Embed Size (px)
Citation preview
Time-Aware Visualization of Document Collections
Aretha B. AlencarInstituto de Ciências Matemáticas e de Computação
Universidade de São PauloCaixa Postal 668
São Carlos, SP, [email protected]
Fernando V. PaulovichInstituto de Ciências Matemáticas e de Computação
Universidade de São PauloCaixa Postal 668
São Carlos, SP, [email protected]
Katy BörnerSchool of Library and Information Science
Indiana University10th Street & Jordan Avenue, Wells Library 021
Bloomington, IN, [email protected]
Maria Cristina F. de OliveiraInstituto de Ciências Matemáticas e de Computação
Universidade de São PauloCaixa Postal 668
São Carlos, SP, [email protected]
ABSTRACTScientific articles are the major mechanism for researchers to re-port their results, and a collection of papers on a discipline canreveal a lot about its evolution, such as the emergence of new top-ics. Nonetheless, given a broad collection of papers it is typicallyvery difficult to grasp important information that could help readersto globally interpret, navigate and then focus on the relevant itemsfor their task. Content-based document maps are visual representa-tions created from evaluating the (dis)similarity amongst the doc-uments, and have been shown to support exploratory tasks in thisscenario. Documents are represented by visual markers placed inthe 2D space so that documents close share similar content. Al-beit the maps allow visually identifying groups of related docu-ments and frontiers between groups, they do not explicitly conveythe temporal evolution of a collection. We propose a technique forcreating content-based similarity maps of document collections thathighlight temporal changes along time. Our solution constructs asequence of maps from time-stamped sub-sets of the data. It adoptsa cumulative backwards strategy to preserve user context acrosssuccessive time-stamps, i.e., maps do not change drastically fromone time stamp to the next, favouring user perception of changes.
Categories and Subject DescriptorsI.3.6 [Computer Graphics]: Methodology and Techniques—In-teraction techniques; I.7.m [Document and Text Processing]:Miscellaneous
General TermsInformation Visualization; Multidimensional Projections
KeywordsTime-varying Data; Text and Document Data
Permission to make digital or hard copies of all or part of this work forpersonal or classroom use is granted without fee provided that copies arenot made or distributed for profit or commercial advantage and that copiesbear this notice and the full citation on the first page. To copy otherwise, torepublish, to post on servers or to redistribute to lists, requires prior specificpermission and/or a fee.SAC 2012 March 26-30, 2012, Riva del Garda (Trento), Italy.Copyright 2012 ACM 978-1-4503-0857-1/12/03 ...$10.00.
1. INTRODUCTIONThe scientific literature available grows at a fast rate, with new
results, methods and technologies being reported on a daily ba-sis. This highly dynamic nature of science poses challenges forresearchers and research policy makers to track the evolution of acertain discipline or research topic. Some visualization techniquesand tools have been proposed specifically to support exploratoryanalysis of collections of scientific articles [2, 8, 20]. Most of theserely on network analysis – where units like authors, institutions,countries, words, articles and journals are represented as nodes andtheir relationships as edges of a complex network. In this work, wefocus on the evolution of content and content similarity of the arti-cles in a collection, rather than on authorship or citation networks,thus providing a complementary view to existing approaches.
Multidimensional projections and point placement techniqueshave been employed to generate global views of high-dimensionaldata sets that can be either embedded in metric space, or for whicha matrix of pairwise distances may be computed [3, 16]. They workby mapping high-dimensional data on a low-dimensional visualspace, typically 2D, while striving to lay out similar points closeto each other. It has been shown that these techniques applied todocument collections can generate insightful document maps thatare suitable for visualization and intuitive exploration of the topicalspace addressed by that collection [15, 14, 12, 17]. Because theyfavor the perception of content similarity and dissimilarity, thesemaps allow visually identifying groups of highly related documents(addressing similar topics) and frontiers between groups, favouringidentification of themes in general, as well as focusing and explo-ration on themes of interest.
Notably, considering a collection to which new documents areadded gradually – as a series of papers from a conference, or thepapers authored by a particular person over a certain time period– this topical space is not static along time, as topics rise and de-cay in the amount of scientific interest they generate. Albeit timeplays an important role in many types of data, text inclusive, ex-isting multidimensional projection techniques do not handle it ex-plicitly. In this work we introduce a new temporally-oriented mul-tidimensional projection technique called Time-based Least SquareProjection, which constructs a sequence of similarity-based mapsfrom time-stamped sub-sets of the data. The goal is to show viewsof a collection of multidimensional data emphasizing changes inthe similarity patterns over time, while preserving global user con-
text. As a proof-of-concept, we illustrate its capabilities analyzingthe research trajectory of individual scholars, based on their scien-tific production reported at ISI Web of Science. In this paper wedetail results for a particular researcher.
In the next section we review previous contributions related tovisualization of text collections and scientific literature, particu-larly those concerned with showing temporal evolution. Section 3presents previous work and concepts required to understand theproposed approach. The full description of the process to gen-erate a sequence of time-stamped document maps is presented inSection 4. Section 5 briefly considers some issues related to ap-plication of the proposed backwards cumulative projection strat-egy to scientific collections and compares it with a conventionalmultidimensional projection approach. Section 6 illustrates howthe technique supports analysis of research trajectories, consider-ing the scientific production of one particular researcher. That isfollowed by the conclusions and further work we intend to pur-sue. Results obtained for other scholars are available at http://lcadfs2.lcad.icmc.usp.br/~aretha/timeaware, and arenot shown here due to space constraints.
2. RELATED WORKA few visualization tools have been introduced aimed at facil-
itating user access and interpretation of text collections evolvingover time. One simple yet interesting technique is ThemeRiver [7],aimed at displaying temporal thematic changes in a document col-lection by highlighting selected topics (themes). It adopts the visualmetaphor of a ‘river’ that flows through time from the left to theright, where individual topics are represented as colored ‘streams’within the river. The width of a flow indicates its strength, and thewidth of the river at a specific time depicts the collective strengthof the selected topics. Analysis allows associating external eventswith major changes in the river. However, interpreting a largeamount of topics is not easy: the visualization becomes cluttered,hampering user ability to discriminate among the areas and colorsrepresenting the topics. It is also difficult to relate topics with spe-cific documents. Moreover, a topic is represented by a single term,a summarization that lacks discrimination power in more complexdocument collections. The choice of topics (terms) to be visualizedis manual, based on the most frequent terms.
On a similar line, but with enhanced analytical strategies,TIARA (Text Insight via Automated Responsive Analytics) [22,11] is visual text analytics tool also aimed at highlighting the tem-poral evolution of topics in a collection of documents. It employsautomatic topic extraction techniques such as LDA (Latent Dirich-let Allocation [1]) to summarize texts into a set of topics and derivetime-sensitive keywords to depict how topics evolve on collectionsof news or emails. The visual metaphor resembles that of The-meRiver. In both tools relevant topics are identified first, and then avisual representation is created to convey a time-based visual sum-mary. Again, resulting views do not immediately relate documentsand topics. Both tools were conceived for visualizing text collec-tions in general, therefore they do not consider specific propertiesof scientific articles, e.g., citation patterns or keywords.
The state of the art of a research field defines its researchfront [2]: a set of highly cited articles and the articles heavily citedby them that form the intellectual basis of the field. Scientists tendto cite the most recently published articles, and therefore the re-search front and intellectual base are characterized by a transientnature. The CiteSpace II tool [2] builds a visual representation thataims to show how research fronts and intellectual bases of a re-search area change over time and their transient patterns. Researchfront terms are identified using the Kleinberg’s burst detection al-
gorithm [9], which returns a ranked list of the most significantword bursts and the time interval when they occurred. The intellec-tual base is formed by groups of articles cited by articles in whichresearch-front terms were found. The final visual representation isa hybrid network with three types of links: co-occurring researchfront terms; co-cited intellectual base articles; and research-frontterm citing an intellectual base article. The betweenness centralitymetric over networks is employed to identify and highlight poten-tial points of paradigm shift over time. Despite using Pathfindernetwork scaling to reduce the number of links shown at a time,the network remains very dense in most cases. Similarly to The-meRiver and TIARA for general collections, Citespace II seeks torepresent the global dynamics a science area through a single staticvisual representation.
The Visone tool [10] employs an MDS-based algorithm to lay-out time series of social network data dynamically by optimizingthe stress both within the current network and over the previousand consecutive networks. This modified stress function penalizesdrastic movements of a node from a network to the next. In thismanner, the authors expect to promote stability along the networksand preserve the mental map between consecutive layouts. How-ever, stability is achieved through a parameter in the stress func-tion rather than being dictated by the data. The algorithm has beenapplied to different networks, including journal citation maps andheterogeneous maps composed by title words, authors, and jour-nals. Despite using title words in their heterogeneous visualization,representation is not focused on topical events. This algorithm isO(n2|T |), where T is the number of networks (i.e., the number oftime intervals) and n is the number of nodes in each network.
In this paper we propose generating views of a collection thathighlight groups of similar, i.e. content-related articles, on a se-quence of document maps capable of showing the temporal evolu-tion of these groups. It differs from the above solutions in that it isaimed at gradually identifying the major topics addressed by a col-lection of scientific papers and highlighting their evolution, relatingtopics and articles in a straightforward manner. The maps focus oncontent, rather than on citation or co-authorship patterns, and hassuch provides a complementary approach to current visualizations.
3. BACKGROUNDMultidimensional projections provide a general framework for
creating interactive visual representations of high dimensional data,which take advantage of the human visual ability to recognizestructures or patterns based on similarity, such as clusters of ele-ments. Many types of projection techniques exist, but all of themshare the same underlying concept: data is projected from an m-dimensional space into a d-dimensional space with d � m (typ-ically, d = 2) while retaining, on the projected space, some in-formation about distance relationships among the m-dimensionaldata items. Formally, let X = {x1, . . . ,xN} be an m-dimensionaldataset, with δ (xi,x j) being a dissimilarity measure between twom-dimensional data instances; and let Y = {y1, . . . ,yN} be a set ofpoints at the d-dimensional space, and d(yi,y j) a distance (usuallyEuclidean) between two points on the projected space. A multidi-mensional projection technique can be defined as an injective func-tion f : X → Y that seeks to make
∣∣δ (xi,x j)−d( f (xi), f (x j))∣∣ as
close to zero as possible ∀xi,x j ∈ X [21].
3.1 Least Square ProjectionThe Least Square Projection (LSP) [15] adopts a strategy dif-
ferent from most conventional projection techniques, in that itseeks to preserve local data neighborhoods identified in the orig-inal m-dimensional space, rather than global neighborhoods rela-
tions. Two major steps are involved in the LSP projection process.In a first step a subset of the dataset, called “control points”, areprojected onto Rd employing a highly precise projection techniqueknown as Force Scheme [21]. In the second step, departing fromthe neighborhood relationships amongst the data instances in Rm
and the Cartesian coordinates of the control points in Rd obtainedin the first step, a linear system is constructed and solved to obtainthe projected coordinates of the remaining points in Rd .
These remaining instances are projected in the convex hull oftheir neighbors, while taking the control points as anchors to addgeometrical information to the system. Further details on how thislinear system is built and solved may be found elsewhere [15]. Be-cause it seeks to preserve local neighborhoods LSP generates goodsimilarity-based maps of data defined on sparse high-dimensionalspaces, which is the case of text collections. It achieves excel-lent compromise between precision, measured in terms of neigh-borhood preservation, and computational cost, as discussed in [15].
3.2 Evaluating SimilarityGenerating content-based maps of documents using multidimen-
sional projection techniques requires an approach to assess how(dis)similar documents are. The input to such techniques is a ma-trix of pairwise dissimilarities amongst all documents. In gen-erating this matrix some data preprocessing is typically requiredto improve projection accuracy. A common approach is to em-ploy the vector space model [19], which represents each docu-ment by a vector of term frequencies. Given a set of N documentsD = {d1, . . . ,dN} represented by M terms T = {t1, . . . , tM}, eachdocument di is represented by a vector di = (αi1,αi2, . . . ,αiM),where the value of αi j must represent the relative influence of aterm t j on a document di. One may adopt some weighting schemesto compute the value of αi j: the term frequency (tf), the termfrequency-inverse document frequency (tf-idf) and their normalizedversions. In principle, the set of terms T consists of all the termsoccurring in the collection, but it is usually reduced through somepre-processing steps, e.g., removing terms known as stopwords (ad-jectives, verbs, etc.) that add no discriminative power; applying astemming algorithm such as Porter’s [18] to reduce words to theirradicals; and removing terms that occur too sparsely or too oftenand hence have limited differentiating capability through Luhn’scut-off values [13].
Once the vector space model of the collection is computed, thecosine between two vector representations may be taken as a mea-sure of semantic dissimilarity between their two correspondingdocuments. If the documents are scientific papers for which thecited references are known, one may extend the vector space modelto consider their shared cited references, as they usually reflecttopic (content) similarity. In this extended version, each uniquereference in the collection is added as an additional column in thevector space model and the corresponding value for each article isset to 1 if that reference appears in its cited references, and to 0otherwise.
4. TIME-BASED LEAST SQUARE PRO-JECTION
In the following we introduce a multidimensional projectiontechnique that handles the time attribute explicitly so as to conveythe changes in the similarity relationships of a multidimensionaldataset, along time. It outputs a temporal sequence of similarity-based maps, given a time-stamped multidimensional dataset.
The following steps explicit the time-based multidimensionalprojection:
1. Given a set of (possibly pre-processed) time-stamped datainstances, split the data into a list of batches X ={X1,X2, . . . ,XT }, according to some temporal property. Thislist must be organized in ascending order regarding the tem-poral property chosen.
2. Project the entire dataset using LSP, creating a data map PT .Create an index current_map with value T.
3. Remove the latest batch from list X . Decrease thevalue of index current_map by one, i.e., current_map =current_map−1.
4. The next data map, Pcurrent_map, is created using a back-ward scheme as follows. Identify in the previous data map,Pcurrent_map−1, the following data instances:
(a) Data instances that belonged to the batch removed inStep 3, which must be removed from the current map.
(b) Data instances which would have their high-dimensional neighborhoods changed as a resultof the previous step, i.e. that had in their neighborhoodinstances identified in Step 4(a). The data neighbor-hoods computed when applying LSP to generate theprevious map are inspected to find the data points withmodified neighborhoods.
(c) Data instances outside the neighborhood of the in-stances identified in Step 4(a).
5. Use LSP to reproject the data instances identified in step 4(b),taking the instances identified in step 4(c) as control points.This actions will create map Pcurrent_map. Add this new mapto the list of maps P.
6. Repeat steps 3 through 5, until there are only two batches onthe list of batches X .
7. Reverse the order of the list of maps to {P1, . . . ,PT } for dis-play.
A problem may occur when there is an insufficient number ofcontrol points. This happens when the projected positions of mostdata instances need to be updated. This is solved by choosing newcontrol points among the data instances that need to be updated.With this purpose in mind, each data instance to be updated is as-signed a weight ω , which infers how close to it the removed in-stances were from its neighborhood:
ω (xi) =k
∑i=1
∥∥ f (xi), f (x j)∥∥ , ∀x j ∈ r(xi) = {x1, . . . ,xk} (1)
where r(xi) is a function that returns a list of the removed datainstances in the neighborhood of data instance xi. These documentsare sorted in ascending order of this weight ω . Supposing that thecurrent map has l control points and it is necessary to achieve atleast min_cp control points, then the first ranked (min_cp− l) datainstances are included as control points.
By using information from the previous map to build the cur-rent one we seek to maintain a global spatial coherence throughoutthe sequence of maps. It is expected that data instances that havesimilar content and are positioned at a certain region in a map Pistay roughly in the same region in the subsequent map Pi+1. Thisbehavior is desirable in order to preserve the user’s mental map:despite modifications, layouts should remain consistent throughoutthe time-based sequence in order to avoid user confusion. The term“mental map” refers to the structural cognitive information a usercreates internally by observing the layout of a visual representa-tion [4].
5. APPLICATION TO SCIENTIFIC COL-LECTIONS
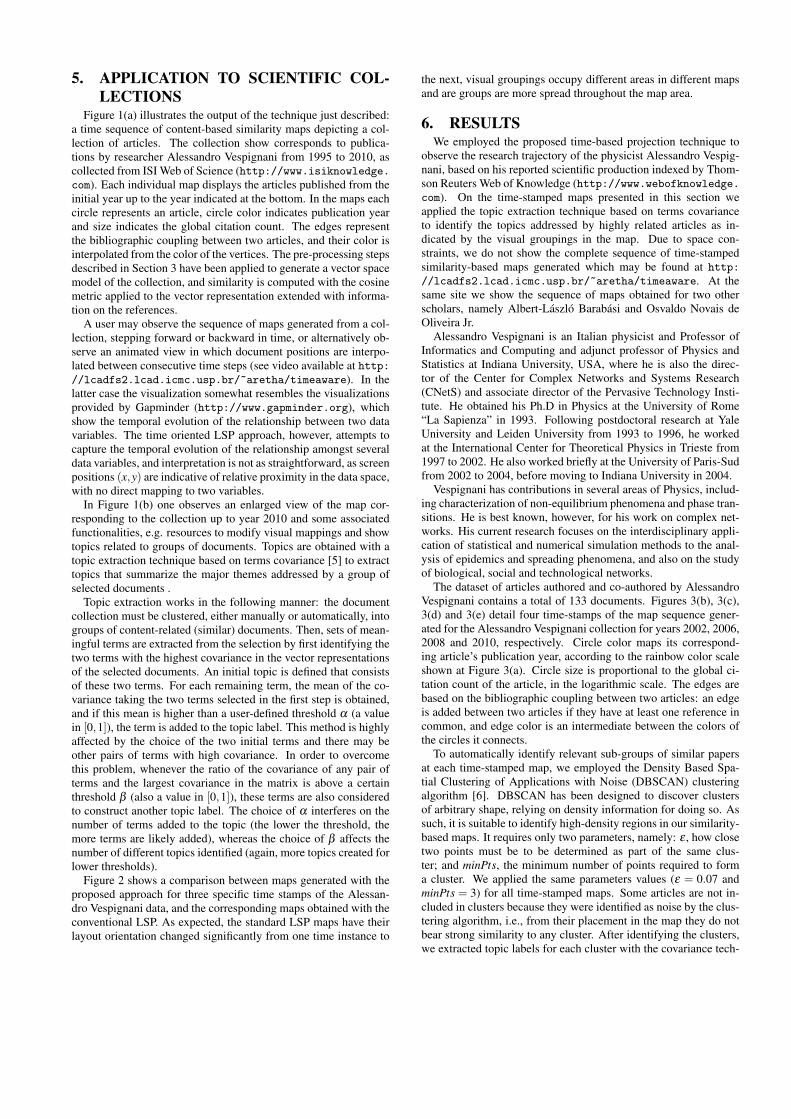
Figure 1(a) illustrates the output of the technique just described:a time sequence of content-based similarity maps depicting a col-lection of articles. The collection show corresponds to publica-tions by researcher Alessandro Vespignani from 1995 to 2010, ascollected from ISI Web of Science (http://www.isiknowledge.com). Each individual map displays the articles published from theinitial year up to the year indicated at the bottom. In the maps eachcircle represents an article, circle color indicates publication yearand size indicates the global citation count. The edges representthe bibliographic coupling between two articles, and their color isinterpolated from the color of the vertices. The pre-processing stepsdescribed in Section 3 have been applied to generate a vector spacemodel of the collection, and similarity is computed with the cosinemetric applied to the vector representation extended with informa-tion on the references.
A user may observe the sequence of maps generated from a col-lection, stepping forward or backward in time, or alternatively ob-serve an animated view in which document positions are interpo-lated between consecutive time steps (see video available at http://lcadfs2.lcad.icmc.usp.br/~aretha/timeaware). In thelatter case the visualization somewhat resembles the visualizationsprovided by Gapminder (http://www.gapminder.org), whichshow the temporal evolution of the relationship between two datavariables. The time oriented LSP approach, however, attempts tocapture the temporal evolution of the relationship amongst severaldata variables, and interpretation is not as straightforward, as screenpositions (x,y) are indicative of relative proximity in the data space,with no direct mapping to two variables.
In Figure 1(b) one observes an enlarged view of the map cor-responding to the collection up to year 2010 and some associatedfunctionalities, e.g. resources to modify visual mappings and showtopics related to groups of documents. Topics are obtained with atopic extraction technique based on terms covariance [5] to extracttopics that summarize the major themes addressed by a group ofselected documents .
Topic extraction works in the following manner: the documentcollection must be clustered, either manually or automatically, intogroups of content-related (similar) documents. Then, sets of mean-ingful terms are extracted from the selection by first identifying thetwo terms with the highest covariance in the vector representationsof the selected documents. An initial topic is defined that consistsof these two terms. For each remaining term, the mean of the co-variance taking the two terms selected in the first step is obtained,and if this mean is higher than a user-defined threshold α (a valuein [0,1]), the term is added to the topic label. This method is highlyaffected by the choice of the two initial terms and there may beother pairs of terms with high covariance. In order to overcomethis problem, whenever the ratio of the covariance of any pair ofterms and the largest covariance in the matrix is above a certainthreshold β (also a value in [0,1]), these terms are also consideredto construct another topic label. The choice of α interferes on thenumber of terms added to the topic (the lower the threshold, themore terms are likely added), whereas the choice of β affects thenumber of different topics identified (again, more topics created forlower thresholds).
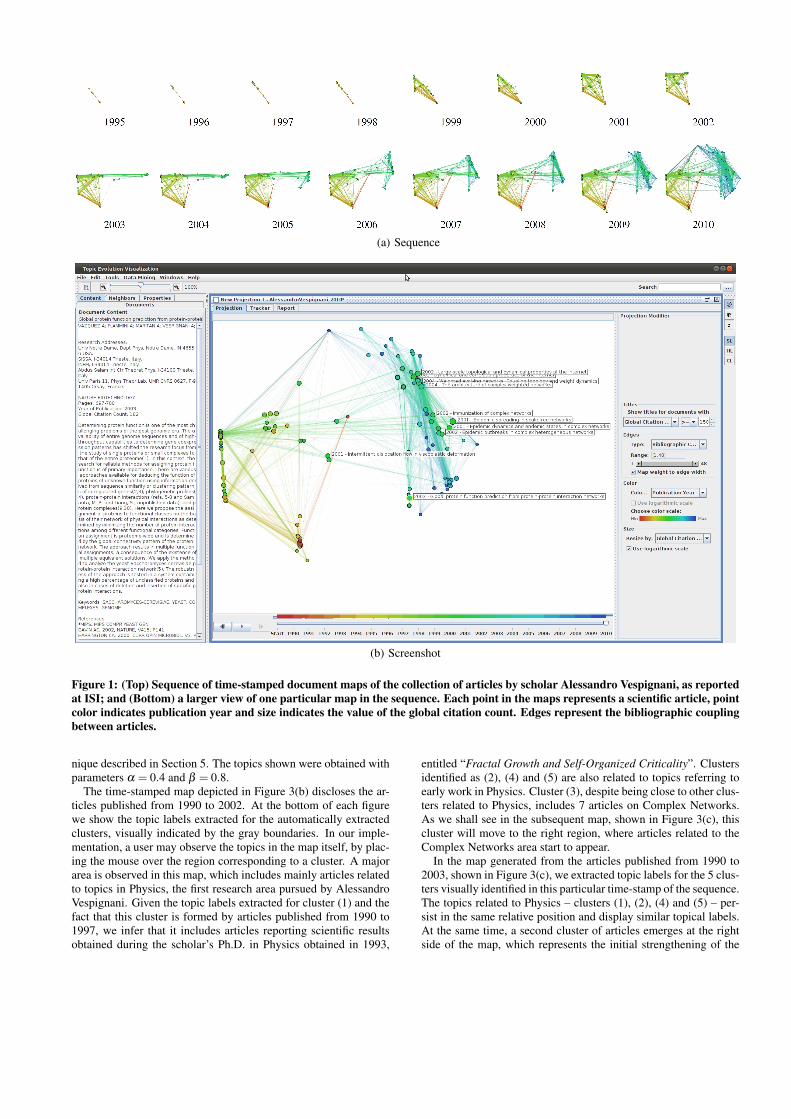
Figure 2 shows a comparison between maps generated with theproposed approach for three specific time stamps of the Alessan-dro Vespignani data, and the corresponding maps obtained with theconventional LSP. As expected, the standard LSP maps have theirlayout orientation changed significantly from one time instance to
the next, visual groupings occupy different areas in different mapsand are groups are more spread throughout the map area.
6. RESULTSWe employed the proposed time-based projection technique to
observe the research trajectory of the physicist Alessandro Vespig-nani, based on his reported scientific production indexed by Thom-son Reuters Web of Knowledge (http://www.webofknowledge.com). On the time-stamped maps presented in this section weapplied the topic extraction technique based on terms covarianceto identify the topics addressed by highly related articles as in-dicated by the visual groupings in the map. Due to space con-straints, we do not show the complete sequence of time-stampedsimilarity-based maps generated which may be found at http://lcadfs2.lcad.icmc.usp.br/~aretha/timeaware. At thesame site we show the sequence of maps obtained for two otherscholars, namely Albert-László Barabási and Osvaldo Novais deOliveira Jr.
Alessandro Vespignani is an Italian physicist and Professor ofInformatics and Computing and adjunct professor of Physics andStatistics at Indiana University, USA, where he is also the direc-tor of the Center for Complex Networks and Systems Research(CNetS) and associate director of the Pervasive Technology Insti-tute. He obtained his Ph.D in Physics at the University of Rome“La Sapienza” in 1993. Following postdoctoral research at YaleUniversity and Leiden University from 1993 to 1996, he workedat the International Center for Theoretical Physics in Trieste from1997 to 2002. He also worked briefly at the University of Paris-Sudfrom 2002 to 2004, before moving to Indiana University in 2004.
Vespignani has contributions in several areas of Physics, includ-ing characterization of non-equilibrium phenomena and phase tran-sitions. He is best known, however, for his work on complex net-works. His current research focuses on the interdisciplinary appli-cation of statistical and numerical simulation methods to the anal-ysis of epidemics and spreading phenomena, and also on the studyof biological, social and technological networks.
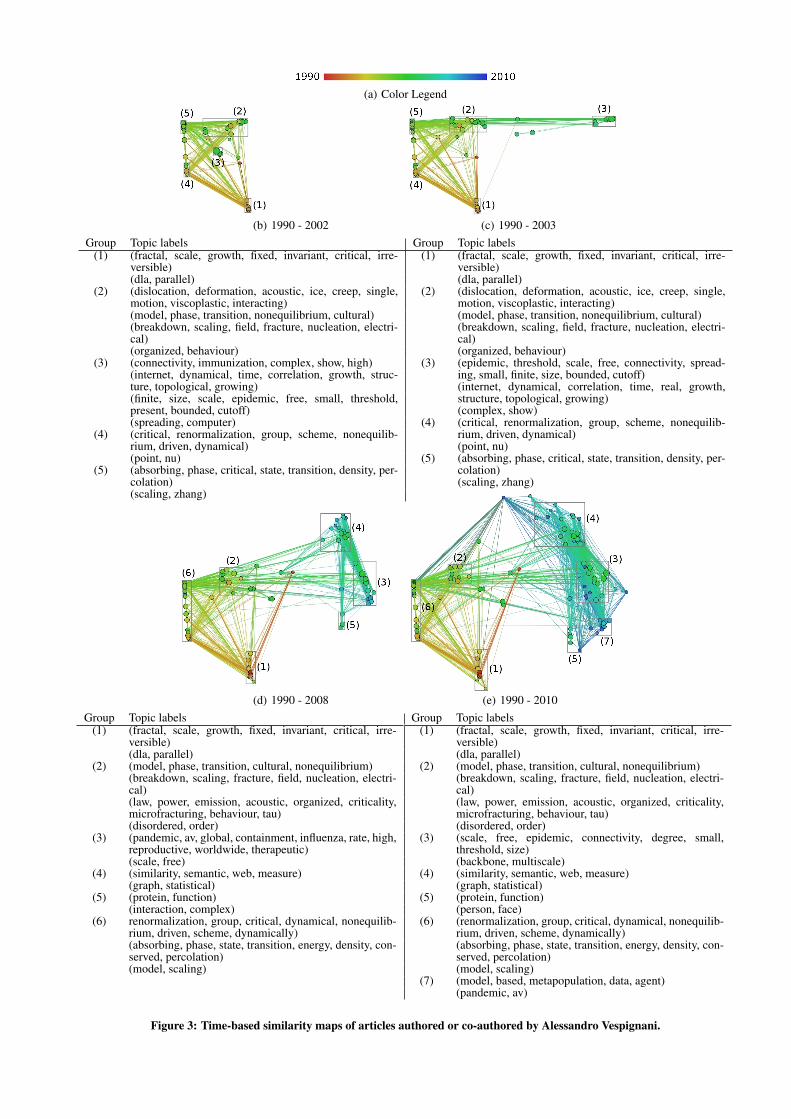
The dataset of articles authored and co-authored by AlessandroVespignani contains a total of 133 documents. Figures 3(b), 3(c),3(d) and 3(e) detail four time-stamps of the map sequence gener-ated for the Alessandro Vespignani collection for years 2002, 2006,2008 and 2010, respectively. Circle color maps its correspond-ing article’s publication year, according to the rainbow color scaleshown at Figure 3(a). Circle size is proportional to the global ci-tation count of the article, in the logarithmic scale. The edges arebased on the bibliographic coupling between two articles: an edgeis added between two articles if they have at least one reference incommon, and edge color is an intermediate between the colors ofthe circles it connects.
To automatically identify relevant sub-groups of similar papersat each time-stamped map, we employed the Density Based Spa-tial Clustering of Applications with Noise (DBSCAN) clusteringalgorithm [6]. DBSCAN has been designed to discover clustersof arbitrary shape, relying on density information for doing so. Assuch, it is suitable to identify high-density regions in our similarity-based maps. It requires only two parameters, namely: ε , how closetwo points must be to be determined as part of the same clus-ter; and minPts, the minimum number of points required to forma cluster. We applied the same parameters values (ε = 0.07 andminPts = 3) for all time-stamped maps. Some articles are not in-cluded in clusters because they were identified as noise by the clus-tering algorithm, i.e., from their placement in the map they do notbear strong similarity to any cluster. After identifying the clusters,we extracted topic labels for each cluster with the covariance tech-
(a) Sequence
(b) Screenshot
Figure 1: (Top) Sequence of time-stamped document maps of the collection of articles by scholar Alessandro Vespignani, as reportedat ISI; and (Bottom) a larger view of one particular map in the sequence. Each point in the maps represents a scientific article, pointcolor indicates publication year and size indicates the value of the global citation count. Edges represent the bibliographic couplingbetween articles.
nique described in Section 5. The topics shown were obtained withparameters α = 0.4 and β = 0.8.
The time-stamped map depicted in Figure 3(b) discloses the ar-ticles published from 1990 to 2002. At the bottom of each figurewe show the topic labels extracted for the automatically extractedclusters, visually indicated by the gray boundaries. In our imple-mentation, a user may observe the topics in the map itself, by plac-ing the mouse over the region corresponding to a cluster. A majorarea is observed in this map, which includes mainly articles relatedto topics in Physics, the first research area pursued by AlessandroVespignani. Given the topic labels extracted for cluster (1) and thefact that this cluster is formed by articles published from 1990 to1997, we infer that it includes articles reporting scientific resultsobtained during the scholar’s Ph.D. in Physics obtained in 1993,
entitled “Fractal Growth and Self-Organized Criticality”. Clustersidentified as (2), (4) and (5) are also related to topics referring toearly work in Physics. Cluster (3), despite being close to other clus-ters related to Physics, includes 7 articles on Complex Networks.As we shall see in the subsequent map, shown in Figure 3(c), thiscluster will move to the right region, where articles related to theComplex Networks area start to appear.
In the map generated from the articles published from 1990 to2003, shown in Figure 3(c), we extracted topic labels for the 5 clus-ters visually identified in this particular time-stamp of the sequence.The topics related to Physics – clusters (1), (2), (4) and (5) – per-sist in the same relative position and display similar topical labels.At the same time, a second cluster of articles emerges at the rightside of the map, which represents the initial strengthening of the
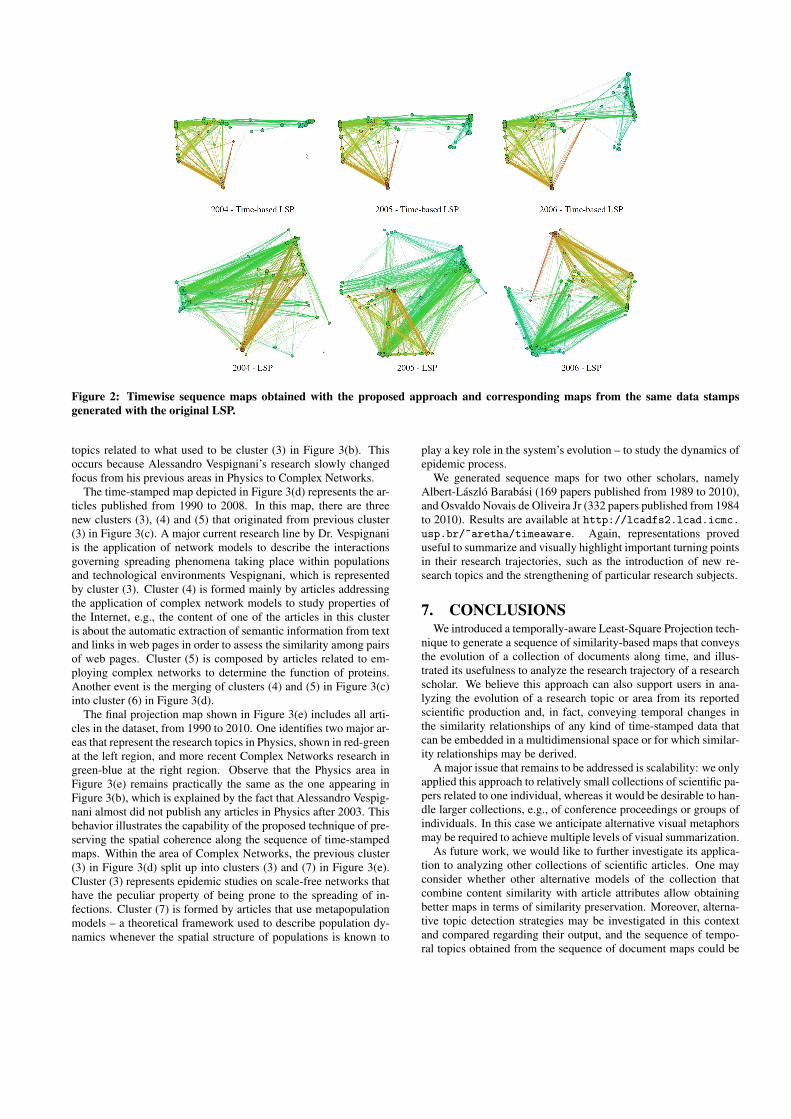
Figure 2: Timewise sequence maps obtained with the proposed approach and corresponding maps from the same data stampsgenerated with the original LSP.
topics related to what used to be cluster (3) in Figure 3(b). Thisoccurs because Alessandro Vespignani’s research slowly changedfocus from his previous areas in Physics to Complex Networks.
The time-stamped map depicted in Figure 3(d) represents the ar-ticles published from 1990 to 2008. In this map, there are threenew clusters (3), (4) and (5) that originated from previous cluster(3) in Figure 3(c). A major current research line by Dr. Vespignaniis the application of network models to describe the interactionsgoverning spreading phenomena taking place within populationsand technological environments Vespignani, which is representedby cluster (3). Cluster (4) is formed mainly by articles addressingthe application of complex network models to study properties ofthe Internet, e.g., the content of one of the articles in this clusteris about the automatic extraction of semantic information from textand links in web pages in order to assess the similarity among pairsof web pages. Cluster (5) is composed by articles related to em-ploying complex networks to determine the function of proteins.Another event is the merging of clusters (4) and (5) in Figure 3(c)into cluster (6) in Figure 3(d).
The final projection map shown in Figure 3(e) includes all arti-cles in the dataset, from 1990 to 2010. One identifies two major ar-eas that represent the research topics in Physics, shown in red-greenat the left region, and more recent Complex Networks research ingreen-blue at the right region. Observe that the Physics area inFigure 3(e) remains practically the same as the one appearing inFigure 3(b), which is explained by the fact that Alessandro Vespig-nani almost did not publish any articles in Physics after 2003. Thisbehavior illustrates the capability of the proposed technique of pre-serving the spatial coherence along the sequence of time-stampedmaps. Within the area of Complex Networks, the previous cluster(3) in Figure 3(d) split up into clusters (3) and (7) in Figure 3(e).Cluster (3) represents epidemic studies on scale-free networks thathave the peculiar property of being prone to the spreading of in-fections. Cluster (7) is formed by articles that use metapopulationmodels – a theoretical framework used to describe population dy-namics whenever the spatial structure of populations is known to
play a key role in the system’s evolution – to study the dynamics ofepidemic process.
We generated sequence maps for two other scholars, namelyAlbert-László Barabási (169 papers published from 1989 to 2010),and Osvaldo Novais de Oliveira Jr (332 papers published from 1984to 2010). Results are available at http://lcadfs2.lcad.icmc.usp.br/~aretha/timeaware. Again, representations proveduseful to summarize and visually highlight important turning pointsin their research trajectories, such as the introduction of new re-search topics and the strengthening of particular research subjects.
7. CONCLUSIONSWe introduced a temporally-aware Least-Square Projection tech-
nique to generate a sequence of similarity-based maps that conveysthe evolution of a collection of documents along time, and illus-trated its usefulness to analyze the research trajectory of a researchscholar. We believe this approach can also support users in ana-lyzing the evolution of a research topic or area from its reportedscientific production and, in fact, conveying temporal changes inthe similarity relationships of any kind of time-stamped data thatcan be embedded in a multidimensional space or for which similar-ity relationships may be derived.
A major issue that remains to be addressed is scalability: we onlyapplied this approach to relatively small collections of scientific pa-pers related to one individual, whereas it would be desirable to han-dle larger collections, e.g., of conference proceedings or groups ofindividuals. In this case we anticipate alternative visual metaphorsmay be required to achieve multiple levels of visual summarization.
As future work, we would like to further investigate its applica-tion to analyzing other collections of scientific articles. One mayconsider whether other alternative models of the collection thatcombine content similarity with article attributes allow obtainingbetter maps in terms of similarity preservation. Moreover, alterna-tive topic detection strategies may be investigated in this contextand compared regarding their output, and the sequence of tempo-ral topics obtained from the sequence of document maps could be
(a) Color Legend
(b) 1990 - 2002 (c) 1990 - 2003Group Topic labels
(1) (fractal, scale, growth, fixed, invariant, critical, irre-versible)(dla, parallel)
(2) (dislocation, deformation, acoustic, ice, creep, single,motion, viscoplastic, interacting)(model, phase, transition, nonequilibrium, cultural)(breakdown, scaling, field, fracture, nucleation, electri-cal)(organized, behaviour)
(3) (connectivity, immunization, complex, show, high)(internet, dynamical, time, correlation, growth, struc-ture, topological, growing)(finite, size, scale, epidemic, free, small, threshold,present, bounded, cutoff)(spreading, computer)
(4) (critical, renormalization, group, scheme, nonequilib-rium, driven, dynamical)(point, nu)
(5) (absorbing, phase, critical, state, transition, density, per-colation)(scaling, zhang)
Group Topic labels(1) (fractal, scale, growth, fixed, invariant, critical, irre-
versible)(dla, parallel)
(2) (dislocation, deformation, acoustic, ice, creep, single,motion, viscoplastic, interacting)(model, phase, transition, nonequilibrium, cultural)(breakdown, scaling, field, fracture, nucleation, electri-cal)(organized, behaviour)
(3) (epidemic, threshold, scale, free, connectivity, spread-ing, small, finite, size, bounded, cutoff)(internet, dynamical, correlation, time, real, growth,structure, topological, growing)(complex, show)
(4) (critical, renormalization, group, scheme, nonequilib-rium, driven, dynamical)(point, nu)
(5) (absorbing, phase, critical, state, transition, density, per-colation)(scaling, zhang)
(d) 1990 - 2008 (e) 1990 - 2010Group Topic labels
(1) (fractal, scale, growth, fixed, invariant, critical, irre-versible)(dla, parallel)
(2) (model, phase, transition, cultural, nonequilibrium)(breakdown, scaling, fracture, field, nucleation, electri-cal)(law, power, emission, acoustic, organized, criticality,microfracturing, behaviour, tau)(disordered, order)
(3) (pandemic, av, global, containment, influenza, rate, high,reproductive, worldwide, therapeutic)(scale, free)
(4) (similarity, semantic, web, measure)(graph, statistical)
(5) (protein, function)(interaction, complex)
(6) renormalization, group, critical, dynamical, nonequilib-rium, driven, scheme, dynamically)(absorbing, phase, state, transition, energy, density, con-served, percolation)(model, scaling)
Group Topic labels(1) (fractal, scale, growth, fixed, invariant, critical, irre-
versible)(dla, parallel)
(2) (model, phase, transition, cultural, nonequilibrium)(breakdown, scaling, fracture, field, nucleation, electri-cal)(law, power, emission, acoustic, organized, criticality,microfracturing, behaviour, tau)(disordered, order)
(3) (scale, free, epidemic, connectivity, degree, small,threshold, size)(backbone, multiscale)
(4) (similarity, semantic, web, measure)(graph, statistical)
(5) (protein, function)(person, face)
(6) (renormalization, group, critical, dynamical, nonequilib-rium, driven, scheme, dynamically)(absorbing, phase, state, transition, energy, density, con-served, percolation)(model, scaling)
(7) (model, based, metapopulation, data, agent)(pandemic, av)
Figure 3: Time-based similarity maps of articles authored or co-authored by Alessandro Vespignani.
analyzed to identify correlations and detect meaningful vocabularychanges. Another desired facility is integrating exhibition of thetopics over the maps, while visually emphasizing strong topicalchanges along time - these could be indicated by regions of greatvariation over successive time-stamped maps.
8. ACKNOWLEDGMENTSThis work was supported by the Brazilian funding agencies
FAPESP (grants 2008/00848-1 and 2008/04622-8), CAPES (grant1271-10-5) and CNPq (305079/2009-3).
9. REFERENCES[1] D. M. Blei, A. Y. Ng, and M. I. Jordan. Latent dirichlet
allocation. Journal of Machine Learning Research,3:993–1022, March 2003.
[2] C. Chen. Citespace II: Detecting and visualizing emergingtrends and transient patterns in scientific literature. Journalof the American Society for Information Science andTechnology, 57:359–377, February 2006.
[3] A. M. Cuadros, F. V. Paulovich, R. Minghim, and G. P.Telles. Point placement by phylogenetic trees and itsapplication to visual analysis of document collections. InIEEE Symposium on Visual Analytics Science andTechnology, pages 99–106, Washington, DC, USA, 2007.IEEE Computer Society.
[4] S. Diehl and C. Görg. Graphs, they are changing - dynamicgraph drawing for a sequence of graphs. In Proceedings ofGraph Drawing, pages 23–31, London, UK, 2002.Springer-Verlag.
[5] D. M. Eler, F. V. Paulovich, M. C. F. d. Oliveira, andR. Minghim. Topic-based coordination for visual analysis ofevolving document collections. In International ConferenceInformation Visualisation, pages 149–155, Washington, DC,USA, 2009. IEEE Computer Society.
[6] M. Ester, H. peter Kriegel, J. S, and X. Xu. A density-basedalgorithm for discovering clusters in large spatial databaseswith noise. In International Conference on KnowledgeDiscovery and Data Mining, pages 226–231. AAAI Press,1996.
[7] S. Havre, E. Hetzler, P. Whitney, and L. Nowell. Themeriver:visualizing thematic changes in large document collections.IEEE Transactions on Visualization and Computer Graphics,8(1):9–20, 2002.
[8] B. Herr, R. Duhon, K. Borner, E. Hardy, and S. Penumarthy.113 years of physical review: Using flow maps to showtemporal and topical citation patterns. In InternationalConference on Information Visualisation, pages 421–426,Los Alamitos, CA, USA, 2008. IEEE Computer Society.
[9] J. Kleinberg. Bursty and hierarchical structure in streams.
Data Mining and Knowledge Discovery, 7:373–397, 2003.10.1023/A:1024940629314.
[10] L. Leydesdorff and T. Schank. Dynamic animations ofjournal maps: Indicators of structural changes andinterdisciplinary developments. Journal of the AmericanSociety for Information Science and Technology,59:1810–1818, September 2008.
[11] S. Liu, M. X. Zhou, S. Pan, W. Qian, W. Cai, and X. Lian.Interactive, topic-based visual text summarization andanalysis. In ACM Conference on Information and KnowledgeManagement, pages 543–552, New York, NY, USA, 2009.ACM.
[12] A. A. Lopes, R. Pinho, F. V. Paulovich, and R. Minghim.Visual text mining using association rules. Computers andGraphics, 31:316–326, June 2007.
[13] H. P. Luhn. The automatic creation of literature abstracts.IBM J. Res. Dev., 2:159–165, April 1958.
[14] F. V. Paulovich and R. Minghim. Hipp: A novel hierarchicalpoint placement strategy and its application to theexploration of document collections. IEEE Transactions onVisualization and Computer Graphics, 14:1229–1236, 2008.
[15] F. V. Paulovich, L. G. Nonato, R. Minghim, andH. Levkowitz. Least square projection: A fast high-precisionmultidimensional projection technique and its application todocument mapping. IEEE Transactions on Visualization andComputer Graphics, 14:564–575, 2008.
[16] F. V. Paulovich, M. C. F. Oliveira, and R. Minghim. Theprojection explorer: A flexible tool for projection-basedmultidimensional visualization. In Brazilian Symposium onComputer Graphics and Image Processing, pages 27–36,Washington, DC, USA, 2007. IEEE Computer Society.
[17] PNNL. IN-SPIRET M Visual document analysis.http://in-spire.pnl.gov, 2008.
[18] M. F. Porter. An algorithm for suffix stripping. Program:Electronic Library & Information Systems, 40(3):211–218,1980.
[19] G. Salton, A. Wong, and C. S. Yang. A vector space modelfor automatic indexing. Communications of the ACM,18:613–620, November 1975.
[20] Sci2 Team. Science of Science (Sci2) Tool. IndianaUniversity and SciTech Strategies. http://sci2.cns.iu.edu,2009.
[21] E. Tejada, R. Minghim, and L. G. Nonato. On improvedprojection techniques to support visual exploration ofmultidimensional data sets. Information Visualization,2(4):218–231, 2003.
[22] F. Wei, S. Liu, Y. Song, S. Pan, M. X. Zhou, W. Qian, L. Shi,L. Tan, and Q. Zhang. Tiara: a visual exploratory textanalytic system. In ACM International Conference onKnowledge Discovery and Data Mining,pages 153–162,New York, NY, USA, 2010. ACM.