Embed Size (px)
Citation preview
International Journal of Mathematical, Engineering and Management Sciences
Vol. 5, No. 1, 96-107, 2020
https://doi.org/10.33889/IJMEMS.2020.5.1.009
96
Time-Based Process Mapping for Lead Time Compression in the
Apparel Supply Chain: A Case Study
Chowdhury Jony Moin
Department of Industrial and Production Engineering,
Shahjalal University of Science and Technology,
University Ave, Sylhet 3114, Bangladesh;
Department of Textile Engineering,
Ahsanullah University of Science and Technology,
141 & 142, Love Road, Dhaka 1208, Bangladesh.
Mohammad Iqbal Department of Industrial and Production Engineering,
Shahjalal University of Science and Technology,
University Ave, Sylhet 3114, Bangladesh.
A. B. M. Abdul Malek Department of Industrial and Production Engineering,
Shahjalal University of Science and Technology,
University Ave, Sylhet 3114, Bangladesh.
Rezwanul Haque School of Science and Engineering,
University of the Sunshine Coast,
90 Sippy Downs Drive, Sippy Downs, QLD 4556, Australia.
Corresponding author: [email protected]
(Received May 17, 2019; Accepted August 30, 2019)
Abstract
Fashion industries are highly globalized as designing, manufacturing and selling are performed in different countries. As
a result, it has a long supply chain and long lead time. Identification of value-added time through-out the supply chain is
a key research area in apparel industries. This case study investigated detailed activities of thirty contracts of an apparel
supply chain by considering the manufacturer as a coupling point of upstream (suppliers) and downstream (buyer). The
contract frequencies were analyzed based on lead time and quantity. Each contract was analyzed using a time-based
process mapping (TBPM). TBPMs of all contracts showed that overall 45% were non-value-added activities throughout
the chain. It was also identified that the non-value activities were independent of the contract volume. This study
recommends time compression methodology to reduce the non-value-added activities by using advanced manufacturing
technologies. The methodology and recommended time compression ways of this study can be applied to other supply
chains.
Keywords- Lead time, Supply chain management, Time to market, TBPM.
1. Introduction The clothing sector is now requiring frequent and trendy product changes in stores, quick response
to trendy product development according to customer preferences (Martínez et al., 2015). Contrary,
these fashion industries are highly globalized as its operations throughout the supply chain from
design to manufacturing, and finally, selling are performed in different countries (Čiarnienė and
International Journal of Mathematical, Engineering and Management Sciences
Vol. 5, No. 1, 96-107, 2020
https://doi.org/10.33889/IJMEMS.2020.5.1.009
97
Vienažindienė, 2014). Thus, it has a long supply chain and long lead time. Consequently, this long
lead time deals with longer forecast horizon and any longer horizon worsen the forecast
(Christopher and Towill, 2002). Whereas, Fashion markets typically show short life-cycles, high
volatility, low predictability and high instinct purchasing (Christopher and Towill, 2002). Because
of such characteristics, forecasting accuracy is extremely difficult. These market complexities,
ferocious competition and fast changes in demand necessitate the companies to be ready to react
promptly to customers’ needs (Bhardwaj and Fairhurst, 2010). To do such, apparel manufacturer
shifted to Mass-Customization from Mass Production (Moin et al., 2013). Mass customization can
be described as manufactures ability to meet market demand with high product variety without
substantial trade-offs in cost, delivery and quality (McCarthy, 2004). Mass customization strategies
lead the manufacturers to supply an increasingly unsettled marketplace with customized products
responding to individual customer requirements with minimal loss of production efficiency (Liu
and Deitz, 2011). Two methodologies can be applied to implement Mass customization: i)
Processes customization and ii) Advanced manufacturing technologies which include
communication and network (Da Silveira et al., 2001).
Customers do not care much about how a company gets the order and deliveries of a product (Moin
et al., 2018). To satisfy the customers there are three competitive dimensions, i.e. price, product
differentiation and delivery time, which depends on the lead time (Magnusson and Simonsson,
2012). This lead time can be divided in many ways. In most common practice, lead-time typically
includes two components: Information lead times (i.e., the time it takes to process an order) and
Order lead times (i.e., the time it takes to produce and ship the item). Nowadays, time became the
most important factor in this competitive business environment. Several strategies are employed
by different companies to reduce the lead time (Pine et al., 1993). For example, information lead
time can be reduced by using very sophisticated and modern communication system while Order
lead time can be reduced through efficient supply chain management (Simchi-Levi et al., 2008).
Different time compression strategies, their goals and effects on lead time based on the age of the
business are summarized in Table 1.
One of the effective ways to reduce the lead time is Time-based study. The term time-based study
first appeared in the open literature in 1988 (Stalk, 1988). Time-based competition is a strategy by
which a firm makes better use of time as a resource to acquire a competitive advantage. It seeks to
compress the time required to Propose, Develop, Manufacture, Market and Deliver its products
(Qunhui and Yang, 2011). To get such time-based advantages it is necessary to shorten the lead
time as much as possible. There are two measures prior to implementing time-based strategies- i)
Timeliness-to-market (this includes Fast-to-market, Fast-to-produce and Early withdraw the
product from the market) and ii) Measure of ‘P time’ and ‘D time’. P time measures the time
needed for all the necessary processes and delivers that product to the customer (generally known
as Lead time). D time measures the time for which a customer is willing to wait to have their
demand fulfilled (Harrison and Hoek, 2011).
For managing timeliness or reducing the gap between P time and D time in the logistics pipeline
several strategies are in practiced like make to order (MTO) and assemble to order (ATO) which
consider a customer order decoupling point (CODP). MTO is a branch of Lean Manufacturing
philosophy where manufacturing starts only after receiving the customer’s order (Kabaivanova,
2015). This is a Pull type production system an oppose to a Push type production system like Make
to Stock (MTS). ATO is a similar pull-type production system where assembly starts only after a
demand is created (Song and Zipkin, 2003). A Time-Based Process Map (TBPM) identifies the
International Journal of Mathematical, Engineering and Management Sciences
Vol. 5, No. 1, 96-107, 2020
https://doi.org/10.33889/IJMEMS.2020.5.1.009
98
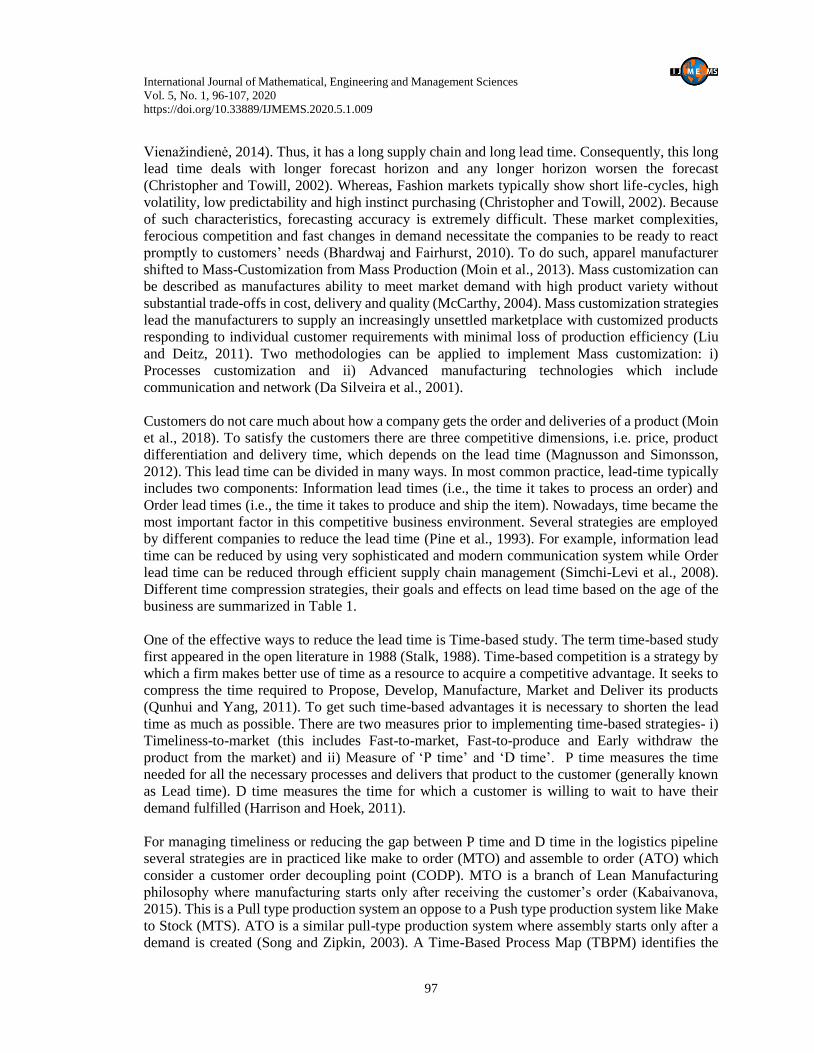
value-adding and non-value adding activities on a supply chain and guides the user for generating
short term and long-term solution (Harrison and Hoek, 2011). A methodical framework for
implementation of Time-based strategies is shown in Figure 1.
Table 1. Lead time reduction strategies depending on their age (Simchi-Levi et al., 2008)
Age of Business Time Compression strategies
The goal of Time
Compression
strategies
Lead
time
Customer
satisfaction Remarks
Age of
manufacturing
(1900-1960)
Setup redesign, Inventory control,
Cellular manufacturing, Preventive
maintenance, Employee involvement in
problem-solving, MRP, MRP II, etc.
Reduce production
time Long Low
Reduce
production time
Age of
distribution (1960-1990)
All above + Direct shipment,
Warehousing, Cross-docking, Transshipment, Product differentiation,
Push-pull boundary, etc.
Manufacturing age
plus
Reduce replenish time
Medium Average
Reduce
production and
distribution time
Age of
information
(1990-2010)
All above + Concurrent and parallel processing, Electronic Data Interchange,
Delayed product differentiation, Supplier
relationship, Vendor-managed inventory (VMI), E-commerce, ERP, ERP II, etc.
Manufacturing and
distribution age plus
Reduce ordering time
Medium Above average
Reduce
information & material flow
time.
Age of the
customer
(2010-next)
All above + Customer Relationship
Management, Customer-focused strategy, Demand forecasting from
customer behavior, involving the
customer in new products development,
shortening business life cycle and
Introduce customer-centric business, etc.
Manufacturing, distribution and
information age plus
Reduce demand
forecasting time
Short High
Satisfy &
Surprise the
customers
Age of market-on-time
(Authors’
perception
All above + Demand rise & creation,
manufacturing as per demand and fulfillment of the demand.
All of the above plus
Dominate market like
fashion leader and Push sell with demand
rise and creation
Very
short Optimum
Satisfy & Surprise the
customers and
control market
Figure 1. Methodology for time-based process improvement (Harrison and Hoek 2011)
Mind-set to required changes for improvement
Go through and evaluate the
process
Identify non-value-adding
processes
Identify the causes of non-value-added
processes
Improve the process
Review the changes in
process
International Journal of Mathematical, Engineering and Management Sciences
Vol. 5, No. 1, 96-107, 2020
https://doi.org/10.33889/IJMEMS.2020.5.1.009
99
Every process mapping including TBPM demonstrates the information flows and the physical
flows together (Bicheno and Holweg, 2000). TBPM is one of the seven mapping tools of ‘Seven
Value Stream Mapping Tools’ (Gracanin et al., 2014). ‘Seven Value Stream Mapping Tools’
includes: (i) Process activity mapping, (ii) Supply chain response matrix, (iii) Production variety
funnel, (iv) Quality filter mapping, (v) Demand amplification mapping, (vi) Decision point analysis
and (vii) Physical structure mapping such as Value stream costing, Cost-time and TBPM
(Chapman, 2003). For the application of Physical structure mapping, cost and quality cannot be
measured properly due to the poor understanding of costs and quality in reality (Harrison and Hoek,
2011). Whereas time can be measured easily and that everyone understands, even people with
minimal training can measure the performance of processes or activities of any large issues in terms
of time. Hence TBPM fits well to all kind of process more than a cross-functional toolbox of Seven
Value Stream Mapping Tools. The application of TBPM was used to a range of industrial sectors
including aerospace and construction, textile supply chain and automotive industries to decrease
the lead time in production (Forza and Filippini, 1993).
Generally, all participants of a supply chain (manufacturers, suppliers, buyer and retailers) have
their own and individual core competencies. When all the partners merge and conjunct their
individual competencies, they can achieve their goals. The time-based strategy for Quick Response
also becomes a great premium for both the organization and supply chain level. To achieve time-
based competitive advantages, this case study adopts time-based process mapping (TBPM), an
effective tool to create the visibility of value-adding and non-value adding time across the network.
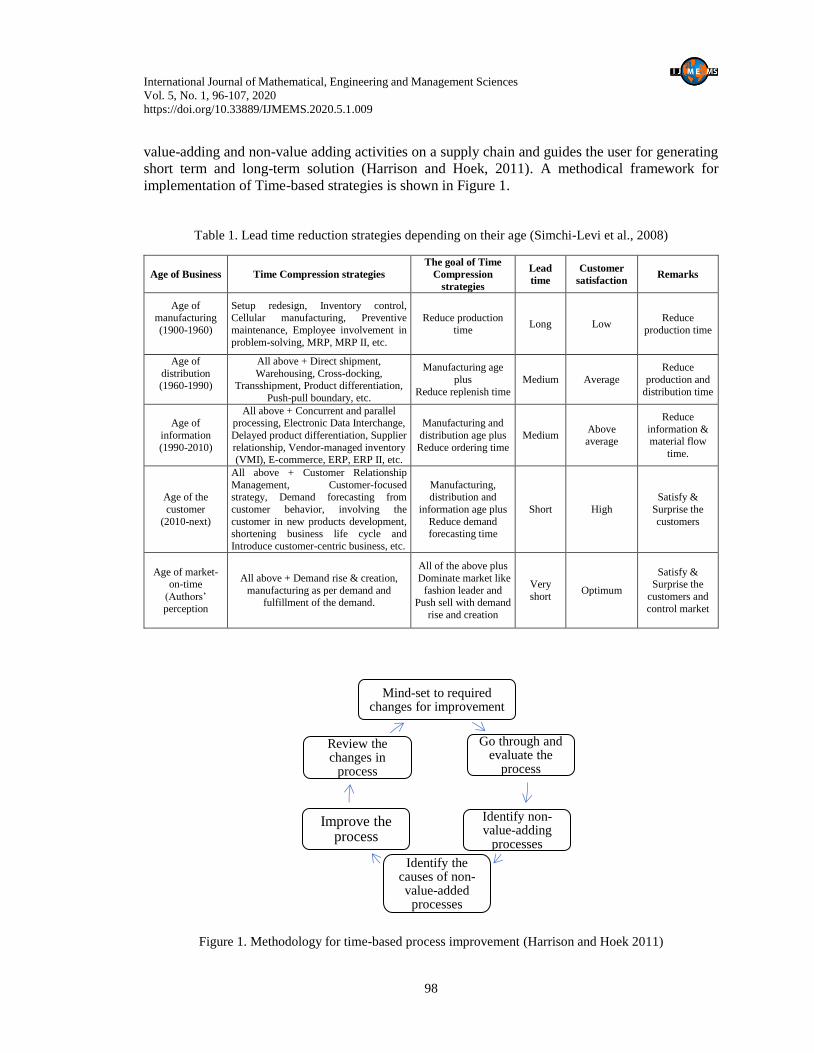
2. The Supply Chain under Investigation This case study focused on an apparel supply chain, of which upstream, downstream and
manufacturer are located in different countries. The manufacturer is performing as a coupling point
of upstream (Suppliers) and downstream (Buyers). In this supply chain, the buyer has direct
linkages with consumers through his own retail outlet. Hence the buyer develops the forecasted
styles through a manufacturer and manufacturer produces those styles by collecting required
materials from suppliers. After developing a style, a corresponding contract is placed by the buyer
to the manufacturer and the contract is executed through all supply chain participants. The chain
structure is shown in Figure 2. It should be noted that no MTO or ATO strategy is applied currently
on this supply chain. However, the authors of this manuscript offered an improved supply chain in
the recommendation section.
Figure 2. Supply chain structure of the current case study
Products Products
Information
Monetary
Supplier Manufacturer Buyer & Retailer Materials Materials
Monetary Monetary
Customer
Lead time (P time)
International Journal of Mathematical, Engineering and Management Sciences
Vol. 5, No. 1, 96-107, 2020
https://doi.org/10.33889/IJMEMS.2020.5.1.009
100
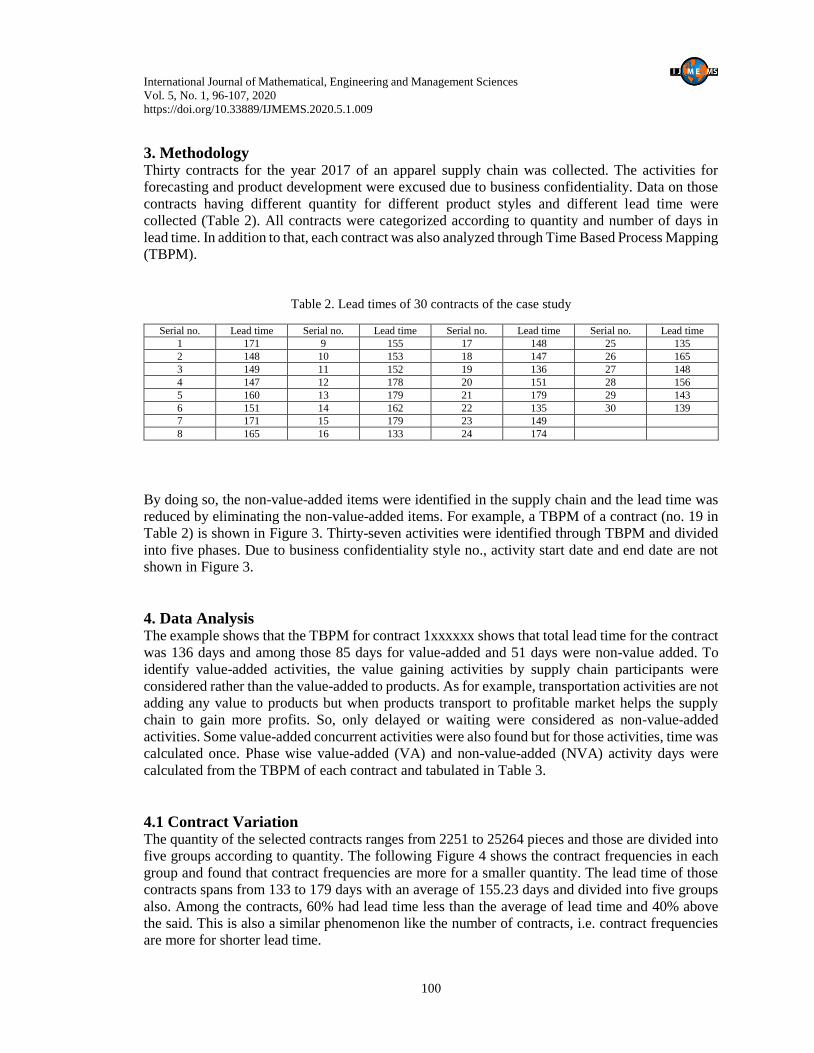
3. Methodology Thirty contracts for the year 2017 of an apparel supply chain was collected. The activities for
forecasting and product development were excused due to business confidentiality. Data on those
contracts having different quantity for different product styles and different lead time were
collected (Table 2). All contracts were categorized according to quantity and number of days in
lead time. In addition to that, each contract was also analyzed through Time Based Process Mapping
(TBPM).
Table 2. Lead times of 30 contracts of the case study
Serial no. Lead time Serial no. Lead time Serial no. Lead time Serial no. Lead time
1 171 9 155 17 148 25 135
2 148 10 153 18 147 26 165
3 149 11 152 19 136 27 148
4 147 12 178 20 151 28 156
5 160 13 179 21 179 29 143
6 151 14 162 22 135 30 139
7 171 15 179 23 149
8 165 16 133 24 174
By doing so, the non-value-added items were identified in the supply chain and the lead time was
reduced by eliminating the non-value-added items. For example, a TBPM of a contract (no. 19 in
Table 2) is shown in Figure 3. Thirty-seven activities were identified through TBPM and divided
into five phases. Due to business confidentiality style no., activity start date and end date are not
shown in Figure 3.
4. Data Analysis The example shows that the TBPM for contract 1xxxxxx shows that total lead time for the contract
was 136 days and among those 85 days for value-added and 51 days were non-value added. To
identify value-added activities, the value gaining activities by supply chain participants were
considered rather than the value-added to products. As for example, transportation activities are not
adding any value to products but when products transport to profitable market helps the supply
chain to gain more profits. So, only delayed or waiting were considered as non-value-added
activities. Some value-added concurrent activities were also found but for those activities, time was
calculated once. Phase wise value-added (VA) and non-value-added (NVA) activity days were
calculated from the TBPM of each contract and tabulated in Table 3.
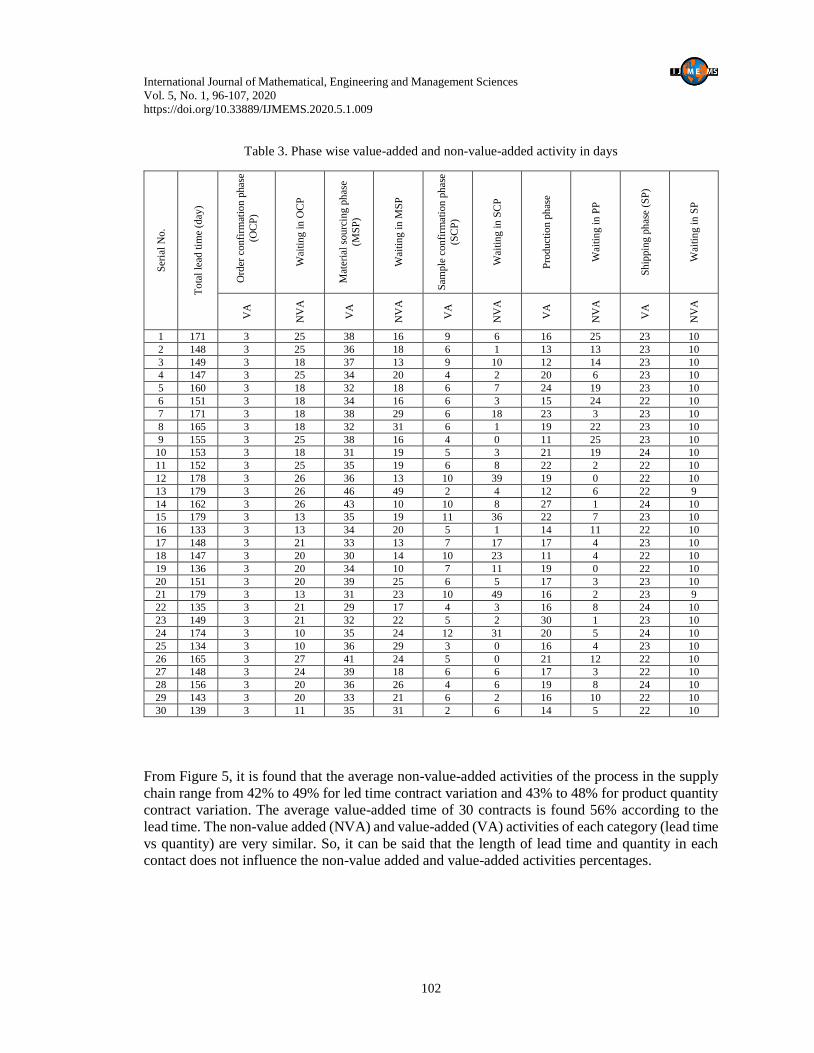
4.1 Contract Variation The quantity of the selected contracts ranges from 2251 to 25264 pieces and those are divided into
five groups according to quantity. The following Figure 4 shows the contract frequencies in each
group and found that contract frequencies are more for a smaller quantity. The lead time of those
contracts spans from 133 to 179 days with an average of 155.23 days and divided into five groups
also. Among the contracts, 60% had lead time less than the average of lead time and 40% above
the said. This is also a similar phenomenon like the number of contracts, i.e. contract frequencies
are more for shorter lead time.
International Journal of Mathematical, Engineering and Management Sciences
Vol. 5, No. 1, 96-107, 2020
https://doi.org/10.33889/IJMEMS.2020.5.1.009
101
Figure 3. Time based process mapping (TBPM)
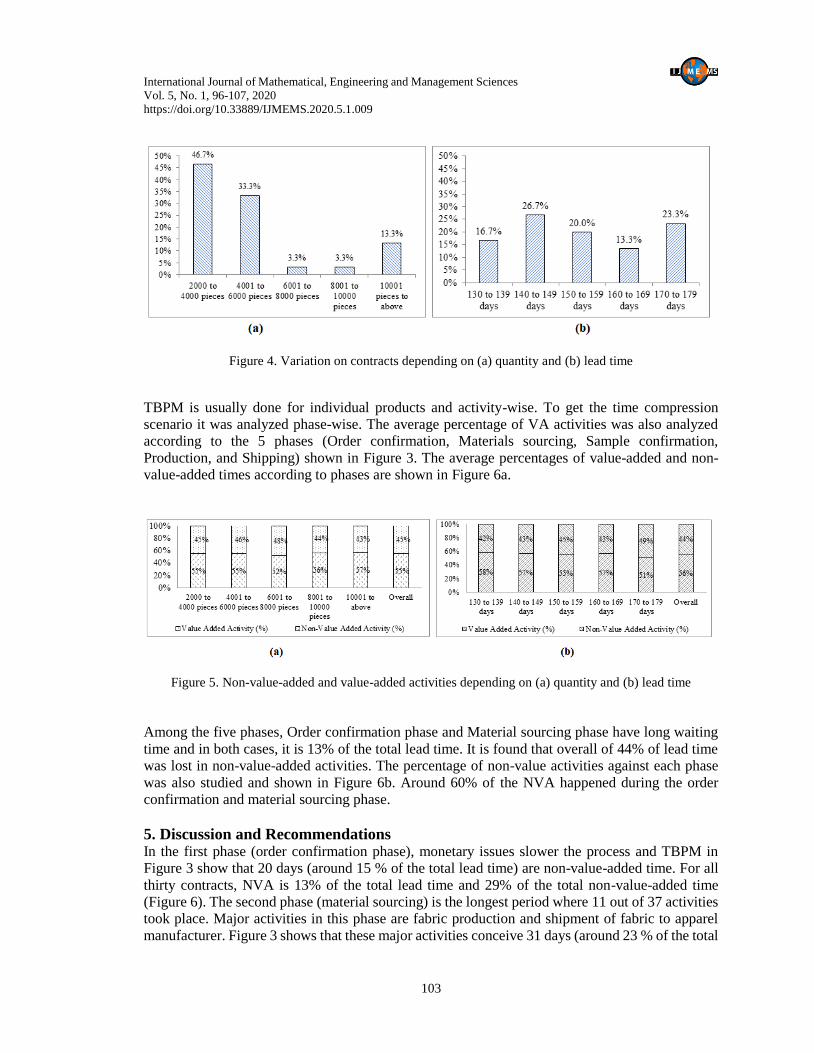
4.2 TBPM
Activity wise time-based process mappings for thirty contracts help to identify value-added (VA)
and non-value-added (NVA) activities. The following Figure 5 shows the percentages of value-
added and non-value added activities against the contract variations: lead time and number of
contracts as mentioned in section 4.1.
International Journal of Mathematical, Engineering and Management Sciences
Vol. 5, No. 1, 96-107, 2020
https://doi.org/10.33889/IJMEMS.2020.5.1.009
102
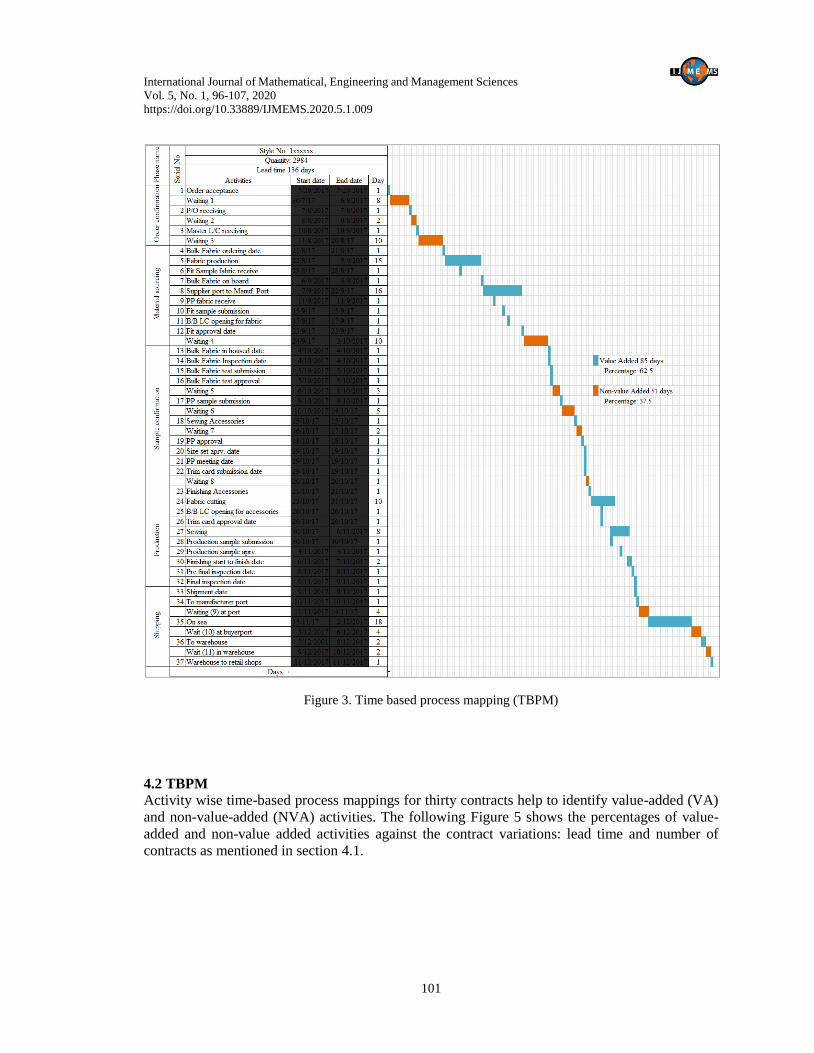
Table 3. Phase wise value-added and non-value-added activity in days
Ser
ial
No.
To
tal
lead
tim
e (d
ay)
Ord
er c
on
firm
atio
n p
has
e
(OC
P)
Wai
tin
g i
n O
CP
Mat
eria
l so
urc
ing
ph
ase
(MS
P)
Wai
tin
g i
n M
SP
Sam
ple
con
firm
atio
n p
has
e
(SC
P)
Wai
tin
g i
n S
CP
Pro
du
ctio
n p
has
e
Wai
tin
g i
n P
P
Sh
ippin
g p
has
e (S
P)
Wai
tin
g i
n S
P
VA
NV
A
VA
NV
A
VA
NV
A
VA
NV
A
VA
NV
A
1 171 3 25 38 16 9 6 16 25 23 10
2 148 3 25 36 18 6 1 13 13 23 10
3 149 3 18 37 13 9 10 12 14 23 10
4 147 3 25 34 20 4 2 20 6 23 10
5 160 3 18 32 18 6 7 24 19 23 10
6 151 3 18 34 16 6 3 15 24 22 10
7 171 3 18 38 29 6 18 23 3 23 10
8 165 3 18 32 31 6 1 19 22 23 10
9 155 3 25 38 16 4 0 11 25 23 10
10 153 3 18 31 19 5 3 21 19 24 10
11 152 3 25 35 19 6 8 22 2 22 10
12 178 3 26 36 13 10 39 19 0 22 10
13 179 3 26 46 49 2 4 12 6 22 9
14 162 3 26 43 10 10 8 27 1 24 10
15 179 3 13 35 19 11 36 22 7 23 10
16 133 3 13 34 20 5 1 14 11 22 10
17 148 3 21 33 13 7 17 17 4 23 10
18 147 3 20 30 14 10 23 11 4 22 10
19 136 3 20 34 10 7 11 19 0 22 10
20 151 3 20 39 25 6 5 17 3 23 10
21 179 3 13 31 23 10 49 16 2 23 9
22 135 3 21 29 17 4 3 16 8 24 10
23 149 3 21 32 22 5 2 30 1 23 10
24 174 3 10 35 24 12 31 20 5 24 10
25 134 3 10 36 29 3 0 16 4 23 10
26 165 3 27 41 24 5 0 21 12 22 10
27 148 3 24 39 18 6 6 17 3 22 10
28 156 3 20 36 26 4 6 19 8 24 10
29 143 3 20 33 21 6 2 16 10 22 10
30 139 3 11 35 31 2 6 14 5 22 10
From Figure 5, it is found that the average non-value-added activities of the process in the supply
chain range from 42% to 49% for led time contract variation and 43% to 48% for product quantity
contract variation. The average value-added time of 30 contracts is found 56% according to the
lead time. The non-value added (NVA) and value-added (VA) activities of each category (lead time
vs quantity) are very similar. So, it can be said that the length of lead time and quantity in each
contact does not influence the non-value added and value-added activities percentages.
International Journal of Mathematical, Engineering and Management Sciences
Vol. 5, No. 1, 96-107, 2020
https://doi.org/10.33889/IJMEMS.2020.5.1.009
103
Figure 4. Variation on contracts depending on (a) quantity and (b) lead time
TBPM is usually done for individual products and activity-wise. To get the time compression
scenario it was analyzed phase-wise. The average percentage of VA activities was also analyzed
according to the 5 phases (Order confirmation, Materials sourcing, Sample confirmation,
Production, and Shipping) shown in Figure 3. The average percentages of value-added and non-
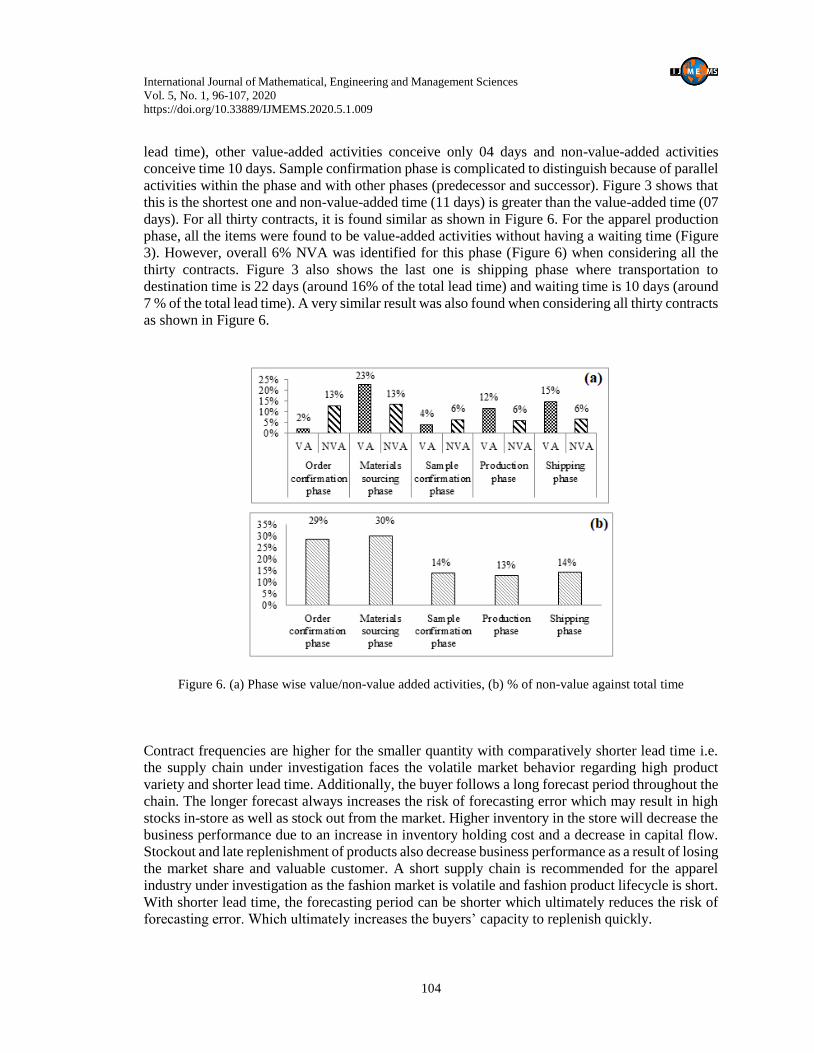
value-added times according to phases are shown in Figure 6a.
Figure 5. Non-value-added and value-added activities depending on (a) quantity and (b) lead time
Among the five phases, Order confirmation phase and Material sourcing phase have long waiting
time and in both cases, it is 13% of the total lead time. It is found that overall of 44% of lead time
was lost in non-value-added activities. The percentage of non-value activities against each phase
was also studied and shown in Figure 6b. Around 60% of the NVA happened during the order
confirmation and material sourcing phase.
5. Discussion and Recommendations In the first phase (order confirmation phase), monetary issues slower the process and TBPM in
Figure 3 show that 20 days (around 15 % of the total lead time) are non-value-added time. For all
thirty contracts, NVA is 13% of the total lead time and 29% of the total non-value-added time
(Figure 6). The second phase (material sourcing) is the longest period where 11 out of 37 activities
took place. Major activities in this phase are fabric production and shipment of fabric to apparel
manufacturer. Figure 3 shows that these major activities conceive 31 days (around 23 % of the total
International Journal of Mathematical, Engineering and Management Sciences
Vol. 5, No. 1, 96-107, 2020
https://doi.org/10.33889/IJMEMS.2020.5.1.009
104
lead time), other value-added activities conceive only 04 days and non-value-added activities
conceive time 10 days. Sample confirmation phase is complicated to distinguish because of parallel
activities within the phase and with other phases (predecessor and successor). Figure 3 shows that
this is the shortest one and non-value-added time (11 days) is greater than the value-added time (07
days). For all thirty contracts, it is found similar as shown in Figure 6. For the apparel production
phase, all the items were found to be value-added activities without having a waiting time (Figure
3). However, overall 6% NVA was identified for this phase (Figure 6) when considering all the
thirty contracts. Figure 3 also shows the last one is shipping phase where transportation to
destination time is 22 days (around 16% of the total lead time) and waiting time is 10 days (around
7 % of the total lead time). A very similar result was also found when considering all thirty contracts
as shown in Figure 6.
Figure 6. (a) Phase wise value/non-value added activities, (b) % of non-value against total time
Contract frequencies are higher for the smaller quantity with comparatively shorter lead time i.e.
the supply chain under investigation faces the volatile market behavior regarding high product
variety and shorter lead time. Additionally, the buyer follows a long forecast period throughout the
chain. The longer forecast always increases the risk of forecasting error which may result in high
stocks in-store as well as stock out from the market. Higher inventory in the store will decrease the
business performance due to an increase in inventory holding cost and a decrease in capital flow.
Stockout and late replenishment of products also decrease business performance as a result of losing
the market share and valuable customer. A short supply chain is recommended for the apparel
industry under investigation as the fashion market is volatile and fashion product lifecycle is short.
With shorter lead time, the forecasting period can be shorter which ultimately reduces the risk of
forecasting error. Which ultimately increases the buyers’ capacity to replenish quickly.
International Journal of Mathematical, Engineering and Management Sciences
Vol. 5, No. 1, 96-107, 2020
https://doi.org/10.33889/IJMEMS.2020.5.1.009
105
It is also recommended that the supply chain follow true MTO strategy where the D time (the time
a customer is willing to wait) is equal to the P time (total lead time). In every phase, there are scopes
to reduce P time. By using advanced information technology and long-term relationship with
corresponding financial institutes the non-value-added time in order confirmation phase can be
eliminated. Again, the commitment and continuous long-term relationship among the supply chain
participants may establish a trustworthy business relationship which will also help the chain to
minimize the non-value-added time in the order confirmation phase.
The P time for sample confirmation phase can be shortened with the empowerment of all
participants in the supply chain. The participation of all the parties (through organizational
learning) within the supply chain in forecasting and product development will reduce forecasting
error. Organizational leanings will develop the capability of fabric producers to develop a new
fabric during the order confirmation phase before the material sourcing phase as a concurrent
activity. In this way, the waiting time (NVA) for the material sourcing phase can be eliminated and
the lead time (P time) of this phase can be shortened. Additionally, vendor managed inventory
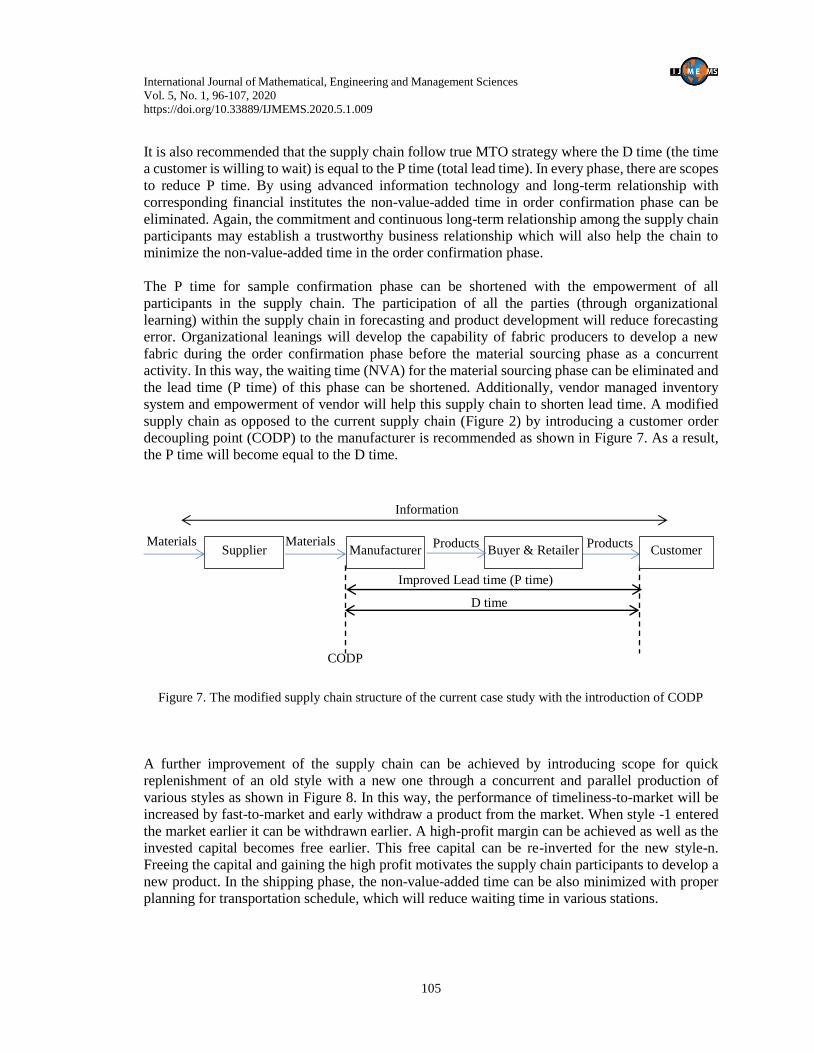
system and empowerment of vendor will help this supply chain to shorten lead time. A modified
supply chain as opposed to the current supply chain (Figure 2) by introducing a customer order
decoupling point (CODP) to the manufacturer is recommended as shown in Figure 7. As a result,
the P time will become equal to the D time.
Figure 7. The modified supply chain structure of the current case study with the introduction of CODP
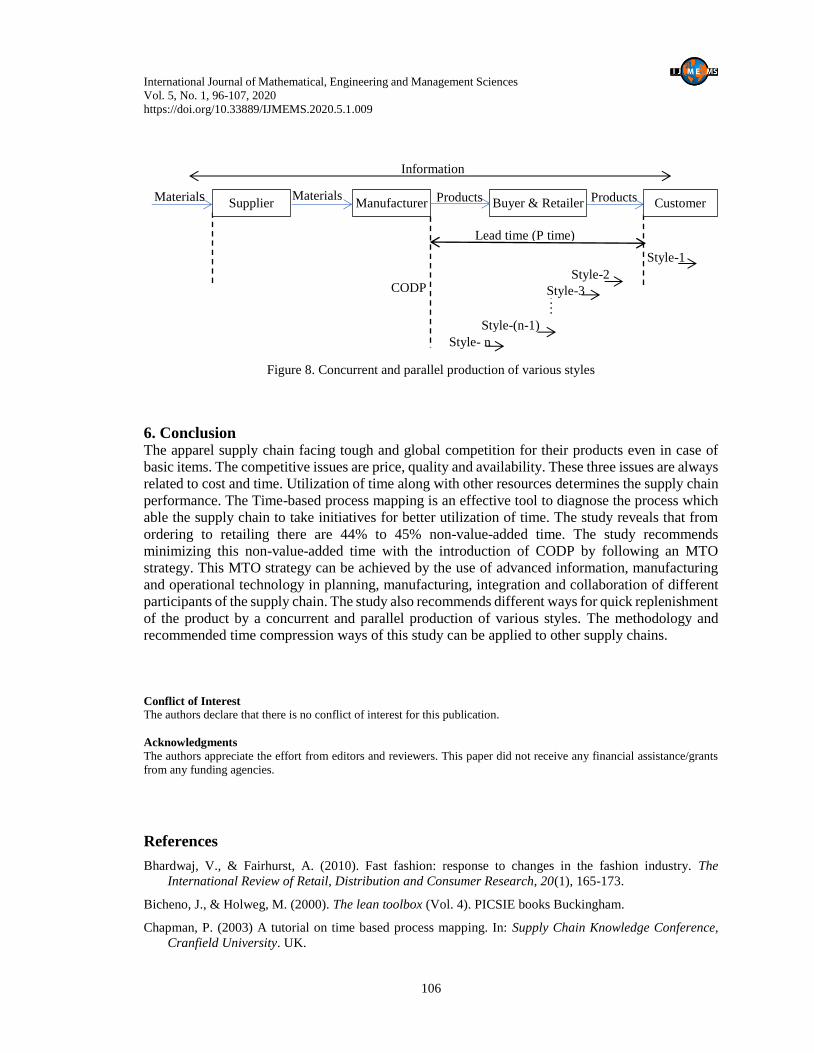
A further improvement of the supply chain can be achieved by introducing scope for quick
replenishment of an old style with a new one through a concurrent and parallel production of
various styles as shown in Figure 8. In this way, the performance of timeliness-to-market will be
increased by fast-to-market and early withdraw a product from the market. When style -1 entered
the market earlier it can be withdrawn earlier. A high-profit margin can be achieved as well as the
invested capital becomes free earlier. This free capital can be re-inverted for the new style-n.
Freeing the capital and gaining the high profit motivates the supply chain participants to develop a
new product. In the shipping phase, the non-value-added time can be also minimized with proper
planning for transportation schedule, which will reduce waiting time in various stations.
Improved Lead time (P time)
CODP
D time
Information
Products Products Supplier Manufacturer Buyer & Retailer
Materials Materials Customer
International Journal of Mathematical, Engineering and Management Sciences
Vol. 5, No. 1, 96-107, 2020
https://doi.org/10.33889/IJMEMS.2020.5.1.009
106
Figure 8. Concurrent and parallel production of various styles
6. Conclusion
The apparel supply chain facing tough and global competition for their products even in case of
basic items. The competitive issues are price, quality and availability. These three issues are always
related to cost and time. Utilization of time along with other resources determines the supply chain
performance. The Time-based process mapping is an effective tool to diagnose the process which
able the supply chain to take initiatives for better utilization of time. The study reveals that from
ordering to retailing there are 44% to 45% non-value-added time. The study recommends
minimizing this non-value-added time with the introduction of CODP by following an MTO
strategy. This MTO strategy can be achieved by the use of advanced information, manufacturing
and operational technology in planning, manufacturing, integration and collaboration of different
participants of the supply chain. The study also recommends different ways for quick replenishment
of the product by a concurrent and parallel production of various styles. The methodology and
recommended time compression ways of this study can be applied to other supply chains.
Conflict of Interest
The authors declare that there is no conflict of interest for this publication.
Acknowledgments
The authors appreciate the effort from editors and reviewers. This paper did not receive any financial assistance/grants
from any funding agencies.
References
Bhardwaj, V., & Fairhurst, A. (2010). Fast fashion: response to changes in the fashion industry. The
International Review of Retail, Distribution and Consumer Research, 20(1), 165-173.
Bicheno, J., & Holweg, M. (2000). The lean toolbox (Vol. 4). PICSIE books Buckingham.
Chapman, P. (2003) A tutorial on time based process mapping. In: Supply Chain Knowledge Conference,
Cranfield University. UK.
……
Lead time (P time)
Information
Products Products Supplier Manufacturer Buyer & Retailer Materials Materials
Customer
Style-1
Style-2
Style-3
Style-(n-1)
Style- n
CODP
International Journal of Mathematical, Engineering and Management Sciences
Vol. 5, No. 1, 96-107, 2020
https://doi.org/10.33889/IJMEMS.2020.5.1.009
107
Christopher, M., & Towill, D.R. (2002). Developing market specific supply chain strategies. The
International Journal of Logistics Management, 13(1), 1-14.
Čiarnienė, R., & Vienažindienė, M. (2014). Agility and responsiveness managing fashion supply chain.
Procedia-Social and Behavioral Sciences, 150, 1012-1019.
Da Silveira, G., Borenstein, D., & Fogliatto, F.S. (2001). Mass customization: literature review and research
directions. International Journal of Production Economics, 72(1), 1-13.
Forza, C., Vinelli, A., & Filippini, R. (1993, July). Telecommunication services for quick response in the
textile-apparel industry. In: Proceedings of the 1st International Symposium on Logistics (pp. 119-26).
The University of Nottingham. Nottingham, UK.
Gracanin, D., Buchmeister, B., & Lalic, B. (2014). Using cost-time profile for value stream optimization.
Procedia Engineering, 69, 1225-1231.
Harrison, A., & Hoek, R.I. (2011). Logistics management & strategy: competing through the supply chain
(Edition 4). Pearson Education Inc. New Jersey.
Kabaivanova, S. (2015). Made to order - the new fashion formula in men's suit market. accessed on 15 May
2019, https://made-to-measure-suits.bgfashion.net/article/10282/61/Made-To-Order-the-new-fashion-
formula-in-mens-suit-market.
Liu, G., & Deitz, G.D. (2011). Linking supply chain management with mass customization capability.
International Journal of Physical Distribution & Logistics Management, 41(7), 668-683.
Magnusson, D., & Simonsson, P. (2012). A framework for decreasing lead times by supplier collaboration.
A study performed at Mölnlycke Health Care. Chalmers University of Technology, Sweden.
Martínez, S., Errasti, A., & Rudberg, M. (2015). Adapting Zara’s ‘Pronto Moda’to a value brand retailer.
Production Planning & Control, 26(9), 723-737.
McCarthy, I.P. (2004). Special issue editorial: the what, why and how of mass customization. Production
Planning & Control, 15(4), 347-351.
Moin, C.J., Doulah, A.S., Ali, M., & Sarwar, F. (2018). Implementation of an operating procedure for quality
control at production level in a RMG industry and assessment of quality improvement. The Journal of
The Textile Institute, 109(4), 524-535.
Moin, C.J., Sarwar, F., & Doulah, A.S. (2013). Investigation of a hybrid production system for mass-
customization apparel manufacturing. Journal of Textile and Apparel, Technology and Management,
8(3), 1-10.
Pine, B.J., Victor, B., & Boynton, A.C. (1993). Making mass customization work. Harvard Business Review,
71(5), 108-111.
Qunhui, L., & Yang, H. (2011). The effects of organizational structure on time-based performance: An
empirical study in Chinese automobile industry. Journal on Innovation and Sustainability, 2(3), 59-67.
Simchi-Levi, D., Kaminsky, P., Simchi-Levi, E., & Shankar, R. (2008). Designing and managing the supply
chain: concepts, strategies and case studies. Tata McGraw-Hill Education.
Song, J.-S., & Zipkin, P. (2003). Supply chain operations: assemble-to-order systems. Handbooks in
Operations Research and Management Science, 11, 561-596.
Stalk, G. (1988). Time: the next source of competitive advantage. Harvard Business Review, 66(4), 41-51.
Original content of this work is copyright © International Journal of Mathematical, Engineering and Management Sciences. Uses
under the Creative Commons Attribution 4.0 International (CC BY 4.0) license at https://creativecommons.org/licenses/by/4.0/