Embed Size (px)
Citation preview
Time-dependent development of flow instabilities of non-Newtonian melts and suspensions with rigid particles
Proceedings of AICHE Annual Meeting Austin, Texas
November 8, 2004
H. S. Tang* and D. M. Kalyon **
Stevens Institute of Technology
Hoboken, NJ 07030, USA
* Presently with Battelle Seattle Research Center, 1100 Dexter Av., Seattle, WA 98109
Key words : flow instabilities, wall slip, extrudate, and surface irregularities
1. Introduction
Flow instabilities are widely encountered during the extrusion of non-Newtonian fluids
through various types of dies. Flow instabilities are manifested during extrusion by the
occurrence of various types of distortions of the surface or the bulk of the extrudates,
sometimes accompanied with time-dependent fluctuations in the pressure necessary to
drive the flow under constant volumetric flow rate conditions. Various types of
distortions of the extrudates are referred to as melt fracture, shark skin, gross surface
irregularities, spurt flow, slip/stick flow. The occurrences of such distortions of
extrudates present bottlenecks, i.e., upper limits to the manufacturing rates in extrusion
based processing of polymers and polymeric suspensions. Consistent with its industrial
importance it has received significant academic and industrial attention [Benbow and
Lamb (1963); Petrie and Denn (1976); Denn (2001); Kalyon and Gevgilili (2003)].
However, as suggested by Denn (2001), the instability phenomenon remains as an issue
that is far from being clearly understood.
Capillary and slit die flows are often used as prototypes for studying the development of
flow instabilities [see, for example, Lim and Schowalter (1989), Donlder et al. (1998),
and Ovaici etc (1998)]. Previous studies have indicated that compressibility of the melt
and slip at the wall are two important factors leading to the instabilities. Particularly, it
was suggested that the discontinuity in the wall slip velocity versus wall shear stress
relationships can lead to the onset of flow instabilities [Hatzikiriakos and Dealy (1992a),
or (1992b)?]. Other studies have suggested that the flow instabilities can occur on the
negative-slope branch, e.g., during which the slip velocity decreases as wall stress
increases [Georgiou (2003)].
This study is a continuation of our earlier studies [Kalyon and Gevgilili (2003) and
Kalyon et al. (2003)] which aim at probing the effects of the flow boundary condition at
the wall on the development of flow instabilities and extrudate surface irregularities upon
the extrusion of polymer melts and polymeric suspensions. In these earlier studies the
wall slip and flow instability behavior of two polymers, i.e., a poly (dimethyl siloxane),
PDMS and an oxetane based alternating block thermo plastic elastomer BAMO/AMMO-
TPE were studied along with the wall slip and flow instability behavior of PDMS filled
with 10, 20, 40% by volume of hollow glass spheres and 60% by volume of KCl Filled
BAMO/AMMO- TPE. Steady torsional flow was used in conjunction with the straight-
line marker technique to analyze wall slip in steady torsional flow. Thermal imaging and
high-speed cinematography were used with capillary flow to characterize the surface
features of extrudates emerging from capillary dies. The effects of the convergence
angle from the reservoir into the capillary die were also investigated (15, 45 and 75°)
for unfilled PDMS and 10% glass filled PDMS. It was determined that the angle of
convergence of the capillary die had no effect on the development of surface
irregularities for these materials.
The incorporation of the glass filler into the PDMS binder gave rise to a reduction of
the apparent shear rate range over which gross surface irregularities were observed.
Furthermore, the extrudates of PDMS with the greatest solid loading level of our
study, i.e., 40% by volume spherical glass were largely free from surface
irregularities except at relatively very low apparent shear rates. On the other hand,
BAMO/AMMO elastomer melt, which exhibits stable stick over relatively high
strains and shear rates in steady torsional flow does not exhibit surface irregularities
in the same shear rate range in capillary flow [Kalyon and Gevgilili (2003)]. However,
the incorporation of rigid particles into the BAMO/AMMO elastomer gives rise to
flow instabilities and surface irregularities during extrusion.
These earlier results suggested that the mechanisms for the development of surface
irregularities of the extrudates of polymers and polymeric suspensions appear to
depend on the stability of the wall boundary condition. Our hypothesis was that if a
stable stick condition or a stable wall slip condition prevails at the wall over a broad
range of shear rates, then flow instabilities are not observed over the same shear rate
range. However, if there is a transition from a stick to slip or slip to stick condition
then flow instabilities are experimentally observed at the transition point.
Our previous work has also shown that the wall slip behavior of polymers and
polymeric suspensions is significantly affected by the amount of air entrained into the
melt [Aral and Kalyon (1995); Kalyon et al. (1995)]. This intuitively suggests that the
wall slip behavior would be a function of pressure due to the compressibility of the
melt and the air it contains, as indeed found to be the case by Dealy and co-workers
[Hatzikiriakos and Dealy (1992b)]. Following up on the compressibility and wall slip
issues recently, we have derived analytical solutions for steady compressible capillary
and slit flows of generalized Newtonian fluids subject to pressure-dependent wall slip.
These solutions show that, with the slip coefficient assumed to be inversely proportional
to pressure, slip velocity increases in the flow direction and the flow can become a plug
flow at the exit of the die.
This present paper extends the steady analysis to the time-dependent analysis of the
extrusion flow subject to pressure dependent wall slip condition. As experimental
evidence we will use results from our previous studies focusing on an unfilled
poly(dimethyl siloxane), PDMS, melt and PDMS filled with 40% by volume of glass
spheres [Kalyon and Gevgilili (2003); Kalyon et al. (2003)].
II. Experiments
Materials
The poly(dimethyl siloxane), PDMS, was procured from GE (GE Silicones-SE-30).
It has a density of 980 kg/m3 at ambient temperature and a zero shear viscosity of
28,900 Pa-s at 30 ºC. The filler particles consisted of spherical hollow glass particles
with a specific gravity of 1.09 and an arithmetic mean particle diameter of 12 µm
(Potters Industry).
Experimental apparati and procedures
An Advanced Rheometric Expansion System (ARES) rheometer, from Rheometric
Scientific, Inc., Piscataway, NJ (currently TA Instruments), was utilized in
conjunction with steady torsional flow using cone-and-plate and parallel-disk
configurations. The environmental chamber was equipped with an imaging window
and auxiliary optics for continuous monitoring of the free surface of the specimen
[Aral and Kalyon (1994); Gevgilili and Kalyon (2001)]. A high-speed camera,
capable of recording at filming speeds as high as 2,000 frames per second, was part of
the set-up.
During steady torsional flow a straight- line marker was placed on the edges of the
cone/plate and the free surface of the polymer melt to enable the characterization of the
wall slip velocity and the true deformation rate [Kalyon et al. (1993), Aral and Kalyon
(1994); Gevgilili and Kalyon (2001)]. The discontinuities that develop between the
surface of the plates of the rheometer and the bulk of the melt suggest the initiation of
wall slip. The steady wall slip velocity values determined using the straight- line marker
technique agree well with the steady wall slip velocity values determined upon the
analysis of the dependence of the shear stress on the surface to volume ratio of the
rheometer, i.e., the conventional Mooney technique [Kalyon et al. (1993)]. The steady
torsional flow behavior of the PDMS and filled PDMS was characterized at various shear
rates and temperatures to determine the conditions under which the catastrophic failure of
the no-slip condition became apparent.
An Instron capillary rheometer was employed to collect additional shear viscosity data
and to study the development of extrudate distortions upon exit from the die. The
diameters, length over the diameter ratios and the converging angle of the tapered entry
geometry connecting the reservoir of the barrel of the rheometer to the straight land
section of the capillary die were changed systematically. The shapes of the extruded
samples, immediately upon extrusion from the die, were captured using a high-speed
camera to allow the immediate characterization of the surfaces of the extrudates. The
surface temperature distributions of the extrudates emerging from the die were also
monitored using a ThermaCam thermal imaging camera. The temperature of the material
immediately upon exit provided data on the effect of viscous energy dissipation and
allowed the determination of the true temperature of the melt.
Experimental results
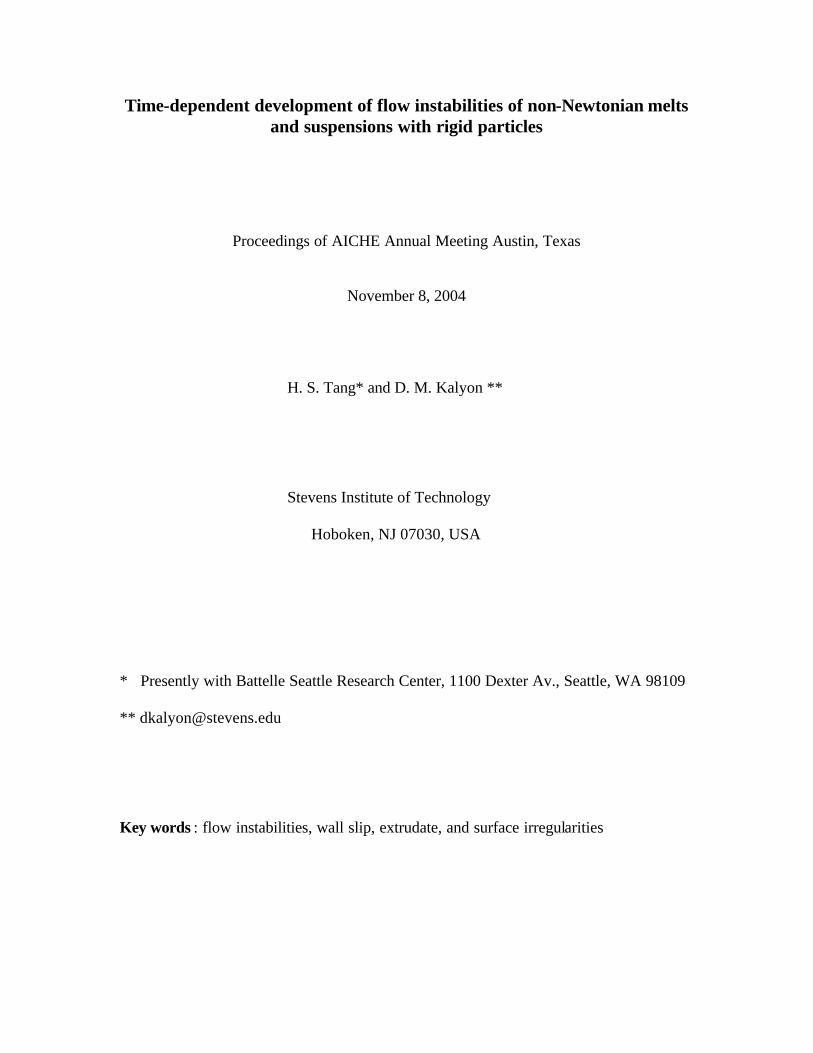
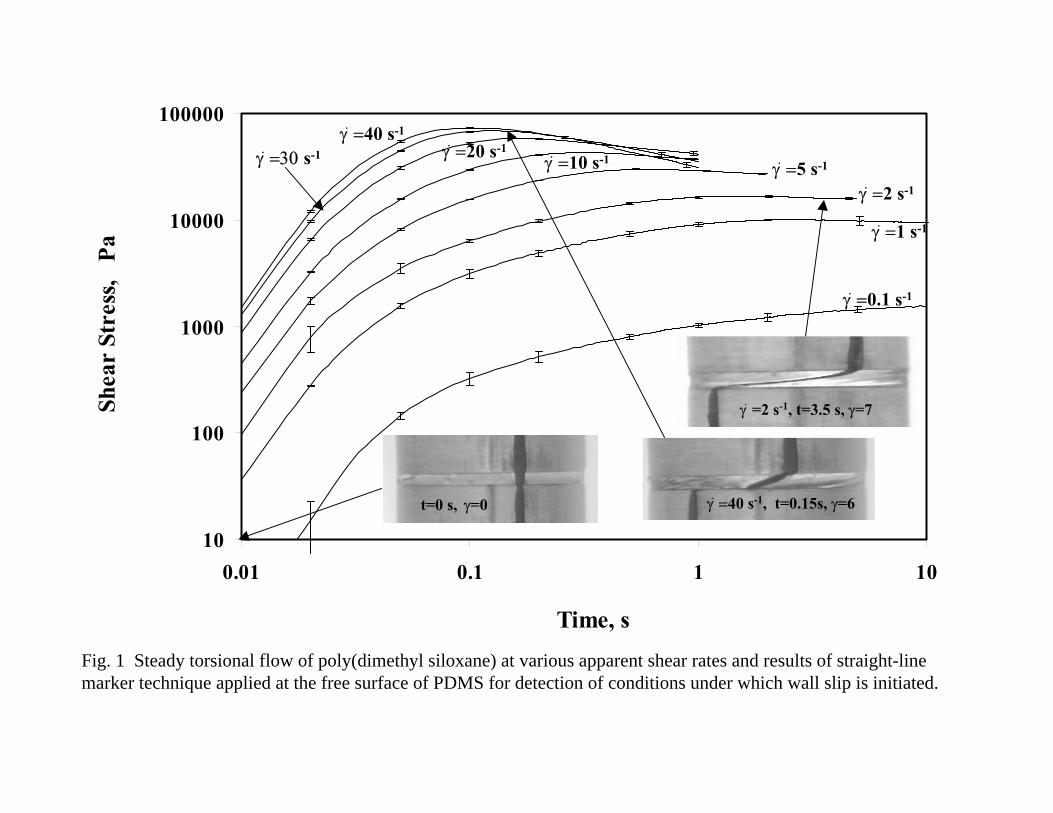
In case of unfilled PDMS steady torsional flow, used with the straight- line marker
technique, suggests that PDMS exhibits strong wall slip (which is observed as a
discontinuity in the marker line at the melt/wall interfaces) in the neighborhood of
0.07 MPa (Figure 1). Previous studies with the same PDMS have indicated that this
critical shear stress, at which strong wall slip is initiated, is temperature independent
[Kalyon and Gevgilili (2003)].
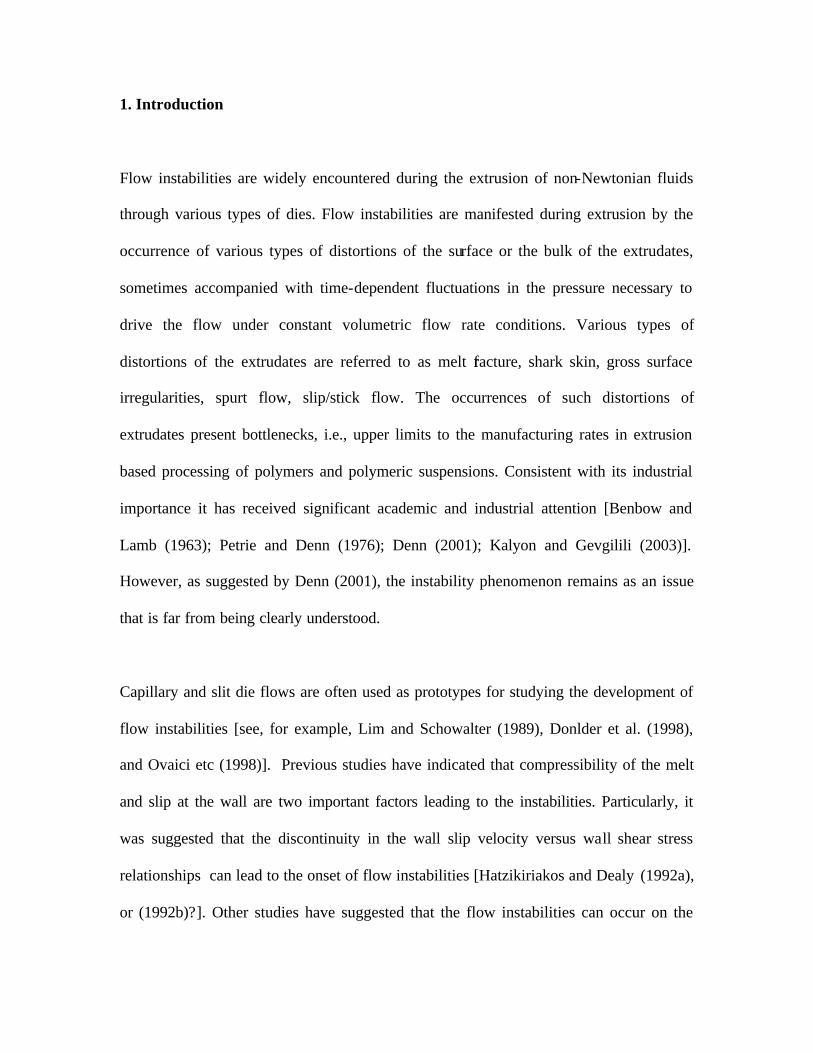
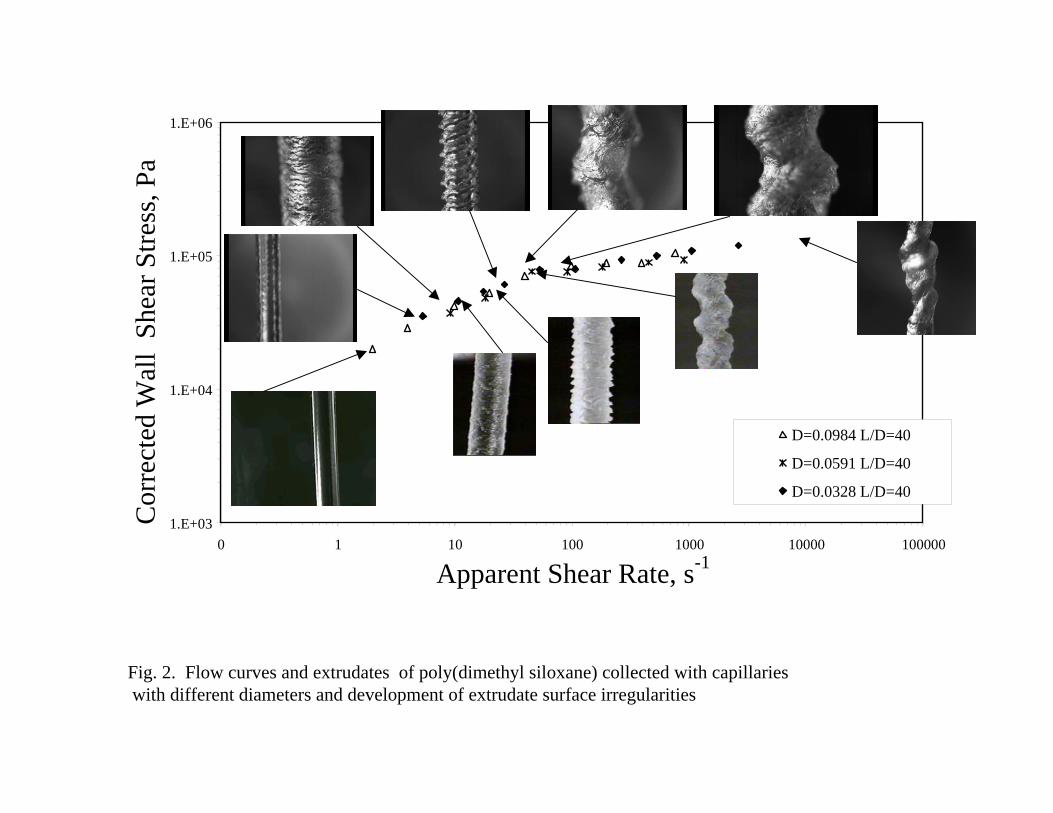
The various types of extrudate distortions observed with the unfilled PDMS as a
function of the flow conditions are shown in Figure 2. The wall shear stress values
were Bagley corrected by using a series of capillaries with systematically-varied
length over diameter ratios of 1, 20 and 40 (or 60). At shear stress values greater than
0.07 MPa severe extrudate surface and bulk distortions were observed for PDMS.
This wall shear stress coincides with the critical wall shear stress in steady torsional
flow at which wall slip is onset. In the relatively low shear rate range the extrudates
of PDMS become undistorted and smooth, and the pressure monotonically increases
to its steady state value. Over a transition region of 0.04 to 0.07 MPa the surfaces of
the extrudates become relatively rough but the bulk is not distorted.
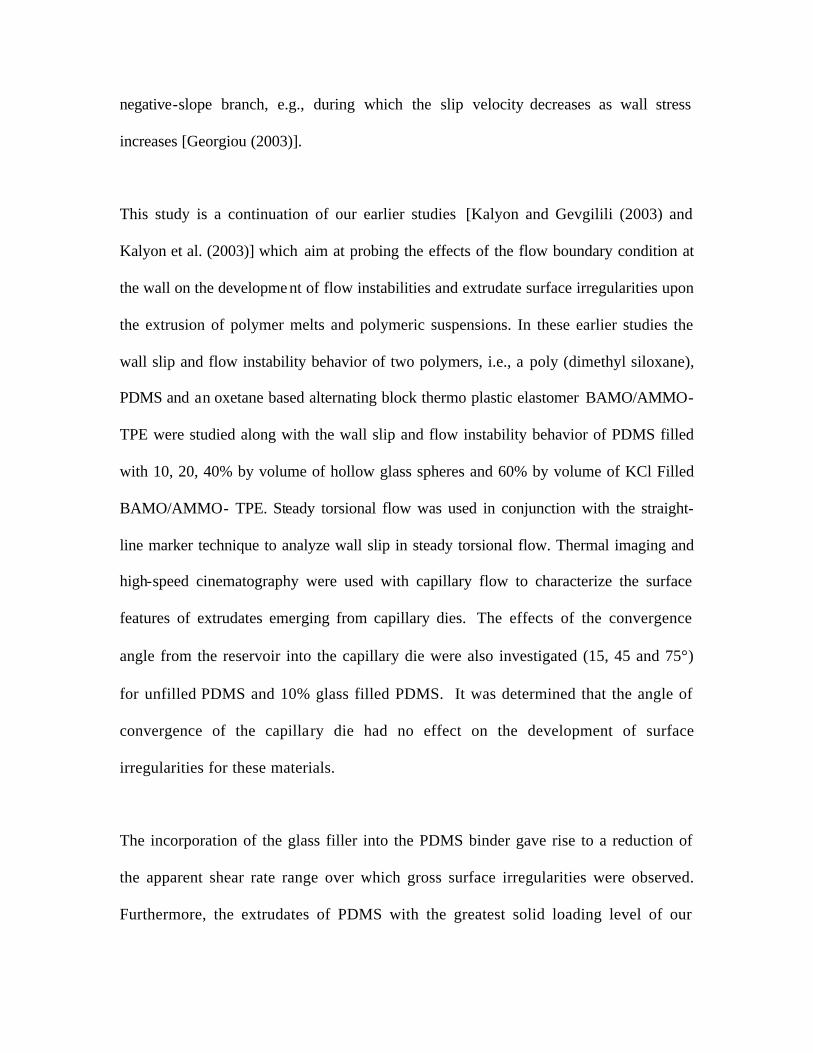
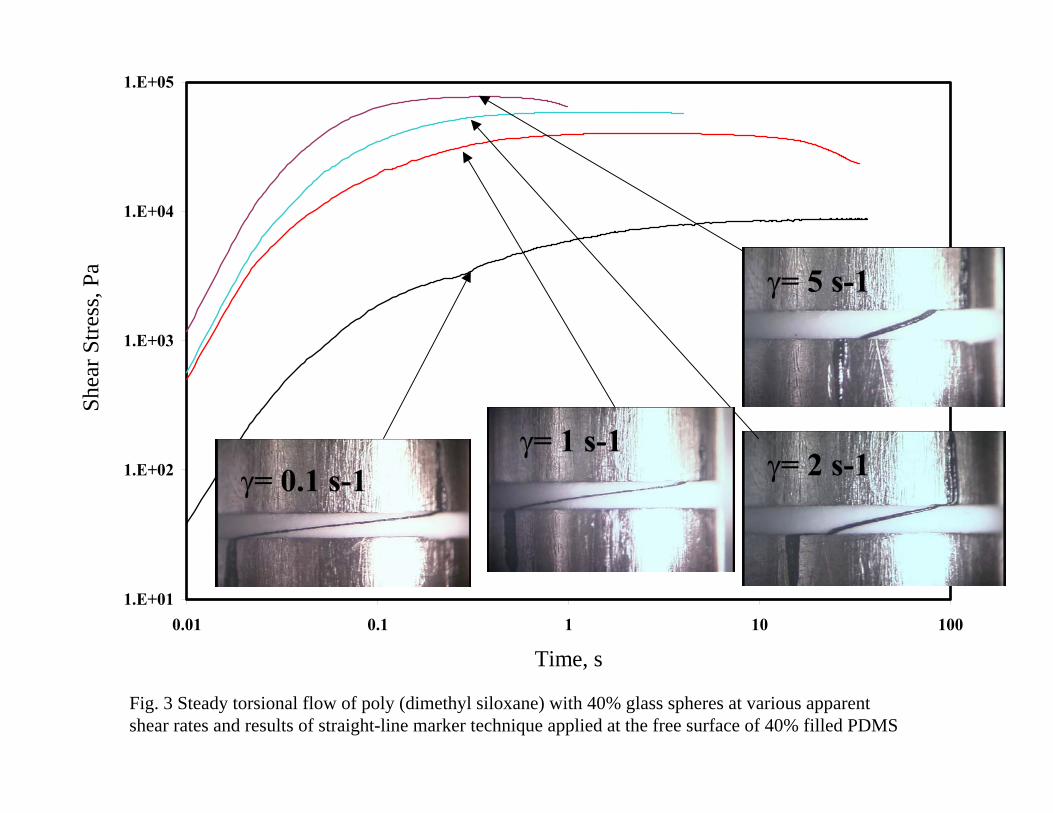
Similar experiments were carried out on PDMS suspensions filled with 10-40% by
volume of glass spheres. The typical results for PDMS suspension with 40% by
volume glass are shown in Figures 3 and 4. Figure 3 shows the typical steady
torsional flow results for the 40% glass filled PDMS. Strong wall slip, as evidenced
by the discontinuities in the straight- line marker occurring at the suspension/wall
interface, occur at a critical wall shear stress range of about 0.029 MPa to 0.035 MPa
for the 10-40% by volume glass filled PDMS suspensions. This critical wall shear
stress is thus smaller than the critical wall shear stress value associated with the onset
of strong wall slip observed for the unfilled PDMS.
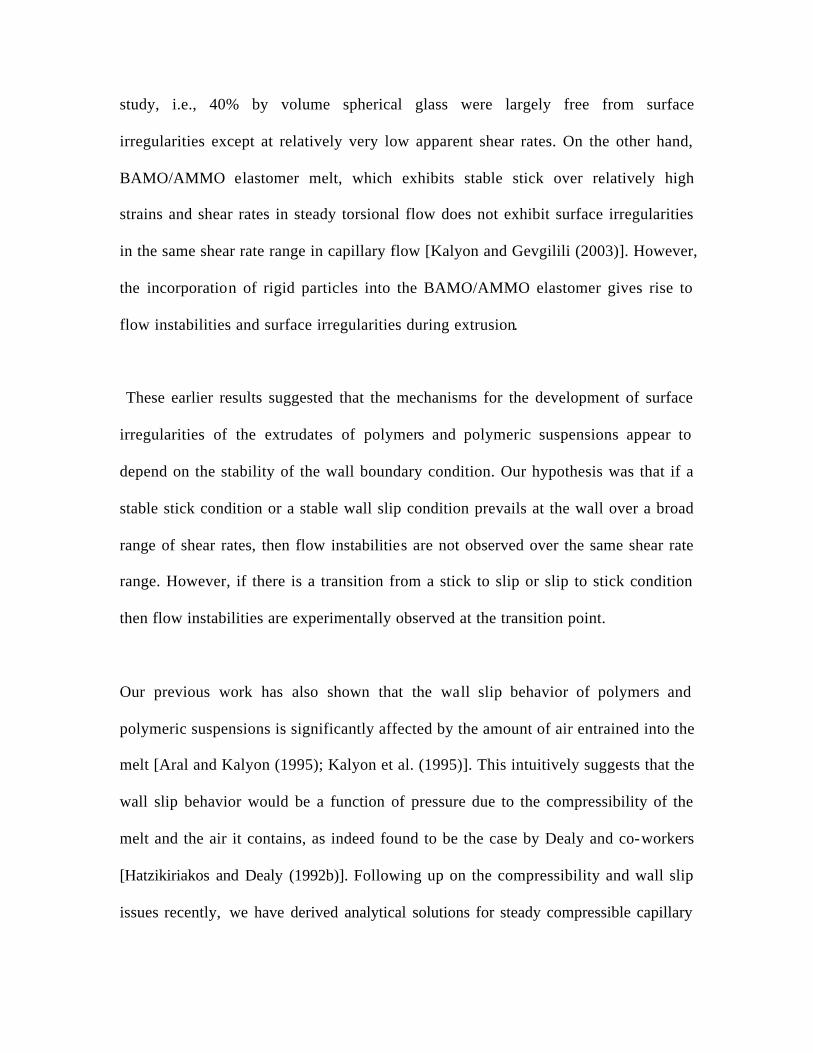
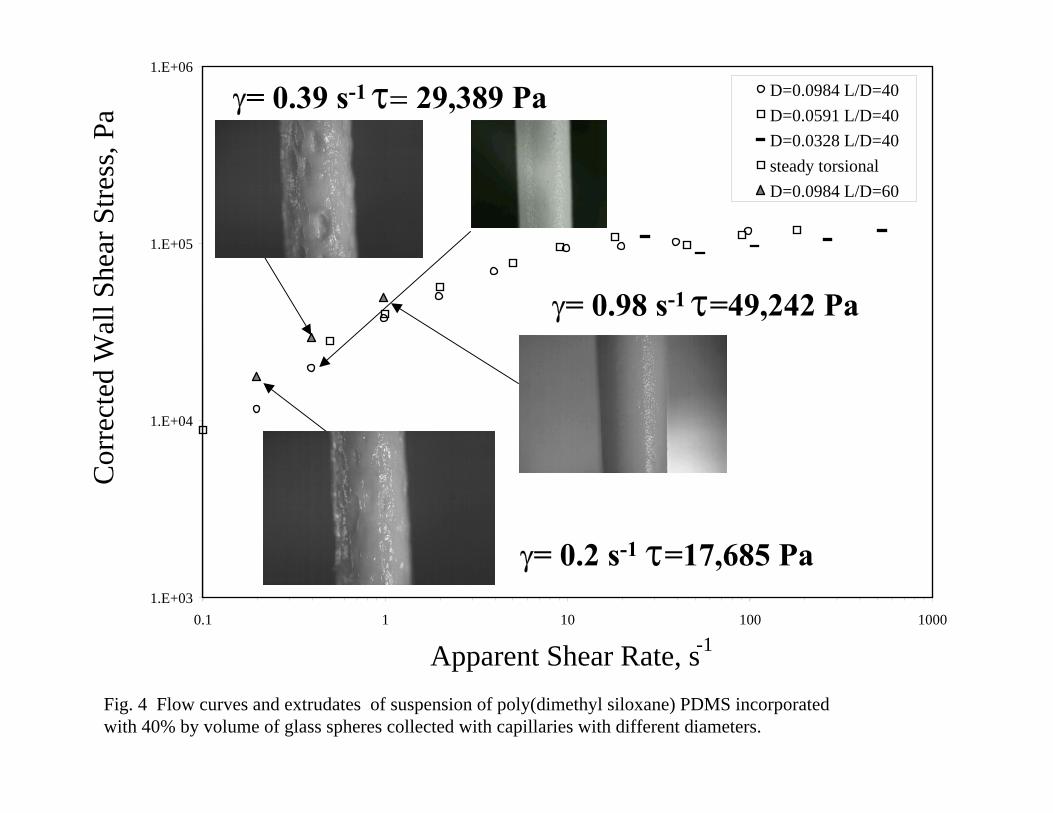
The capillary flow curve s for the 40% glass filled PDMS and the extrudates emerging
from the capillary under various conditions are shown in Figure 4. The extrudates
shown in the inserts were collected using four capillary dies with a constant length
over diameter ratio of 40 and with diameters of 0.0328” (.83 mm), 0.059” (1.5 mm),
0.0984” (2.5 mm) and 0.1378” (3.5 mm) and a length over diameter ratio of 60 at a
diameter of 2.5 mm. The wall shear stress values were Bagley corrected by using a
series of capillaries with systematically varied length over diameter ratios of 1, 20 and
40 (or 60). The surface to volume dependence of the flow curves of 40% glass filled
PDMS are clearly seen, i.e., with increasing surface to volume ratio (decreasing
diameter of the capillary die) the wall shear stress decreases at constant apparent
shear rate suggesting wall slip. Over a broad range of shear rates the extrudates of the
40% glass filled PDMS are smooth and completely free of any type of surface
irregularities. However, at relatively very small shear rates in the range of 0.5 1/s and
less, and for the capillary with the length over the diameter ratio of 60, the surfaces of
the extrudates become distorted. It is interesting to note that the wall shear stress
values at which this surface irregularities are observed are smaller than the critical
wall shear stress value of the suspension at which strong wall slip is onset in steady
torsional flow (0.035 MPa).
The comparisons of Figs. 2 and 4 suggest that the surfaces of unfilled PDMS are free
of distortions in the low shear rate range but become distorted at shear stresses which
are generally above 0.07 MPa with some relatively minor surface roughnesses setting
in over a transition region (0.04 MPa to 0.07 MPa). On the other hand, for the 40%
filled PDMS the extrudates are free of surface and bulk irregularities over a broad
range of shear rates and shear stresses but distortions set in at wall shear stress values,
which are smaller than about 0.035 MPa. Thus, the flow instability behavior is
reversed between the unfilled and filled PDMS.
The purpose of the paper is to present a mathematical model of the flow in a capillary die
(Figure 5) and apply it to the extrusion of unfilled PDMS and 40% PDMS. The two fluids
are considered to be compressible. The flow is isothermal, time-dependent and subject
to wall slip with strong slip onset at the critical shear stress. The objective was to
determine if the consideration of the compressibility and the wall slip behavior of the
PDMS melt and its suspension are sufficient to predict the conditions under which flow
instabilities for PDMS and its suspensions are onset. Consistent with the earlier literature
on the subject [Hatzikiriakos and Dealy (1992a); Georgiou, (2003)] the viscoelasticity
of the melt and the suspension is ignored (this would have introduced various types of
numerical instabilities which would not have allowed us to probe the effects of
compressibility and wall slip alone) and the fluids are considered to behave as
generalized Newtonian fluids flowing under lubrication flow conditions.
III. Simulation of the Time-dependent Flow Field
Mathematical models
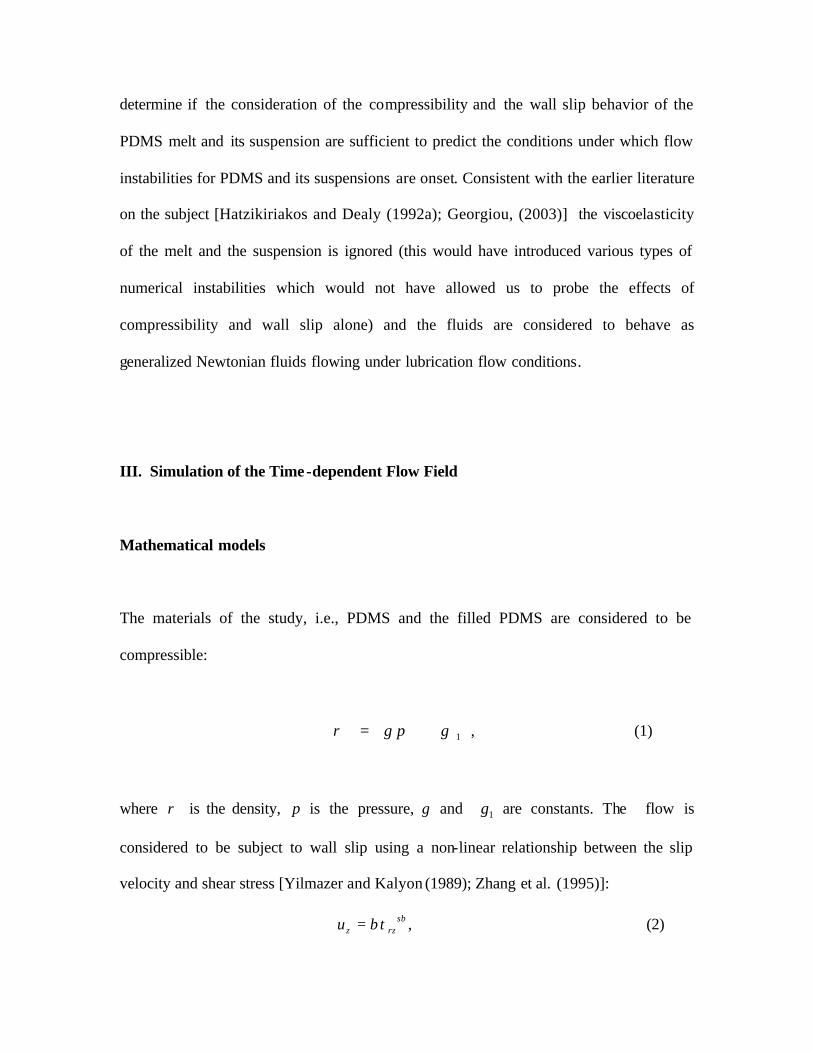
The materials of the study, i.e., PDMS and the filled PDMS are considered to be
compressible:
1γγρ += p , (1)
where ρ is the density, p is the pressure, γ and 1γ are constants. The flow is
considered to be subject to wall slip using a non-linear relationship between the slip
velocity and shear stress [Yilmazer and Kalyon (1989); Zhang et al. (1995)]:
sbrzzu βτ= , (2)

which is further modified to include the concept of a critical wall shear stress above
which strong wall slip is observed:
( )( ))aw(tanh1sbwsu τ−τα+βτ= . (3)
Here, su is the slip velocity, wτ is the wall shear stress, aτ is the critical wall shear stress
at which strong slip occurs, β is the Navier’s slip coefficient, sb is an empirical constant,
and α is a positive constant. When wτ < aτ , the slip velocity is assumed to be negligible,
while for wτ > aτ , wall slip becomes significant.
The assumptions of the analysis were: 1) the flow is axis-symmetrical, 2) pressure
changes only in the axial, z-direction, 3) the convection term and temperature effects
from the continuity and momentum equations are ignored, 4) only the straight land
section of the tube die is considered and thus the converging section of the capillary die is
ignored. With these assumptions the equations of continuity and momentum become:
01 =
+
∂∂
+∂∂
Vpzt
pγγ
,
(4)
01
)(2
11
=∂∂
++
++
∂∂
zp
pRptV w
γγγγτ
,
where V is the cross section averaged velocity and t is time.
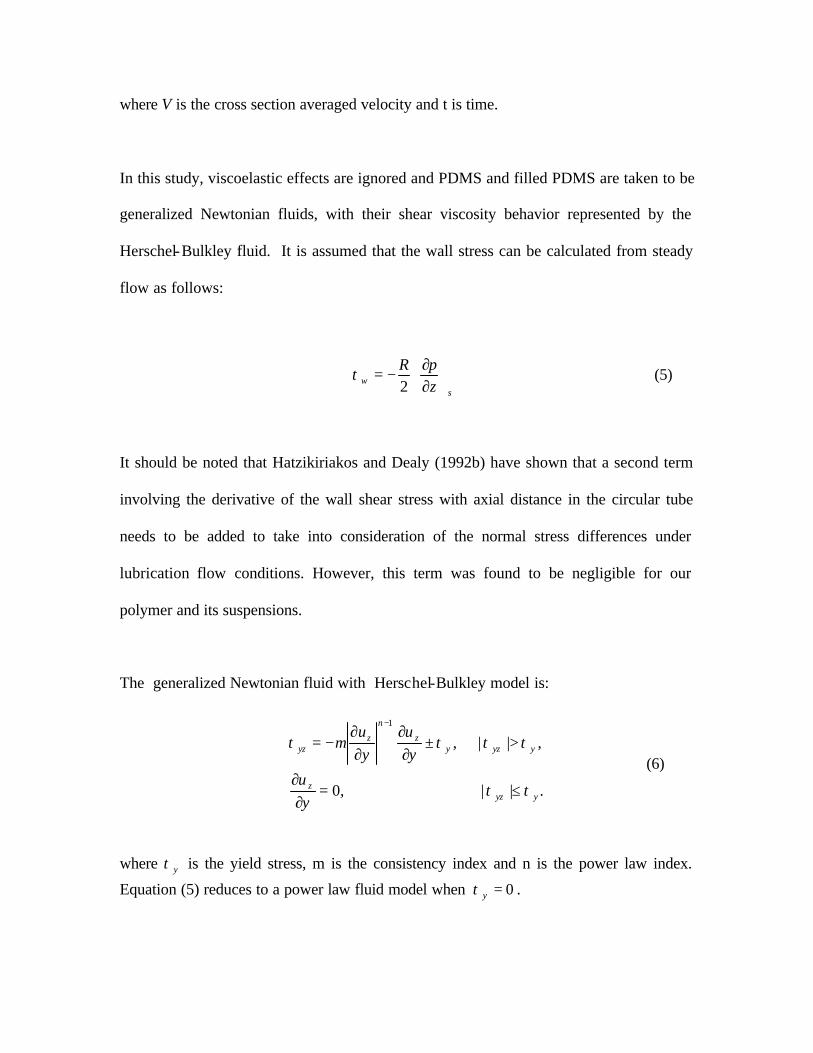
In this study, viscoelastic effects are ignored and PDMS and filled PDMS are taken to be
generalized Newtonian fluids, with their shear viscosity behavior represented by the
Herschel-Bulkley fluid. It is assumed that the wall stress can be calculated from steady
flow as follows:
s
w zpR
∂∂
−=2
τ (5)
It should be noted that Hatzikiriakos and Dealy (1992b) have shown that a second term
involving the derivative of the wall shear stress with axial distance in the circular tube
needs to be added to take into consideration of the normal stress differences under
lubrication flow conditions. However, this term was found to be negligible for our
polymer and its suspensions.
The generalized Newtonian fluid with Herschel-Bulkley model is:
≤=∂
∂
>±∂
∂∂
∂−=
−
.||,0
,||,1
yyzz
yyzyz
n
zyz
yu
yu
yu
m
ττ
ττττ (6)
where yτ is the yield stress, m is the consistency index and n is the power law index.
Equation (5) reduces to a power law fluid model when 0=yτ .

Under steady state flow conditions the solution for the mean velocity, V,
τ≤
∂∂
τ−
∂∂−α+
−β
τ>
∂∂
τ−
∂∂
−α+
∂∂
−β+
−
∂∂−
+
∂∂−τ−
+
τ+
−
∂∂
−+
∂∂
−τ−++
−
−
∂∂
−+
∂∂
−τ−++
τ−
=
.ysz
p2R,a
szp
2Rtanh11
sb
sdzdp
2R
,ysz
p2R
,asz
p2R
tanh11sb
szp
2R
1
szp
n/11
szp
2R
y)n/11(n/1m
y16
3sz
pn/13
szp
2R
y)n/12)(n/11(n/1m2R
16
3
szp
n/12
szp
2R
y)n/13)(n/11(n/1m2R
y16
V
(7)
The boundary conditions for the flow are given as the following at the entry and exit
planes of the tube:
0,0 == zVV .
(8)
Lzpp a == , ,
and the initial condition is set as a pseudo-steady flow. In summary, the flow problem in
this study is formulated as Equations. 3-8.
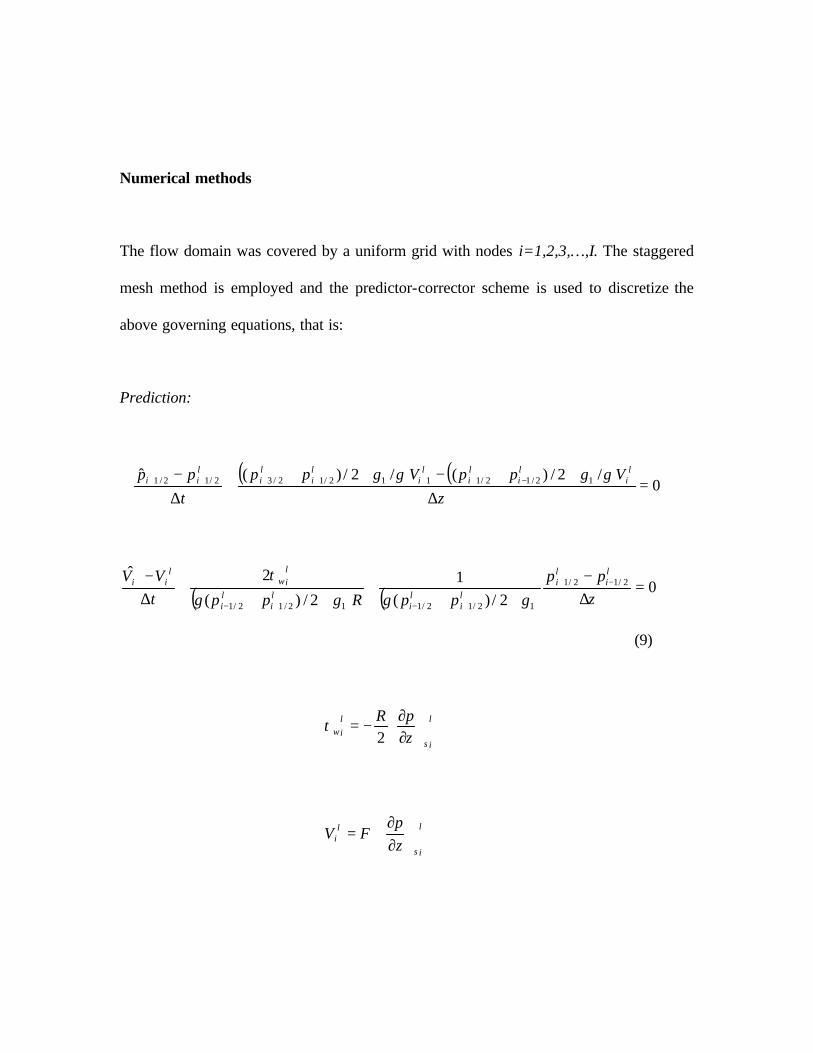
Numerical methods
The flow domain was covered by a uniform grid with nodes i=1,2,3,…,I. The staggered
mesh method is employed and the predictor-corrector scheme is used to discretize the
above governing equations, that is:
Prediction:
( ) ( )
0/2/)(/2/)(ˆ 12/12/1112/12/32/12/1 =
∆++−++
+∆− −++++++
zVppVpp
tpp l
ili
li
li
li
li
lii γγγγ
( ) ( ) 02/)(
12/)(
2ˆ2/12/1
12/12/112/12/1
=∆−
+++
+++
∆− −+
+−+− zpp
ppRpptVV l
ili
li
li
li
li
liw
lii
γγγγ
τ
(9)
l
is
liw z
pR
∂∂
−=2
τ
∂∂
= l
is
li z
pFV
where t∆ is the time step, z∆ is the grid spacing, l is the time step index, and F is the
function defined as the RHS of Eq. (7).
Correction:
( ) ( )
( ) ( )0
2
ˆ/2/)ˆˆ(ˆ/2/)ˆˆ2
/2/)(/2/)(
12/12/1112/12/3
12/12/1112/12/32/11
2/1
=∆
++−+++
∆++−++
+∆−
−++++
−+++++++
zVppVpp
zVppVpp
tpp
iiiiii
li
li
li
li
li
li
li
li
γγγγ
γγγγ
( ) ( )
( ) ( ) 0ˆˆ
2/)ˆˆ(1
2/)(1
/2/)ˆˆˆ2
/2/)ˆˆ2
2/12/1
12/12/1
2/12/1
12/12/1
12/12/312/12/3
1
=∆−
+++
∆−
+++
+++
+++
∆−
−+
+−
−+
+−
++++
+
zpp
ppzpp
pp
RppRpptVV
ii
ii
li
li
li
li
ii
iw
ii
liw
li
li
γγγγ
γγτ
γγτ
(10)
is
iw zpR
∂∂
−=ˆ
2τ̂
∂∂
=is
i zp
FVˆˆ
In the above, the 4th equation in both prediction and correction steps is solved by Newton
method. Moreover, pressure at the entry plane and velocity at the exit plane are obtained

by extrapolation. The computer code was validated using analytical solutions related to
steady-state solutions of the above equations for which we could obtain analytical
solutions.
Numerical Solutions
The critical wall shear stress aτ for 40% and unfilled PDMS are 35000 and 70,000 Pa,
respectively [Kalyon and Gevgilili (2003); Kalyon et al. (2003)]. Pressure-volume-
temperature, P-V-T, experiments were used to determine the compressibility coefficients
for the PDMS and 40% by volume glass- filled PDMS. It was determined that
26106.1 −− ⋅×= smγ and 31 4.1073 −⋅= mkgγ for 40% PDMS and 26104.1 −− ⋅×= smγ and
31 0.958 −⋅= mkgγ for PDMS.
a) Suspension of PDMS incorporated with 40% by volume glass spheres
Using a set of capillary flow experimental data at large shear rates, the parameters of 40%
PDMS were determined using the inverse problem solution methodologies [Tang and
Kalyon (2004)]: 16.087600 sPam ⋅= , 0.16=n , Pay 58800=τ , 17.2Pa1sm13-101 ⋅−⋅×=β ,
and 17.2=sb . In the low shear rate range (less than 5 s-1) a second set of parameters
were found to be applicable [Tang and Kalyon (2004)]: 5.050000 sPam ⋅= , 0.5=n ,
Pay 403=τ , 17.2Pa1sm14-1005.10−⋅−⋅×=β , 0=κ , and 17.2=sb .
Figure 6 shows a typical solution for the suspension of PDMS with 40% glass for
pressure, velocity, slip velocity, shear stress under the conditions of 2R=0.0015m,
L/2R=40, V0=0.01m/s. In the figure, triangles represent slip velocity. The figure also
presents the time history of pressure at the entrance and of velocity at the exit. The
simulation results indicate that the solution only has a very short transient state and then
the solution becomes steady. It is seen that the flow is actually a plug flow, that is V=us,
where V is the average velocity and us is the slip velocity. Over the length of the entire
tube wall shear stress increases in the axial z-direction. The wall shear stress is always
greater than the critical wall shear stress at which the transition between the stick and slip
conditions occurs.
The time-dependent simulations of the flow field for all of the conditions pertaining to
the flow curve given in Figure 4 were carried out. Over a broad range of conditions the
typical behavior observed in Figure 6, summarized as fast conversion of the flow
condition into a steady state, and development of a steady slip velocity at the wall and the
wall shear stress values always greater than the critical wall shear stress at which the
transition from stick to the slip condition occurs was observed. The predicted mean
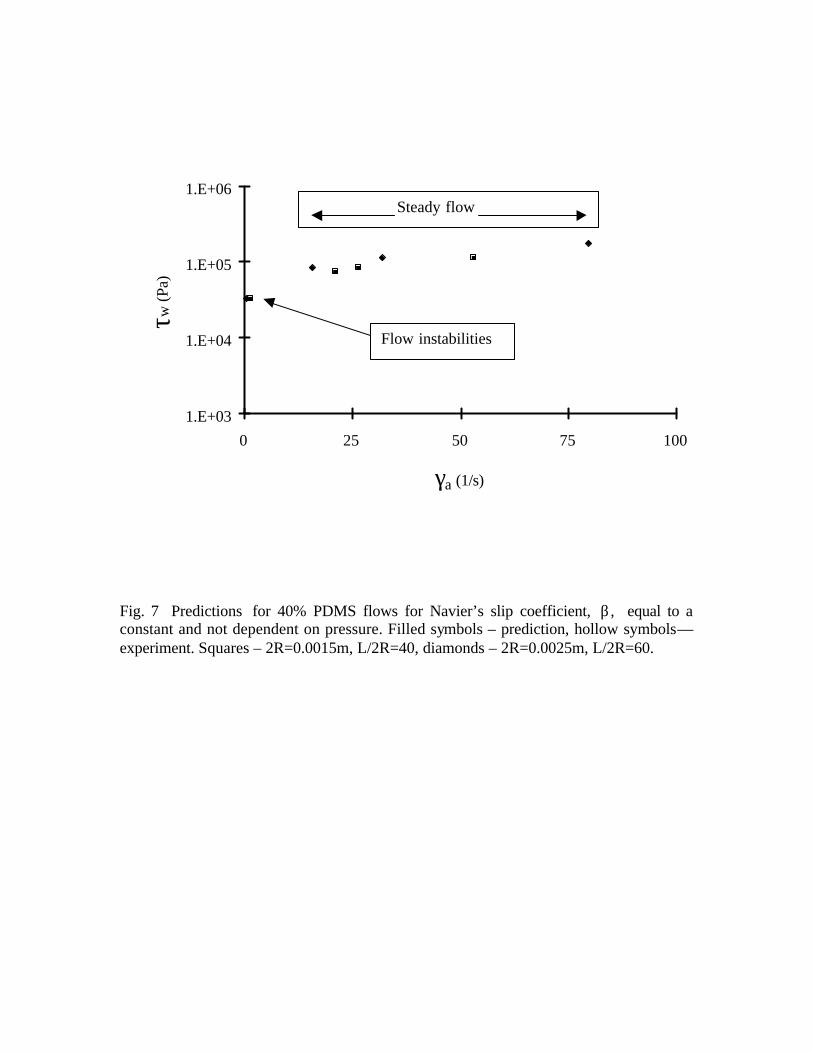
values of the wall shear stress versus the apparent shear rate values are shown in Figure 7.
Over a broad range of conditions, except at the lowest shear rates, the simulation suggests
that the flow would occur under steady state conditions as indeed observed in the
corresponding experiments (no pressure fluctuations and the extrudate surfaces were
smooth, i.e., Figure 4). For the lowest shear rates considered such as around 2 s-1 the
flow was predicted to be unsteady. This is an important finding and suggests that the
onset of flow instabilities is predicted for suspensions of PDMS at wall shear stress
values which are less than the critical wall shear stress at which strong wall slip is onset.
This is indeed the experimental behavior shown in Figure 4.
In the relatively high shear rate range the wall shear stress is greater than the critical shear
stress with no crossing-over the critical shear stress. However, in the low shear rate
range the wall shear stress values are in the neighborhood of the critical wall shear stress
values and the simulations reveal cross-over from below to above the value of the critical
shear stress over the length of the die.
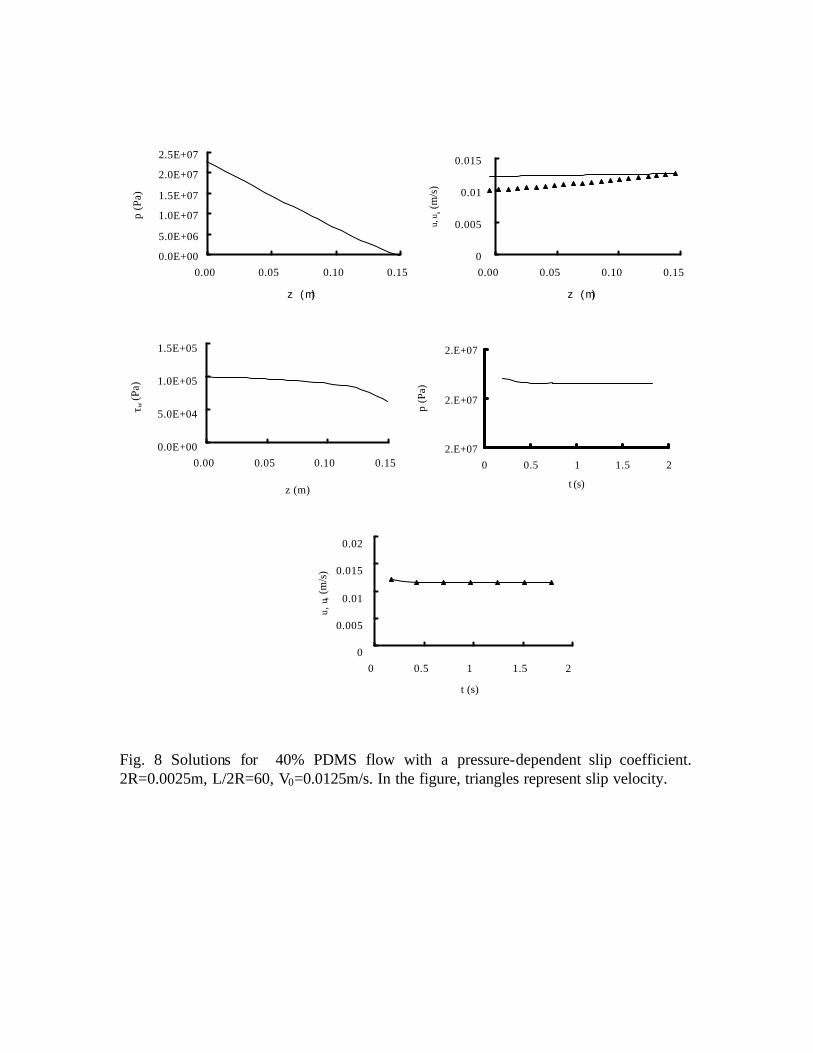
What happens if the Navier’s slip coefficient is assumed to be pressure dependent? A
second set of simulations for the PDMS with 40% by volume glass were carried out using
the following dependence of the Navier’s slip coefficient on pressure
κββ )/(0 ppa= (11)
and parameters 15.047600 sPam ⋅= , 0.15=n , Pay 40000=τ , 17.2Pa1sm13-105.30
−⋅−⋅×=β , 3.0=κ , and 17.2=sb .
The results shown in Figure 8 are obtained for 2R=0.0025m, L/2R=60, V0=0.0125m/s. In
the figures, triangles represent slip velocity. The mean velocity values are represented by
the continuous curves. Steady state is again achieved very fast (Fig 8). The slip velocity
values are relatively large. Under such steady state conditions the time-dependent and
steady values of the wall shear stress at various locations in the cylindrical tube are all
greater than the critical wall shear stress at which the transition from the stick to the slip
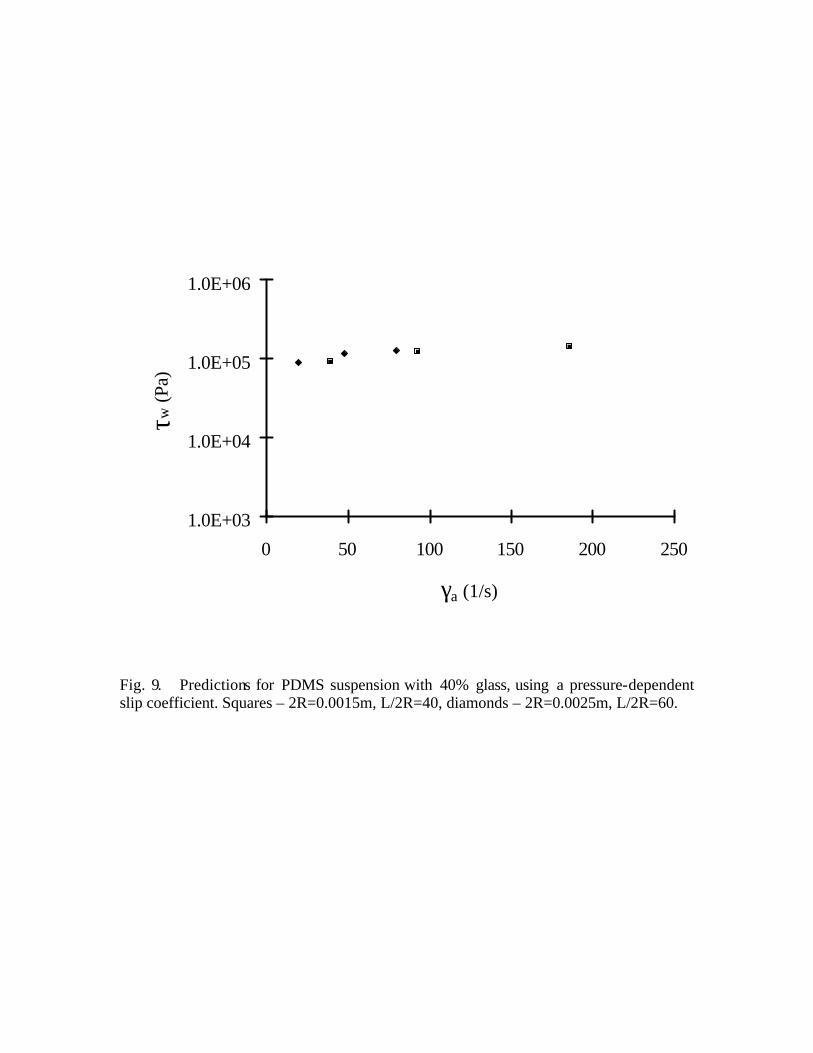
condition occurs. The mean values of the wall shear stress under steady state conditions
over the entire set of conditions of the experiments and the corresponding experimental
values are shown in Figure 9. The predictions and the experiments agree that over a large
range of shear rates (apparent shear rates are larger than 10), there are no fluctuations in
pressure and the extrudates are smooth and free of any type of surface irregularities,
suggesting that the flow over the entire range of shear rates occurred free of flow
instabilities. Overall, the differences between the predictions of the simulations that use
the constant or the pressure-dependent Navier’s slip coefficient are not significant. The
low shear rate region was not probed in these simulations akin to those conditions used to
generate the results given in Figure 7.
.
b) Solutions for unfilled PDMS
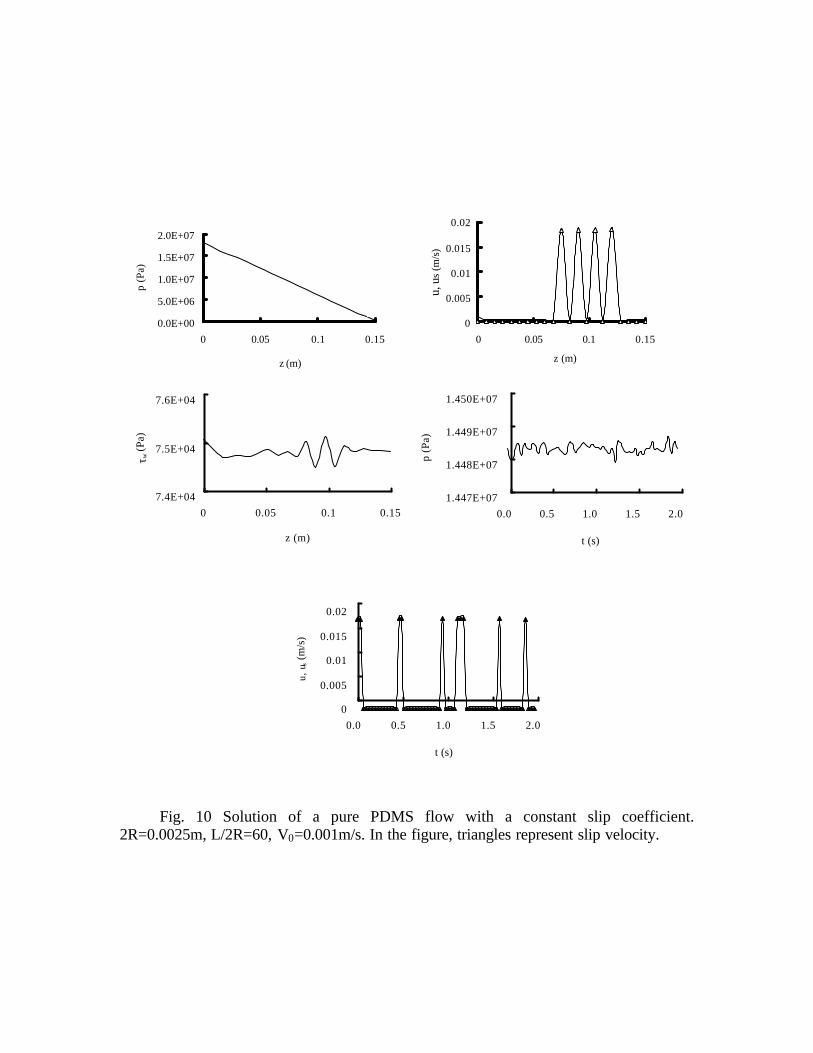
The typical results of time-dependent solutions of the Poiseuille flow for PDMS obtained
for a constant Navier’s slip coefficient are shown in Figure 10. In the figure, at shear rates
greater than 5 s-1, the parameters collected from the experiments with the higher shear
rates were used: 15.027000 sPam ⋅= , 0.15=n , Pay 40000=τ ,
26.2Pa1sm11-109.0 −⋅−⋅×=β , 26.2=sb . For shear rates lower than 5 s-1, parameters
collected from the experiments with the lower shears were used: [Tang and Kalyon
(2004)]: 39.017200 sPam ⋅= , 0.39=n , Pay 0=τ , 26.2Pa1sm15-1015.40−⋅−⋅×=β ,
0=κ , and 26.2=sb . The diameter of the tube, the length over the diameter ratio and the
initial mean velocity were 2R=0.0025m, L/2R=60, V0=0.001m/s, respectively. In the
figure, triangles represent slip velocity. The pressure exhibits time-dependence and the
values of the mean velocity, wall shear stress and the slip velocity at the wall all exhibit
time-dependence, which are not damped. The periodicity observed here is typical and
persists indefinitely with no steady state solution reached under shear rates, which are
greater than 5 s-1.

It is interesting to note that the wall shear stress distribution collected at a value of 100 s
upon the inception of the shear flow from the rest state suggests that the critical wall
shear stress at which the transition from the stick condition to wall slip occurs is crossed
multiple times. The transition from the stick to the slip condition appears to generate the
time dependence of the pressure, and location-dependent values of the mean velocity and
the slip velocity. The predicted periodicity shown in Figure 10 suggests that the flow
would not become steady and would exhibit fluctuations in the pressure necessary to
drive the flow on one hand and distortions in the extrudates caused by the time dependent
changes in the flow boundary condition at the wall and the location specific va lues of the
mean flow velocity.
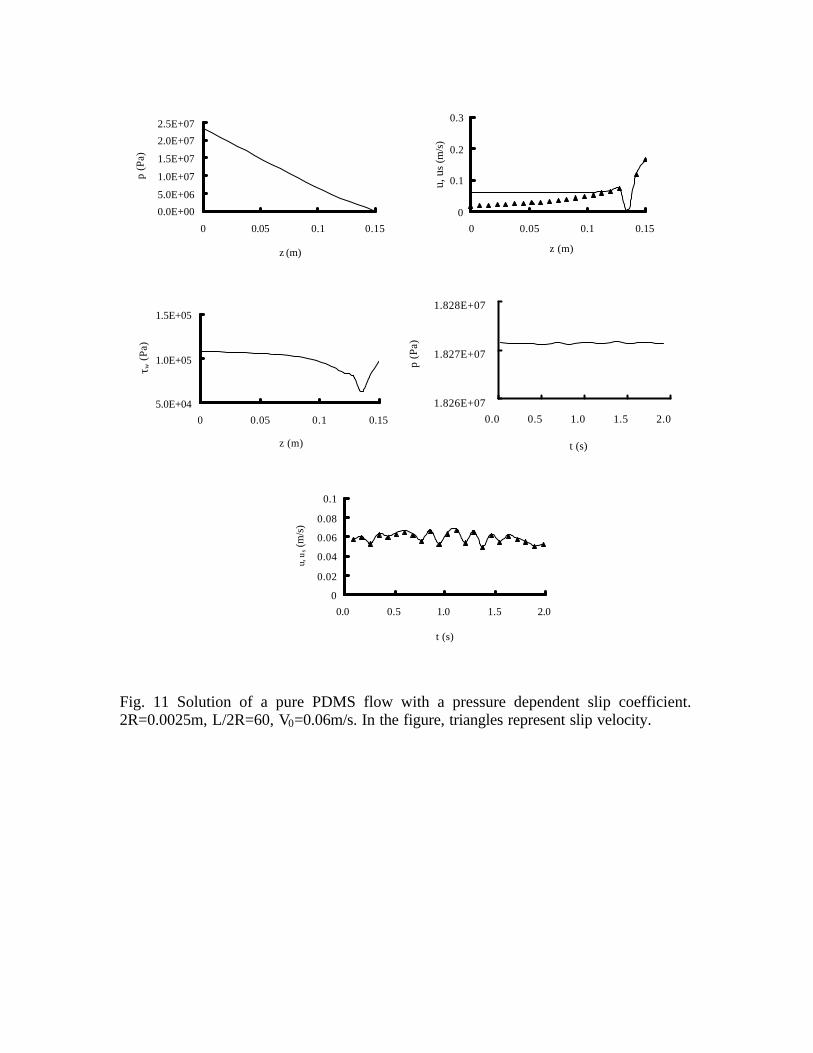
Does the nature of the flow change if the Navier’s slip coefficient is taken to be
dependent on the pressure? A new set of solutions was obtained with the following
parameters for unfilled PDMS and are shown in Figure 11. 15.027000 sPam ⋅= , 0.15=n ,
Pay 35000=τ , 26.2Pa1sm11-109.00−⋅−⋅×=β , 1=κ , and sb=2.26. Figure 11 again
indicates that the wall shear stress oscillates around the critical stress. It also shows that
slip-stick prevails and governs the flow behavior, such as sometimes the slip velocity
approaches zero, and sometimes it approaches the cross-section averaged mean velocity,
thus oscillating between the no slip to unfilled slip (plug flow) conditions.
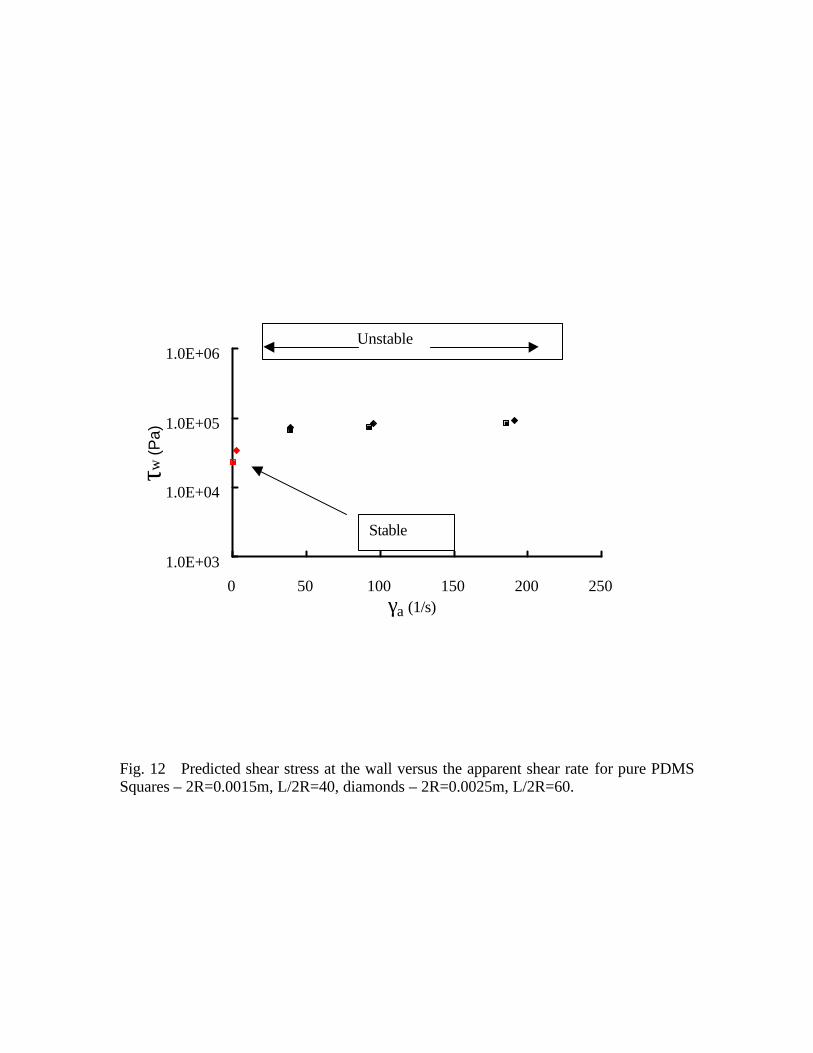
The simulations were carried out over a broad range of apparent shear rates, i.e., 2-200 s-1.
The time-dependence of the velocities and the pressure prevailed over almost this entire
range of apparent shear rates, except in the lowest shear rate range of less than 5 s-1. The
time-averaged values of the predicted wall shear stress values are shown in Figure 12. It
should be noted again that all of the wall shear stress values shown in Figure 12 for
which flow instabilities were predicted are very close to the critical wall shear stress at
which the transition from the stick to the slip condition occurs. Thus, for this entire range
of apparent shear rates the critical value of the shear stress is encountered at some
location at the surface of the die and initiates the flow instability mechanism to give rise
to the observed surface irregularities shown in Figure 2. However, at the lowest shear
rate considered, i.e., around apparent shear rate of 2 s-1 and less, steady solutions were
observed (Figure 12). Under these conditions the wall shear stress values are significantly
lower than the critical wall shear stress at which strong wall slip is onset in steady
torsional flow.
IV. Concluding remarks
A time-dependent solution of the capillary flow of compressible generalized Newtonian
fluids subject to wall slip is presented. The model shows that the critical shear stress, at
which apparent slip occurs, plays an important role to determine if the capillary flow is
steady or unsteady. The numerical findings agree with the experimental findings for the
capillary flow of the two materials of our study, i.e., PDMS and filled PDMS.
Overall, these results appear to confirm our earlier hypothesis (Kalyon et al. (2003) that
the stability of the wall boundary condition during flow is very important. The critical
wall shear stress at which strong wall slip occurs acts as a boundary. If the flow
conditions generate wall shear stress values which are in the neighborhood of this critical
wall shear stress than transitions from the steady to unsteady or from unsteady to steady
flow occurs. It is also interesting to note that for the filled PDMS a stable wall slip
condition (with wall shear stress values significantly greater than the critical shear stress)
prevails over the bulk of the flow curve and the flow in this region is steady. Only when
the apparent shear rate is sufficiently reduced so that the corresponding wall shear stress
values approach the critical wall shear stress then flow instabilities are onset.
For the unfilled PDMS bulk of the flow curve involves wall shear stress values, which
are in the neighborhood of the critical wall shear stress, and the flow over this broad
range of shear rates is unsteady. The resulting wall slip condition is not stable with non-
periodic excursions between the slip and stick conditions. The decrease of the shear rate
to lower than 2 s-1 for unfilled PDMS gives rise to wall shear stress values that are
significantly lower than the critical shear stress and the resulting stable stick condition
generates stable flow.
Acknowledgements
The authors are grateful to Ms Birinci of Stevens Institute of Technology for
generating the experimental data and to Dr. Gevgilili for his input and suggestions.

References
Aral, B., Kalyon, D. M. (1994) Effects of temperature and surface roughness on time-dependent wall slip in steady torsional flow of concentrated suspensions. J. Rheol., 38, 957-972. Aral, B, Kalyon, D. M. (1995) Rheology and Extrudability of Very Concentrated Suspensions: Effects of Vacuum Imposition. Plast. and Rubber Comp. Proc. and Applications, 24, 201-210. Benbow, J. J. and P. Lamb, “New aspects of melt fracture,” SPE Transactions 3, 7-17 (1963). Denn M. M. (2001) Extrusion instabilities and wall slip, Annu. Rev. Fluid Mech., 33, 265-287 Donlder C. F. J. den, Koopmans, R. J., Molenaar, J (1998) Quantitative modeling of HDPE spurt experiments using wall slip and generalized Newtonian flow, J. Non-Newtonain Fluid Mech., 79, 503-514 Gevgilili, H. and Kalyon D. M. (2001) Step strain flow: wall slip effects and other error sources. J. Rheol. 45, 1-9. Georgiou, G. C. (2003) The time-dependent, compressible Posiseuille and extrusion-swell flows of a Carreau fluid with slip at wall, J. Non-Newtonian Fluid Mech., 109, 93-114. Hatzikiriakos, S. G. and Dealy, J. M. (1992a) Role of slip and fracture in the oscillating flow of HDPE in a capillary. J. Rheol., 36, 845-884 Hatzikiriakos, S. G. and Dealy, J. M. (1992b) Wall slip of molten high density polyethylenes.II. Capillary rheometer studies, J. Rheol., 36, 4, 703-741. Kalyon, DS. M., Yaras, P., Aral, B., Yilmazer, U. (1993) Rheological behavior of a concentrated suspension: A solid rocket fuel simulant, J. Rheo., 37, 35-53 Kalyon, D., H. Gokturk, P. Yaras, Aral B. (1995) Motion Analysis of Development of Wall Slip During Die Flow of Concentrated Suspensions. Society of Plastics Engineers ANTEC Technical Papers, 41, 1130-1134. Kalyon, D. M., Gevgilili H. (2003) Wall slip and extrudate distortion of three polymer melts. J. Rheol., 47, 3, 683-699. Kalyon, D. M, Birinci, E. and Gevgilili, H.(2003) Development of extrudate distortions as affected by wall slip behavior of polymers and filled polymers.
Proceedings of Annual Meeting of American Institute of Chemical Engineers Annual Meeting. Lim, F. J., Schowalter, W. R. (1989) Wall slip of narrow molecular weight distribution polybutadienes, 33, 1360-1382 Ovaici, H., Mackley, M. R., McKinley, G. H., Crook, S. J. (1998) The experimental observation and modeling of an “Ovaici” necklace and stick-spurt instability arising during the cold extrusion of chocolate, J. Rheol., 42, 125-157 Petrie, C. J. S. and M. M. Denn, ”Instabilities in polymer processing,” AIChE J. 22, 209-236 (1976). Tang, H. S., Kalyon, D. M. (2004) Estimation of the parameters of Herschel-Bulkley fluid under wall slip using a combination of capillary and squeeze flow viscometers, Rheol. Acta 43, 80-88. Yilmazer, U., Kalyon, D. M. 1989 Slip effects in capillary and parallel disk torsional flows of highly filled suspensions. J. Rheol. 33, 1197-1212 Zhang, W., Silvi, N., Vlachopoulos J. (1995) Modeling and experiments of squeezing flow of polymer melts. Intern. Polymer processing, X, 155-164
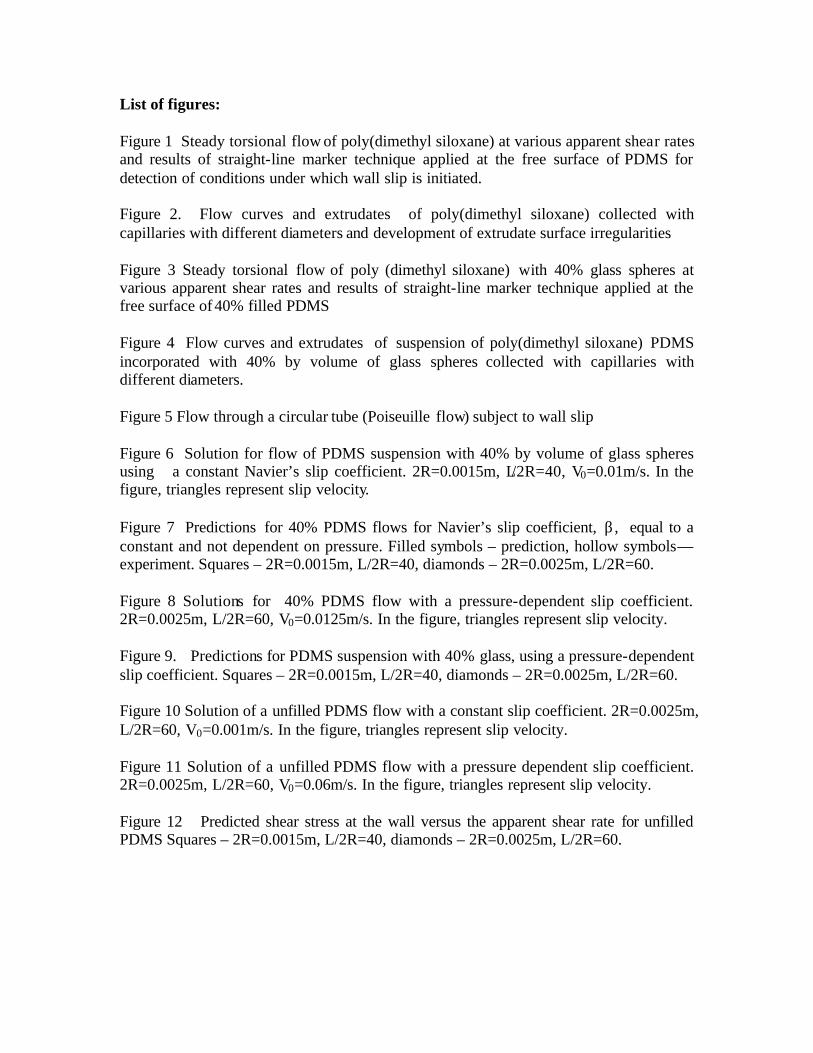
List of figures: Figure 1 Steady torsional flow of poly(dimethyl siloxane) at various apparent shear rates and results of straight-line marker technique applied at the free surface of PDMS for detection of conditions under which wall slip is initiated. Figure 2. Flow curves and extrudates of poly(dimethyl siloxane) collected with capillaries with different diameters and development of extrudate surface irregularities Figure 3 Steady torsional flow of poly (dimethyl siloxane) with 40% glass spheres at various apparent shear rates and results of straight-line marker technique applied at the free surface of 40% filled PDMS Figure 4 Flow curves and extrudates of suspension of poly(dimethyl siloxane) PDMS incorporated with 40% by volume of glass spheres collected with capillaries with different diameters. Figure 5 Flow through a circular tube (Poiseuille flow) subject to wall slip Figure 6 Solution for flow of PDMS suspension with 40% by volume of glass spheres using a constant Navier’s slip coefficient. 2R=0.0015m, L/2R=40, V0=0.01m/s. In the figure, triangles represent slip velocity. Figure 7 Predictions for 40% PDMS flows for Navier’s slip coefficient, β , equal to a constant and not dependent on pressure. Filled symbols – prediction, hollow symbols—experiment. Squares – 2R=0.0015m, L/2R=40, diamonds – 2R=0.0025m, L/2R=60. Figure 8 Solutions for 40% PDMS flow with a pressure-dependent slip coefficient. 2R=0.0025m, L/2R=60, V0=0.0125m/s. In the figure, triangles represent slip velocity. Figure 9. Predictions for PDMS suspension with 40% glass, using a pressure-dependent slip coefficient. Squares – 2R=0.0015m, L/2R=40, diamonds – 2R=0.0025m, L/2R=60. Figure 10 Solution of a unfilled PDMS flow with a constant slip coefficient. 2R=0.0025m, L/2R=60, V0=0.001m/s. In the figure, triangles represent slip velocity. Figure 11 Solution of a unfilled PDMS flow with a pressure dependent slip coefficient. 2R=0.0025m, L/2R=60, V0=0.06m/s. In the figure, triangles represent slip velocity. Figure 12 Predicted shear stress at the wall versus the apparent shear rate for unfilled PDMS Squares – 2R=0.0015m, L/2R=40, diamonds – 2R=0.0025m, L/2R=60.
10
100
1000
10000
100000
0.01 0.1 1 10
Time, s
Shea
r St
ress
, P
a
γׂ=2 s-1γׂ=5 s-1γׂ=10 s-1
γׂ=40 s-1
γׂ=20 s-1γׂ=30 s-1
γׂ=40 s-1, t=0.15s, γ=6
γׂ=2 s-1, t=3.5 s, γ=7
t=0 s, γ=0
γׂ=1 s-1
γׂ=0.1 s-1
Fig. 1 Steady torsional flow of poly(dimethyl siloxane) at various apparent shear rates and results of straight-line marker technique applied at the free surface of PDMS for detection of conditions under which wall slip is initiated.
1.E+03
1.E+04
1.E+05
1.E+06
0 1 10 100 1000 10000 100000
Apparent Shear Rate, s-1
Cor
rect
ed W
all
Shea
r Stre
ss, P
a
D=0.0984 L/D=40
D=0.0591 L/D=40
D=0.0328 L/D=40
Fig. 2. Flow curves and extrudates of poly(dimethyl siloxane) collected with capillarieswith different diameters and development of extrudate surface irregularities
1.E+01
1.E+02
1.E+03
1.E+04
1.E+05
0.01 0.1 1 10 100
Time, s
Shea
r Stre
ss, P
a
γ= 2 s-1γ= 0.1 s-1
Fig. 3 Steady torsional flow of poly (dimethyl siloxane) with 40% glass spheres at various apparent shear rates and results of straight-line marker technique applied at the free surface of 40% filled PDMS
γ= 5 s-1
γ= 1 s-1
1.E+03
1.E+04
1.E+05
1.E+06
0.1 1 10 100 1000
Apparent Shear Rate, s-1
Cor
rect
ed W
all S
hear
Stre
ss, P
aD=0.0984 L/D=40D=0.0591 L/D=40D=0.0328 L/D=40steady torsional D=0.0984 L/D=60
γ= 0.2 s-1 τ=17,685 Pa
γ= 0.39 s-1 τ= 29,389 Pa
γ= 0.98 s-1 τ=49,242 Pa
d=0.072”d=0.07”
Fig. 4 Flow curves and extrudates of suspension of poly(dimethyl siloxane) PDMS incorporated with 40% by volume of glass spheres collected with capillaries with different diameters.

r Us R z=o z L Fig. 5 Flow through a circular tube (Poiseuille flow) subject to wall slip

0.0E+00
4.0E+06
8.0E+06
1.2E+07
1.6E+07
0.00 0.02 0.04 0.06
z (m)
p (P
a)
0
0.005
0.01
0.015
0.00 0.02 0.04 0.06
z (m)
u, u
s (m
/s)
8.50E+04
8.75E+04
9.00E+04
0.00 0.02 0.04 0.06
z (m)
τ w (
Pa)
0.E+00
1.E+07
2.E+07
3.E+07
0 0.5 1 1.5 2
t (s)
p (P
a)
0
0.02
0.04
0.06
0.08
0 0.5 1 1.5 2
t (s)
u, u
s (m
/s)
Fig. 6 Solution for flow of PDMS suspension with 40% by volume of glass spheres using a constant Navier’s slip coefficient. 2R=0.0015m, L/2R=40, V0=0.01m/s. In the figure, triangles represent slip velocity.
1.E+03
1.E+04
1.E+05
1.E+06
0 25 50 75 100
γa (1/s)
τw (P
a)
Fig. 7 Predictions for 40% PDMS flows for Navier’s slip coefficient, β , equal to a constant and not dependent on pressure. Filled symbols – prediction, hollow symbols—experiment. Squares – 2R=0.0015m, L/2R=40, diamonds – 2R=0.0025m, L/2R=60.
Flow instabilities
Steady flow
0.0E+00
5.0E+06
1.0E+07
1.5E+07
2.0E+07
2.5E+07
0.00 0.05 0.10 0.15
z (m)
p (P
a)
0
0.005
0.01
0.015
0.00 0.05 0.10 0.15
z (m)
u, u
s (m
/s)
0.0E+00
5.0E+04
1.0E+05
1.5E+05
0.00 0.05 0.10 0.15
z (m)
τ w (
Pa)
2.E+07
2.E+07
2.E+07
0 0.5 1 1.5 2
t (s)
p (P
a)
0
0.005
0.01
0.015
0.02
0 0.5 1 1.5 2
t (s)
u, u
s (m
/s)
Fig. 8 Solutions for 40% PDMS flow with a pressure-dependent slip coefficient. 2R=0.0025m, L/2R=60, V0=0.0125m/s. In the figure, triangles represent slip velocity.
1.0E+03
1.0E+04
1.0E+05
1.0E+06
0 50 100 150 200 250
γa (1/s)
τw (P
a)
Fig. 9. Predictions for PDMS suspension with 40% glass, using a pressure-dependent slip coefficient. Squares – 2R=0.0015m, L/2R=40, diamonds – 2R=0.0025m, L/2R=60.
0.0E+00
5.0E+06
1.0E+07
1.5E+07
2.0E+07
0 0.05 0.1 0.15
z (m)
p (P
a)
0
0.005
0.01
0.015
0.02
0 0.05 0.1 0.15
z (m)
u, u
s (m
/s)
7.4E+04
7.5E+04
7.6E+04
0 0.05 0.1 0.15
z (m)
τ w (
Pa)
1.447E+07
1.448E+07
1.449E+07
1.450E+07
0.0 0.5 1.0 1.5 2.0
t (s)
p (P
a)
0
0.005
0.01
0.015
0.02
0.0 0.5 1.0 1.5 2.0
t (s)
u, u
s (m
/s)
Fig. 10 Solution of a pure PDMS flow with a constant slip coefficient. 2R=0.0025m, L/2R=60, V0=0.001m/s. In the figure, triangles represent slip velocity.
0.0E+00
5.0E+06
1.0E+07
1.5E+07
2.0E+07
2.5E+07
0 0.05 0.1 0.15
z (m)
p (P
a)
0
0.1
0.2
0.3
0 0.05 0.1 0.15
z (m)
u, u
s (m
/s)
5.0E+04
1.0E+05
1.5E+05
0 0.05 0.1 0.15
z (m)
τ w (
Pa)
1.826E+07
1.827E+07
1.828E+07
0.0 0.5 1.0 1.5 2.0
t (s)
p (P
a)
0
0.02
0.04
0.06
0.08
0.1
0.0 0.5 1.0 1.5 2.0
t (s)
u, u
s (m
/s)
Fig. 11 Solution of a pure PDMS flow with a pressure dependent slip coefficient. 2R=0.0025m, L/2R=60, V0=0.06m/s. In the figure, triangles represent slip velocity.
1.0E+03
1.0E+04
1.0E+05
1.0E+06
0 50 100 150 200 250γa (1/s)
τw (P
a)
Fig. 12 Predicted shear stress at the wall versus the apparent shear rate for pure PDMS Squares – 2R=0.0015m, L/2R=40, diamonds – 2R=0.0025m, L/2R=60.
Unstable
Stable