Embed Size (px)
Citation preview
1
TIME-RESOLVED LASER SPECTROSCOPIC STUDIES OF RATE-LIMITING EVENTS IN PROTEIN FOLDING AND BINDING
By
RANJANI NARAYANAN
A DISSERTATION PRESENTED TO THE GRADUATE SCHOOL OF THE UNIVERSITY OF FLORIDA IN PARTIAL FULFILLMENT
OF THE REQUIREMENTS FOR THE DEGREE OF DOCTOR OF PHILOSOPHY
UNIVERSITY OF FLORIDA
2009

2
© 2009 Ranjani Narayanan

3
ACKNOWLEDGMENTS
Graduate study in a new country is both an exciting and occasionally terrifying prospect.
I am indebted to the Gator community for making my experience in this wonderful University a
memorable one.
I would first like to acknowledge my parents, Mrs. And Mr. Narayanan for constantly
encouraging me to aim high and achieve the best in all my endeavors. I also wish to thank my
brother Sudharsan Narayanan for doing his bit to cheer me up during trying times. During my
time as a graduate student, I met my husband, Balaji Krishnaprasad, whose constant support has
sustained me through the past two years.
Dr. Stephen Hagen my mentor, advisor and guide has instilled in me the zeal to achieve
perfection in research. He has been a patient teacher who has taught me to deal with problems
innovatively, communicate ideas effectively, and perform independent research efficiently.
I would also like to thank Dr. Arthur Edison, Dr. Adrian Roitberg, Dr. David Reitze, and
Dr. Sergei Obukhov for serving on my supervisory committee. I have benefited from their
suggestions and comments at various times. I consider myself fortunate to have had a very
talented committee to guide me.
I am grateful to the faculty and staff of Physics department at the University of Florida,
Gainesville. I am thankful to Marc Link, Edward Storch, Raymond Frommeyer, and Bill
Malphurs at the Machine Shop for providing me with parts of exceptional quality for my
research. I wish to thank the members of the Electronics Shop and Jay Horton for providing me
with technical support and suggestions at odd times of the day and week. The administrative
staffs have also been very helpful with the smooth management of paperwork and other
formalities.
4
I would like to thank my colleagues Pablo Perez, Suzette Pabit, and Omjoy Ganesh for
their companionship and useful suggestions (academic and otherwise). I have also benefited
from collaborative associations with Dr. Cherian Zachariah and other members of Dr. Edison’s
lab. I would like to thank Dr. Alfred Chung for providing me with peptides for my research.
Leslie Pelakh’s help in solvent viscosity measurements for my project on TZ2 is also kindly
acknowledged.
I am indebted to the University of Florida for opening the doors to a rich educational
experience. The staff at the International Center in particular Debra Anderson and Maud Fraser
have been almost maternal in their concern for all students including myself. My stint as a
graduate student also enabled me to befriend exceptional students and researchers from various
disciplines of study at the University of Florida. I shall forever cherish the camaraderie and
wonderful times spent in the company of my various Gator friends.
5
TABLE OF CONTENTS page
ACKNOWLEDGMENTS.................................................................................................................... 3
LIST OF FIGURES .............................................................................................................................. 8
ABSTRACT ........................................................................................................................................ 11
CHAPTER
1 INTRODUCTION....................................................................................................................... 13
Introduction ................................................................................................................................. 13 Protein Structure .......................................................................................................................... 13 Finding the Right Fold in Time .................................................................................................. 14 Rate Limit for Protein Folding ................................................................................................... 18
Diffusion Limits Rate of Protein Folding .......................................................................... 18 Polymer physics and diffusion-limited contact formation......................................... 18 Gaussian statistics and the dynamics of the unfolded protein ................................... 19 Comparison of dynamics of internal and external loops ........................................... 22
Solvent Friction Effects on Protein Folding ...................................................................... 23 Internal Friction ................................................................................................................... 25
Intrinsically Disordered Proteins ................................................................................................ 27 Definition of ‘Disorder’....................................................................................................... 28 Characteristics of Intrinsically Disordered Proteins .......................................................... 29 Functions of Intrinsically Disordered Proteins .................................................................. 30
Theoretical Studies of Coupled Folding and Binding............................................................... 31 Experiments on Coupled Folding and Binding in Natively Disordered Proteins ................... 32 Intrinsically Disordered Peptide IA3 and the Yeast Aspartic Proteinase A (YPrA) ............... 33
Intrinsically Disordered Peptide IA3 ........................................................................... 34 Yeast Aspartic Proteinase A (YPrA) .................................................................................. 35
Scope of This Dissertation .......................................................................................................... 36
2 EXPERIMENTAL STUDIES OF FAST FOLDING KINETICS ........................................... 38
Introduction ................................................................................................................................. 38 Probes of Conformational Change in Proteins .......................................................................... 40
Fluorescence and Triplet Absorption Spectroscopy .......................................................... 40 Collection of Fluorescence Spectra ............................................................................. 46
Circular Dichroism Spectroscopy ....................................................................................... 47 Collection of CD spectra.............................................................................................. 50
Tryptophan Photo-physics .......................................................................................................... 50 Tryptophan Fluorescence .................................................................................................... 51 Tryptophan Triplet Relaxation ............................................................................................ 52
Techniques Used to Study Protein Folding Kinetics ................................................................ 55 Mixing .................................................................................................................................. 55
6
Flash Photolysis ................................................................................................................... 55 Excitation System: ....................................................................................................... 57 Probe System ................................................................................................................ 57 Sample Preparation ...................................................................................................... 58 Spectral Data Acquisition ............................................................................................ 59 Data Analysis................................................................................................................ 60
Temperature- jump Spectroscopy ....................................................................................... 60 Temperature-jump Apparatus ..................................................................................................... 62
Infrared (IR) Excitation ....................................................................................................... 62 Ultra-violet (UV) Probe: ..................................................................................................... 63 Fiber and Sample Block ...................................................................................................... 65 Sample Handling: ................................................................................................................ 66 Sample Preparation: ............................................................................................................. 66 Temperature-jump Calibration............................................................................................ 67 Kinetic Data Acquisition: .................................................................................................... 68 Spectral Data Acquisition: .................................................................................................. 69
3 KINETICS OF FOLDING AND BINDING OF THE INTRINSICALLY DISORDERED PEPTIDE IA3 WITH YPRA ........................................................................... 71
Introduction ................................................................................................................................. 71 Results .......................................................................................................................................... 73
Peptide Characterization ..................................................................................................... 73 Equilibrium Fluorescence Studies ...................................................................................... 73 Characterization of IA3 Folding Behavior at Equilibrium ................................................ 75 Kinetics of IA3 Folding in the Presence of TFE ................................................................ 78 Kinetics of IA3 Folding and Binding to YPrA ................................................................... 81
Discussion .................................................................................................................................... 82 Alpha-helix Formation in Proteins ..................................................................................... 83 Scheme for IA3-YPrA Interaction ...................................................................................... 84 Origin of Fast ~ 90 ns Relaxation ....................................................................................... 85 Future Research ................................................................................................................... 86
Summary ...................................................................................................................................... 87
4 HETEROGENEOUS FOLDING KINETICS OF TRYPTOPHAN ZIPPER ......................... 89
Introduction ................................................................................................................................. 89 Heterogeneous Folding of TZ2: Background .................................................................... 91
Results .......................................................................................................................................... 94 Circular Dichroism Spectroscopy ....................................................................................... 94 Kinetics of TZ2 Relaxation after Temperature-jump ........................................................ 95
Discussion .................................................................................................................................. 100 Conclusions ............................................................................................................................... 102
5 CONTACT FORMATION IN POLYPEPTIDES .................................................................. 104
Introduction ............................................................................................................................... 104
7
Background: Experiments on Contact Formation ........................................................... 104 Rationale for our Experiments .......................................................................................... 105
Results ........................................................................................................................................ 106 Characterization of Tryptophan Photochemistry ............................................................. 107 Determination of Power Law Dependence for Tryptophan Triplet Relaxation ............ 108 Tryptophan Triplet Lifetimes and Oxygen Quenching ................................................... 110
Challenges and Bottlenecks ...................................................................................................... 111 Discussion .................................................................................................................................. 113 Conclusions ............................................................................................................................... 114
6 FUTURE DIRECTIONS AND CONCLUSIONS .................................................................. 116
APPENDIX: NUMERICAL METHODS ....................................................................................... 118
LIST OF REFERENCES ................................................................................................................. 122
BIOGRAPHICAL SKETCH ........................................................................................................... 137
8
LIST OF FIGURES
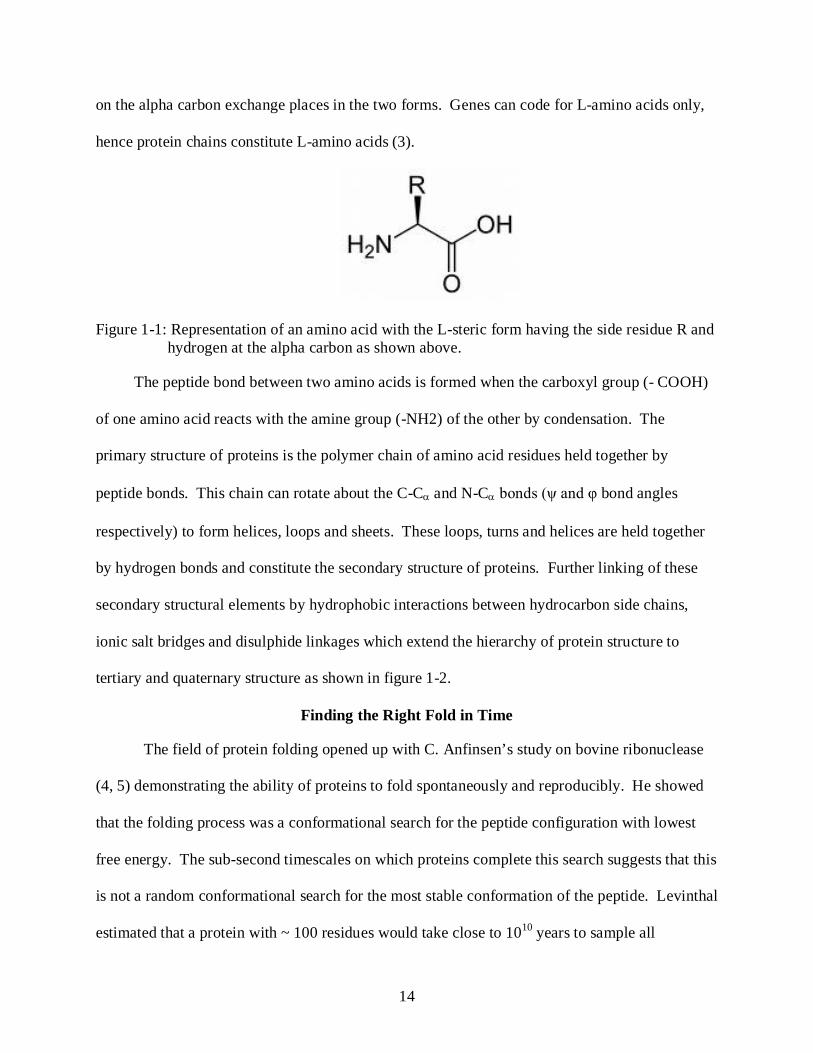
Figure page 1-1 Representation of an amino acid. .......................................................................................... 14
1.2 Representation of the hierarchical nature of protein structure. ......................................... 15
1-3 Representation of energy landscape of protein folding. ...................................................... 16
1-4 Fastest folding times for proteins .......................................................................................... 17
1-5 Internal loops and external loops .......................................................................................... 19
1-6 Statistical distribution of the conformations sampled by ends of a freely jointed polymer chain ........................................................................................................................ 21
1-7 Representation of barrier crossing events in Kramers model ............................................. 24
1-8 Fly-casting model. .................................................................................................................. 31
1-9 Complex of IA3 (red alpha helix) with YPrA (blue) ............................................................ 35
2-1 Two-state folding in a protein ............................................................................................... 38
2-2 Jablonski diagram showing the interaction of light with matter. ........................................ 41
2-3 Effects of solvent exposure on fluorescence of free tryptophan ......................................... 42
2-4 Energy transfer between two fluorophores tryptophan and dansyl attached to N2W-K16C-dansyl IA3 peptide ....................................................................................................... 43
2-5 Representation of design of IA3 mutants with FRET donor tryptophan and acceptor dansyl ...................................................................................................................................... 45
2-6 View of the inhibition complex of YPrA (blue) with IA3 (gray) based on crystal structure data (76)................................................................................................................... 46
2-7 CD spectrum of thermal denaturation of alpha helical peptide IA3 and beta hairpin forming TZ2 peptide. ............................................................................................................. 49
2-8 Tryptophan structure ............................................................................................................. 51
2-9 Model for diffusion controlled loop formation in a poly-amino acid chain labeled with donor Trp and acceptor cysteine (in red). .................................................................... 52
2-10 Time-resolved transient spectroscopy apparatus.................................................................. 58
2-11 Response of free tryptophan and the peptide TC5b to a temperature jump of 9.8oC. ...... 61
9
2-12 Temperature jump set-up with following elements ............................................................. 63
2-13 UV probe system ................................................................................................................... 64
2-14 Sample holder and fused silica fiber ..................................................................................... 65
2-15 Representation of thermal diffusion in sample after the IR pulse. ...................................... 66
2-16 Temperature calibration of T-jump system with fluorescence of free tryptophan in solvent used for experiments. .............................................................................................. 67
2-17 Saturation of aqueous NATA solution with UV photons. ................................................... 68
2.18 Spectral data acquisition system ........................................................................................... 69
3-1 Two potential schemes of interaction for YPrA with the intrinsically disordered peptide IA3 .............................................................................................................................. 72
3-2 Equilibrium fluorescence measurements with N2W-K16C-dansyl IA3 ............................. 74
3-3 Equilibrium far-UV circular dichroism data for mutant N2W-K16C-dansyl IA3 ............ 76
3-4 Analysis of thermodynamic parameters for folding transition of IA3 as a function of temperature and TFE.............................................................................................................. 78
3-5 Temperature-calibration of Temperature-jump system.. ..................................................... 79
3-6 Temperature-jump data for IA3 in TFE ................................................................................. 81
3-7 Kinetics of coupled folding and binding interaction of IA3 with YPrA ............................. 82
3-8 Proposed model for interaction between IA3 (I) and YPrA (Y) .......................................... 84
4-1 Structure of tryptophan zipper TZ2. ..................................................................................... 90
4-2 CD signal for TZ2 in pH 7.0 phosphate buffer + 2M GdnHCl ........................................... 94
4-3 Comparison of fluorescent response of free tryptophan in N-acetyl tryptophan amide (NATA) and tryptophan residues in TZ2 in phosphate buffer at pH 7.0 with 2M GdnHCl after a temperature jump of 9.7oC ......................................................................... 95
4-4 Fluorescent response of 120 µM TZ2 in 50 mM phosphate buffer at pH 7.0 and 2M GdnHCl to a temperature-jump of 8-10oC. .......................................................................... 96
4-5 Shift in fluorescence intensity and red shift in peak wavelength of fluorescence at low viscosities (blue) and high viscosities (orange) ............................................................ 97
4-6 Viscosity dependence of relaxation of spectral shift at 35oC and 52oC.............................. 98
10
4-7 Kinetic response of TZ2 in solvents of varying viscosities at different temperatures.. ..... 99
5-1 Flash photolysis scheme for monitoring intra-chain diffusion via energy transfer between contact forming monomers. .................................................................................. 105
5-2 Optimisation of the transient spectroscopy apparatus ....................................................... 107
5-3 Absorption spectra for free tryptophan in pH 7.0 phosphate buffer ................................. 108
5-4 Tryptophan triplet relaxation (absorption maximum at 450 nm) fit to a single exponential and power law decay ....................................................................................... 109
5-5 Triplet relaxation as a function of triplet and oxygen concentration ................................ 111
5-6 Photo-damage of tryptophan by repeated UV irradiation in an experiment..................... 112
A-1 Time-resolved fluorescence spectra of double mutant N2W-K16C-IA3 peptide ........... 118
A-2 Results of singular value decomposition of time-resolved fluorescence spectra for IA3. ........................................................................................................................................ 120
A-3 Single exponential fit for both SV2 and SV3 in time.......................................................... 121
11
Abstract of Dissertation Presented to the Graduate School of the University of Florida in Partial Fulfillment of the Requirements for the Degree of Doctor of Philosophy
TIME-RESOLVED LASER SPECTROSCOPIC STUDIES OF
RATE-LIMITING EVENTS IN PROTEIN FOLDING AND BINDING
By
Ranjani Narayanan
May 2009 Chair: Stephen James Hagen Major: Physics
Proteins fold from simple poly-amino acid chains to compact three-dimensional
structures capable of performing diverse functions in our cells. This disorder to order transition
is both swift (~microseconds) and specific. While energy landscape theory and kinetic theories
of diffusion have enriched our understanding of the mechanism by which proteins fold, we are
still searching for the answers to key questions. What is the limiting speed for the folding
process? What events drive the folding process at these limiting speeds?
Protein folding begins with the formation of a contact between any two points of the
chain diffusing towards each other. The rate of this event sets an upper limit to the overall
folding rate. We use laser-triggered nanosecond-resolved multi-wavelength transient absorbance
spectroscopy to study contact formation in simple amino acid chains in aqueous solvents.
Studying variation of diffusion rates with solvent viscosity and temperature identifies the events
limiting the folding rate. Small fast folding proteins are model systems to conduct such
experiments, as their folding mimics the initial events in the protein folding process. Our laser-
induced temperature-jump nanosecond- resolved fluorescence studies of the tryptophan zipper
folding investigates the events that limit beta-hairpin formation in tryptophan zipper at various
temperatures and solvent viscosities. We observe a fast (~100 ns) relaxation and a slower (~ µs)
12
relaxation for the tryptophan zipper in our kinetic studies of TZ2 folding with varying time
dependence at different temperatures and viscosities. The presence of more than one relaxation
confirms the existence of multiple folding pathways for TZ2. They also open up the possibility
of exploring these pathways in different regimes of solvent viscosity.
We study the folding kinetics of the natively unfolded IA3 peptide coupled to its binding
to the YPrA enzyme. This interaction results in specific and potent inhibition of YPrA by IA3.
Our laser-triggered temperature jump studies enable a better understanding of the mechanism by
which IA3 inhibits YPrA . The different folding kinetics of IA3 in the absence and presence of
YPrA suggests a mechanism where IA3 first binds to YPrA, and then uses YPrA as a template to
stabilize its folded state.
13
CHAPTER 1 INTRODUCTION
Introduction
Proteins are vital in biological processes. Protein function is derived from structure, which
in turn is derived from sequence encoded by the cellular DNA. The protein folding problem (1,
2) is the process by which the freshly synthesized polymer chain of amino acids assembles itself
into a compact functional form on biologically relevant timescales. Current understanding of
protein folding has benefited from advances in experimental methods for probing the protein
folding reaction and theoretical approaches that simulate folding using simple physical models.
This has led to a giant leap in understanding of the proteins with a well-defined fold. The
progress of similar research on intrinsically disordered proteins has been more recent.
This dissertation focuses on the kinetics of sub-millisecond folding events in proteins,
which includes binding induced folding of the intrinsically disordered peptide IA3. We use time-
resolved spectroscopic techniques to monitor the rate-limiting events of the folding process such
as intra-chain contact formation in simple polypeptide chains and turn formation in mini-proteins
such as tryptophan zipper. Our studies of the intrinsically disordered peptide IA3 follow its
extremely rapid concerted folding and binding interaction with the protease YPrA. Before
plunging headlong into a discussion of the details of the individual projects, this introductory
chapter briefly reviews the major concepts in the protein folding literature relevant to our studies.
Protein Structure
Proteins are polymer chains of amino acids, which are characterized by a carboxylic acid
group (-COOH), an amine group (-NH2) and another organic group (R) attached to the central
carbon atom as shown in figure 1-1. R could represent an aliphatic or aromatic carbon group.
The L- and D-forms of the same amino acid are mirror symmetric: the hydrogen and R residue
14
on the alpha carbon exchange places in the two forms. Genes can code for L-amino acids only,
hence protein chains constitute L-amino acids (3).
Figure 1-1: Representation of an amino acid with the L-steric form having the side residue R and hydrogen at the alpha carbon as shown above.
The peptide bond between two amino acids is formed when the carboxyl group (- COOH)
of one amino acid reacts with the amine group (-NH2) of the other by condensation. The
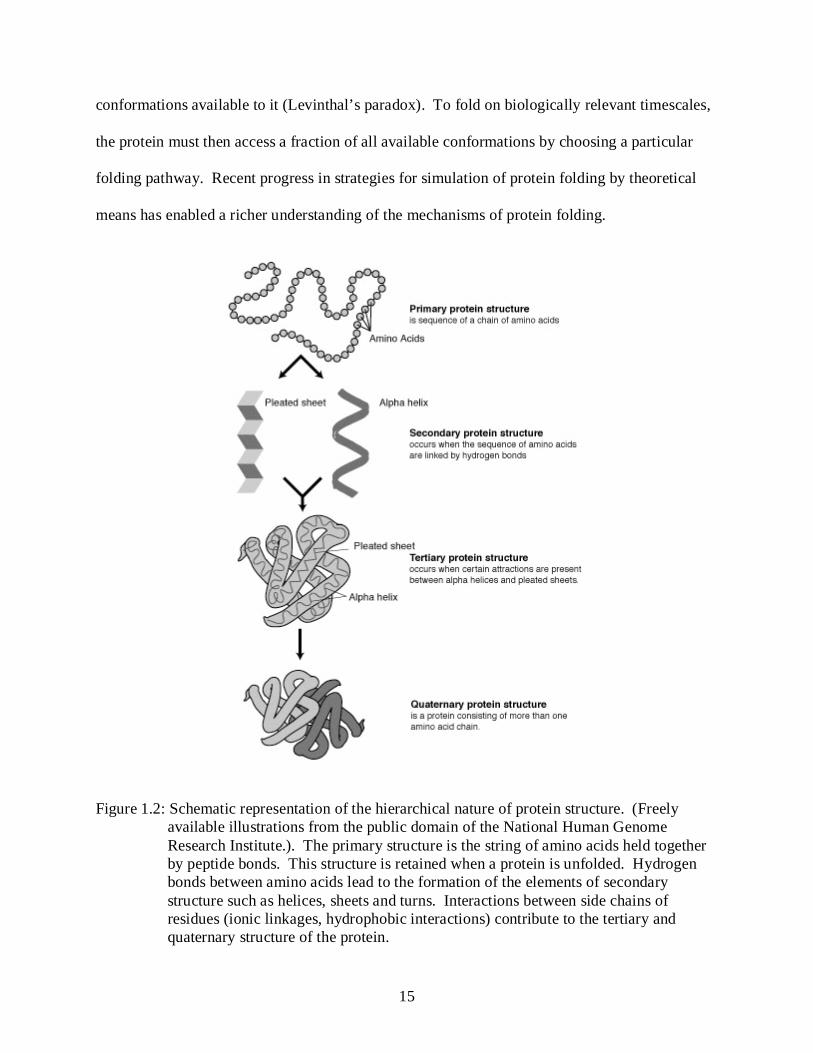
primary structure of proteins is the polymer chain of amino acid residues held together by
peptide bonds. This chain can rotate about the C-Cα and N-Cα bonds (ψ and φ bond angles
respectively) to form helices, loops and sheets. These loops, turns and helices are held together
by hydrogen bonds and constitute the secondary structure of proteins. Further linking of these
secondary structural elements by hydrophobic interactions between hydrocarbon side chains,
ionic salt bridges and disulphide linkages which extend the hierarchy of protein structure to
tertiary and quaternary structure as shown in figure 1-2.
Finding the Right Fold in Time
The field of protein folding opened up with C. Anfinsen’s study on bovine ribonuclease
(4, 5) demonstrating the ability of proteins to fold spontaneously and reproducibly. He showed
that the folding process was a conformational search for the peptide configuration with lowest
free energy. The sub-second timescales on which proteins complete this search suggests that this
is not a random conformational search for the most stable conformation of the peptide. Levinthal
estimated that a protein with ~ 100 residues would take close to 1010 years to sample all
15
conformations available to it (Levinthal’s paradox). To fold on biologically relevant timescales,
the protein must then access a fraction of all available conformations by choosing a particular
folding pathway. Recent progress in strategies for simulation of protein folding by theoretical
means has enabled a richer understanding of the mechanisms of protein folding.
Figure 1.2: Schematic representation of the hierarchical nature of protein structure. (Freely available illustrations from the public domain of the National Human Genome Research Institute.). The primary structure is the string of amino acids held together by peptide bonds. This structure is retained when a protein is unfolded. Hydrogen bonds between amino acids lead to the formation of the elements of secondary structure such as helices, sheets and turns. Interactions between side chains of residues (ionic linkages, hydrophobic interactions) contribute to the tertiary and quaternary structure of the protein.
16
Protein folding can be visualized as a chemical reaction with the unfolded and folded
protein being initial and final states of the system. The protein can thus be described as
traversing a trajectory on a surface, which relates its energy to the co-ordinates of its constituent
atoms in a particular conformation. In recent times, it has been possible to explore this energy
surface by simulating the trajectories of the atoms of a protein while folding in solvent.
Equations of motion have been written for the atoms constituting a protein, and a variety of
potentials used to describe the electrostatic, van der Waals and covalent interactions in a protein.
Unlike simple chemical reactions where transition state energies differ by large enthalpies of
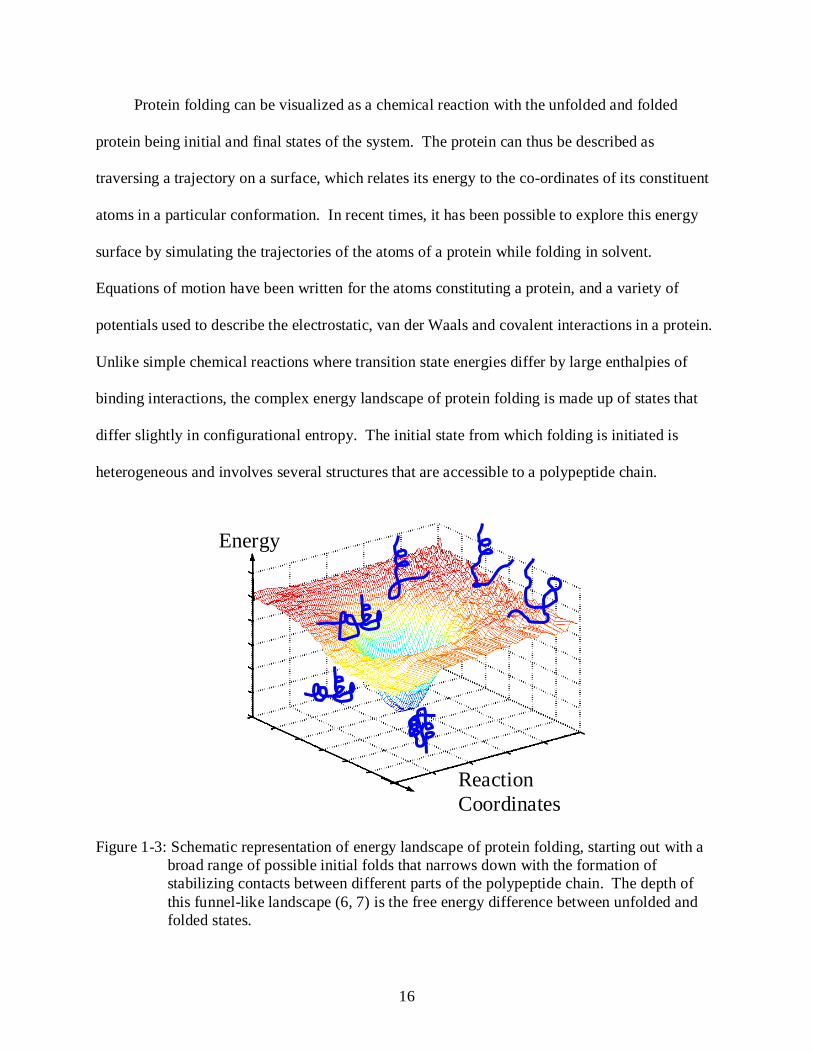
binding interactions, the complex energy landscape of protein folding is made up of states that
differ slightly in configurational entropy. The initial state from which folding is initiated is
heterogeneous and involves several structures that are accessible to a polypeptide chain.
Figure 1-3: Schematic representation of energy landscape of protein folding, starting out with a broad range of possible initial folds that narrows down with the formation of stabilizing contacts between different parts of the polypeptide chain. The depth of this funnel-like landscape (6, 7) is the free energy difference between unfolded and folded states.
Energy
Reaction Coordinates
17
The folding process then proceeds as a downhill search in which interactions that are
‘native-like’ are more stabilizing than non-native like interactions. A given molecule samples
only a subset of all possible conformations accessible to it, owing to the statistical nature of the
process, thus allowing for a more realistic folding time. This picture of a folding funnel (6, 7, 8)
has enabled us to understand several features of the folding reaction (figure 1-3).
The concept of a funnel has been extended to protein binding, which is vital to the
functioning of proteins. The stable complex of two proteins lies at the bottom of the funnel. It
has been argued (9) that the more rugged the landscape near the bottom of the funnel, the more
likely it is for the protein to be ‘flexible’ and make non-specific contacts during complex
formation. If the funnel has a narrow minimum, it would imply the higher likelihood of a rigidly
structured protein that would interact with other proteins in a ‘lock-and-key’ scheme. This
suggests that structural rigidity is not a pre-requisite for specificity in bimolecular recognition,
and that protein-protein associations can be possible with flexible proteins too.
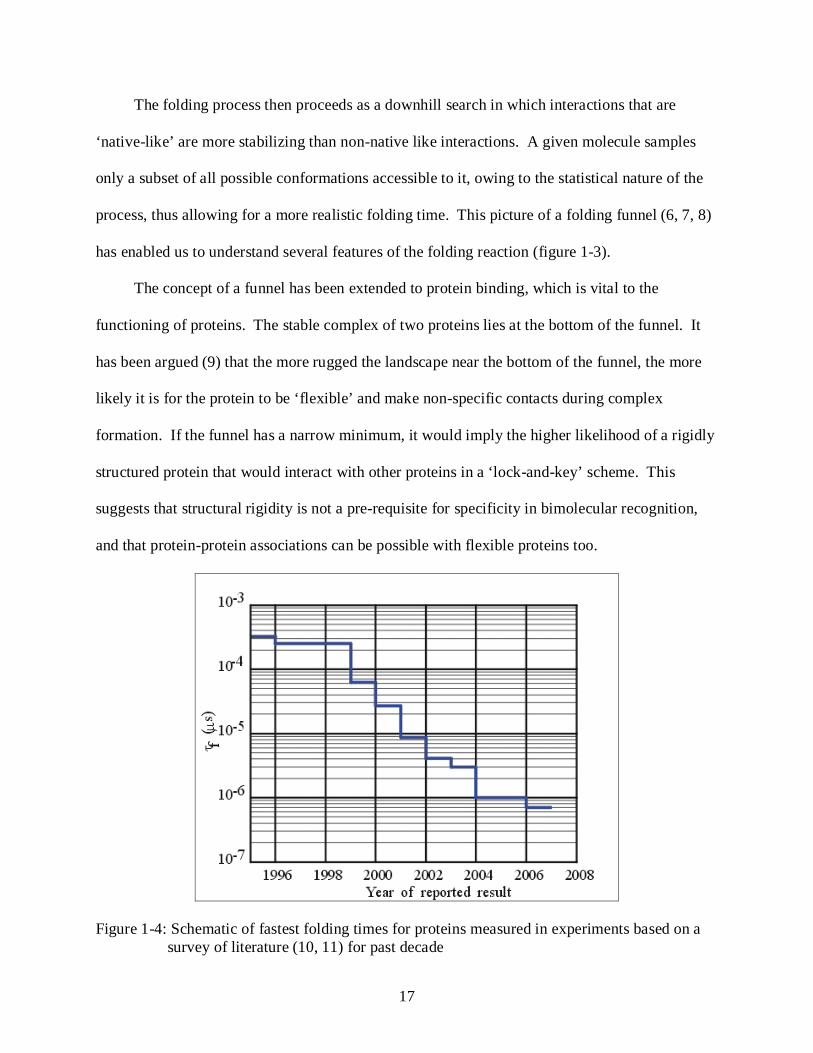
Figure 1-4: Schematic of fastest folding times for proteins measured in experiments based on a survey of literature (10, 11) for past decade
18
Rate Limit for Protein Folding
Experiments on small proteins have shown folding times on the scale of microseconds (10)
to milliseconds (figure 1-4). Since folding involves compaction and contact formation events,
the folding time is limited by the slowest of these events. These events include the collapse of
the polypeptide chain to form the first contact to form loops and turns. Therefore, one can
expect mini-proteins that fold into loops and turns to fold at this limiting speed. Our studies of
contact formation in small peptides and hairpin formation in the tryptophan zipper protein
measure this limiting rate under different experimental conditions of temperature and solvent
viscosity.
We study fast folding proteins, so that we may understand what physically limits the rates
of their folding. This implies that we have to implement strategies to acquire kinetic data for
protein folding with sub-microsecond resolution and then make a connection between the
observed kinetics and simple physical models for protein folding.
Diffusion Limits Rate of Protein Folding
The unfolded state is the starting point of the protein folding process. It is comparable to a
‘random-coil’ like polymer chain that can sample a host of dynamic conformations. The
formation of numerous contacts between segments of this chain facilitates the compaction and
eventual folding of the protein. Intra-chain diffusion of these chain segments towards each other
can thus be regarded as an elementary step in the folding reaction (12, 13).
Polymer physics and diffusion-limited contact formation
Theoretical studies of diffusion limited contact formation in proteins have gained from an
understanding of cyclization reactions (14) in flexible polymers. The unfolded state of a protein
(15, 16) can be modeled by statistical mechanical models for polymers. We have a simple
picture of a multi-unit chain whose monomers are brought in proximity to each other by
19
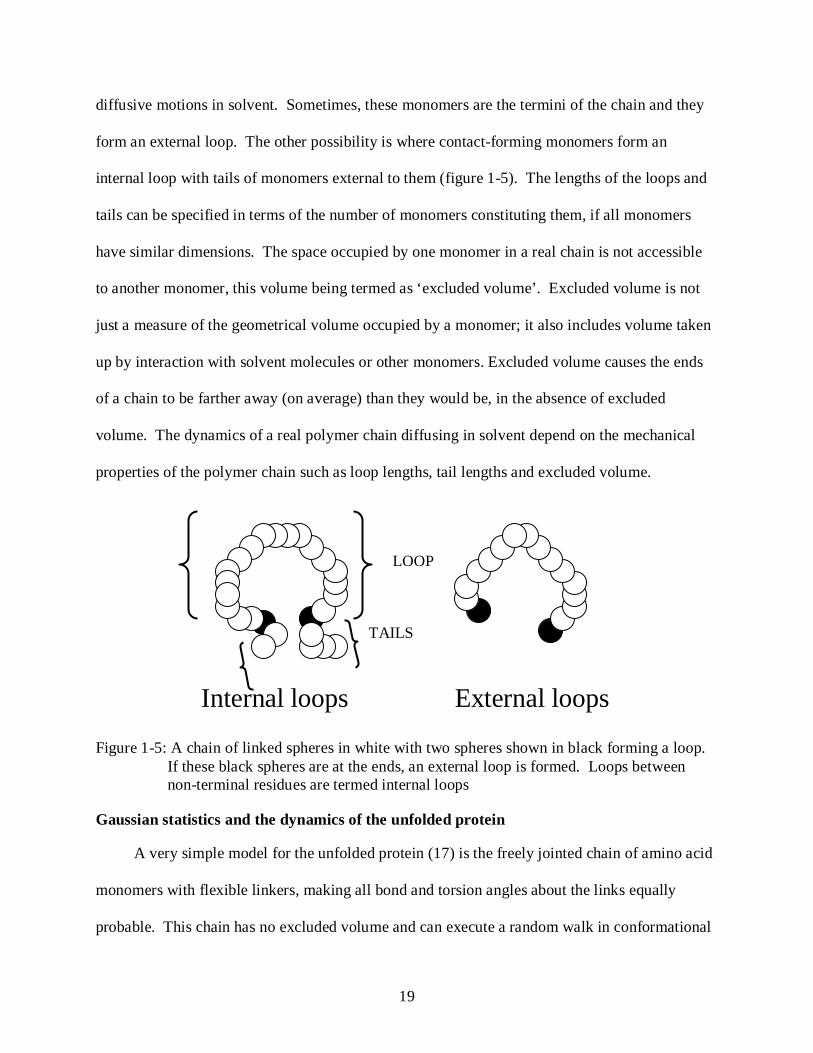
diffusive motions in solvent. Sometimes, these monomers are the termini of the chain and they
form an external loop. The other possibility is where contact-forming monomers form an
internal loop with tails of monomers external to them (figure 1-5). The lengths of the loops and
tails can be specified in terms of the number of monomers constituting them, if all monomers
have similar dimensions. The space occupied by one monomer in a real chain is not accessible
to another monomer, this volume being termed as ‘excluded volume’. Excluded volume is not
just a measure of the geometrical volume occupied by a monomer; it also includes volume taken
up by interaction with solvent molecules or other monomers. Excluded volume causes the ends
of a chain to be farther away (on average) than they would be, in the absence of excluded
volume. The dynamics of a real polymer chain diffusing in solvent depend on the mechanical
properties of the polymer chain such as loop lengths, tail lengths and excluded volume.
Figure 1-5: A chain of linked spheres in white with two spheres shown in black forming a loop. If these black spheres are at the ends, an external loop is formed. Loops between non-terminal residues are termed internal loops
Gaussian statistics and the dynamics of the unfolded protein
A very simple model for the unfolded protein (17) is the freely jointed chain of amino acid
monomers with flexible linkers, making all bond and torsion angles about the links equally
probable. This chain has no excluded volume and can execute a random walk in conformational
TAILS
Internal loops External loops
LOOP

20
space. The one-dimensional end-to-end distance vector R is calculated for a chain of n segments
with uniform average bond length L (R max = n L) . The mean value of this vector is zero when
we average out equally probable bond angles. The root mean square value however is a non-
zero. Assuming each chain conformation to be equally probable, the probability of the ends
being at a distance between R and R + dR, is given by a Gaussian distribution of the form shown
in Eq.1-1 .
)2/3exp()3/2(
4)( 222/32
2
RRR
dRRdRRP −=π
π [1-1]
The equation holds true for a phantom chain where two units could occupy the same space.
Incorporation of excluded volume effects would reduce the conformations available to the
polymer, reducing the random walk to a self-avoiding walk.
2
2 )()(r
rPDtrP
∂∂
=∂
∂
[1-2]
Diffusion equations can be used to study the time-evolution of the probability distribution
of r, the distance between ends of a polymer and calculate the time τ taken by the termini of the
polypeptide to diffuse towards each other, initiating the folding process (14, 16, 17).
Peq(r) is the equilibrium distribution of the fluctuating distances between points in the
chain. Schulten, Schulten and Szabo (18) use a one-dimensional model for diffusion of polymer
to estimate time of first contact, obtaining a result that has been successful in explaining the
dynamics of several peptides with reasonably good accuracy. This approach looks at the
fluctuating end-to-end distance between the ends of the loop and tries to estimate the time taken
for the ends to diffuse towards each other under the action of an entropic potential and make the
first contact.
21
0 2 4 6 8 100
2
4
6
8
Distance r
End
-to-
end
dist
ance
p(r
)
0 2 4 6 8 10-2
0
2
4
6
Distance r
Inte
ract
ion
pote
ntia
l U(r
)
U(r) = - kB*T*log(p(r))
Probability distribution of end-to-end distance for freely jointed chain
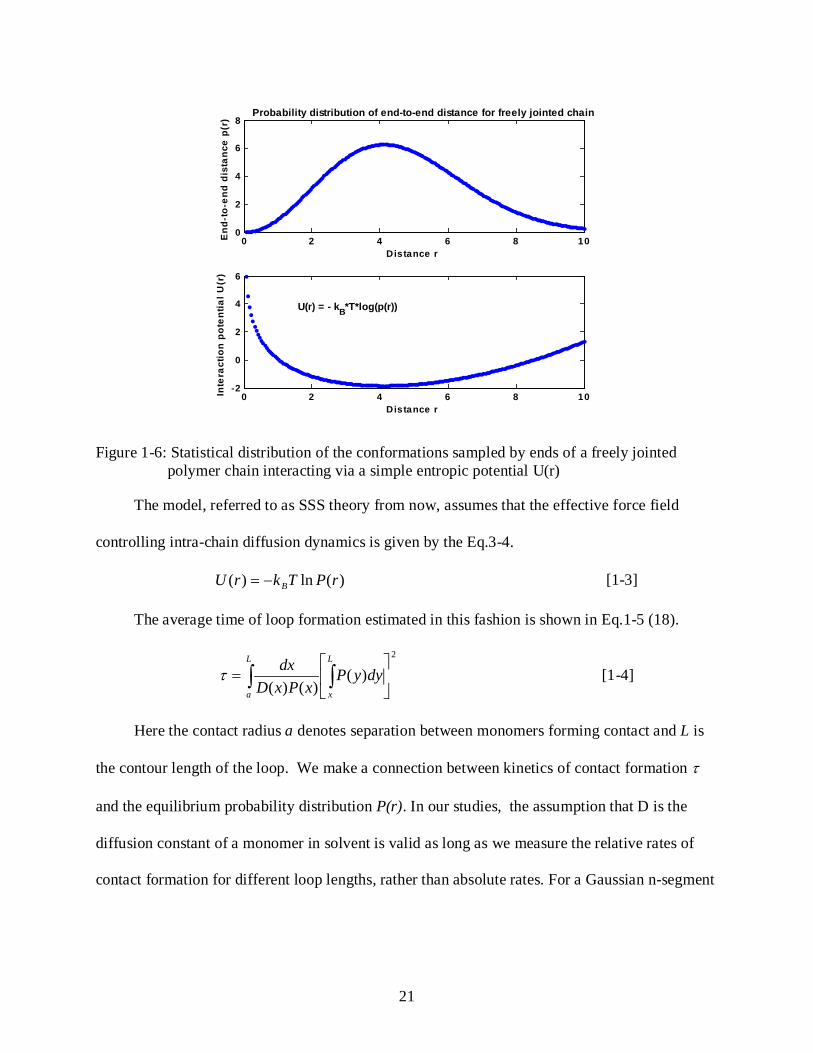
Figure 1-6: Statistical distribution of the conformations sampled by ends of a freely jointed polymer chain interacting via a simple entropic potential U(r)
The model, referred to as SSS theory from now, assumes that the effective force field
controlling intra-chain diffusion dynamics is given by the Eq.3-4.
)(ln)( rPTkrU B−= [1-3]
The average time of loop formation estimated in this fashion is shown in Eq.1-5 (18).
2
)()()(
= ∫∫
L
x
L
a
dyyPxPxD
dxτ [1-4]
Here the contact radius a denotes separation between monomers forming contact and L is
the contour length of the loop. We make a connection between kinetics of contact formation τ
and the equilibrium probability distribution P(r). In our studies, the assumption that D is the
diffusion constant of a monomer in solvent is valid as long as we measure the relative rates of
contact formation for different loop lengths, rather than absolute rates. For a Gaussian n-segment
22
chain without any excluded volume interactions, the theory predicts that the rate of contact
formation scales as n-3/2.
Comparison of dynamics of internal and external loops
We have looked so far at theoretical estimates of loop rates by the ends of a chain. The
more biologically relevant scenario is one where two points in the chain form an internal loop.
Intuitively one would expect these loops to form slower than external loops due to the effect of
dragging tails. The additional residues to the loop also have an excluded volume that reduces the
probability of loop formation between interior residues. One study (19) on loop formation in
three different scenarios; end-end, end-interior and interior loops reported distinct differences in
statistical behavior, which was manifest by the different scaling dependence of probability
distributions for the loops. Doucet et al (20) have used a freely jointed chain model with hard
sphere excluded volume interactions and applied SSS theory to the probability distribution for
inter-residue distance. Increased suppression of contact formation rates are reported for loops of
increasing length on adding tails. This has been attributed to the increased interaction potential
U(r) in loops with enhanced contour length and tails. The study of end-interior loops (figure 3-3)
seems to indicate that tails on one end slow the rate of contact formation, but not to the same
extent as a slowing down of contact formation rate by a tail on both ends.
This study enables predictions for experimental determination of contact formation rates
in polypeptide chains. The rate of diffusion limited contact formation estimated in this fashion
serves as an upper limit for the rate (18) at which a real polypeptide chain assembles itself (via
multiple ‘native’-like contacts) into a structured protein. Nanosecond-pulsed laser spectroscopy
has enabled measurement of intra-chain diffusion in the protein cytochrome c (21). This yields a
time of 40 µs for diffusion-limited contact between the heme group, and a residue 50-60 amino
23
acids further along the polypeptide chain. This rate has been extrapolated to 1 µs for contact
formation between residues separated by 10 amino acids which represents the fastest intra-chain
diffusion in short polypeptide chain segments. More recent experimental studies of contact
formation between diffusing segments of the poly-amino acid chain have studied energy transfer
between photo-excited triplet states of residues (22, 23, 24) in peptide chain. We use this
method of triplet-triplet energy transfer to estimate the rate of diffusion limited contact formation
in polypeptide chains (chapter 5).
Solvent Friction Effects on Protein Folding
The folding reaction of most fast-folding proteins is well described by a two-state
transition between the unfolded state and the folded state. Since folding relies on the formation
of multiple ‘native’ like contacts between segments of the polypeptide chain by diffusion, the
rate of folding is controlled by the rate of diffusion across the energy barrier separating the two
states. Kramer’s theory of reaction rates (25) for a particle diffusing across a one-dimensional
double well potential U(x) can be applied to this scenario (26) to estimate the escape of the
particle. According to this theory, the diffusive dynamics of the particle is coupled to thermal
noise inherent in the system, making the particle’s reaction co-ordinate x and velocity stochastic
in nature. The Langevin equation of motion for the particle of mass M can be written as shown
in Eq.1-1.
)()(' txMxUxM ξγ +−−= [1-5]
The term γ is the friction term that incorporates the damping effect of solvent interactions.
The fluctuating force ξ(t) obeys the fluctuation-dissipation theorem. For a strong friction term,
the xM can be neglected. The potential U can be assumed as shown in figure 1-4 with an
24
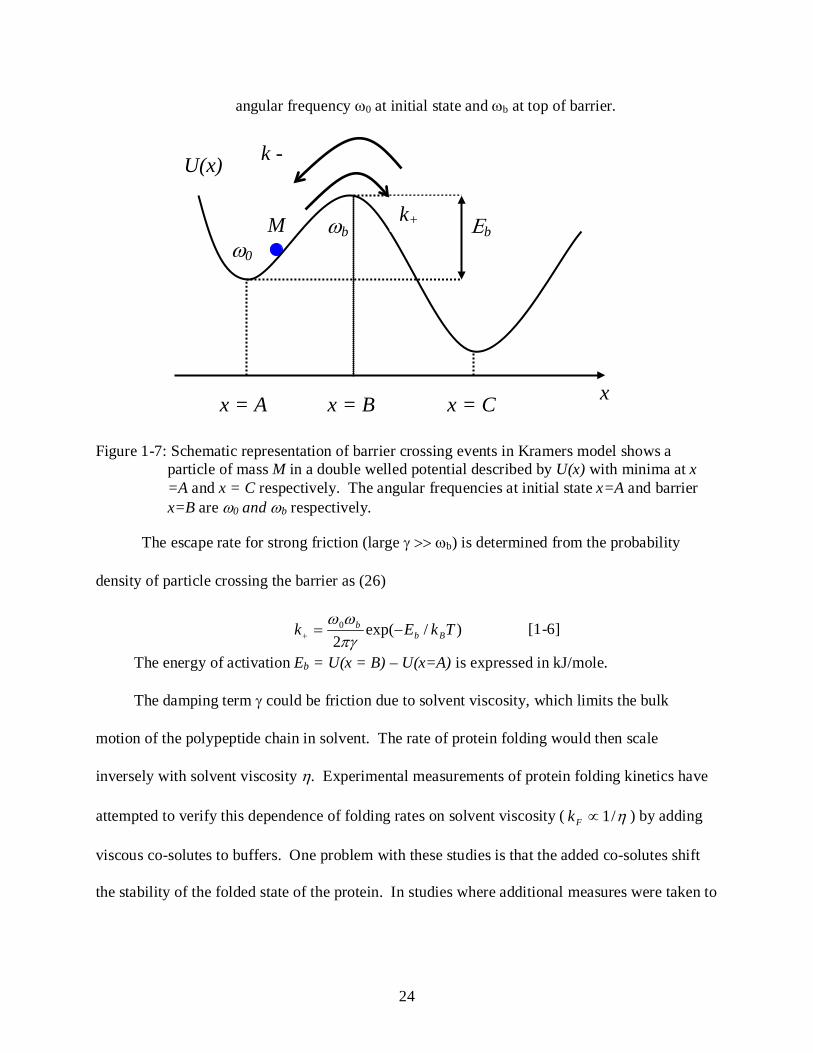
angular frequency ω0 at initial state and ωb at top of barrier.
Figure 1-7: Schematic representation of barrier crossing events in Kramers model shows a particle of mass M in a double welled potential described by U(x) with minima at x =A and x = C respectively. The angular frequencies at initial state x=A and barrier x=B are ω0 and ωb respectively.
The escape rate for strong friction (large γ >> ωb) is determined from the probability
density of particle crossing the barrier as (26)
)/exp(2
0 TkEk Bbb −=+ πγ
ωω [1-6]
The energy of activation Eb = U(x = B) – U(x=A) is expressed in kJ/mole.
The damping term γ could be friction due to solvent viscosity, which limits the bulk
motion of the polypeptide chain in solvent. The rate of protein folding would then scale
inversely with solvent viscosity η. Experimental measurements of protein folding kinetics have
attempted to verify this dependence of folding rates on solvent viscosity ( η/1∝Fk ) by adding
viscous co-solutes to buffers. One problem with these studies is that the added co-solutes shift
the stability of the folded state of the protein. In studies where additional measures were taken to
U(x)
x x = A x = B
k+
k -
x = C
ω0 ωb Εb M
25
reverse this shift in stability, the inverse of the folding rate was observed to scale with solvent
viscosity in a linear fashion (27, 28, 29, 30).
Since experimental studies cannot probe conditions of very low solvent viscosity (η 0 ),
the kinetic results ( 1−Fk ) can be extrapolated to zero solvent viscosity, to estimate the limiting rate
of protein folding. As η 0, the folding kinetics are dominated more by internal
reconfiguration of polypeptide chain than by bulk diffusion of chain in solvent. These
interactions are weakly coupled to solvent and limit the folding rates. Internal friction is used to
describe the contribution of these interactions to the overall friction affecting the protein. Early
studies on polymer chains have indicated mechanisms by which a polymer chain can experience
drag forces that do not arise from changes in solvent viscosity. These include the potential
energy barriers to backbone rotations, long-range interactions between residues and the
accessibility of free volume in a non-continuum solvent.
Internal Friction
The internal friction of the protein retards the motion of protein segments (27) relative to
each other, and plays a key role in protein dynamics at low solvent viscosities. The
consequences of internal friction have been interpreted in different ways by different models.
Ansari’s study of folding kinetics of myoglobin (27) observed a finite folding rate at low solvent
viscosity. They used a modified Kramers model with an additional viscosity term σ in the
reaction friction, as shown in equation 1-3.
)/exp( TkEAk BaF −+
=ση
[1-7]
Applying this model to the data for myoglobin, they obtained σ ~ 4.1 ± 1.3 mPa s, 4×
larger than the viscosity of water. More recent attempts to fit experimental data for protein
26
folding to equation 1-3 (31, 32, 33, 34, 35) have not always provided conclusive evidence for a
positive σ. This has led to concerns that the interpretation of internal friction as a viscosity is
flawed(28, 36). Instead, the protein folding time can be viewed as the sum of two timescales,
one of which is solvent-controlled while the other is dominated by the effects of internal friction
(28, 29, 36, 37). In equation 1-4, τS reflects the timescale of protein conformational dynamics
affected by changes in solvent viscosity, while τint reflects the timescale of events that are
insensitive to changes in solvent viscosity.
int1 ττ +≈−
SFk [1-8]
The timescale of internal friction (~ 106/s) has been seen to be slower (28, 29) than that of
simple diffusion of an ideal polypeptide chain (~ 100 ns). It thus sets an upper limit to protein
folding that differs from diffusion- limited rates for contact formation, hydrophobic collapse and
similar bulk motions of the chain. Internal friction has a notable influence on folding dynamics
at low solvent viscosities for proteins folding at relatively high rates. This also explains the
apparent absence of internal friction effects in proteins that fold on slower millisecond timescales
(37, 38).
Theoretical studies can offer an insight into the events underlying the folding process at
different conditions of solvent viscosity. Simulations with lattice models (39) have shown the
existence of multiple regimes for diffusional motion of peptides at different solvent viscosities.
It has been shown that the folding times scale linearly with solvent viscosity in the region of high
solvent viscosities, but at low viscosities the scale factor is not unity (40). This suggests the
weak coupling of folding dynamics to the solvent friction. A recent simulation of folding
dynamics for the protein BBA5 (41) has indicated a subtle shift in folding mechanism adopted
by the protein at different conditions of solvent viscosity. This study suggests that at low solvent
27
friction, the protein adopts a folding pathway characterized by fast long-range interactions.
When solvent friction is large, short-range interactions are formed easily. Both the solvent and
the protein determine the actual folding mechanism, as protein folding is a polymeric diffusive
reaction affected by extrinsic solvent diffusion and intrinsic chain diffusion. This opens up the
possibilities of observation of multiple pathways of folding for a protein by tweaking the solvent
viscosity. I study the effects of solvent friction on the multi-state folding of the tryptophan
zipper TZ2 (discussed in chapter 4).
Intrinsically Disordered Proteins
In the past few decades, protein-folding research has largely focused on proteins with a
well-defined structure. An awareness of the existence of functional proteins that lack a well-
defined three-dimensional structure has come about only in the last two decades (42, 43, 44, 45),
(46, 47, 48). These proteins are termed as ‘natively unfolded’, ‘natively unstructured’,
‘intrinsically disordered’ and ‘intrinsically unstructured’ in the literature. The presence of a
dynamic ensemble of conformations for the natively unfolded peptides poses a challenge to the
sequence-structure-function paradigm (49), (50) in protein folding that asserts that a protein’s
amino acid sequence codes for one specific conformation that determines the protein’s specific
function.
Disorder seems to confer several benefits to these proteins. The flexibility of disordered
proteins enables them to interact with multiple molecules at different sites with high specificity
and low affinity (42, 44, 45, 48, 49, 51, 52), because of their ability to rearrange their
conformation to interact with a specific target molecule. Reduced steric constraints also enable
faster association rates and easier dissociation by unzipping mechanisms (51). They have larger
surface areas of interaction than conventionally folded proteins (53), due to their ability to wrap
up or surround their partner molecule. They are also more tolerant of changes in pH and
28
temperature, which might cause destabilization of well-folded proteins (45). Disordered regions
are more amenable to regulation by molecules or proteins, which bind to them at specific sites.
This is used for regulation of several signaling and degradation pathways (42, 49).
Natively disordered proteins are involved in vital biological functions that include
molecular recognition (51, 54), regulation of transcription and translation (42, 55, 56), assembly
and proteolytic regulation (42, 52). To perform these diverse functions, most disordered proteins
have to bind to other proteins (50, 55, 57, 58), metal ions (59), (60) and radicals (61). They also
undergo a disorder to order transition on binding to their targets (62). The exact mechanism of
this concerted folding and binding is not very well understood. While the structural features of
these peptides prior to and after the coupled folding and binding interaction have been studied
exhaustively (63), (58), few theoretical studies (64, 65), (66, 67) and fewer experimental
strategies (68, 69) have focused on the hierarchy of events in this interaction. This chapter
reviews the literature on intrinsically disordered proteins and the handful of experiments focused
on the coupled folding and binding interaction of intrinsically disordered proteins with their
target molecules. Finally, we shall introduce the intrinsically disordered peptide IA3 and its
target molecule, the enzyme YPrA. We have used temperature-jump triggered time-resolved
fluorescence to monitor the binding-induced helix folding in the natively unfolded IA3. We
present the results and conclusions of our experimental studies in detail in the next chapter.
Definition of ‘Disorder’
Order or structure in a protein is defined by the degrees of freedom available to the
residues of the protein. These degrees of freedom are characterized by the bond angles for the C-
C and C-N bonds and the atom positions that limit the conformations available to each residue.
Intrinsically disordered proteins exhibit a dynamic ensemble of conformations (44)(46) available
to each constituent residue under physiological conditions of pH and temperature. The existence
29
of disorder is thus determined by the dynamical properties of the protein and not necessarily by
the presence or absence of local secondary structure. Disorder could be local e.g. a short region
in a protein or global (full-length protein) (42).
Characteristics of Intrinsically Disordered Proteins
Intrinsically disordered proteins (70), (71) have an amino acid composition that is
different from that of their folded counterparts. They are depleted in hydrophobic and aromatic
residues (‘ordering’ residues), and enriched in charged hydrophilic (‘disorder promoting’)
residues such as glutamine, glycine etc (71), (72). A high (usually negative) charge and low
hydrophobicity is a typical attribute of an intrinsically disordered protein (46), (44).
The solvent exposed surface area for each residue in an intrinsically disordered protein is
much larger than the solvent exposed area for residues in structured proteins. This enables a
larger surface area of interaction per residue (73). The ratio of interacting surface area per
residue to total surface area per residue is as high as 50% in intrinsically unstructured proteins
(70), compared to only 5-15% in well-structured proteins. This implies that intrinsically
disordered proteins use a large portion of their surface area to interact with other proteins or
molecules (74). In comparison to ordered proteins, intrinsically unstructured proteins have more
hydrophobic residues exposed to surface than buried within. Their presence in exposed surface
area of intrinsically disordered proteins indicates their role in interactions with their target
proteins that ultimately stabilize the fold of the intrinsically disordered peptide (74), (73).
To summarize, intrinsically disordered proteins can be distinguished from their structured
counterparts by their larger interacting surfaces and interactions mediated by hydrophobic
residues in interacting regions. This suggests a unique mode of interaction where hydrophobic
residues make contacts during binding that could promote stabilization of the protein core.
30
Functions of Intrinsically Disordered Proteins
Intrinsically disordered proteins are involved in several vital processes like bio-molecular
recognition, regulation of transcription, translation, signaling pathways, and proteolysis (42, 54,
57). The absence of a rigid structure enables them to associate with multiple target molecules
with high specificity and low affinity. Their ease of interaction with their targets also leads to
faster rates of interaction.
Intrinsically disordered proteins are involved in nucleic acid recognition (48, 51, 52, 57),
(75) and unwinding and bending of DNA. Several transcriptional regulators like p300 and p27
(42, 55) have domains that are completely unfolded and on binding to their targets, the binding
stabilizes their tertiary structures. The relative instability of intrinsically disordered proteins
involved in transcriptional regulation and signaling enables a higher level of control through
proteolytic degradation (42, 51).
Post-translational modification of complexes of proteins is also easier with the ‘flexible’
disordered peptides (45, 54). Simple biological switching is possible by covalent modification of
binding of intrinsically disordered proteins with their targets. Chemical modification of side
chains requires a close association of target protein and modifying enzyme. Steric hindrances
affect the rate of this association if the side chain lies within a structured region. A disordered
region facilitates substrate binding with the side chain, as seen in several proteins with
disordered regions undergoing acetylation, methylation, phosphorylation and glycosylation (51).
The binding of intrinsically disordered regions or peptides with specific biological
molecules regulates inhibition or activation of processes like degradation. We study the
inhibition of a protein-degrading enzyme in yeast, YPrA (76) by an intrinsically disordered IA3
peptide in the same yeast cell. Structural studies of the IA3-YPrA complex show that the N-
terminus of the IA3 peptide is folded into an alpha helix that occupies the active site of the
31
enzyme. Since access to the enzyme’s active site is blocked for all potential substrate molecules,
the enzyme activity is inhibited.
Theoretical Studies of Coupled Folding and Binding
The functionality of intrinsically disordered proteins is linked to their coupled folding and
binding interaction with their target proteins. Some theoretical studies have employed energy
landscape theory to model the association of a natively unfolded protein with another protein.
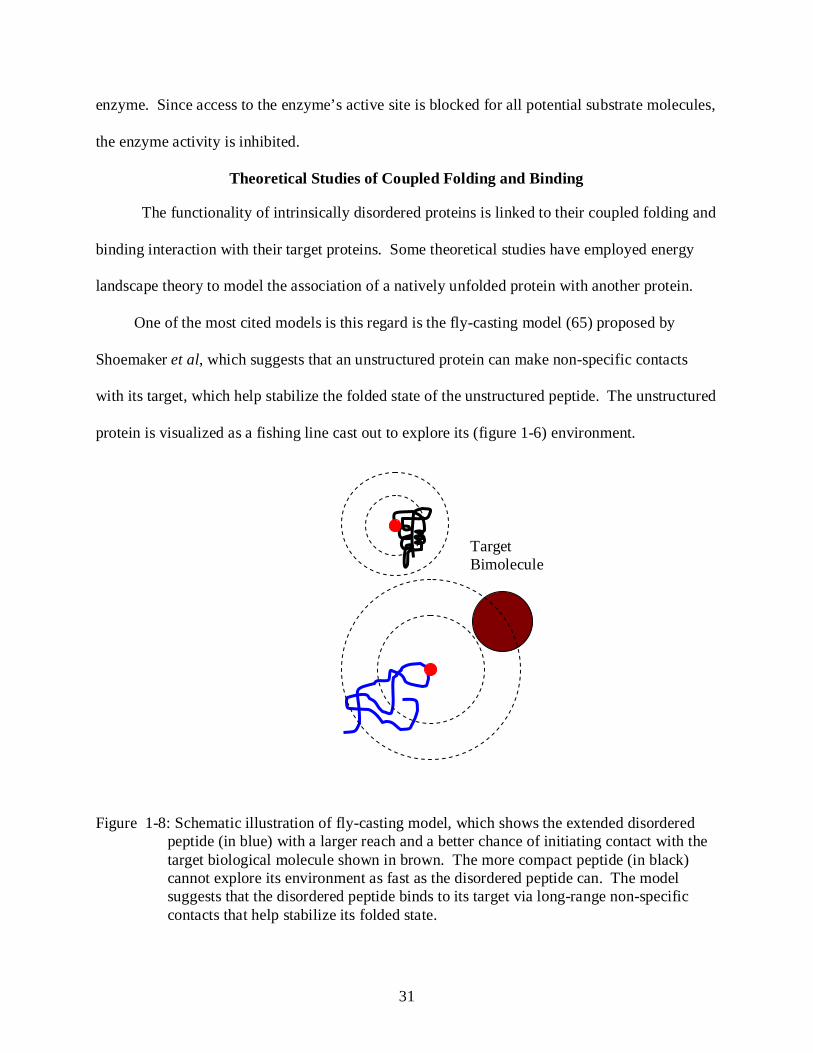
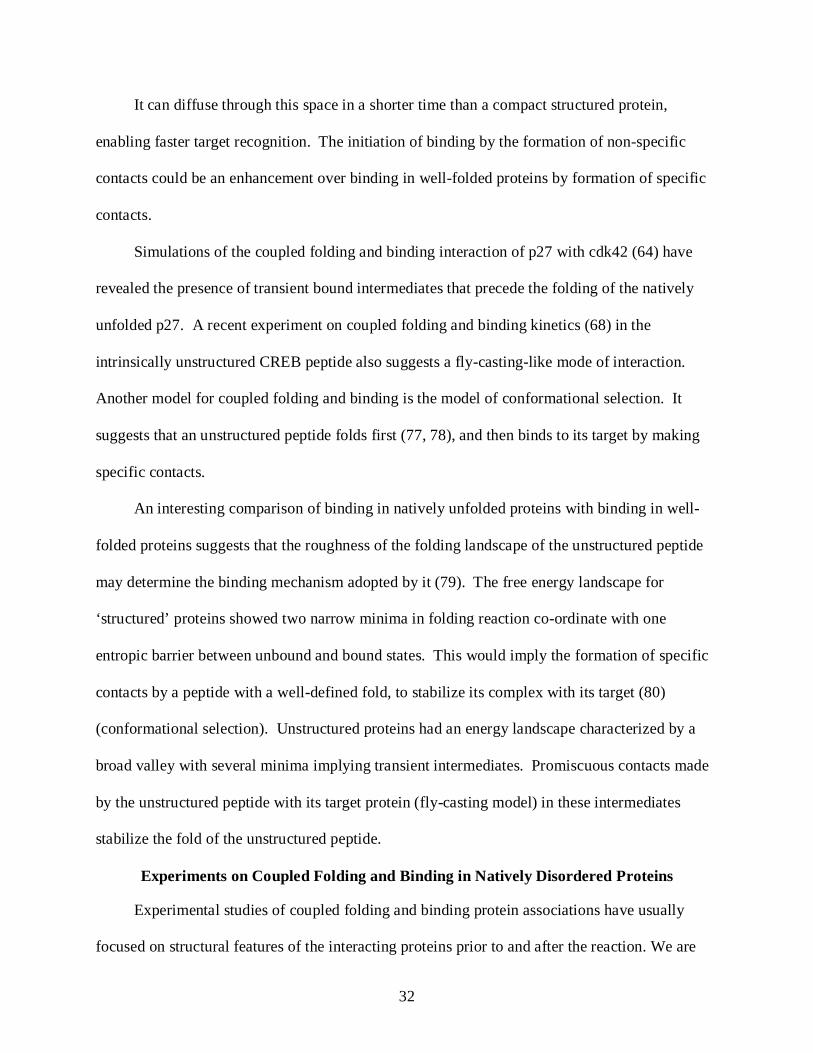
One of the most cited models is this regard is the fly-casting model (65) proposed by
Shoemaker et al, which suggests that an unstructured protein can make non-specific contacts
with its target, which help stabilize the folded state of the unstructured peptide. The unstructured
protein is visualized as a fishing line cast out to explore its (figure 1-6) environment.
Figure 1-8: Schematic illustration of fly-casting model, which shows the extended disordered peptide (in blue) with a larger reach and a better chance of initiating contact with the target biological molecule shown in brown. The more compact peptide (in black) cannot explore its environment as fast as the disordered peptide can. The model suggests that the disordered peptide binds to its target via long-range non-specific contacts that help stabilize its folded state.
Target Bimolecule
32
It can diffuse through this space in a shorter time than a compact structured protein,
enabling faster target recognition. The initiation of binding by the formation of non-specific
contacts could be an enhancement over binding in well-folded proteins by formation of specific
contacts.
Simulations of the coupled folding and binding interaction of p27 with cdk42 (64) have
revealed the presence of transient bound intermediates that precede the folding of the natively
unfolded p27. A recent experiment on coupled folding and binding kinetics (68) in the
intrinsically unstructured CREB peptide also suggests a fly-casting-like mode of interaction.
Another model for coupled folding and binding is the model of conformational selection. It
suggests that an unstructured peptide folds first (77, 78), and then binds to its target by making
specific contacts.
An interesting comparison of binding in natively unfolded proteins with binding in well-
folded proteins suggests that the roughness of the folding landscape of the unstructured peptide
may determine the binding mechanism adopted by it (79). The free energy landscape for
‘structured’ proteins showed two narrow minima in folding reaction co-ordinate with one
entropic barrier between unbound and bound states. This would imply the formation of specific
contacts by a peptide with a well-defined fold, to stabilize its complex with its target (80)
(conformational selection). Unstructured proteins had an energy landscape characterized by a
broad valley with several minima implying transient intermediates. Promiscuous contacts made
by the unstructured peptide with its target protein (fly-casting model) in these intermediates
stabilize the fold of the unstructured peptide.
Experiments on Coupled Folding and Binding in Natively Disordered Proteins
Experimental studies of coupled folding and binding protein associations have usually
focused on structural features of the interacting proteins prior to and after the reaction. We are
33
aware of a few experiments that characterize the mechanism of the interaction. Cofactor assisted
folding of flavodoxin from Desulphuris sulphuricans in the presence of the FMN cofactor has
been studied (81) in mixing experiments. The folding of the flavodoxin protein proceeds via the
fast formation of a bound intermediate followed by the slower conversion to the folded state. The
authors of this study also reported a ten-fold acceleration in the folding rate due the binding
interaction. Recent studies (68) of the interaction of the unstructured pKID domain of the CREB
protein with the KIX domain of CBP have shown that an encounter complex with non-specific
contacts is formed prior to the folding of the unstructured domain. Simulations in a later study
(82) have reiterated these findings. Studies of the disordered TC-1 peptide with Chibby protein
(83) have revealed regions of high helical propensity in the TC-1 peptide that conformationally
rearrange themselves prior to binding. Another study on folding in intrinsically unstructured
mutants of the SNase proteins (69) has revealed the preference of some mutants to fold prior to
binding, and others to bind before folding.
Intrinsically Disordered Peptide IA3 and the Yeast Aspartic Proteinase A (YPrA)
We study the coupled folding and binding interaction of the intrinsically disordered
peptide IA3 (PDB ID 1dpj) with the proteolytic enzyme, aspartic proteinase A or YPrA (PDB ID
2jxr) in yeast. The aspartic proteinase cleaves proteins and is localized to the cellular vesicles.
The IA3 peptide is found in the cytoplasm of the same cell suggesting that it does not encounter
the proteinase unless the vesicles containing YPrA are ruptured. In the event of a vesicular
rupture, the IA3 peptide binds to the proteinase at its active site. This blocks access by any other
substrate to the active site of the proteinase, thereby inhibiting the protease. Thus, the disordered
peptide IA3 effectively protects the cellular machinery from possible damage by the protease. It
is unique as an endogenous inhibitor (84) of an enzyme, i.e. the same cell that expresses the
enzyme also expresses its inhibitor. Pure IA3 is unstructured (85) in solution. When bound to
34
YPrA, it is observed that the N-terminal residues of IA3 (76)are folded into an alpha helix. One
of the simplest questions one can ask about the YPrA-IA3 interaction is whether binding
precedes folding or folding precedes binding. In one simple scheme, a small subpopulation of
IA3 that is already folded to a helix can bind to YPrA. This drives the equilibrium towards the
folded, bound state. The other possibility is that free IA3 remains unfolded, but is able to make
non-specific contacts with YPrA that facilitate the folding transition. Our study of the folding
kinetics of the intrinsically unstructured IA3 in the absence and presence of YPrA enables us to
test these two scenarios.
Intrinsically Disordered Peptide IA3
IA3 is a 7.7-kDa peptide of 68 amino acids found in the cytoplasm of the yeast cell
Saccharomyces cerevisiae (84). The amino acid sequence of wild-type IA3 shown in the figure
4.2 (86, 87) shows 47 polar residues and 6 aromatic acids. Pure IA3 is unstructured as evidenced
by circular dichroism and nuclear magnetic resonance studies (85). Crystallography studies of
the complex of IA3 bound to YPrA (76), indicate that the N-terminus of IA3 (residues 2-32) is
folded into an alpha helix, with the hydrophobic residues facing into the active site of the
enzyme. This alpha helix occupies the space in the active cleft of the protease.
IA3 is very specific to YPrA (88, 89), to which it binds with sub-nanomolar binding
affinity. It does not inhibit other proteases that are structurally similar to YPrA. In fact IA3 is
cleaved by these other similar proteases. Experiments with truncated versions of the wild-type
IA3 show that the N-terminus alone is capable of inhibiting the protease with the same affinity as
the wild-type IA3 peptide (89, 90). While the N-terminus is vital to the inhibitory action, it is
believed that the C-terminus also plays a role in the binding interaction of YPrA and IA3.

35
Yeast Aspartic Proteinase A (YPrA)
Aspartic proteinases are enzymes characterized by a dyad of aspartic acid groups (91) that
is necessary for protein digesting action or proteolysis. Structural studies of these proteinases
(87, 91, 92) show a molecule with predominant beta sheet content and right handed alpha helical
segments that form two lobes, with the active site in the interface of the two lobes. Each lobe
contains an aspartic acid residue positioned close to the other aspartic acid in the other lobe and
together they cleave substrate that is positioned inside the active cleft (92). Most aspartic
proteinases have a unique structural motif, termed the ‘flap’ and consisting of a beta hairpin loop
extending over the active cleft and implicated in catalytic action.
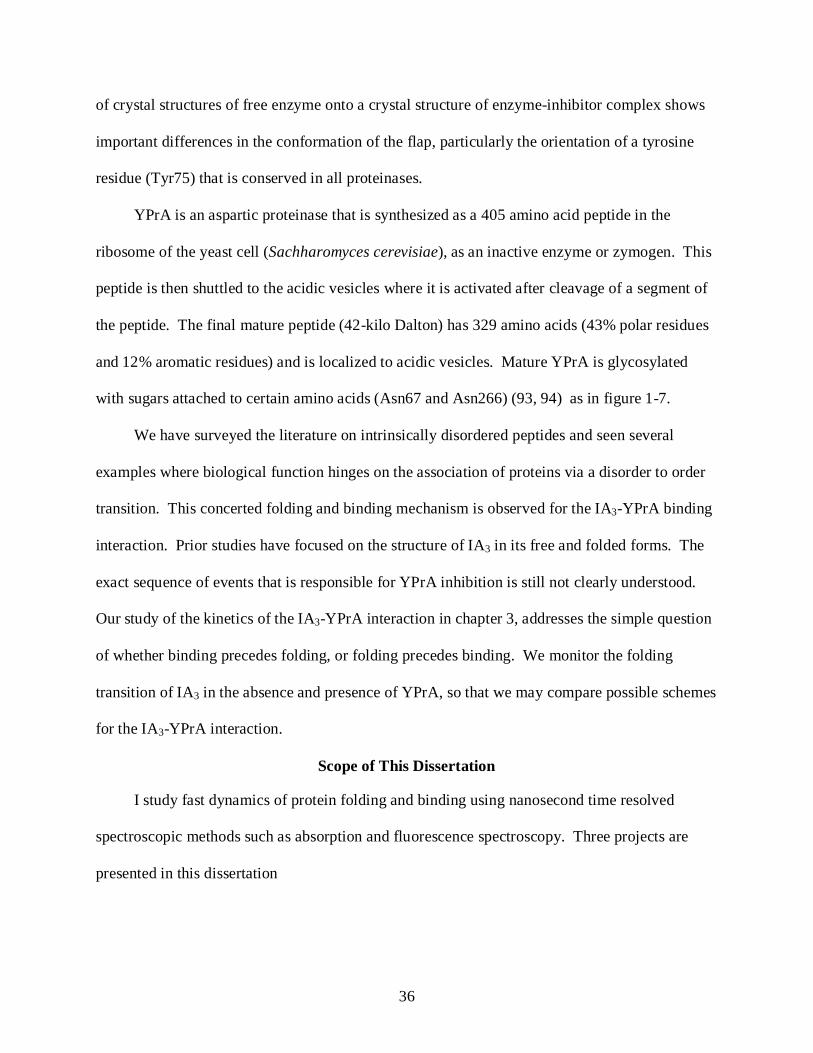
Figure 1-9: Complex of IA3 (red alpha helix) with YPrA (blue), with polysaccharide chain attached to Asn 266 and aspartic groups of Asp32 and Asp215 near the active site. Reproduced with permission from Yeast (2007), 24, 467-480
The flap region (91) is the most flexible element of the structure and has been reported to
move by as much as 8.7 Å among different crystals structures of the enzyme. Superimposition
36
of crystal structures of free enzyme onto a crystal structure of enzyme-inhibitor complex shows
important differences in the conformation of the flap, particularly the orientation of a tyrosine
residue (Tyr75) that is conserved in all proteinases.
YPrA is an aspartic proteinase that is synthesized as a 405 amino acid peptide in the
ribosome of the yeast cell (Sachharomyces cerevisiae), as an inactive enzyme or zymogen. This
peptide is then shuttled to the acidic vesicles where it is activated after cleavage of a segment of
the peptide. The final mature peptide (42-kilo Dalton) has 329 amino acids (43% polar residues
and 12% aromatic residues) and is localized to acidic vesicles. Mature YPrA is glycosylated
with sugars attached to certain amino acids (Asn67 and Asn266) (93, 94) as in figure 1-7.
We have surveyed the literature on intrinsically disordered peptides and seen several
examples where biological function hinges on the association of proteins via a disorder to order
transition. This concerted folding and binding mechanism is observed for the IA3-YPrA binding
interaction. Prior studies have focused on the structure of IA3 in its free and folded forms. The
exact sequence of events that is responsible for YPrA inhibition is still not clearly understood.
Our study of the kinetics of the IA3-YPrA interaction in chapter 3, addresses the simple question
of whether binding precedes folding, or folding precedes binding. We monitor the folding
transition of IA3 in the absence and presence of YPrA, so that we may compare possible schemes
for the IA3-YPrA interaction.
Scope of This Dissertation
I study fast dynamics of protein folding and binding using nanosecond time resolved
spectroscopic methods such as absorption and fluorescence spectroscopy. Three projects are
presented in this dissertation
37
(1) Studies of coupled folding and binding interaction between the intrinsically disordered
peptide IA3 and its binding partner YPrA: These studies combine equilibrium circular dichroism
and fluorescence spectroscopy with kinetic measurements using a temperature jump system.
(2) Studies of solvent viscosity dependence of folding kinetics of tryptophan zipper TZ2:
These studies combine equilibrium circular dichroism and kinetic studies with temperature jump
triggered time resolved fluorescence spectroscopy.
(3) Time resolved transient absorption studies of contact formation in polypeptide chains
to estimate the upper limit to protein folding
Following this introductory chapter, I shall review experimental techniques used to
monitor the protein folding reaction in chapter 2 with a focus on techniques capable of probing
the sub-millisecond response of a protein to a thermal, chemical or optical perturbation.
Subsequent chapters provide a detailed description of the different projects mentioned above.
Chapter 3 provides a detailed description of our kinetic studies of the coupled folding and
binding interaction between the protease YPrA and its intrinsically disordered inhibitor IA3. I
study solvent viscosity effects on beta hairpin formation in the tryptophan zipper, a mini-protein
of twelve residues designed to form a beta hairpin, in chapter 4. Studies of contact formation in
polypeptide chains are discussed in detail in chapter 5. The concluding chapter, Chapter 6 is a
general summary of results and conclusions. An appendix on methods of numerical analysis is
provided to supplement the information on data analysis in all the projects.
38
CHAPTER 2 EXPERIMENTAL STUDIES OF FAST FOLDING KINETICS
Introduction
Experiments on fast folding of proteins have contributed greatly to our knowledge of the
early events (2, 10, 95, 96) in this process. Advances in genetic engineering (10, 97, 98, 99, 100)
have enabled expression of site-directed mutants with fluorescent probes of the folding
transition. The advent of pulsed lasers (101, 102, 103) has opened up the opportunity of probing
events in the sub-microsecond timescale. We study folding on sub-millisecond timescales (11,
95, 101, 104, 105, 106) because the earliest events in the folding of small proteins, which set the
pace for the entire folding process occur on these very timescales. These processes could be the
elementary steps (12, 23, 107) in the folding reaction such as loop formation (12), turn formation
(108, 109, 110) and helix nucleation (107, 111).
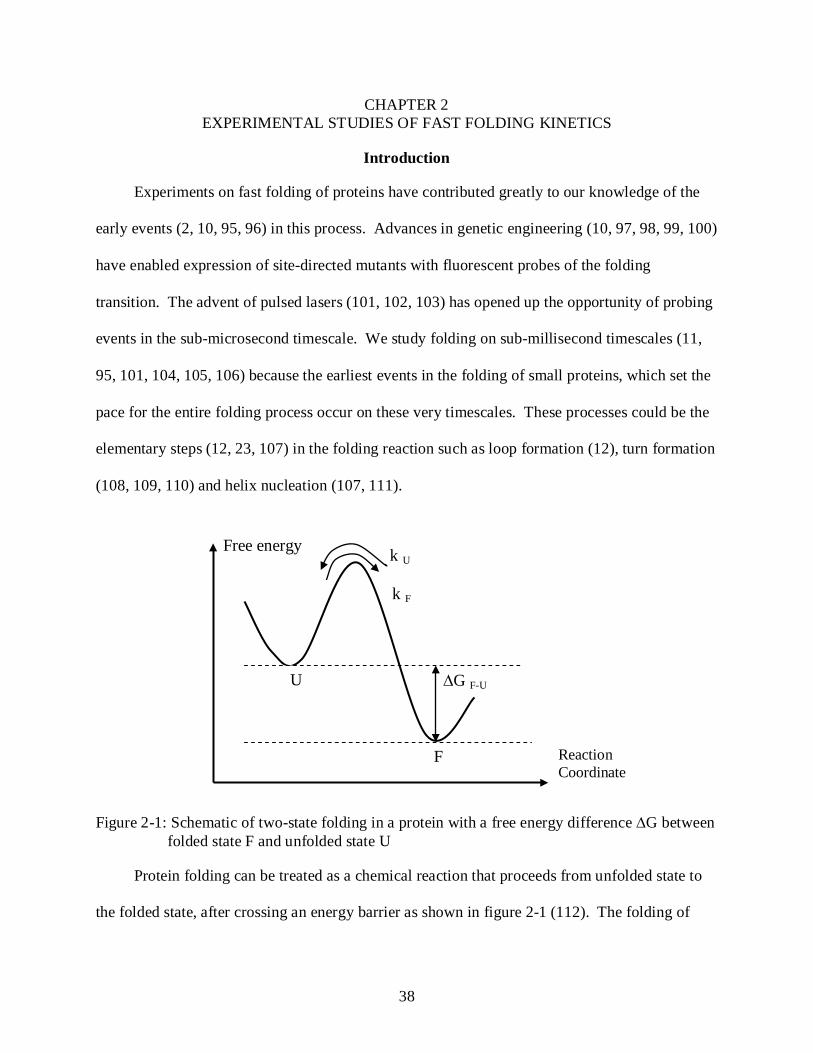
Figure 2-1: Schematic of two-state folding in a protein with a free energy difference ∆G between folded state F and unfolded state U
Protein folding can be treated as a chemical reaction that proceeds from unfolded state to
the folded state, after crossing an energy barrier as shown in figure 2-1 (112). The folding of
U
F
∆G F-U
Free energy
Reaction Coordinate
k F
k U

39
many proteins can be treated as a two-state transition where the Gibbs free energy difference
between unfolded state U and folded state F is ∆GF-U
In addition, the rates of folding and unfolding are kF and kU respectively (113)
[2-1]
The equilibrium constant for the folding reaction KUF is given by
)/exp(][][ TkG
kk
UFK BUF
U
FmequilibriuFU →→ ∆−=== [2-2]
Here kB is the Boltzmann constant and T is the temperature in Kelvin. At any time t, the
rate of change of population of folded molecules [F] is given by
][][][ FkUkdtFd
UF −= [2-3]
Since the total population of protein is fixed to C, the Eq. 2-3 can be written as
))exp(1))(/((][][
)exp()}exp(]{[
;)]0([
);exp()}exp(]{[
)exp()exp(]}[{
][][)(
])[(][]}[{][][][
0
0
0
tkkCkFF
dttCktFd
FtF
tCktFdtd
tCktFdtd
CkFdtFd
kkk
FkkCkFkFCkdtFd
FUC
UFF
t
F
F
F
F
F
F
observedUF
UFFUF
o
λ
λλ
λλ
λλλ
λ
λ
−−++=
=
==
=
=+
=+
=+=
+−=−−=
+=
∫∫
[2-4]
U F kF
kU
40
The solution for this differential equation is a single exponential with relaxation rate λ.
For a known free energy of unfolding ∆G and observed relaxation rate λ, the folding and
unfolding rates (kF, kU) can be determined. Experiments designed to determine λ usually employ
chemical, optical or thermal means to destabilize the protein from its folded state, and then probe
its relaxation back to equilibrium. We shall first review the commonly used probes of
conformational change in proteins and then review commonly used techniques to trigger
conformational change of the protein.
Probes of Conformational Change in Proteins
When electromagnetic radiation is incident on a sample, the properties of the radiation that
emerge from the sample can provide structural information about the sample. The simplest
measurable property is the fraction of excitation absorbed (optical absorption). Radiation
emitted by a sample at wavelengths other than the excitation wavelength can also be monitored
(i.e. fluorescence, phosphorescence and Raman scattering). Circular dichroism is the
phenomenon of differential absorption of left and right circularly polarized light by chiral
molecules. We use circular dichroism spectroscopy to determine the secondary structure content
of the IA3 peptide and tryptophan zipper in different solvent conditions, and time-resolved
fluorescence spectroscopy to measure the folding kinetics of these proteins.
Fluorescence and Triplet Absorption Spectroscopy
A qualitative study of these techniques would require a quantum mechanical description of
the electronic states of the molecules in the sample before and after their interaction with the
radiation (114). If we assume two states a and b described by the wave-functions ψa and ψb,
respectively, the intensity of emission or absorption associated with a transition between these
two states depends on the transition dipole moment defined by ab ψµψ ~ and the magnitude of
41
the incident electric field that induces an electric dipole moment µ in the sample. The energy
gap and subsequently the wavelength of maximal absorption between these two states is a
consequence (114) of this interaction between electric field of incident light and sample.
Different electronic transitions in proteins and polypeptides (115) give rise to their unique
absorption spectra. A transition from the ground state to the excited π state (ππ*) occurs in
the long-wave region while the presence of heteroatoms such as nitrogen, oxygen or sulphur
enables nσ* and nπ* transitions. The delocalization of pi electrons also results in a unique
spectral response.
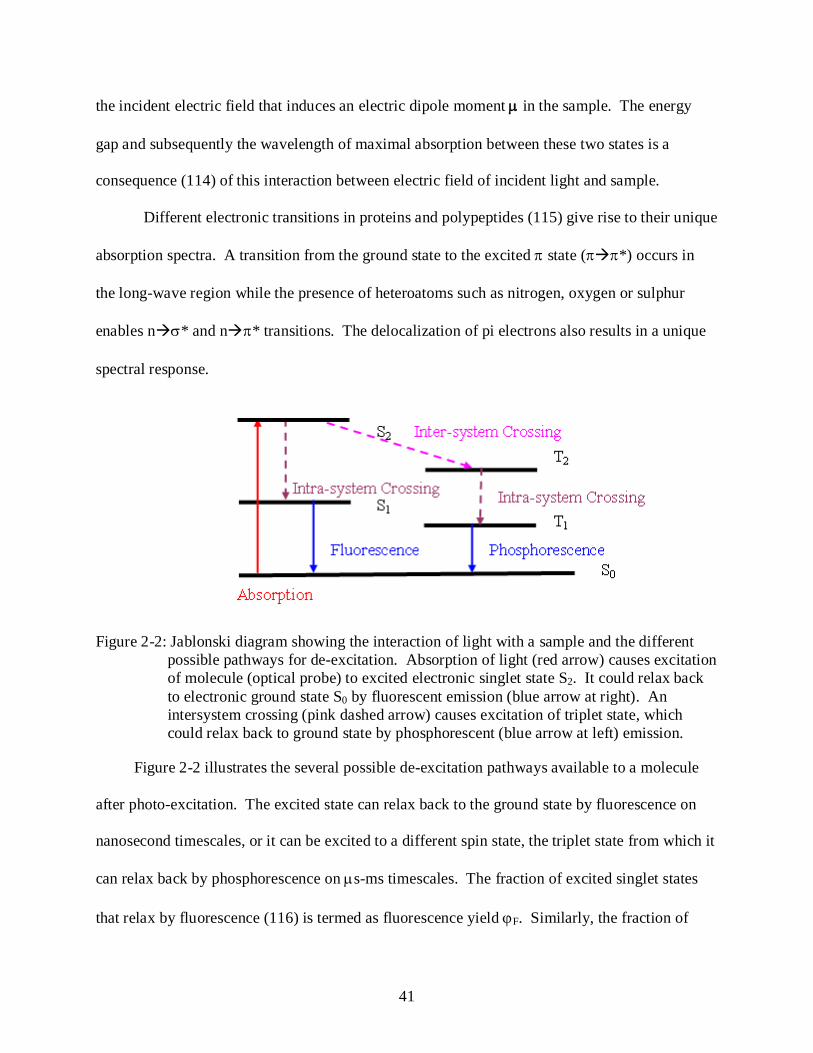
Figure 2-2: Jablonski diagram showing the interaction of light with a sample and the different possible pathways for de-excitation. Absorption of light (red arrow) causes excitation of molecule (optical probe) to excited electronic singlet state S2. It could relax back to electronic ground state S0 by fluorescent emission (blue arrow at right). An intersystem crossing (pink dashed arrow) causes excitation of triplet state, which could relax back to ground state by phosphorescent (blue arrow at left) emission.
Figure 2-2 illustrates the several possible de-excitation pathways available to a molecule
after photo-excitation. The excited state can relax back to the ground state by fluorescence on
nanosecond timescales, or it can be excited to a different spin state, the triplet state from which it
can relax back by phosphorescence on µs-ms timescales. The fraction of excited singlet states
that relax by fluorescence (116) is termed as fluorescence yield ϕF. Similarly, the fraction of
42
excited singlet states that are converted to excited triplet states is termed triplet yield ϕT. The
violation of spin conservation principles in the singlet-triplet conversion results in a low
probability of phosphorescent emission, and thus low phosphorescence intensity and a long
triplet relaxation lifetime (115). De-excitation of these excited states occurs by an electron -
transfer mechanism after diffusion-limited collision with oxygen triplet and other quenchers in
solvent. The triplet state lifetime of a molecule can be employed as a sensitive and specific
probe of collisional quenching. We employ this strategy in our measurements of contact
formation in polypeptides (chapter 3).
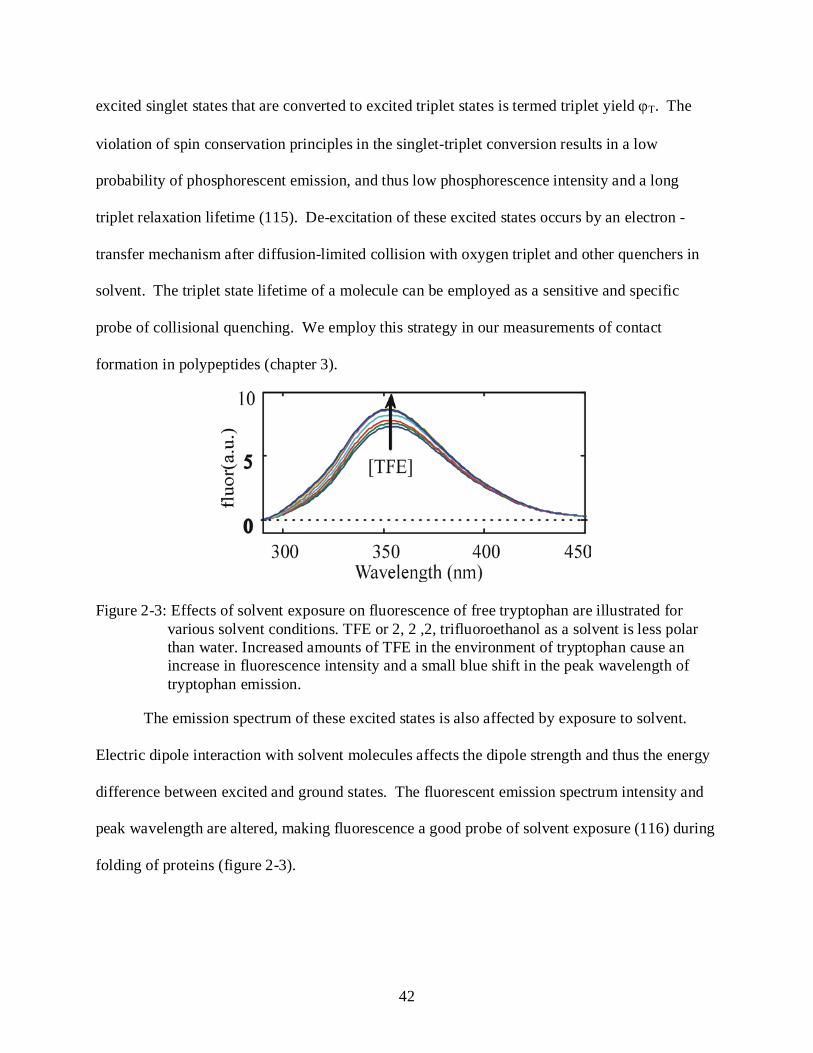
Figure 2-3: Effects of solvent exposure on fluorescence of free tryptophan are illustrated for
various solvent conditions. TFE or 2, 2 ,2, trifluoroethanol as a solvent is less polar than water. Increased amounts of TFE in the environment of tryptophan cause an increase in fluorescence intensity and a small blue shift in the peak wavelength of tryptophan emission.
The emission spectrum of these excited states is also affected by exposure to solvent.
Electric dipole interaction with solvent molecules affects the dipole strength and thus the energy
difference between excited and ground states. The fluorescent emission spectrum intensity and
peak wavelength are altered, making fluorescence a good probe of solvent exposure (116) during
folding of proteins (figure 2-3).
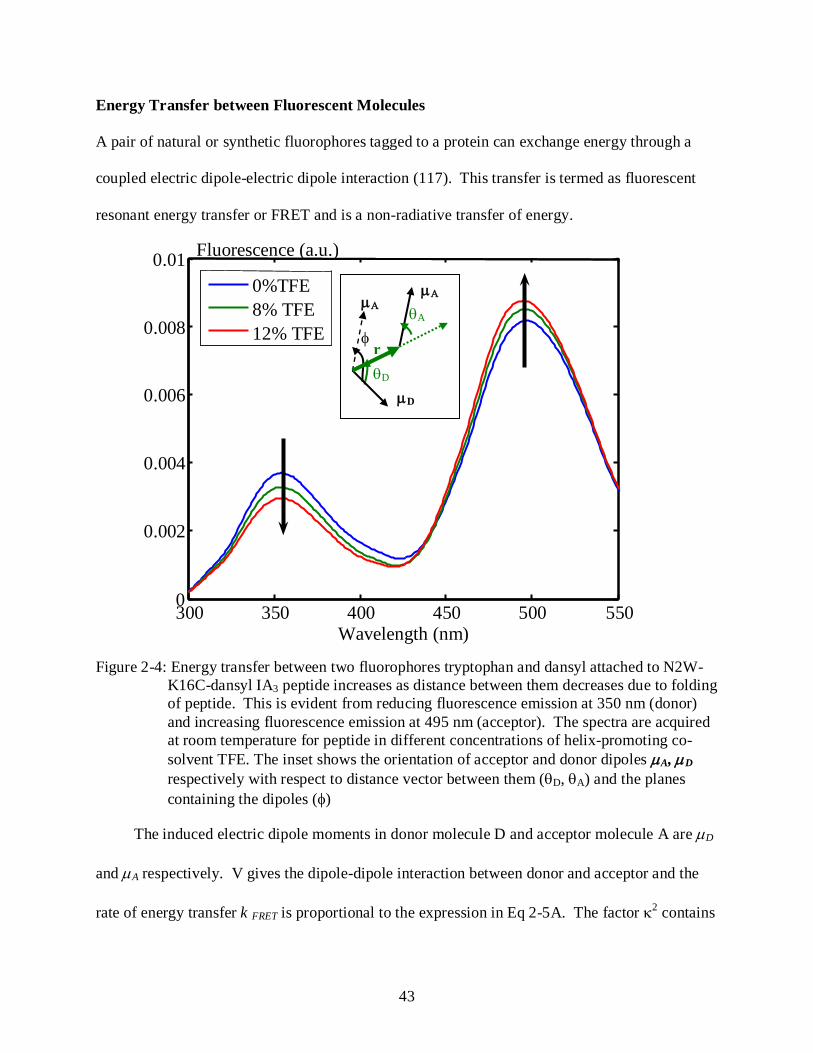
43
300 350 400 450 500 550 0
0.002
0.004
0.006
0.008
0.01
Wavelength (nm)
Fluorescence (a.u.)
0%TFE 8% TFE 12% TFE
θA
r
µD
µΑ
θD
µΑ
φ
Energy Transfer between Fluorescent Molecules
A pair of natural or synthetic fluorophores tagged to a protein can exchange energy through a
coupled electric dipole-electric dipole interaction (117). This transfer is termed as fluorescent
resonant energy transfer or FRET and is a non-radiative transfer of energy.
Figure 2-4: Energy transfer between two fluorophores tryptophan and dansyl attached to N2W-K16C-dansyl IA3 peptide increases as distance between them decreases due to folding of peptide. This is evident from reducing fluorescence emission at 350 nm (donor) and increasing fluorescence emission at 495 nm (acceptor). The spectra are acquired at room temperature for peptide in different concentrations of helix-promoting co-solvent TFE. The inset shows the orientation of acceptor and donor dipoles µA, µD respectively with respect to distance vector between them (θD, θA) and the planes containing the dipoles (φ)
The induced electric dipole moments in donor molecule D and acceptor molecule A are µD
and µA respectively. V gives the dipole-dipole interaction between donor and acceptor and the
rate of energy transfer k FRET is proportional to the expression in Eq 2-5A. The factor κ2 contains
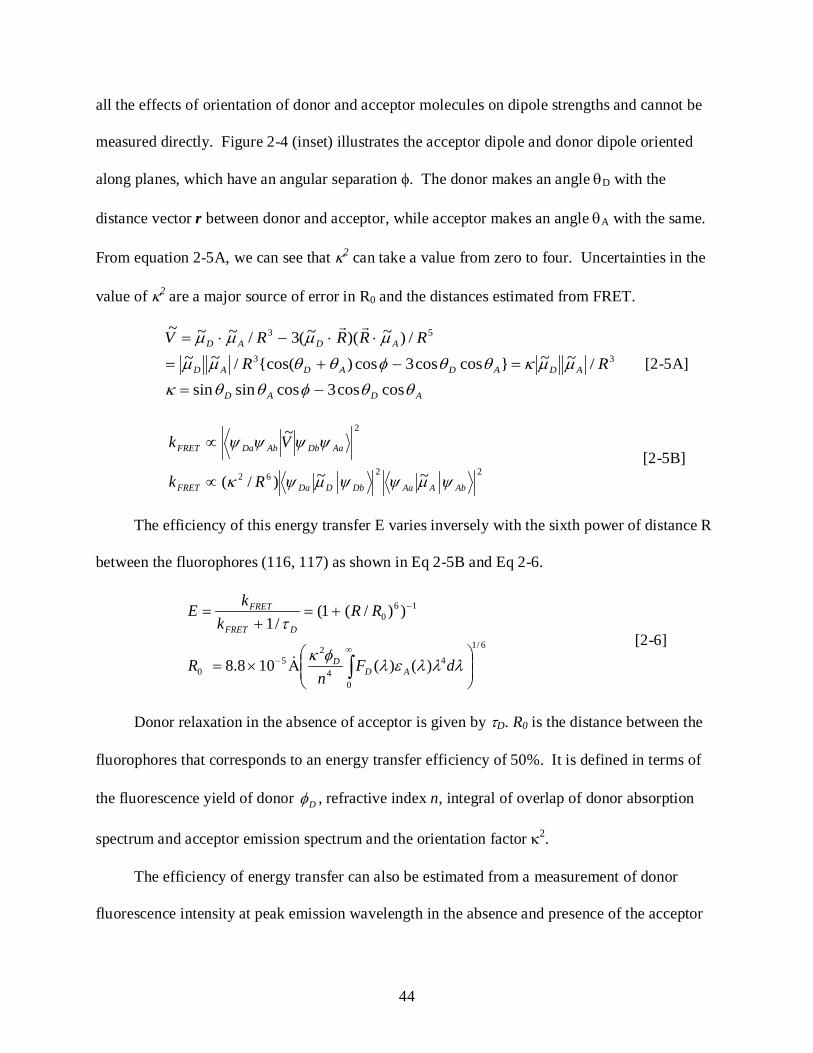
44
all the effects of orientation of donor and acceptor molecules on dipole strengths and cannot be
measured directly. Figure 2-4 (inset) illustrates the acceptor dipole and donor dipole oriented
along planes, which have an angular separation φ. The donor makes an angle θD with the
distance vector r between donor and acceptor, while acceptor makes an angle θA with the same.
From equation 2-5A, we can see that κ2 can take a value from zero to four. Uncertainties in the
value of κ2 are a major source of error in R0 and the distances estimated from FRET.
ADAD
ADADADAD
ADAD
RRRRRRV
θθφθθκµµκθθφθθµµ
µµµµ
coscos3cossinsin/~~}coscos3cos){cos(/~~
/)~)(~(3/~~~
33
53
−=
=−+=
⋅⋅−⋅=
[2-5A]
2262
2
~~)/(
~
AbAAaDbDDaFRET
AaDbAbDaFRET
Rk
Vk
ψµψψµψκ
ψψψψ
∝
∝ [2-5B]
The efficiency of this energy transfer E varies inversely with the sixth power of distance R
between the fluorophores (116, 117) as shown in Eq 2-5B and Eq 2-6.
6/1
0
44
25
0
160
)()(108.8
))/(1(/1
Α×=
+=+
=
∫∞
−
−
λλλελφκ
τ
dFn
R
RRk
kE
ADD
DFRET
FRET
[2-6]
Donor relaxation in the absence of acceptor is given by τD. R0 is the distance between the
fluorophores that corresponds to an energy transfer efficiency of 50%. It is defined in terms of
the fluorescence yield of donor Dφ , refractive index n, integral of overlap of donor absorption
spectrum and acceptor emission spectrum and the orientation factor κ2.
The efficiency of energy transfer can also be estimated from a measurement of donor
fluorescence intensity at peak emission wavelength in the absence and presence of the acceptor
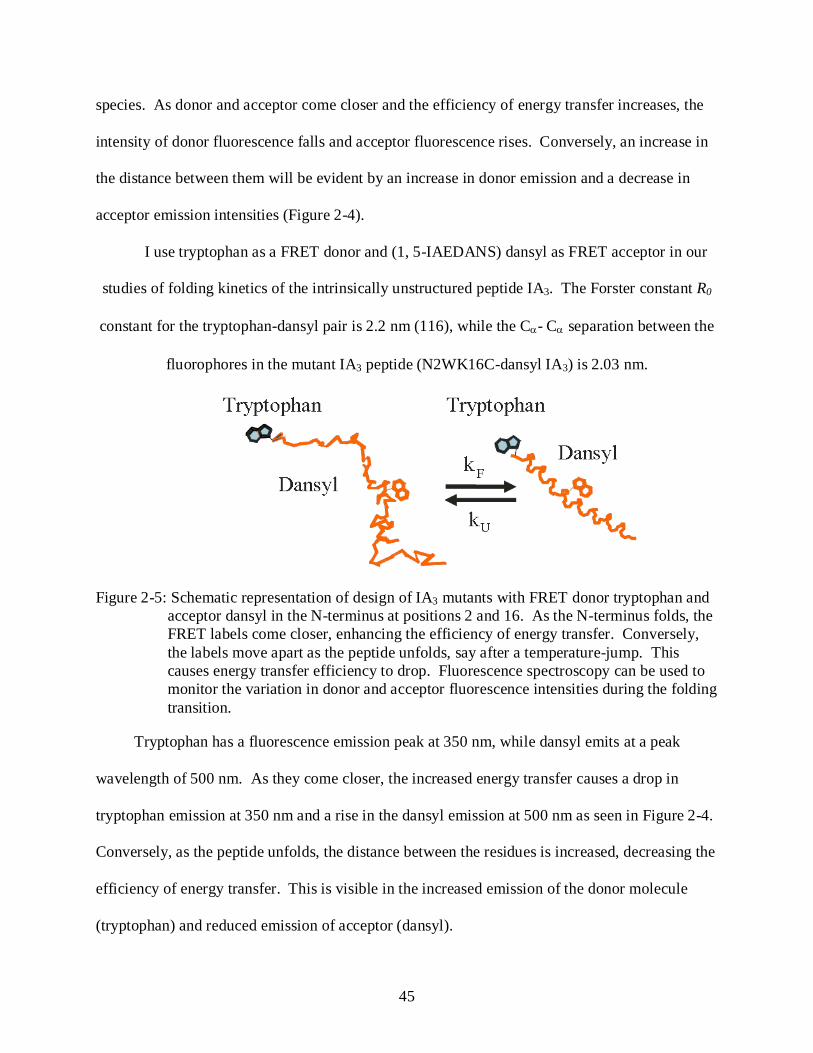
45
species. As donor and acceptor come closer and the efficiency of energy transfer increases, the
intensity of donor fluorescence falls and acceptor fluorescence rises. Conversely, an increase in
the distance between them will be evident by an increase in donor emission and a decrease in
acceptor emission intensities (Figure 2-4).
I use tryptophan as a FRET donor and (1, 5-IAEDANS) dansyl as FRET acceptor in our
studies of folding kinetics of the intrinsically unstructured peptide IA3. The Forster constant R0
constant for the tryptophan-dansyl pair is 2.2 nm (116), while the Cα- Cα separation between the
fluorophores in the mutant IA3 peptide (N2WK16C-dansyl IA3) is 2.03 nm.
Figure 2-5: Schematic representation of design of IA3 mutants with FRET donor tryptophan and acceptor dansyl in the N-terminus at positions 2 and 16. As the N-terminus folds, the FRET labels come closer, enhancing the efficiency of energy transfer. Conversely, the labels move apart as the peptide unfolds, say after a temperature-jump. This causes energy transfer efficiency to drop. Fluorescence spectroscopy can be used to monitor the variation in donor and acceptor fluorescence intensities during the folding transition.
Tryptophan has a fluorescence emission peak at 350 nm, while dansyl emits at a peak
wavelength of 500 nm. As they come closer, the increased energy transfer causes a drop in
tryptophan emission at 350 nm and a rise in the dansyl emission at 500 nm as seen in Figure 2-4.
Conversely, as the peptide unfolds, the distance between the residues is increased, decreasing the
efficiency of energy transfer. This is visible in the increased emission of the donor molecule
(tryptophan) and reduced emission of acceptor (dansyl).

46
To study the binding interaction of IA3 with YPrA, we used an acceptor only tagged IA3
mutant peptide (K16C-dansyl IA3), as the YPrA has four naturally occurring tryptophan residues
near the IA3 binding site (118). In the crystal structure of the IA3-YPrA complex, three of the
tryptophan residues (W39, W190 and W241) are within the Förster distance of residue 16 of IA3
peptide. Residue W181 lies at a distance of 2.8 nm away (Figure 2-6).
Figure 2-6: View of the inhibition complex of YPrA (blue) with IA3 (gray) based on crystal structure data (76). The N-terminal residues form a helix, with cysteine of K16C mutant shown in orange. The tryptophan residues of YPrA near the active site are shown in red.
Collection of Fluorescence Spectra
All equilibrium fluorescence data for our experiments are acquired on a JASCO FP-750
spectropolarimeter. Lyophilized protein is dissolved in 50 mM sodium phosphate (pH 7.0) to
make a buffered solution with ~ 15-20 µM protein. This solution is taken in a cell with an
optical path length of 10 mm. Fluorescence spectra are acquired over wavelengths 260-500 nm
after excitation by light of wavelength of 266 nm. Sample temperature can be controlled to a
47
precision of ± 0.1oC with the use of a circulating water bath (Neslab). All samples are sealed to
eliminate evaporation loss and stirred continuously during data acquisition.
Circular Dichroism Spectroscopy
We understand fluorescence in terms of the electric effects of light incident on the sample.
The effects of the magnetic field of the incident light wave are negligibly small in such cases.
There are molecules in which magnetic effects due to the oscillating magnetic field of the
incident radiation (114) induces a substantial magnetic dipole m. Both the electric dipole µ and
magnetic dipole m act on the wave functions representing the electronic states giving rise to the
phenomenon of optical activity. Circular dichroism is one manifestation of optical activity.
Circular dichroism (CD) is the phenomenon of differential absorbance of left and right
circularly polarized light by an optically active sample. If a beam of light is incident on a sample
that absorbs right and left circularly polarized light equally, there is no effect on the polarization
state of the transmitted light. When the left and right circularly polarized light waves are
differentially absorbed however, an elliptical polarized light wave is obtained. Therefore, CD
measurements are measurements of the ellipticity of resultant polarized light. The minor and
major axes of the ellipse traced by the resultant light wave (electric field vector E
with
subscripts L and R for left and right circular polarization) depend on the extinction coefficients
for left and right circularly polarized light εL and εR respectively, as in Equation. 2-7. The
intensity of the left and right polarized light is proportional to the magnitude of the
corresponding electric field vector as shown in equation 2-7. The intensity of signal after
differential absorption can be estimated from the extinction coefficients for the left and right
circularly polarized light , protein concentration C and optical path length l respectively. Values
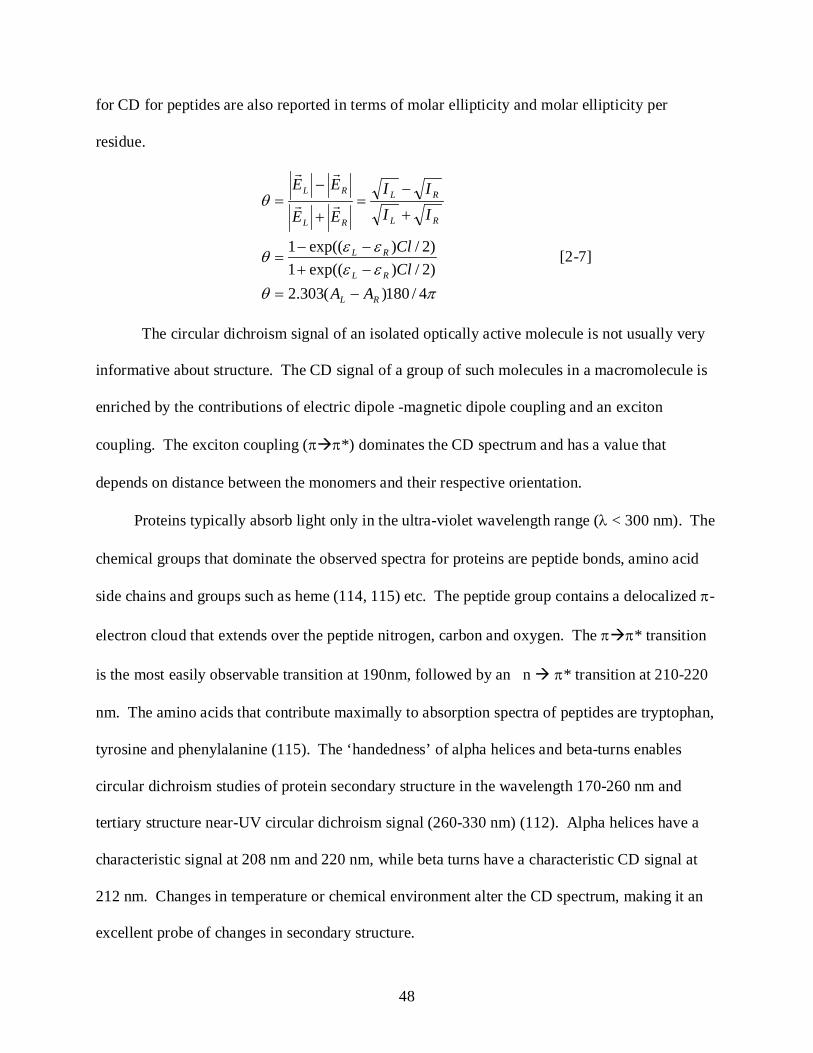
48
for CD for peptides are also reported in terms of molar ellipticity and molar ellipticity per
residue.
πθεεεε
θ
θ
4/180)(303.2)2/)exp((1)2/)exp((1
RL
RL
RL
RL
RL
RL
RL
AAClCl
IIII
EE
EE
−=−+−−
=
+
−=
+
−=
[2-7]
The circular dichroism signal of an isolated optically active molecule is not usually very
informative about structure. The CD signal of a group of such molecules in a macromolecule is
enriched by the contributions of electric dipole -magnetic dipole coupling and an exciton
coupling. The exciton coupling (ππ*) dominates the CD spectrum and has a value that
depends on distance between the monomers and their respective orientation.
Proteins typically absorb light only in the ultra-violet wavelength range (λ < 300 nm). The
chemical groups that dominate the observed spectra for proteins are peptide bonds, amino acid
side chains and groups such as heme (114, 115) etc. The peptide group contains a delocalized π-
electron cloud that extends over the peptide nitrogen, carbon and oxygen. The ππ* transition
is the most easily observable transition at 190nm, followed by an n π* transition at 210-220
nm. The amino acids that contribute maximally to absorption spectra of peptides are tryptophan,
tyrosine and phenylalanine (115). The ‘handedness’ of alpha helices and beta-turns enables
circular dichroism studies of protein secondary structure in the wavelength 170-260 nm and
tertiary structure near-UV circular dichroism signal (260-330 nm) (112). Alpha helices have a
characteristic signal at 208 nm and 220 nm, while beta turns have a characteristic CD signal at
212 nm. Changes in temperature or chemical environment alter the CD spectrum, making it an
excellent probe of changes in secondary structure.
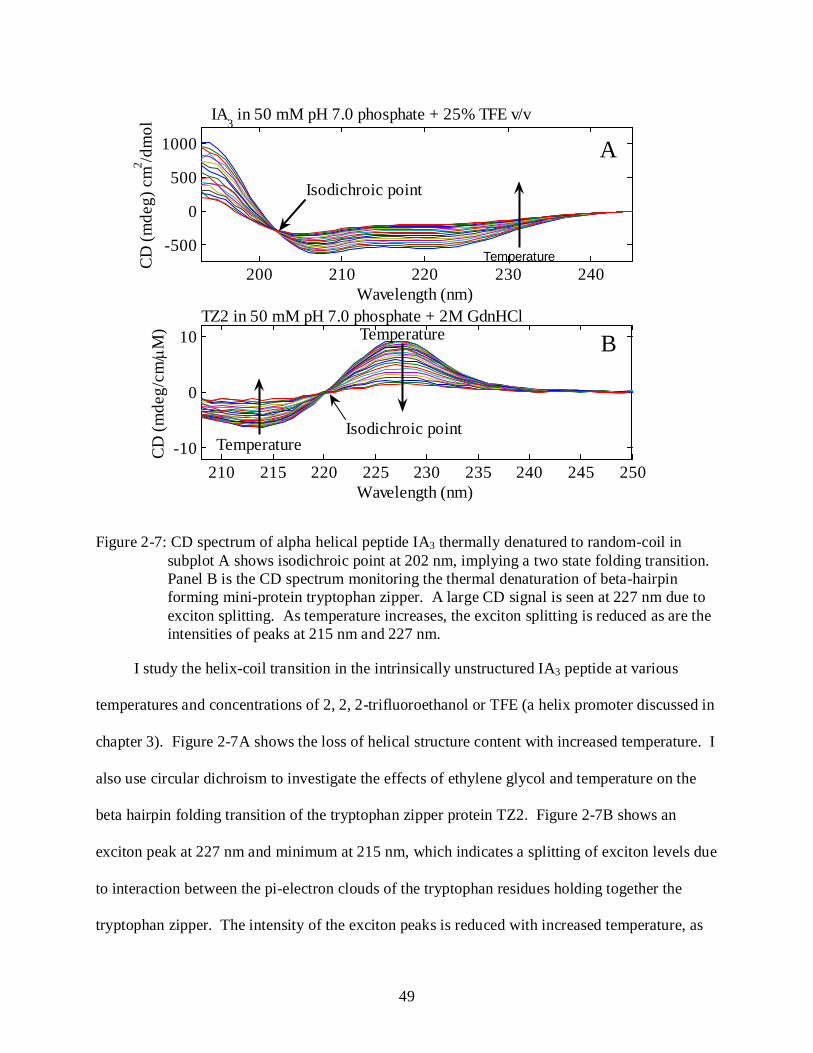
49
200 210 220 230 240
-500
0
500
1000
Wavelength (nm)
CD (m
deg)
cm2 /d
mol
210 215 220 225 230 235 240 245 250-10
0
10
Wavelength (nm)
CD (m
deg/
cm/µ
M)
Temperature
Isodichroic point
A
B
Temperature
Temperature
Isodichroic point
TZ2 in 50 mM pH 7.0 phosphate + 2M GdnHCl
IA3 in 50 mM pH 7.0 phosphate + 25% TFE v/v
Figure 2-7: CD spectrum of alpha helical peptide IA3 thermally denatured to random-coil in subplot A shows isodichroic point at 202 nm, implying a two state folding transition. Panel B is the CD spectrum monitoring the thermal denaturation of beta-hairpin forming mini-protein tryptophan zipper. A large CD signal is seen at 227 nm due to exciton splitting. As temperature increases, the exciton splitting is reduced as are the intensities of peaks at 215 nm and 227 nm.
I study the helix-coil transition in the intrinsically unstructured IA3 peptide at various
temperatures and concentrations of 2, 2, 2-trifluoroethanol or TFE (a helix promoter discussed in
chapter 3). Figure 2-7A shows the loss of helical structure content with increased temperature. I
also use circular dichroism to investigate the effects of ethylene glycol and temperature on the
beta hairpin folding transition of the tryptophan zipper protein TZ2. Figure 2-7B shows an
exciton peak at 227 nm and minimum at 215 nm, which indicates a splitting of exciton levels due
to interaction between the pi-electron clouds of the tryptophan residues holding together the
tryptophan zipper. The intensity of the exciton peaks is reduced with increased temperature, as
50
TZ2 unfolds. The CD curves for the thermal transition of IA3 and TZ2 intersect at a single
wavelength, termed as isodichroic wavelength. The presence of an isodichroic point is indicative
of a two-state folding transition in proteins.
Collection of CD spectra
Spectra were collected on an AVIV-202 CD spectropolarimeter at wavelengths 195-240
nm in a 1cm path length cell over temperatures 5-85oC (5oC increments). A reference spectrum
(solvent) was subtracted from each sample spectrum as a background correction. Equilibrium
far-UV circular dichroism (CD) spectra were collected for all IA3 peptides at ~ 15 µM
concentration in 50 mM pH 7.0 phosphate buffer and 0-25% TFE v/v (increments of 5% TFE
v/v). I acquire circular dichroism data for 32 µM TZ2 in 50 mM pH 7.0 phosphate buffer with
varying concentrations of ethylene glycol (percentage by weight) from 0-50% in increments of
12.5% by weight over temperatures 5-95oC and wavelengths 200-260 nm.
Tryptophan Photo-physics
The projects discussed in this dissertation focus on studies of peptides that have tryptophan
as a probe of conformational change during the folding transition of the peptide under different
experimental conditions. We briefly review the properties of tryptophan that make it an
excellent spectroscopic probe for our experiments.
The side chain of the amino acid tryptophan is an indole molecule with a substitution at the
third carbon atom as shown in figure 2-8. It has ten π electrons delocalized about the aromatic
groups, and a nitrogen atom that contribute to a complex absorption spectrum. A peak at 280 nm
with a wing at 271-273 nm (115) characterizes its absorption spectrum. The fluorescence
spectrum is broad, featureless and centered around 348-350 nm. The fluorescence quantum yield
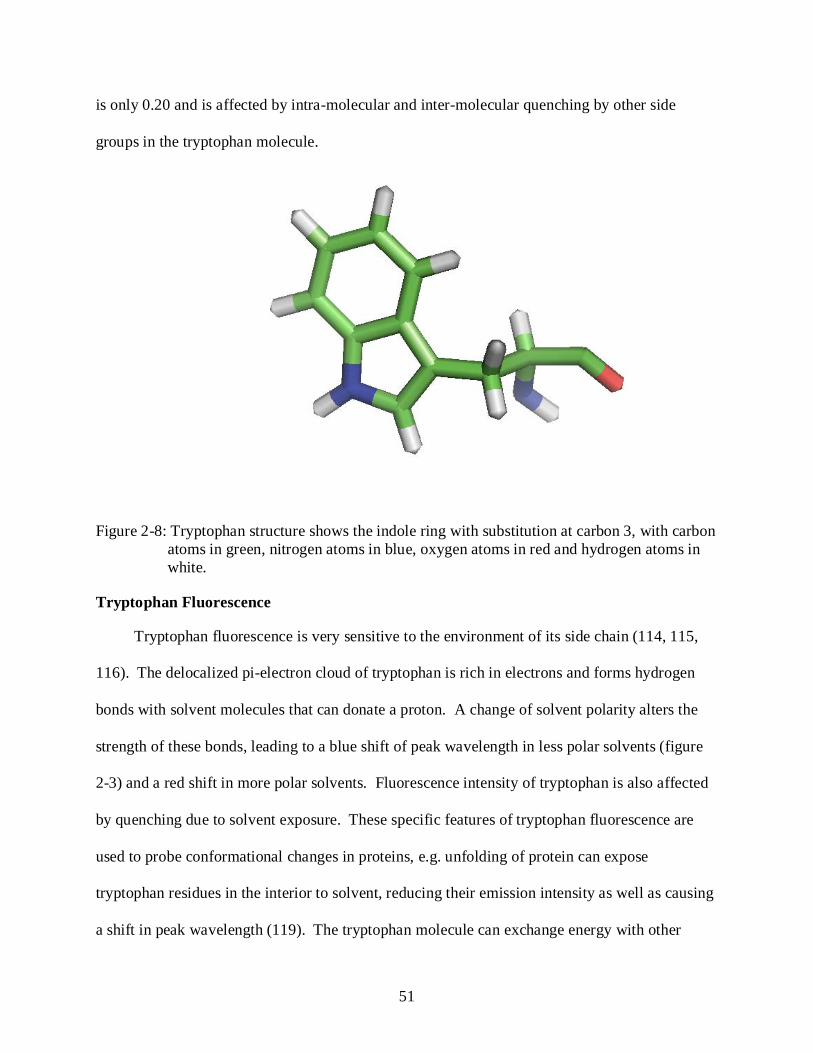
51
is only 0.20 and is affected by intra-molecular and inter-molecular quenching by other side
groups in the tryptophan molecule.
Figure 2-8: Tryptophan structure shows the indole ring with substitution at carbon 3, with carbon atoms in green, nitrogen atoms in blue, oxygen atoms in red and hydrogen atoms in white.
Tryptophan Fluorescence
Tryptophan fluorescence is very sensitive to the environment of its side chain (114, 115,
116). The delocalized pi-electron cloud of tryptophan is rich in electrons and forms hydrogen
bonds with solvent molecules that can donate a proton. A change of solvent polarity alters the
strength of these bonds, leading to a blue shift of peak wavelength in less polar solvents (figure
2-3) and a red shift in more polar solvents. Fluorescence intensity of tryptophan is also affected
by quenching due to solvent exposure. These specific features of tryptophan fluorescence are
used to probe conformational changes in proteins, e.g. unfolding of protein can expose
tryptophan residues in the interior to solvent, reducing their emission intensity as well as causing
a shift in peak wavelength (119). The tryptophan molecule can exchange energy with other
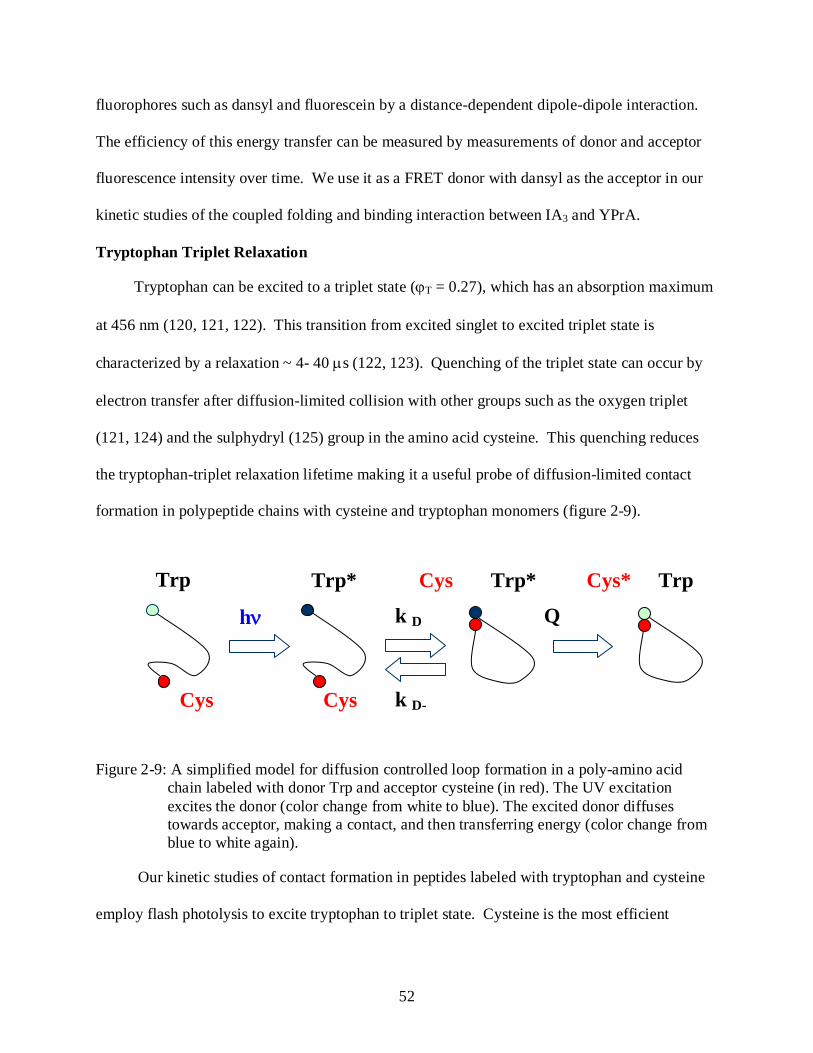
52
fluorophores such as dansyl and fluorescein by a distance-dependent dipole-dipole interaction.
The efficiency of this energy transfer can be measured by measurements of donor and acceptor
fluorescence intensity over time. We use it as a FRET donor with dansyl as the acceptor in our
kinetic studies of the coupled folding and binding interaction between IA3 and YPrA.
Tryptophan Triplet Relaxation
Tryptophan can be excited to a triplet state (ϕT = 0.27), which has an absorption maximum
at 456 nm (120, 121, 122). This transition from excited singlet to excited triplet state is
characterized by a relaxation ~ 4- 40 µs (122, 123). Quenching of the triplet state can occur by
electron transfer after diffusion-limited collision with other groups such as the oxygen triplet
(121, 124) and the sulphydryl (125) group in the amino acid cysteine. This quenching reduces
the tryptophan-triplet relaxation lifetime making it a useful probe of diffusion-limited contact
formation in polypeptide chains with cysteine and tryptophan monomers (figure 2-9).
Figure 2-9: A simplified model for diffusion controlled loop formation in a poly-amino acid chain labeled with donor Trp and acceptor cysteine (in red). The UV excitation excites the donor (color change from white to blue). The excited donor diffuses towards acceptor, making a contact, and then transferring energy (color change from blue to white again).
Our kinetic studies of contact formation in peptides labeled with tryptophan and cysteine
employ flash photolysis to excite tryptophan to triplet state. Cysteine is the most efficient
Trp* Trp* Trp
hν
Trp
k D-
k D
Q
Cys Cys
Cys Cys*
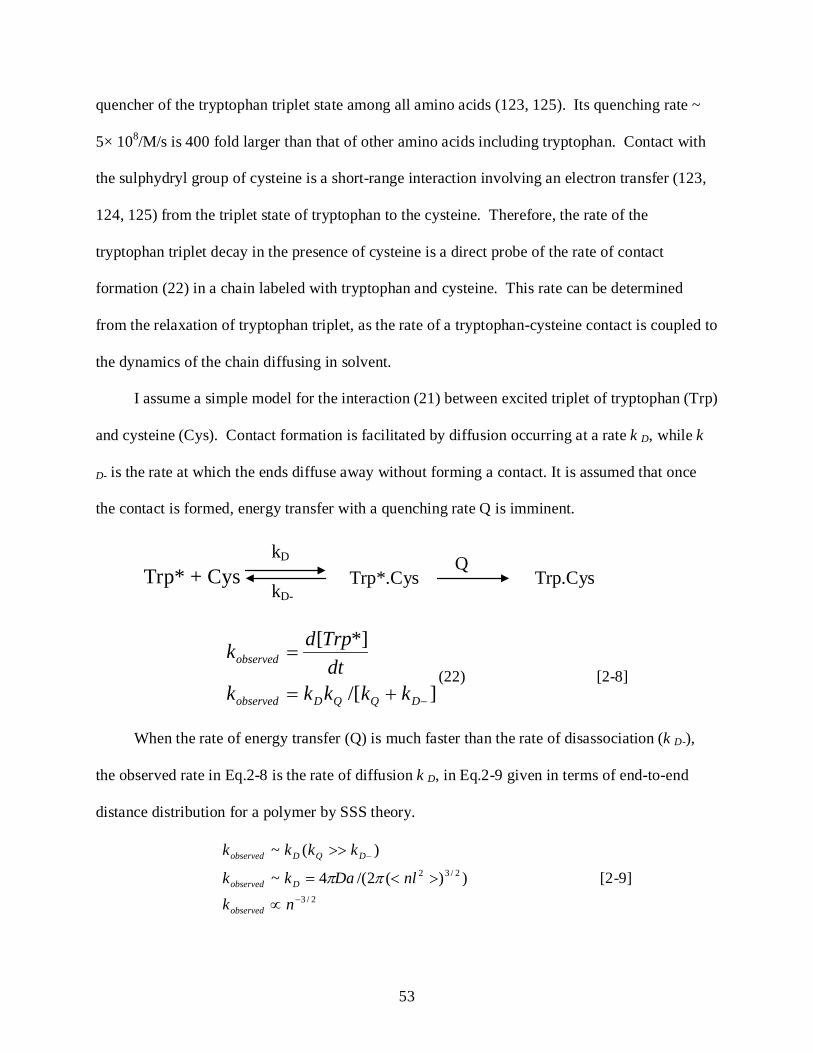
53
quencher of the tryptophan triplet state among all amino acids (123, 125). Its quenching rate ~
5× 10⁸/M/s is 400 fold larger than that of other amino acids including tryptophan. Contact with
the sulphydryl group of cysteine is a short-range interaction involving an electron transfer (123,
124, 125) from the triplet state of tryptophan to the cysteine. Therefore, the rate of the
tryptophan triplet decay in the presence of cysteine is a direct probe of the rate of contact
formation (22) in a chain labeled with tryptophan and cysteine. This rate can be determined
from the relaxation of tryptophan triplet, as the rate of a tryptophan-cysteine contact is coupled to
the dynamics of the chain diffusing in solvent.
I assume a simple model for the interaction (21) between excited triplet of tryptophan (Trp)
and cysteine (Cys). Contact formation is facilitated by diffusion occurring at a rate k D, while k
D- is the rate at which the ends diffuse away without forming a contact. It is assumed that once
the contact is formed, energy transfer with a quenching rate Q is imminent.
]/[
*][
−+=
=
DQQDobserved
observed
kkkkkdt
Trpdk(22) [2-8]
When the rate of energy transfer (Q) is much faster than the rate of disassociation (k D-),
the observed rate in Eq.2-8 is the rate of diffusion k D, in Eq.2-9 given in terms of end-to-end
distance distribution for a polymer by SSS theory.
2/3
2/32 ))(2/(4~
)(~
−
−
∝
><=
>>
nknlDakk
kkkk
observed
Dobserved
DQDobserved
ππ [2-9]
Trp* + Cys kD-
Trp*.Cys kD
Trp.Cys Q
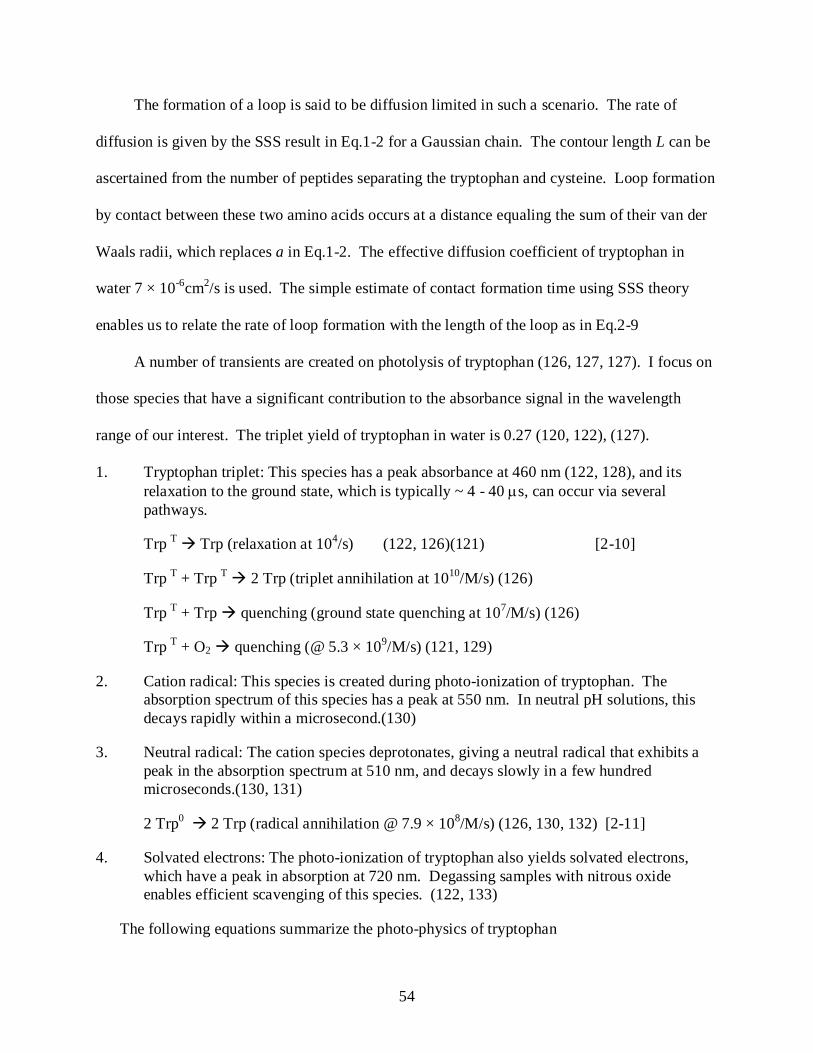
54
The formation of a loop is said to be diffusion limited in such a scenario. The rate of
diffusion is given by the SSS result in Eq.1-2 for a Gaussian chain. The contour length L can be
ascertained from the number of peptides separating the tryptophan and cysteine. Loop formation
by contact between these two amino acids occurs at a distance equaling the sum of their van der
Waals radii, which replaces a in Eq.1-2. The effective diffusion coefficient of tryptophan in
water 7 × 10⁻⁶cm2/s is used. The simple estimate of contact formation time using SSS theory
enables us to relate the rate of loop formation with the length of the loop as in Eq.2-9
A number of transients are created on photolysis of tryptophan (126, 127, 127). I focus on
those species that have a significant contribution to the absorbance signal in the wavelength
range of our interest. The triplet yield of tryptophan in water is 0.27 (120, 122), (127).
1. Tryptophan triplet: This species has a peak absorbance at 460 nm (122, 128), and its relaxation to the ground state, which is typically ~ 4 - 40 µs, can occur via several pathways.
Trp T Trp (relaxation at 104/s) (122, 126)(121) [2-10]
Trp T + Trp T 2 Trp (triplet annihilation at 1010/M/s) (126)
Trp T + Trp quenching (ground state quenching at 107/M/s) (126)
Trp T + O2 quenching (@ 5.3 × 10⁹/M/s) (121, 129)
2. Cation radical: This species is created during photo-ionization of tryptophan. The absorption spectrum of this species has a peak at 550 nm. In neutral pH solutions, this decays rapidly within a microsecond.(130)
3. Neutral radical: The cation species deprotonates, giving a neutral radical that exhibits a peak in the absorption spectrum at 510 nm, and decays slowly in a few hundred microseconds.(130, 131)
2 Trp0 2 Trp (radical annihilation @ 7.9 × 10⁸/M/s) (126, 130, 132) [2-11]
4. Solvated electrons: The photo-ionization of tryptophan also yields solvated electrons, which have a peak in absorption at 720 nm. Degassing samples with nitrous oxide enables efficient scavenging of this species. (122, 133)
The following equations summarize the photo-physics of tryptophan
55
Trp Trp* Trp+ + e- (photo-ionization) (126, 130, 133) [2-12]
(Excitation) Cation radical) (Solvated electrons)
Trp+ Trp0 + H+ (Deprotonation) [2-13]
(Neutral radical) (Protons) (122, 131, 132)
Trp Trp T (Inter-system crossing after excitation) [2-14]
In experiments, [Trp] ~ 100 µM, the ground state quenching mechanism occurs on a
timescale of milliseconds, when the processes of interest to us occur in the microsecond scale.
The kinetics of relaxation of the tryptophan triplet and the neutral radical are discussed in detail
in chapter 5.
Techniques Used to Study Protein Folding Kinetics
Mixing
This is one of the oldest techniques used to study folding of proteins. A protein in highly
destabilizing solvent conditions is mixed with a buffer, favoring refolding of protein. The
kinetics of relaxation of protein to the new equilibrium is probed by an optical probe, such as
fluorescence, circular dichroism etc (134). The time resolution of this technique is limited by the
time of mixing, which is rarely faster than a few tens of microseconds (135). Continuous flow
mixing has enabled the detection and characterization of intermediates along the folding pathway
of proteins such as cytochrome c.
Flash Photolysis
A laser pulse can be used to trigger a photochemical change, with the wavelength chosen
to specifically excite molecules in the protein that serve as optical probes of the folding
transition. This photochemical change could be a rupture of specific bonds or fast electron
transfer that leads protein to the native state. While flash photolysis has been around for a long
while, nanosecond and femtosecond pulsed lasers allow studies of sub- microsecond events in
56
folding. The earliest such study was conducted on a complex of cytochrome c protein (11) and
carbon monoxide, which was photo-disassociated by a laser pulse. The release of the carbon
monoxide that binds preferentially to the heme group allows the heme group to bind to other
ligands in the protein. This enables observation and measurement of rates of initial formation of
contacts as protein samples its conformational space. Recent studies of contact formation in
polypeptide chains have employed flash photolysis methods to excite triplet states whose
relaxation (22, 24, 136, 137, 138) enables an observation of the dynamics of a disordered
polypeptide chain.
We use flash photolysis triggered energy transfer between tryptophan and cysteine in a
polypeptide chain to monitor intra-chain diffusion, discussed in chapter 5. A flash of UV light
excites the tryptophan molecule to the triplet state, which can be detected through its visible
absorption. Quenching of the triplet state by collisional contact with the sulphydryl group of
cysteine enables an actual measurement of contact formation in the chain. The acquisition of
time-resolved absorption spectra provides information about the relaxation of the excited triplet
state, which is linked to conformational dynamics of the polypeptide chain. Our transient
absorption spectroscopy system (figure 2-10) monitors tryptophan triplet relaxation over
wavelengths 400-700 nm with nanosecond time resolution on sub-millisecond timescales.
Sample is excited by a laser pulse (λ = 289 nm, pulse width 7 ns) that is generated by Stimulated
Raman emission in hydrogen gas at 650 psig pumped by the fourth harmonic of Nd: YAG laser
at λ = 266 nm. A xenon flash lamp (λ = 400-700 nm) probes the excitation volume at a
programmable time delay τD after the excitation. A kinetic profile of triplet relaxation can be
obtained for values of τD from a few nanoseconds to a millisecond.
The system consists of the following elements
57
• Excitation and probe optics • Sample preparation • Spectral data acquisition
Excitation System:
The 266 nm fourth harmonic of Nd: YAG laser (Spectra Physics INDI-50-10, 5Hz, 5-7ns)
induces stimulated Raman emission in deuterium gas at a pressure of 650 psig in Raman cell
(Light Age PAL-101 RC). The first Stokes shift at this wavelength for deuterium is 2991 cm-1,
providing an output at wavelength of 289 nm. The two wavelengths are separated using two
Pellin Broca prisms, following which the 289 nm beam is focused onto the sample cell using a
long focus( f = +50 cm) fused silica lens. The size of the UV spot on sample at focus is 2.12
mm. Typical energy of this excitation beam is 1-1.6 mJ/pulse.
Probe System
A xenon flash lamp (EG &G) provides a flash of visible light (400-700 nm) at time τD
after the pump beam. The time delay between probe pulse and pump pulse is varied from 10 ns –
10 ms by the use of a Lab-view program that controls a SRS DG535 delay generator whose
output signals externally trigger the flash lamp trigger and laser Q switch trigger. A combination
of beam-splitters and mirrors yields two probe beams, which are focused onto sample. One of
these beams is focused onto the excitation volume of sample, while the other beam is focused to
a spot located 5 mm below the other. The control track for unphotolyzed sample provides the
reference absorbance intensity I0, with respect to which the transient absorbance I for photolyzed
sample is calculated using Beer-Lambert law }10{ )(0
εClII −=
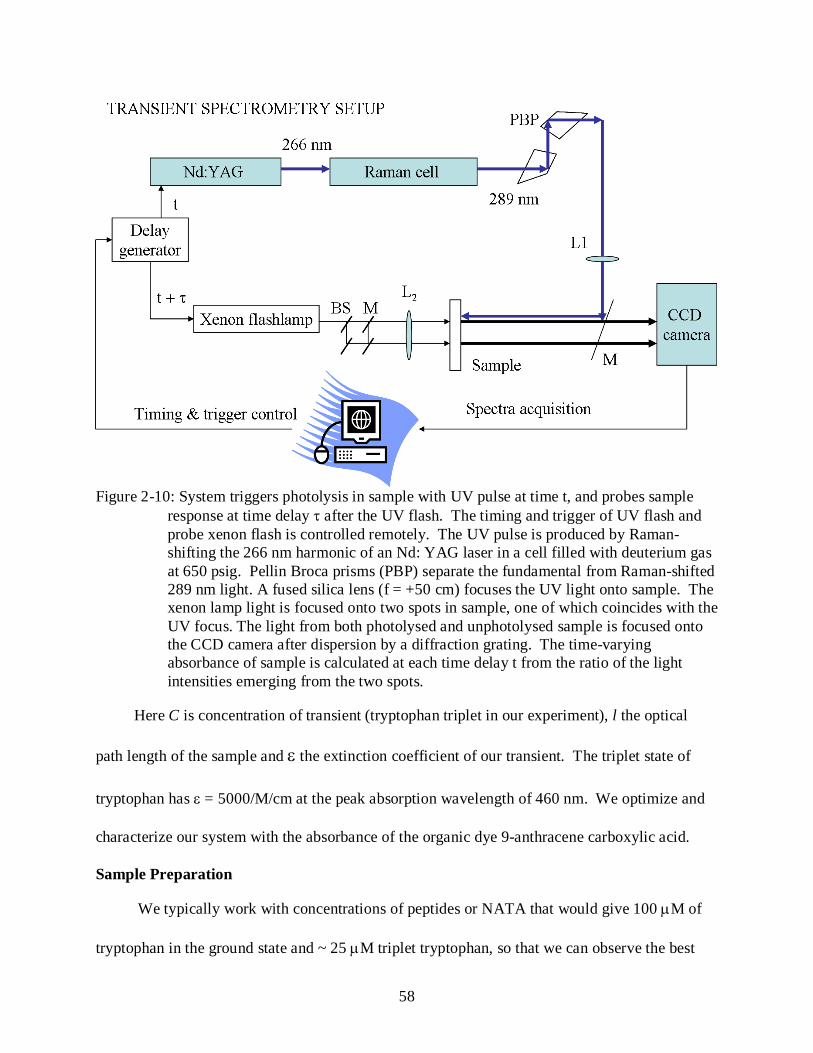
58
Figure 2-10: System triggers photolysis in sample with UV pulse at time t, and probes sample
response at time delay τ after the UV flash. The timing and trigger of UV flash and probe xenon flash is controlled remotely. The UV pulse is produced by Raman-shifting the 266 nm harmonic of an Nd: YAG laser in a cell filled with deuterium gas at 650 psig. Pellin Broca prisms (PBP) separate the fundamental from Raman-shifted 289 nm light. A fused silica lens (f = +50 cm) focuses the UV light onto sample. The xenon lamp light is focused onto two spots in sample, one of which coincides with the UV focus. The light from both photolysed and unphotolysed sample is focused onto the CCD camera after dispersion by a diffraction grating. The time-varying absorbance of sample is calculated at each time delay t from the ratio of the light intensities emerging from the two spots.
Here C is concentration of transient (tryptophan triplet in our experiment), l the optical
path length of the sample and ε the extinction coefficient of our transient. The triplet state of
tryptophan has ε = 5000/M/cm at the peak absorption wavelength of 460 nm. We optimize and
characterize our system with the absorbance of the organic dye 9-anthracene carboxylic acid.
Sample Preparation
We typically work with concentrations of peptides or NATA that would give 100 µM of
tryptophan in the ground state and ~ 25 µM triplet tryptophan, so that we can observe the best
59
signal for tryptophan triplet in a 1 cm optical path length cell. Samples are prepared in 50 mM
pH 7.0 phosphate buffer and purged with nitrous oxide gas for 15-20 minutes prior to data
acquisition. The nitrous oxide scavenges electrons produced (122, 129) during experiment as
their large absorption signal at 720 nm can interfere with the signal under consideration. It also
reduces the concentration of ambient oxygen (129) in sample from 250 µM to ~ 20 µM.
Oxygen is a very efficient quencher (121, 123, 124, 126) of the triplet state of tryptophan.
We also use a glucose oxidase- catalase enzyme system (139) to lower ambient oxygen levels in
the sample to a few µM. Glucose oxidase uses oxygen to break down glucose to give hydrogen
peroxide, which is broken down to water and oxygen by the catalase enzyme. Addition of the
enzymes (~20 nM) a few minutes before the actual experiment bring down oxygen to the levels
where it does not affect the kinetics of tryptophan triplet relaxation. We also add a layer of
mineral oil on top of sample to prevent any sample interaction with oxygen in atmospheric air
during experiment. Samples are stirred constantly with a magnetic stir bar to prevent photo-
damage of sample in the excitation volume over the time-course of experiment. A thermo-
electric chip connected to a temperature controller (MPT-5000, Wavelength Electronics), which
can set sample temperature from 5-100 oC with 0.1 oC precision, controls the sample
temperature.
Spectral Data Acquisition
The xenon spectra (control and signal tracks) are focused onto the entrance slit of a
monochromator (Princeton Instruments Acton) with a diffraction grating, which disperses a
spectrum from 400-700 nm. This spectrum is now focused onto the CCD array (Roper Scientific
Instruments PI-MAX) operating in nanosecond-gated mode. A GG400 filter cuts out light below
340 nm wavelength, to filter out tryptophan fluorescence signal at 350 nm. We calibrate the
60
ICCD camera for the wavelengths mentioned using the standard lines of the mercury argon pen-
lamp (Oriel 6033). Optical elements focusing light from sample onto spectrograph must be
optimally aligned so that the light coming from the signal track and control track have close to
equal intensities in the wavelength region of interest. The programmable timing generator (PTG)
triggers camera ON at delays ~τD after excitation and controls timing of spectral acquisition by
camera. These delays are programmed to be logarithmically spaced between 10 ns- 10ms using
Labview. For each delay, 20-40 spectra are acquired to enhance signal to noise ratio. We use
Labview software to trigger the pump and probe beams, set parameters for instruments acquiring
data and acquire data.
Data Analysis
The time delays from the HP counter and the spectra from the CCD are combined by the
Matlab program tspec_data_3.m (Hagen SJ) to yield a matrix with data as a function of
wavelength along rows and time delays (along columns). Singular value decomposition
(explained in appendix A) or SVD resolves the data matrix into independently evolving spectral
and temporal eigenvectors. The temporal eigenvectors can be fit to simple exponential
relaxations.
Temperature- jump Spectroscopy
Changes in temperature can destabilize the folded state of the protein, allowing for a
method of probing their folding mechanism. Early T-jump methods used a capacitive discharge
to heat the protein solvent quickly. This provided a time resolution (140) of 10 µs, varying with
the electrical conductivity of the solvent. Pulsed IR-laser temperature jump has now become the
method of choice to (141) trigger sub-microsecond events in protein folding (102, 142).
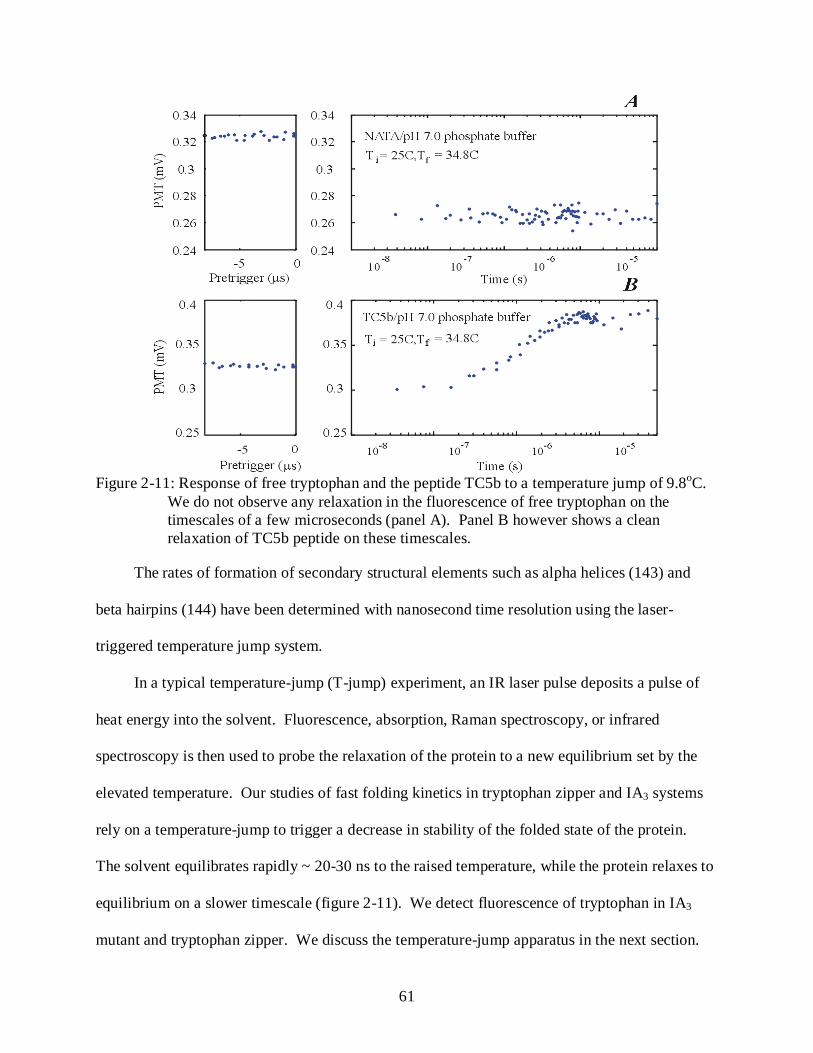
61
Figure 2-11: Response of free tryptophan and the peptide TC5b to a temperature jump of 9.8oC.
We do not observe any relaxation in the fluorescence of free tryptophan on the timescales of a few microseconds (panel A). Panel B however shows a clean relaxation of TC5b peptide on these timescales.
The rates of formation of secondary structural elements such as alpha helices (143) and
beta hairpins (144) have been determined with nanosecond time resolution using the laser-
triggered temperature jump system.
In a typical temperature-jump (T-jump) experiment, an IR laser pulse deposits a pulse of
heat energy into the solvent. Fluorescence, absorption, Raman spectroscopy, or infrared
spectroscopy is then used to probe the relaxation of the protein to a new equilibrium set by the
elevated temperature. Our studies of fast folding kinetics in tryptophan zipper and IA3 systems
rely on a temperature-jump to trigger a decrease in stability of the folded state of the protein.
The solvent equilibrates rapidly ~ 20-30 ns to the raised temperature, while the protein relaxes to
equilibrium on a slower timescale (figure 2-11). We detect fluorescence of tryptophan in IA3
mutant and tryptophan zipper. We discuss the temperature-jump apparatus in the next section.
62
Temperature-jump Apparatus
The laser temperature jump apparatus used in the present work (figure 2-12) consists of the
following:
• Infra-red excitation • Ultra-violet probe • Sample block • Sample handling and preparation • Kinetic data acquisition • Spectral data acquisition Infrared (IR) Excitation
We use an Nd: YAG laser (Continuum Surelite I-10) whose flash lamp and Q-switch are
triggered externally by the falling edge of electrical pulses (10Hz, 10 µs wide, 5V 0V). The
laser output at the fundamental wavelength 1064 nm (2Hz, 5-7 ns) is used to pump a Raman cell
(Light Age 101-PAL RC) filled with hydrogen gas. The first Stokes line for stimulated Raman
scattering is at 4155 cm-1, hence the 1064 nm fundamental output of the Nd:YAG laser is shifted
to 1890 nm. Light at the shifted wavelength is separated from the fundamental wavelength by
dispersion through a Pellin Broca prism, split into two beams that are incident on the sample
from opposite sides (‘hot’ spot diameter 1 mm) as shown in figure 2-12 ensuring a homogenous
heating of the sample. At 1890 nm, the decay length of the beam in water is 0.03 cm.
Temperature jumps of 10-15 oC can be achieved for aqueous solutions by varying the Q-switch
delay setting of the IR laser in the range of 116-120 µs.
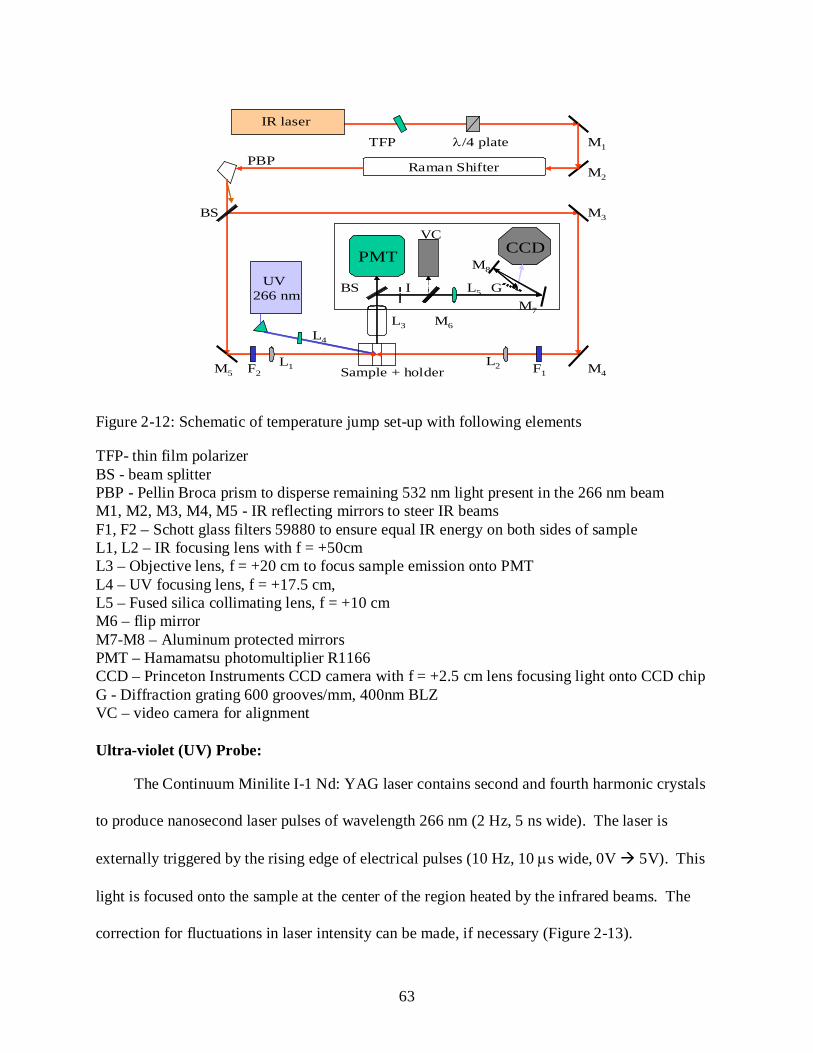
63
F1
IR laser
Raman Shifter
BS
UV 266 nm
PMT CCD
Sample + holder
TFP λ/4 platePBP
VC
G
M1
M2
M3
M4M5 F2L1 L2
L3L4
BS I
M6
L5
M7
M8
Figure 2-12: Schematic of temperature jump set-up with following elements
TFP- thin film polarizer BS - beam splitter PBP - Pellin Broca prism to disperse remaining 532 nm light present in the 266 nm beam M1, M2, M3, M4, M5 - IR reflecting mirrors to steer IR beams F1, F2 – Schott glass filters 59880 to ensure equal IR energy on both sides of sample L1, L2 – IR focusing lens with f = +50cm L3 – Objective lens, f = +20 cm to focus sample emission onto PMT L4 – UV focusing lens, f = +17.5 cm, L5 – Fused silica collimating lens, f = +10 cm M6 – flip mirror M7-M8 – Aluminum protected mirrors PMT – Hamamatsu photomultiplier R1166 CCD – Princeton Instruments CCD camera with f = +2.5 cm lens focusing light onto CCD chip G - Diffraction grating 600 grooves/mm, 400nm BLZ VC – video camera for alignment Ultra-violet (UV) Probe:
The Continuum Minilite I-1 Nd: YAG laser contains second and fourth harmonic crystals
to produce nanosecond laser pulses of wavelength 266 nm (2 Hz, 5 ns wide). The laser is
externally triggered by the rising edge of electrical pulses (10 Hz, 10 µs wide, 0V 5V). This
light is focused onto the sample at the center of the region heated by the infrared beams. The
correction for fluctuations in laser intensity can be made, if necessary (Figure 2-13).
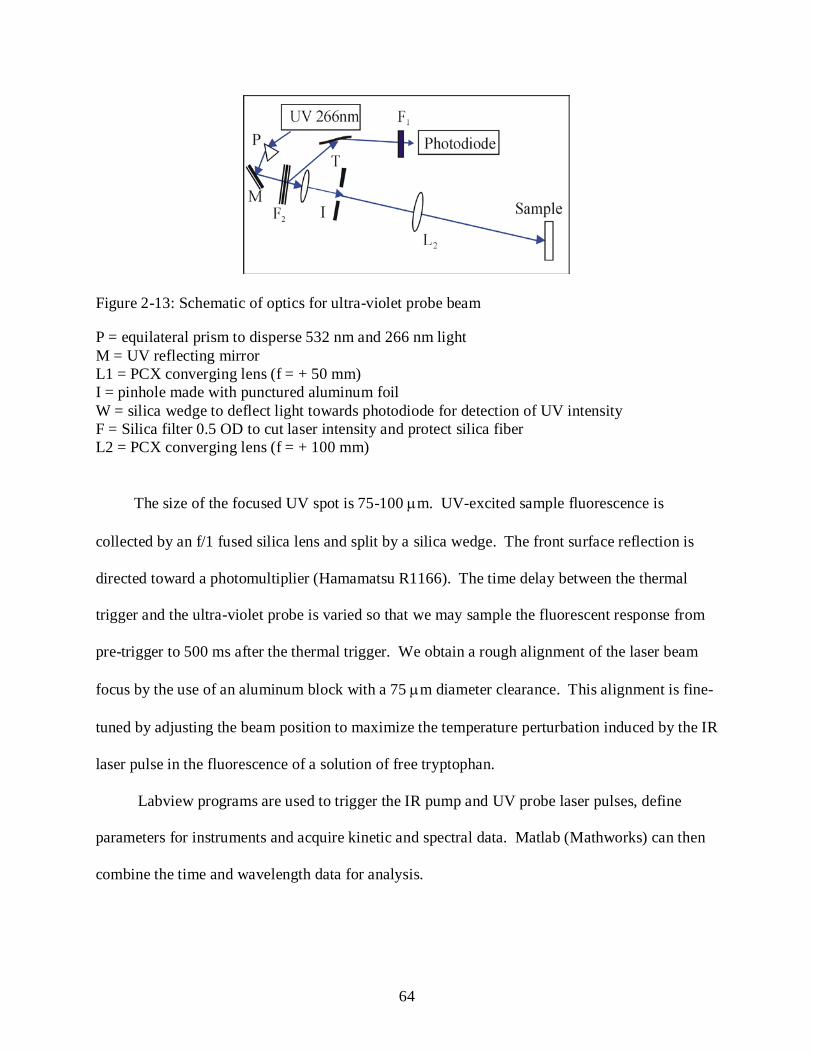
64
Figure 2-13: Schematic of optics for ultra-violet probe beam
P = equilateral prism to disperse 532 nm and 266 nm light M = UV reflecting mirror L1 = PCX converging lens (f = + 50 mm) I = pinhole made with punctured aluminum foil W = silica wedge to deflect light towards photodiode for detection of UV intensity F = Silica filter 0.5 OD to cut laser intensity and protect silica fiber L2 = PCX converging lens (f = + 100 mm)
The size of the focused UV spot is 75-100 µm. UV-excited sample fluorescence is
collected by an f/1 fused silica lens and split by a silica wedge. The front surface reflection is
directed toward a photomultiplier (Hamamatsu R1166). The time delay between the thermal
trigger and the ultra-violet probe is varied so that we may sample the fluorescent response from
pre-trigger to 500 ms after the thermal trigger. We obtain a rough alignment of the laser beam
focus by the use of an aluminum block with a 75 µm diameter clearance. This alignment is fine-
tuned by adjusting the beam position to maximize the temperature perturbation induced by the IR
laser pulse in the fluorescence of a solution of free tryptophan.
Labview programs are used to trigger the IR pump and UV probe laser pulses, define
parameters for instruments and acquire kinetic and spectral data. Matlab (Mathworks) can then
combine the time and wavelength data for analysis.
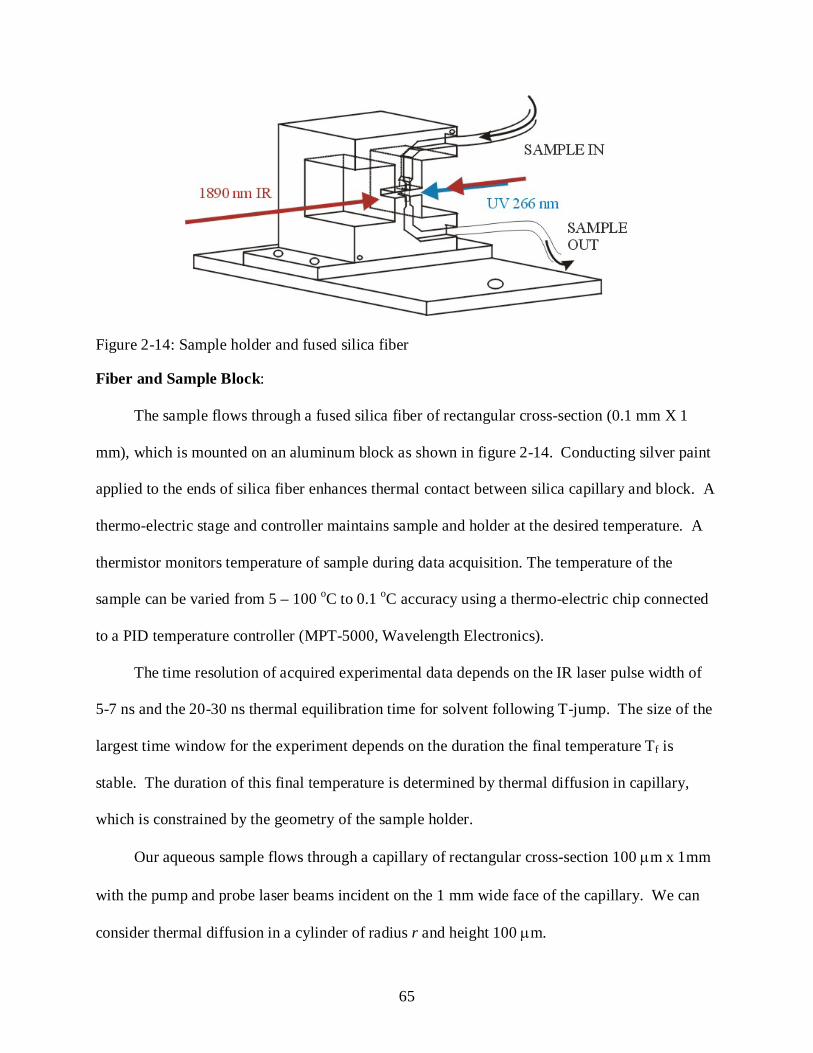
65
Figure 2-14: Sample holder and fused silica fiber
Fiber and Sample Block:
The sample flows through a fused silica fiber of rectangular cross-section (0.1 mm X 1
mm), which is mounted on an aluminum block as shown in figure 2-14. Conducting silver paint
applied to the ends of silica fiber enhances thermal contact between silica capillary and block. A
thermo-electric stage and controller maintains sample and holder at the desired temperature. A
thermistor monitors temperature of sample during data acquisition. The temperature of the
sample can be varied from 5 – 100 oC to 0.1 oC accuracy using a thermo-electric chip connected
to a PID temperature controller (MPT-5000, Wavelength Electronics).
The time resolution of acquired experimental data depends on the IR laser pulse width of
5-7 ns and the 20-30 ns thermal equilibration time for solvent following T-jump. The size of the
largest time window for the experiment depends on the duration the final temperature Tf is
stable. The duration of this final temperature is determined by thermal diffusion in capillary,
which is constrained by the geometry of the sample holder.
Our aqueous sample flows through a capillary of rectangular cross-section 100 µm x 1mm
with the pump and probe laser beams incident on the 1 mm wide face of the capillary. We can
consider thermal diffusion in a cylinder of radius r and height 100 µm.
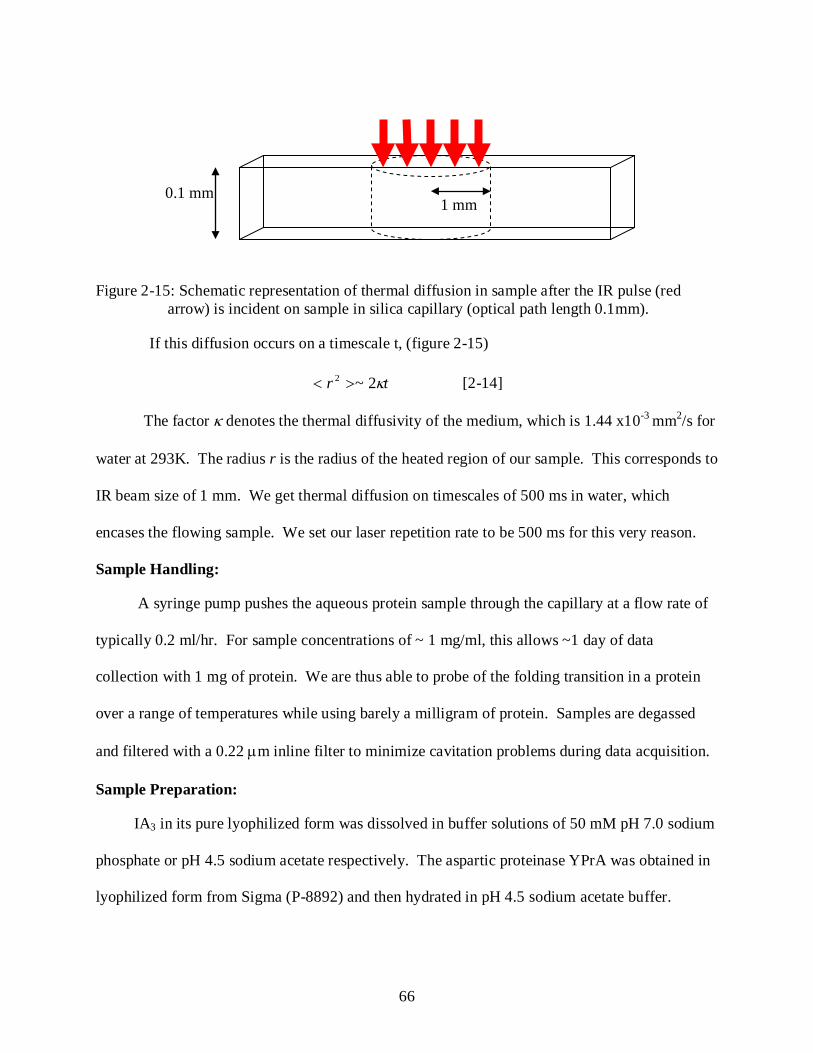
66
Figure 2-15: Schematic representation of thermal diffusion in sample after the IR pulse (red arrow) is incident on sample in silica capillary (optical path length 0.1mm).
If this diffusion occurs on a timescale t, (figure 2-15)
tr κ2~2 >< [2-14]
The factor κ denotes the thermal diffusivity of the medium, which is 1.44 x10⁻³ mm2/s for
water at 293K. The radius r is the radius of the heated region of our sample. This corresponds to
IR beam size of 1 mm. We get thermal diffusion on timescales of 500 ms in water, which
encases the flowing sample. We set our laser repetition rate to be 500 ms for this very reason.
Sample Handling:
A syringe pump pushes the aqueous protein sample through the capillary at a flow rate of
typically 0.2 ml/hr. For sample concentrations of ~ 1 mg/ml, this allows ~1 day of data
collection with 1 mg of protein. We are thus able to probe of the folding transition in a protein
over a range of temperatures while using barely a milligram of protein. Samples are degassed
and filtered with a 0.22 µm inline filter to minimize cavitation problems during data acquisition.
Sample Preparation:
IA3 in its pure lyophilized form was dissolved in buffer solutions of 50 mM pH 7.0 sodium
phosphate or pH 4.5 sodium acetate respectively. The aspartic proteinase YPrA was obtained in
lyophilized form from Sigma (P-8892) and then hydrated in pH 4.5 sodium acetate buffer.
0.1 mm 1 mm
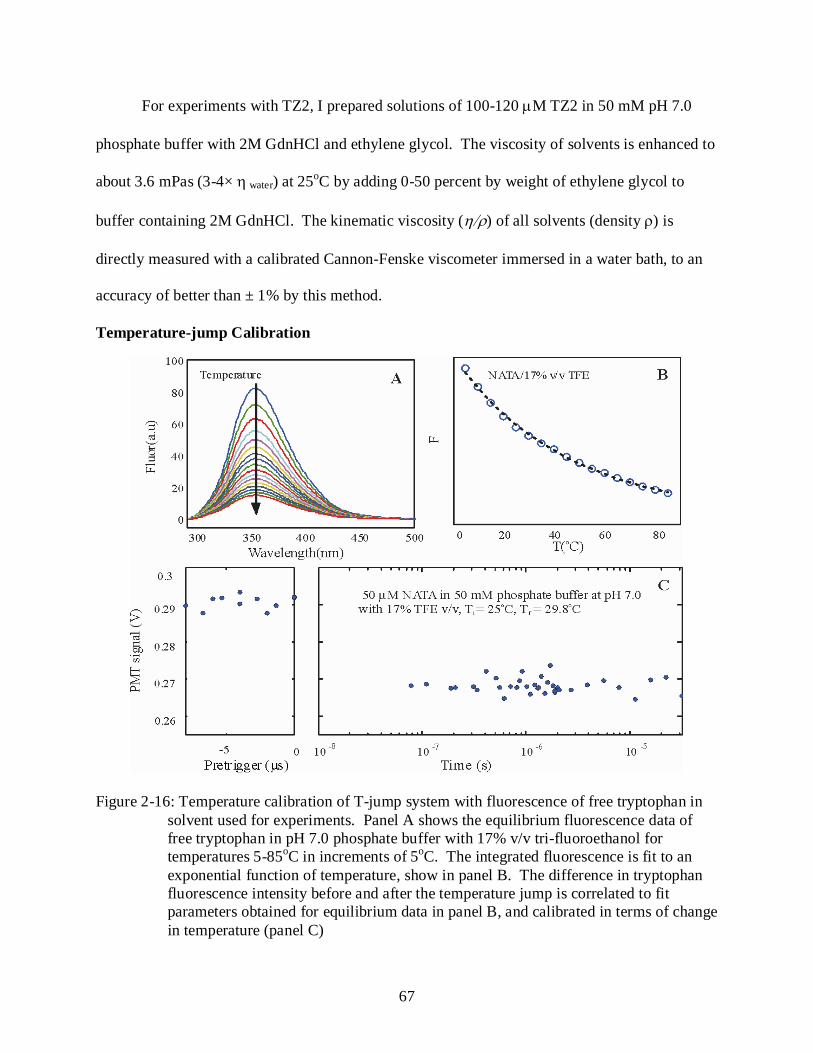
67
For experiments with TZ2, I prepared solutions of 100-120 µM TZ2 in 50 mM pH 7.0
phosphate buffer with 2M GdnHCl and ethylene glycol. The viscosity of solvents is enhanced to
about 3.6 mPas (3-4× η water) at 25oC by adding 0-50 percent by weight of ethylene glycol to
buffer containing 2M GdnHCl. The kinematic viscosity (η/ρ) of all solvents (density ρ) is
directly measured with a calibrated Cannon-Fenske viscometer immersed in a water bath, to an
accuracy of better than ± 1% by this method.
Temperature-jump Calibration
Figure 2-16: Temperature calibration of T-jump system with fluorescence of free tryptophan in solvent used for experiments. Panel A shows the equilibrium fluorescence data of free tryptophan in pH 7.0 phosphate buffer with 17% v/v tri-fluoroethanol for temperatures 5-85oC in increments of 5oC. The integrated fluorescence is fit to an exponential function of temperature, show in panel B. The difference in tryptophan fluorescence intensity before and after the temperature jump is correlated to fit parameters obtained for equilibrium data in panel B, and calibrated in terms of change in temperature (panel C)
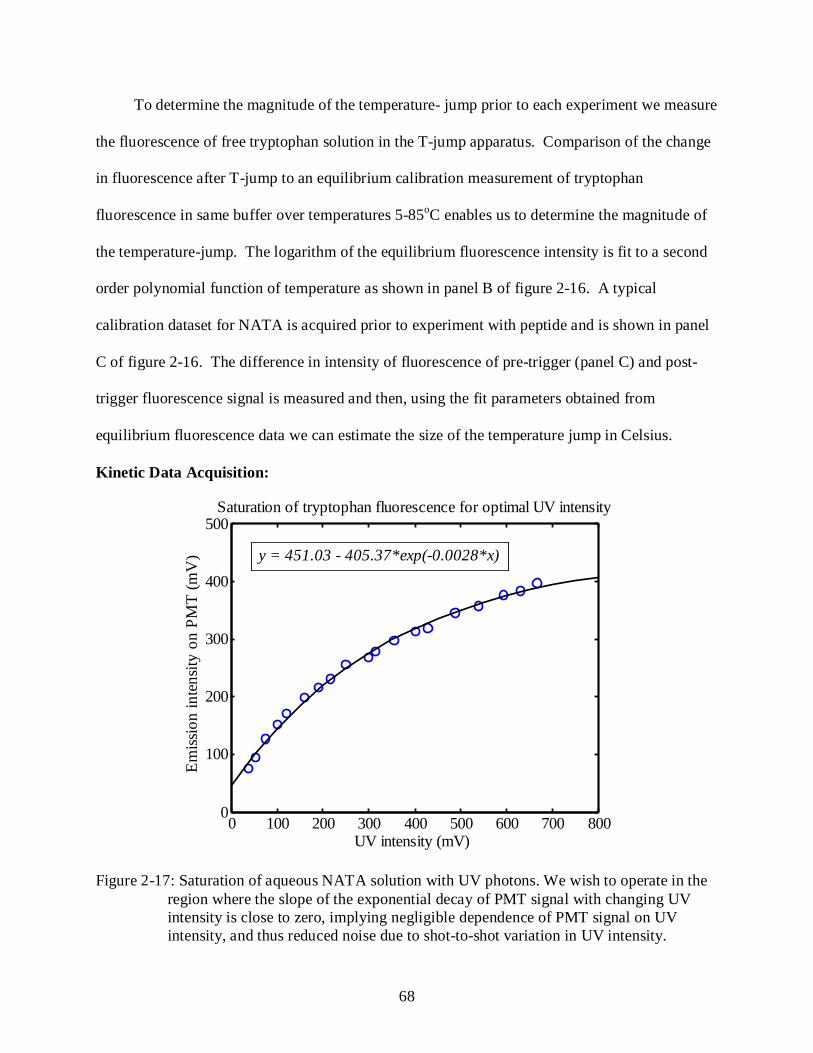
68
To determine the magnitude of the temperature- jump prior to each experiment we measure
the fluorescence of free tryptophan solution in the T-jump apparatus. Comparison of the change
in fluorescence after T-jump to an equilibrium calibration measurement of tryptophan
fluorescence in same buffer over temperatures 5-85oC enables us to determine the magnitude of
the temperature-jump. The logarithm of the equilibrium fluorescence intensity is fit to a second
order polynomial function of temperature as shown in panel B of figure 2-16. A typical
calibration dataset for NATA is acquired prior to experiment with peptide and is shown in panel
C of figure 2-16. The difference in intensity of fluorescence of pre-trigger (panel C) and post-
trigger fluorescence signal is measured and then, using the fit parameters obtained from
equilibrium fluorescence data we can estimate the size of the temperature jump in Celsius.
Kinetic Data Acquisition:
0 100 200 300 400 500 600 700 8000
100
200
300
400
500
UV intensity (mV)
Emiss
ion
inte
nsity
on
PMT
(mV
)
Saturation of tryptophan fluorescence for optimal UV intensity
y = 451.03 - 405.37*exp(-0.0028*x)
Figure 2-17: Saturation of aqueous NATA solution with UV photons. We wish to operate in the
region where the slope of the exponential decay of PMT signal with changing UV intensity is close to zero, implying negligible dependence of PMT signal on UV intensity, and thus reduced noise due to shot-to-shot variation in UV intensity.

69
Emission from the sample volume probed by the focused ultra-violet laser pulse is
collected and sampled by a photomultiplier (Hamamatsu R1166 D-type φ 19 mm) as well as a
CCD camera. The primary sources of noise in data collection arise from shot-to-shot variations
in UV and IR laser intensity as well as a small amount of electrical noise due to RF interference
from the IR laser Q-switch. Noise due to fluctuations in UV laser intensity can be reduced by
optimizing PMT signal while varying the UV intensity and determining the region of operation
where PMT signal is insensitive to fluctuations in UV intensity (Figure 2-17).
Spectral Data Acquisition:
Figure 2.18: Sample fluorescence is collected by a lens that focuses light at the focal plane of a
collimating lens. Collimated light is dispersed by a diffraction grating to yield a spectrum spanning wavelengths 250 -700 nm. This spectrum is focused onto a CCD array that acquires spectra synchronously with the photomultiplier. We can acquire multi-wavelength time-resolved fluorescence spectra over ns-µs timescales with nanosecond resolution.
Sample fluorescence is collimated and directed onto a diffraction grating (150
grooves/mm, 400 nm blaze wavelength), which disperses light to provide spectrum over
70
wavelengths 290-725 nm. The spectra are centered at 400 nm and focused onto a CCD camera
array with a focusing lens (f = 2.5 cm). Wavelength calibration of this CCD array is performed
with standard mercury-argon pen lamp (Oriel 6033). A video camera with a focusing lens is also
used to optimize alignment of emitted light through the optical system (figure 2-18).
We have a laser-triggered temperature jump system that can probe the kinetics of
relaxation of proteins that can absorb UV light of wavelength 266 nm and have a fluorescent
response in the wavelength region 250 – 700 nm. We can simultaneously acquire spectral and
kinetic data with nanosecond time resolution on timescales of ns-ms. We employ temperature
jumps of 6-8oC to destabilize the folded state of the tryptophan zipper protein, so that we may
probe its folding by observing the fluorescence of tryptophan (emission maximum at 350 nm) at
time delays extending out to a few tens of microseconds. We have used this system to monitor
the folding kinetics of tryptophan zipper in solvents of varying viscosity. Our temperature jump
studies of the folding kinetics of the intrinsically unstructured peptide IA3 coupled to its binding
with YPrA enable us to identify the sequence of events that lead to the effective inhibition of the
YPrA.
71
CHAPTER 3 KINETICS OF FOLDING AND BINDING OF THE INTRINSICALLY DISORDERED
PEPTIDE IA3 WITH YPRA
Introduction
We have seen the diverse roles played by intrinsically disordered proteins in initiation and
regulation of vital biological processes (42, 46, 51). The activity of these proteins arises through
their folding to a structure that is conducive to their function (42, 45, 52, 58, 62). This ordering
transition occurs during or prior to their association with other proteins or cofactors (58). The
inhibition of the proteolytic enzyme YPrA by the intrinsically unstructured IA3 is a case in point.
Free IA3 has no residual secondary structure, as indicated by CD (85) and NMR studies (145).
X-ray crystallographic studies of YPrA and IA3 (76) show the N-terminal residues of IA3 bound
to the active site of YPrA and folded into an alpha helix. This folded segment of IA3 blocks
substrate access to YPrA inhibiting the enzyme. Despite overwhelming evidence of a unique
mechanism of interaction that couples helix formation and binding (76, 84, 88, 89, 145), no study
so far has investigated the sequence of events that lead to YPrA inhibition by IA3. We study the
kinetics of this interaction to gain an insight into the function of IA3.
The simplest mechanisms that can be envisaged for the YPrA-IA3 interaction are that
(Scheme I) folding precedes binding to YPrA or that (Scheme II) a transient complex is formed
prior to folding of the intrinsically disordered peptide (Figure 5.1). Scheme I would suggest that
the folding kinetics of IA3 would be unchanged by the binding interaction with YPrA. If scheme
II were to be valid, however, the folding kinetics of IA3 should be significantly different in the
presence of YPrA.
Our approach is to do a comparative study of the kinetics of IA3 folding in the absence and
presence of YPrA, or effectively IA3 folding independent of binding and IA3 folding coupled to
binding. We use the helix promoting co-solvent 2, 2, 2-trifluoroethanol (146, 147) (TFE) to
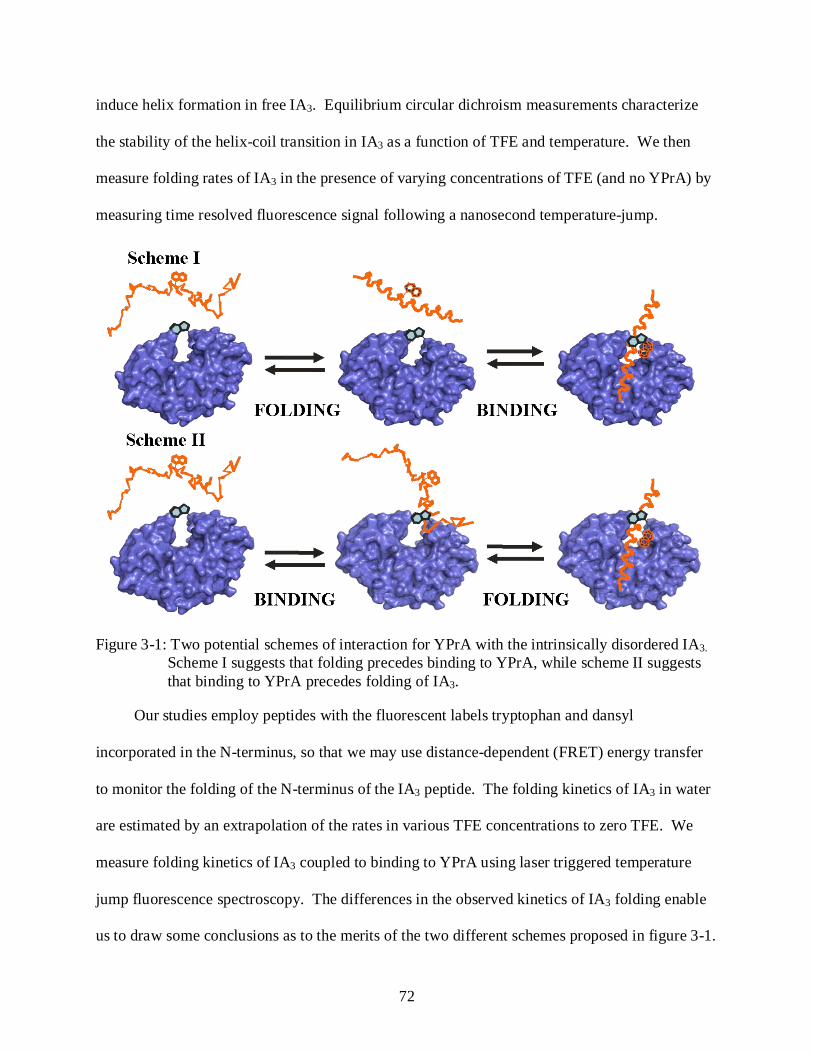
72
induce helix formation in free IA3. Equilibrium circular dichroism measurements characterize
the stability of the helix-coil transition in IA3 as a function of TFE and temperature. We then
measure folding rates of IA3 in the presence of varying concentrations of TFE (and no YPrA) by
measuring time resolved fluorescence signal following a nanosecond temperature-jump.
Figure 3-1: Two potential schemes of interaction for YPrA with the intrinsically disordered IA3.
Scheme I suggests that folding precedes binding to YPrA, while scheme II suggests that binding to YPrA precedes folding of IA3.
Our studies employ peptides with the fluorescent labels tryptophan and dansyl
incorporated in the N-terminus, so that we may use distance-dependent (FRET) energy transfer
to monitor the folding of the N-terminus of the IA3 peptide. The folding kinetics of IA3 in water
are estimated by an extrapolation of the rates in various TFE concentrations to zero TFE. We
measure folding kinetics of IA3 coupled to binding to YPrA using laser triggered temperature
jump fluorescence spectroscopy. The differences in the observed kinetics of IA3 folding enable
us to draw some conclusions as to the merits of the two different schemes proposed in figure 3-1.
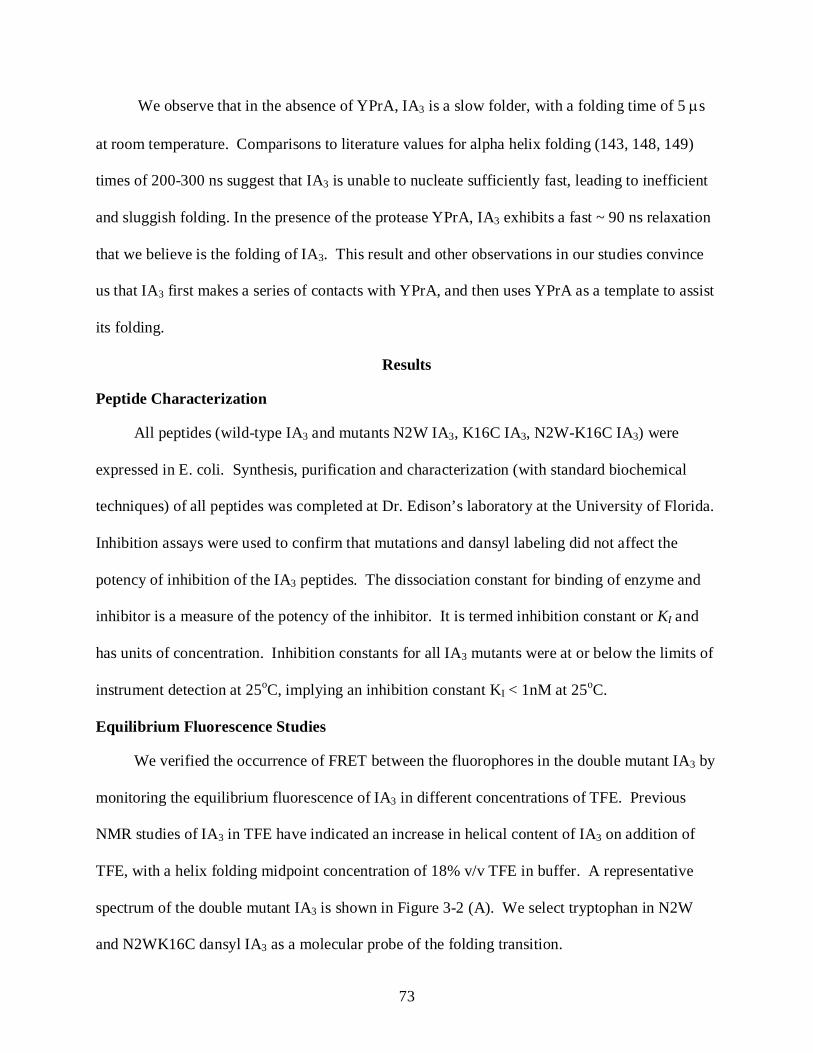
73
We observe that in the absence of YPrA, IA3 is a slow folder, with a folding time of 5 µs
at room temperature. Comparisons to literature values for alpha helix folding (143, 148, 149)
times of 200-300 ns suggest that IA3 is unable to nucleate sufficiently fast, leading to inefficient
and sluggish folding. In the presence of the protease YPrA, IA3 exhibits a fast ~ 90 ns relaxation
that we believe is the folding of IA3. This result and other observations in our studies convince
us that IA3 first makes a series of contacts with YPrA, and then uses YPrA as a template to assist
its folding.
Results
Peptide Characterization
All peptides (wild-type IA3 and mutants N2W IA3, K16C IA3, N2W-K16C IA3) were
expressed in E. coli. Synthesis, purification and characterization (with standard biochemical
techniques) of all peptides was completed at Dr. Edison’s laboratory at the University of Florida.
Inhibition assays were used to confirm that mutations and dansyl labeling did not affect the
potency of inhibition of the IA3 peptides. The dissociation constant for binding of enzyme and
inhibitor is a measure of the potency of the inhibitor. It is termed inhibition constant or KI and
has units of concentration. Inhibition constants for all IA3 mutants were at or below the limits of
instrument detection at 25oC, implying an inhibition constant KI < 1nM at 25oC.
Equilibrium Fluorescence Studies
We verified the occurrence of FRET between the fluorophores in the double mutant IA3 by
monitoring the equilibrium fluorescence of IA3 in different concentrations of TFE. Previous
NMR studies of IA3 in TFE have indicated an increase in helical content of IA3 on addition of
TFE, with a helix folding midpoint concentration of 18% v/v TFE in buffer. A representative
spectrum of the double mutant IA3 is shown in Figure 3-2 (A). We select tryptophan in N2W
and N2WK16C dansyl IA3 as a molecular probe of the folding transition.
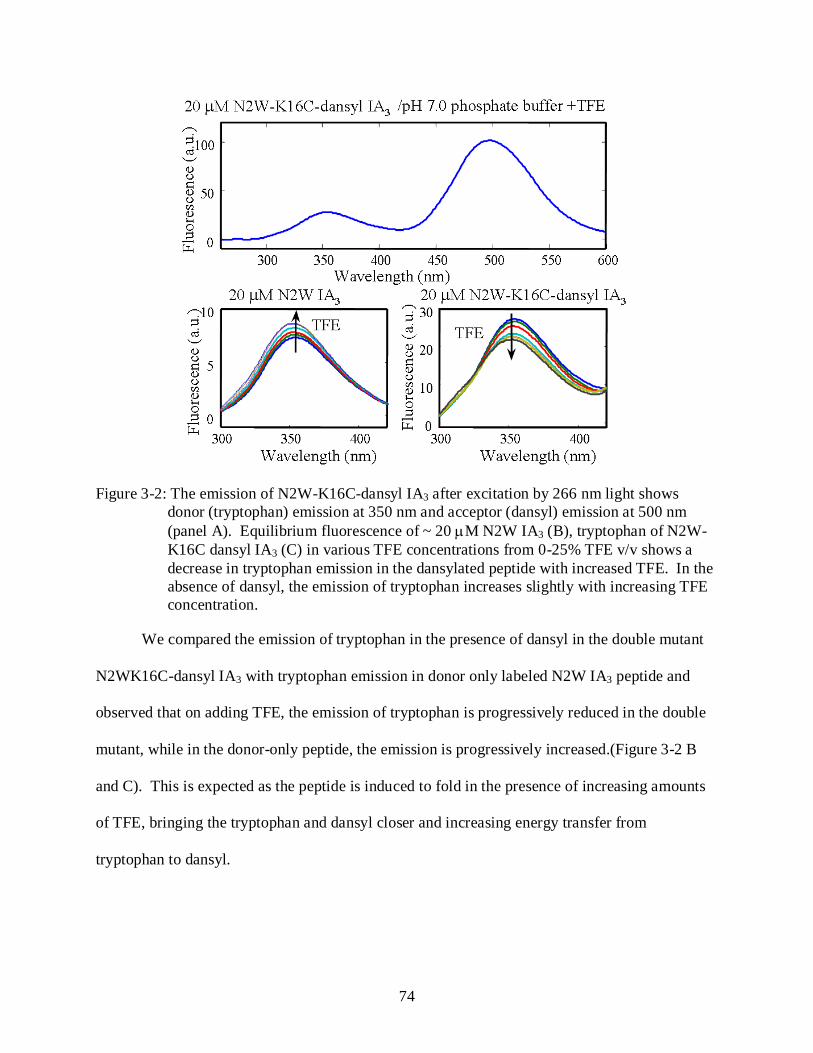
74
Figure 3-2: The emission of N2W-K16C-dansyl IA3 after excitation by 266 nm light shows donor (tryptophan) emission at 350 nm and acceptor (dansyl) emission at 500 nm (panel A). Equilibrium fluorescence of ~ 20 µM N2W IA3 (B), tryptophan of N2W-K16C dansyl IA3 (C) in various TFE concentrations from 0-25% TFE v/v shows a decrease in tryptophan emission in the dansylated peptide with increased TFE. In the absence of dansyl, the emission of tryptophan increases slightly with increasing TFE concentration.
We compared the emission of tryptophan in the presence of dansyl in the double mutant
N2WK16C-dansyl IA3 with tryptophan emission in donor only labeled N2W IA3 peptide and
observed that on adding TFE, the emission of tryptophan is progressively reduced in the double
mutant, while in the donor-only peptide, the emission is progressively increased.(Figure 3-2 B
and C). This is expected as the peptide is induced to fold in the presence of increasing amounts
of TFE, bringing the tryptophan and dansyl closer and increasing energy transfer from
tryptophan to dansyl.

75
Characterization of IA3 Folding Behavior at Equilibrium
Previous NMR studies have revealed that free IA3 forms a random-coil (no residual
secondary structure) (145) in the absence of TFE. In the presence of TFE, the N-terminus of IA3
acquires alpha helix structure. The use of TFE to induce helix folding in peptides with little or
no helical secondary structure in the absence of TFE has been well studied (146, 147, 150). It is
possible to determine the equilibrium thermodynamic parameters (free energy of folding
/unfolding, associated enthalpy and entropy) for the helix- to- coil transition in water by an
extrapolation of the folding parameters measured at various TFE concentrations(150, 151).
Equilibrium far-UV circular dichroism probes the secondary structure content of IA3 at
various temperatures and TFE concentrations. We observe that at low TFE concentrations, the
CD spectrum is typical of a random coil with a dominant minimum at 200 nm. As the
concentration of TFE increases, the CD spectrum begins to exhibit the signature of an alpha
helical structure with a minimum near 208 nm and 220 nm. All the spectra for all IA3 mutants
also exhibit an isodichroic point near 202 nm, which is suggestive of the existence of two
populations of IA3, one that is folded into an alpha helix and one that is unfolded. This
observation is consistent with previous NMR studies and enables us to fit all CD data over all
wavelengths, temperatures and TFE concentrations to a two state model for IA3 folding.
Our model assumes that the free energy of unfolding of IA3, ∆G varies linearly with TFE
concentration (Eq 3-1). Our unfolding free energy for all IA3 mutants is then well defined by
two enthalpy parameters mH and ∆H0, and two entropy parameters ∆S0 and mS.
][])[(),(][
][
000
0
0
TFEmGTFETmmSTHTFETGTFEmSS
TFEmHHSTHG
SH
S
H
+∆=−+∆−∆=∆+∆=∆
+∆=∆∆−∆=∆
[3-1]
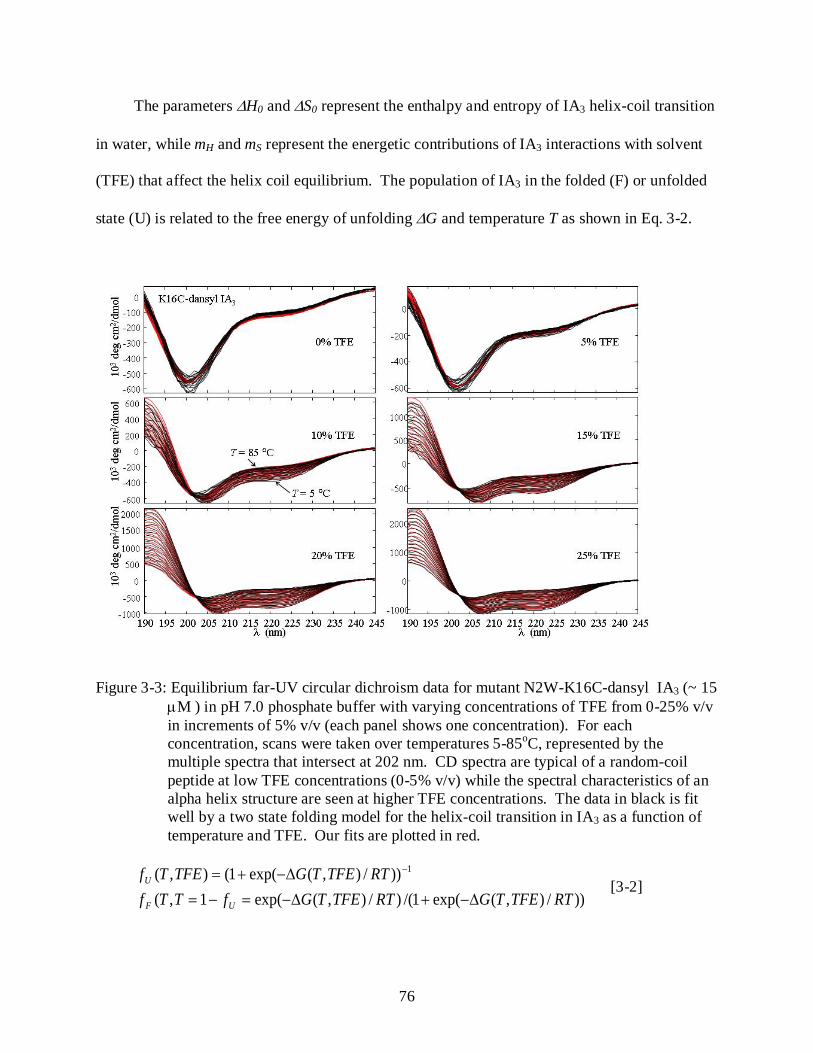
76
The parameters ∆H0 and ∆S0 represent the enthalpy and entropy of IA3 helix-coil transition
in water, while mH and mS represent the energetic contributions of IA3 interactions with solvent
(TFE) that affect the helix coil equilibrium. The population of IA3 in the folded (F) or unfolded
state (U) is related to the free energy of unfolding ∆G and temperature T as shown in Eq. 3-2.
Figure 3-3: Equilibrium far-UV circular dichroism data for mutant N2W-K16C-dansyl IA3 (~ 15
µM ) in pH 7.0 phosphate buffer with varying concentrations of TFE from 0-25% v/v in increments of 5% v/v (each panel shows one concentration). For each concentration, scans were taken over temperatures 5-85oC, represented by the multiple spectra that intersect at 202 nm. CD spectra are typical of a random-coil peptide at low TFE concentrations (0-5% v/v) while the spectral characteristics of an alpha helix structure are seen at higher TFE concentrations. The data in black is fit well by a two state folding model for the helix-coil transition in IA3 as a function of temperature and TFE. Our fits are plotted in red.
))/),(exp(1/()/),(exp(1,())/),(exp(1(),( 1
RTTFETGRTTFETGfTTfRTTFETGTFETf
UF
U
∆−+∆−=−=∆−+= −
[3-2]
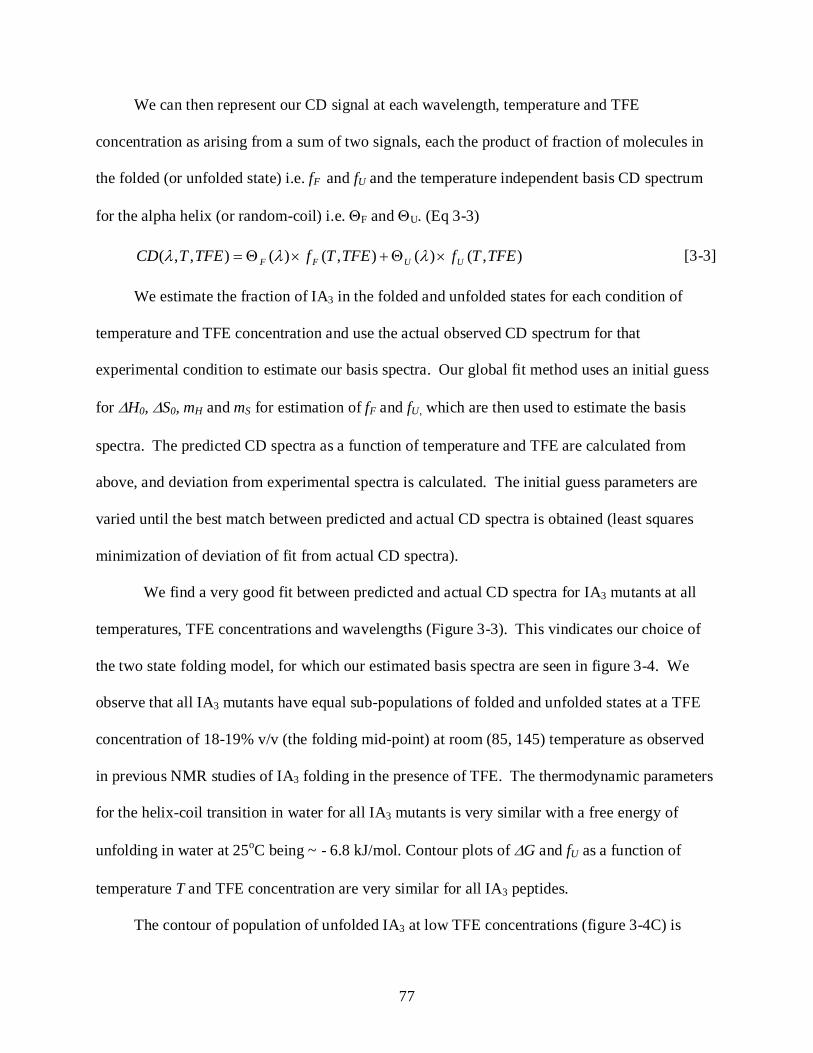
77
We can then represent our CD signal at each wavelength, temperature and TFE
concentration as arising from a sum of two signals, each the product of fraction of molecules in
the folded (or unfolded state) i.e. fF and fU and the temperature independent basis CD spectrum
for the alpha helix (or random-coil) i.e. ΘF and ΘU. (Eq 3-3)
),()(),()(),,( TFETfTFETfTFETCD UUFF ×Θ+×Θ= λλλ [3-3]
We estimate the fraction of IA3 in the folded and unfolded states for each condition of
temperature and TFE concentration and use the actual observed CD spectrum for that
experimental condition to estimate our basis spectra. Our global fit method uses an initial guess
for ∆H0, ∆S0, mH and mS for estimation of fF and fU, which are then used to estimate the basis
spectra. The predicted CD spectra as a function of temperature and TFE are calculated from
above, and deviation from experimental spectra is calculated. The initial guess parameters are
varied until the best match between predicted and actual CD spectra is obtained (least squares
minimization of deviation of fit from actual CD spectra).
We find a very good fit between predicted and actual CD spectra for IA3 mutants at all
temperatures, TFE concentrations and wavelengths (Figure 3-3). This vindicates our choice of
the two state folding model, for which our estimated basis spectra are seen in figure 3-4. We
observe that all IA3 mutants have equal sub-populations of folded and unfolded states at a TFE
concentration of 18-19% v/v (the folding mid-point) at room (85, 145) temperature as observed
in previous NMR studies of IA3 folding in the presence of TFE. The thermodynamic parameters
for the helix-coil transition in water for all IA3 mutants is very similar with a free energy of
unfolding in water at 25oC being ~ - 6.8 kJ/mol. Contour plots of ∆G and fU as a function of
temperature T and TFE concentration are very similar for all IA3 peptides.
The contour of population of unfolded IA3 at low TFE concentrations (figure 3-4C) is
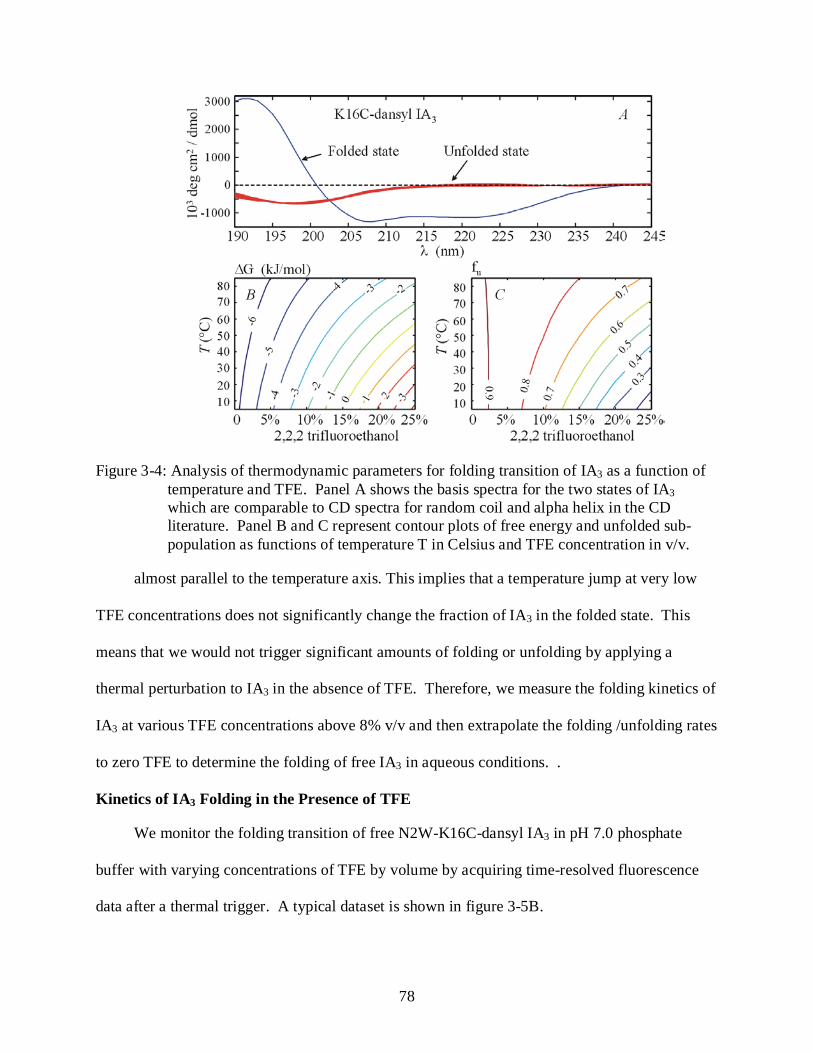
78
Figure 3-4: Analysis of thermodynamic parameters for folding transition of IA3 as a function of
temperature and TFE. Panel A shows the basis spectra for the two states of IA3 which are comparable to CD spectra for random coil and alpha helix in the CD literature. Panel B and C represent contour plots of free energy and unfolded sub-population as functions of temperature T in Celsius and TFE concentration in v/v.
almost parallel to the temperature axis. This implies that a temperature jump at very low
TFE concentrations does not significantly change the fraction of IA3 in the folded state. This
means that we would not trigger significant amounts of folding or unfolding by applying a
thermal perturbation to IA3 in the absence of TFE. Therefore, we measure the folding kinetics of
IA3 at various TFE concentrations above 8% v/v and then extrapolate the folding /unfolding rates
to zero TFE to determine the folding of free IA3 in aqueous conditions. .
Kinetics of IA3 Folding in the Presence of TFE
We monitor the folding transition of free N2W-K16C-dansyl IA3 in pH 7.0 phosphate
buffer with varying concentrations of TFE by volume by acquiring time-resolved fluorescence
data after a thermal trigger. A typical dataset is shown in figure 3-5B.
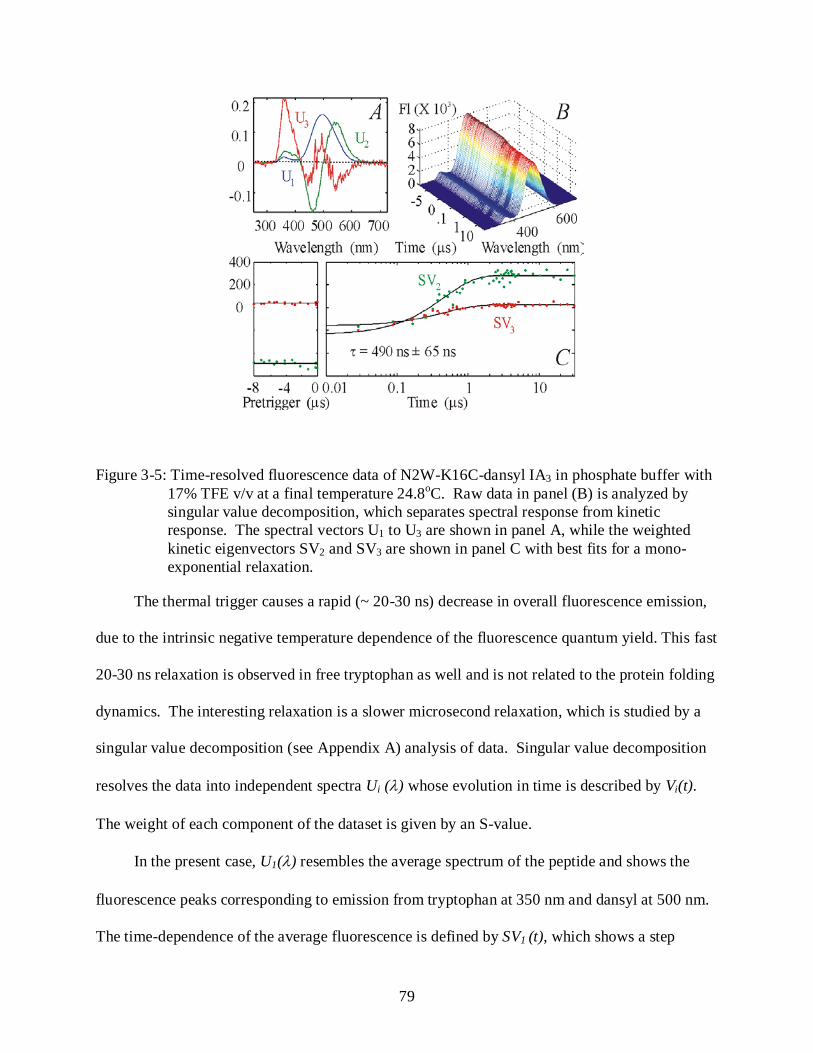
79
Figure 3-5: Time-resolved fluorescence data of N2W-K16C-dansyl IA3 in phosphate buffer with 17% TFE v/v at a final temperature 24.8oC. Raw data in panel (B) is analyzed by singular value decomposition, which separates spectral response from kinetic response. The spectral vectors U1 to U3 are shown in panel A, while the weighted kinetic eigenvectors SV2 and SV3 are shown in panel C with best fits for a mono-exponential relaxation.
The thermal trigger causes a rapid (~ 20-30 ns) decrease in overall fluorescence emission,
due to the intrinsic negative temperature dependence of the fluorescence quantum yield. This fast
20-30 ns relaxation is observed in free tryptophan as well and is not related to the protein folding
dynamics. The interesting relaxation is a slower microsecond relaxation, which is studied by a
singular value decomposition (see Appendix A) analysis of data. Singular value decomposition
resolves the data into independent spectra Ui (λ) whose evolution in time is described by Vi(t).
The weight of each component of the dataset is given by an S-value.
In the present case, U1(λ) resembles the average spectrum of the peptide and shows the
fluorescence peaks corresponding to emission from tryptophan at 350 nm and dansyl at 500 nm.
The time-dependence of the average fluorescence is defined by SV1 (t), which shows a step
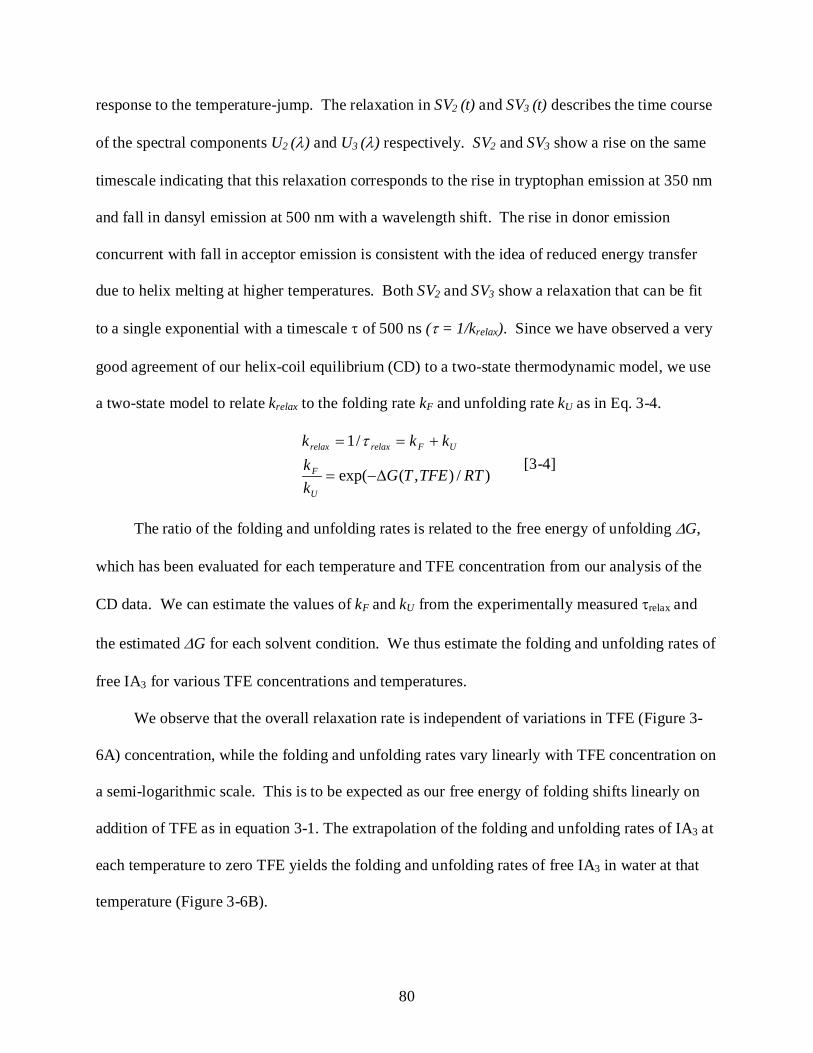
80
response to the temperature-jump. The relaxation in SV2 (t) and SV3 (t) describes the time course
of the spectral components U2 (λ) and U3 (λ) respectively. SV2 and SV3 show a rise on the same
timescale indicating that this relaxation corresponds to the rise in tryptophan emission at 350 nm
and fall in dansyl emission at 500 nm with a wavelength shift. The rise in donor emission
concurrent with fall in acceptor emission is consistent with the idea of reduced energy transfer
due to helix melting at higher temperatures. Both SV2 and SV3 show a relaxation that can be fit
to a single exponential with a timescale τ of 500 ns (τ = 1/krelax). Since we have observed a very
good agreement of our helix-coil equilibrium (CD) to a two-state thermodynamic model, we use
a two-state model to relate krelax to the folding rate kF and unfolding rate kU as in Eq. 3-4.
)/),(exp(
/1
RTTFETGkk
kkk
U
F
UFrelaxrelax
∆−=
+== τ [3-4]
The ratio of the folding and unfolding rates is related to the free energy of unfolding ∆G,
which has been evaluated for each temperature and TFE concentration from our analysis of the
CD data. We can estimate the values of kF and kU from the experimentally measured τrelax and
the estimated ∆G for each solvent condition. We thus estimate the folding and unfolding rates of
free IA3 for various TFE concentrations and temperatures.
We observe that the overall relaxation rate is independent of variations in TFE (Figure 3-
6A) concentration, while the folding and unfolding rates vary linearly with TFE concentration on
a semi-logarithmic scale. This is to be expected as our free energy of folding shifts linearly on
addition of TFE as in equation 3-1. The extrapolation of the folding and unfolding rates of IA3 at
each temperature to zero TFE yields the folding and unfolding rates of free IA3 in water at that
temperature (Figure 3-6B).
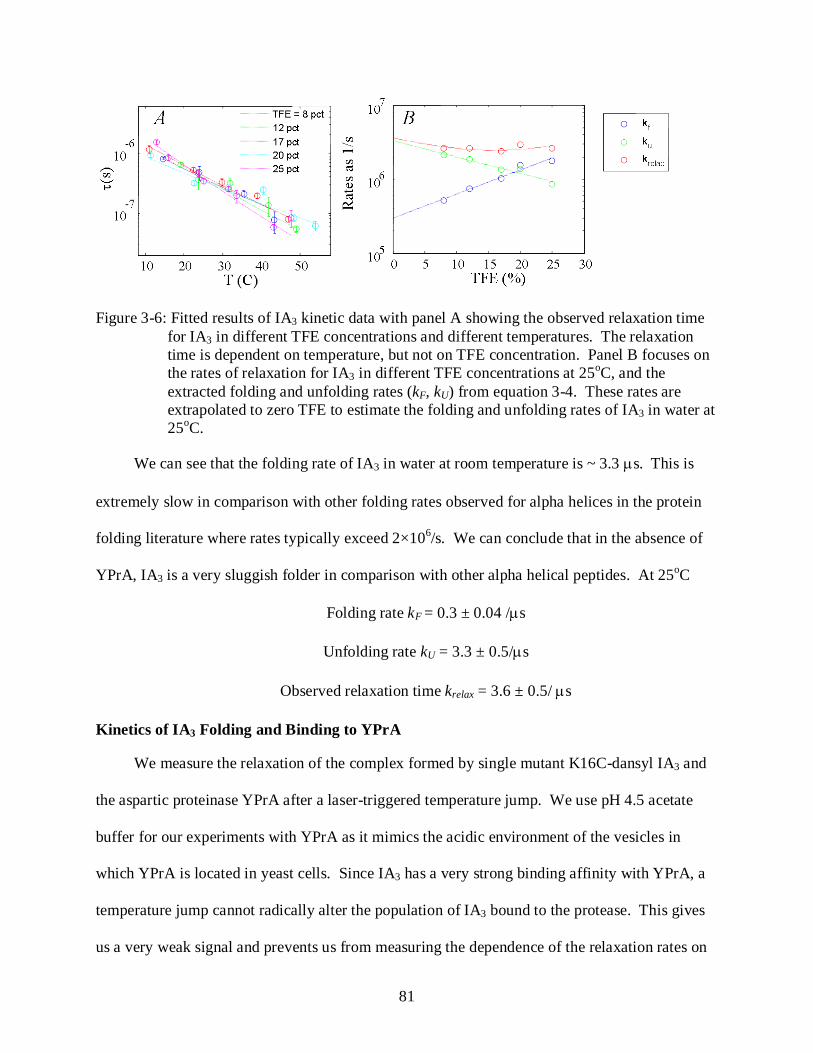
81
Figure 3-6: Fitted results of IA3 kinetic data with panel A showing the observed relaxation time for IA3 in different TFE concentrations and different temperatures. The relaxation time is dependent on temperature, but not on TFE concentration. Panel B focuses on the rates of relaxation for IA3 in different TFE concentrations at 25oC, and the extracted folding and unfolding rates (kF, kU) from equation 3-4. These rates are extrapolated to zero TFE to estimate the folding and unfolding rates of IA3 in water at 25oC.
We can see that the folding rate of IA3 in water at room temperature is ~ 3.3 µs. This is
extremely slow in comparison with other folding rates observed for alpha helices in the protein
folding literature where rates typically exceed 2×10⁶/s. We can conclude that in the absence of
YPrA, IA3 is a very sluggish folder in comparison with other alpha helical peptides. At 25oC
Folding rate kF = 0.3 ± 0.04 /µs
Unfolding rate kU = 3.3 ± 0.5/µs
Observed relaxation time krelax = 3.6 ± 0.5/ µs
Kinetics of IA3 Folding and Binding to YPrA
We measure the relaxation of the complex formed by single mutant K16C-dansyl IA3 and
the aspartic proteinase YPrA after a laser-triggered temperature jump. We use pH 4.5 acetate
buffer for our experiments with YPrA as it mimics the acidic environment of the vesicles in
which YPrA is located in yeast cells. Since IA3 has a very strong binding affinity with YPrA, a
temperature jump cannot radically alter the population of IA3 bound to the protease. This gives
us a very weak signal and prevents us from measuring the dependence of the relaxation rates on
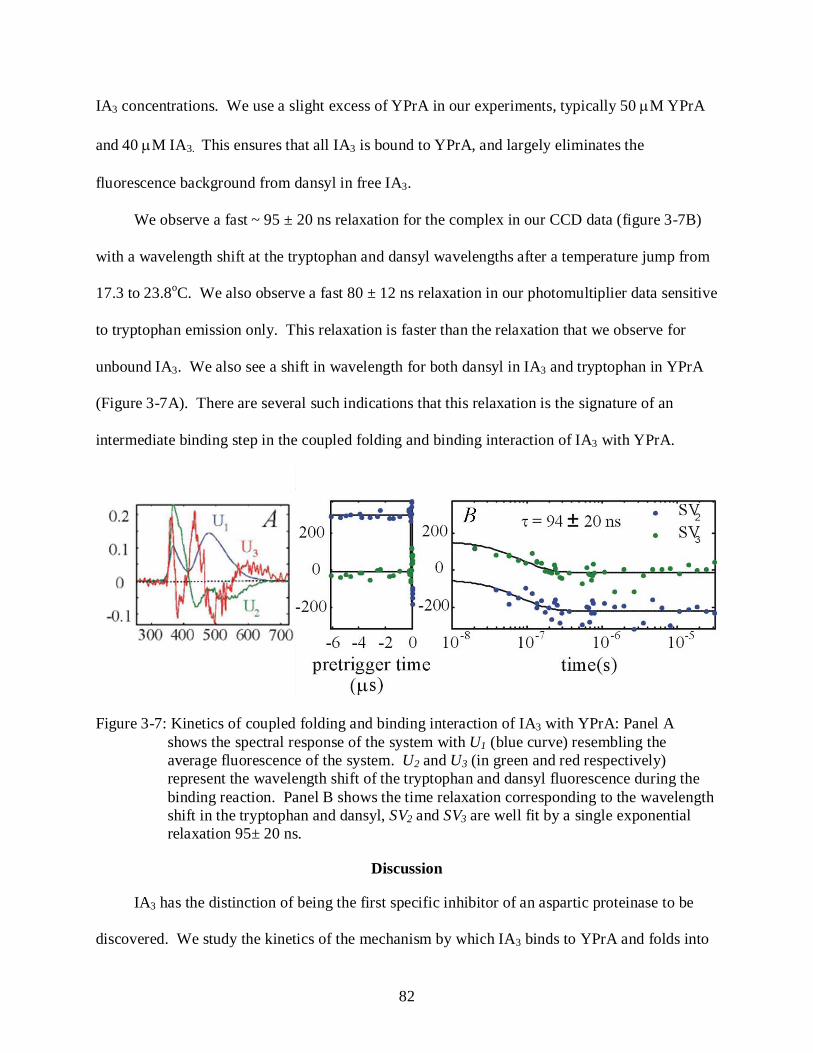
82
IA3 concentrations. We use a slight excess of YPrA in our experiments, typically 50 µM YPrA
and 40 µM IA3. This ensures that all IA3 is bound to YPrA, and largely eliminates the
fluorescence background from dansyl in free IA3.
We observe a fast ~ 95 ± 20 ns relaxation for the complex in our CCD data (figure 3-7B)
with a wavelength shift at the tryptophan and dansyl wavelengths after a temperature jump from
17.3 to 23.8oC. We also observe a fast 80 ± 12 ns relaxation in our photomultiplier data sensitive
to tryptophan emission only. This relaxation is faster than the relaxation that we observe for
unbound IA3. We also see a shift in wavelength for both dansyl in IA3 and tryptophan in YPrA
(Figure 3-7A). There are several such indications that this relaxation is the signature of an
intermediate binding step in the coupled folding and binding interaction of IA3 with YPrA.
Figure 3-7: Kinetics of coupled folding and binding interaction of IA3 with YPrA: Panel A shows the spectral response of the system with U1 (blue curve) resembling the average fluorescence of the system. U2 and U3 (in green and red respectively) represent the wavelength shift of the tryptophan and dansyl fluorescence during the binding reaction. Panel B shows the time relaxation corresponding to the wavelength shift in the tryptophan and dansyl, SV2 and SV3 are well fit by a single exponential relaxation 95± 20 ns.
Discussion
IA3 has the distinction of being the first specific inhibitor of an aspartic proteinase to be
discovered. We study the kinetics of the mechanism by which IA3 binds to YPrA and folds into
83
an alpha helix that blocks access to the enzyme active site. Our approach first decouples the
folding and binding aspects of the interaction, and monitors helix formation in free IA3. The
kinetics of the coupled folding and binding IA3- YPrA interaction are compared against this
control scenario.
Alpha-helix Formation in Proteins
Helix formation as one of the elementary events in the protein folding process has been
the focus of several theoretical (152, 153, 154) and experimental studies (143, 148, 149, 154).
Theoretical studies have recognized the role of two events in the helix formation process: (155,
156) helix initiation or nucleation and helix propagation. Helix initiation involves hydrogen
bond formation between two residues on a chain separated by three peptide bonds and is
entropically expensive. Once the helix is initiated, the bond energy compensates for the loss of
entropy due to fixation of each additional residue. For the first turn in a peptide, this
compensation is not available leading to a free energy barrier to the helix formation process.
Helix initiation (155) can hold up the overall process of helix formation in short peptides, while
helix propagation limits the rate of helix formation in long peptides. It is estimated that peptides
of 20-30 amino acids take 0.3-0.5 µs to fold into an alpha helix (152, 153). This is also observed
in experiments (100, 102, 111, 148, 149, 157, 158). The N-terminus of IA3 is 32 residues long,
and predicted to fold in 200-300 ns. Our experiments with IA3 in TFE indicate a relatively
sluggish folder that takes close to 3-5 µs to fold. This would imply inefficient nucleation in the
absence of stabilizing contacts with YPrA.
In the context of binding induced folding, a previous theoretical study of dimeric coiled-
coil GCN4 peptide folding has indicated that folding is faster with the collision of two
unstructured chains than collision of two preformed helices. This implies that the interaction of
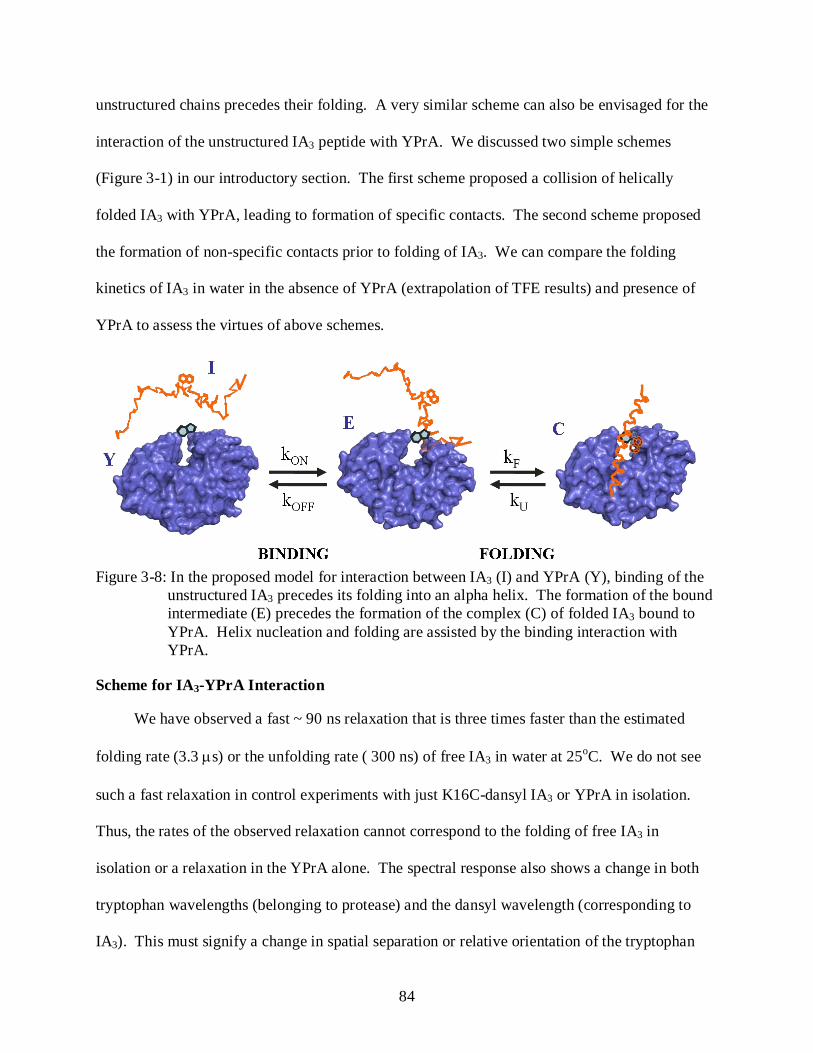
84
unstructured chains precedes their folding. A very similar scheme can also be envisaged for the
interaction of the unstructured IA3 peptide with YPrA. We discussed two simple schemes
(Figure 3-1) in our introductory section. The first scheme proposed a collision of helically
folded IA3 with YPrA, leading to formation of specific contacts. The second scheme proposed
the formation of non-specific contacts prior to folding of IA3. We can compare the folding
kinetics of IA3 in water in the absence of YPrA (extrapolation of TFE results) and presence of
YPrA to assess the virtues of above schemes.
Figure 3-8: In the proposed model for interaction between IA3 (I) and YPrA (Y), binding of the
unstructured IA3 precedes its folding into an alpha helix. The formation of the bound intermediate (E) precedes the formation of the complex (C) of folded IA3 bound to YPrA. Helix nucleation and folding are assisted by the binding interaction with YPrA.
Scheme for IA3-YPrA Interaction
We have observed a fast ~ 90 ns relaxation that is three times faster than the estimated
folding rate (3.3 µs) or the unfolding rate ( 300 ns) of free IA3 in water at 25oC. We do not see
such a fast relaxation in control experiments with just K16C-dansyl IA3 or YPrA in isolation.
Thus, the rates of the observed relaxation cannot correspond to the folding of free IA3 in
isolation or a relaxation in the YPrA alone. The spectral response also shows a change in both
tryptophan wavelengths (belonging to protease) and the dansyl wavelength (corresponding to
IA3). This must signify a change in spatial separation or relative orientation of the tryptophan
85
residues of the protease and the dansyl in K16C-dansyl IA3. We can conclude that the 90 ns
relaxation cannot arise from the folding or unfolding step of the IA3 alone, but that it corresponds
to an interaction between IA3 and YPrA. Since the folding kinetics of free IA3 are significantly
different from those of folding coupled to binding, and the spectral response shows a change in
the fluorescence of both donor and acceptor, scheme I can be eliminated.
Origin of Fast ~ 90 ns Relaxation
We now need to identify the source of the fast 90 ns relaxation. For KI = 1nM, [IA3] =
40 µM, [YPrA] = 50 µM and a relaxation of 90 ns, the simplest two state association model
would have rates kON, kOFF that follow kON/kOFF = KI and kON [extra YPrA] + kOFF = 1/krelax. We
have 10 µM extra YPrA in our experiments, which suggests two possibilities. One possibility is
that the relaxation is large because the rate of association is large, i.e. the order of 1012 (Ms)-1.
However, this result exceeds the diffusion-limited rate of 109 (Ms)-1 by several orders of
magnitude and is therefore unphysical. The other possibility is that the rate of disassociation is
large i.e. of the order of 107/s. This suggests a very weak association of IA3 and YPrA, which
could lead to tight inhibition only if kON is also very fast. Even for diffusion limited association
kON ~ 109(Ms)-1, the disassociation rate kOFF ~ 107(Ms)-1 gives [I] [Y]/ [E] = kOFF/kON ~ 0.01 M.
This makes the binding affinity of IA3 for YPrA close to 1M. In the light of the high binding
affinity of IA3 for YPrA (KI ~ 1 nM), it is then difficult to explain the combination of weak
association with very fast kinetics. Even for diffusion limited association kON ~ 109(Ms)-1, the
disassociation rate kOFF ~ 107(Ms)-1 gives [I] [Y]/ [E] = kOFF/kON ~ 0.01 M. A sub-nanomolar
binding affinity is possible in this scenario only if C is favored over E (figure 3-8) by a factor of
107. Since only a small population ~ 10% of IA3 is helically folded in water, this would
necessitate an association that enhances the folded sub-population of IA3 by eight orders of

86
magnitude. These estimates are hard to believe especially since the literature on folding and
binding in proteins suggests typical association rates of 106(Ms)-1 and disassociation rates of 10-
100 /s (68, 69, 81).
Based on the above arguments, we conclude that the fast relaxation observed does not
correspond to the association of IA3 with YPrA, but rather the folding/unfolding step in scheme
II. We also see an increase in donor signal, signifying an enhanced separation between
tryptophan in YPrA and dansyl in IA3, due to unfolding of the IA3 helix at the active site. We
see a very fast 80-90 ns relaxation that is nearly threefold faster than the expected rate of IA3
unfolding in water (~300 ns), implying that the binding interaction accelerates the
folding/unfolding kinetics of IA3. To achieve sub-nanomolar inhibition, the complex C should
be favored over E, implying that the 80-90 ns relaxation is really dominated by the folding rate
of IA3 (kF). So, kF >> kU, with kF + kU ~ (90ns)-1. This implies that the relaxation we observe is
the folding rate of IA3 in contact with YPrA. Thus interaction with YPrA accelerates the folding
process of IA3 by three orders of magnitude to a folding rate that is comparable to the rates of the
fastest folding helices in the protein folding (100, 143, 148, 157) literature.
Future Research
Our studies point towards a mechanism of interaction where IA3 forms an encounter
complex, and uses YPrA as a template to assist its folding. Our studies have focused on the
interaction of the N-terminus of IA3 with YPrA, as it is crucial to inhibitory action. Studies
indicate that N-terminal extension of IA3 peptides can relax the selectivity of IA3 towards YPrA,
but the deletion or mutation of the C-terminus does not have such effects. NMR studies show
interactions between YPrA with C-terminal residues of IA3. The 15N HSQC peaks for three
residues in the C-terminus (G40, G62 and G64) are seen to broaden and then disappear with
addition of sub-stoichiometric quantities of YPrA. It is intriguing that the residues of the C-
87
terminus interact with the protease, but they do not affect the equilibrium constant for inhibition.
This suggests the interesting possibility of the C-terminus binding to YPrA by long-range
contacts and forming the intermediate complex. We could speculate that this steers the peptide
so that the N-terminus can fold and bind to the active site. This is similar to the fly-casting
scheme (65), which suggests that long- range contacts initiate the formation of a bound
intermediate that promotes folding and binding. Future investigations of IA3-YPrA interaction
kinetics with mutants would be useful in determining the nature of these interactions that
stabilize the bound and folded state of IA3.
Summary
Our kinetic study of IA3 folding coupled to its binding interaction with YPrA is possibly
the very first investigation of the events underlying the inhibition of YPrA by IA3.
We have characterized the equilibrium thermodynamics of the helix to coil transition in
free IA3 as a function of the helix promoting co-solvent TFE and temperature. Our estimate of
the free energy of unfolding ∆G for each solvent condition from the aforementioned analysis
enables us to extract the folding and unfolding rates of free IA3 from its relaxation after a
nanosecond temperature jump. These rates can be extrapolated to water to estimate the folding
rates of free IA3 in water. The folding rates of free IA3 in water can then be compared to the
relaxation observed following a thermal perturbation of a complex of IA3 and YPrA. The fast
relaxation in that system seems to indicate that IA3 and YPrA form a transient unfolded
intermediate prior to forming the bound complex – Scheme II in figure 3-1. Our observations
point towards a fly-casting mode of interaction where the intrinsically disordered peptide
interacts with YPrA forming an intermediate and then uses the protease as a template to facilitate
its helical folding.

88
We have a better understanding of the events leading to inhibition of YPrA by IA3. Our
study does not directly identify the interactions at the residue level that stabilize the folded state
of the peptide. Simulation or experimental studies of mutants without key residues can enrich
our understanding of the IA3-YPrA system at the molecular level. Experiments suggest that the
C-terminus of IA3 far from the binding domain interacts with the protease and yet does not affect
the inhibition constant of the reaction. Future experiments that identify the role of the C-
terminus would greatly enhance our current understanding of the specific details of the inhibition
reaction.
89
CHAPTER 4 HETEROGENEOUS FOLDING KINETICS OF TRYPTOPHAN ZIPPER
Introduction
The free energy surface of protein folding is visualized as a funnel (6, 7, 8, 159, 159, 160)
where the protein moves from regions of high conformational energy (the unfolded state) to
regions of low conformational energy (the folded state). The topology of this folding funnel
(160, 8) influences the folding route taken by the protein molecule. If the shape of the free
energy is such that the trajectories of all protein molecules are confined to a narrow region of
conformational space, a single folding pathway can describe folding satisfactorily. There are
proteins whose energy terrain is such that the trajectories of different protein molecules pass
through broad regions of conformational space. The presence of multiple folding routes in such
proteins is observed by different folding behavior in a variety of experimental studies (8, 119,
161, 162, 163). Kinetic studies of multi-state folding thus offer a unique insight into the events
that drive folding as the protein explores its conformation and energy options by diffusion.
Kramers theory of reaction rates (25) can effectively describe the effects of friction on the
dynamics of diffusion for the protein. The theory proposes that in the limit of strong frictional
damping, the protein folding rates scale inversely with the frictional drag coefficient that appears
in the Langevin equations of motion for the protein molecule in the medium. This frictional drag
is often attributed to the dynamic viscosity of the solvent ηs. Experiments on protein folding in
different regimes of solvent viscosity (27, 28, 29, 34, 36, 37, 164) indicate the existence of two
timescales. One is the timescale determined by the friction external to the protein and varies
with solvent viscosity (28, 37). The second timescale is set by internal friction effects, which do
not vary with solvent viscosity. Studies have focused so far on the influence of solvent viscosity
on the rate of folding along one pathway (28, 29, 32, 33, 34, 36).
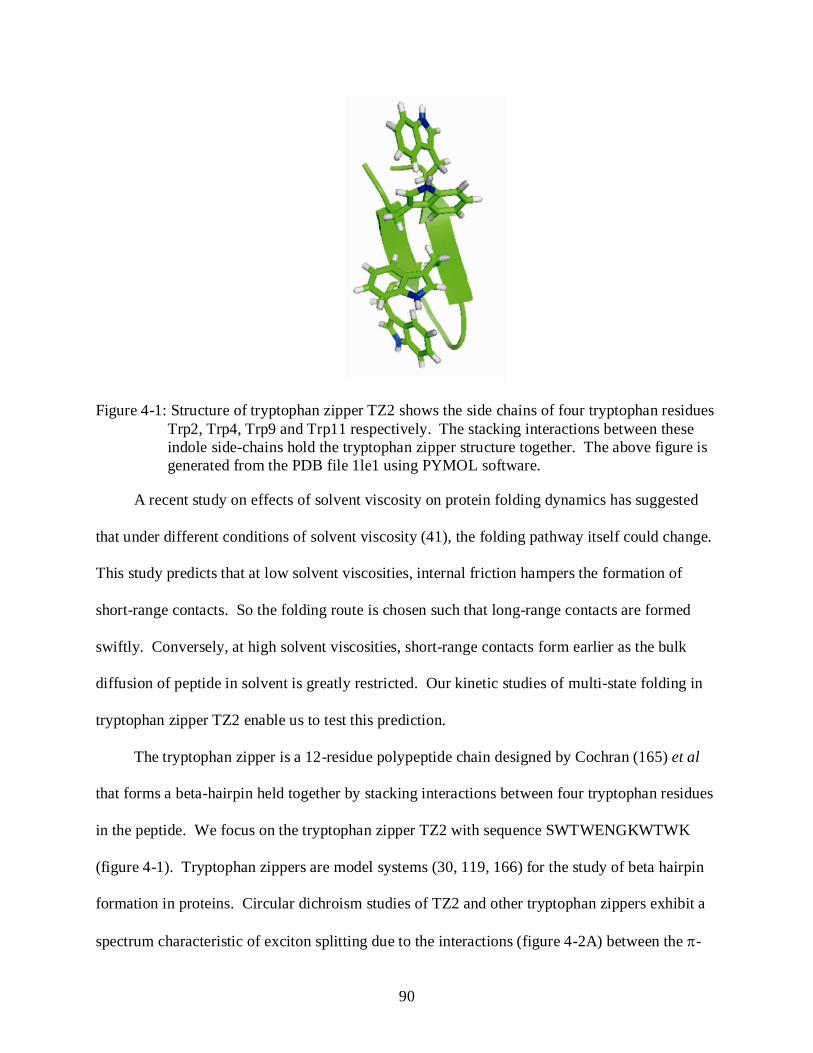
90
Figure 4-1: Structure of tryptophan zipper TZ2 shows the side chains of four tryptophan residues Trp2, Trp4, Trp9 and Trp11 respectively. The stacking interactions between these indole side-chains hold the tryptophan zipper structure together. The above figure is generated from the PDB file 1le1 using PYMOL software.
A recent study on effects of solvent viscosity on protein folding dynamics has suggested
that under different conditions of solvent viscosity (41), the folding pathway itself could change.
This study predicts that at low solvent viscosities, internal friction hampers the formation of
short-range contacts. So the folding route is chosen such that long-range contacts are formed
swiftly. Conversely, at high solvent viscosities, short-range contacts form earlier as the bulk
diffusion of peptide in solvent is greatly restricted. Our kinetic studies of multi-state folding in
tryptophan zipper TZ2 enable us to test this prediction.
The tryptophan zipper is a 12-residue polypeptide chain designed by Cochran (165) et al
that forms a beta-hairpin held together by stacking interactions between four tryptophan residues
in the peptide. We focus on the tryptophan zipper TZ2 with sequence SWTWENGKWTWK
(figure 4-1). Tryptophan zippers are model systems (30, 119, 166) for the study of beta hairpin
formation in proteins. Circular dichroism studies of TZ2 and other tryptophan zippers exhibit a
spectrum characteristic of exciton splitting due to the interactions (figure 4-2A) between the π-
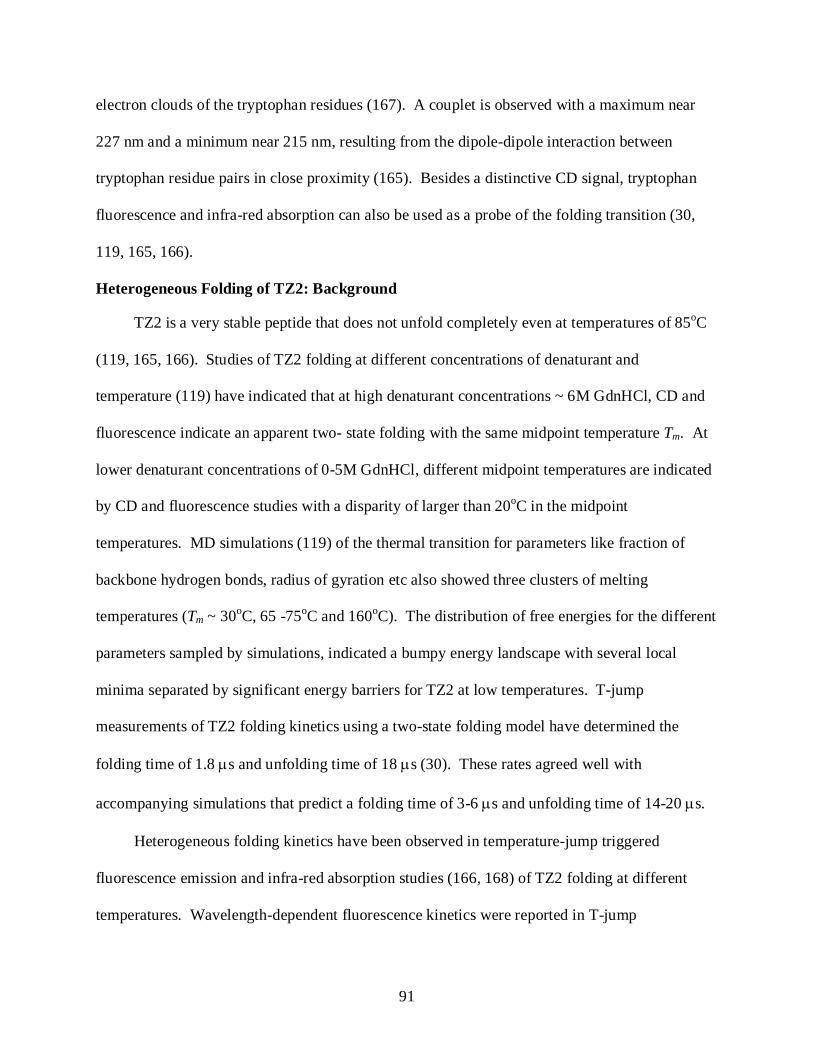
91
electron clouds of the tryptophan residues (167). A couplet is observed with a maximum near
227 nm and a minimum near 215 nm, resulting from the dipole-dipole interaction between
tryptophan residue pairs in close proximity (165). Besides a distinctive CD signal, tryptophan
fluorescence and infra-red absorption can also be used as a probe of the folding transition (30,
119, 165, 166).
Heterogeneous Folding of TZ2: Background
TZ2 is a very stable peptide that does not unfold completely even at temperatures of 85oC
(119, 165, 166). Studies of TZ2 folding at different concentrations of denaturant and
temperature (119) have indicated that at high denaturant concentrations ~ 6M GdnHCl, CD and
fluorescence indicate an apparent two- state folding with the same midpoint temperature Tm. At
lower denaturant concentrations of 0-5M GdnHCl, different midpoint temperatures are indicated
by CD and fluorescence studies with a disparity of larger than 20oC in the midpoint
temperatures. MD simulations (119) of the thermal transition for parameters like fraction of
backbone hydrogen bonds, radius of gyration etc also showed three clusters of melting
temperatures (Tm ~ 30oC, 65 -75oC and 160oC). The distribution of free energies for the different
parameters sampled by simulations, indicated a bumpy energy landscape with several local
minima separated by significant energy barriers for TZ2 at low temperatures. T-jump
measurements of TZ2 folding kinetics using a two-state folding model have determined the
folding time of 1.8 µs and unfolding time of 18 µs (30). These rates agreed well with
accompanying simulations that predict a folding time of 3-6 µs and unfolding time of 14-20 µs.
Heterogeneous folding kinetics have been observed in temperature-jump triggered
fluorescence emission and infra-red absorption studies (166, 168) of TZ2 folding at different
temperatures. Wavelength-dependent fluorescence kinetics were reported in T-jump
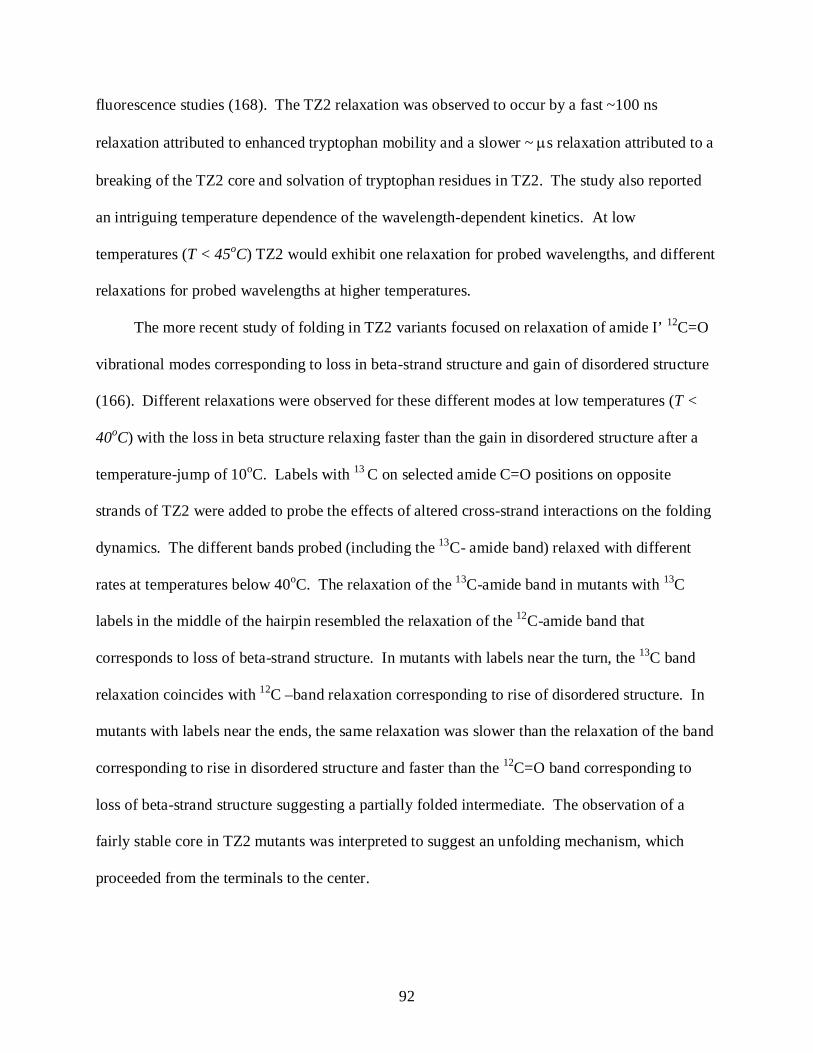
92
fluorescence studies (168). The TZ2 relaxation was observed to occur by a fast ~100 ns
relaxation attributed to enhanced tryptophan mobility and a slower ~ µs relaxation attributed to a
breaking of the TZ2 core and solvation of tryptophan residues in TZ2. The study also reported
an intriguing temperature dependence of the wavelength-dependent kinetics. At low
temperatures (T < 45oC) TZ2 would exhibit one relaxation for probed wavelengths, and different
relaxations for probed wavelengths at higher temperatures.
The more recent study of folding in TZ2 variants focused on relaxation of amide I’ 12C=O
vibrational modes corresponding to loss in beta-strand structure and gain of disordered structure
(166). Different relaxations were observed for these different modes at low temperatures (T <
40oC) with the loss in beta structure relaxing faster than the gain in disordered structure after a
temperature-jump of 10oC. Labels with 13 C on selected amide C=O positions on opposite
strands of TZ2 were added to probe the effects of altered cross-strand interactions on the folding
dynamics. The different bands probed (including the 13C- amide band) relaxed with different
rates at temperatures below 40oC. The relaxation of the 13C-amide band in mutants with 13C
labels in the middle of the hairpin resembled the relaxation of the 12C-amide band that
corresponds to loss of beta-strand structure. In mutants with labels near the turn, the 13C band
relaxation coincides with 12C –band relaxation corresponding to rise of disordered structure. In
mutants with labels near the ends, the same relaxation was slower than the relaxation of the band
corresponding to rise in disordered structure and faster than the 12C=O band corresponding to
loss of beta-strand structure suggesting a partially folded intermediate. The observation of a
fairly stable core in TZ2 mutants was interpreted to suggest an unfolding mechanism, which
proceeded from the terminals to the center.
93
We are motivated to understand this heterogeneity in folding behavior in TZ2 by studying
the kinetic response of TZ2 fluorescence after a temperature-jump at different temperatures and
in solvents of varying viscosities. We need to add guanidine hydrochloride to enhance the
temperature-jump signal as the fraction of unfolded TZ2 molecules is very small (~10%) at room
temperature in plain buffer. Addition of guanidine hydrochloride increases the fraction of
unfolded TZ2 by reducing the denaturation (melting) temperature of the peptide.
We vary the viscosity of solvents by adding ethylene glycol (0-50% by weight) (33) to
50 mM phosphate buffer maintained at pH 7.0. The kinematic viscosity of solvents with
ethylene glycol (maximum ~ 4× ηwater) was measured by Leslie Pelakh in our laboratory with a
Cannon-Fenske viscometer immersed in a temperature-controlled water bath. It is important in
such studies (165) to verify that the stability of the protein is not affected by the change in
solvent composition. Therefore, we employ equilibrium circular dichroism (CD) to characterize
the folding transition of TZ2 in ethylene glycol at various temperatures. We observe that
although ethylene glycol enhances the viscosity of the protein solvents, it does not stabilize or
destabilize the folded state of TZ2. We then study the folding kinetics of TZ2 in five different
concentrations of ethylene glycol from 0-50% by weight in buffered solutions of pH 7.0 with 2M
guanidine hydrochloride.
We observe two relaxations in our temperature-jump experiments; one is fast (~100 ns)
while the other is slow (~ µs) and well described by a single exponential. These two relaxations
correspond to changes in tryptophan fluorescence intensity and a red shift in wavelength of peak
emission of tryptophan in TZ2 after the temperature-jump. As we alter the conditions of
temperature and viscosity, we observe different kinetic responses for the change in fluorescence
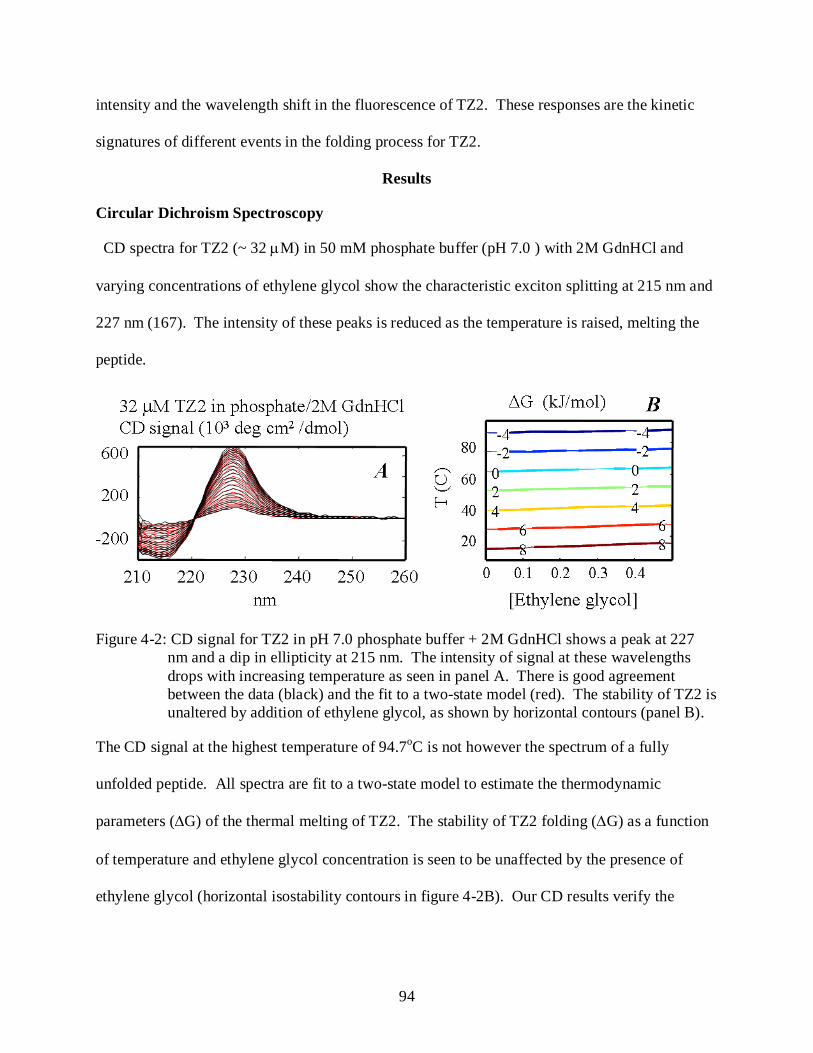
94
intensity and the wavelength shift in the fluorescence of TZ2. These responses are the kinetic
signatures of different events in the folding process for TZ2.
Results
Circular Dichroism Spectroscopy
CD spectra for TZ2 (~ 32 µM) in 50 mM phosphate buffer (pH 7.0 ) with 2M GdnHCl and
varying concentrations of ethylene glycol show the characteristic exciton splitting at 215 nm and
227 nm (167). The intensity of these peaks is reduced as the temperature is raised, melting the
peptide.
Figure 4-2: CD signal for TZ2 in pH 7.0 phosphate buffer + 2M GdnHCl shows a peak at 227 nm and a dip in ellipticity at 215 nm. The intensity of signal at these wavelengths drops with increasing temperature as seen in panel A. There is good agreement between the data (black) and the fit to a two-state model (red). The stability of TZ2 is unaltered by addition of ethylene glycol, as shown by horizontal contours (panel B).
The CD signal at the highest temperature of 94.7oC is not however the spectrum of a fully
unfolded peptide. All spectra are fit to a two-state model to estimate the thermodynamic
parameters (∆G) of the thermal melting of TZ2. The stability of TZ2 folding (∆G) as a function
of temperature and ethylene glycol concentration is seen to be unaffected by the presence of
ethylene glycol (horizontal isostability contours in figure 4-2B). Our CD results verify the
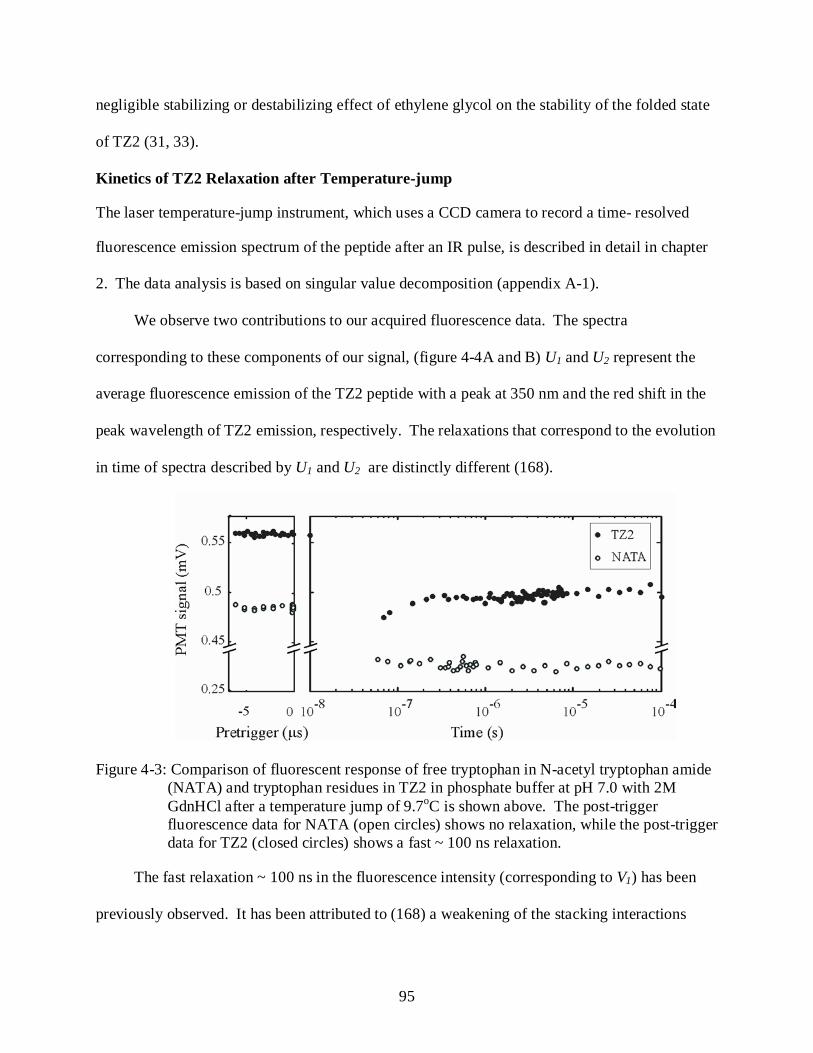
95
negligible stabilizing or destabilizing effect of ethylene glycol on the stability of the folded state
of TZ2 (31, 33).
Kinetics of TZ2 Relaxation after Temperature-jump
The laser temperature-jump instrument, which uses a CCD camera to record a time- resolved
fluorescence emission spectrum of the peptide after an IR pulse, is described in detail in chapter
2. The data analysis is based on singular value decomposition (appendix A-1).
We observe two contributions to our acquired fluorescence data. The spectra
corresponding to these components of our signal, (figure 4-4A and B) U1 and U2 represent the
average fluorescence emission of the TZ2 peptide with a peak at 350 nm and the red shift in the
peak wavelength of TZ2 emission, respectively. The relaxations that correspond to the evolution
in time of spectra described by U1 and U2 are distinctly different (168).
Figure 4-3: Comparison of fluorescent response of free tryptophan in N-acetyl tryptophan amide (NATA) and tryptophan residues in TZ2 in phosphate buffer at pH 7.0 with 2M GdnHCl after a temperature jump of 9.7oC is shown above. The post-trigger fluorescence data for NATA (open circles) shows no relaxation, while the post-trigger data for TZ2 (closed circles) shows a fast ~ 100 ns relaxation.
The fast relaxation ~ 100 ns in the fluorescence intensity (corresponding to V1) has been
previously observed. It has been attributed to (168) a weakening of the stacking interactions
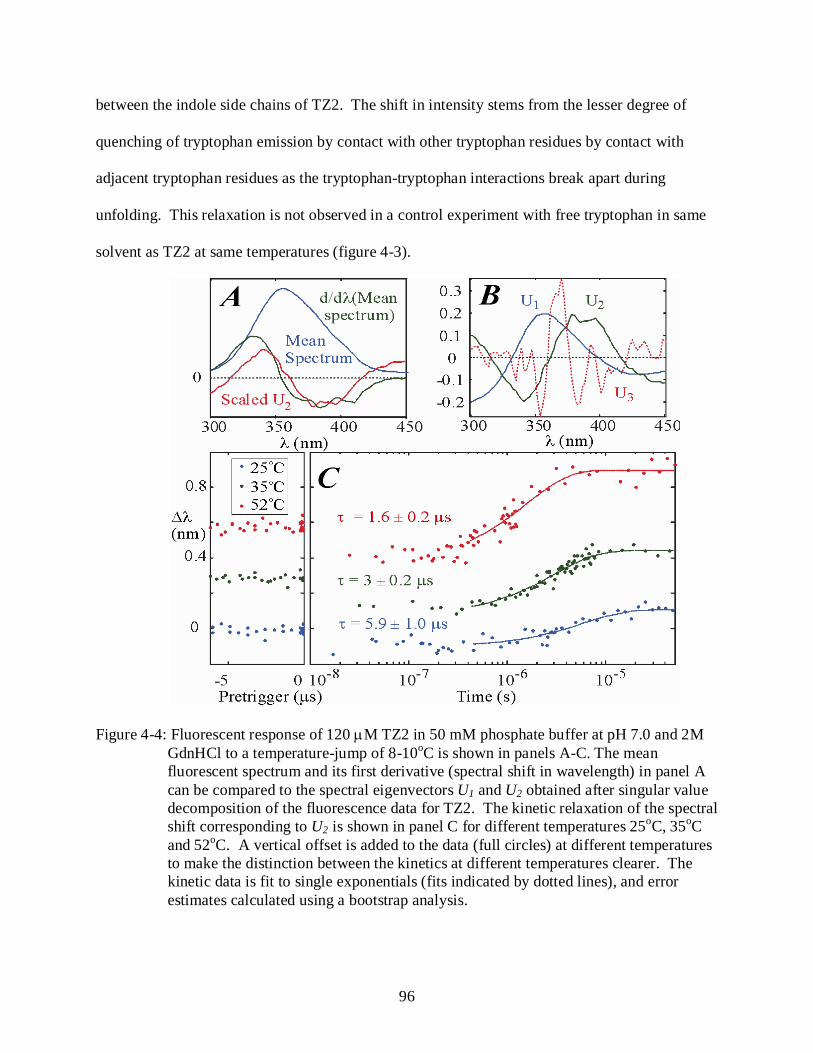
96
between the indole side chains of TZ2. The shift in intensity stems from the lesser degree of
quenching of tryptophan emission by contact with other tryptophan residues by contact with
adjacent tryptophan residues as the tryptophan-tryptophan interactions break apart during
unfolding. This relaxation is not observed in a control experiment with free tryptophan in same
solvent as TZ2 at same temperatures (figure 4-3).
Figure 4-4: Fluorescent response of 120 µM TZ2 in 50 mM phosphate buffer at pH 7.0 and 2M GdnHCl to a temperature-jump of 8-10oC is shown in panels A-C. The mean fluorescent spectrum and its first derivative (spectral shift in wavelength) in panel A can be compared to the spectral eigenvectors U1 and U2 obtained after singular value decomposition of the fluorescence data for TZ2. The kinetic relaxation of the spectral shift corresponding to U2 is shown in panel C for different temperatures 25oC, 35oC and 52oC. A vertical offset is added to the data (full circles) at different temperatures to make the distinction between the kinetics at different temperatures clearer. The kinetic data is fit to single exponentials (fits indicated by dotted lines), and error estimates calculated using a bootstrap analysis.
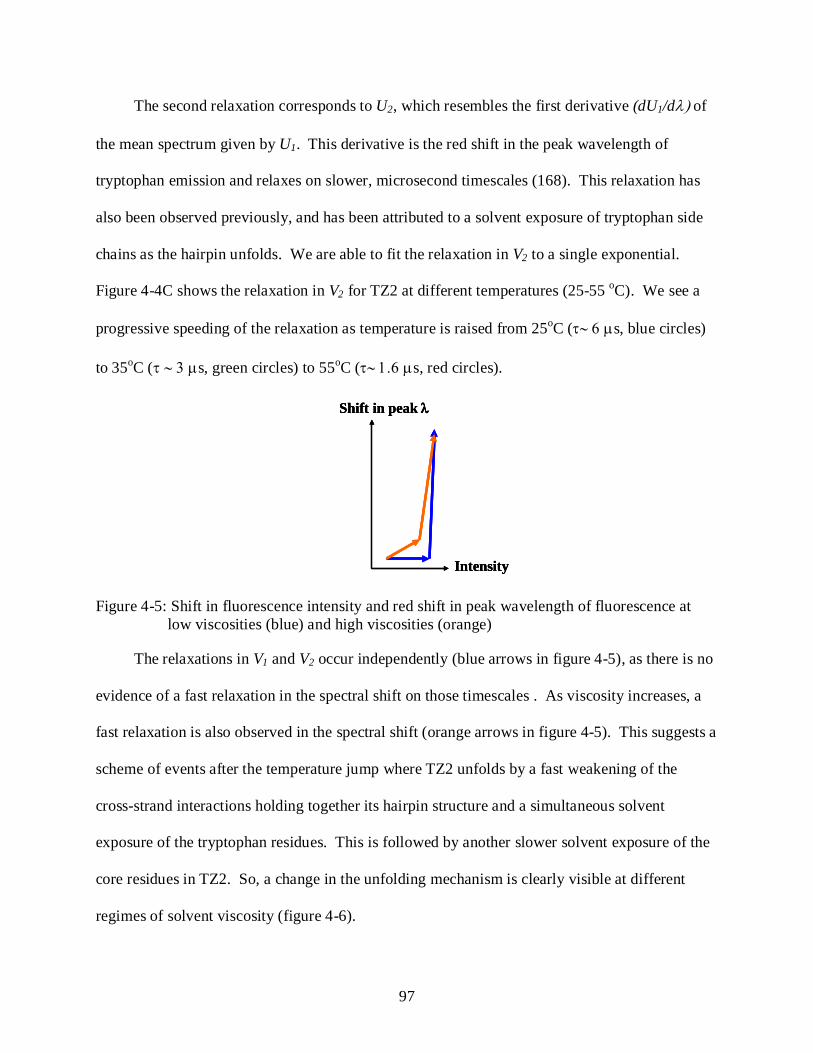
97
The second relaxation corresponds to U2, which resembles the first derivative (dU1/dλ) of
the mean spectrum given by U1. This derivative is the red shift in the peak wavelength of
tryptophan emission and relaxes on slower, microsecond timescales (168). This relaxation has
also been observed previously, and has been attributed to a solvent exposure of tryptophan side
chains as the hairpin unfolds. We are able to fit the relaxation in V2 to a single exponential.
Figure 4-4C shows the relaxation in V2 for TZ2 at different temperatures (25-55 oC). We see a
progressive speeding of the relaxation as temperature is raised from 25oC (τ∼ 6 µs, blue circles)
to 35oC (τ ∼ 3 µs, green circles) to 55oC (τ∼ 1.6 µs, red circles).
Intensity
Shift in peak λ
Intensity
Shift in peak λ
Intensity
Shift in peak λ
Figure 4-5: Shift in fluorescence intensity and red shift in peak wavelength of fluorescence at low viscosities (blue) and high viscosities (orange)
The relaxations in V1 and V2 occur independently (blue arrows in figure 4-5), as there is no
evidence of a fast relaxation in the spectral shift on those timescales . As viscosity increases, a
fast relaxation is also observed in the spectral shift (orange arrows in figure 4-5). This suggests a
scheme of events after the temperature jump where TZ2 unfolds by a fast weakening of the
cross-strand interactions holding together its hairpin structure and a simultaneous solvent
exposure of the tryptophan residues. This is followed by another slower solvent exposure of the
core residues in TZ2. So, a change in the unfolding mechanism is clearly visible at different
regimes of solvent viscosity (figure 4-6).
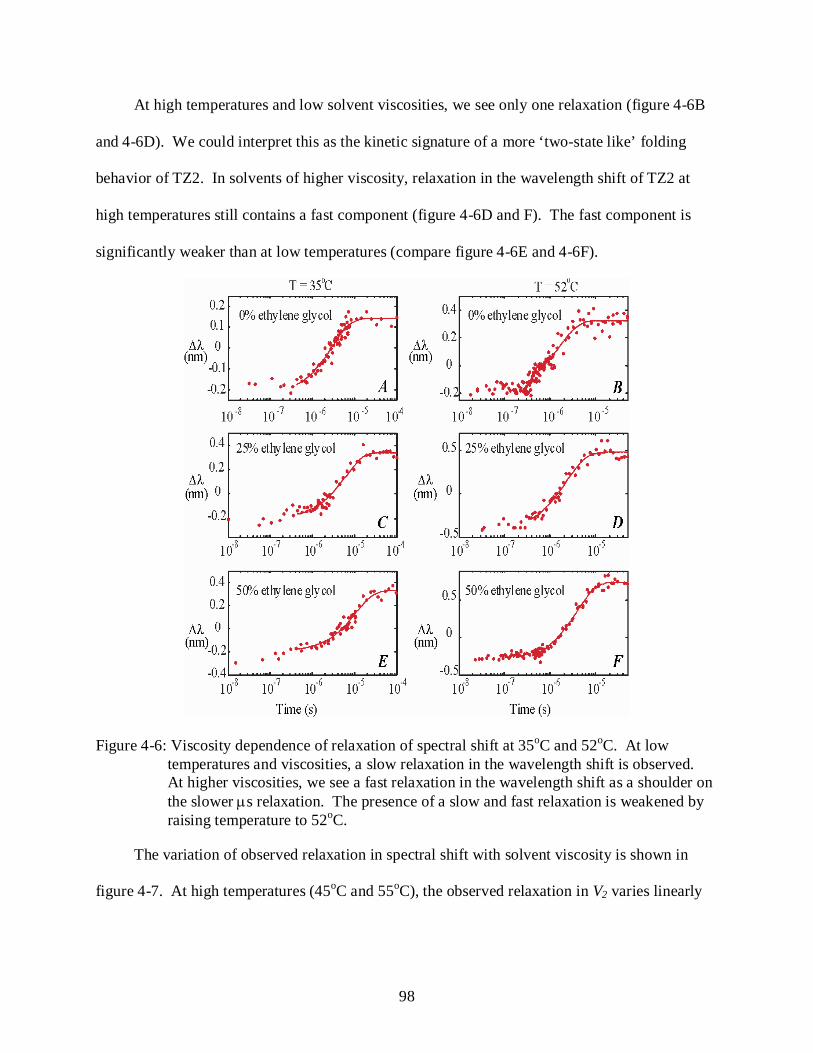
98
At high temperatures and low solvent viscosities, we see only one relaxation (figure 4-6B
and 4-6D). We could interpret this as the kinetic signature of a more ‘two-state like’ folding
behavior of TZ2. In solvents of higher viscosity, relaxation in the wavelength shift of TZ2 at
high temperatures still contains a fast component (figure 4-6D and F). The fast component is
significantly weaker than at low temperatures (compare figure 4-6E and 4-6F).
Figure 4-6: Viscosity dependence of relaxation of spectral shift at 35oC and 52oC. At low temperatures and viscosities, a slow relaxation in the wavelength shift is observed. At higher viscosities, we see a fast relaxation in the wavelength shift as a shoulder on the slower µs relaxation. The presence of a slow and fast relaxation is weakened by raising temperature to 52oC.
The variation of observed relaxation in spectral shift with solvent viscosity is shown in
figure 4-7. At high temperatures (45oC and 55oC), the observed relaxation in V2 varies linearly
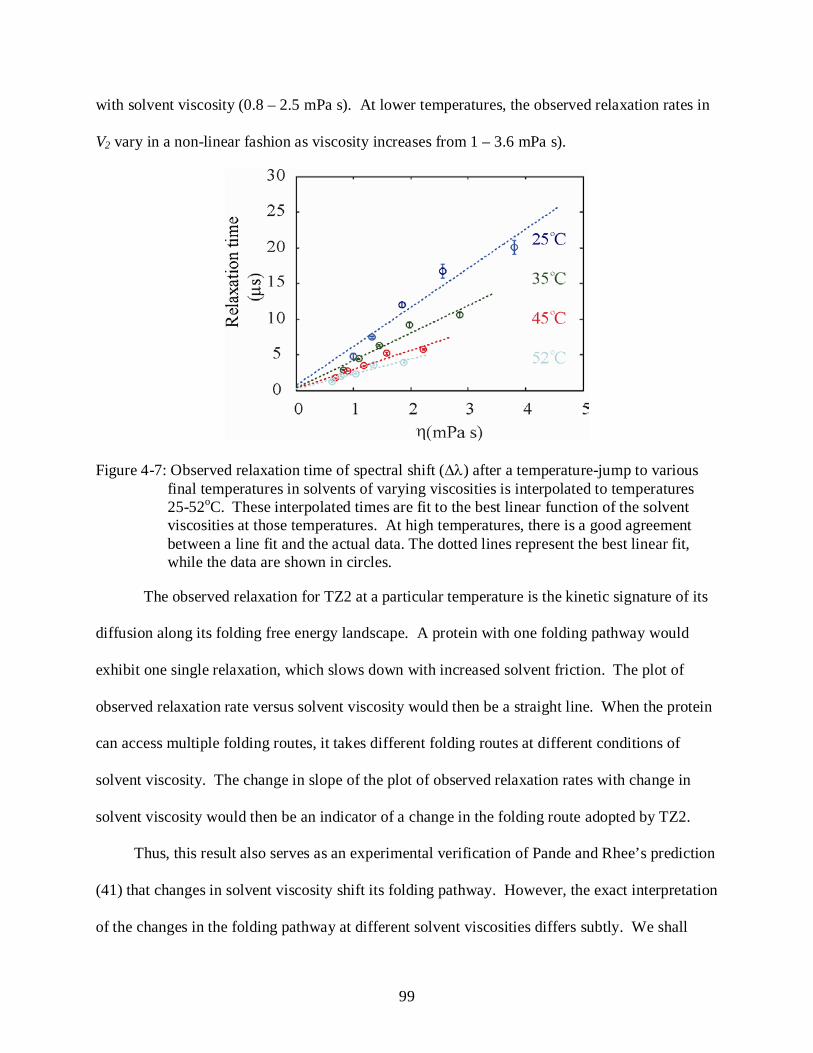
99
with solvent viscosity (0.8 – 2.5 mPa s). At lower temperatures, the observed relaxation rates in
V2 vary in a non-linear fashion as viscosity increases from 1 – 3.6 mPa s).
Figure 4-7: Observed relaxation time of spectral shift (∆λ) after a temperature-jump to various final temperatures in solvents of varying viscosities is interpolated to temperatures 25-52oC. These interpolated times are fit to the best linear function of the solvent viscosities at those temperatures. At high temperatures, there is a good agreement between a line fit and the actual data. The dotted lines represent the best linear fit, while the data are shown in circles.
The observed relaxation for TZ2 at a particular temperature is the kinetic signature of its
diffusion along its folding free energy landscape. A protein with one folding pathway would
exhibit one single relaxation, which slows down with increased solvent friction. The plot of
observed relaxation rate versus solvent viscosity would then be a straight line. When the protein
can access multiple folding routes, it takes different folding routes at different conditions of
solvent viscosity. The change in slope of the plot of observed relaxation rates with change in
solvent viscosity would then be an indicator of a change in the folding route adopted by TZ2.
Thus, this result also serves as an experimental verification of Pande and Rhee’s prediction
(41) that changes in solvent viscosity shift its folding pathway. However, the exact interpretation
of the changes in the folding pathway at different solvent viscosities differs subtly. We shall
100
discuss the expected changes in the folding pathway as predicted by Rhee’s results and our
observations of the changes in the folding pathway in TZ2 in the next section. The non-linear
response of TZ2 folding kinetics to increases in solvent viscosity is more pronounced at low (T ≤
35oC) temperatures. This suggests that TZ2 folding tends to be multi-state at these temperatures.
Discussion
The rate at which a polypeptide chain diffuses through the solvent physically (28, 29, 36,
37) limits the overall rate of protein folding. Both solvent friction external to solvent, as well as
internal friction due to intra-chain interactions influences the diffusional dynamics of the protein.
Similar experiments in the past have focused on simple proteins with one folding pathway (28,
29, 37, 157), where different sources of friction influence the rates of folding along the folding
route differently. Our studies of TZ2 folding in different regimes of solvent viscosity indicate
that these different sources of friction can also influence the folding route adopted by the protein.
TZ2 folding has been observed to be heterogeneous at varying conditions of temperature
and denaturant concentration. The interpretation of this heterogeneity has been different in
different studies probed by UV-circular dichroism, fluorescence, and infrared absorption inTZ2
(30, 119, 166, 168). One previous study of TZ2 folding kinetics at different temperatures in 2M
GdnHCl observed two different microsecond relaxations at temperatures exceeding 45oC. These
relaxations corresponded to the fluorescence intensity of TZ2 at different wavelengths (168) and
were attributed to sampling of different local minima on the free energy landscape. A recent
study found this heterogeneity in folding kinetics to be temperature-dependent but with multi-
state folding at low temperatures and two-state like folding at high temperatures. This was
explained in terms of the rougher folding energy landscape for TZ2 at low temperatures (166).
Our studies of TZ2 folding in phosphate buffer with 2M GdnHCl definitely confirm the
multi-state nature of folding at low temperatures. The fluorescence intensity and the peak
101
wavelength of the fluorescence emission traverse different trajectories along the energy
landscape as shown (figure 4-3) by the different relaxations in the V1 and V2 kinetic vectors over
all wavelengths. We observe a fast ~ 100 ns relaxation in V1 for the mean fluorescence intensity
followed by a slower ~ µs relaxation for the red shift in wavelength for TZ2 emission. The fast
relaxation of the fluorescence intensity can be attributed to the weakening of stacking
interactions holding the hairpin together. The slower wavelength shift is the effect of a slower
solvation of residues involved in the stacking interactions. This suggests an unfolding
mechanism where the interactions holding the TZ2 hairpin structure together break apart first ,
followed by slower solvation exposure. As solvent viscosity is enhanced, the relaxations
progress from being independent (figure 4-4 and 4-5A) to the situation where both fast and slow
relaxations are observed in the red shift in wavelength. The mechanism of unfolding the hairpin
now progresses by a fast simultaneous rupture of the interactions holding the hairpin together
and solvent exposure of the tryptophan residues in the core, followed by a slower solvent
exposure of core residues. This is a change in the folding route adopted by the protein molecule.
This change in the folding route can be induced by a subtle shift in the balance of influence from
friction external to the protein and internal friction internal to the protein. The influence of
solvent viscosity on the folding routes is weakened at high temperatures (figure 4-5B and 4-5F).
In fact at low solvent viscosities and high temperatures, TZ2 folding resembles a two-state
transition.
Our experiments demonstrate the use of solvent-tuning the folding pathways adopted by
TZ2 at various temperatures (figure 4.6). The rough free energy landscape accessible to TZ2 can
be ‘smoothed’ by increases in temperature (119, 166). The solvent friction on the other hand
influences the roughness of the same landscape in a complex manner. So, if increases in
102
temperature can change the folding of TZ2 from multi-state to apparent two-state folding,
increases in medium friction can potentially enable TZ2 to sample multiple folding routes (figure
4-5) even at higher temperatures. A recent study by Pande and Rhee predicted that at low
solvent viscosities, the protein folding would occur by early formation of long-range contacts.
At high viscosities, it would occur by early compaction followed by formation of long-range
contacts. Our studies of TZ2 folding kinetics suggest a different change in folding mechanism.
At low solvent viscosity (~ηwater), unfolding occurs by a fast rupture of the hairpin followed by
solvation of the core. Reversibly, folding would occur by solvent exclusion (compaction)
followed by long-range contact formation. At high solvent viscosity (~ 3-4× ηwater), we observe
the kinetic signature of a folding mechanism that involves simultaneous compaction and
interactions between the cross-strands of TZ2.
The access to different folding routes can enable an enriched understanding of the energy
landscape of folding for TZ2 and the different possible schemes of events underlying the
formation of beta hairpin structure in TZ2. It also opens up the possibility of future experiments
on TZ2 mutants with site-specific fluorescent labels, so that we may understand better the events
that limit the rate of hairpin formation in TZ2. These events could include turn formation and
the formation of contacts that stabilize the core of TZ2.
Conclusions
Kinetic studies of TZ2 folding in solvents with varying concentrations of ethylene glycol
are conducted to study multi-state folding at different conditions of solvent viscosity and
temperatures. The fluorescence intensity and the peak wavelength of the fluorescence emission
traverse different trajectories along the energy landscape as shown (figure 4-3) by the different
relaxations in the V1 and V2 kinetic vectors over all wavelengths. This confirms the (30, 119)
103
heterogeneous nature of TZ2 folding. We also investigate the temperature dependence of this
heterogeneity in folding for different conditions of solvent viscosity and observe that folding is
more multi-state at low temperatures and more like a two-state transition at high temperatures.
Increases in solvent friction enhance the multi-state folding behavior, even at high temperatures
of 55oC. The non-linear kinetic response at different experimental conditions of solvent
viscosity experimentally verifies the (41) prediction that folding pathways are influenced by the
diffusional properties of the protein and its environment.
104
CHAPTER 5 CONTACT FORMATION IN POLYPEPTIDES
Introduction
Protein folding begins from an ensemble of random-coil like configurations for the
unfolded polypeptide chain, which proceeds to the final folded state by formation of contacts
between residues of the chain. The first contact (12) between any two regions of the chain is an
important event (23) that initiates the compaction of the chain and the formation of secondary
structural elements such as turns, hairpins and helices. This event is termed as contact formation
or loop formation in the protein folding literature. It sets the limit for the protein folding process,
as a protein can fold only as fast as its folding nucleus can form. Theoretical estimates of rates
of contact formation have used simple polymer models for the unfolded polypeptide chain (18,
169) to estimate the rates at which its ends diffuse towards each other in solvent. Experimental
measurements of intra-chain diffusion rates of the ends of a polypeptide chain (22, 23, 24)
indicate a rate of contact formation ~ 107/s or (100 ns)-1 for very short polypeptides and slower
rates for longer loops. This chapter focuses on studies of intra-chain diffusion in polypeptide
chains in aqueous solvent and the effects of loop length, temperature and solvent viscosity on the
rates of loop formation.
Background: Experiments on Contact Formation
Energy transfer methods such as FRET and triplet-triplet energy transfer (TTET) are used
to estimate the rate of loop formation in peptides (170) and nucleic acids (171). Studies of end-
to-end loop formation kinetics in peptides with seven to twenty amino acids show that the time
of formation of longer loops are in agreement with times predicted by SSS theory i.e. 2/3n∝τ .
For short loops with four to six amino acids between terminal amino acids, however the time of
loop formation saturates at 100 ns.
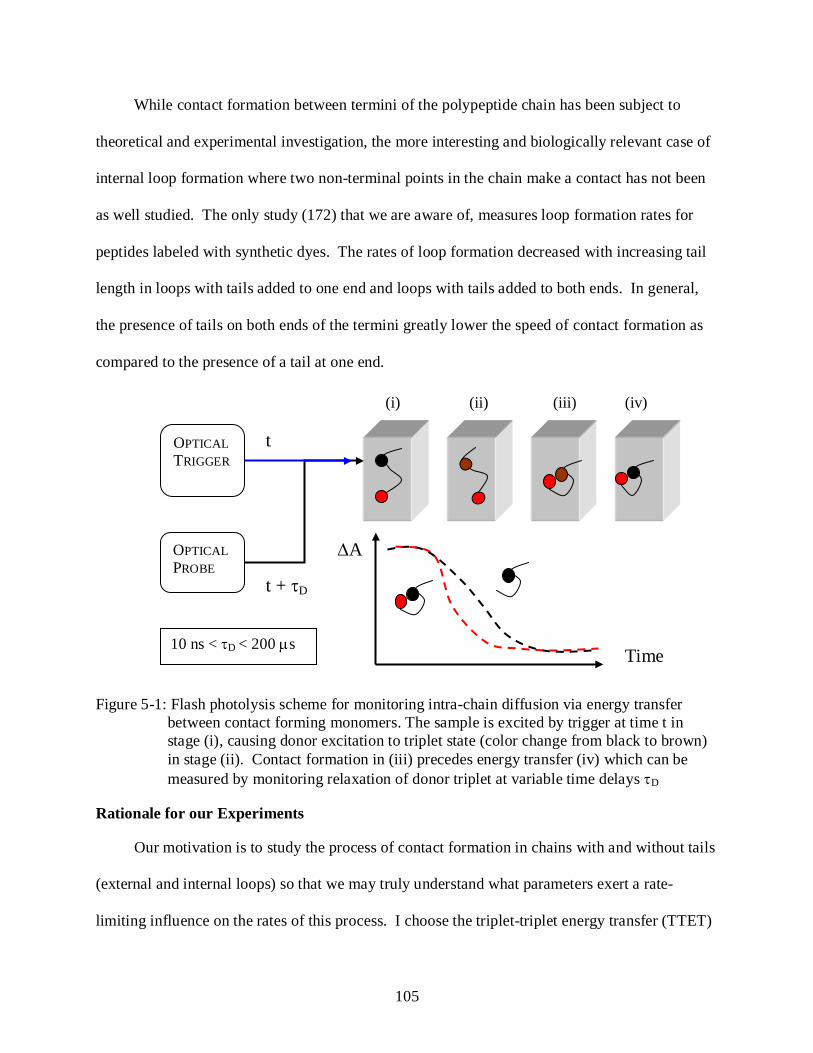
105
While contact formation between termini of the polypeptide chain has been subject to
theoretical and experimental investigation, the more interesting and biologically relevant case of
internal loop formation where two non-terminal points in the chain make a contact has not been
as well studied. The only study (172) that we are aware of, measures loop formation rates for
peptides labeled with synthetic dyes. The rates of loop formation decreased with increasing tail
length in loops with tails added to one end and loops with tails added to both ends. In general,
the presence of tails on both ends of the termini greatly lower the speed of contact formation as
compared to the presence of a tail at one end.
Figure 5-1: Flash photolysis scheme for monitoring intra-chain diffusion via energy transfer between contact forming monomers. The sample is excited by trigger at time t in stage (i), causing donor excitation to triplet state (color change from black to brown) in stage (ii). Contact formation in (iii) precedes energy transfer (iv) which can be measured by monitoring relaxation of donor triplet at variable time delays τD
Rationale for our Experiments
Our motivation is to study the process of contact formation in chains with and without tails
(external and internal loops) so that we may truly understand what parameters exert a rate-
limiting influence on the rates of this process. I choose the triplet-triplet energy transfer (TTET)
OPTICAL TRIGGER
OPTICAL PROBE
t
t + τD
10 ns < τD < 200 µs
(i) (ii) (iii) (iv)
Time
∆A
106
method for our studies of contact formation in polypeptide chains, as it is a more sensitive and
specific probe of contact formation, compared to FRET. The mechanisms for TTET and FRET
differ in that actual overlap of electron clouds is essential for TTET. Therefore, it is more
reliable as a reporter for loop formation than FRET. I use tryptophan and cysteine as triplet
donor and acceptor respectively, in our experiments (figure 5-1). Quenching of the triplet state
can occur by electron transfer after diffusion-limited collision with the sulphydryl (125) group in
the amino acid cysteine. This quenching reduces the tryptophan-triplet relaxation lifetime
making it a useful probe of diffusion-limited contact formation in polypeptide chains with
cysteine and tryptophan monomers (figure 2-9).
Results
Optimization of the Transient Spectroscopy System
The transient spectrometry set-up is capable of acquiring multi-wavelength spectra over
wavelengths 400-700 nm at sub-millisecond time delays with nanosecond time resolution.
Energy transfer experiments reported in the contact formation literature typically probe sample
response at a single wavelength. Multi-wavelength data provides additional information and
thus a more global view of the system response. This system is designed to excite molecules
which can absorb 260-290 nm light, such as tryptophan (λmax = 280 nm) in peptides.
The system performance is optimized with the complex of carbon monoxide and protein
cytochrome c (11), which is photolyzed by the UV beam. Cytochrome c contains a heme group
that binds to specific ligands His18 and Met80 in the natively folded protein in the absence of
carbon monoxide. It can be unfolded under destabilizing conditions by the preferential binding
of carbon monoxide to the haem group. This complex is photo-disassociated by a laser pulse
after which the haem group rebinds to its ligands in the protein while sampling the

107
conformational space available to it. Thus, the laser pulse initiates a conformational change
(figure 5-2) in the protein. Time-resolved difference absorption spectroscopy (A(λ,t) - A(λ, t =
0) in the region of the Soret band associated with the haem group (400-430 nm) at time delays
from 10 ns to 100 ms can be used to monitor this conformational change.
Figure 5-2: Systems check with 3 µM Cytochrome c + CO, whose differential absorbance (A) can be resolved into (B) spectra ui relaxing on timescales given by vi. The huge change in absorbance is due to the re-binding of haem in protein with its ligands.
I can observe the change in absorption of the cytochrome c after flash photolysis at ~
417 nm over logarithmic timescales spanning nanoseconds to seconds. The alignment of the
transient spectrometry system can also be optimized by observing the magnitude of the change in
absorbance after photolysis of this sample.
Characterization of Tryptophan Photochemistry
I have observed the spectra of transients (figure 5-3) generated after laser photolysis of
aqueous solutions of tryptophan and their relaxations on the microsecond timescale. Singular
value decomposition of our absorption spectra yields triplet spectrum at 460 nm and neutral
radical at 510 nm. The time-evolution of these spectra can be fit to a single exponential on
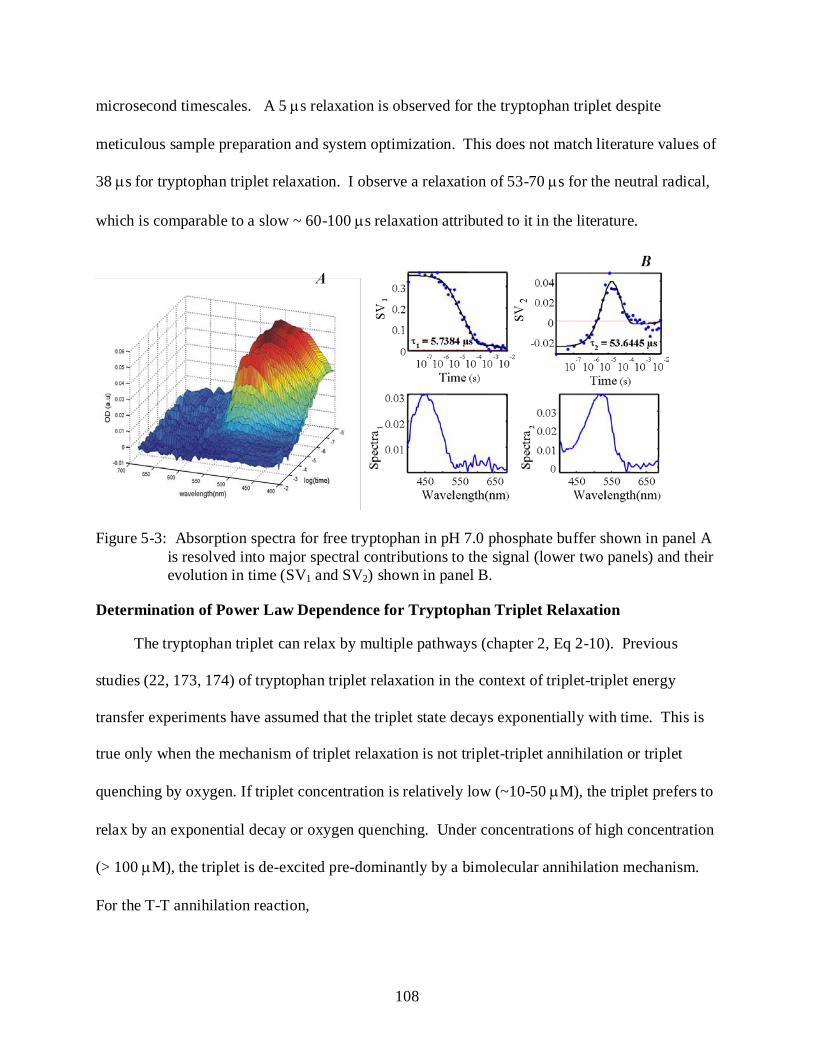
108
microsecond timescales. A 5 µs relaxation is observed for the tryptophan triplet despite
meticulous sample preparation and system optimization. This does not match literature values of
38 µs for tryptophan triplet relaxation. I observe a relaxation of 53-70 µs for the neutral radical,
which is comparable to a slow ~ 60-100 µs relaxation attributed to it in the literature.
Figure 5-3: Absorption spectra for free tryptophan in pH 7.0 phosphate buffer shown in panel A
is resolved into major spectral contributions to the signal (lower two panels) and their evolution in time (SV1 and SV2) shown in panel B.
Determination of Power Law Dependence for Tryptophan Triplet Relaxation
The tryptophan triplet can relax by multiple pathways (chapter 2, Eq 2-10). Previous
studies (22, 173, 174) of tryptophan triplet relaxation in the context of triplet-triplet energy
transfer experiments have assumed that the triplet state decays exponentially with time. This is
true only when the mechanism of triplet relaxation is not triplet-triplet annihilation or triplet
quenching by oxygen. If triplet concentration is relatively low (~10-50 µM), the triplet prefers to
relax by an exponential decay or oxygen quenching. Under concentrations of high concentration
(> 100 µM), the triplet is de-excited pre-dominantly by a bimolecular annihilation mechanism.
For the T-T annihilation reaction,
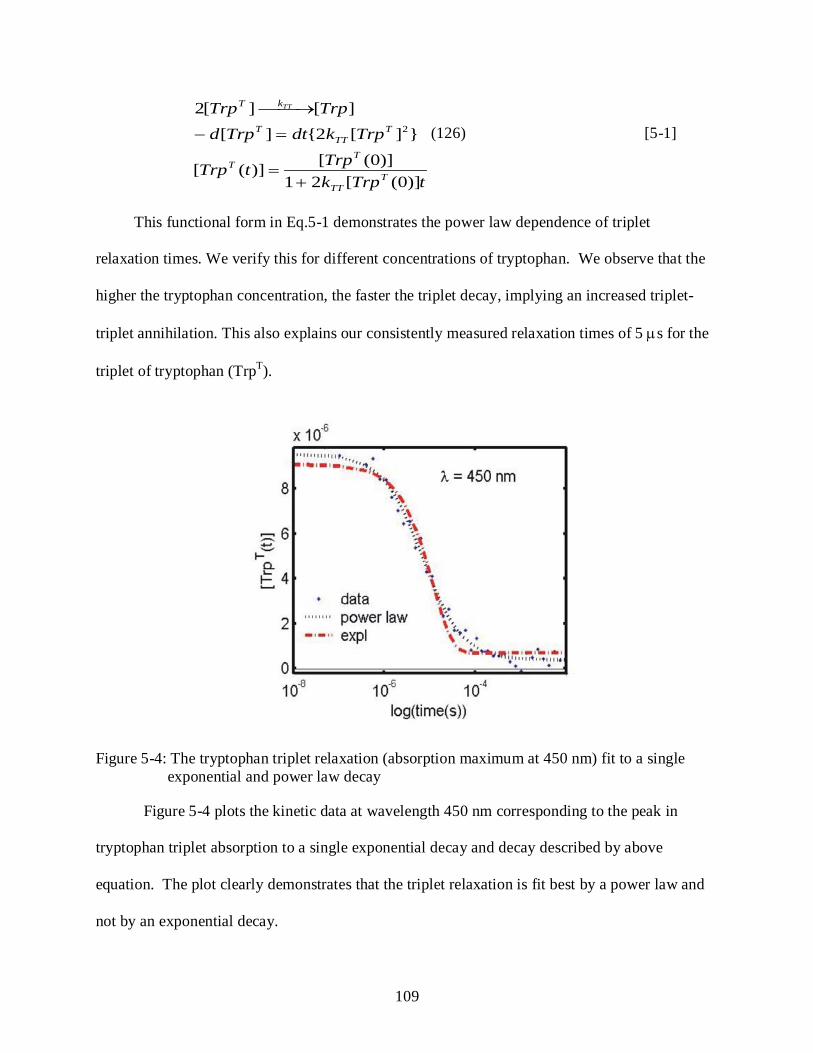
109
tTrpkTrptTrp
TrpkdtTrpdTrpTrp
TTT
TT
TTT
T
kT TT
)]0([21)]0([)]([
}][2{][][][2
2
+=
=−
→
(126) [5-1]
This functional form in Eq.5-1 demonstrates the power law dependence of triplet
relaxation times. We verify this for different concentrations of tryptophan. We observe that the
higher the tryptophan concentration, the faster the triplet decay, implying an increased triplet-
triplet annihilation. This also explains our consistently measured relaxation times of 5 µs for the
triplet of tryptophan (TrpT).
Figure 5-4: The tryptophan triplet relaxation (absorption maximum at 450 nm) fit to a single exponential and power law decay
Figure 5-4 plots the kinetic data at wavelength 450 nm corresponding to the peak in
tryptophan triplet absorption to a single exponential decay and decay described by above
equation. The plot clearly demonstrates that the triplet relaxation is fit best by a power law and
not by an exponential decay.
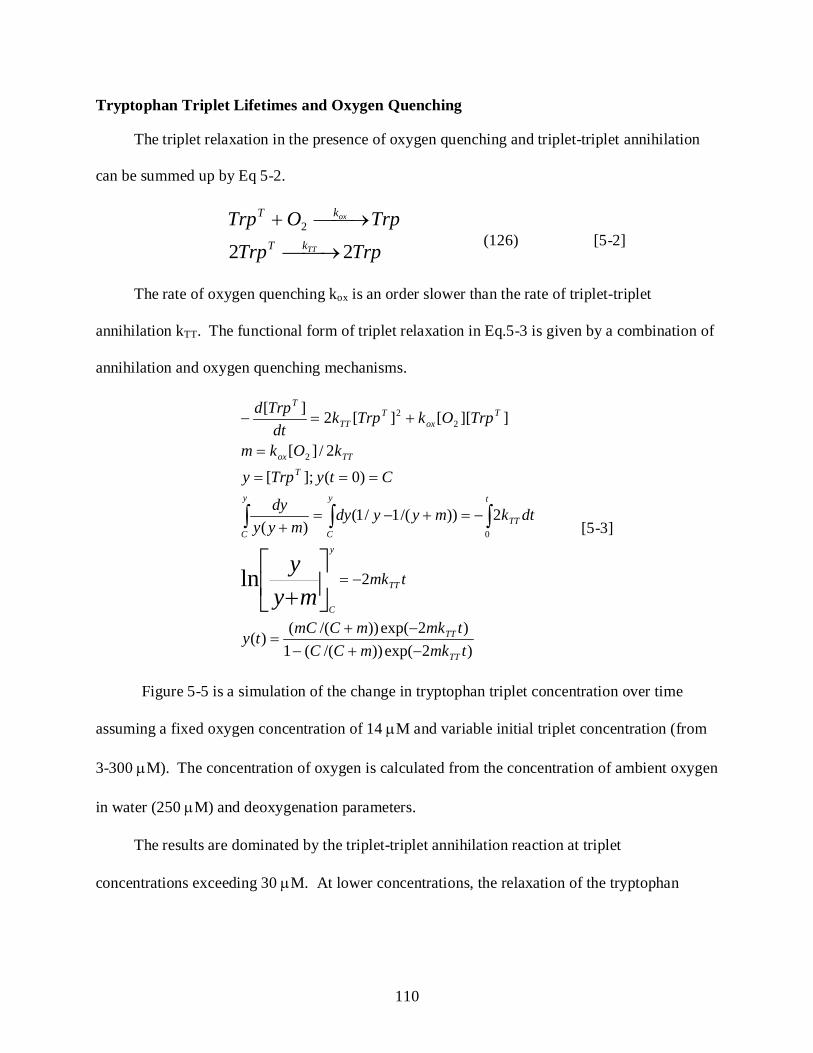
110
Tryptophan Triplet Lifetimes and Oxygen Quenching
The triplet relaxation in the presence of oxygen quenching and triplet-triplet annihilation
can be summed up by Eq 5-2.
TrpTrpTrpOTrp
TT
ox
kT
kT
222
→
→+ (126) [5-2]
The rate of oxygen quenching kox is an order slower than the rate of triplet-triplet
annihilation kTT. The functional form of triplet relaxation in Eq.5-3 is given by a combination of
annihilation and oxygen quenching mechanisms.
)2exp())/((1)2exp())/(()(
2
2))/(1/1()(
)0(];[
2/][
]][[][2][
ln
0
2
22
tmkmCCtmkmCmCty
tmk
dtkmyydymyy
dy
CtyTrpykOkm
TrpOkTrpkdt
Trpd
TT
TT
TT
y
C
t
TT
y
C
y
C
TTTox
Tox
TTT
T
myy
−+−−+
=
−=
−=+−=+
===
=
+=−
+
∫∫∫ [5-3]
Figure 5-5 is a simulation of the change in tryptophan triplet concentration over time
assuming a fixed oxygen concentration of 14 µM and variable initial triplet concentration (from
3-300 µM). The concentration of oxygen is calculated from the concentration of ambient oxygen
in water (250 µM) and deoxygenation parameters.
The results are dominated by the triplet-triplet annihilation reaction at triplet
concentrations exceeding 30 µM. At lower concentrations, the relaxation of the tryptophan
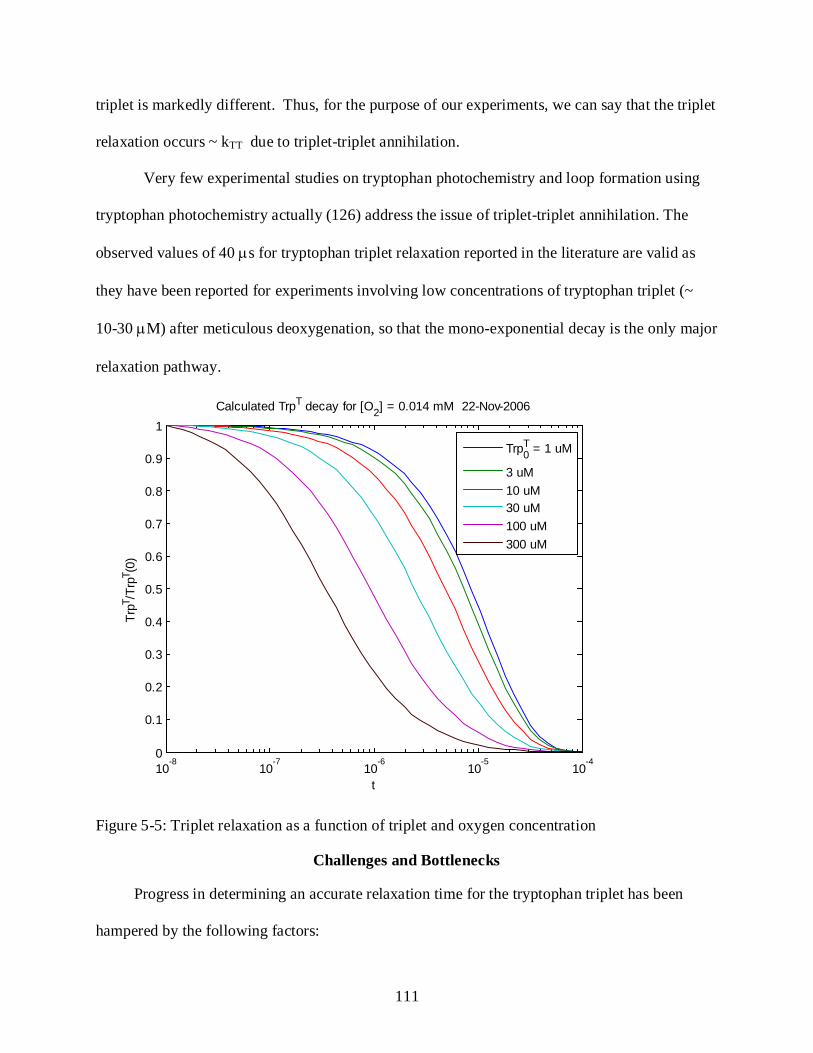
111
triplet is markedly different. Thus, for the purpose of our experiments, we can say that the triplet
relaxation occurs ~ kTT due to triplet-triplet annihilation.
Very few experimental studies on tryptophan photochemistry and loop formation using
tryptophan photochemistry actually (126) address the issue of triplet-triplet annihilation. The
observed values of 40 µs for tryptophan triplet relaxation reported in the literature are valid as
they have been reported for experiments involving low concentrations of tryptophan triplet (~
10-30 µM) after meticulous deoxygenation, so that the mono-exponential decay is the only major
relaxation pathway.
Figure 5-5: Triplet relaxation as a function of triplet and oxygen concentration
Challenges and Bottlenecks
Progress in determining an accurate relaxation time for the tryptophan triplet has been
hampered by the following factors:
10-8
10-7
10-6
10-5
10-4
0
0.1
0.2
0.3
0.4
0.5
0.6
0.7
0.8
0.9
1
t
TrpT /
TrpT (
0)
Calculated TrpT decay for [O2] = 0.014 mM 22-Nov-2006
TrpT0 = 1 uM
3 uM10 uM30 uM100 uM300 uM

112
• The raw absorbance signal shows two signals at 460 nm and 510 nm decaying rapidly on
different timescales. The neutral radical has a large broad peak at 510 nm and a very
slow relaxation time of about a hundred microseconds. The decay of this species also
occurs by an annihilation reaction on a slower timescale. This greatly affects our analysis
of triplet state kinetics.
• Tryptophan is easily photo-bleached by UV light. This affects our signal levels over the
time of an experiment. A typical experiment uses 1500 UV shots, for optimal signal to
noise. This is also close to the number of UV shots after which tryptophan signal drops
by 1/e (figure 5-6). This makes alignment with tryptophan cumbersome.
Figure 5-6: Photo-damage of tryptophan by repeated UV irradiation in an experiment. A solution of free tryptophan (3 ml, 0.1mM) in phosphate buffer is sealed in a 1 cm path length absorption cell, and subject to flash photolysis repeatedly in our transient spectrometry setup. Each experiment involves 1800 excitation events or UV laser shots. The fluorescence of the tryptophan sample is monitored after each successive irradiation on a JASCO FP-750 fluorimeter. It shows the irreversible photo-damage to tryptophan during experiments. We typically start with 0.35 micromoles and lose almost half of it after one experiment. We are unable to get a signal from our sample after three experiments, as indicated by the negligible fluorescence of the tryptophan sample in figure.

113
Discussion
The formation of a loop in a polymer chain of amino acids is a significant step (13, 22)
towards the folded state of the protein. The accurate estimation of these rates is very essential
for a better understanding of the mechanism of protein folding. Energy transfer methods have
been used to probe the diffusion-limited rates of loop formation in polymer chains tagged with
optically excitable molecular probes. The observed kinetics have been fit to simple models for
polymer chains diffusing in solvent enabling an estimate of the speeds at which intra-chain
diffusion of an unfolded polypeptide chain can initiate the creation of a loop. Experimental
studies of loop formation have focused largely on the rates of formation of external loops and
their dependence on factors such as loop length, temperature, amino acid composition and
solvent viscosity. A very recent study has also investigated the slowing effect of tails of residues
external to the loop, on rates of loop formation.
None of the studies mentioned so far addresses the role of excluded volume interactions
and their effect on loop formation kinetics in exterior and interior loops.
The motivation in studying loop formation in polymer chains 5-20 amino acids long was to
investigate the change in rates of loop formation with and without tails as a consequence of
excluded volume interactions between segments of the loop. Towards this end, I constructed a
transient spectroscopy system capable of probing the diffusion limited energy transfer between
tryptophan and cysteine separated by glycine-glutamine-alanine repeats in amino acid chains of
5-20 residues. Cysteine is known to quench the triplet state of tryptophan most effectively
among amino acids, by a mechanism that involves actual overlap of electron clouds. Our
rationale for using this system is that the triplet state relaxation provides a sensitive and specific
probe of actual contact preceding the formation of a loop.
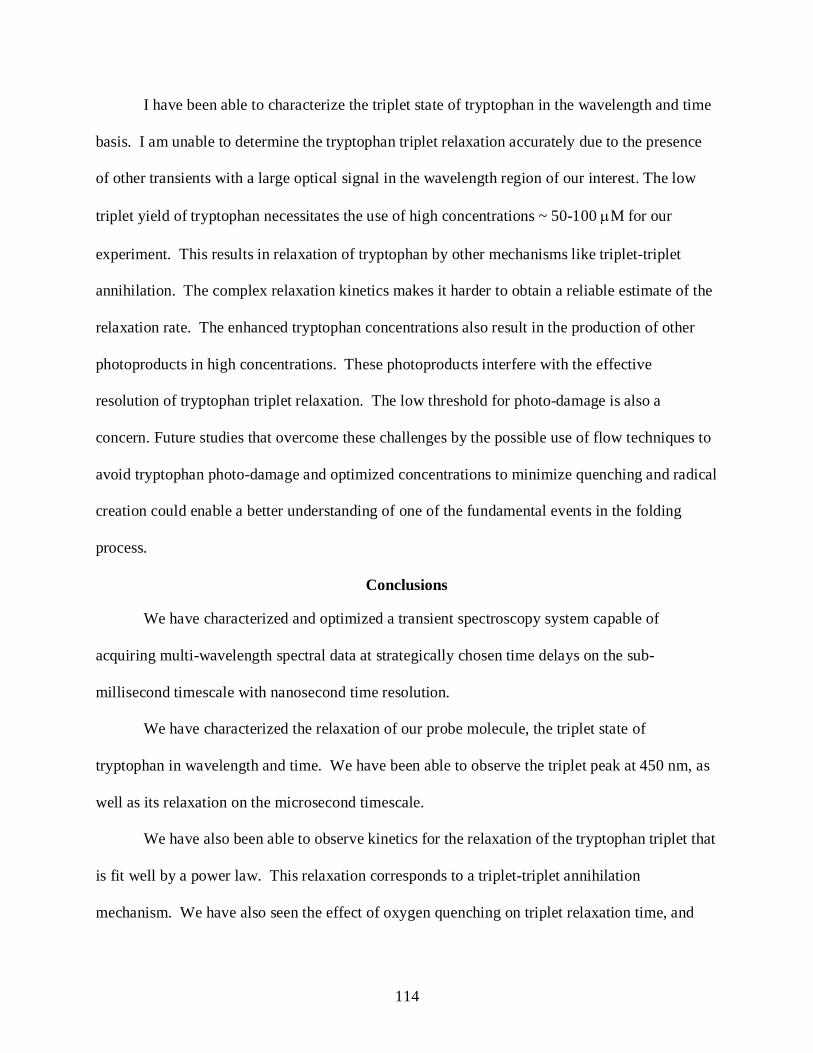
114
I have been able to characterize the triplet state of tryptophan in the wavelength and time
basis. I am unable to determine the tryptophan triplet relaxation accurately due to the presence
of other transients with a large optical signal in the wavelength region of our interest. The low
triplet yield of tryptophan necessitates the use of high concentrations ~ 50-100 µM for our
experiment. This results in relaxation of tryptophan by other mechanisms like triplet-triplet
annihilation. The complex relaxation kinetics makes it harder to obtain a reliable estimate of the
relaxation rate. The enhanced tryptophan concentrations also result in the production of other
photoproducts in high concentrations. These photoproducts interfere with the effective
resolution of tryptophan triplet relaxation. The low threshold for photo-damage is also a
concern. Future studies that overcome these challenges by the possible use of flow techniques to
avoid tryptophan photo-damage and optimized concentrations to minimize quenching and radical
creation could enable a better understanding of one of the fundamental events in the folding
process.
Conclusions
We have characterized and optimized a transient spectroscopy system capable of
acquiring multi-wavelength spectral data at strategically chosen time delays on the sub-
millisecond timescale with nanosecond time resolution.
We have characterized the relaxation of our probe molecule, the triplet state of
tryptophan in wavelength and time. We have been able to observe the triplet peak at 450 nm, as
well as its relaxation on the microsecond timescale.
We have also been able to observe kinetics for the relaxation of the tryptophan triplet that
is fit well by a power law. This relaxation corresponds to a triplet-triplet annihilation
mechanism. We have also seen the effect of oxygen quenching on triplet relaxation time, and
115
note that relaxation of the tryptophan triplet is more sensitive to the bimolecular annihilation
reaction than oxygen quenching. This result is valid only for high concentrations of tryptophan
triplet ([Trp*] >> 50 µM).
Previous studies of diffusion limited contact formation probing tryptophan triplet
relaxation have employed kinetic information at one single wavelength of interest. Our multi-
wavelength studies highlight the rich complexity of tryptophan photochemistry and the
possibility that the reported values of tryptophan relaxation do not consider the different
contributions from the photoproducts of tryptophan photolysis. Our attempts at accurately
measuring the rate of loop formation by probing tryptophan triplet transfer have been challenged
by difficulties in resolving signal due to different tryptophan photoproducts. Future work in this
direction would involve surmounting these difficulties by optimization of experimental
conditions to prevent tryptophan photo-damage and allow removal of photoproducts that
interfere with our analysis.
116
CHAPTER 6 FUTURE DIRECTIONS AND CONCLUSIONS
We have enhanced the capabilities of a nanosecond laser pulse triggered temperature jump
system, so that we can acquire multi-wavelength spectra synchronously with kinetic data on sub-
microsecond timescales. This system has been used to investigate the kinetics of inhibition of the
enzyme YPrA in yeast by an endogenous inhibitor IA3. We have been able to gain a unique
insight into the sequence of events that lead to the folding of the natively unstructured IA3 while
it binds to YPrA. This folding and binding inhibition reaction is essential for the protection of
cellular proteins from damage by YPrA. We have undertaken one of the few studies of the
kinetics of coupled folding and binding in natively unfolded proteins, and the first study of this
kind for the IA3-YPrA system. Our studies have revealed that the unstructured IA3 peptide first
makes non-specific contacts with YPrA, which stabilize the helically folded state of IA3.
Our study has not considered the role of the C-terminus of the unstructured peptide IA3 in
the binding interaction with YPrA. Previous NMR studies of the IA3-YPrA interaction have
shown that certain residues of the C-terminus of IA3 away from the binding site actually interact
with the YPrA. The inhibitory ability of IA3 peptides with and without the C-terminus are very
similar, so this interaction does not affect the equilibrium inhibition constant. One interesting
possibility is that the C-terminus forms fleeting contacts with YPrA leading to the formation of
the encounter complex that has an unfolded N-terminus, while the IA3 is bound to YPrA by the
C-terminal contacts. Studies of folding kinetics of truncated IA3 peptides with only N-terminus
in the future could elucidate the role of the C-terminus in the interaction with YPrA. Another
interesting possibility for future work is identification of key residues involved in this non-
specific binding by experiments and simulations with mutants of IA3.
117
Our study of the folding dynamics of the tryptophan zipper in different solvent viscosities
investigates its navigation of the energetic landscape under different experimental conditions.
Previous theoretical studies have indicated a heterogeneous folding behavior of tryptophan
zipper folding at low temperatures due to a rough energy landscape. It has been argued that at
high temperatures, the landscape is dominated by one global minimum, leading to one folding
pathway. Our kinetic studies reveal the presence of two folding pathways at temperatures less
than 35C, with distinguishably different relaxation rates. This result has several repercussions
for the rate limiting events leading to secondary structure formation in the tryptophan zipper.
While our studies look at the kinetics of folding pathways accessible to the protein, the actual
structural features of the protein formed along these routes are still subject to speculation.
Studies in simulation and experiment with systems like tryptophan zippers are needed for a
complete view of the initial events in the folding process.
We have designed and characterized a transient spectroscopy system capable of acquiring
nanosecond time resolved multi-wavelength spectral data on events occurring on the ns-ms
timescale. We have been able to study the photochemistry of tryptophan after flash photolysis by
a nanosecond pulse of ultra-violet light. This study revealed the rich spectral and kinetic
complexity of photoproducts of tryptophan. This system holds promise for experiments that
probe early events in the protein folding process (loop and turn formation) with molecular probes
whose photochemistry is well characterized.
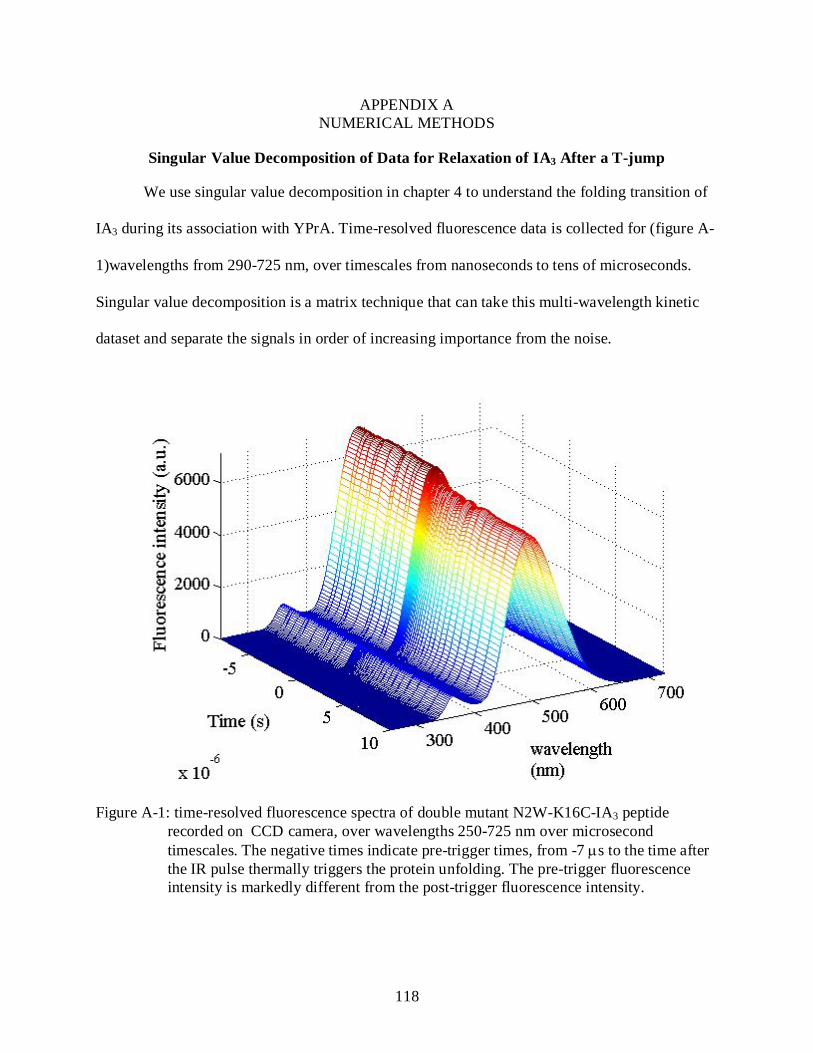
118
APPENDIX A NUMERICAL METHODS
Singular Value Decomposition of Data for Relaxation of IA3 After a T-jump
We use singular value decomposition in chapter 4 to understand the folding transition of
IA3 during its association with YPrA. Time-resolved fluorescence data is collected for (figure A-
1)wavelengths from 290-725 nm, over timescales from nanoseconds to tens of microseconds.
Singular value decomposition is a matrix technique that can take this multi-wavelength kinetic
dataset and separate the signals in order of increasing importance from the noise.
Figure A-1: time-resolved fluorescence spectra of double mutant N2W-K16C-IA3 peptide recorded on CCD camera, over wavelengths 250-725 nm over microsecond timescales. The negative times indicate pre-trigger times, from -7 µs to the time after the IR pulse thermally triggers the protein unfolding. The pre-trigger fluorescence intensity is markedly different from the post-trigger fluorescence intensity.
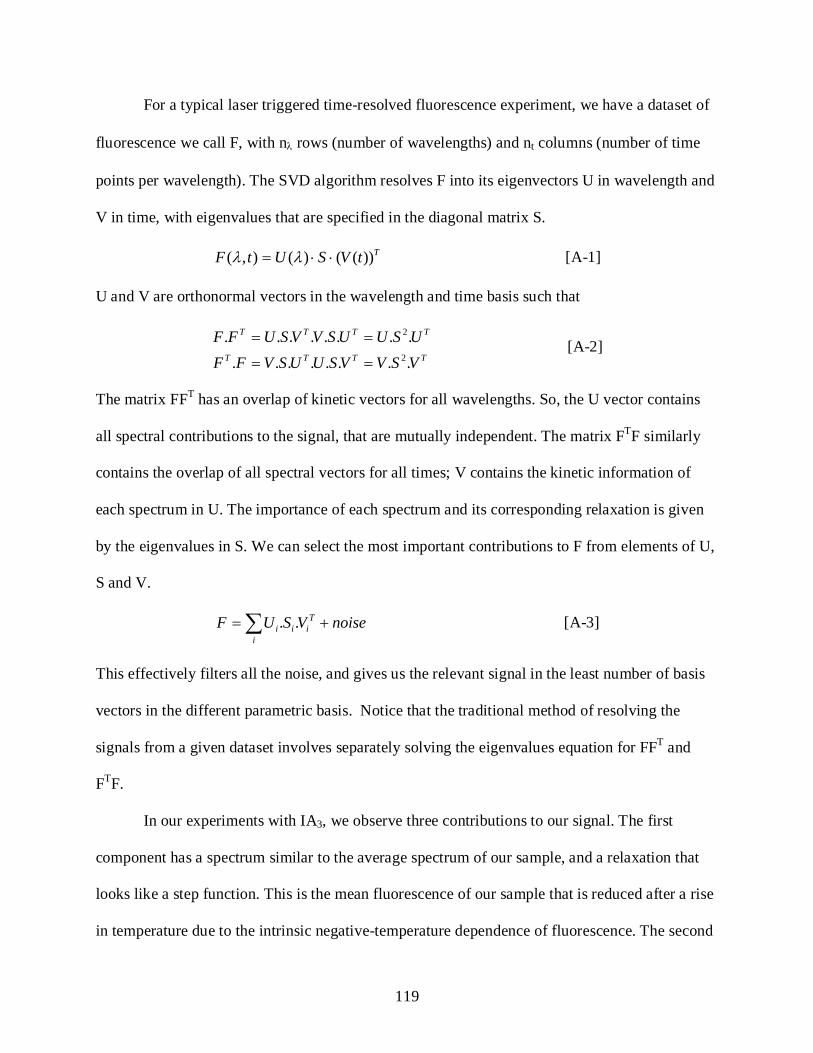
119
For a typical laser triggered time-resolved fluorescence experiment, we have a dataset of
fluorescence we call F, with nλ rows (number of wavelengths) and nt columns (number of time
points per wavelength). The SVD algorithm resolves F into its eigenvectors U in wavelength and
V in time, with eigenvalues that are specified in the diagonal matrix S.
TtVSUtF ))(()(),( ⋅⋅= λλ [A-1]
U and V are orthonormal vectors in the wavelength and time basis such that
TTTT
TTTT
VSVVSUUSVFFUSUUSVVSUFF................
2
2
==
== [A-2]
The matrix FFT has an overlap of kinetic vectors for all wavelengths. So, the U vector contains
all spectral contributions to the signal, that are mutually independent. The matrix FTF similarly
contains the overlap of all spectral vectors for all times; V contains the kinetic information of
each spectrum in U. The importance of each spectrum and its corresponding relaxation is given
by the eigenvalues in S. We can select the most important contributions to F from elements of U,
S and V.
noiseVSUFi
Tiii += ∑ .. [A-3]
This effectively filters all the noise, and gives us the relevant signal in the least number of basis
vectors in the different parametric basis. Notice that the traditional method of resolving the
signals from a given dataset involves separately solving the eigenvalues equation for FFT and
FTF.
In our experiments with IA3, we observe three contributions to our signal. The first
component has a spectrum similar to the average spectrum of our sample, and a relaxation that
looks like a step function. This is the mean fluorescence of our sample that is reduced after a rise
in temperature due to the intrinsic negative-temperature dependence of fluorescence. The second
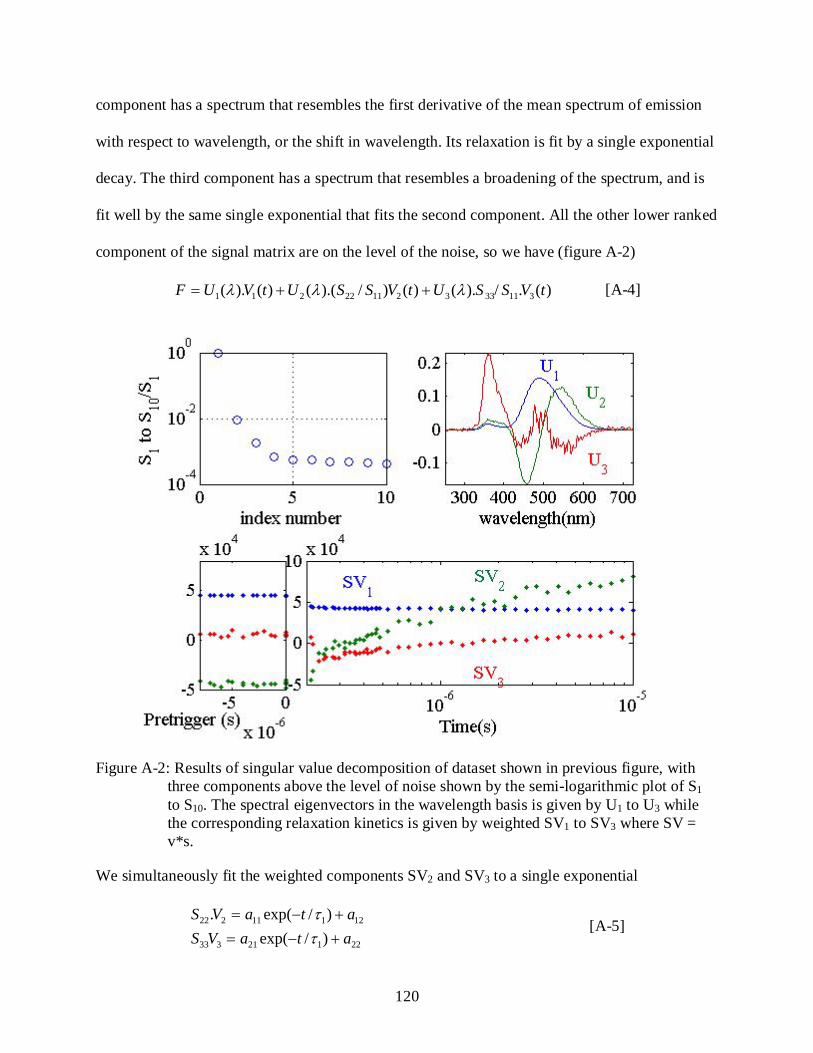
120
component has a spectrum that resembles the first derivative of the mean spectrum of emission
with respect to wavelength, or the shift in wavelength. Its relaxation is fit by a single exponential
decay. The third component has a spectrum that resembles a broadening of the spectrum, and is
fit well by the same single exponential that fits the second component. All the other lower ranked
component of the signal matrix are on the level of the noise, so we have (figure A-2)
)(./).()()/).(()().( 31133321122211 tVSSUtVSSUtVUF λλλ ++= [A-4]
Figure A-2: Results of singular value decomposition of dataset shown in previous figure, with three components above the level of noise shown by the semi-logarithmic plot of S1 to S10. The spectral eigenvectors in the wavelength basis is given by U1 to U3 while the corresponding relaxation kinetics is given by weighted SV1 to SV3 where SV = v*s.
We simultaneously fit the weighted components SV2 and SV3 to a single exponential
22121333
12111222
)/exp()/exp(.
ataVSataVS
+−=+−=
ττ
[A-5]
121
This relaxation is the signature of the folding transition of the unstructured peptide IA3 . The fall
of the second component in the red region, and its rise in the blue region of the spectrum indicate
a rise in tryptophan fluorescence concurrent with the fall in the dansyl fluorescence. This would
imply a reduced transfer of energy to the dansyl moiety, our FRET acceptor, from tryptophan.
This would arise only when the peptide melts pushing the chromophores apart at the higher
temperature.
Figure A-3: Single exponential fit for both SV2 and SV3 in time, providing an observed lifetime ~ 500 ns. This estimate of τ can be used with the estimated ∆G (T, TFE) from our fits of CD data for helix-coil transition of IA3 in TFE to determine the folding and unfolding rate (kF, kU) of IA3 at this temperature T and TFE concentration. This procedure is repeated for multiple measurements at various temperatures and TFE concentrations.
122
LIST OF REFERENCES
1. Dill, K. A., Ozkan, S. B., Shell, M. S., and Weikl, T. R. (2008) The Protein Folding Problem. Annu. Rev. Biophys. 37, 289-316.
2. Fersht, A. R. (2008) From the First Protein Structures to our Current Knowledge of Protein Folding: Delights and Scepticisms. Nat. Rev. Mol. Cell Biol.
3. Finkelstein, A. V., and Ptitsyn, O. B. (2002) Protein Physics : A Course of Lectures. Academic Press, Amsterdam ; Boston.
4. Anfinsen, C. B. (1973) Principles that Govern the Folding of Protein Chains. Science. 181, 223-230.
5. Anfinsen, C. B., and Scheraga, H. A. (1975) Experimental and Theoretical Aspects of Protein Folding. Adv. Protein Chem. 29, 205-300.
6. Bryngelson, J. D., Onuchic, J. N., Socci, N. D., and Wolynes, P. G. (1995) Funnels, Pathways, and the Energy Landscape of Protein Folding: A Synthesis. Proteins. 21, 167-195.
7. Onuchic, J. N., Luthey-Schulten, Z., and Wolynes, P. G. (1997) Theory of Protein Folding: The Energy Landscape Perspective. Annu. Rev. Phys. Chem. 48, 545-600.
8. Dill, K. A., and Chan, H. S. (1997) From Levinthal to Pathways to Funnels. Nat. Struct. Biol. 4, 10-19.
9. Ma, B., Kumar, S., Tsai, C. J., and Nussinov, R. (1999) Folding Funnels and Binding Mechanisms. Protein Eng. 12, 713-720.
10. Eaton, W. A., Munoz, V., Hagen, S. J., Jas, G. S., Lapidus, L. J., Henry, E. R., and Hofrichter, J. (2000) Fast Kinetics and Mechanisms in Protein Folding. Annu. Rev. Biophys. Biomol. Struct. 29, 327-359.
11. Jones, C. M., Henry, E. R., Hu, Y., Chan, C. K., Luck, S. D., Bhuyan, A., Roder, H., Hofrichter, J., and Eaton, W. A. (1993) Fast Events in Protein Folding Initiated by Nanosecond Laser Photolysis. Proc. Natl. Acad. Sci. U. S. A. 90, 11860-11864.
12. Bieri, O., and Kiefhaber, T. (1999) Elementary Steps in Protein Folding. Biol. Chem. 380, 923-929.
123
13. Creighton, T. E. (1997) Protein Folding: Does Diffusion Determine the Folding Rate? Curr. Biol. 7, R380-3.
14. Friedman, B., and Oshaughnessy, B. (1993) Theory of Intramolecular Reactions in Polymeric Liquids. Macromolecules. 26, 4888-4898.
15. Chan, H. S., and Dill, K. A. (1991) Polymer Principles in Protein Structure and Stability. Annu. Rev. Biophys. Biophys. Chem. 20, 447-490.
16. Hyeon, C., and Thirumalai, D. (2006) Kinetics of Interior Loop Formation in Semiflexible Chains. J. Chem. Phys. 124, 104905.
17. Zhou, H. X. (2004) Polymer Models of Protein Stability, Folding, and Interactions. Biochemistry. 43, 2141-2154.
18. Szabo, A., Schulten, K., and Schulten, Z. (1980) 1st Passage Time Approach to Diffusion Controlled Reactions. J. Chem. Phys. 72, 4350-4357.
19. Chan, H. S., and Dill, K. A. (1990) The Effects of Internal Constraints on the Configurations of Chain Molecules. J. Chem. Phys. 92, 3118-3135.
20. Doucet, D., Roitberg, A., and Hagen, S. J. (2007) Kinetics of Internal-Loop Formation in Polypeptide Chains: A Simulation Study. Biophys. J. 92, 2281-2289.
21. Hagen, S. J., Hofrichter, J., Szabo, A., and Eaton, W. A. (1996) Diffusion-Limited Contact Formation in Unfolded Cytochrome c: Estimating the Maximum Rate of Protein Folding. Proc. Natl. Acad. Sci. U. S. A. 93, 11615-11617.
22. Lapidus, L. J., Eaton, W. A., and Hofrichter, J. (2000) Measuring the Rate of Intramolecular Contact Formation in Polypeptides. Proc. Natl. Acad. Sci. U. S. A. 97, 7220-7225.
23. Krieger, F., Fierz, B., Bieri, O., Drewello, M., and Kiefhaber, T. (2003) Dynamics of Unfolded Polypeptide Chains as Model for the Earliest Steps in Protein Folding. J. Mol. Biol. 332, 265-274.
24. Bieri, O., Wirz, J., Hellrung, B., Schutkowski, M., Drewello, M., and Kiefhaber, T. (1999) The Speed Limit for Protein Folding Measured by Triplet-Triplet Energy Transfer. Proc. Natl. Acad. Sci. U. S. A. 96, 9597-9601.
25. Kramers, H. A. (1940) Brownian Motion in a Field of Force and the Diffusion Model of Chemical Reactions. Physica. 7, 284-304.

124
26. Hanggi, P., Talkner, P., and Borkovec, M. (1990) Reaction-Rate Theory - 50 Years After Kramers. Reviews of Modern Physics. 62, 251-341.
27. Ansari, A., Jones, C. M., Henry, E. R., Hofrichter, J., and Eaton, W. A. (1992) The Role of Solvent Viscosity in the Dynamics of Protein Conformational Changes. Science. 256, 1796-1798.
28. Hagen, S. J., Qiu, L. L., and Pabit, S. A. (2005) Diffusional Limits to the Speed of Protein Folding: Fact Or Friction? Journal of Physics-Condensed Matter. 17, S1503-S1514.
29. Qiu, L., and Hagen, S. J. (2004) A Limiting Speed for Protein Folding at Low Solvent Viscosity. J. Am. Chem. Soc. 126, 3398-3399.
30. Snow, C. D., Qiu, L., Du, D., Gai, F., Hagen, S. J., and Pande, V. S. (2004) Trp Zipper Folding Kinetics by Molecular Dynamics and Temperature-Jump Spectroscopy. Proc. Natl. Acad. Sci. U. S. A. 101, 4077-4082.
31. Jacob, M., Schindler, T., Balbach, J., and Schmid, F. X. (1997) Diffusion Control in an Elementary Protein Folding Reaction. Proc. Natl. Acad. Sci. U. S. A. 94, 5622-5627.
32. Jacob, M., and Schmid, F. X. (1999) Protein Folding as a Diffusional Process. Biochemistry. 38, 13773-13779.
33. Jacob, M., Geeves, M., Holtermann, G., and Schmid, F. X. (1999) Diffusional Barrier Crossing in a Two-State Protein Folding Reaction. Nat. Struct. Biol. 6, 923-926.
34. Plaxco, K. W., and Baker, D. (1998) Limited Internal Friction in the Rate-Limiting Step of a Two-State Protein Folding Reaction. Proc. Natl. Acad. Sci. U. S. A. 95, 13591-13596.
35. Bhattacharyya, R. P., and Sosnick, T. R. (1999) Viscosity Dependence of the Folding Kinetics of a Dimeric and Monomeric Coiled Coil. Biochemistry. 38, 2601-2609.
36. Qiu, L. L., and Hagen, S. J. (2005) Internal Friction in the Ultrafast Folding of the Tryptophan Cage (Vol 307, Pg 243, 2004). Chem. Phys. 312, 325-+.
37. Pabit, S. A., Roder, H., and Hagen, S. J. (2004) Internal Friction Controls the Speed of Protein Folding from a Compact Configuration. Biochemistry. 43, 12532-12538.
38. Hagen, S. J., Qiu, L. L., and Pabit, S. A. (2005) Diffusional Limits to the Speed of Protein Folding: Fact Or Friction? Journal of Physics-Condensed Matter. 17, S1503-S1514.
125
39. Klimov, D. K., and Thirumalai, D. (1997) Viscosity Dependence of the Folding Rates of Proteins. Phys. Rev. Lett. 79, 317-320.
40. Zagrovic, B., and Pande, V. (2003) Solvent Viscosity Dependence of the Folding Rate of a Small Protein: Distributed Computing Study. J. Comput. Chem. 24, 1432-1436.
41. Rhee, Y. M., and Pande, V. S. (2008) Solvent Viscosity Dependence of the Protein Folding Dynamics. J Phys Chem B. 112, 6221-6227.
42. Dyson, H. J., and Wright, P. E. (2005) Intrinsically Unstructured Proteins and their Functions. Nat. Rev. Mol. Cell Biol. 6, 197-208.
43. Dyson, H. J., and Wright, P. E. (2004) Unfolded Proteins and Protein Folding Studied by NMR. Chem. Rev. 104, 3607-3622.
44. Uversky, V. N., Gillespie, J. R., and Fink, A. L. (2000) Why are "Natively Unfolded" Proteins Unstructured Under Physiologic Conditions? Proteins. 41, 415-427.
45. Fink, A. L. (2005) Natively Unfolded Proteins. Curr. Opin. Struct. Biol. 15, 35-41.
46. Dunker, A. K., Lawson, J. D., Brown, C. J., Williams, R. M., Romero, P., Oh, J. S., Oldfield, C. J., Campen, A. M., Ratliff, C. M., Hipps, K. W., Ausio, J., Nissen, M. S., Reeves, R., Kang, C., Kissinger, C. R., Bailey, R. W., Griswold, M. D., Chiu, W., Garner, E. C., and Obradovic, Z. (2001) Intrinsically Disordered Protein. J. Mol. Graph. Model. 19, 26-59.
47. Le Gall, T., Romero, P. R., Cortese, M. S., Uversky, V. N., and Dunker, A. K. (2007) Intrinsic Disorder in the Protein Data Bank. J. Biomol. Struct. Dyn. 24, 325-342.
48. Sickmeier, M., Hamilton, J. A., LeGall, T., Vacic, V., Cortese, M. S., Tantos, A., Szabo, B., Tompa, P., Chen, J., Uversky, V. N., Obradovic, Z., and Dunker, A. K. (2007) DisProt: The Database of Disordered Proteins. Nucleic Acids Res. 35, D786-93.
49. Wright, P. E., and Dyson, H. J. (1999) Intrinsically Unstructured Proteins: Re-Assessing the Protein Structure-Function Paradigm. J. Mol. Biol. 293, 321-331.
50. Haynes, C., Oldfield, C. J., Ji, F., Klitgord, N., Cusick, M. E., Radivojac, P., Uversky, V. N., Vidal, M., and Iakoucheva, L. M. (2006) Intrinsic Disorder is a Common Feature of Hub Proteins from Four Eukaryotic Interactomes. PLoS Comput. Biol. 2, e100.
51. Dunker, A. K., Brown, C. J., Lawson, J. D., Iakoucheva, L. M., and Obradovic, Z. (2002) Intrinsic Disorder and Protein Function. Biochemistry. 41, 6573-6582.
126
52. Uversky, V. N. (2002) Natively Unfolded Proteins: A Point Where Biology Waits for Physics. Protein Sci. 11, 739-756.
53. Gunasekaran, K., Tsai, C. J., Kumar, S., Zanuy, D., and Nussinov, R. (2003) Extended Disordered Proteins: Targeting Function with Less Scaffold. Trends Biochem. Sci. 28, 81-85.
54. Iakoucheva, L. M., Brown, C. J., Lawson, J. D., Obradovic, Z., and Dunker, A. K. (2002) Intrinsic Disorder in Cell-Signaling and Cancer-Associated Proteins. J. Mol. Biol. 323, 573-584.
55. Liu, J., Perumal, N. B., Oldfield, C. J., Su, E. W., Uversky, V. N., and Dunker, A. K. (2006) Intrinsic Disorder in Transcription Factors. Biochemistry. 45, 6873-6888.
56. Vacic, V., Oldfield, C. J., Mohan, A., Radivojac, P., Cortese, M. S., Uversky, V. N., and Dunker, A. K. (2007) Characterization of Molecular Recognition Features, MoRFs, and their Binding Partners. J. Proteome Res. 6, 2351-2366.
57. Uversky, V. N., Oldfield, C. J., and Dunker, A. K. (2005) Showing Your ID: Intrinsic Disorder as an ID for Recognition, Regulation and Cell Signaling. J. Mol. Recognit. 18, 343-384.
58. Uversky, V. N., and Narizhneva, N. V. (1998) Effect of Natural Ligands on the Structural Properties and Conformational Stability of Proteins. Biochemistry (Mosc). 63, 420-433.
59. Uversky, V. N., Gillespie, J. R., Millett, I. S., Khodyakova, A. V., Vasilenko, R. N., Vasiliev, A. M., Rodionov, I. L., Kozlovskaya, G. D., Dolgikh, D. A., Fink, A. L., Doniach, S., Permyakov, E. A., and Abramov, V. M. (2000) Zn(2+)-Mediated Structure Formation and Compaction of the "Natively Unfolded" Human Prothymosin Alpha. Biochem. Biophys. Res. Commun. 267, 663-668.
60. Engel, J., Taylor, W., Paulsson, M., Sage, H., and Hogan, B. (1987) Calcium Binding Domains and Calcium-Induced Conformational Transition of SPARC/BM-40/osteonectin, an Extracellular Glycoprotein Expressed in Mineralized and Nonmineralized Tissues. Biochemistry. 26, 6958-6965.
61. Baskakov, I. V., Kumar, R., Srinivasan, G., Ji, Y. S., Bolen, D. W., and Thompson, E. B. (1999) Trimethylamine N-Oxide-Induced Cooperative Folding of an Intrinsically Unfolded Transcription-Activating Fragment of Human Glucocorticoid Receptor. J. Biol. Chem. 274, 10693-10696.
62. Dyson, H. J., and Wright, P. E. (2002) Coupling of Folding and Binding for Unstructured Proteins. Curr. Opin. Struct. Biol. 12, 54-60.
127
63. Dyson, H. J., and Wright, P. E. (1998) Equilibrium NMR Studies of Unfolded and Partially Folded Proteins. Nat. Struct. Biol. 5 Suppl, 499-503.
64. Verkhivker, G. M., Bouzida, D., Gehlhaar, D. K., Rejto, P. A., Freer, S. T., and Rose, P. W. (2003) Simulating Disorder-Order Transitions in Molecular Recognition of Unstructured Proteins: Where Folding Meets Binding. Proc. Natl. Acad. Sci. U. S. A. 100, 5148-5153.
65. Shoemaker, B. A., Portman, J. J., and Wolynes, P. G. (2000) Speeding Molecular Recognition by using the Folding Funnel: The Fly-Casting Mechanism. Proc. Natl. Acad. Sci. U. S. A. 97, 8868-8873.
66. Lu, H. P. (2005) Probing Single-Molecule Protein Conformational Dynamics. Acc. Chem. Res. 38, 557-565.
67. Lu, Q., Lu, H. P., and Wang, J. (2007) Exploring the Mechanism of Flexible Biomolecular Recognition with Single Molecule Dynamics. Phys. Rev. Lett. 98, 128105.
68. Sugase, K., Dyson, H. J., and Wright, P. E. (2007) Mechanism of Coupled Folding and Binding of an Intrinsically Disordered Protein. Nature. 447, 1021-1025.
69. Onitsuka, M., Kamikubo, H., Yamazaki, Y., and Kataoka, M. (2008) Mechanism of Induced Folding: Both Folding before Binding and Binding before Folding can be Realized in Staphylococcal Nuclease Mutants. Proteins.
70. Meszaros, B., Tompa, P., Simon, I., and Dosztanyi, Z. (2007) Molecular Principles of the Interactions of Disordered Proteins. J. Mol. Biol. 372, 549-561.
71. Romero, P., Obradovic, Z., Li, X., Garner, E. C., Brown, C. J., and Dunker, A. K. (2001) Sequence Complexity of Disordered Protein. Proteins. 42, 38-48.
72. Williams, R. M., Obradovi, Z., Mathura, V., Braun, W., Garner, E. C., Young, J., Takayama, S., Brown, C. J., and Dunker, A. K. (2001) The Protein Non-Folding Problem: Amino Acid Determinants of Intrinsic Order and Disorder. Pac. Symp. Biocomput. , 89-100.
73. Gunasekaran, K., Tsai, C. J., and Nussinov, R. (2004) Analysis of Ordered and Disordered Protein Complexes Reveals Structural Features Discriminating between Stable and Unstable Monomers. J. Mol. Biol. 341, 1327-1341.
74. Mohan, A., Oldfield, C. J., Radivojac, P., Vacic, V., Cortese, M. S., Dunker, A. K., and Uversky, V. N. (2006) Analysis of Molecular Recognition Features (MoRFs). J. Mol. Biol. 362, 1043-1059.

128
75. Zhou, P., Lugovskoy, A. A., McCarty, J. S., Li, P., and Wagner, G. (2001) Solution Structure of DFF40 and DFF45 N-Terminal Domain Complex and Mutual Chaperone Activity of DFF40 and DFF45. Proc. Natl. Acad. Sci. U. S. A. 98, 6051-6055.
76. Li, M., Phylip, L. H., Lees, W. E., Winther, J. R., Dunn, B. M., Wlodawer, A., Kay, J., and Gustchina, A. (2000) The Aspartic Proteinase from Saccharomyces Cerevisiae Folds its Own Inhibitor into a Helix. Nat. Struct. Biol. 7, 113-117.
77. Halperin, I., Ma, B. Y., Wolfson, H., and Nussinov, R. (2002) Principles of Docking: An Overview of Search Algorithms and a Guide to Scoring Functions. Proteins. 47, 409-443.
78. Levy, Y., Cho, S. S., Onuchic, J. N., and Wolynes, P. G. (2005) A Survey of Flexible Protein Binding Mechanisms and their Transition States using Native Topology Based Energy Landscapes. J. Mol. Biol. 346, 1121-1145.
79. Gupta, N., and Irback, A. (2004) Coupled Folding-Binding Versus Docking: A Lattice Model Study. J. Chem. Phys. 120, 3983-3989.
80. Tsai, C. J., Xu, D., and Nussinov, R. (1998) Protein Folding Via Binding and Vice Versa. Fold. Des. 3, R71-80.
81. Muralidhara, B. K., Rathinakumar, R., and Wittung-Stafshede, P. (2006) Folding of Desulfovibrio Desulfuricans Flavodoxin is Accelerated by Cofactor Fly-Casting. Arch. Biochem. Biophys. 451, 51-58.
82. Turjanski, A. G., Gutkind, J. S., Best, R. B., and Hummer, G. (2008) Binding-Induced Folding of a Natively Unstructured Transcription Factor. PLoS Comput. Biol. 4, e1000060.
83. Gall, C., Xu, H., Brickenden, A., Ai, X., and Choy, W. Y. (2007) The Intrinsically Disordered TC-1 Interacts with Chibby Via Regions with High Helical Propensity. Protein Sci. 16, 2510-2518.
84. Dreyer, T., Valler, M. J., Kay, J., Charlton, P., and Dunn, B. M. (1985) The Selectivity of Action of the Aspartic-Proteinase Inhibitor IA3 from Yeast (Saccharomyces Cerevisiae). Biochem. J. 231, 777-779.
85. Green, T. B., Ganesh, O., Perry, K., Smith, L., Phylip, L. H., Logan, T. M., Hagen, S. J., Dunn, B. M., and Edison, A. S. (2004) IA3, an Aspartic Proteinase Inhibitor from Saccharomyces Cerevisiae, is Intrinsically Unstructured in Solution. Biochemistry. 43, 4071-4081.
129
86. Biedermann, K., Montali, U., Martin, B., Svendsen, I. B., and Ottesen, M. (1980) The Amino-Acid-Sequence of Proteinase-a Inhibitor-3 from Bakers-Yeast. Carlsberg Res. Commun. 45, 225-235.
87. Lenney, J. F., and Dalbec, J. M. (1967) Purification and Properties of Two Proteinases from Saccharomyces Cerevisiae. Arch. Biochem. Biophys. 120, 42-48.
88. Phylip, L. H., Lees, W. E., Brownsey, B. G., Bur, D., Dunn, B. M., Winther, J. R., Gustchina, A., Li, M., Copeland, T., Wlodawer, A., and Kay, J. (2001) The Potency and Specificity of the Interaction between the IA3 Inhibitor and its Target Aspartic Proteinase from Saccharomyces Cerevisiae. J. Biol. Chem. 276, 2023-2030.
89. Winterburn, T. J., Wyatt, D. M., Phylip, L. H., Bur, D., Harrison, R. J., Berry, C., and Kay, J. (2007) Key Features Determining the Specificity of Aspartic Proteinase Inhibition by the Helix-Forming IA3 Polypeptide. J. Biol. Chem. 282, 6508-6516.
90. Winterburn, T. J., Phylip, L. H., Bur, D., Wyatt, D. M., Berry, C., and Kay, J. (2007) N-Terminal Extension of the Yeast IA3 Aspartic Proteinase Inhibitor Relaxes the Strict Intrinsic Selectivity. FEBS J. 274, 3685-3694.
91. Davies, D. R. (1990) The Structure and Function of the Aspartic Proteinases. Annu. Rev. Biophys. Biophys. Chem. 19, 189-215.
92. Pearl, L., and Blundell, T. (1984) The Active Site of Aspartic Proteinases. FEBS Lett. 174, 96-101.
93. Dreyer, T., Halkier, B., Svendsen, I., and Ottesen, M. (1986) Primary Structure of the Aspartic Proteinase a from Saccharomyces Cerevisiae. Carlsberg Res. Commun. 51, 27-41.
94. Aguilar, C. F., Cronin, N. B., Badasso, M., Dreyer, T., Newman, M. P., Cooper, J. B., Hoover, D. J., Wood, S. P., Johnson, M. S., and Blundell, T. L. (1997) The Three-Dimensional Structure at 2.4 A Resolution of Glycosylated Proteinase A from the Lysosome-Like Vacuole of Saccharomyces Cerevisiae. J. Mol. Biol. 267, 899-915.
95. Roder, H., Maki, K., and Cheng, H. (2006) Early Events in Protein Folding Explored by Rapid Mixing Methods. Chem. Rev. 106, 1836-1861.
96. Eaton, W. A., Munoz, V., Thompson, P. A., Chan, C. K., and Hofrichter, J. (1997) Submillisecond Kinetics of Protein Folding. Curr. Opin. Struct. Biol. 7, 10-14.

130
97. Eaton, W. A., Thompson, P. A., Chan, C. K., Hage, S. J., and Hofrichter, J. (1996) Fast Events in Protein Folding. Structure. 4, 1133-1139.
98. Gruebele, M. (2005) Downhill Protein Folding: Evolution Meets Physics. C. R. Biol. 328, 701-712.
99. Yang, W. Y., and Gruebele, M. (2004) Folding Lambda-Repressor at its Speed Limit. Biophys. J. 87, 596-608.
100. Zhu, Y., Alonso, D. O., Maki, K., Huang, C. Y., Lahr, S. J., Daggett, V., Roder, H., DeGrado, W. F., and Gai, F. (2003) Ultrafast Folding of alpha3D: A De Novo Designed Three-Helix Bundle Protein. Proc. Natl. Acad. Sci. U. S. A. 100, 15486-15491.
101. Ballew, R. M., Sabelko, J., and Gruebele, M. (1996) Observation of Distinct Nanosecond and Microsecond Protein Folding Events. Nat. Struct. Biol. 3, 923-926.
102. Ballew, R. M., Sabelko, J., and Gruebele, M. (1996) Direct Observation of Fast Protein Folding: The Initial Collapse of Apomyoglobin. Proc. Natl. Acad. Sci. U. S. A. 93, 5759-5764.
103. Ervin, J., Sabelko, J., and Gruebele, M. (2000) Submicrosecond Real-Time Fluorescence Sampling: Application to Protein Folding. J. Photochem. Photobiol. B. 54, 1-15.
104. Yang, W. Y., and Gruebele, M. (2003) Folding at the Speed Limit. Nature. 423, 193-197.
105. Gruebele, M. (1999) The Fast Protein Folding Problem. Annu. Rev. Phys. Chem. 50, 485-516.
106. Roder, H., and Colon, W. (1997) Kinetic Role of Early Intermediates in Protein Folding. Curr. Opin. Struct. Biol. 7, 15-28.
107. Roder, H., and Shastry, M. R. (1999) Methods for Exploring Early Events in Protein Folding. Curr. Opin. Struct. Biol. 9, 620-626.
108. Du, D., Tucker, M. J., and Gai, F. (2006) Understanding the Mechanism of Beta-Hairpin Folding Via Phi-Value Analysis. Biochemistry. 45, 2668-2678.
109. Dyer, R. B., Maness, S. J., Peterson, E. S., Franzen, S., Fesinmeyer, R. M., and Andersen, N. H. (2004) The Mechanism of Beta-Hairpin Formation. Biochemistry. 43, 11560-11566.
110. Klimov, D. K., and Thirumalai, D. (2000) Mechanisms and Kinetics of Beta-Hairpin Formation. Proc. Natl. Acad. Sci. U. S. A. 97, 2544-2549.
131
111. Roder, H. (2004) Stepwise Helix Formation and Chain Compaction during Protein Folding. Proc. Natl. Acad. Sci. U. S. A. 101, 1793-1794.
112. Nèolting, B. (1999) Protein Folding Kinetics : Biophysical Methods. Springer, Berlin ; New York.
113. Creighton, T. E. (1994) The Energetic Ups and Downs of Protein Folding. Nat. Struct. Biol. 1, 135-138.
114. Cantor, C. R., and Schimmel, P. R. (1980) Biophysical Chemistry. Freeman, San Francisco.
115. Demchenko, A. P. (1986) Ultraviolet Spectroscopy of Proteins. Rev. and enl. translation of the Russian ed., Springer-Verlag, Berlin ; New York.
116. Lakowicz, J. R., and NetLibrary, I. (2002) Topics in Fluorescence Spectroscopy. Kluwer Academic, New York.
117. Forster, T. (1948) *Zwischenmolekulare Energiewanderung Und Fluoreszenz. Annalen Der Physik. 2, 55-75.
118. Parr, C. L., Keates, R. A., Bryksa, B. C., Ogawa, M., and Yada, R. Y. (2007) The Structure and Function of Saccharomyces Cerevisiae Proteinase A. Yeast. 24, 467-480.
119. Yang, W. Y., Pitera, J. W., Swope, W. C., and Gruebele, M. (2004) Heterogeneous Folding of the Trpzip Hairpin: Full Atom Simulation and Experiment. J. Mol. Biol. 336, 241-251.
120. Banishev, A. A., Shirshin, E. A., and Fadeev, V. V. (2008) Determination of Photophysical Parameters of Tryptophan Molecules by Methods of Laser Fluorimetry. Quantum Electronics. 38, 77-81.
121. Strambini, G. B., Kerwin, B. A., Mason, B. D., and Gonnelli, M. (2004) The Triplet-State Lifetime of Indole Derivatives in Aqueous Solution. Photochem. Photobiol. 80, 462-470.
122. Bent, D. V., and Hayon, E. (1975) Excited State Chemistry of Aromatic Amino Acids and Related Peptides. III. Tryptophan. J. Am. Chem. Soc. 97, 2612-2619.
123. Gonnelli, M., and Strambini, G. B. (1995) Phosphorescence Lifetime of Tryptophan in Proteins. Biochemistry. 34, 13847-13857.
124. Gonnelli, M., and Strambini, G. B. (2005) Intramolecular Quenching of Tryptophan Phosphorescence in Short Peptides and Proteins. Photochem. Photobiol. 81, 614-622.
132
125. Li, Z., Lee, W. E., and Galley, W. C. (1989) Distance Dependence of the Tryptophan-Disulfide Interaction at the Triplet Level from Pulsed Phosphorescence Studies on a Model System. Biophys. J. 56, 361-367.
126. Tsentalovich, Y. P., Snytnikova, O. A., and Sagdeev, R. Z. (2004) Properties of Excited States of Aqueous Tryptophan. Journal of Photochemistry and Photobiology A-Chemistry. 162, 371-379.
127. Stevenson, K. L., Papadantonakis, G. A., and LeBreton, P. R. (2000) Nanosecond UV Laser Photoionization of Aqueous Tryptophan: Temperature Dependence of Quantum Yield, Mechanism, and Kinetics of Hydrated Electron Decay. Journal of Photochemistry and Photobiology A-Chemistry. 133, 159-167.
128. Fischer, C. J., Gafni, A., Steel, D. G., and Schauerte, J. A. (2002) The Triplet-State Lifetime of Indole in Aqueous and Viscous Environments: Significance to the Interpretation of Room Temperature Phosphorescence in Proteins. J. Am. Chem. Soc. 124, 10359-10366.
129. Banks, D. D., and Kerwin, B. A. (2004) A Deoxygenation System for Measuring Protein Phosphorescence. Anal. Biochem. 324, 106-114.
130. Evans, R. F., Ghiron, C. A., Volkert, W. A., Kuntz, R. R., Santus, R., and Bazin, M. (1976) Flash-Photolysis of N-Acetyl-L-Tryptophanamide - Evidence for Radical Production without Hydrated Electron Formation. Chemical Physics Letters. 42, 39-42.
131. Bryant, F. D., Santus, R., and Grossweiner, L. I. (1975) Laser Flash-Photolysis of Aqueous Tryptophan. J. Phys. Chem. 79, 2711-2716.
132. Evans, R. F., Ghiron, C. A., Kuntz, R. R., and Volkert, W. A. (1976) Flash-Photolysis of N-Acetyl-L-Tryptophanamide - Proton Quenching of Radical and Electron Production. Chemical Physics Letters. 42, 415-418.
133. Baugher, J. F., and Grossweiner, L. I. (1977) Photolysis Mechanism of Aqueous Tryptophan. J. Phys. Chem. 81, 1349-1354.
134. Roder, H., Maki, K., Cheng, H., and Shastry, M. C. (2004) Rapid Mixing Methods for Exploring the Kinetics of Protein Folding. Methods. 34, 15-27.
135. Shastry, M. C., Luck, S. D., and Roder, H. (1998) A Continuous-Flow Capillary Mixing Method to Monitor Reactions on the Microsecond Time Scale. Biophys. J. 74, 2714-2721.
133
136. Fierz, B., Joder, K., Krieger, F., and Kiefhaber, T. (2007) Using Triplet-Triplet Energy Transfer to Measure Conformational Dynamics in Polypeptide Chains. Methods Mol. Biol. 350, 169-187.
137. Fierz, B., and Kiefhaber, T. (2007) End-to-End Vs Interior Loop Formation Kinetics in Unfolded Polypeptide Chains. J. Am. Chem. Soc. 129, 672-679.
138. Fierz, B., Satzger, H., Root, C., Gilch, P., Zinth, W., and Kiefhaber, T. (2007) Loop Formation in Unfolded Polypeptide Chains on the Picoseconds to Microseconds Time Scale. Proc. Natl. Acad. Sci. U. S. A. 104, 2163-2168.
139. Englander, S. W., Calhoun, D. B., and Englander, J. J. (1987) Biochemistry without Oxygen. Anal. Biochem. 161, 300-306.
140. Eigen, M., and Hammes, G. G. (1960) Kinetic Studies of Adp Reactions with the Temperature Jump Method. J. Am. Chem. Soc. 82, 5951-5952.
141. Ballew, R. M., Sabelko, J., Reiner, C., and Gruebele, M. (1996) A Single-Sweep, Nanosecond Time Resolution Laser Temperature-Jump Apparatus. Rev. Sci. Instrum. 67, 3694-3699.
142. Ballew, R. M., Sabelko, J., and Gruebele, M. (1996) Observation of Distinct Nanosecond and Microsecond Protein Folding Events. Nat. Struct. Biol. 3, 923-926.
143. Williams, S., Causgrove, T. P., Gilmanshin, R., Fang, K. S., Callender, R. H., Woodruff, W. H., and Dyer, R. B. (1996) Fast Events in Protein Folding: Helix Melting and Formation in a Small Peptide. Biochemistry. 35, 691-697.
144. Munoz, V., Thompson, P. A., Hofrichter, J., and Eaton, W. A. (1997) Folding Dynamics and Mechanism of Beta-Hairpin Formation. Nature. 390, 196-199.
145. Ganesh, O. K., Green, T. B., Edison, A. S., and Hagen, S. J. (2006) Characterizing the Residue Level Folding of the Intrinsically Unstructured IA3. Biochemistry. 45, 13585-13596.
146. Buck, M. (1998) Trifluoroethanol and Colleagues: Cosolvents Come of Age. Recent Studies with Peptides and Proteins. Q. Rev. Biophys. 31, 297-355.
147. Kentsis, A., and Sosnick, T. R. (1998) Trifluoroethanol Promotes Helix Formation by Destabilizing Backbone Exposure: Desolvation rather than Native Hydrogen Bonding Defines the Kinetic Pathway of Dimeric Coiled Coil Folding. Biochemistry. 37, 14613-14622.
134
148. Thompson, P. A., Eaton, W. A., and Hofrichter, J. (1997) Laser Temperature Jump Study of the Helixcoil Kinetics of an Alanine Peptide Interpreted with a 'Kinetic Zipper' Model. Biochemistry. 36, 9200-9210.
149. Dyer RB. Helix Folding Kinetics. Analytical biochemistry.
150. Luo, P., and Baldwin, R. L. (1997) Mechanism of Helix Induction by Trifluoroethanol: A Framework for Extrapolating the Helix-Forming Properties of Peptides from trifluoroethanol/water Mixtures Back to Water. Biochemistry. 36, 8413-8421.
151. Jasanoff, A., and Fersht, A. R. (1994) Quantitative Determination of Helical Propensities from Trifluoroethanol Titration Curves. Biochemistry. 33, 2129-2135.
152. Zimm, B. H., and Bragg, J. K. (1959) Theory of the Phase Transition between Helix and Random Coil in Polypeptide Chains. J. Chem. Phys. 31, 526-535.
153. Schwarz, G. (1965) On Kinetics of Helix-Coil Transition of Polypeptides in Solution. J. Mol. Biol. 11, 64-&.
154. Sosnick, T. R., Jackson, S., Wilk, R. R., Englander, S. W., and DeGrado, W. F. (1996) The Role of Helix Formation in the Folding of a Fully Alpha-Helical Coiled Coil. Proteins. 24, 427-432.
155. Galzitskaya, O. V., Higo, J., and Finkelstein, A. V. (2002) Alpha-Helix and Beta-Hairpin Folding from Experiment, Analytical Theory and Molecular Dynamics Simulations. Curr. Protein Peptide Sci. 3, 191-200.
156. Huang, C. Y., Getahun, Z., Zhu, Y., Klemke, J. W., DeGrado, W. F., and Gai, F. (2002) Helix Formation Via Conformation Diffusion Search. Proc. Natl. Acad. Sci. U. S. A. 99, 2788-2793.
157. Gai, F., Du, D., and Xu, Y. (2007) Infrared Temperature-Jump Study of the Folding Dynamics of Alpha-Helices and Beta-Hairpins. Methods Mol. Biol. 350, 1-20.
158. Dumont, C., Matsumura, Y., Kim, S. J., Li, J., Kondrashkina, E., Kihara, H., and Gruebele, M. (2006) Solvent-Tuning the Collapse and Helix Formation Time Scales of Lambda(6-85)*. Protein Sci. 15, 2596-2604.
159. Chan, H. S., and Dill, K. A. (1998) Protein Folding in the Landscape Perspective: Chevron Plots and Non-Arrhenius Kinetics. Proteins. 30, 2-33.
135
160. Dinner, A. R., Sali, A., Smith, L. J., Dobson, C. M., and Karplus, M. (2000) Understanding Protein Folding Via Free-Energy Surfaces from Theory and Experiment. Trends Biochem. Sci. 25, 331-339.
161. Udgaonkar, J. B. (2008) Multiple Routes and Structural Heterogeneity in Protein Folding. Annu. Rev. Biophys. 37, 489-510.
162. Dobson, C. M., and Karplus, M. (1999) The Fundamentals of Protein Folding: Bringing Together Theory and Experiment. Curr. Opin. Struct. Biol. 9, 92-101.
163. Dobson, C. M., and Evans, P. A. (1988) Protein Structure .Trapping Folding Intermediates. Nature. 335, 666-667.
164. Jas, G. S., Eaton, W. A., and Hofrichter, J. (2001) Effect of Viscosity on the Kinetics of Alpha-Helix and Beta-Hairpin Formation. J Phys Chem B. 105, 261-272.
165. Cochran, A. G., Skelton, N. J., and Starovasnik, M. A. (2001) Tryptophan Zippers: Stable, Monomeric Beta -Hairpins. Proc. Natl. Acad. Sci. U. S. A. 98, 5578-5583.
166. Hauser, K., Krejtschi, C., Huang, R., Wu, L., and Keiderling, T. A. (2008) Site-Specific Relaxation Kinetics of a Tryptophan Zipper Hairpin Peptide using Temperature-Jump IR Spectroscopy and Isotopic Labeling. J. Am. Chem. Soc. 130, 2984-2992.
167. Grishina, I. B., and Woody, R. W. (1994) Contributions of Tryptophan Side Chains to the Circular Dichroism of Globular Proteins: Exciton Couplets and Coupled Oscillators. Faraday Discuss. (99), 245-262.
168. Yang, W. Y., and Gruebele, M. (2004) Detection-Dependent Kinetics as a Probe of Folding Landscape Microstructure. J. Am. Chem. Soc. 126, 7758-7759.
169. Wilemski, G., and Fixman, M. (1974) Diffusion-Controlled Intrachain Reactions of Polymers .2. Results for a Pair of Terminal Reactive Groups. J. Chem. Phys. 60, 878-890.
170. Huang, F., Hudgins, R. R., and Nau, W. M. (2004) Primary and Secondary Structure Dependence of Peptide Flexibility Assessed by Fluorescence-Based Measurement of End-to-End Collision Rates. J. Am. Chem. Soc. 126, 16665-16675.
171. Wang, X. J., and Nau, W. M. (2004) Kinetics of End-to-End Collision in Short Single-Stranded Nucleic Acids. J. Am. Chem. Soc. 126, 808-813.
136
172. Fierz, B., and Kiefhaber, T. (2007) End-to-End Vs Interior Loop Formation Kinetics in Unfolded Polypeptide Chains. J. Am. Chem. Soc. 129, 672-679.
173. Buscaglia, M., Schuler, B., Lapidus, L. J., Eaton, W. A., and Hofrichter, J. (2003) Kinetics of Intramolecular Contact Formation in a Denatured Protein. J. Mol. Biol. 332, 9-12.
174. Lapidus, L. J., Eaton, W. A., and Hofrichter, J. (2001) Dynamics of Intramolecular Contact Formation in Polypeptides: Distance Dependence of Quenching Rates in a Room-Temperature Glass. Phys. Rev. Lett. 87, 258101.

137
BIOGRAPHICAL SKETCH
Ranjani Narayanan was born in 1980 in Chidambaram, a small town in the state of Tamil
Nadu, India. She spent her childhood years in Durgapur, a steel township in the state of West
Bengal. She attended Carmel School and DAV Model School (Durgapur), where she was the
high school valedictorian. She was active in academic and extra-curricular activities. After
completing her schooling in 1998, she moved north to the Indian capital city, New Delhi to
pursue an undergraduate degree in electronics from Sri Venkateswara College.
She then joined the prestigious Indian Institute of Technology - Madras, or IITM in
Chennai, (then Madras) for her Masters degree in Physics (Ranked first in the competitive
entrance examination.) It is here that she discovered her passion for experimental research after
working with Dr. Vijayan on non-linear optics. She was the recipient of a merit scholarship for
both years of her study at IITM. She was also active in extra-curricular events at IITM,
volunteering for the prestigious cultural festival Saarang and NGO Child Relief and You.
The physics department at the University of Florida, Gainesville was the next stop for
Ranjani, who decided to work on protein folding kinetics for her doctoral dissertation under the
tutelage of Dr. Stephen J. Hagen. She learned to study the folding of proteins with nanosecond
lasers and honed her experimental skills by enhancing the capabilities of a temperature-jump
spectroscopy system. She co-authored a paper on coupled folding and binding in the
unstructured IA3 peptide, appearing in the prestigious Journal of the American Chemical Society.
She also presented her work in the American Physical Society meeting at New Orleans, and won
the student travel award, awarded by the Division of Biological Physics.
She met her husband, Balaji (Another Gator) during her stay in Gainesville and married
him in December 2006. She has volunteered for the Alachua County Library as a “Homework
Helper”. She is an avid Gator football and basketball fan.


![JSCSEN 7 ( ) (20 3)8–5411 1 1 ISSN 1820-7421(Online)phenyldiazenyl)-benzylidene]isonicotinohydrazide. Synthesis, spectro-scopic characterization and antimicrobial activity](https://img.pdfslide.net/doc/110x75/5acad77f7f8b9aa3298dddb3/jscsen-7-20-385411-1-1-issn-1820-7421online-phenyldiazenyl-benzylideneisonicotinohydrazide.jpg)