Embed Size (px)
Citation preview

Time-Resolved Near-Infrared Photometry of Extreme Kuiper BeltObject Haumea
Lacerda, P. (2009). Time-Resolved Near-Infrared Photometry of Extreme Kuiper Belt Object Haumea.Astronomical Journal, 137(2), 3404-3413. DOI: 10.1088/0004-6256/137/2/3404
Published in:Astronomical Journal
Document Version:Peer reviewed version
Queen's University Belfast - Research Portal:Link to publication record in Queen's University Belfast Research Portal
General rightsCopyright for the publications made accessible via the Queen's University Belfast Research Portal is retained by the author(s) and / or othercopyright owners and it is a condition of accessing these publications that users recognise and abide by the legal requirements associatedwith these rights.
Take down policyThe Research Portal is Queen's institutional repository that provides access to Queen's research output. Every effort has been made toensure that content in the Research Portal does not infringe any person's rights, or applicable UK laws. If you discover content in theResearch Portal that you believe breaches copyright or violates any law, please contact [email protected].
Download date:07. Jun. 2018
arX
iv:0
811.
3732
v1 [
astr
o-ph
] 2
3 N
ov 2
008
Accepted for publication, The Astronomical Journal. 2008 November 28.Preprint typeset using LATEX style emulateapj v. 08/22/09
TIME-RESOLVED NEAR-INFRARED PHOTOMETRYOF EXTREME KUIPER BELT OBJECT HAUMEA
Pedro LacerdaInstitute for Astronomy, University of Hawaii, 2680 Woodlawn Drive, Honolulu, HI 96822
Accepted for publication, The Astronomical Journal. 2008 November 28.
ABSTRACT
We present time-resolved near-infrared (J and H) photometry of the extreme Kuiper belt object(136108) Haumea (formerly 2003 EL61) taken to further investigate rotational variability of this object.The new data show that the near-infrared peak-to-peak photometric range is similar to the value atvisible wavelengths, ∆mR = 0.30±0.02 mag. Detailed analysis of the new and previous data revealssubtle visible/near-infrared color variations across the surface of Haumea. The color variations arespatially correlated with a previously identified surface region, redder in B−R and darker than themean surface. Our photometry indicates that the J−H colors of Haumea (J−H = −0.057 ± 0.016mag) and its brightest satellite Hi’iaka (J−H = −0.399±0.034 mag) are significantly (>9σ) different.The satellite Hi’iaka is unusually blue in J−H , consistent with strong 1.5 µm water-ice absorption.The phase coefficient of Haumea in the J-band is found to increase monotonically with wavelengthin the range 0.4 < λ < 1.3. We compare our findings with other Solar system objects and discussimplications regarding the surface of Haumea.Subject headings: Kuiper belt — methods: data analysis — minor planets, asteroids — solar system:
general — techniques: photometric
1. INTRODUCTION
Kuiper belt objects (KBOs) orbit the sun in the trans-Neptunian region of the Solar system. Mainly due totheir large heliocentric distances and resulting low tem-peratures, KBOs are amongst the least processed relicsof the planetary accretion disk and thus carry invaluableinformation about the physics and chemistry of planetformation. Moreover, as a surviving product of the de-bris disk of the Sun, the Kuiper belt is a nearby analog todebris disks around other stars and may provide usefulinsights into the study of the latter.
The known KBO population – which currentlyamounts to over a thousand objects – provides severalclues to the origin and evolution not only of the smallbodies but also of the planets. One example is the out-ward migration of planet Neptune, inferred from the needto explain the resonant structure of the KBO population,namely the 3:2 resonant KBOs of which (134340) Plutois a member (Malhotra 1995). Extreme, physically un-usual objects are a profitable source of interesting scienceas they often challenge existing paradigms. One suchunusual object in the Kuiper belt is (136108) Haumea,formerly known as 2003 EL61.
Haumea is remarkable in many ways. With approxi-mate triaxial semi-axes 1000 × 800 × 500 km, it is oneof the largest known KBOs. Its elongated shape is aconsequence of the very rapid 3.9 h period rotation,and those two properties combined can be used to in-fer Haumea’s bulk density (ρ ∼ 2500 kg m−3), assum-ing that the object’s shape has relaxed to hydrostaticequilibrium (Rabinowitz et al. 2006; Lacerda & Jewitt2007). Haumea’s rapid rotation and the spectral andorbital similarity between this object and a numberof smaller KBOs, have led Brown et al. (2007) to sug-gest that an ancient shattering collision (> 1 Gyr ago;
Electronic address: [email protected]
Ragozzine & Brown 2007) could explain both. Haumeais one of the bluest known KBOs, with B−R = 0.97±0.03mag (Rabinowitz et al. 2006; Lacerda et al. 2008), andit has an optical and infrared spectrum consistent witha surface coated in almost pure water-ice (Tegler et al.2007; Trujillo et al. 2007). This stands in contrast withother large KBOs such as Pluto, Eris, and 2005 FY9,which have methane rich surfaces (Cruikshank et al.1976; Brown et al. 2005; Licandro et al. 2006). Twosatellites have been detected in orbit around Haumea.The innermost, Namaka, has an orbital period of Porb ∼34 days, an apparent orbital semimajor axis a ∼ 1′′, anda fractional optical brightness of f ∼ 1.5% with respectto Haumea. The outermost, Hi’iaka has Porb ∼ 41 days,a ∼ 1.2′′, and f ∼ 6% (Brown et al. 2006).
Time-resolved optical photometry of Haumea has re-vealed evidence for a localized surface feature both redderand darker than the surrounding material (Lacerda et al.2008). Although the existing data are unable to breakthe degeneracy between the physical size and the coloror albedo of this dark, red spot (hereafter, DRS), theevidence points to it taking a large (> 20%) fraction ofthe instantaneous cross section. The composition of theDRS remains unknown but its albedo and B−R colorare consistent with the surfaces of Eris, 2005 FY9, andPluto’s and Iapetus’ brighter regions. These observationsmotivated us to search for rotational modulation of thewater ice band strength that might be associated withthe optically detected DRS.
In this paper we provide further constraints on thesurface properties of Haumea. We present time-resolvednear-infrared (J and H) data and search for visible/near-infrared color variability. We also constrain the J-bandphase function of Haumea and compare it to its opti-cal counterparts. Finally, we measure the J−H color ofHi’iaka, the brightest satellite of Haumea.
2 Pedro Lacerda
TABLE 1Journal of Observations of Haumea.
UT Date 2008 Apr 14Heliocentric Distance, R 51.116 AUGeocentric Distance, ∆ 50.240 AUPhase angle, α 0.55◦
Weather PhotometricTelescope 8.2 m SubaruInstrument MOIRCSPixel scale 0.117′′/pixelSeeing 0.5′′– 0.8′′
Filters (Exp. Time) J (30 s), H (20 s)
2. OBSERVATIONS
Near-infrared observations were taken using the 8.2-m diameter Subaru telescope atop Mauna Kea, Hawaii.We used the Multi-Object Infrared Camera and Spectro-graph (MOIRCS; Tokoku et al. 2003) which is mountedat the f/12.2 Cassegrain focus. MOIRCS accomodatestwo 2048×2048 pixel HgCdTe (HAWAII-2) arrays, witheach pixel projecting onto a square 0.117′′ on a side inthe sky. Observations were obtained through broadbandJ (λc = 1.26 µm, ∆λ = 0.17 µm) and H (λc = 1.64 µm,∆λ = 0.28 µm) filters. The data were instrumentallycalibrated using dark frames and dome flat-field imagesobtained immediately before and after the night of ob-servation. Because of technical difficulties with detector1, we used detector 2 for all our science and calibra-tion frames. Science images were obtained in sets of twodithered positions 15′′ apart, which were later mutuallysubtracted to remove the infrared background flux.
The night of 2008 April 15 UT was photometric, al-lowing us to absolutely calibrate the data using observa-tions of standard star FS33 from the UKIRT Faint Stan-dards catalog (Hawarden et al. 2001). The Haumea fluxthrough each filter was measured using circular aperturephotometry relative to a field star, while a second fieldstar was used to verify the constancy of the first. The dis-persion in the star-to-star relative photometry indicatesa mean 1σ uncertainty of ±0.015 magnitude in J and±0.023 magnitude in H . The field star was calibrated tothe standard star FS33 at airmass 1.02, just short of thetelescope’s Alt-Az elevation limit. From scatter in thestandard star photometry we estimate a systematic un-certainty in the absolute calibration of 0.04 magnitudesin J and 0.02 magnitudes in H . A brief journal of ob-servations can be found in Table 1. The final calibratedbroadband photometric measurements are listed in Ta-bles 2 and 3.
We generally obtained two consecutive sets of twodithered images in each filter before switching filters (i.e.JJ-JJ-HH-HH-. . .). This results in sets of four datapoints all within 3 to 4 minutes of each other. To re-duce the scatter in the lightcurves we binned each ofthese sets of consecutive measurements into a single datapoint, with each binned point obtained by averaging thetimes and magnitudes of the set. The error bar on eachbinned point includes the error on the mean magnitudeand the average uncertainty of the unbinned measure-ments, added in quadrature. The binned measurementsare listed in Tables 4 and 5.
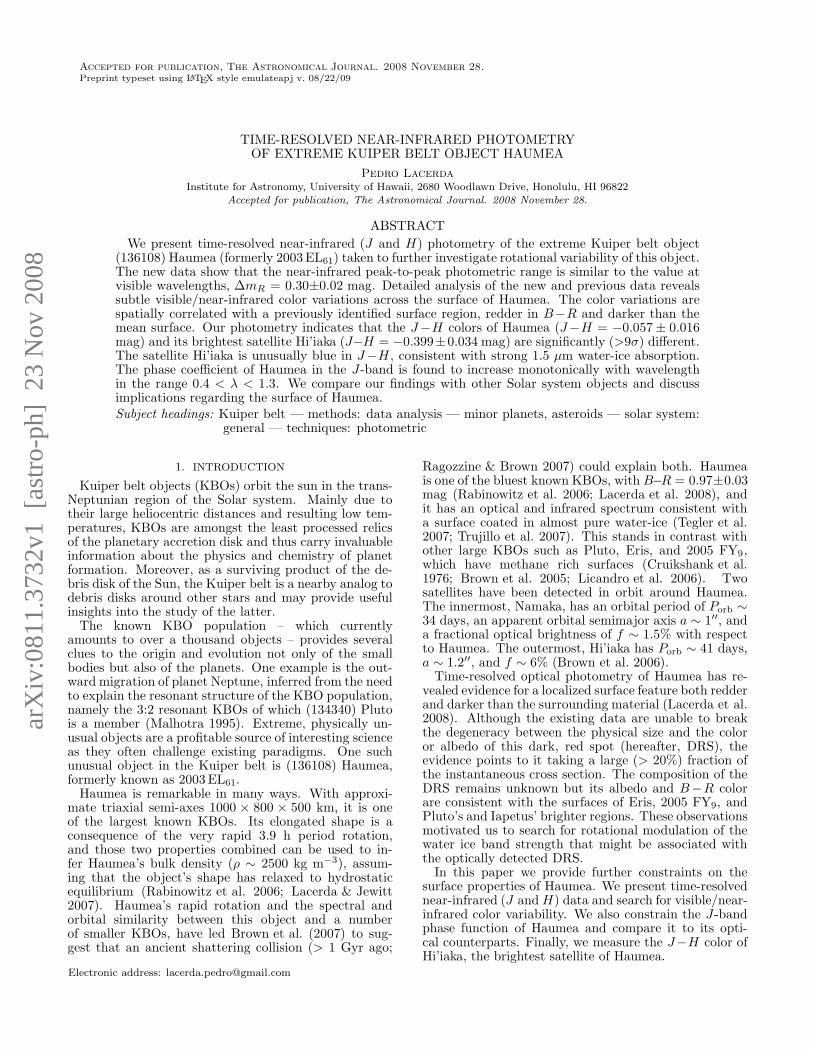
Fig. 1.— Four-color lightcurve of Haumea. Symbols labelled 2008correspond to the new J and H data presented here. Measurementsfrom 2007 (Lacerda et al. 2008) are marked for direct comparison.The vertical axis corresponds to the J2008 apparent magnitude.Data in other bands have been shifted using the mean colors (seetext).
Fig. 2.— Binned near-infrared lightcurve of Haumea. Here, setsof consecutive data points in Fig. 1 have been binned to reduce scat-ter. Green hexagons (J-band) and red circles (H-band) mark themean rotational phase and magnitude of consecutive measurements(mostly sets of four). Measurements from 2007 (Lacerda et al.2008) are marked for direct comparison: the green squares areJ-band measurements, while the densely sampled B- and R-banddata are plotted as thick cyan and orange lines. The vertical axiscorresponds to the J2008 apparent magnitude. Data in other bandshave been shifted using the mean colors (see text).

Near-IR Photometry of Haumea 3
TABLE 2J-band Photometry of Haumea.
UT Date a Julian Date a mJb UT Date a Julian Date a mJ
b
2008 Apr 15.10985 2454571.609852 16.370±0.022 2008 Apr 15.26057 2454571.760570 16.416±0.0222008 Apr 15.11066 2454571.610665 16.352±0.022 2008 Apr 15.26138 2454571.761382 16.441±0.0222008 Apr 15.11175 2454571.611747 16.352±0.020 2008 Apr 15.26790 2454571.767900 16.411±0.0222008 Apr 15.11255 2454571.612546 16.338±0.024 2008 Apr 15.26872 2454571.768716 16.398±0.0222008 Apr 15.16761 2454571.667607 16.352±0.019 2008 Apr 15.26979 2454571.769791 16.404±0.0242008 Apr 15.16842 2454571.668420 16.334±0.019 2008 Apr 15.27060 2454571.770602 16.371±0.0232008 Apr 15.18420 2454571.684204 16.385±0.020 2008 Apr 15.27696 2454571.776959 16.309±0.0222008 Apr 15.18502 2454571.685020 16.367±0.019 2008 Apr 15.27777 2454571.777775 16.260±0.0222008 Apr 15.18610 2454571.686098 16.386±0.019 2008 Apr 15.27886 2454571.778859 16.305±0.0222008 Apr 15.18691 2454571.686910 16.390±0.019 2008 Apr 15.27967 2454571.779671 16.272±0.0222008 Apr 15.19373 2454571.693727 16.343±0.018 2008 Apr 15.28660 2454571.786601 16.189±0.0262008 Apr 15.19454 2454571.694539 16.340±0.019 2008 Apr 15.28741 2454571.787407 16.173±0.0222008 Apr 15.19562 2454571.695623 16.327±0.018 2008 Apr 15.28849 2454571.788485 16.200±0.0242008 Apr 15.19644 2454571.696435 16.332±0.018 2008 Apr 15.28930 2454571.789298 16.186±0.0242008 Apr 15.20279 2454571.702793 16.263±0.019 2008 Apr 15.29585 2454571.795847 16.158±0.0212008 Apr 15.20361 2454571.703606 16.234±0.019 2008 Apr 15.29666 2454571.796665 16.132±0.0212008 Apr 15.20468 2454571.704682 16.247±0.019 2008 Apr 15.29774 2454571.797743 16.112±0.0222008 Apr 15.20549 2454571.705494 16.237±0.019 2008 Apr 15.29856 2454571.798556 16.121±0.0212008 Apr 15.21199 2454571.711991 16.180±0.019 2008 Apr 15.30507 2454571.805070 16.130±0.0202008 Apr 15.21280 2454571.712804 16.174±0.019 2008 Apr 15.30588 2454571.805884 16.135±0.0212008 Apr 15.21390 2454571.713896 16.172±0.019 2008 Apr 15.30697 2454571.806969 16.162±0.0212008 Apr 15.21471 2454571.714708 16.186±0.019 2008 Apr 15.30778 2454571.807784 16.123±0.0202008 Apr 15.22109 2454571.721087 16.167±0.018 2008 Apr 15.31249 2454571.812494 16.191±0.0202008 Apr 15.22190 2454571.721900 16.182±0.017 2008 Apr 15.31330 2454571.813304 16.174±0.0212008 Apr 15.22297 2454571.722974 16.173±0.019 2008 Apr 15.31831 2454571.818312 16.212±0.0212008 Apr 15.22379 2454571.723786 16.198±0.019 2008 Apr 15.31913 2454571.819128 16.246±0.0192008 Apr 15.23047 2454571.730466 16.228±0.019 2008 Apr 15.32385 2454571.823849 16.286±0.0192008 Apr 15.23128 2454571.731280 16.252±0.019 2008 Apr 15.32466 2454571.824657 16.301±0.0212008 Apr 15.23236 2454571.732358 16.232±0.020 2008 Apr 15.32953 2454571.829527 16.330±0.0252008 Apr 15.23317 2454571.733171 16.261±0.019 2008 Apr 15.33034 2454571.830342 16.318±0.0222008 Apr 15.23952 2454571.739521 16.333±0.021 2008 Apr 15.33506 2454571.835055 16.351±0.0222008 Apr 15.24034 2454571.740339 16.336±0.022 2008 Apr 15.33586 2454571.835859 16.361±0.0212008 Apr 15.24140 2454571.741404 16.350±0.021 2008 Apr 15.34632 2454571.846321 16.375±0.0222008 Apr 15.24222 2454571.742216 16.345±0.020 2008 Apr 15.34713 2454571.847132 16.377±0.0202008 Apr 15.24959 2454571.749588 16.392±0.020 2008 Apr 15.34822 2454571.848217 16.382±0.0212008 Apr 15.25039 2454571.750392 16.425±0.020 2008 Apr 15.34911 2454571.849106 16.352±0.0202008 Apr 15.25147 2454571.751474 16.432±0.020 2008 Apr 15.35012 2454571.850125 16.347±0.0202008 Apr 15.25229 2454571.752288 16.415±0.021 2008 Apr 15.35094 2454571.850936 16.366±0.0202008 Apr 15.25867 2454571.758673 16.420±0.022 2008 Apr 15.35202 2454571.852017 16.366±0.0202008 Apr 15.25949 2454571.759489 16.409±0.024 2008 Apr 15.35283 2454571.852828 16.347±0.020
a Dates in Haumea’s reference frame;b Apparent magnitude.
3. RESULTS AND DISCUSSION
3.1. Color Versus Rotation
The new data record just over one full rotation ofHaumea. Figure 1 combines previously published B andR data (Lacerda et al. 2008) with the new J and H dataand shows that all four filters exhibit very similar vari-ability with a combined total range ∆m = 0.30 ± 0.02mag. As described in §2, to improve the signal-to-noiseratios of the J and H data, we binned sets of measure-ments taken back-to-back (usually sets of four); the re-sulting lightcurve is shown in Fig. 2. There, the previ-ously identified dark, red spot (DRS; Lacerda et al. 2008)on the surface of Haumea is clearly apparent at rotationalphases close to φ = 0.8 in the B and R curves. The near-infrared data generally follow the R-band data but showa slight visible/near-infrared reddening which coincideswith the DRS.
The differences between the individual lightcurves inFigs. 1 and 2 are small. To highlight color variationson Haumea, we plot in Fig. 3 all possible combinationsof visible-to-near-infrared color curves. The curves arecalculated by interpolating the better-sampled B and Rdata to the binned J and H rotational phases (Fig. 2) and
subtracting. The error bars are dominated by the un-certainties in the near-infrared measurements, which areadded quadratically to the mean B or R errors. Whentaken separately, the color curves in Fig. 3 appear to dif-fer only marginally from a rotationally constant value.However, the color B−H , and arguably B−J , R−H ,and J−H , show visible reddening humps for rotationalphases close to where the DRS was found to lie (φ ∼ 0.8).To locate and quantify color variability features in thecurves in Fig. 3 we employ a running Gaussian proba-bility test. In this test we consider a moving rotationalphase window and calculate the quantity
G =
∑N
i=1(ci − c0)/ei√N
(1)
for the points that fall within the window. In Eq. (1), Nis the number of points within the window, ci and ei arethe color values and respective error bars of those points,and c0 is the median color of all points (dotted horizontallines in Fig. 3). We then move the window along eachcolor curve in rotational phase steps of 0.05 to obtaina running-G value. Equation (1) represents a Gaussiandeviate with zero mean and unity standard deviation and

4 Pedro Lacerda
TABLE 3H-band Photometry of Haumea.
UT Date a Julian Date a mHb UT Date a Julian Date a mH
b
2008 Apr 15.11484 2454571.614839 16.370±0.026 2008 Apr 15.25430 2454571.754303 16.505±0.0242008 Apr 15.11553 2454571.615528 16.396±0.026 2008 Apr 15.25501 2454571.755009 16.493±0.0222008 Apr 15.11648 2454571.616483 16.355±0.024 2008 Apr 15.25596 2454571.755956 16.489±0.0222008 Apr 15.11719 2454571.617187 16.382±0.025 2008 Apr 15.25665 2454571.756649 16.474±0.0222008 Apr 15.17144 2454571.671445 16.449±0.021 2008 Apr 15.26340 2454571.763400 16.478±0.0222008 Apr 15.17213 2454571.672129 16.423±0.020 2008 Apr 15.26409 2454571.764093 16.490±0.0262008 Apr 15.17311 2454571.673107 16.426±0.021 2008 Apr 15.26505 2454571.765051 16.527±0.0252008 Apr 15.17380 2454571.673799 16.424±0.021 2008 Apr 15.26574 2454571.765742 16.500±0.0262008 Apr 15.18920 2454571.689196 16.430±0.021 2008 Apr 15.27262 2454571.772622 16.388±0.0252008 Apr 15.18989 2454571.689885 16.402±0.021 2008 Apr 15.27332 2454571.773318 16.455±0.0282008 Apr 15.19086 2454571.690862 16.414±0.022 2008 Apr 15.27427 2454571.774272 16.432±0.0312008 Apr 15.19155 2454571.691552 16.413±0.022 2008 Apr 15.27496 2454571.774963 16.401±0.0272008 Apr 15.19847 2454571.698466 16.349±0.019 2008 Apr 15.28168 2454571.781679 16.273±0.0272008 Apr 15.19915 2454571.699147 16.340±0.020 2008 Apr 15.28237 2454571.782369 16.333±0.0332008 Apr 15.20011 2454571.700109 16.335±0.019 2008 Apr 15.28332 2454571.783321 16.302±0.0312008 Apr 15.20079 2454571.700787 16.330±0.017 2008 Apr 15.28401 2454571.784011 16.290±0.0342008 Apr 15.20749 2454571.707494 16.261±0.019 2008 Apr 15.29131 2454571.791314 16.249±0.0242008 Apr 15.20819 2454571.708186 16.268±0.020 2008 Apr 15.29201 2454571.792008 16.210±0.0232008 Apr 15.20914 2454571.709144 16.233±0.020 2008 Apr 15.29298 2454571.792983 16.188±0.0212008 Apr 15.20984 2454571.709836 16.225±0.020 2008 Apr 15.29367 2454571.793674 16.165±0.0222008 Apr 15.21673 2454571.716730 16.238±0.018 2008 Apr 15.30058 2454571.800584 16.186±0.0202008 Apr 15.21742 2454571.717424 16.197±0.018 2008 Apr 15.30126 2454571.801264 16.192±0.0192008 Apr 15.21838 2454571.718383 16.235±0.019 2008 Apr 15.30222 2454571.802219 16.181±0.0202008 Apr 15.21907 2454571.719073 16.208±0.019 2008 Apr 15.30291 2454571.802912 16.179±0.0212008 Apr 15.22582 2454571.725818 16.246±0.019 2008 Apr 15.30979 2454571.809794 16.213±0.0232008 Apr 15.22651 2454571.726511 16.245±0.020 2008 Apr 15.31049 2454571.810488 16.220±0.0232008 Apr 15.22747 2454571.727468 16.261±0.019 2008 Apr 15.31532 2454571.815318 16.253±0.0242008 Apr 15.22816 2454571.728161 16.255±0.019 2008 Apr 15.31601 2454571.816013 16.253±0.0232008 Apr 15.23518 2454571.735181 16.349±0.021 2008 Apr 15.32114 2454571.821135 16.333±0.0242008 Apr 15.23588 2454571.735878 16.344±0.020 2008 Apr 15.32183 2454571.821831 16.287±0.0242008 Apr 15.23683 2454571.736832 16.369±0.023 2008 Apr 15.32668 2454571.826679 16.383±0.0262008 Apr 15.23751 2454571.737510 16.343±0.021 2008 Apr 15.32736 2454571.827364 16.389±0.0252008 Apr 15.24423 2454571.744229 16.394±0.023 2008 Apr 15.33236 2454571.832360 16.457±0.0282008 Apr 15.24492 2454571.744916 16.408±0.024 2008 Apr 15.33305 2454571.833051 16.393±0.0262008 Apr 15.24587 2454571.745869 16.428±0.023 2008 Apr 15.33789 2454571.837886 16.443±0.0282008 Apr 15.24656 2454571.746561 16.459±0.023 2008 Apr 15.33861 2454571.838607 16.439±0.027
a Dates in Haumea’s reference frame;b Apparent magnitude.
TABLE 4Binned J-band Data.
Mean UT Date a Mean Julian Date a Mean mJb
2008 Apr 15.11120 2454571.611202 16.353±0.0132008 Apr 15.16801 2454571.668013 16.343±0.0132008 Apr 15.18556 2454571.685558 16.382±0.0102008 Apr 15.19508 2454571.695081 16.336±0.0092008 Apr 15.20414 2454571.704144 16.245±0.0102008 Apr 15.21335 2454571.713350 16.178±0.0092008 Apr 15.22244 2454571.722437 16.180±0.0102008 Apr 15.23182 2454571.731819 16.243±0.0112008 Apr 15.24087 2454571.740870 16.341±0.0102008 Apr 15.25094 2454571.750936 16.416±0.0122008 Apr 15.26003 2454571.760028 16.422±0.0122008 Apr 15.26925 2454571.769252 16.396±0.0132008 Apr 15.27832 2454571.778316 16.287±0.0152008 Apr 15.28795 2454571.787948 16.187±0.0122008 Apr 15.29720 2454571.797203 16.131±0.0132008 Apr 15.30643 2454571.806427 16.138±0.0122008 Apr 15.31290 2454571.812899 16.183±0.0142008 Apr 15.31872 2454571.818720 16.229±0.0182008 Apr 15.32425 2454571.824253 16.294±0.0132008 Apr 15.32993 2454571.829934 16.324±0.0152008 Apr 15.33546 2454571.835457 16.356±0.0132008 Apr 15.34769 2454571.847694 16.372±0.0112008 Apr 15.35148 2454571.851476 16.357±0.010
a Dates in Haumea’s reference frame;b Mean apparent magnitude.
TABLE 5Binned H-band Data.
Mean UT Date a Mean Julian Date a Mean mHb
2008 Apr 15.11601 2454571.616009 16.376±0.0152008 Apr 15.17262 2454571.672620 16.431±0.0112008 Apr 15.19037 2454571.690374 16.415±0.0112008 Apr 15.19963 2454571.699627 16.339±0.0092008 Apr 15.20866 2454571.708665 16.247±0.0132008 Apr 15.21790 2454571.717903 16.220±0.0122008 Apr 15.22699 2454571.726990 16.252±0.0092008 Apr 15.23635 2454571.736350 16.352±0.0112008 Apr 15.24539 2454571.745394 16.423±0.0162008 Apr 15.25548 2454571.755479 16.491±0.0122008 Apr 15.26457 2454571.764572 16.499±0.0142008 Apr 15.27379 2454571.773793 16.419±0.0182008 Apr 15.28284 2454571.782845 16.300±0.0182008 Apr 15.29249 2454571.792495 16.203±0.0192008 Apr 15.30174 2454571.801745 16.185±0.0092008 Apr 15.31014 2454571.810141 16.217±0.0142008 Apr 15.31567 2454571.815666 16.253±0.0132008 Apr 15.32148 2454571.821483 16.310±0.0232008 Apr 15.32702 2454571.827022 16.386±0.0152008 Apr 15.33271 2454571.832706 16.425±0.0302008 Apr 15.33825 2454571.838247 16.441±0.016
a Dates in Haumea’s reference frame;b Mean apparent magnitude.

Near-IR Photometry of Haumea 5
TABLE 6Mean magnitudes and colors.
Object mJa mH
b B − R R − J J − H
Haumea 16.29 ± 0.09 16.34 ± 0.10 0.972 ± 0.014 0.885 ± 0.012 −0.057 ± 0.016Satellite 18.92 ± 0.09 19.32 ± 0.10 . . . . . . −0.399 ± 0.034
a Mean apparent J magnitude on 2008 Apr 15 UT;b Mean apparent H magnitude on 2008 Apr 15 UT;
Fig. 3.— Visible and near-infrared color curves of Haumea.Each curve represents deviations from the respective rotationally-medianed mean color (from bottom up, B−J = 1.856 ± 0.012mag, B−H = 1.799 ± 0.021 mag, R−J = 0.885 ± 0.012 mag,R−H = 0.828 ± 0.016 mag, and J−H = −0.057 ± 0.016 mag)and is vertically shifted by 0.1 mag for clarity. Slight reddeningbumps are observable in B−H, B−J , and possibly in R−H andJ−H.
can thus be converted to a Gaussian probability, p(G),assuming that the points are normally distributed aroundthe median. The probability p(G) is sensitive to unlikelysequences of deviant points, all on one side of the median.Figure 4 shows the test results for each of the color curvesusing a window size ∆φ = 0.25 (see discussion below).The Figure shows that the B−H curve has a significant(∼4σ) non-random feature close to φ = 0.8. The testalso detects weaker (2.8σ and 2.5σ) features in the B−Jand R−H curves close to φ = 0.8.
The size of the rotational phase window ∆φ is physi-cally motivated by the fraction of the surface of Haumeathat is visible at any given instant. In that sense, itshould not be larger than ∆φ = 0.5. Moreover, although
Fig. 4.— Running Gaussian probability for each of the colorcurves in Fig. 3. Unlikely sequences of points all above or below themedian colors (horizontal, dotted lines in Fig. 3) will be visible aspeaks in this Figure. The color curve B−H color shows a significantpeak at rotational phase φ ∼ 0.8. Curves B−J and R−H showsmaller but noticeable features at the same rotational phase.
half the surface is visible, projection effects in the limbregion will make the effective visible area smaller, by pos-sibly another factor 2. In Fig. 5 we illustrate the effect ofthe window size by replotting the running p(G) for colorcurve B−H using four window sizes, ∆φ = 0.20, 0.25,0.33, and 0.50. As expected, p(G) does not differ muchfor windows 0.20 ≤ ∆φ ≤ 0.33. For the largest windowsize ∆φ = 0.50 the probability begins to appear dilluted,but even then the test succeeds in locating the feature atφ = 0.8.
The near-infrared measurements presented here areconsiderably less numerous than the the optical data thatwere used to identify the DRS in B−R (Lacerda et al.2008). Also, the J and H measurements may showsystematic correlations because they were measured onthe same night using the same telescope. Neverthe-less, the observed changes in B and R relative to Jand H do not suffer from this effect and are likely tobe real. A visible/near-infrared reddening was alreadyobserved in our 2007 data (see J2007 points in Fig. 1)adding confidence to our conclusions. The results pre-sented above suggest that the region close to the DRS isalso spectrally anomalous in the visible-to-near-infraredwavelength range with respect to the average surface ofHaumea.
6 Pedro Lacerda
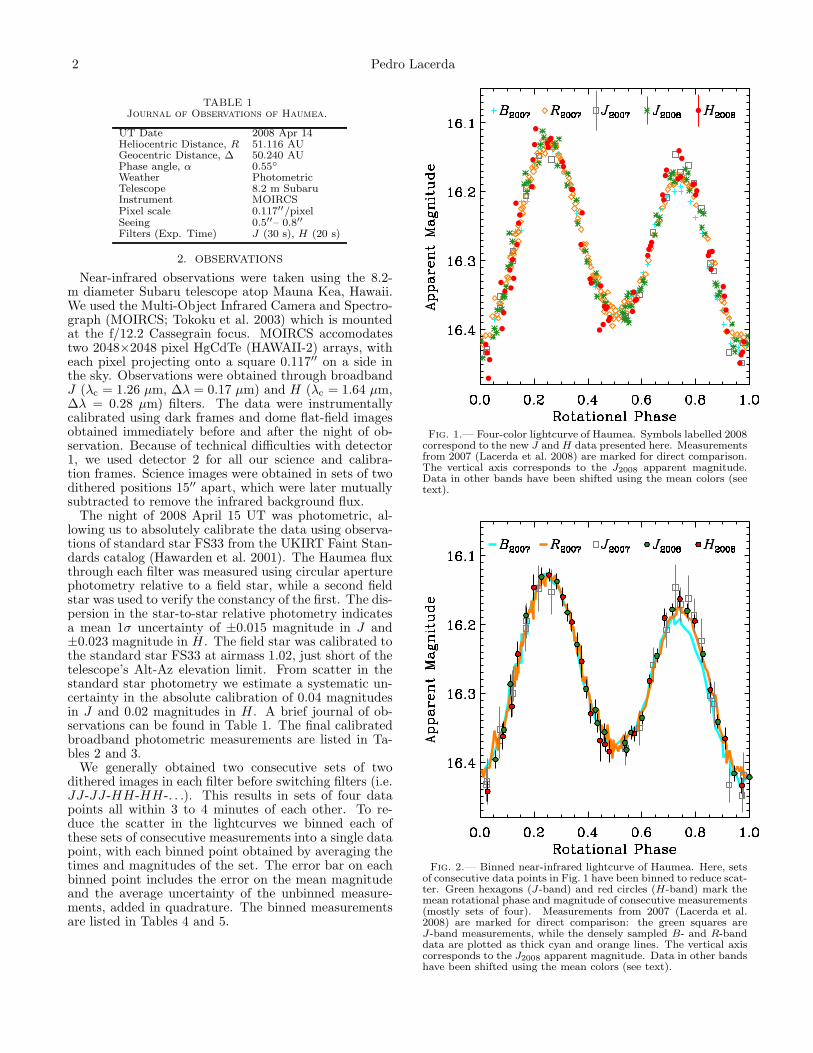
Fig. 5.— Running Gaussian probability for the B−H color curvefor four window sizes, ∆φ = 0.20, 0.25, 0.33, and 0.50. The run-ning probability p(G) is calculated in a window of width ∆φ whichis evaluated in rotational phase steps of 0.05. The differences areminimal for window sizes 0.20 ≤ ∆φ ≤ 0.33. For the largest win-dow size ∆φ = 0.50 the probability begins to appear dilluted. Seetext for details.
Fig. 6.— Normalized reflectivity vs. wavelength for different ro-tational phases. The reflectivities were computed from the broad-band colors by subtracting the colors of the Sun (B − R = 0.996,R − J = 0.797, J − H = 0.258; cf. Holmberg et al. 2006). Allcurves were normalized at the R-band, and divided by the curve atrotational phase φ = 0.4, for clarity. The inset shows the reflectiv-ities prior to dividing by the φ = 0.4 curve. The shaded polygonrepresents the uncertainty propagated from errors of measurement.
In Fig. 6 we combine our four-band data to producereflectivity vs. wavelength curves at different rotationalphases. We focus on the DRS region and plot curves atφ = 0.3 and φ = 0.4 as illustrative of the mean Haumeasurface. We employed interpolation to calculate colorindices at the given rotational phases, which were sub-
sequently converted to reflectivities relative to the R-band. To enhance the subtle differences with rotationwe normalize all curves by that at φ = 0.4; an inset inFig. 6 shows the reflectivities before normalization. Fig-ure 6 shows that relative to the majority of the surface ofHaumea the region near φ = 0.7 displays an enhanced H-band reflectivity which, close to φ = 0.8, is accompaniedby a depressed B-band reflectivity. Close to φ = 0.9, Bremains depressed, while H is restored to average values.We note that this variation is consistent with the resultsshown in Fig. 4. To summarize, the DRS region is bothfainter in B and brighter in H than the rest of Haumea.
The presence of a blue absorber on the DRS couldexplain the fainter B reflectance. A recent U - and B-band photometric study of KBOs (Jewitt et al. 2007)suggests that objects in the classical population (objectsin quasi-circular orbits between the 2:1 and the 3:2 mean-motion resonance with Neptune) lack significant blue ab-sorption. As discussed by those authors, B-band ab-sorption in main-belt asteroids is generally linked withthe presence of phyllosilicates and other hydrated min-erals (see also Gaffey & McCord 1978; Feierberg et al.1985) and is a characteristic feature in the spectra ofC and G-type asteroids (Tholen & Barucci 1989). Howlikely is it that Haumea has hydrated minerals on itssurface? Although Haumea is located in the classicalpopulation as defined above, it is atypical in its water-ice dominated surface spectrum and its high bulk den-sity (2.5 times water). These two properties suggest adifferentiated body with significant rocky content. Fur-thermore, KBOs (mainly the larger ones) have possiblysustained liquid water in their interiors due to radiogenicheating (Merk & Prialnik 2006). It would therefore beunremarkable to find trace amounts of hydrated miner-als on Haumea. In fact, fits to the near-infrared spec-trum of Haumea are slightly improved by the additionof phyllosilicates such as kaolinite and montmorillonite(Trujillo et al. 2007). Ultraviolet spectra of Haumea atdifferent rotational phases are needed to further con-strain the character of the blue absorption close to theDRS.
Our J and H photometry suggests that the 1.5 µmwater-ice band is weaker (less deep) close to the DRS. Incontrast, Lacerda et al. (2008) found marginal evidencethat the 1.5 µm band is deeper close to the DRS. Onedifference between the two measurements is that whilehere we use J vs. H , Lacerda et al. (2008) used J vs. the“CH4s” filter to assess possible variations in the water-ice band. The latter filter has a bandpass (center 1.60µm, FWHM 0.11 µm) between the 1.5 µm and the 1.65µm band diagnostic of crystalline water-ice and is thusaffected by the degree of crystallinity of the ice. The twomeasurements can be reconciled if the DRS material hasan overall less deep 1.5 µm water-ice band but a largerrelative abundance of crystalline water ice. We simulatedthis scenario using synthetic reflectance spectra [calcu-lated using published optical constants for crystallinewater ice (Grundy & Schmitt 1998) and a Hapke modelwith the best fit parameters for Haumea (Trujillo et al.2007)]. By convolving two model spectra, one for T = 30K and one for T = 140 K (to simulate a weaker crys-talline band), with the J , H , and CH4s bandpasses wefound an effect similar to what is observed. The 30 Kspectrum, taken to represent the DRS material, shows a
Near-IR Photometry of Haumea 7
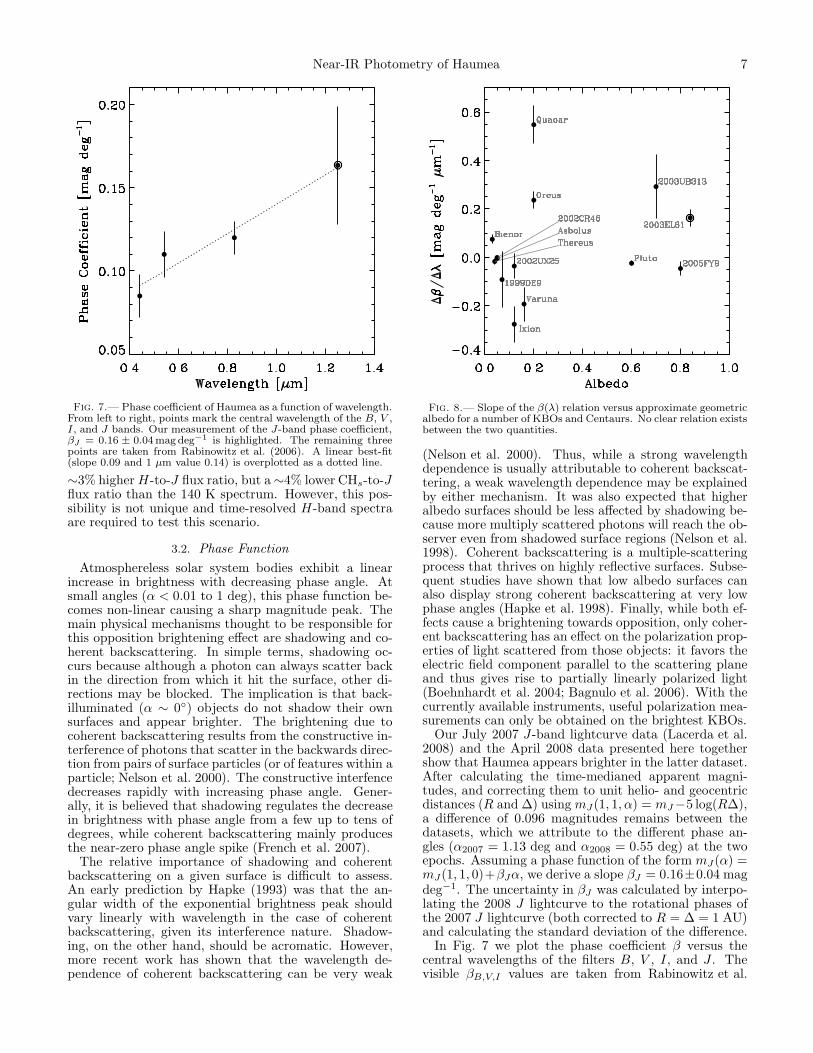
Fig. 7.— Phase coefficient of Haumea as a function of wavelength.From left to right, points mark the central wavelength of the B, V ,I, and J bands. Our measurement of the J-band phase coefficient,βJ = 0.16 ± 0.04mag deg−1 is highlighted. The remaining threepoints are taken from Rabinowitz et al. (2006). A linear best-fit(slope 0.09 and 1 µm value 0.14) is overplotted as a dotted line.
∼3% higher H-to-J flux ratio, but a ∼4% lower CHs-to-Jflux ratio than the 140 K spectrum. However, this pos-sibility is not unique and time-resolved H-band spectraare required to test this scenario.
3.2. Phase Function
Atmosphereless solar system bodies exhibit a linearincrease in brightness with decreasing phase angle. Atsmall angles (α < 0.01 to 1 deg), this phase function be-comes non-linear causing a sharp magnitude peak. Themain physical mechanisms thought to be responsible forthis opposition brightening effect are shadowing and co-herent backscattering. In simple terms, shadowing oc-curs because although a photon can always scatter backin the direction from which it hit the surface, other di-rections may be blocked. The implication is that back-illuminated (α ∼ 0◦) objects do not shadow their ownsurfaces and appear brighter. The brightening due tocoherent backscattering results from the constructive in-terference of photons that scatter in the backwards direc-tion from pairs of surface particles (or of features within aparticle; Nelson et al. 2000). The constructive interfencedecreases rapidly with increasing phase angle. Gener-ally, it is believed that shadowing regulates the decreasein brightness with phase angle from a few up to tens ofdegrees, while coherent backscattering mainly producesthe near-zero phase angle spike (French et al. 2007).
The relative importance of shadowing and coherentbackscattering on a given surface is difficult to assess.An early prediction by Hapke (1993) was that the an-gular width of the exponential brightness peak shouldvary linearly with wavelength in the case of coherentbackscattering, given its interference nature. Shadow-ing, on the other hand, should be acromatic. However,more recent work has shown that the wavelength de-pendence of coherent backscattering can be very weak
Fig. 8.— Slope of the β(λ) relation versus approximate geometricalbedo for a number of KBOs and Centaurs. No clear relation existsbetween the two quantities.
(Nelson et al. 2000). Thus, while a strong wavelengthdependence is usually attributable to coherent backscat-tering, a weak wavelength dependence may be explainedby either mechanism. It was also expected that higheralbedo surfaces should be less affected by shadowing be-cause more multiply scattered photons will reach the ob-server even from shadowed surface regions (Nelson et al.1998). Coherent backscattering is a multiple-scatteringprocess that thrives on highly reflective surfaces. Subse-quent studies have shown that low albedo surfaces canalso display strong coherent backscattering at very lowphase angles (Hapke et al. 1998). Finally, while both ef-fects cause a brightening towards opposition, only coher-ent backscattering has an effect on the polarization prop-erties of light scattered from those objects: it favors theelectric field component parallel to the scattering planeand thus gives rise to partially linearly polarized light(Boehnhardt et al. 2004; Bagnulo et al. 2006). With thecurrently available instruments, useful polarization mea-surements can only be obtained on the brightest KBOs.
Our July 2007 J-band lightcurve data (Lacerda et al.2008) and the April 2008 data presented here togethershow that Haumea appears brighter in the latter dataset.After calculating the time-medianed apparent magni-tudes, and correcting them to unit helio- and geocentricdistances (R and ∆) using mJ(1, 1, α) = mJ−5 log(R∆),a difference of 0.096 magnitudes remains between thedatasets, which we attribute to the different phase an-gles (α2007 = 1.13 deg and α2008 = 0.55 deg) at the twoepochs. Assuming a phase function of the form mJ(α) =mJ(1, 1, 0)+βJα, we derive a slope βJ = 0.16±0.04 magdeg−1. The uncertainty in βJ was calculated by interpo-lating the 2008 J lightcurve to the rotational phases ofthe 2007 J lightcurve (both corrected to R = ∆ = 1 AU)and calculating the standard deviation of the difference.
In Fig. 7 we plot the phase coefficient β versus thecentral wavelengths of the filters B, V , I, and J . Thevisible βB,V,I values are taken from Rabinowitz et al.

8 Pedro Lacerda
(2006) where they are measured in the phase range0.5 < α < 1.0 deg. A linear fit to the relation is over-plotted as a dotted line showing that βλ increases withλ. The fit has a slope ∆β/∆λ = 0.09 ± 0.03 mag deg−1
µm−1 and a 1 µm value β1µm = 0.14 ± 0.02 mag deg−1.Using a χ2 test we are only able to reject a constantβλ at the 2σ level. However, the monotonic increaseof βλ with wavelength plus the high albedo (pV > 0.6,Rabinowitz et al. 2006) of Haumea both suggest that co-herent backscattering is dominant in the range of phaseangles observed.
Small icy bodies in the solar system show verydiverse phase function vs. wavelength behaviors(Rabinowitz et al. 2007). Most KBOs for which thephase curve has been measured in more than oneband show steeper slopes towards longer wavelengths.We show here that in the case of Haumea this be-havior extends into the near-infrared. The Centaurs(Rabinowitz et al. 2007) and the Uranian satellites(Karkoschka 2001) show little variation in the phasecurve with wavelength for α < 3 to 6 deg, suggestingthat shadowing is dominant over coherent backscatter-ing. Other objects show opposite or even non-monotonicrelations between phase function slope and wavelength.For instance, some type of terrain on the Jovianmoon Europa have phase functions that vary non-monotonically with wavelength (Helfenstein et al. 1998),while Pluto’s phase function has a weak wavelengthdependence opposite to that seen in Haumea, fromβB = 0.037 ± 0.001 mag deg−1 to βR = 0.032 ± 0.001mag deg−1 (Buratti et al. 2003).
In Fig. 8 we plot the slope of the βλ vs. λ relationagainst approximate geometric albedo for a number ofKBOs and Centaurs. The values ∆β/∆λ were obtainedfrom linear fits to the phase slope measurements in threebands by Rabinowitz et al. (2007). The scatter in Fig. 8is substantial and no clear relation is evident betweenalbedo and the wavelength dependance of the phase func-tion. As a result, the interpretation of these results interms of physical properties of the surface is problem-atic. The photometric (and polarimetric) phase func-tions depend in a non-trivial way on the size and spatialarrangement of surface regolith particles, as well as ontheir composition. Besides, the phase functions of KBOscan only be measured in a narrow range of phase angles(currently 0.5 < α < 1.2 deg in the case of Haumea)making it difficult to recognize the presence or width ofnarrow opposition peaks. Nevertheless, further evidencethat coherent backscattering is responsible for the ob-served linearity between β and λ can be sought usingpolarization measurements of the surface of Haumea.
3.3. Satellite
We stacked our ∼70 frames in each filter to increase thesignal-to-noise ratio of any real features around Haumeaand so attempt to detect the satellites. In the stackedframes, we used a field star as representative of the point-spread function (PSF), scaled it to the brightest pixel ofHaumea and subtracted it from the KBO. The result isshown in Figs. 9 and 10, where the original image, thePSF, and the subtracted image are plotted; one satel-lite, Hi’iaka, is clearly visible through both filters. Wemeasure a Hi’iaka-Haumea separation d = 0.872±0.002′′
(PA = 184.67 ± 0.13 deg), and flux ratios (with respectto Haumea) of 0.088± 0.001 and 0.064± 0.002 in J andH , respectively. The mean UT of the frame stack is 2008Apr 15.23134. We do not detect any other sources in thevicinity of Haumea, although we are sensitive to objectsas faint as 0.11× the J-band (and 0.21× the H-band) fluxof Hi’iaka. At the time of observation, the fainter, innersatellite Namaka was within 0.2′′ of Haumea (Ragozzine,private comm.), which explains why it is invisible in ourdata. Given its fractional brightness (∼1%) with respectto Haumea, Namaka has negligible contribution to thenear-infrared photometry presented here.
Haumea has a color index J−H = −0.057±0.016 mag(see Fig. 3 and Table 6). Our photometry of Hi’iaka rel-ative to Haumea implies a color J−H = −0.399± 0.034mag for the former. This color index is unusually blue,but consistent with the observation that the 1.5 µmband is deeper for Hi’iaka than for Haumea (Takato et al.2006; Barkume et al. 2006). Table 6 lists the derivedcolors of Haumea and Hi’iaka. A sample of J − Hcolors of 40 KBOs and Centaurs found in the litera-ture (Delsanti et al. 2006) shows a pronounced cluster-ing around J−H = 0.4 mag with a dispersion of ∼0.2mag. The two significant outliers are KBOs (19308) 1996TO66 (J −H = −0.21 ± 0.17 mag) and (24835) 1995SM55 (J−H = −0.49 ± 0.06 mag) which both possessnear-infrared spectra consistent with water-ice absorp-tion (Brown et al. 1999; Barkume et al. 2008).
The J −H colors of Haumea and Hi’iaka are signifi-cantly (>9σ) different. Given the current best estimatesfor the mass and orbit of Hi’iaka, particles collisionallyejected (ejection velocities 10 to 200 m s−1) from itssurface will likely reach Haumea only on hyperbolic or-bits (Stern 2008). The escape speed from the surfaceof Hi’iaka (near 130 m s−1, assuming water-ice density)rivals the escape speed from the Haumea system at theorbit of Hi’iaka (∼120 m s−1), meaning that only hy-perbolic mass exchange is possible. The same cannotbe said about Namaka which is both smaller and deeperinto the potential well of the satellite system. It is there-fore more likely that Haumea is polluted by ejecta fromNamaka than from Hi’iaka. Whether this means thatthe J−H color of Namaka is closer to that of Haumearemains to be seen.
4. SUMMARY
From time-resolved, near-infared photometry ofKuiper belt object Haumea we find the following
• The near-infrared peak-to-peak photometric rangeis ∆mR = 0.30±0.02 mag. The new data re-veal slight visible/near-infrared color variations onHaumea, which are spatially correlated with a pre-viously identified surface region, redder in B−R anddarker than the mean surface. We find that nearthis region Haumea displays an enhanced H-bandreflectance accompanied by B-band absorption rel-ative to elsewhere on the surface. Time-resolvedspectra are needed to learn more about the physic-ochemical properties of this anomalous region.
• The rotationally medianed visible and near-infrared colors of Haumea are R−J = 0.885±0.012mag and J−H = −0.057± 0.016 mag.

Near-IR Photometry of Haumea 9
Fig. 9.— Top left: Stack of ∼ 70 J-band frames of Haumea. The satellite Hi’iaka is discernible to the left of Haumea. Top right: StellarPSF built from a stack of ∼ 70 J-band frames of a star in the Haumea field. Bottom left: Image of Hi’iaka obtained by subtracting the topright image from the top left one. Bottom right: Contours of Haumea and Hi’iaka (blue) overplotted on contours of the satellite Hi’iakaalone (red) to show the relative position.
• We detect Hi’iaka, Haumea’s brightest satellite, inboth J and H and measure its color J −H =−0.399 ± 0.034 mag. The J −H color differencebetween Hi’iaka and Haumea is significant (>9σ).This suggests that either the transfer of surfaceejecta between the two is negligible, or that theirsurface colors are not controlled by ejecta trans-fer. Ejecta transfer between Haumea and the innersatellite Namaka is neither ruled out nor substan-tiated by our data but is more likely given the con-figuration of the system.
• The slope of the J-band phase function in therange 0.55 ≤ α(deg) ≤ 1.14 is βJ = 0.16±0.04 magdeg−1. Combining this measurement with slopesobtained in three other visible wavelengths we find
that the slope of Haumea’s phase function variesmonotonically with wavelength. The slope of therelation is ∆β/∆λ ∼ 0.09 mag deg−1 µm−1 andβ1µm ∼ 0.14 mag deg−1. This finding confirms pre-vious inferences that coherent backscattering is themain cause of opposition brightening for Haumea.
ACKNOWLEDGMENTS
We appreciate insightful discussion and commentsfrom David Jewitt and Jan Kleyna. We thank WillGrundy for sharing useful software routines, and JonSwift for valuable discussion that contributed to thiswork. PL was supported by a grant to David Jewittfrom the National Science Foundation.
REFERENCES
Bagnulo, S., Boehnhardt, H., Muinonen, K., Kolokolova, L.,Belskaya, I., & Barucci, M. A. 2006, A&A, 450, 1239
Barkume, K. M., Brown, M. E., & Schaller, E. L. 2006, ApJ, 640,L87
—. 2008, AJ, 135, 55

10 Pedro Lacerda
Fig. 10.— Same as Fig. 9 for H-band data.
Boehnhardt, H., Bagnulo, S., Muinonen, K., Barucci, M. A.,Kolokolova, L., Dotto, E., & Tozzi, G. P. 2004, A&A, 415, L21
Brown, M. E., Barkume, K. M., Ragozzine, D., & Schaller, E. L.2007, Nature, 446, 294
Brown, M. E., Trujillo, C. A., & Rabinowitz, D. L. 2005, ApJ,635, L97
Brown, M. E., et al. 2006, ApJ, 639, L43Brown, R. H., Cruikshank, D. P., & Pendleton, Y. 1999, ApJ,
519, L101Buratti, B. J., et al. 2003, Icarus, 162, 171Cruikshank, D. P., Pilcher, C. B., & Morrison, D. 1976, Science,
194, 835Delsanti, A., Peixinho, N., Boehnhardt, H., Barucci, A., Merlin,
F., Doressoundiram, A., & Davies, J. K. 2006, AJ, 131, 1851Feierberg, M. A., Lebofsky, L. A., & Tholen, D. J. 1985, Icarus,
63, 183French, R. G., Verbiscer, A., Salo, H., McGhee, C., & Dones, L.
2007, PASP, 119, 623Gaffey, M. J., & McCord, T. B. 1978, Space Science Reviews, 21,
555Grundy, W. M., & Schmitt, B. 1998, J. Geophys. Res., 103, 25809Hapke, B. 1993, Theory of reflectance and emittance spectroscopy
(Topics in Remote Sensing, Cambridge, UK: CambridgeUniversity Press, —c1993)
Hapke, B., Nelson, R., & Smythe, W. 1998, Icarus, 133, 89Hawarden, T. G., Leggett, S. K., Letawsky, M. B., Ballantyne,
D. R., & Casali, M. M. 2001, MNRAS, 325, 563
Helfenstein, P., et al. 1998, Icarus, 135, 41Holmberg, J., Flynn, C., & Portinari, L. 2006, MNRAS, 367, 449Jewitt, D., Peixinho, N., & Hsieh, H. H. 2007, AJ, 134, 2046Karkoschka, E. 2001, Icarus, 151, 51Lacerda, P., Jewitt, D., & Peixinho, N. 2008, AJ, 135, 1749Lacerda, P., & Jewitt, D. C. 2007, AJ, 133, 1393Licandro, J., Pinilla-Alonso, N., Pedani, M., Oliva, E., Tozzi,
G. P., & Grundy, W. M. 2006, A&A, 445, L35Malhotra, R. 1995, AJ, 110, 420Merk, R., & Prialnik, D. 2006, Icarus, 183, 283Nelson, R. M., Hapke, B. W., Smythe, W. D., & Horn, L. J. 1998,
Icarus, 131, 223Nelson, R. M., Hapke, B. W., Smythe, W. D., & Spilker, L. J.
2000, Icarus, 147, 545Rabinowitz, D. L., Barkume, K., Brown, M. E., Roe, H.,
Schwartz, M., Tourtellotte, S., & Trujillo, C. 2006, ApJ, 639,1238
Rabinowitz, D. L., Schaefer, B. E., & Tourtellotte, S. W. 2007,AJ, 133, 26
Ragozzine, D., & Brown, M. E. 2007, AJ, 134, 2160Stern, S. A. 2008, ArXiv e-prints, 805Takato, N., Terada, H., & Tae-Soo, P. 2006, Oral communicationTegler, S. C., Grundy, W. M., Romanishin, W., Consolmagno,
G. J., Mogren, K., & Vilas, F. 2007, AJ, 133, 526Tholen, D. J., & Barucci, M. A. 1989, in Asteroids II, ed. R. P.
Binzel, T. Gehrels, & M. S. Matthews, 298–315

Near-IR Photometry of Haumea 11
Tokoku, C., et al. 2003, in Instrument Design and Performancefor Optical/Infrared Ground-based Telescopes., ed. M. Iye &A. F. M. Moorwood, Vol. 4841, 1625–1633
Trujillo, C. A., Brown, M. E., Barkume, K. M., Schaller, E. L., &Rabinowitz, D. L. 2007, ApJ, 655, 1172