Embed Size (px)
Citation preview
Time use diary design for our times - an overview, and an example of a ‘drag-
and-drop’ diary instrument for online application.
Sullivan, Oriel; Gershuny, Jonathan; Sevilla, Almudena; Walthery, Pierre and Vega,
Marga
Centre for Time Use Research
Department of Social Science, UCL (IOE)
Time use diary design for our times - an overview, presenting a Drop-and-drag diary
instrument for online application.
Introduction
The recent global pandemic, involving restrictions on movement, social distancing and the
displacement of many work activities to the home, has created an upsurge of interest in changes
in the distribution and sequencing of our daily activities. Time use diary data is recognised as
the leading source of evidence on this topic. The purpose of this paper is to provide a timely
overview of the current state-of-the-art in respect of the design of time use surveys for rapid,
online or smartapp deployment. It has three parts: firstly, for those who are looking for an
overview of the various diary designs in use, we briefly summarise the main methods currently
deployed to collect time use data. Secondly, for those interested in learning more about the
development of time use diary data collection, we present an overview of the history of the
development of the various kinds of diary designs and purposes, from their origin in the late
1800s. Finally, we present a detailed example of a specific kind of diary design, the ‘Drag-and-
drop diary’, that may be of particular interest in respect of the sudden demand for new data on
time use as it is both user-friendly to complete and capable of rapid online adaptation and
deployment.
Time diary survey design: overview
Everything we do, we do in time. Just as in physics and spatial navigation, so in social science,
public health and the study of environmental sustainability, the measurement of activities in real
time is of central importance. The appropriate measurement technique for this type of data is the
time use diary: the collection of uninterrupted accounts of the continuous stream of daily
activities, with estimated start/finish times, from which researchers can estimate both durations
and sequences. Time use diary data is by now recognised as the ‘gold standard’ for the collection
of information about people’s use of time (Cornwell, Gershuny and Sullivan 2019; Gershuny et
al 2020 forthcoming). Questionnaire approaches based on recall of time-allocation (asking how
much time a respondent spent in a particular activity over the past week, for example) are of
limited use for this purpose, since respondents are in general unaware of totals of time devoted to
specific activities, and are rarely asked about their activity sequences. In order to pinpoint the
main considerations involved in designing a time use diary survey, it is, however, necessary first
to consider the survey-questionnaire based alternative, as this is the commonly used standard
‘time-use’ add-on to many major nationally-representative surveys.
Survey time-allocation questions
These are usually framed in two different ways: 1) an estimate of the frequency with which one
undertook a particular activity over a given reference period – for example, the past week or
month (as used, for example, in the Millennium Cohort Study and the Avon Longitudinal Study
of Parents and Children) and 2) an estimate of how much time one spent in a given activity over
a given reference period (for example in the U.S. Panel Study of Income Dynamics, the U.K.
British Household Panel Study/Understanding Society and the Australian Household Income and
Labour Dynamics survey to look at housework time). Such measures are widely used, but all
involve assumptions about how accurately we remember our time; methodological work
comparing diary responses with questionnaire responses shows that the latter are far less
accurate. For example, it has been found that men tend to overestimate their housework time,
while women may underestimate theirs (Kan and Pudney 2008, Schultz and Grunow 2012).
Similarly, men who work longer hours tend to overestimate their working time, while part-time
employed women tend to underestimate theirs (Walthery and Gershuny 2019) These sorts of
inaccuracies are understandable, because while we are aware of the passage of time we generally
do not remember how much of it we devote to each different activity. So, for example, the
question “How many hours did you spend in your job last week?” or “how many hours did you
spend doing general housework” – is not necessarily easy to answer. It tends to unreliability
partly due to a failure of recall; we do not, as part of our normal routines, undertake the various
mental processes that would be necessary to answer this sort of question accurately: firstly
classifying activities into groups—deciding for example what belongs in the category of ‘paid
work’ or ‘housework’—then adding the duration of each successive episode to the accumulated
total for that category. And finally, deciding what constitutes ‘a week’, and starting to
accumulate a new total of time as a result. Not knowing the answer, we make a guess, which is
likely to be influenced by a desire to represent ourselves in particular ways, as for example the
sort of person who works long hours at her job or cooks, or does not cook, who plays a sport or
goes to the theatre, by exaggerating or reducing our estimates of the time we devote to particular
activities. These two sources of error, respectively, measurement error and normative bias, are
known to distort the responses that people give to these sorts of questions (Juster and Stafford,
1985).
Time use survey design - considerations
There are several initial considerations to be taken into account when designing a time use diary
survey:
- Mode of collection (paper, online, smartphone).
- Number of activity categories (‘full’ = own-word, or ‘light’ = pre-coded activity list
diary)
- Diary information fields (main activity only, or additional information like secondary
activities, who with, where, enjoyment etc.)
- Time-slot length (user-defined start/finish times, or defined time-slots eg 10 minutes, 15
minutes etc.)
- Number of diary days collected (single day, weekday and weekend day, other)
Below we outline the main design alternatives that are currently in use, focussing first on the
above considerations in relation to traditional pen-and-paper-based diaries, and then discussing
new methodologies designed for deployment online or with smart-apps. Time use diary research
has a long history, discussed briefly in the following section, and current best practice in diary
design is the outcome of this long traditional of data collection.
Paper-based time use diaries
Time use diaries have traditionally been pen-and-paper based, in the form of a small booklet left
behind by an interviewer for respondents to complete on a designated day or days, or completed
in retrospect (‘day before interview’) by an interviewer during an arranged call-back interview.
This has been the standard method of collection, and all the over 100 nationally-representative
time use diary surveys of the Multinational Time Use Study archive assembled, harmonized and
disseminated by the UCL Centre for Time Use Research were collected in this way (including
the most recent nationally-representative UK 2014-15 Time Use Diary Survey – the UKTUS
2015). In respect of the number of activities recorded both options are available for paper diaries;
1) in ‘full’ diaries respondents record (write up) in their own words what they are doing,
and, post -survey, coders code up their responses into typically up to 300 categories of
different activities (which may then of course be amalgamated into smaller clusters of
activities). These full diaries are the gold standard for large-scale nationally
representative surveys, such as the UKTUS 2015 and the rest of the Harmonised
European Time Use Survey (HETUS). Figure 1 shows an example of this type of diary –
that used in the UKTUS 2015 (Gershuny and Sullivan 2017). The diary has rows
representing successive 10- minute periods, and separate columns in which respondents
record: “what were you doing?” (main or main activity); “were you doing anything else
at the same time” (secondary activity); “where were you?” (location); and “who else was
engaged in this activity with you?” (co-presence). The two activity columns are each
coded into over 250 distinct activity categories. An innovation of this particular survey
was that we added two columns recording whether the respondent was using an
electronic device (screen, laptop, tablet or smartphone), and how much she/he enjoyed
each ten-minute period. Note that this diary is pre-formatted into 10-minute time-slots.
This level of granularity of time-slots is considered the optimum compromise for
reducing respondents’ burden (in terms of having to remember exact start and finish
times), while enabling them to complete a full record of their activities (it also facilitates
the process of subsequent transposition into a data file). Activities that last longer than
10 minutes can be recorded with a line drawn across the relevant time slots – as in the
example shown in Figure 1. The obvious ambiguity here lies in how respondents will
record activities lasting less than 10 minutes; will they ignore them, record them as
secondary activities or record them as lasting the full 10 minutes? This ambiguity
necessitates a trade-off between the complexity and length of the diary (if time-slots
lasted only one minute, for example), and accuracy of record. The general judgement is
that 10-minute time-slots are optimum, and time-slots of longer durations than 10
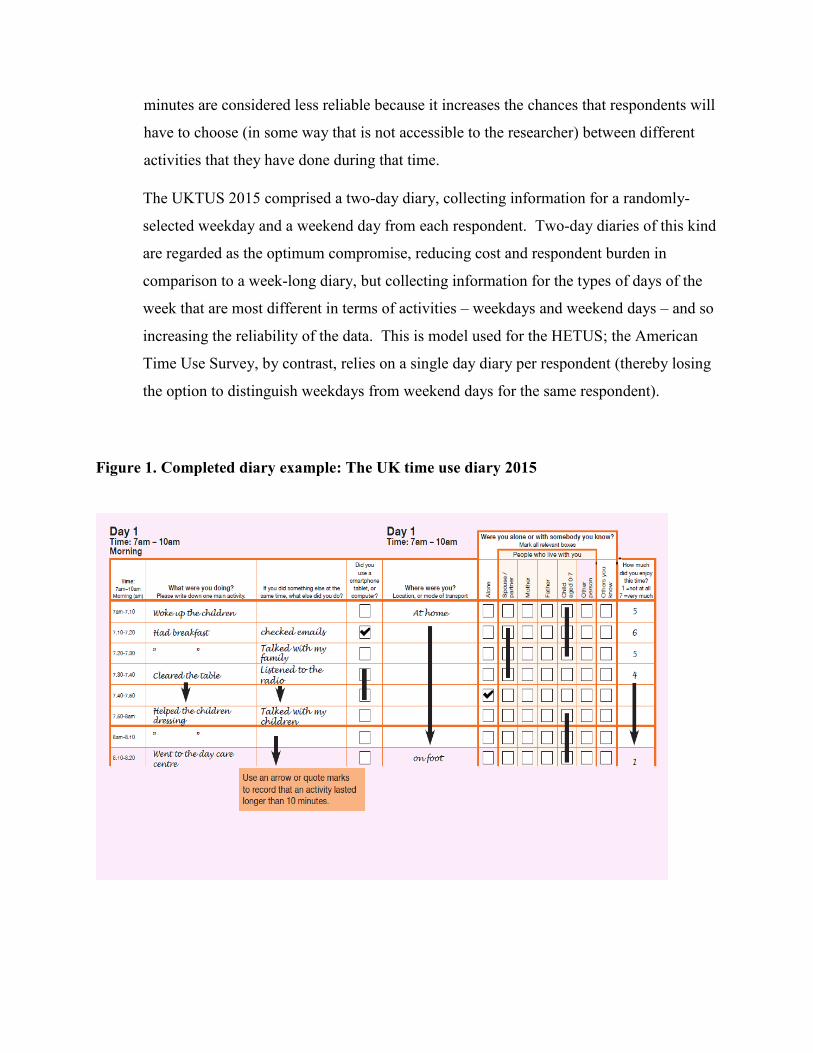
minutes are considered less reliable because it increases the chances that respondents will
have to choose (in some way that is not accessible to the researcher) between different
activities that they have done during that time.
The UKTUS 2015 comprised a two-day diary, collecting information for a randomly-
selected weekday and a weekend day from each respondent. Two-day diaries of this kind
are regarded as the optimum compromise, reducing cost and respondent burden in
comparison to a week-long diary, but collecting information for the types of days of the
week that are most different in terms of activities – weekdays and weekend days – and so
increasing the reliability of the data. This is model used for the HETUS; the American
Time Use Survey, by contrast, relies on a single day diary per respondent (thereby losing
the option to distinguish weekdays from weekend days for the same respondent).
Figure 1. Completed diary example: The UK time use diary 2015
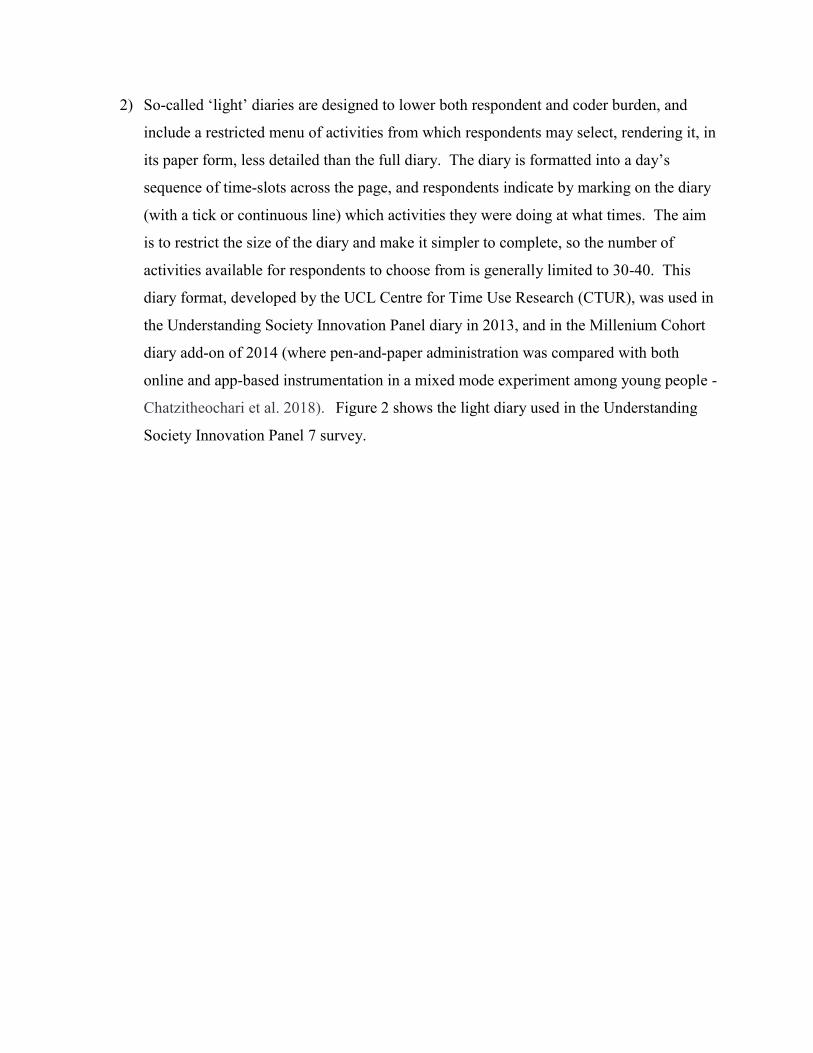
2) So-called ‘light’ diaries are designed to lower both respondent and coder burden, and
include a restricted menu of activities from which respondents may select, rendering it, in
its paper form, less detailed than the full diary. The diary is formatted into a day’s
sequence of time-slots across the page, and respondents indicate by marking on the diary
(with a tick or continuous line) which activities they were doing at what times. The aim
is to restrict the size of the diary and make it simpler to complete, so the number of
activities available for respondents to choose from is generally limited to 30-40. This
diary format, developed by the UCL Centre for Time Use Research (CTUR), was used in
the Understanding Society Innovation Panel diary in 2013, and in the Millenium Cohort
diary add-on of 2014 (where pen-and-paper administration was compared with both
online and app-based instrumentation in a mixed mode experiment among young people -
Chatzitheochari et al. 2018). Figure 2 shows the light diary used in the Understanding
Society Innovation Panel 7 survey.
Figure 2: Completed diary example, Understanding Society IP7 diary
In an era when life is inexorably moving online, and in which online surveys and smartphone
apps have been increasingly prominent in producing rapid (if not always accurate) results,
attention has switched more recently to considerations of how it might be possible to collect time
use diary data of good quality in a digital format.
New device-based instruments to collect time diary data
Attempts to collect time use data using apps and online devices are a relatively recent
development. In terms of design here are currently three main approaches, that vary in terms of
the completeness of their collection strategies. An advantage of internet or app-based techniques
is that they are able to overcome one of the restrictions of the light diary format by providing the
possibility of using ‘unfolding’ (sequentially nested) lists of activity with levels of detail about
activities potentially rivalling those of full own-words surveys. The first two approaches (the
survey-like Modular approach and the diary-like Drag-and-drop approach) collect the full
sequence of activities across the day; necessary if one wants to analyse the timing or ordering of
activities (for example, the duration of leisure activities, and what activity interrupts them, by
gender). The third (Point-estimate approach), developed for a different purpose, relies on the
sampling of a few activities through a designated day or days, so that mean distributions of the
different daily activities may be calculated, but activity durations and sequence information is
not available (see Gershuny 2004). We describe each of these in turn, using examples, below:
1. Survey-like Modular approach (e.g. Modular Online Time Use Survey - MOTUS): This
method has been developed by the TOR research group at Vrei Universitat Belgium (e.g. Minnen
et al. 2014; for a recent online example designed for collecting information in the current Covid-
19 crisis see https://www.everydaylife.eu/).
This approach involves respondents initially selecting the start and end time of their first main
activity of the day, and then the activity itself from drop-down menus. This is followed by the
collection of further information for that activity period, such as secondary activities, who with
and location information. And so on through each main activity of the day. Figure 3 illustrates in
the left hand screen the time log information (taken from the app version of the instrument) for
main (‘primary’) and any secondary activities done at the same time, and the collection of the
context information for the same main activity episode in the right hand screen.
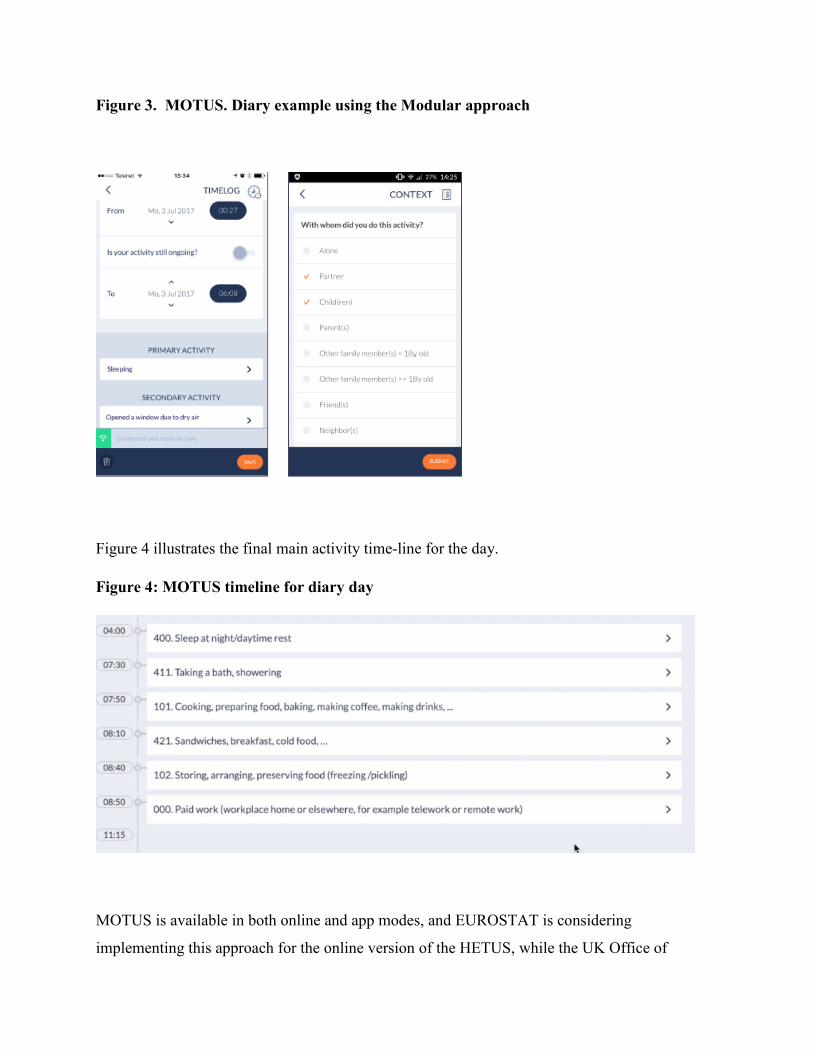
Figure 3. MOTUS. Diary example using the Modular approach
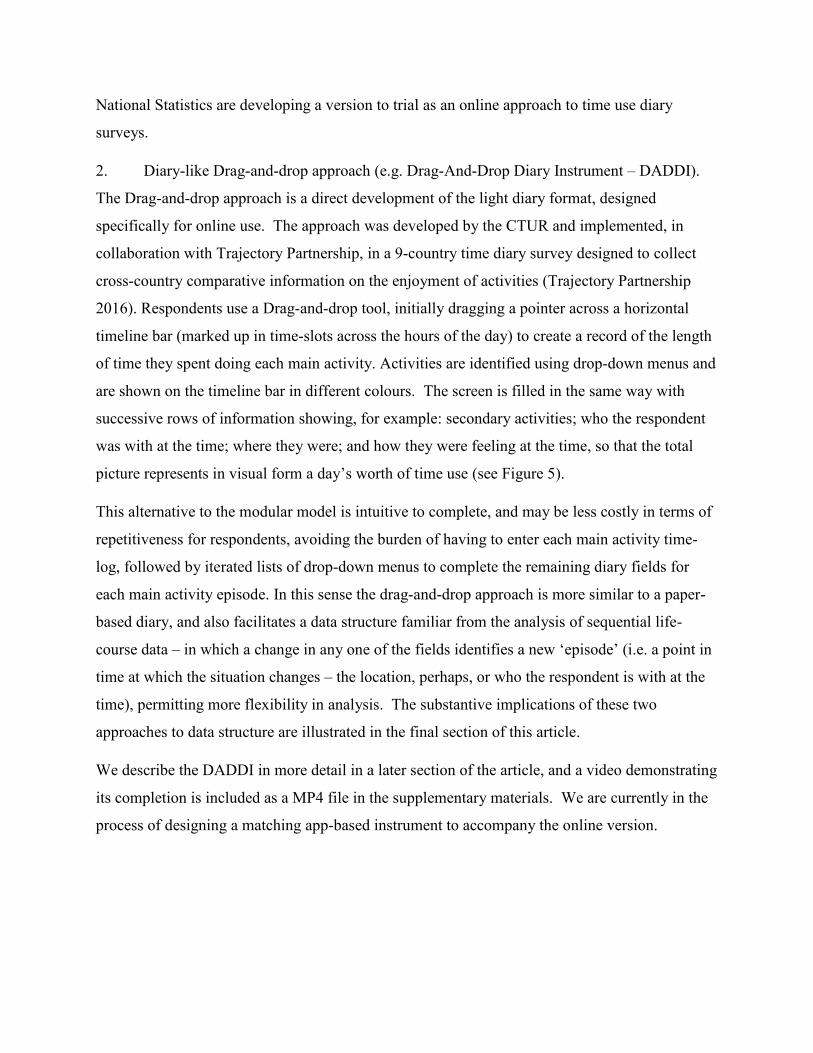
Figure 4 illustrates the final main activity time-line for the day.
Figure 4: MOTUS timeline for diary day
MOTUS is available in both online and app modes, and EUROSTAT is considering
implementing this approach for the online version of the HETUS, while the UK Office of
National Statistics are developing a version to trial as an online approach to time use diary
surveys.
2. Diary-like Drag-and-drop approach (e.g. Drag-And-Drop Diary Instrument – DADDI).
The Drag-and-drop approach is a direct development of the light diary format, designed
specifically for online use. The approach was developed by the CTUR and implemented, in
collaboration with Trajectory Partnership, in a 9-country time diary survey designed to collect
cross-country comparative information on the enjoyment of activities (Trajectory Partnership
2016). Respondents use a Drag-and-drop tool, initially dragging a pointer across a horizontal
timeline bar (marked up in time-slots across the hours of the day) to create a record of the length
of time they spent doing each main activity. Activities are identified using drop-down menus and
are shown on the timeline bar in different colours. The screen is filled in the same way with
successive rows of information showing, for example: secondary activities; who the respondent
was with at the time; where they were; and how they were feeling at the time, so that the total
picture represents in visual form a day’s worth of time use (see Figure 5).
This alternative to the modular model is intuitive to complete, and may be less costly in terms of
repetitiveness for respondents, avoiding the burden of having to enter each main activity time-
log, followed by iterated lists of drop-down menus to complete the remaining diary fields for
each main activity episode. In this sense the drag-and-drop approach is more similar to a paper-
based diary, and also facilitates a data structure familiar from the analysis of sequential life-
course data – in which a change in any one of the fields identifies a new ‘episode’ (i.e. a point in
time at which the situation changes – the location, perhaps, or who the respondent is with at the
time), permitting more flexibility in analysis. The substantive implications of these two
approaches to data structure are illustrated in the final section of this article.
We describe the DADDI in more detail in a later section of the article, and a video demonstrating
its completion is included as a MP4 file in the supplementary materials. We are currently in the
process of designing a matching app-based instrument to accompany the online version.
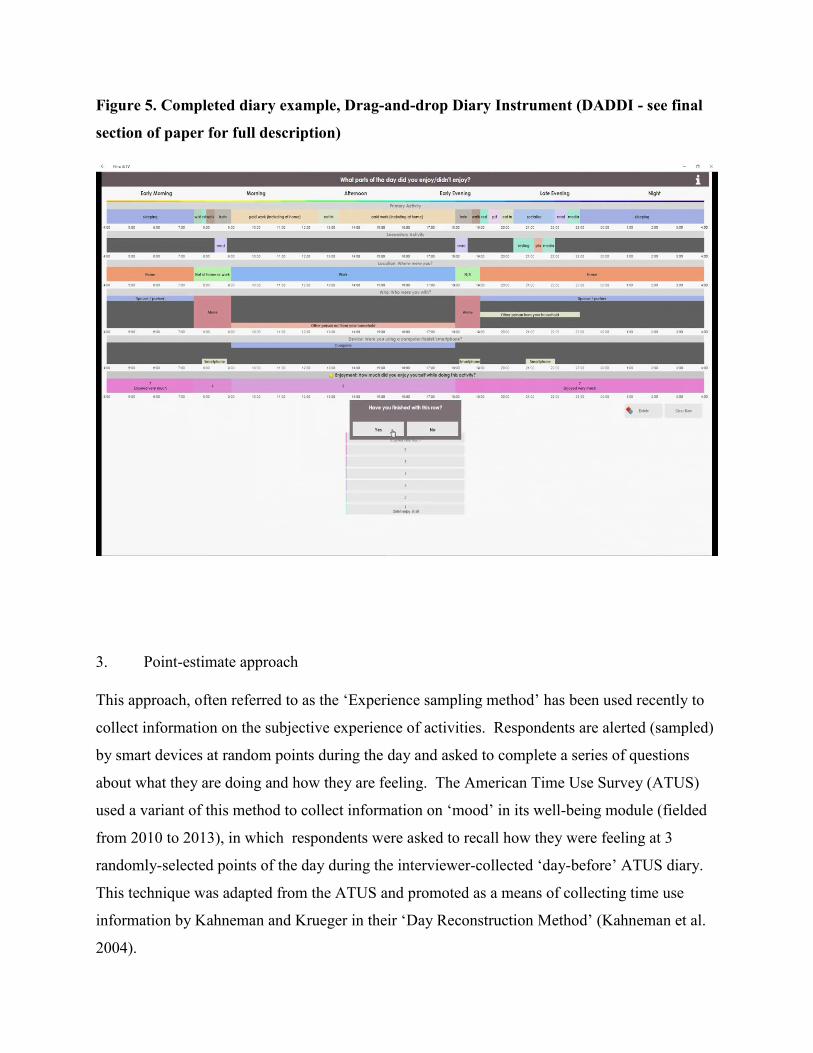
Figure 5. Completed diary example, Drag-and-drop Diary Instrument (DADDI - see final
section of paper for full description)
3. Point-estimate approach
This approach, often referred to as the ‘Experience sampling method’ has been used recently to
collect information on the subjective experience of activities. Respondents are alerted (sampled)
by smart devices at random points during the day and asked to complete a series of questions
about what they are doing and how they are feeling. The American Time Use Survey (ATUS)
used a variant of this method to collect information on ‘mood’ in its well-being module (fielded
from 2010 to 2013), in which respondents were asked to recall how they were feeling at 3
randomly-selected points of the day during the interviewer-collected ‘day-before’ ATUS diary.
This technique was adapted from the ATUS and promoted as a means of collecting time use
information by Kahneman and Krueger in their ‘Day Reconstruction Method’ (Kahneman et al.
2004).
A prominent UK example, collecting big data from a non-random volunteer survey, is the
‘Mappiness’ project which relies on a smartphone app to collect feelings of subjective affect
(including ‘happiness’), together with co-presence, location and activity (Bryson and MacKerron
2017; see the website at https://www.mappinessapp.com/).
The obvious difference of this approach from the previous two (modular, and drag-and-drop),
and its disadvantage in respect of the full potential of time use data analysis, is that only a limited
range of activities per day are sampled and identified. Although populations distributions of
time spent in different activities may be estimated in this way, there is no option for analysing
episode durations (for example, the experience of longer versus shorter periods of leisure) or
activity sequences (such as, for example, the enjoyment of a particular activity when it is
preceded or succeeded by another activity).
A brief history of time use diaries
There is a surprisingly long history of time-use diary surveys. It appears that the original
innovators were Russian researchers, observing peasant households at the end of the 19th century.
The results however survive only in the form of calculations of the balance of different sorts of
peasant work (Chayanov,1966). In Britain, the Fabian Socialist Maud Pember-Reeve persuaded
a small sample of London women to complete time-use diaries. The chapter describing these
results in her Round About a Pound a Week (1912) is the first English-language time-use diary
publication. The Soviet Russian economist Stanislav Strumilin published a time budget account
of Russian workers in 1925. And almost simultaneously the US Department of Agriculture—we
may speculate about connections with the earlier Russian agricultural extension applications—
started a substantial collection of time diaries from farm, town, and later elite educated “college”,
women (Kneeland 1929). These provide the earliest time diary dataset whose original
individual-level data survives for use by modern researchers (Gershuny and Harms 2017).
The first major US academic study of time use (Lundberg et al 1934) explicitly identified
Kneeland’s USDA work as the source of its methodology. Their study of leisure in a suburban
community, was followed by Sorokin and Berger’s (1939) investigation of the activity patterns
of young people—the former of these two authors had been a colleague of Strumilin in Moscow
in the early 1920s. The first time-diary-type research in the UK was conducted by the Mass
Observation organisation in 1937 (more than 1000 of the original diaries survive to the present),
closely followed by the BBC which conducted its first “listener availability” study in 1938.
During the 1950s more media broadcasters in Europe, North America and the Pacific rim
followed the BBC example of deploying large samples of diarists to estimate the daily habits of
radio listeners, and later television viewers, used both as a guide to appropriate programming
through the day and the week, and also to provide a basis for estimating audience sizes so as to
guide the pricing of advertisements. Converse and Robinson (1974) among others, made
constructive use of studies by the Columbia Broadcasting Company in their early study of
historical change in US time use. By the early 1960s large diary-based time-use studies were
underway in Czechoslovakia, France, Hungary, Poland, Japan, the UK and others.
This extensive pre-history means that by the time of the first properly designed, ex-ante (pre-
fieldwork) harmonised cross-national time use study, funded in the mid-1960s by UNESCO and
led by the Hungarian sociologist Alexander Szalai (1972) there was already a considerable
international convergence of research practice. The 12-country dataset that emerged from the
Szalai study, one of the first cross-national comparative studies on any subject available to social
scientists, popularised a design of time use diary surveys that continues, with variations, to the
present time.
This common underlying design means that ex-post harmonisation of the micro-level data of all
the subsequent time-diary based studies whose samples have survived to the present time is,
while painstaking and protracted, essentially straightforward. And the next substantial exercise
in ex-ante harmonised cross-national comparative time diary research, organised by Eurostat
from the mid-1990s, started from the same Szalai-based model (Gershuny 1995, Eurostat 2009);
the two tranches of national data collected (1999-2006 and 2009-2015) for the Harmonised
European Time Use Survey so far include all the larger EU countries. The US started to collect
the American Time Use Study as the seventh wave of the General Population Survey in 2003.
This departs from the basic Szalai architecture, in particular by collecting only a single activity
category per time-slot. But it is collected continuously, with annual releases of data, and is the
largest source of time diary data collected anywhere.
The Multinational Time Use Study (MTUS) archive is by far the largest available collection of
comparative and historical time-use materials, with 1.5M days from 85 surveys from 26
countries, all harmonised ex post, most of the data freely downloadable for use by academic
researchers (www.timeuse.org/mtus; see Fisher and Gershuny 2016).
Online time use diary surveys for rapid deployment: a Drag-and-drop example
The recent global pandemic has created an upsurge in interest in the ways in which people are
using their time under conditions of lockdown and social distancing. The requirement is for a
diary instrument with an online format that can be rapidly administered, and in which respondent
burden is not too onerous.
The CTUR 9-Country Drag-and-drop Diary Instrument (‘DADDI’) was initially designed for
deployment among an international online market research panel covering 9 different countries.
The original aim was to fill the gap in national comparative data on the enjoyment of different
activities (the UKTUS 2015 was among the first national-level time use diary survey to include a
field asking respondents how much they were enjoying the different time-slots of the day). Nine
nationally comparative populations in Europe and the USA were covered, representing 4
different ‘policy regime types’: UK; USA; France; Germany; Netherlands; Sweden; Finland;
Italy and Spain. The data was collected between November 2015 and May 2016 using quotas on
socio-demographic factors such as age, gender, education and employment, with a minimum
number of respondents guaranteed according to nationally representative quotas. Each country
provided over 1,000 ‘diary days’ of data, with a total sample of more than 10,000 days of data
across the 9 countries, based on interviews with 6,000 respondents, most of whom completed 2
diary days.
The Drag-and-drop format proved to be an effective instrument. Respondents completed a 10-
minute recruitment/profiling survey including the standard range of socio-economic and
demographic questions, and then completed two diaries, one for a weekend day and one for a
weekday. Instructions consisted of a simple 3-minute visual online demonstration, and the
average time taken to complete the diary was 10 minutes per diary day. Response quality was at
a level to be expected of on-line diaries, and with unusually low levels of missing primary
activity data.
The main advantage of this instrument for online deployment is that it is collects the entire
sequence of activities and a complete set of information fields through the whole diary day,
while being intuitively easy to follow as respondents move graphically along the day’s timeline.
The complete diary (as shown in Figure 5) creates a visually interesting and informative picture
of the day’s activities for the respondent. All of these features recommend it for adaptation and
use in a context where rapid deployment of an instrument for the collection of time use data is
needed.
While we opted for a range of diary information fields for the 9-Country Study to match the
specifications of the UKTUS 2015 (main activity, secondary activity, location, who with, device
use and enjoyment), the design enables amendment either to include fewer fields (in which case
time of completion could be reduced), or to enhance, expand or amend the range and number of
fields. For example, in the current Covid-19 crisis, during which the extent of social contact has
become a major issue in research on transmission of the virus, the ‘who you were with at the
time’ field could be significantly expanded to include a wider range of possible social contacts,
and amended to give an indication of what kind of contact was involved (e.g. 2 metre distance
only; or closer than that). Similarly, fields describing other aspects of ‘affect’ could be added to
the enjoyment field, indicating levels of stress, anxiety or boredom judged relevant to the current
situation. An webapp version of the instrument is currently under development for these
purposes.
An illustration is given in the following sequence of figures (Figures 6 to 13) of the completion
of the Drag-and-drop diary instrument (DADDI). (The MP4 file from which these screen-shots
were taken is available in the supplementary materials for this paper: Diary_example_v2).
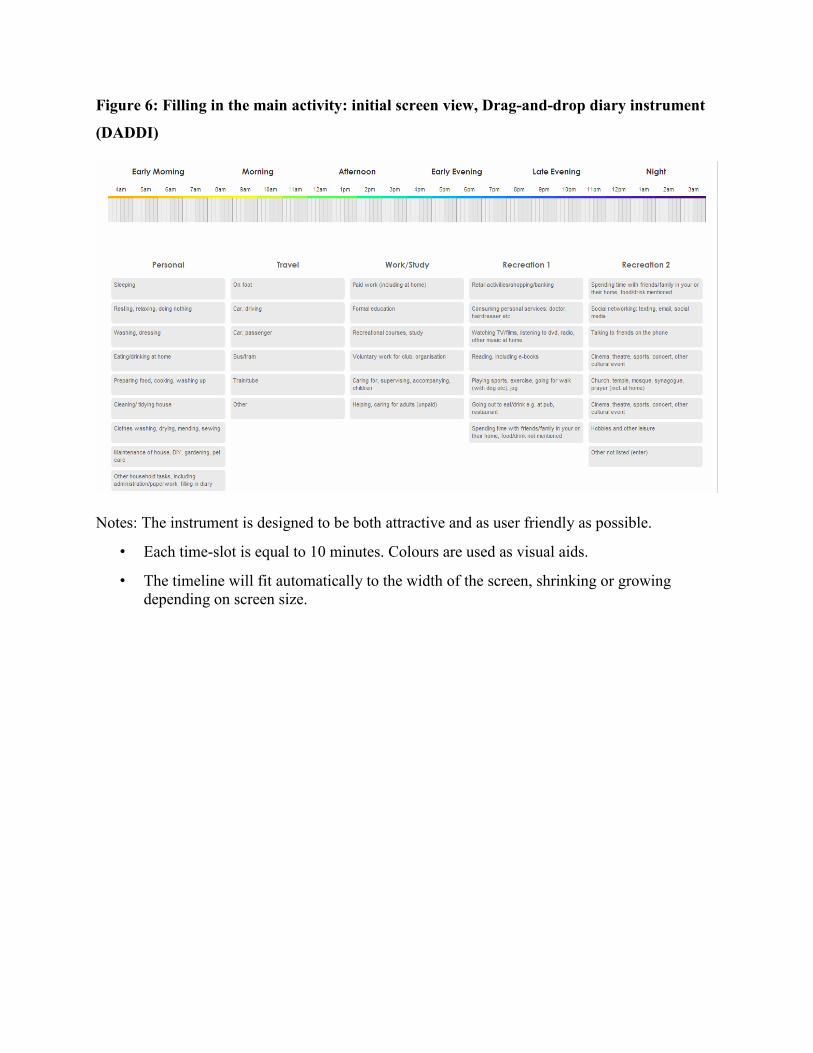
Figure 6: Filling in the main activity: initial screen view, Drag-and-drop diary instrument
(DADDI)
Notes: The instrument is designed to be both attractive and as user friendly as possible.
• Each time-slot is equal to 10 minutes. Colours are used as visual aids.
• The timeline will fit automatically to the width of the screen, shrinking or growing
depending on screen size.
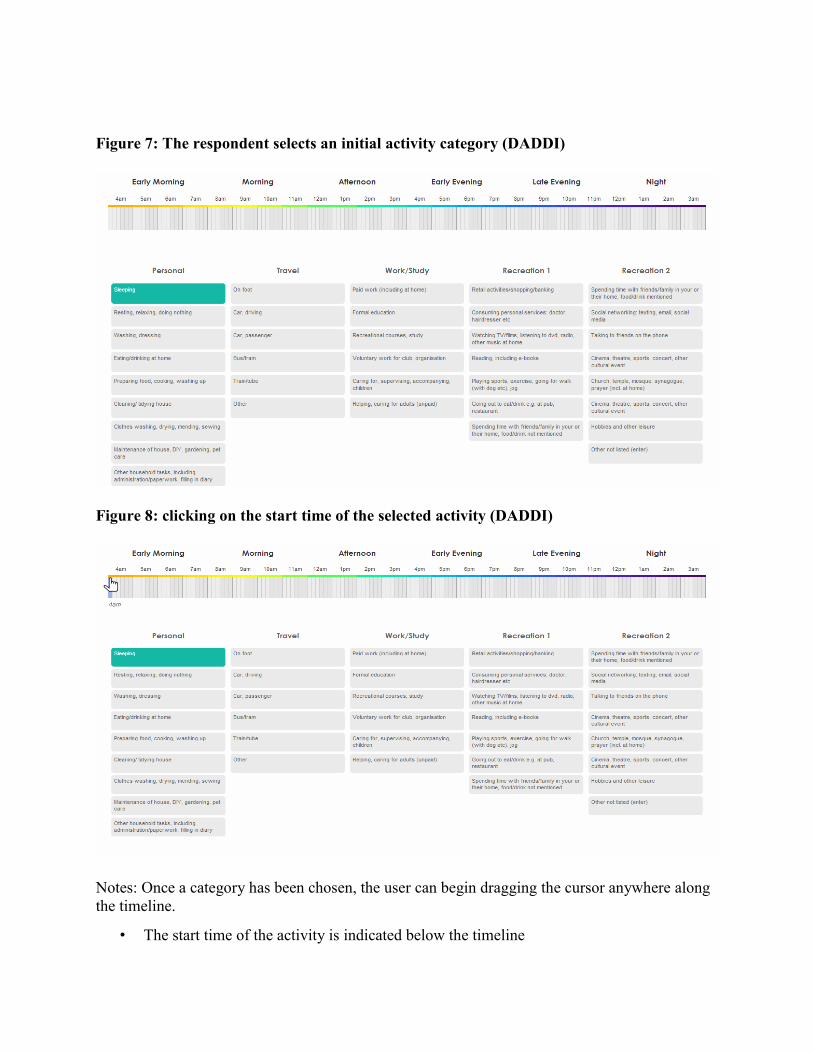
Figure 7: The respondent selects an initial activity category (DADDI)
Figure 8: clicking on the start time of the selected activity (DADDI)
Notes: Once a category has been chosen, the user can begin dragging the cursor anywhere along
the timeline.
• The start time of the activity is indicated below the timeline
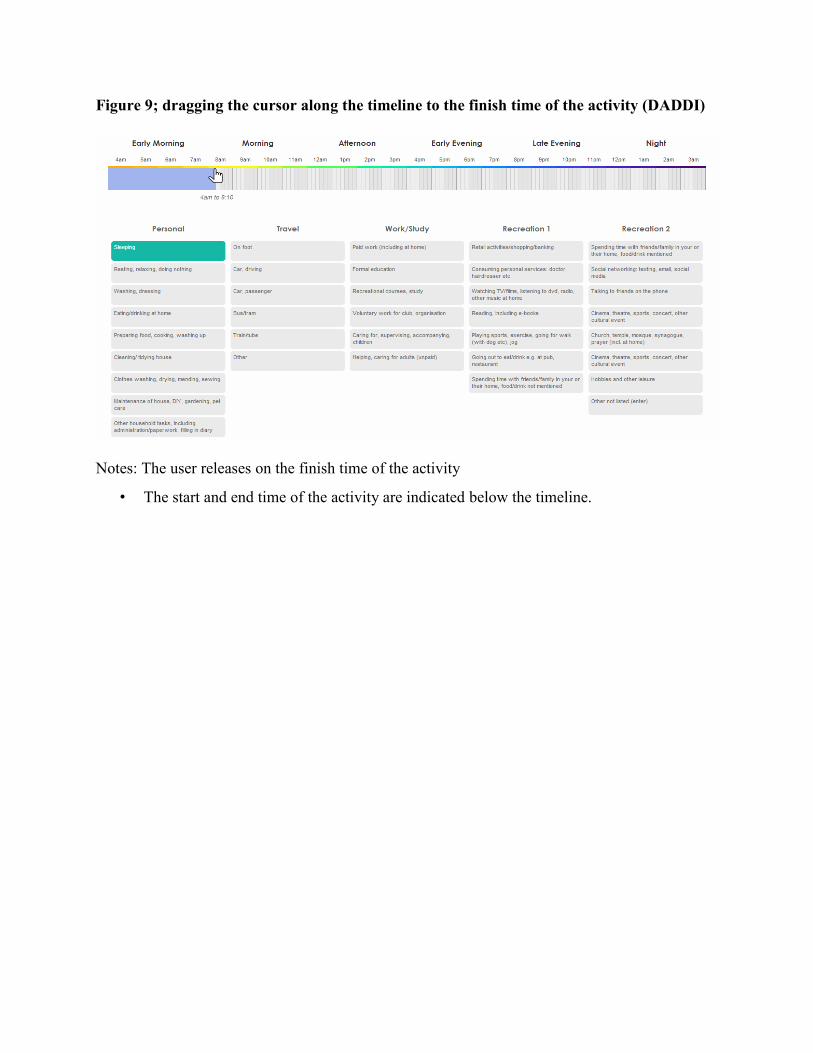
Figure 9; dragging the cursor along the timeline to the finish time of the activity (DADDI)
Notes: The user releases on the finish time of the activity
• The start and end time of the activity are indicated below the timeline.
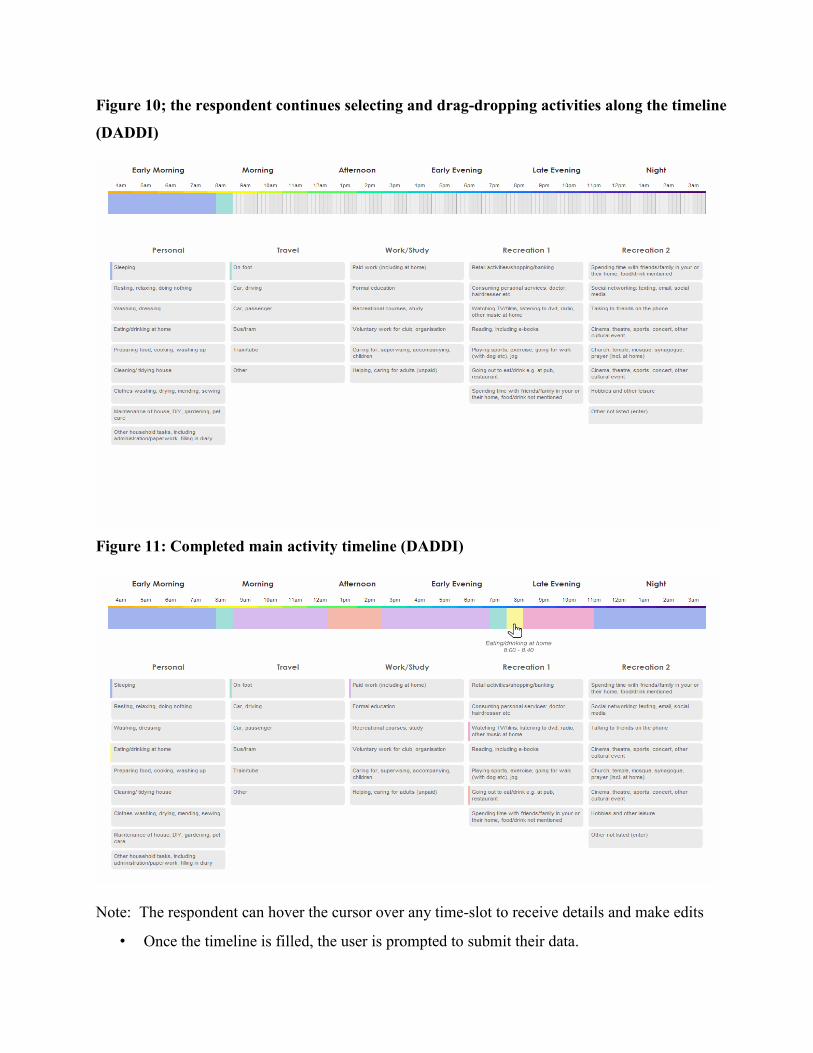
Figure 10; the respondent continues selecting and drag-dropping activities along the timeline
(DADDI)
Figure 11: Completed main activity timeline (DADDI)
Note: The respondent can hover the cursor over any time-slot to receive details and make edits
• Once the timeline is filled, the user is prompted to submit their data.
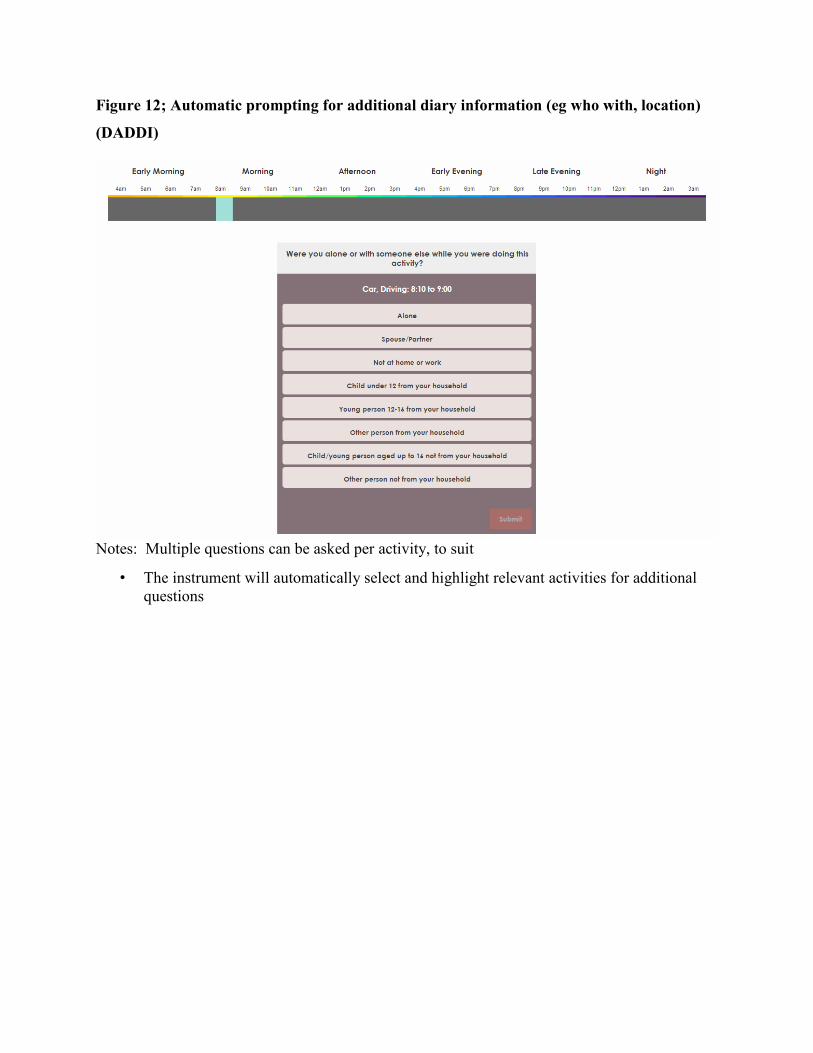
Figure 12; Automatic prompting for additional diary information (eg who with, location)
(DADDI)
Notes: Multiple questions can be asked per activity, to suit
• The instrument will automatically select and highlight relevant activities for additional
questions
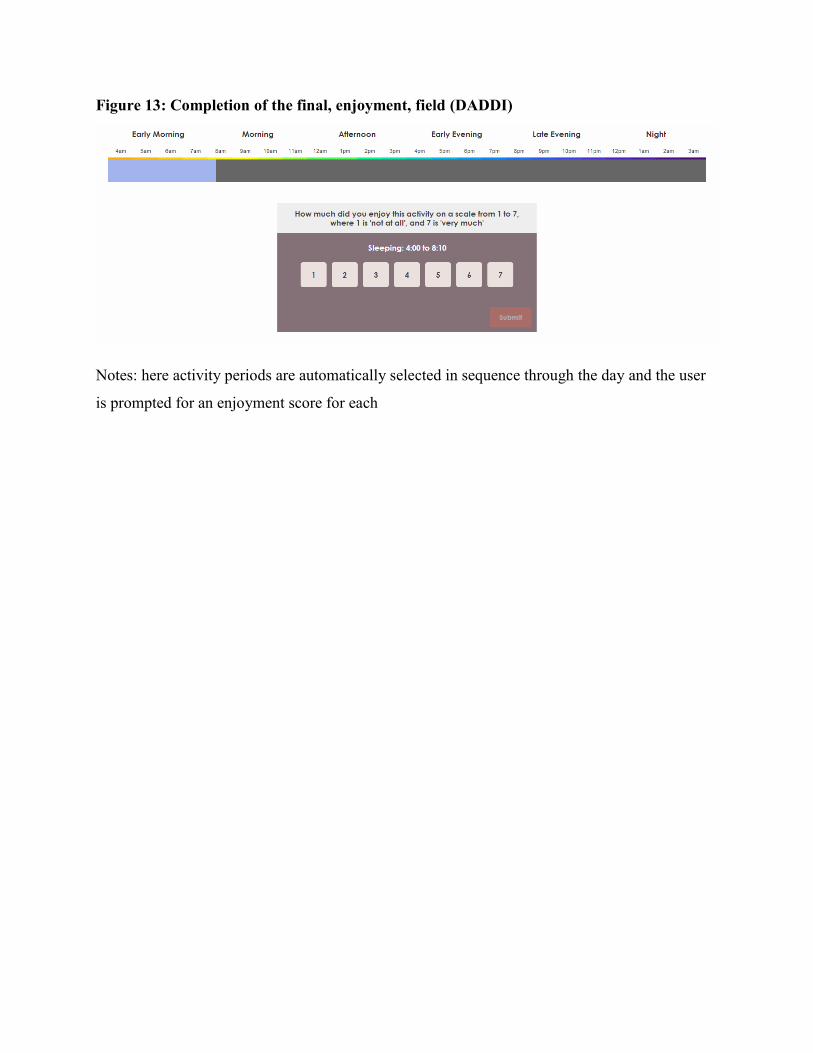
Figure 13: Completion of the final, enjoyment, field (DADDI)
Notes: here activity periods are automatically selected in sequence through the day and the user
is prompted for an enjoyment score for each
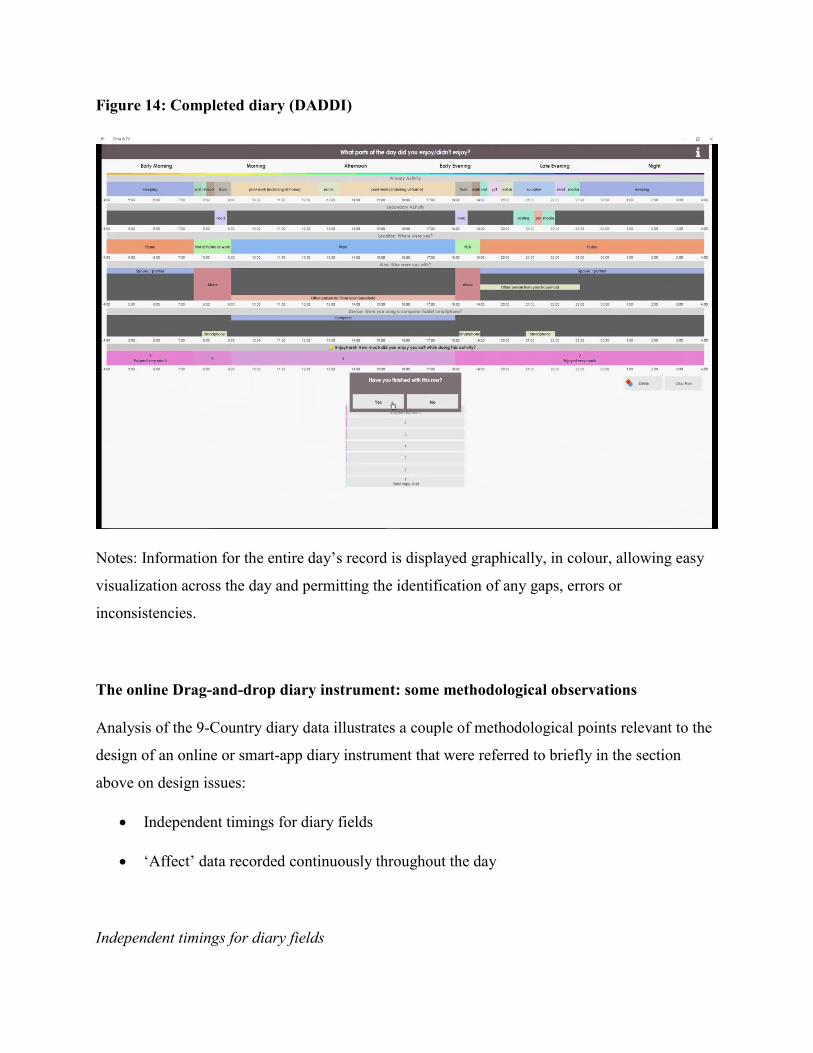
Figure 14: Completed diary (DADDI)
Notes: Information for the entire day’s record is displayed graphically, in colour, allowing easy
visualization across the day and permitting the identification of any gaps, errors or
inconsistencies.
The online Drag-and-drop diary instrument: some methodological observations
Analysis of the 9-Country diary data illustrates a couple of methodological points relevant to the
design of an online or smart-app diary instrument that were referred to briefly in the section
above on design issues:
Independent timings for diary fields
‘Affect’ data recorded continuously throughout the day
Independent timings for diary fields
Following the methodology used in life-course analysis for longitudinal data where there are
multiple fields of evidence, ‘episodes’ are conventionally defined as periods during which all
fields remain unchanged. In contrast to some other diaries (such as those used in the ATUS and
MOTUS) in which the start and finish times of the main activity serves to structure the timing of
the other diary fields, the drop-and-drag instrument facilitates the independent timing of each of
the diary fields. Where any one field takes a new value, a new episode starts. A single main
activity period may therefore form part of several episodes, during which a different secondary
activity might be done, or the ‘who with’ field might change. Main activities can have different
lengths to secondary activities, enjoyment levels can vary where the main activity is unchanged,
telephones devices can be used during just part of a main or secondary activity, and so on. This
flexibility not only better reflects our lived experience of time, it also accords with the accepted
convention for life-course data, from which analytic techniques are directly transposable (e.g.
multichannel sequence analysis; Gauthier et al 2010).
From the 9-Country study data we can show that this difference has important implications for
analysis. If, for example, we take only the duration of the main activity as defining an episode in
the 9-Country Study data we find an average of 13.91 episodes across the survey, with some
national variation—Italian respondents with average of 15.4, US respondents with an average of
12.6. But following the convention of defining episodes as periods of time in which no field of
the diary changes, the overall mean count of daily diary episodes rises from 13.9 to 16.3 (again
with USA respondents -15.0 episodes per day- at the bottom, and Italian respondents- 18.7
episodes per day- at the top).
The independence of the timing of fields has important substantive consequences. Certain
activities are particularly prone to being recorded as secondary, such as snacking or watching
TV. The ‘using a device’ field may well also feature as a secondary activity accompanying a
non-screen main. Therefore, where episodes are defined according only to main activities this
will have one of two consequences: either the secondary activity is recorded as lasting the
duration of the main activity (e.g. a snack eaten for only 15 minutes at work is recorded as
lasting the full 5-hour work episode); or the secondary activity is simply omitted (e.g. using a
smartphone for 5 minutes is not considered worth recording during a 30-minute period where the
main activity is eating). There is no way of knowing which of these options might be adopted by
respondents, and in both cases the diary record will be inaccurate, in the first case vastly
exaggerating the time spent snacking, in the second under-estimating the use of mobile devices.
Continuous recording of ‘affect’ fields
It has become popular to collect information on affect (either positive or negative) through the
‘experience sampling method’ (e.g. the ‘Day Reconstruction Method’ – Kahneman et al. 2004).
But the continuous recording of affect fields, which was pioneered by Robinson for the U.S.
1985 time use survey (and referred to, for example, in Robinson and Godbey, 1997) has
advantages from an analytic perspective. For example, it permits standardisation of enjoyment
scores at the level of the individual diarist, in order to mitigate individual and cultural differences
in reporting standards (we can ‘normalise’ each diarist’s responses to produce a daily individual
mean enjoyment of zero, with a standard deviation of 1). It also permits the modelling of
duration effects in relation to affect. For example, in analysis of the 9-Country study data, we
are able to provide support, across certain activities, for the fundamental economic postulate of
diminishing marginal utility. So, for example in the case of sleep, a positive coefficient for
enjoyment across activity duration coupled with a negative duration-squared term combine to
produce downward-turning modelled marginal utility curves. The enjoyment curve for sleeping
across activity duration reaches its maximum level at a very plausible seven and a half hours
(450 minute) duration, and turns downwards thereafter (see also Gershuny, 2012).
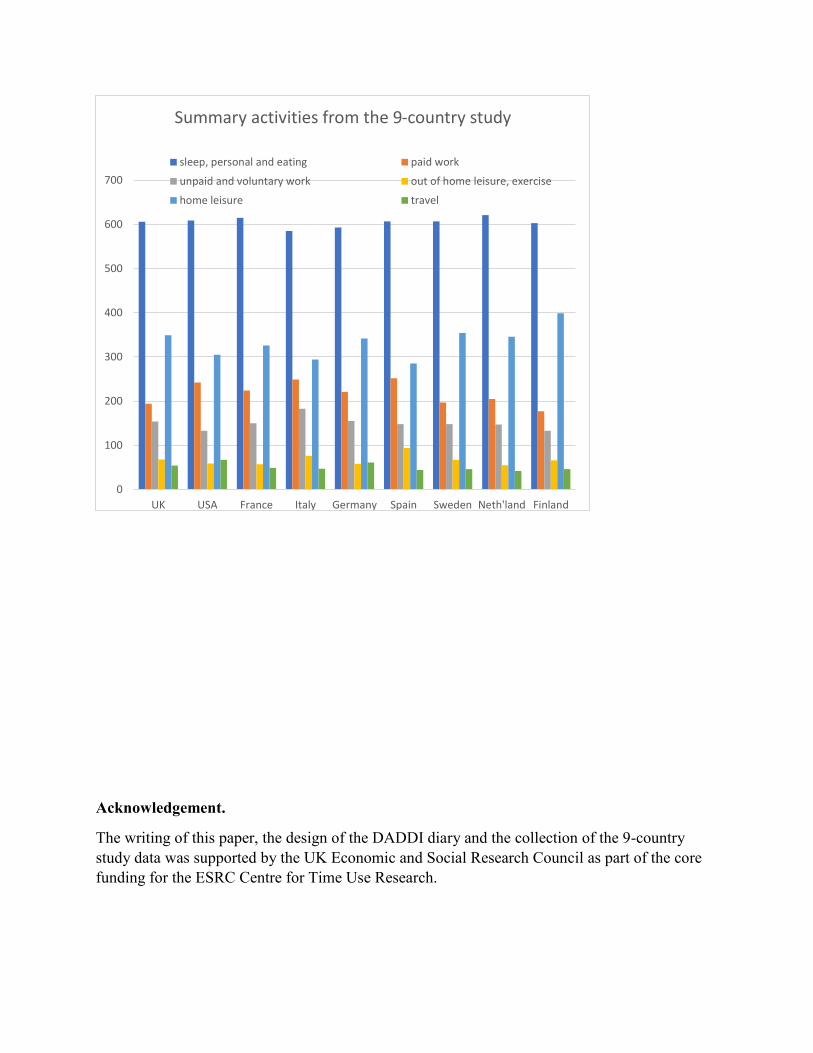
Finally, the 9-Country Study dataset, using a single instrument and an identical (apart from
language) instructional video for all the different countries is uniquely well placed for
international comparison. Comparative research often focusses on international differences.
Perhaps too easily forgotten is the more general overall observation: the overall cross-national
similarity in mean times in various daily activity totals as shown in Figure 15.
Figure 15: Summary mean time in major activities, 9-Country Study
Acknowledgement.
The writing of this paper, the design of the DADDI diary and the collection of the 9-country
study data was supported by the UK Economic and Social Research Council as part of the core
funding for the ESRC Centre for Time Use Research.
0
100
200
300
400
500
600
700
UK USA France Italy Germany Spain Sweden Neth'land Finland
Summary activities from the 9-country study
sleep, personal and eating paid work
unpaid and voluntary work out of home leisure, exercise
home leisure travel
References
Bryson, A., MacKerron, G. (2017) Are You Happy While You Work?, The Economic Journal,
127, 106–125 https://doi.org/10.1111/ecoj.12269
Chatzitheochari, S., Fisher, K., Emily Gilbert, Lisa Calderwood, Tom Huskinson, Andrew
Cleary, Jonathan Gershuny, (2018). Using New Technologies for Time Diary Data
Collection: Instrument Design and Data Quality Findings from a Mixed-Mode Pilot
Survey, Social Indicators Research, 137, 379–390. DOI 10.1007/s11205-017-1569-5
Chayanov A.V., (1966) On the Theory of Peasant Economy, Homewood, Ill: Irwin
Cornwell, B., Gershuny, J., and Sullivan, O. (2019). The Social Structure of Time: Emerging
Trends and New Directions. Annual Review of Sociology 45, 301-320
Eurostat (2009) Harmonised European Time Use Surveys: 2008 Guidelines, Luxembourg:
Office for Official Publications of the European Union.
Fisher, K. and Gershuny, J. (2016) Multinational Time Use Study User’s Guide and
Documentation Version 9. https://www.timeuse.org/MTUS-User-Guide
Gauthier J., Widmer E.D., Bucher P. and Notredame C. (2010). Multichannel sequence analysis
applied to social science data. Sociological Methodology 40, 1-38.
Gershuny, J. (1995) Draft Proposal for the Methodology of the European Time-use Survey.
Statistics in Transition, 2, 529-551.
Gershuny, J. (2004) Costs and Benefits of Time Sampling Methodologies. Social Indicators
Research 67, 247–252. https://doi.org/10.1023/B:SOCI.0000007340.64308.dc
Gershuny, J. (2012) National Utility: measuring the enjoyment of activities. European
Sociological Review 29, 996-1009
Gershuny, J. and Sullivan, O. (2017). United Kingdom Time Use Survey, 2014-2015. [data
collection]. UK Data Service. SN: 8128, http://doi.org/10.5255/UKDA-SN-8128-1
Gershuny, J., Teresa Harms, Emma Thomas, Aiden Doherty, Karen Milton, Paul Kelly and
Charlie Foster (2020 forthcoming). Testing self-report time-use diaries against objective
instruments in real time, Sociological Methodology. DOI:10.1177/0081175019884591
Juster F.T and Stafford F.P. (Eds.) (1985). Time, Goods and Well-Being. Ann Arbor: Institute for
Social Research.
Kahneman D, Krueger A.B, Schkade D.A, Schwarz N and Stone A.A. (2004). A survey method
for characterizing daily life experience: The day reconstruction method. Science
306:1776-1780.
Kan, M. Y., and Pudney, S. (2008). Measurement Error in Stylized and Diary Data on Time Use.
Sociological Methodology, 38, 101–132.
Kneeland, H. (1929). Women on Farms Average 63 Hours' Work Weekly in Survey of 700
Homes. In Milton S. Eisenhower (ed). Yearbook of Agriculture. Washington DC, USA:
United States Department of Agriculture.
Lundberg, G.A., Keonavouski, M. and Mclnery, M.A.. (1934) Leisure: A Suburban Study. New
York, New York USA: Colombia University Press.
Minnen, Joeri, Glorieux, Ignace, van Tienoven, Theun Pieter, Daniels, Sarah, Weenas, Djiwo,
Deyaert, Jef, Bogaert, Sarah and Rymenants, Sven. (2014). Modular Online Time Use
Survey (MOTUS) – Translating an existing method to the 21st century. electronic
International Journal for Time Use Research. 11, 73-93. 10.13085/eIJTUR.11.1.73-93.
Pember-Reeves, M. (1913) Round about a Pound a Week - 2008 reprint. London, UK:
Persephone Books.
Robinson, John P., and Converse, P. (1972), Social change as reflected in the use of time. pp 17-
86 in A. Campbell and P. Converse (eds) The Human Meaning of Social Change, New
York: Russel Sage.
Robinson, J. P. and Godbey, G. (1997). Time for Life: The Surprising Ways Americans Use Their
Time. University Park, PA: The Pennsylvania State University Press.
Schulz, F., and Grunow, D. (2012). Comparing Diary and Survey Estimates on Time Use.
European Sociological Review, 28, 622-632.
Sorokin, P. A., and Berger, C. Q. (1939) Time Budgets of Human Behavior. Cambridge, USA:
Harvard University Press
Strumilin, S G., (1925). [Byudzhet vremeni rabochikh v 1923-1924] (Time Budgets of Russian
Workers in 1923-1924) in Planovoe khozyaistvo No. 7, reprinted Problemy ekonomiki
truda, Moscow 1957
Szalai, A. (ed). (1972) The Use of Time: Daily Activities of Urban and Suburban Populations in
Twelve Countries. Den Haag: Mouton.
Trajectory Partnership (2016) Time Use Report: A Day in the Life.
Walthery, P., Gershuny, J. (2019) Improving Stylised Working Time Estimates with Time Diary
Data: A Multi Study Assessment for the UK. Social Indicators Research 144, 1303–1321
https://doi.org/10.1007/s11205-019-02074-3
1 Excluding those 12% of diaries with fewer than 4 episodes, and/or no record of a main and
secondary activity done simultaneously (an ad hoc definition of ‘bad diaries’), the mean overall
number of episodes rises to 17.5