Embed Size (px)
Citation preview

Timely closure of the prospore membrane requires SPS1 and SPO77 in Saccharomyces
cerevisiae.
Scott M. Paulissen, Christian J. Slubowski1, Joseph M. Roesner2, and Linda S. Huang.
Department of Biology, University of Massachusetts Boston, Boston, MA 02125
Current address:
1 Department of Surgery, Beth Israel Deaconess Medical Center, Boston, MA 02215
2 Merck, Boston, MA 02115
Genetics: Early Online, published on May 11, 2016 as 10.1534/genetics.115.183939
Copyright 2016.

Page3of42
Running Title: Closing the prospore membrane
Keywords: Prospore membrane; meiotic exit; anaphase promoting complex; sporulation;
cytokinesis; germinal center kinase
Corresponding Author: Linda S. Huang
Department of Biology, University of Massachusetts Boston, 100 Morrissey Boulevard, Boston,
MA 02125
617-287-6674

Page4of42
ABSTRACT
During sporulation in Saccharomyces cerevisiae, a double lipid bilayer called the prospore
membrane is formed de novo, growing around each meiotic nucleus and ultimately closing to
create four new cells within the mother cell. Here we show that SPS1, which encodes a kinase
belonging to the Germinal Center Kinase III (GCKIII) family, is involved in prospore membrane
development and is required for prospore membrane closure. We find that SPS1 genetically
interacts with SPO77, and see that loss of either gene disrupts prospore membrane closure in a
similar fashion. Specifically, cells lacking SPS1 and SPO77 produce hyper-elongated prospore
membranes from which the leading edge protein complex is not removed from the prospore
membrane in a timely fashion. The SPS1/SPO77 pathway is required for the proper
phosphorylation and stability of Ssp1, a member of the leading edge protein complex that is
removed and degraded when the prospore membrane closes. Genetic dissection of prospore
membrane closure finds SPS1 and SPO77 act in parallel to a previously described pathway of
prospore membrane closure that involves AMA1, an activator of the meiotic anaphase promoting
complex.

Page5of42
INTRODUCTION
Biological membranes provide a barrier for inhibiting the flow of materials between a
cell and its surroundings and for compartmentalizing the contents of the various organelles
within a cell. The size and shape of membranes are central to their functions. Membranes are
essential for many fundamental cellular processes including ion balance, energy generation, and
secretion. In cell division, membrane dynamics are particularly important, where they act to
segregate the contents of the cellular progeny.
The process of cell division differs among cells. Most commonly, animal cells divide
through a mechanism requiring the assembly of an actin-based contractile ring at the division site
(reviewed in Green et al. 2012). This actomyosin ring contracts and matures, ultimately leading
to scission of the membrane necks mediated by the ESCRTIII complex. However, other
variations of cytokinesis occur: cellularization during early Drosophila embryogenesis, which
requires the growth of membranes around the nuclei before the contractile event (Lee and Harris
2014) and cell division in plants, which requires the secretion of vesicles to the division plane to
form the phragmoplast which will eventually separate the two daughter cells (reviewed in
Jürgens 2005). Actin is not always involved in cytokinesis; although prokaryotic cells have actin-
like filaments (reviewed in Carballido-López 2006), these filaments are not used for cytokinesis
(Pollard and Wu 2010). Similarly, cytokinesis in Trypanosoma brucei (a bikont eukaryote) does
not require actin but seems to utilize microtubules (Wheeler et al. 2013). In the budding yeast
Saccharomyces cerevisiae, an actin-based contractile ring plays a role in cytokinesis in
vegetatively growing cells (Bi et al. 1998; Balasubramanian et al. 2004). However, actin does
not appear to be involved in the closure of the prospore membrane that grows around the meiotic
product during sporulation (Taxis et al. 2006).

Page6of42
Sporulation in S. cerevisiae occurs as diploid cells experience nutritional stress. The
diploid mother cell undergoes meiosis and spore formation, creating four haploid spores, the
yeast equivalent of gametes (Neiman 2011). Haploid nuclei formed during meiosis are
encapsulated in a double lipid bilayer membrane called the prospore membrane (PSM). The PSM
forms de novo after meiosis II (Neiman 1998) and ultimately surrounds each of the haploid
nuclei. These PSMs must also capture the necessary cytosolic components, including some
organelles, which are needed for the newly forming spore. At the appropriate time, the PSM will
close; this closure is a cytokinetic event that creates the four spores within the mother cell. The
PSM will be used as the template for the construction of the spore wall, and ultimately becomes
the plasma membrane for the newly formed spore (Coluccio et al. 2004; Diamond et al. 2009).
Growth of the PSM initiates at the Spindle Pole Body (SBP), the yeast equivalent of the
centrosome, through the fusion of post-Golgi vesicles (Moens 1971; Neiman 1998; Knop and
Strasser 2000). As the PSM grows, it is first shaped like a small horseshoe that then elongates to
capture the nucleus and some cytoplasmic content (Diamond et al. 2009). As the PSM closes, it
takes on a rounded shape (Diamond et al. 2009).
The leading edge protein complex (LEP), composed of Don1, Ady3, Irc10 and Ssp1, is
found at the growing end of the PSM and is required for proper growth and closure of the PSM
(Knop and Strasser 2000; Moreno-Borchart et al. 2001; Nickas and Neiman 2002; Lam et al.
2014). Ssp1 is the most critical component of the LEP, required for the leading edge localization
of the other LEP members (Nag et al. 1997; Moreno-Borchart et al. 2001). The removal and
degradation of Ssp1 occurs at the time of PSM closure (Maier et al. 2007).
Degradation of Ssp1 is mediated by AMA1, a meiosis specific activator of the anaphase
promoting complex (APC/C), although a direct role for Ama1 in targeting Ssp1 for destruction

Page7of42
has not been demonstrated (Cooper et al. 2000; Diamond et al. 2009; Tan et al. 2010). The
APC/C is an E3 ubiquitin ligase made up of multiple proteins that requires an activator for
proper substrate selection (reviewed in McLean et al. 2011). During meiosis, the Cdc20 mitotic
activator is required along with Ama1 to regulate APC/C activity (Pesin and Orr-Weaver 2008;
Cooper and Strich 2011). APCAMA1 has multiple substrates, including Clb1, Pds1, and Ndd1
(Cooper et al. 2000; Oelschlaegel et al. 2005; Penkner et al. 2005; Okaz et al. 2012). AMA1 is
needed during meiotic prophase, as ama1Δ cells form a MI spindle early, but ultimately form
MII spindles at the proper time (Cooper et al. 2000; Okaz et al. 2012).
The main phenotype seen in ama1Δ mutants is during spore morphogenesis (Coluccio et
al. 2004; Diamond et al. 2009). AMA1 is required for proper closure of the prospore membrane,
and ama1Δ mutants have stabilized Ssp1 at the leading edge of the PSM (Diamond et al. 2009).
Cells lacking AMA1 have normal membrane initiation, but have an extended elongation phase
with a partial defect in closure of the prospore membrane. Approximately 30% of ama1Δ cells
form rounded and closed prospore membranes. Because the closure defect in ama1Δ was
incomplete, it has been proposed that there may be an AMA1 independent pathway acting during
prospore membrane closure (Diamond et al. 2009).
SPS1 encodes a GCKIII kinase (Slubowski et al. 2014) required for sporulation (Friesen
et al. 1994). Since its discovery and initial characterization (Percival-Smith and Segall 1986;
Friesen et al. 1994), SPS1 has been associated with a broad set of functions during sporulation,
including histone phosphorylation, spore wall enzyme trafficking, and Gas1 internalization
(Iwamoto et al. 2005; Krishnamoorthy et al. 2006; Rolli et al. 2011).
In this study, we identify SPO77 as a high copy suppressor of SPS1. We find a new role
for SPS1 and SPO77 in PSM development, and find that they act together in this role. Cells

Page8of42
lacking SPS1 and SPO77 display hyper-elongated PSMs that close less frequently than in wild
type cells and do not remove and degrade the leading edge protein complex in a timely fashion.
Finally, we examine the relationship of SPS1 and SPO77 with the previously described AMA1-
dependent pathway for PSM closure (Diamond et al. 2009), and find that they function in
parallel to AMA1. The results collectively suggest that the SPS1 pathway is involved in PSM
closure and that it functions in parallel to the previously described AMA1–dependent pathway for
PSM closure (Diamond et al. 2009).

Page9of42
MATERIALS AND METHODS
Strains, Yeast Growth and Induction Medias
All strains in this study are in the SK1 background (Kane and Roth 1974), and listed in
Tables S1 and S2. Standard genetic methods were used to create strains unless otherwise noted
(Fink and Rose 1990). Epitope-tagged strains and gene knock out strains were created using
PCR-mediated integration as previously described (Longtine et al. 1998; Lee et al. 2013).
Primers and plasmids used in this study are listed in Tables S3 and S4.
Cells were grown in standard yeast media and sporulated in a synchronous manner in
liquid media, as previously described (Huang et al. 2005). Unless otherwise noted, all liquid
cultures were grown within an Erlenmeyer flask in a shaking incubator at 30º. Cells to be
sporulated were first grown to saturation in YPD overnight at and then transferred to YPA and
grown to ~1.3 OD600/ml overnight. These cells were then harvested, washed in ddH2O, and
resuspended in 1% potassium acetate at 2.0 OD600/ml. Sporulation of cells containing plasmids
was the same as above except instead of YPD, cells were grown in SD media, lacking the
appropriate nutrient for selection.
Sporulation Efficiency Counts
Cells that were to be counted for sporulation efficiency were sporulated as above.
Cultures in triplicate were incubated at 30° for 24 and 48 hours, as indicated. Aliquots were
withdrawn and placed on a slide and examined using a bright-field microscope. At least 200
cells per culture (done in triplicate) for a total of at least 600 cells per strain were counted for
refractile spores or refractile spore-like structures. All cells containing HTB2:mCherry were
assessed for meiotic efficiency at nine hours post induction.
96-well Plasmid Isolation

Page10of42
Library plasmids were isolated from glycerol bacterial stocks by a STET-BSA boiling miniprep
protocol (Holmes and Quigley 1981) adapted for the 96-well format. Bacterial cells containing
library plasmids were thawed from glycerol stocks onto LB plates containing kanamycin. After
incubation overnight at 37° colonies were then pinned into deep well (2.2 ml) 96-well plates
containing TB plus kanamycin liquid media and grown overnight at 37° to saturation. All spin
steps were conducted at 4° unless otherwise noted. These cultures were then spun down at
5000x g, and the pellet was resuspended in 195 µl of STET-Lyso-BSA lysis solution. This was
transferred into a 96-well PCR plate, sealed with a foil plate sealer and heated to 99° for one
minute then cooled to 4°C for one minute in a thermocycler. Resulting lysates were then spun at
5000x g for 20-30 minutes as needed to achieve a suitably tight pellet. Once pelleted, 100 µl of
the supernatant was removed and transferred to a round bottomed 96-well storage plate and
mixed with 100µl of IPP (75% isopropanol: 25% 10M ammonium acetate) solution to precipitate
the DNA, and spun to pellet the DNA. The pellet was then washed with 150µl of 80% ethanol,
and resuspended in 45 µl of 10mM pH 8.0 Tris. Plates were then sealed and stored at -20° for
later use.
96-well Yeast Plasmid Transformation
Library plasmids were transformed into yeast using a transformation protocol (Gietz and Schiestl
2007) adapted for a 96-well format and optimized for the SK1 strain background. The parent
yeast strain (LH1060) was grown overnight in a 2800 ml Erlenmeyer flask containing 250 ml of
SD-URA liquid media to a concentration of ~0.9 ± 0.1 OD600. Then 5.0 x 10⁹ cells were
harvested, washed with 0.1M lithium acetate (LiOAc), and resuspended in 1 ml 0.1M LiOAc.
1.1mls of the pooled cells were mixed with 825 µl of 1M lithium acetate and 2.2 ml of salmon
sperm ssDNA, per 96-well plate to be transformed. 38 µl of this cell transformation mixture was

Page11of42
transferred to each well in a round-bottomed 96-well plate with 15µl of plasmid DNA from
library, and mixed with 100µl of 50% PEG. The plate was then sealed and transferred to a 42°
shaking incubator to heat shock for five hours. After heat shock, cells were pelleted, resuspended
in 14 µl of sterile water and transferred in two ~9 µl duplicates on a SD-URA-LEU plate. Plates
were then incubated face up for two to three days until significant colony growth was observed
and then pinned onto a fresh SD-URA-LEU plate. Resulting duplicate patches were pinned into
150 µl of SD-URA-LEU liquid media in round-bottomed 96-well plates and grown overnight.
The resulting cultures had 60 µl of 40% glycerol added, sealed with foil plate sealers and frozen
in the -80°C freezer. Any plasmids that failed to transform by this high throughput method were
then transformed using standard lithium acetate transformation.
Screen and Plasmid Construction
C-terminal tagging of SPS1 with three tandem copies of GFP resulted in a hypomorphic
allele which we call sps1*. sps1* was mated with a strain containing HTB2 tagged with mCherry
(LH902; Parodi et al, 2012) for tracking meiosis, and then transformed with pRS426-G20
(Nakanishi, et al. 2004) to allow for the visualization of PSM dynamics, which resulted in strain
LH1060. This strain was grown, aliquoted into seventeen 96-well plates and transformed with
the 1588 plasmids of The Minimal Tiled Library (Jones et al. 2008) high copy over-expression
plasmid library using methods described above. All subsequent steps were carried out in 96-well
plates unless otherwise noted. The resulting strains were then grown in liquid SD-LEU-URA
media to saturation, transferred to YPA overnight, spun down and resuspended in 750µL of 1%
potassium acetate along with a single 2 mm glass bead to increase aeration. This suspension was
placed in a 30º C shaking incubator for 24 to 48 hours before screening.
Page12of42
Cells were screened using a Zeiss Axioskop 2 microscope using DIC and a 100x 1.45 NA
lens. Cells were screened for the production of refractile spores. If necessary, plates were re-
sporulated until satisfactory meiotic performance was achieved for all wells. Any plasmid that
appeared to behave as a high copy suppressor (by creating more refractile spores) was rescreened
by retransforming the library plasmid into yeast and sporulated again in Erlenmeyer flasks using
conventional high-efficiency methods. These cultures were then reassessed for increased
refractile structure formation. Plasmids that were deemed to increase the formation of refractile
structures using these methods were considered to be suppressors of sps1*.
Since each plasmid contained multiple genes, each gene was cloned individually into
pRS423, a high copy vector (Sikorski and Hieter 1989). Fragments of the pGP564 plasmids
from the Minimal Tiled Library that suppressed sps1* were amplified using PCR that add either
XhoI and ClaI or, XhoI and SacI sites depending on the sequence of the insert. To construct
pRS423-SPO77, template pGP564-YGPM4k18 was used in conjunction with primers OLH1253
and OLH1254. To construct pRS423-SPS1, template pGP564-YGPM1j19 was used in
conjunction with primers OLH1332 and OLH1333. To construct pRS423-STP2, template
YGPM30n09 was used in conjunction with primers OLH1241 and OLH1242. SPO77 and SPS1
inserts were tested by complementation of their respective genomic null mutants. Each of these
plasmids was then transformed back into LH1060, sporulated using standard methods, and
reassessed for refractile structure formation indicative of spore formation.
The plasmid pCS232 was created by PCR amplification of GFPEnvy from pFA6a-link-
Envy-SpHIS5 (Slubowski et al. 2015) using primers OLH1493 and OLH1494, which
incorporated EcoRI and HindIII restriction sites flanking GFPEnvy. pRS316-prSPS1-SBP-SPS1
(Slubowski et al. 2015) and the GFPEnvy PCR product were cut with EcoRI and HindIII,

Page13of42
removing the SBP epitope and producing ligation compatible overlaps, which allowed the
creation of pRS316-prSPS1-Envy-SPS1. pRS316-prSPS1-Envy-SPS1 and empty pRS424 vector
were then digested with SacI and KpnI and the entire prSPS1-Envy-SPS1 insert was ligated into
the pRS424 backbone creating pCS232 (pRS424-prSPS1-Envy-SPS1).
Fluorescence Microscopy
All fluorescent images were visualized using a Zeiss Axioskop 2 fluorescent microscope
using a 100x NA 1.45 lens. Images were captured using a Hammamatsu OrcaER CCD camera
run by the Open Lab imaging software. All cells were imaged under live conditions unless
otherwise noted. Cells were optically sectioned in the Z-plane for each channel. Z section images
were adjusted for equivalent brightness and contrast and merged.
PSM Time-Lapse Videos and Projections
All videos and 3D projections of sporulating cells were done on a Zeiss LSM 510
confocal microscope and captured with Zeiss LSM 510 software. Time-lapse videos were taken
using a CellASIC microfluidics chamber and Millipore Y-04D plates. Cells were captured in the
visualization chamber between four and five hours after induction in sporulation media (using
standard sporulation methods described above). While in the chamber, additional sporulation
media was perfused at 6 PSI for the duration of imaging. Images were taken every two minutes
for the duration of the video with a pinhole aperture of 540 and 512x512 resolution and scan-
time of 7.6 µs/pixel. 3D projections were imaged in the same manner as time lapse images,
except a Z-stack was taken of a cell and the resulting z-stacks were then projected into a 3D view
using the LSM 510 software for a ±45º view at 6º intervals.
PSM Size and Nuclear Capture quantification
Page14of42
All PSM size measurements were made as previously described (Parodi et al. 2012) using
ImageJ software (Schneider et al. 2012) on images collected as described above. Briefly, an
image stack of optical sections was taken of individual post-meiotic cells and PSM size was
determined by measurement of the maximal projection of each rounded PSM.
Nuclear capture was scored on live post-meiotic cells with rounded PSMs and merged
optical sections of PSM and Htb2-mCherry signal were used to assess if each of the nuclei were
fully captured by the closed PSM. The number of captured nuclei per ascus were quantified as in
Parodi et al. 2012.
Western Blotting
Cells were collected at the indicated times and prepared using the TCA method (Philips and
Herskowitz, 1998), which involves first lysing cells in a lysis buffer (1.85 N NaOH and 10% v/v
betamercaptolethanol) followed by precipitation of proteins with 50% (v/v) trichloroacetic acid.
TCA precipitated protein lysates were then washed with ice cold acetone and resuspended in 1x
sample buffer neturalized with 5 µl of 1 M Tris Base before boiling for 5 minutes. Protein lysates
were separated on SDS-PAGE gels. Protein was transferred onto Immobilon LF-PVDF
membrane, blocked and incubated overnight with the appropriate primary antibodies. Sps1-GFP
(sps1*) and sf-GFP were detected using JL-8 anti-GFP antibodies (Takara/Clontech) at 1:1000;
Ssp1-myc was detected using 9E10 anti-myc antibodies (Covance) at 1:1000; Pgk1 was detected
by using 22C5D8 anti-Pgk1 (LifeTechnologies) (1:1000); Tub1 was detected using monoclonal
mouse 12G10 anti-Tub1 antibody at 1:1000 concentration (DSHB). Fluorescent IR-Dye
conjugated anti-mouse secondary antibodies were used at 1:20000 (LI-COR). All membranes
were imaged using an Odyssey Infrared Imaging system (LI-COR).
Quantification of Protein Levels

Page15of42
Proteins were quantified using the Image Studio v3.1 software from LI-COR. Bands from
Western blots were quantified using 4-pixel top-bottom median background correction, and the
total signal value was used for protein level comparisons. For looking at Ssp1 levels, blots were
quantified by normalizing the Ssp1-13x-myc signal to the Pgk1 signal for the lane, the
normalizing the resulting Ssp1/Pgk1 ratios to the park ratio of that blot, to show the relative Ssp1
expression pattern in each genetic background.
Protein Stability Assay
Protein stability was assayed using the translational inhibitor cycloheximide. Cycloheximide was
added to cultures 8 hours after transfer to sporulation media. Aliquots were subsequently
withdrawn every 15 minutes after the addition of cycloheximide, and pelleted. The samples were
then processed by TCA precipitation and SDS-PAGE analysis, as described above. Three
biological replicates for each strain were analyzed, and Ssp1-myc was normalized to the long-
lived Tub1 levels. An ANCOVA test was used to calculate the significance of the difference in
Ssp1 stability seen between wild type and sps1Δ.
Phos-tag™ Analysis
Phos-Tag™ gels were made using Phos-tag™ Acrylamide AAL-107 (WACO) at a final
concentration of 31.4µM Phos-tag™ and 50.6 µM MnCl2 in an otherwise standard SDS-
polyacrylamide gel, as in (Whinston et al. 2013). Samples were prepared as above and run at 80
V at 4° before being transferred and imaged, as above.
Immunoprecipitation
To co-immunoprecipitate Sps1 and Ssp1, cultures of cells were sporulated while meiosis was
monitored, to ensure synchronous sporulations both within and between cultures. When sfGFP-
Sps1 fluorescence was visible in the majority of cells, cells (120 OD600) were harvested and
Page16of42
flash frozen in liquid nitrogen, along with parallel samples (3 OD600) for Western analysis, as
described above. Samples for coimmunoprecipitation were taken and lysed in IP buffer (16 mM
HEPES,1.2 mM MgCl2, 330 mM NaCl, 0.8% v/v NP40, 0.08 mM EDTA) with phosphatase and
protease inhibitors, as previously described (Slubowski et al. 2014). Resulting cell lysates were
precleared using blocked agarose beads (Chromotek) for 1 hour before the supernatant was
removed and placed on GFP-trap conjugated agarose beads for two hours at 4°(Chromotek).
Beads were washed four times in IP buffer, resuspended in 2x sample buffer, boiled for 5
minutes. Samples were analyzed on a a 10% SDS-PAGE gel, as described above.
Data and reagent availability
Strains and plasmids are available upon request.

Page17of42
RESULTS
Screening for high copy suppressors of SPS1
To identify genes that interact with SPS1, we screened a tiled 2µ library of 1588 plasmids
covering ~98% of the genome (Jones et al. 2008) for their ability to suppress sps1*. sps1* is a C-
terminal Sps1-3xGFP fusion protein that does not complement sps1Δ. Cells homozygous for
sps1* form 6.2% refractile spores, which is intermediate between wild type (86.2%) and the
sps1∆ null allele (1.8%), consistent with sps1* acting as a hypomorphic allele (Figure 1A). sps1*
does not act in a dominant negative fashion, as the sporulation efficiency of SPS1/sps1* is
similar to wild type (Figure 1A). Consistent with sps1* being a hypomorphic allele (and not a
protein null), the protein encoded by sps1* can be detected on an immunoblot (Figure S1). We
chose to suppress a hypomorphic allele to facilitate the isolation of a broader range of
suppressors than might be obtained using a null.
Plasmids containing the library were transformed into sps1*, sporulated in 96-well plates,
and visually screened for the formation of refractile spores (Figure 1B). As sporulation is less
efficient in 96-well plates, candidate strains yielding >10% refractile spores were reassessed for
spore formation using conventional high-efficiency liquid sporulation conditions. Four plasmids
from the library reproducibly suppressed the sps1* phenotype: YGPM4k18, YGPM1j19,
YGPM18n12, and YGPM30n09 (Figure 1C). Two plasmids, YGPM1j19, and YGPM18n12,
contained SPS1, while YGPM4k18 and YGPM30n09 harbored candidate suppressors. Each
individual gene contained within YGPM4k18 and YGPM30n09 was subcloned into the high
copy vector pRS423 (Sikorski and Hieter 1998). This analysis revealed that the suppression
observed by YGPM4k18 and YGPM30n09 could be accounted for by SPO77 and STP2,
respectively (Figure 1D).

Page18of42
Previous studies demonstrated that null alleles of SPO77 do not form refractile spores
(Rabitsch et al. 2001; Coluccio et al. 2004). SPO77 encodes a protein with no known conserved
functional domains and appears specific to fungi. We confirmed that spo77Δ mutants are
defective in forming refractile spores, but detected no defects in refractile spore formation in
stp2Δ mutants (Figure 2A).
STP2 encodes a transcription factor that controls the expression of genes responsible for
the import of amino acids across the plasma membrane (de Boer et al. 2000). STP2 has a
paralog, STP1, that also plays a redundant role in amino acid transport (de Boer et al. 2000);
STP1 overexpression (plasmids YGPM10d14 and YGPM17l13) did not suppress sps1*. As STP2
had no obvious sporulation defect, we chose to focus on SPO77.
SPO77 genetically interacts with SPS1
To further examine the relationship between SPS1 and SPO77, we examined spore
formation in the spo77Δsps1Δ double mutant. Consistent with a role in the same (rather than
parallel) pathways, spo77Δsps1Δ mutants formed spores at a similar level to either single mutant
(Figure 2A). In contrast to its ability to suppress the sps1* hypomorph, SPO77 overexpression
failed to suppress the sps1Δ null, (Figure 2B), suggesting that some level of SPS1 activity is
required for SPO77 to suppress SPS1. SPS1 overexpression also failed to suppress the spo77Δ
null (Figure 2C).
SPS1 and SPO77 play a role in PSM development
As refractile spore formation is the terminal phenotype of a complex process, we
reasoned we could more precisely understand the roles of SPS1 and SPO77 in spore
morphogenesis by assaying earlier events. Thus, we chose to examine the formation of the
prospore membranes (PSMs), an early event during spore formation that occurs as cells are
Page19of42
undergoing meiosis II (Neiman 2011) using a PSM marker (pRS426-G20, which is a GFP fusion
to residues 51-91 of Spo20 (Nakanishi et al. 2004)). PSMs in wild-type cells underwent
development as previously reported, with PSMs initiating at the spindle poles of cells in meiosis
II, elongating around the meiotic nucleus, and rounding up as they close to form the four
individual prospores as meiosis II is completed (Figure 3A) (Diamond et al. 2009).
Both sps1Δ and spo77Δ mutants had aberrant PSM development, exhibiting hyper-
elongated and often convoluted PSMs at the latest stages of PSM development that give rise to
rounded, but smaller than wild-type PSMs (Figure 3A, 3B, 3C, 4A; projections shown in Files
S1, S2, S3, S4, S5, and S6). We confirmed that these hyper-elongated PSMs lead directly to the
small, round PSM phenotype, by following single cells using time-lapse microscopy (Files S7,
S8, and S9). PSM perimeter was quantified after rounding, with wild type cells forming PSMs
with a perimeter of 7.4±0.9 µm, while both sps1Δ and spo77Δ form PSMs with perimeters of 5.8
±1.3 µm (Figure 4B).
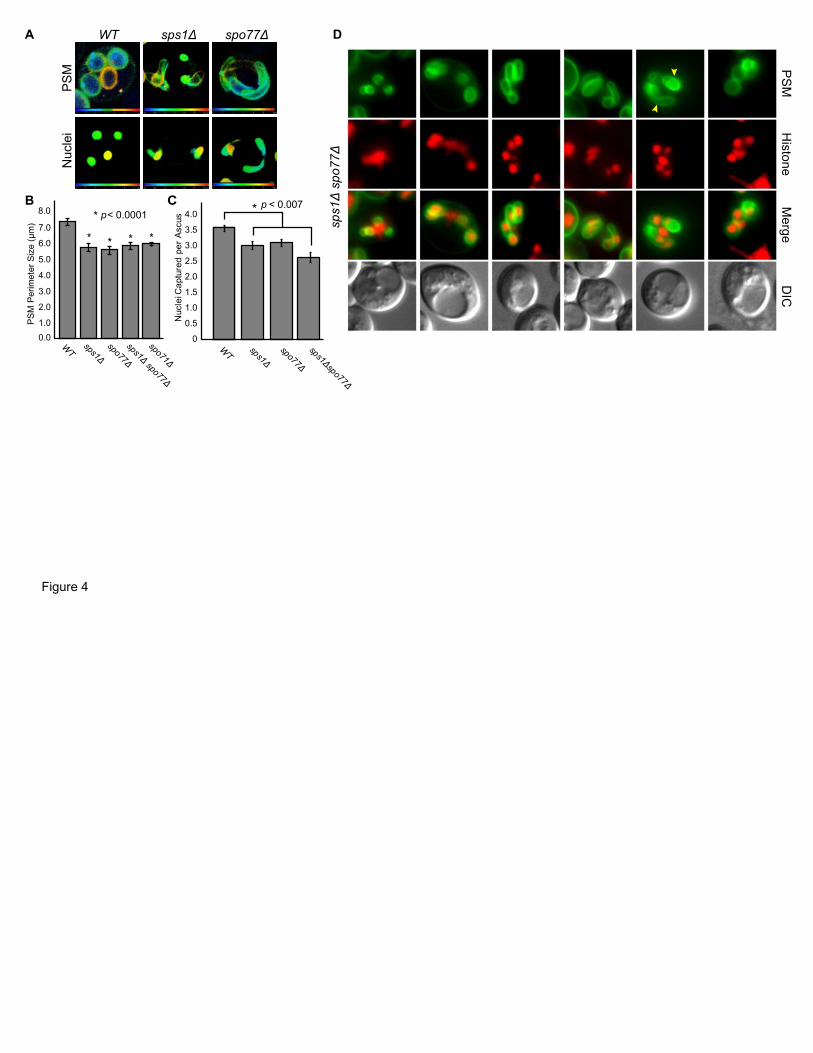
We also see a slight decrease in the ability of the PSMs to properly capture nuclei in the
mutant backgrounds. Nuclear capture was quantified at two time-points: early in PSM
development, just before or immediately after elongation began and again after closure. Early in
PSM development there was nearly 100% nuclear envelopment in all strains examined.
However, we saw a modest (~10%) decrease compared to wild type in nuclear capture for sps1Δ
and spo77Δ cells that had rounded PSMs (Figure 4C). This suggests that PSMs initially grow
around the nuclei but that the nuclei sometimes escape capture before PSM closure.
The sps1Δspo77Δ double mutant is indistinguishable from either single mutant in all
phenotypes examined, including PSM morphology (Figure 4D), PSM size (Figure 4B) and
nuclear capture (Figure 4C). Thus, both SPS1 and SPO77 exert similar effects on PSM

Page20of42
development and exhibit genetic interactions consistent with acting in the same, rather than
parallel, pathways.
Sps1 has a dynamic localization during sporulation
We previously reported that a superfolderGFP-Sps1 (sfGFP-Sps1) fusion protein
localizes to the nucleus and the cytoplasm during sporulation (Slubowski et al. 2014). Due to the
observed PSM defect in sps1Δ cells, we reexamined sfGFP-Sps1 localization and detected a dim,
transient localization at the PSM (Figure S1). sfGFP folds and matures quickly but
photobleaches rapidly (Lee et al. 2013; Slubowski et al. 2015). The PSM localization of sfGFP-
Sps1 fades to undetectable levels within three seconds of epifluorescent illumination, making it
difficult to observe.
To better capture the localization of Sps1, we fused Sps1 to the GFP variant Envy, which
is brighter and more photostable than sfGFP (Slubowski et al. 2015). Envy-Sps1 was expressed
under the control of the SPS1 promoter from a high copy plasmid in a strain lacking endogenous
SPS1, alongside the blue fluorescent PSM marker Spo2051-91-mTagBFP (Lin et al. 2013) (Figure
5). Envy-Sps1 complements sps1Δ, as sps1Δ cells with this plasmid form refractile spores. We
observed colocalization between Envy-Sps1 and the PSM marker during the elongation phase
(Figure 5). As the PSMs round up, Envy-Sps1 accumulates in the nucleus and the cytosol, as
previously reported for sfGFP-Sps1. Thus, Sps1 can localize to the PSM during PSM
development, and concentrates in the nucleus as the PSMs close.
SPS1 and SPO77 are required for the removal of the LEP
The Leading Edge Protein (LEP) coat is a proteinaceous structure found at the leading
edge of the growing PSM. The LEP is thought to provide structural support and directional
guidance for the PSM, and is removed when the PSM closes (Maier et al. 2007; Diamond et al.

Page21of42
2009). Because the PSMs of sps1Δ and spo77Δ mutants are irregularly shaped late in their
development, we examined whether the LEP was disturbed by assessing the localization of the
LEP coat member Don1 (Knop and Strasser 2000). Don1 was tagged with GFP (Huang et al.
2005) and its localization was examined in wild type, sps1Δ and spo77Δ cells.
We observe Don-GFP localization to the leading edge of the PSM in wild type cells
during PSM elongation (Figure 6A left), as previously observed (Knop and Strasser 2000;
Diamond et al. 2009). Similarly, sps1Δ and spo77Δ cells have Don1-GFP at the leading edge of
elongated PSMs as well as in hyper-elongated PSMs (Figure 6B left and 6C left). When wild
type cells have rounded PSMs, Don1-GFP is removed from the PSM and becomes faint and
diffuse within the newly formed PSM (Figure 6A right) (Maier et al. 2007; Diamond et al.
2009). In contrast, in both sps1Δ and spo77Δ mutant strains, Don1-GFP remains bright and
generally localized to puncta associated with the PSM (Figure 6B right and 6C right). The Don1-
GFP puncta are not properly removed from closed prospore membranes in sps1Δ and spo77Δ
cells compared to wild type (Table 1; p-value <0.0001). These results suggest that SPS1 and
SPO77 are not required for the correct initial localization of the LEP, but are required for proper
LEP disassembly.
The LEP is removed as PSMs close, and previous work has shown that AMA1 regulates
PSM closure and is required for proper LEP removal (Maier et al. 2007; Diamond et al. 2009).
We see that ama1Δ cells make rounded PSMs that retain bright Don1-GFP puncta (Figure 6D
right) as previously shown (Diamond et al. 2009; Park et al. 2013), at a frequency similar to
what was observed in the sps1Δ and spo77Δ mutants (Table 1; p-value <0.0001). We also
observe hyper-elongated PSMs in ama1∆ cells (Figure 6D left), consistent with previous reports
(Diamond et al. 2009). Given the similarity of the sps1∆ and spo77∆ phenotypes to the ama1∆

Page22of42
phenotype, we hypothesized that SPS1 and SPO77 may have a role in PSM closure similar to
AMA1.
SPS1 and SPO77 are required for PSM closure independent of AMA1
To test whether SPS1 and SPO77 act in the same pathway as AMA1 to regulate PSM
closure, we examined PSM development in double mutants of sps1Δama1Δ and spo77Δama1Δ.
As expected, early PSM morphology was relatively normal (Figure 7A and 7B). However, as
cells approached the time wild type strains would have rounded PSMs and begin showing
refractile structures indicative of spore wall development, both double mutants display a hyper-
elongated PSM morphology similar to that of the sps1∆ and spo77∆ single mutants (Figure 7A
and 7B). Unlike in sps1Δ, spo77Δ and ama1Δ single mutants, the hyper-elongated PSMs never
develop into round structures in the sps1Δama1Δ and spo77Δama1Δ double mutants. This is true
even as late as 12 hours after sporulation induction, when wild type cells have completed spore
morphogenesis. At late time points, the entire cell cytoplasm of sps1Δ ama1Δ and spo77Δ
ama1Δ double mutants fills with heavily invaginated PSM material (Figure 7A and 7B yellow
arrows), with nearly all nuclei contained within the PSM (Figure 7A and 7B, white arrows).
Taken together, these data suggest that sps1Δama1Δ and spo77Δama1Δ double mutants can still
target nuclei but completely lack the ability to form rounded PSMs. Because the sps1Δama1Δ
and spo77Δama1Δ double mutants show sporulation defects more severe than either the sps1Δ or
spo77∆ single mutant, and because the sps1Δspo77Δ PSM phenotype is indistinguishable from
either single mutant, this suggests that SPS1 and SPO77 function in an independent pathway that
acts in parallel and is partially redundant with the AMA1 pathway that regulates PSM closure.
Because the removal of the LEP from the leading edge of the PSM is mediated by AMA1
and is correlated with PSM closure, we asked whether loss of SPS1 or SPO77 exacerbated the

Page23of42
previously described ama1Δ defect of incomplete removal of LEP material at the time of PSM
closure (Diamond et al. 2009). Double mutants of both sps1Δama1Δ and spo77Δama1Δ were
sporulated and the LEP was visualized using Don1-GFP. Both double mutants showed
phenotypes similar to the single mutants (Figure 7C and 7D), except that few to no rounded
PSMs and no dissociated Don1-GFP foci were observed within a double mutant ascus. Full LEP
rings were found as late as 12 hours post-induction (Figure 7C and 7D, white arrows). The
presence of LEP rings in the double mutants, at times when wild type cells have completed spore
morphogenesis, is consistent with a complete failure in PSM closure. This result suggests that
SPS1, SPO77 and AMA1 are required to disassemble and degrade the LEP during the course of
PSM development.
Because we saw that the LEP was not properly removed, we asked whether PSM-
mediated cytokinesis was affected in these mutants. We first examined PSM initiation to see
whether the timing of PSM formation was altered. None of the strains examined had a delay in
the initiation of PSM formation (Figure 8A).
Next, as rounding of the PSMs is an indirect measure of closure (Diamond et al. 2009),
we examined the appearance of rounded PSMs in the single and double mutants of SPS1, SPO77
and AMA1. We saw delays in the formation of rounded PSMs (Figure 8B). sps1Δ, spo77Δ single
mutants and the sps1Δspo77Δ double mutant all displayed similar PSM rounding kinetics, with a
delay of approximately one hour compared to wild type and the formation of fewer rounded
PSMs (sps1Δ =73.0%, spo77Δ = 67.5% and sps1Δspo77Δ =69.5%, compared to 96.5% for wild
type). These results are consistent with SPS1 and SPO77 acting in the same pathway.
The single mutant of ama1Δ showed a more severe delay in rounded PSM appearance
(about two hours) and even fewer rounded PSMs (31.0%) than the sps1Δ and spo77Δ single

Page24of42
mutants (73.0% and 67.5% respectively) or the sps1Δspo77Δ double mutant (69.5%) (Figure
8B). The ama1Δ sps1Δ and the ama1Δ spo77Δ double mutants fail to form rounded PSMs (0%
for both strains) (Figure 8B), consistent with SPO77 and SPS1 acting in a parallel pathway to
AMA1 in PSM closure.
SPS1 and SPO77 are required for Ssp1 degradation
Previous studies have shown that Ssp1 is removed from the leading edge and degraded
when PSMs close (Maier et al. 2007), and that AMA1 is needed for Ssp1 removal (Diamond et
al. 2009). Because we see Don1 persistence in rounded PSMs in the in the sps1Δ and spo77Δ
mutants (Table 1), since SSP1 is required for Don1 localization (Moreno-Borchart et al. 2001),
and because SPS1 and SPO77 act in parallel to AMA1, we asked whether SPS1 and SPO77 were
also required for Ssp1 removal and degradation. We examined Ssp1 degradation by examining
the relative protein levels of the fusion protein Ssp1-13x-myc and see that Ssp1 protein levels
decrease during sporulation and that Ssp1 is stabilized in ama1Δ mutants, as previously
described (Figure 8C, 8D; Maier et al. 2007; Diamond et al. 2009). At 14 hours, Ssp1 is also
stabilized in the sps1Δ and spo77Δ mutants, as well as in the ama1Δ sps1Δ and the ama1Δ
spo77Δ double mutants (Figure 8C, 8D). These mutant strains also all show multiple bands of
Ssp1 not seen in wild type, which are presumably degradation products. For simplicity, our
quantitation (Figure 8D) summed all Ssp1 bands. Because we do not know which bands
represent functional Ssp1 at the leading edge of the PSM, the stabilization we see may reflect a
stabilization of the total pool (which may include nonfunctional Ssp1), and it is possible that the
decline in the functional pool is more modest. The increase instability that we see was not due to
obvious differences in the rate of sporulation in the different cultures, as these cultures are
progressing through meiosis at nearly identical rates (Figure 8E).

Page25of42
Since SPS1 appears to act in an independent pathway from AMA1, we asked whether it
normally acts to promote Ssp1 degradation, like AMA1 (Diamond et al. 2009), or acts by
inhibiting Ssp1 production. We distinguished between these possibilities by observing the
relative length of time extant Ssp1-13x-myc persists after halting translation using
cycloheximide, an inhibitor of translation, to estimate the stability of Ssp1 in wild type and the
sps1Δ mutant. The sps1Δ mutant showed increased Ssp1-13x-myc protein stability relative to
wild type, as normalized to the long-lived Tub1 protein (p-value = 0.049; Figure 8F). Taken
together, these results suggests that, like AMA1, the SPS1 pathway normally plays a role in
promoting the destruction of Ssp1.
Sps1 interacts with, and is required for the proper phosphorylation of, Ssp1
Because Sps1 appeared to be regulating Ssp1 protein levels, we wondered whether this
regulation involved a physical interaction. Using a strain where Sps1 and Ssp1 were epitope
tagged at the genomic locus, we were able to coimmunoprecipitate sfGFP-Sps1 and Ssp1-13x-
myc in sporulating cells (Figure 8G). This result is consistent with Sps1 and Ssp1 being in a
complex during sporulation.
Ssp1 has been previously been described as a phosphoprotein (Maier et al. 2007). Since
Sps1 is a serine/threonine kinase and is in complex with Ssp1, we tested whether SPS1 is
required for Ssp1 phosphorylation. We assayed the 10 hour samples from Figure 8C for
phosphorylation using a Phos-tag™ gel, which specifically retards the migration of
phosphoproteins through the matrix, allowing resolution of multiple phosphorylation states
(Kinoshita et al. 2006; Whinston et al. 2013). In wild type cells, the Ssp1-13x-myc fusion
protein migrates as several distinct bands on a Phos-tag™ gel, consistent with Ssp1 having
multiple phosphorylation sites (Figure 8H). In sps1Δ and spo77Δ mutants, the most slowly

Page26of42
migrating species of Ssp1-13x-myc was missing), although there is also an increase of some
presumed degradation products (Figure 8H). However, ama1Δ mutants did not show a similar
loss of the slowest migrating species of Ssp1-13x-myc compared to the sps1Δ or spo77Δ mutants
(Figure 8G). These results suggest that SPS1 and SPO77 are required for the proper
phosphorylation of Ssp1, and that their effects on Ssp1 modification are distinct from those of
AMA1. This result is also consistent with SPS1 and SPO77 acting independently of AMA1.

Page27of42
DISCUSSION
Prior work has demonstrated that closure of the prospore membrane in S. cerevisiae
depends upon the activator of the meiotic anaphase promoting complex encoded by AMA1
(Diamond et al. 2009). However the partial defects observed in ama1Δ mutants suggested that
another, independent pathway also acts to regulate closure. Here, we find the pathway defined by
SPS1 and SPO77 act in parallel to AMA1 to regulate closure, and affects the phosphorylation and
stability of Ssp1 (Figure 8C, 8D, 8F, 8H). In contrast, AMA1 is required for the stability of Ssp1
(Figure 8C, 8D) but not its phosphorylation (Figure 8H) (Diamond et al. 2009).
In our model, we place SPS1 and SPO77 together in one pathway, as cells deficient in
either SPS1 or SPO77 produce hyper-elongated prospore membranes, do not properly remove
Don1 from the leading edge of the prospore membrane, and have stabilized Ssp1 that is reduced
in phosphorylation (Figure 8I). The sps1Δ spo77Δ double mutant is indistinguishable from either
single mutant for prospore membrane size (Figure 4B), nuclear capture (Figure 4C), prospore
membrane development (Figure 4D), and prospore membrane closure (Figure 8B), consistent
with both genes acting in the same pathway. Interestingly, high copy SPO77 can suppress the
hypomorphic sps1* allele, but not the sps1Δ null, suggesting that genetic suppression requires at
least some SPS1 activity. Additionally, we could not suppress spo77Δ mutants with
overexpression of SPS1, which may be expected if SPS1 acted downstream of SPO77. It is
possible that SPO77 modulates SPS1 in some fashion, perhaps acting as a cofactor or scaffold
necessary for SPS1's role in Ssp1 degradation. We simply conclude that these two genes act
together to promote prospore membrane closure.
We believe that the SPS1/SPO77 pathway acts in parallel to AMA1 (Figure 8I), because
the sps1Δama1Δ and spo77Δ ama1Δ mutants have a complete block in PSM closure (Figure 8B).

Page28of42
This stands in contrast to the single mutants, which show reductions, but not a total block in
cytokinesis.
How SPO77, SPS1, and AMA1 regulate Ssp1 stability is unclear. Because Ama1 is an
activator of the APC/C (Cooper et al. 2000), it is tempting to speculate that Ama1 is important
for the ubiquitination and subsequent degradation of Ssp1, although attempts to see a
ubiquitinated form of Ssp1 have not been successful (Maier et al. 2007; Diamond et al. 2009).
We also do not know whether the stabilization of Ssp1 we see in the sps1Δ and spo77Δ strains
reflects a stabilization of the functional pool of Ssp1 at the leading edge. Furthermore, because
protein stability is examined at later time points in mutants where the progression through
sporulation has been blocked, more studies are needed to determine whether the stabilization of
Ssp1 we see is due to a direct effect of the mutated gene or an indirect effect due to other earlier
defects.
Although ubiquitinated Ssp1 has not been detected, Ssp1 appears to be phosphorylated
(Maier et al. 2007). We find that phosphorylation of Ssp1 is reduced in the sps1Δ and spo77Δ
mutants (Figure 8H), although not abolished. Because we see Sps1 and Ssp1 in a complex
(Figure 8G), it is possible that Ssp1 is a substrate of Sps1, although studies will need to be done
to demonstrate the direct phosphorylation of Ssp1 by Sps1. Since Sps1 is a STE20-like kinase in
the GCKIII subfamily (Slubowski et al. 2014), it is possible that Sps1 phosphorylates Ssp1 along
with another kinase that acts in parallel. The functional impact of Ssp1 phosphorylation remains
to be determined.
A role for SPS1 in influencing a cytokinetic event may extend beyond yeast sporulation.
An SPS1 homolog in the amoeba Dictyostelium discoideum, SvkA, has been shown to have a
role in the final steps of cytokinesis in mitotic division, as well as playing a role in the formation

Page29of42
of fruiting bodies in response to starvation (Rohlfs et al. 2007). The localization of SvkA is also
similar to Sps1 in that both have cyto-nuclear localization and enrichment at the membrane when
cytokinesis occurs (Rohlfs et al. 2007), suggesting that Sps1 and related GCKIII kinases may
have primordial origins in stress response and influencing cytokinesis in these contexts.
Similarly, the Drosophila GCKIII kinase Wheezy has been shown to be involved in trachea
development, where wheezy mutants have inappropriate trafficking of membrane-bound
adhesion proteins and increase accumulation of Crumbs protein on the tracheal membrane (Song,
et al., 2013), although Crumbs and Ssp1 do not show any obvious homology.
The timing of prospore membrane closure, as with any cytokinetic event, needs to be
properly regulated. The APC/C is a highly regulated complex with direct roles regulating the
events that occur during the meiotic division and subject to complex feedback loops (Cooper et
al. 2000; Oelschlaegel et al. 2005; Penkner et al. 2005; Tan et al. 2010; Tsuchiya et al. 2011;
Okaz et al. 2012). The involvement of AMA1 in regulating the cytokinetic event suggests a
mechanism for regulating the meiotic cell cycle, with APC/CAMA1 activity coordinated with other
cell cycle events. The involvement of the APC/C in cytokinesis is likely more universal, as the
APC/C also plays a role in regulating abscission during cytokinesis by degrading the Plk1 kinase
in human cells (Lindon and Pines 2004; Bastos and Barr 2010). Similarly, a meiosis specific
activator of the APC/C (mfr1) in S. pombe has been suggested to coordinate the nuclear divisions
in sporulation suggesting a conserved role for meiosis-specific APC/C activators in meiotic
cytokinesis, although a direct role in forespore membrane closure (the S. pombe prospore
membrane equivalent) for mfr1 has not been demonstrated (Blanco et al. 2001). The activator of
Sps1 is not known, and thus the signal to which it is responding is currently unclear. The timing
of Sps1 protein accumulation is governed by an Ime2/Rim4-dependent translational repression

Page30of42
and derepression that delays Sps1 production until after MII, despite SPS1 transcription
occurring at MI with Ndt80-MSE induction (Berchowitz et al. 2013). Whatever activates Sps1
may represent an additional signal monitoring the state of the cell, whose output is used to decide
when cytokinesis occurs.
Acknowledgements: We would like to thank Aaron Neiman for the blue fluorescent PSM
marker Spo2051-91-mTagBFP, Alan Fossa for technical assistance, Alexey Veraksa, Dang
Truong, Catherine McCusker, and Paul Garrity for helpful comments on the manuscript. This
work was supported by a Goranson Award and a Doctoral Dissertation Grant from UMass
Boston to SMP and the following awards to LSH: MCB-0544160 from the National Science
Foundation, GM086805 from the National Institutes of Health, and a Proposal Development
Grant and Healy Award from UMass Boston.

Page31of42
REFERENCES
Balasubramanian, M. K., E. Bi, and M. Glotzer, 2004 Comparative Analysis of Cytokinesis in
Budding Yeast, Fission Yeast and Animal Cells. Curr. Biol. 14: R806–R818.
Bastos, R. N., and F. A. Barr, 2010 Plk1 negatively regulates Cep55 recruitment to the midbody
to ensure orderly abscission. J. Cell Biol. 191: 751–60.
Berchowitz, L. E., A. S. Gajadhar, F. J. van Werven, A. A. De Rosa, M. L. Samoylova et al.,
2013 A developmentally regulated translational control pathway establishes the meiotic
chromosome segregation pattern. Genes Dev. 27: 2147–63.
Blanco, M. A., L. Pelloquin, and S. Moreno, 2001 Fission yeast mfr1 activates APC and
coordinates meiotic nuclear division with sporulation. J. Cell Sci. 114: 2135–43.
de Boer, M., P. S. Nielsen, J. P. Bebelman, H. Heerikhuizen, H. A. Andersen et al., 2000 Stp1p,
Stp2p and Abf1p are involved in regulation of expression of the amino acid transporter gene
BAP3 of Saccharomyces cerevisiae. Nucleic Acids Res. 28: 974–81.
Carballido-López, R., 2006 The bacterial actin-like cytoskeleton. Microbiol. Mol. Biol. Rev. 70:
888–909.
Coluccio, A., E. Bogengruber, M. N. Conrad, M. E. Dresser, P. Briza et al., 2004 Morphogenetic
pathway of spore wall assembly in Saccharomyces cerevisiae. Eukaryot. Cell 3: 1464–75.
Cooper, K. F., M. J. Mallory, D. B. Egeland, M. Jarnik, and R. Strich, 2000 Ama1p is a meiosis-
specific regulator of the anaphase promoting complex/cyclosome in yeast. Proc. Natl. Acad.
Sci. U. S. A. 97: 14548–53.
Cooper, K. F., and R. Strich, 2011 Meiotic control of the APC/C: similarities & differences from
mitosis. Cell Div. 6: 16.
Page32of42
Diamond, A. E., J.-S. Park, I. Inoue, H. Tachikawa, and A. M. Neiman, 2009 The anaphase
promoting complex targeting subunit Ama1 links meiotic exit to cytokinesis during
sporulation in Saccharomyces cerevisiae. Mol. Biol. Cell 20: 134–45.
Friesen, H., R. Lunz, S. Doyle, and J. Segall, 1994 Mutation of the SPS1-encoded protein kinase
of Saccharomyces cerevisiae leads to defects in transcription and morphology during spore
formation. Genes Dev. 8: 2162–2175.
Gietz, R. D., and R. H. Schiestl, 2007 Large-scale high-efficiency yeast transformation using the
LiAc/SS carrier DNA/PEG method. Nat. Protoc. 2: 38–41.
Green, R. A., E. Paluch, and K. Oegema, 2012 Cytokinesis in animal cells. Annu. Rev. Cell Dev.
Biol. 28: 29–58.
Holmes, D. S., and M. Quigley, 1981 A rapid boiling method for the preparation of bacterial
plasmids. Anal. Biochem. 114: 193–7.
Huang, L. S., H. K. Doherty, and I. Herskowitz, 2005 The Smk1p MAP kinase negatively
regulates Gsc2p, a 1,3-beta-glucan synthase, during spore wall morphogenesis in
Saccharomyces cerevisiae. Proc. Natl. Acad. Sci. U. S. A. 102: 12431–6.
Iwamoto, M. A., S. R. Fairclough, S. A. Rudge, and J. Engebrecht, 2005 Saccharomyces
cerevisiae Sps1p Regulates Trafficking of Enzymes Required for Spore Wall Synthesis.
Society 4: 536–544.
Jones, G. M., J. Stalker, S. Humphray, A. West, T. Cox et al., 2008 A systematic library for
comprehensive overexpression screens in Saccharomyces cerevisiae. Nat. Methods 5: 239–
241.
Jürgens, G., 2005 Cytokinesis in higher plants. Annu Rev Plant Biol 56: 281-99.

Page33of42
Kane, S. M., and R. Roth, 1974 Carbohydrate metabolism during ascospore development in
yeast. J. Bacteriol. 118: 8–14.
Kinoshita, E., E. Kinoshita-Kikuta, K. Takiyama, and T. Koike, 2006 Phosphate-binding tag, a
new tool to visualize phosphorylated proteins. Mol. Cell. Proteomics 5: 749–57.
Knop, M., and K. Strasser, 2000 Role of the spindle pole body of yeast in mediating assembly of
the prospore membrane during meiosis. EMBO J. 19: 3657–67.
Krishnamoorthy, T., X. Chen, J. Govin, W. L. Cheung, J. Dorsey et al., 2006 Phosphorylation of
histone H4 Ser1 regulates sporulation in yeast and is conserved in fly and mouse
spermatogenesis. Genes Dev. 20: 2580–92.
Lam, C., E. Santore, E. Lavoie, L. Needleman, N. Fiacco et al., 2014 A visual screen of protein
localization during sporulation identifies new components of prospore membrane-associated
complexes in budding yeast. Eukaryot. Cell 13: 383–91.
Lee, D. M., and T. J. C. Harris, 2014 Coordinating the cytoskeleton and endocytosis for
regulated plasma membrane growth in the early Drosophila embryo. Bioarchitecture 4: 68–
74.
Lee, S., W. A. Lim, and K. S. Thorn, 2013 Improved blue, green, and red fluorescent protein
tagging vectors for S. cerevisiae. PLoS One 8: e67902.
Lin, C. P.-C., C. Kim, S. O. Smith, and A. M. Neiman, 2013 A highly redundant gene network
controls assembly of the outer spore wall in S. cerevisiae. PLoS Genet. 9: e1003700.
Lindon, C., and J. Pines, 2004 Ordered proteolysis in anaphase inactivates Plk1 to contribute to
proper mitotic exit in human cells. J. Cell Biol. 164: 233–41.
Longtine, M. S., a McKenzie, D. J. Demarini, N. G. Shah, a Wach et al., 1998 Additional
Page34of42
modules for versatile and economical PCR-based gene deletion and modification in
Saccharomyces cerevisiae. Yeast 14: 953–61.
Maier, P., N. Rathfelder, M. G. Finkbeiner, C. Taxis, M. Mazza et al., 2007 Cytokinesis in yeast
meiosis depends on the regulated removal of Ssp1p from the prospore membrane. EMBO J.
26: 1843–52.
Managbanag, J. R., T. M. Witten, D. Bonchev, L. a Fox, M. Tsuchiya et al., 2008 Shortest-path
network analysis is a useful approach toward identifying genetic determinants of longevity.
PLoS One 3: e3802.
McLean, J. R., D. Chaix, M. D. Ohi, and K. L. Gould, 2011 State of the APC/C: Organization,
function, and structure. Crit. Rev. Biochem. Mol. Biol 46: 118-36.
Moens, P. B., 1971 Fine structure of ascospore development in the yeast Saccharomyces
cerevisiae. Can. J. Microbiol. 17: 507–10.
Moreno-Borchart, A. C., K. Strasser, M. G. Finkbeiner, A. Shevchenko, and M. Knop, 2001
Prospore membrane formation linked to the leading edge protein (LEP) coat assembly.
EMBO J. 20: 6946–57.
Nag, D. K., M. P. Koonce, and J. Axelrod, 1997 SSP1, a gene necessary for proper completion
of meiotic divisions and spore formation in Saccharomyces cerevisiae. Mol. Cell. Biol. 17:
7029–39.
Nakanishi, H., Y. Suda, and A. M. Neiman, 2007 Erv14 family cargo receptors are necessary for
ER exit during sporulation in Saccharomyces cerevisiae. J. Cell Sci. 120: 908–16.
Neiman, A. M., 1998 Prospore Membrane Formation Defines a Developmentally Regulated
Branch of the Secretory Pathway in Yeast. J. Cell Biol. 140: 29–37.

Page35of42
Neiman, A. M., 2011 Sporulation in the budding yeast Saccharomyces cerevisiae. Genetics 189:
737–65.
Nickas, M. E., and A. M. Neiman, 2002 Ady3p links spindle pole body function to spore wall
synthesis in Saccharomyces cerevisiae. Genetics 160: 1439–50.
Oelschlaegel, T., M. Schwickart, J. Matos, A. Bogdanova, A. Camasses et al., 2005 The yeast
APC/C subunit Mnd2 prevents premature sister chromatid separation triggered by the
meiosis-specific APC/C-Ama1. Cell 120: 773–88.
Okaz, E., O. Argüello-Miranda, A. Bogdanova, P. K. Vinod, J. J. Lipp et al., 2012 Meiotic
prophase requires proteolysis of M phase regulators mediated by the meiosis-specific
APC/CAma1. Cell 151: 603–18.
Park, J.-S., Y. Okumura, H. Tachikawa, and A. M. Neiman, 2013 SPO71 encodes a
developmental stage-specific partner for Vps13 in Saccharomyces cerevisiae. Eukaryot.
Cell 12: 1530–7.
Parodi, E. M., C. S. Baker, C. Tetzlaff, S. Villahermosa, and L. S. Huang, 2012 SPO71 mediates
prospore membrane size and maturation in Saccharomyces cerevisiae. Eukaryot. Cell 11:
1191–200.
Penkner, A. M., S. Prinz, S. Ferscha, and F. Klein, 2005 Mnd2, an essential antagonist of the
anaphase-promoting complex during meiotic prophase. Cell 120: 789–801.
Percival-Smith, a, and J. Segall, 1986 Characterization and mutational analysis of a cluster of
three genes expressed preferentially during sporulation of Saccharomyces cerevisiae. Mol.
Cell. Biol. 6: 2443–51.
Pesin, J. A., and T. L. Orr-Weaver, 2008 Regulation of APC/C Activators in Mitosis and
Page36of42
Meiosis. Annu. Rev. Cell Dev. Biol. 24: 475–499.
Pollard, T. D., and J.-Q. Wu, 2010 Understanding cytokinesis: lessons from fission yeast. Nat.
Rev. Mol. Cell Biol. 11: 149–55.
Rabitsch, K. P., A. Tóth, M. Gálová, A. Schleiffer, G. Schaffner et al., 2001 A screen for genes
required for meiosis and spore formation based on whole-genome expression. Curr. Biol.
11: 1001–9.
Rohlfs, M., R. Arasada, P. Batsios, J. Janzen, and M. Schleicher, 2007 The Ste20-like kinase
SvkA of Dictyostelium discoideum is essential for late stages of cytokinesis. J. Cell Sci.
120: 4345–54.
Rolli, E., E. Ragni, M. de Medina-Redondo, J. Arroyo, C. R. V. de Aldana et al., 2011
Expression, stability, and replacement of glucan-remodeling enzymes during developmental
transitions in Saccharomyces cerevisiae. Mol. Biol. Cell 22: 1585–98.
Sikorski, R. S., and P. Hieter, 1989 A system of shuttle vectors and yeast host strains designed
for efficient manipulation of DNA in Saccharomyces cerevisiae. Genetics 122: 19–27.
Slubowski, C. J., A. D. Funk, J. M. Roesner, S. M. Paulissen, and L. S. Huang, 2015 Plasmids
for C-terminal tagging in Saccharomyces cerevisiae that contain improved GFP proteins,
Envy and Ivy. Yeast 32: 379-87.
Slubowski, C. J., S. M. Paulissen, and L. S. Huang, 2014 The GCKIII Kinase Sps1 and the 14-3-
3 Isoforms, Bmh1 and Bmh2, Cooperate to Ensure Proper Sporulation in Saccharomyces
cerevisiae. PLoS One 9: e113528.
Tan, G. S., J. Magurno, and K. F. Cooper, 2010 Ama1p-activated anaphase-promoting complex
regulates the destruction of Cdc20p during meiosis II. Mol. Biol. Cell 22: 315–326.

Page37of42
Taxis, C., C. Maeder, S. Reber, N. Rathfelder, K. Miura et al., 2006 Dynamic organization of the
actin cytoskeleton during meiosis and spore formation in budding yeast. Traffic 7: 1628–42.
Tsuchiya, D., C. Gonzalez, and S. Lacefield, 2011 The spindle checkpoint protein Mad2
regulates APC/C activity during prometaphase and metaphase of meiosis I in
Saccharomyces cerevisiae. Mol. Biol. Cell 22: 2848–61.
Wheeler, R. J., N. Scheumann, B. Wickstead, K. Gull, and S. Vaughan, 2013 Cytokinesis in
Trypanosoma brucei differs between bloodstream and tsetse trypomastigote forms:
implications for microtubule-based morphogenesis and mutant analysis. Mol. Microbiol. 90:
1339–55.
Whinston, E., G. Omerza, A. Singh, C. W. Tio, and E. Winter, 2013 Activation of the Smk1
mitogen-activated protein kinase by developmentally regulated autophosphorylation. Mol.
Cell. Biol. 33: 688–700.

Page38of42
FigureLegends
Figure 1 STP2 and SPO77 are high copy suppressors of sps1. (A) sps1* is a hypomorphic allele
of SPS1. Cells of the indicated genotypes were sporulated and assessed for refractile spore
formation 24 hours post sporulation induction (strains from left to right LH177, LH1020,
LH1017, LH1019, LH1018, LH872). For each strain at least 200 cells were counted from
triplicate cultures. (B) A schematic of the pipeline used for a high copy suppression screen of the
hypomorphic allele sps1*. Numbers at the top describe the number of hits carried on through the
step in the grey box found below. (C) Plasmids isolated from the library were retested under
conventional high-efficiency conditions and assessed for refractile spore formation and
normalized to the level of suppression of sps1* seen with YGPM1j19, which contains SPS1
(strains from left to right LH1037, LH1035, LH1034, LH1036). The sps1* strain harboring the
control plasmid (YGPM27a08), the 2µ-SPS1 containing plasmid (YGPM1j19), the 2µ-SPO77
containing plasmid (YGPM4k18), and the 2µ-STP2 containing plasmid (YGPM30n09)
sporulated at 3%, 45%, 12%, and 8% respectively. (D) Genes and their native promoters were
cloned from the two library plasmids that showed suppression of sps1* into pRS423, assessed
for suppression of sps1*, and normalized to the level of suppression seen with YGPM1j19,
which contains SPS1 (strains from left to right LH1038, LH1039, LH1040). All error bars in
(B), (C), and (D) indicate standard deviation; p values were calculated using an unpaired t-test.
Figure 2 SPS1 and SPO77 interact. (A) WT, sps1, spo77, sps1spo77 and stp2 knock out strains
(LH902, LH976, LH1010, LH1012, LH1016, respectively) were assessed for refractile spore
formation. All experiments were counted at 24 hours post induction. (B) sps1Δ null strains
sporulated with SPO77 on a high copy plasmid. (from left to right LH1041, LH1042,

Page39of42
LH1043)(C) spo77Δ null strains were sporulated with SPS1 on a high copy plasmid (from left to
right LH1044, LH1046, LH1045). For the experiments in (A), (B), and (C), at least 200 cells
were counted from each culture and all cultures were grown and sporulated in triplicate. All error
bars in (A), (B), and (C) indicate standard deviation; p values were calculated using an unpaired
t-test.
Figure 3 SPO77 and SPS1 have similar roles for PSM development during sporulation. PSMs
are labeled using a plasmid containing pRS426-G20. Nuclei are labeled using genomically
integrated HTB2-mCherry. (A) PSMs in Wild type (WT) cells (LH917) at various stages of PSM
development. Stages are as follows: i, pinpoints, ii, early horseshoe, iii, mid horseshoe, iv, early
elongation, v, mid elongation, vi, late elongation, vii, extreme elongation (does not occur in wild
type cells), viii, rounded/closed. (B) PSMs in sps1Δ cells (LH1047). Yellow arrows highlight
aberrant PSM morphology. (C) PSMs in spo77Δ cells (LH1049).
Figure 4 Analysis of PSM development. (A) Live WT, spo77Δ and sps1Δ cells (LH917,
LH1049, LH1047) were sporulated in a CellASIC microfluidics chamber and imaged via
confocal microscopy during late stage PSM development. Image is a merged z-stack. Depth is
indicated by color coding, with blue indicating the most proximal and red indicates the most
distal within the z-plane. (B) SPS1 and SPO77 are required for proper rounded PSM size. WT,
sps1 Δ, spo77Δ, and sps1Δ spo77Δ cells (LH917, LH1047, LH1049, LH1050) were sporulated.
Those cells with four rounded PSMs present were assessed for the perimeter size of the
maximum projection of each PSM. For each strain at least 50 rounded PSMs were analyzed
from images taken over at least 3 cultures. Error bars indicate the SEM; p-values were
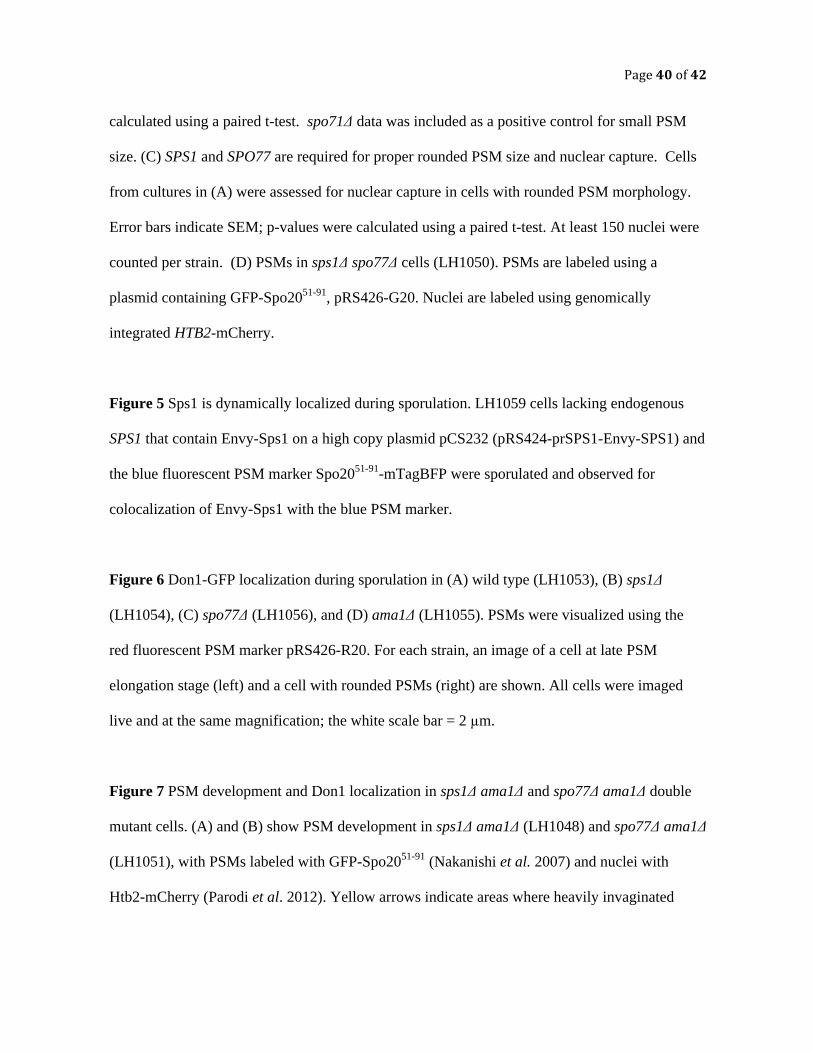
Page40of42
calculated using a paired t-test. spo71Δ data was included as a positive control for small PSM
size. (C) SPS1 and SPO77 are required for proper rounded PSM size and nuclear capture. Cells
from cultures in (A) were assessed for nuclear capture in cells with rounded PSM morphology.
Error bars indicate SEM; p-values were calculated using a paired t-test. At least 150 nuclei were
counted per strain. (D) PSMs in sps1Δ spo77Δ cells (LH1050). PSMs are labeled using a
plasmid containing GFP-Spo2051-91, pRS426-G20. Nuclei are labeled using genomically
integrated HTB2-mCherry.
Figure 5 Sps1 is dynamically localized during sporulation. LH1059 cells lacking endogenous
SPS1 that contain Envy-Sps1 on a high copy plasmid pCS232 (pRS424-prSPS1-Envy-SPS1) and
the blue fluorescent PSM marker Spo2051-91-mTagBFP were sporulated and observed for
colocalization of Envy-Sps1 with the blue PSM marker.
Figure 6 Don1-GFP localization during sporulation in (A) wild type (LH1053), (B) sps1Δ
(LH1054), (C) spo77Δ (LH1056), and (D) ama1Δ (LH1055). PSMs were visualized using the
red fluorescent PSM marker pRS426-R20. For each strain, an image of a cell at late PSM
elongation stage (left) and a cell with rounded PSMs (right) are shown. All cells were imaged
live and at the same magnification; the white scale bar = 2 µm.
Figure 7 PSM development and Don1 localization in sps1Δ ama1Δ and spo77Δ ama1Δ double
mutant cells. (A) and (B) show PSM development in sps1Δ ama1Δ (LH1048) and spo77Δ ama1Δ
(LH1051), with PSMs labeled with GFP-Spo2051-91 (Nakanishi et al. 2007) and nuclei with
Htb2-mCherry (Parodi et al. 2012). Yellow arrows indicate areas where heavily invaginated

Page41of42
PSM material is seen late during spore morphogenesis. White arrows indicate nuclei. (C) and (D)
show Don1-GFP localization in sps1Δ ama1Δ (LH1057) and spo77Δ ama1Δ (LH1058) strains;
PSMs are visualized with a red fluorescent PSM marker, pRS426-R20 (Diamond et al. 2009). In
A and B, yellow arrows indicate grossly misshapen PSM structures; white arrows indicate nuclei
still contained within PSM material. In C and D, yellow arrows indicate grossly misshapen PSM
structures; white arrows indicate intact Don1 rings well after spore appearance in WT cells. Scale
bar = 2 µm.
Figure 8 SPS1 and SPO77 act together in parallel to AMA1 to affect Ssp1 stability and
phosphorylation. Quantitation of PSM initiation (A) and PSM closure (B) in wild type (LH917),
sps1Δ (LH1047), spo77Δ (LH1049), ama1Δ (LH1052), sps1Δ spo77Δ (LH1050), sps1Δ ama1Δ
(LH1048) and spo77Δ ama1Δ (LH1051) cells. In (A), cells were scored for PSM initation and
any cell that had forming PSMs were counted as intitiated. In (B), cells that had PSMs were
counted as either closed (if their PSMs were rounded) or open. Cells were considered to have
closed PSMs if the PSMs were rounded. Cells were counted as having open PSMs if PSMs were
present and not rounded; hyperelongated PSMs were counted as open. (C) SPS1 and SPO77 are
required for proper Ssp1 steady state levels. Ssp1-13x-myc levels were assayed by
immunblotting, from lysates made from samples taken during sporulation, using Ssp1-myc in
wild type (LH1027), sps1Δ (LH1028), spo77Δ (LH1030), ama1Δ (LH1029), sps1Δ ama1Δ
(LH1031) and spo77Δ ama1Δ (LH1032) cells. Pgk1 was assayed as a loading control. (D) Blots
from (C) were quantified by normalizing Ssp1-13x-myc signal to the Pgk1 signal (see Materials
and Methods for details). (E) Kinetics of meiosis, as assayed using Htb2-mCherry, for the
cultures used in 8C. (F) Relative protein stability of Ssp1was assayed in wild type (LH1027),

Page42of42
sps1Δ (LH1028), and from sporulating cells. Cycloheximide (CHX) was added to cells which
were in sporulation media at 8 hours, and samples were withdrawn at the indicated elapsed time
after CHX addition. Tub1 was used as a loading control to normalize Ssp1-myc abundance. A p-
value of 0.049 was calculated using the ANCOVA statistic, indicating a significant difference
between the rates of Ssp1-myc loss in the WT and sps1Δ backgrounds. (G) Ssp1 is in a complex
with Sps1. Immunoprecipitation experiments were carried out using synchronously sporulating
cultures of wild type (LH902), Ssp1-13x-myc (LH1027), sfGFP-Sps1 (LH986), Ssp1-13x-
myc/sfGFP-Sps1 (LH1034) cells. (H) An aliquote of the lysates from the 10 hour time point
from the blots in 8C were run on a Phos-tag™ gel to separate the different phosphor-isoforms of
Ssp1. (I) Model of the relationship between SPS1, SPO77, and AMA1. See discussion for details.

TABLE 1: Don1-GFP Persistence in Cells with Closed PSMs Strain % of cells with Puncta n= Fisher’s Exact p-value WT (LH1053) 8.8 103 N/A sps1∆ (LH1054) 71.7 99 <0.0001 spo77∆ (LH1056) 77.6 85 <0.0001 ama1∆ (LH1055) 88.1 84 <0.0001

B
30%
25%
20%
15%
10%
5%
0% +pSPO77
+pSTP2
Spor
ulat
ion
Effic
ienc
y
+vector
60%
40%
20%
0% YGPM-4k18
YGPM-27a08
Spor
ulat
ion
Effic
ienc
y
80%
YGPM-1j19
YGPM-30n09
100%
p < 0.0001 p < 0.001
C D
0%
20%
40%
60%
80%
100%
% o
f Cel
ls w
ith S
pore
(s)
SPS1 sps1* Δ sps1* Δsps1*
* p = 0.0135
*
A
SPS1 SPS1 SPS1 sps1* Δ Δ
IsolateLibrary
DNA
TransformYeast
SporulateYeast
Count Spores
IsolatePossibleHits for
Validation
RescreenHits withStandardMethods
CloneIndividual
Genes
TransformYeast
CountSpores
1588Yeast
Strains
1588Yeast
Strains
1588Yeast
Strains
1588pGP564
Plasmids
39Yeast
Strains
39Yeast
Strains
TenpRS423
Plasmids
TenpRS423
Plasmids
TwopRS423
Plasmids
Figure 1

A
60%
40%
20%
0%
sps1ΔWT
Spor
ulat
ion
Effic
ienc
y
80%
spo77Δ sps1Δspo77Δ
100%
stp2Δ
p < 0.0001 C
0%10%20%30%40%50%60%70%
sps1Δ
+vector sps1Δ
+pSPO77 sps1Δ
+pSPS1
% C
ells
with
Spo
re(s
)
0%10%20%30%40%50%60%70%
spo77Δ+vector
spo77Δ+pSPS1
spo77Δ+pSPO77
% C
ells
with
Spo
re(s
)
B
Figure 2

sps1Δ
PS
MH
isto
ne
Me
rge
DIC
C
spo77Δ
PS
MH
isto
ne
Me
rge
DIC
B
PS
M
His
ton
e
Me
rge
DIC
A i ii iii iv v vi vii viii
WT
Figure 3
WT sp 1Δ sp 77Δ
Nucle
iP
SM
B
PS
M P
eri
mete
r S
ize (
µm
)
* * *
7.0
6.0
5.0
4.0
3.0
2.0
1.0
0.0 W
Tsps1Δ
8.0 p < 0.0001
spo77Δ
sps1Δspo77Δ
spo71Δ
*
0
0.5
1.0
1.5
2.0
2.5
3.0
3.5
4.0
WT
sps1Δspo77Δ
sps1Δspo77Δ
Nucle
i C
aptu
re
d pe
r A
scus
C p < 0.007 *
*
sp1Δ
p77Δ
DIC
Merg
eH
isto
ne
PS
MA D
Figure 4

En
vy-S
ps1
PS
MM
erg
eD
IC
Early Elongation Mature Spore
Figure 5

ama1Δ
Do
n1
P
SM
D
IC
WT sps1Δ spo77Δ
Merg
e
A B C D
Figure 6

sps1Δ am
a1Δ
PS
M
His
tone
M
erg
e D
IC
iii iv v P
SM
H
isto
ne
Me
rge
DIC
spo77Δ am
a1Δ
A
BD
on1
PS
M D
IC
Me
rge
Do
n1
PS
M D
IC
Me
rge
ii i C
D
Figure 7

0%
20%
40%
60%
80%
100%
0 2 4 6 8 10 12
%of
cel
ls in
MII
Hours in SPO
WT
sps1
ama1
spo77
ama1 sps1
ama1 spo77
sps1spo77
ama1WT
untagged
Ssp1-Myc -10hr
0%
20%
40%
60%
80%
0 2 4 6 8%
of c
ells
with
PSM
Initi
atio
n
WT
sps1Δ
ama1Δama1Δ sps1Δ
spo77Δsps1Δ spo77Δ
ama1Δ spo77Δ
Hours in Spo
0%
20%
40%
60%
80%
100%
0 2 4 6 8 10 12
Cel
ls w
ith c
lose
d PS
Ms WT
sps1Δ
ama1Δ
ama1Δsps1Δ
spo77Δsps1Δ spo77Δ
ama1Δspo77Δ
unin
itiate
din
itiate
dE
longate
dH
yper e
longate
dC
losed
AA
B D
C
E
Hours in Spo
F
Phos-T
ag
G
Ssp1
PSM Closure
AMA1 SPS1/SPO77-GFP-myc-GFP-GFP-myc
TCA Prep-GFP
TCA Prep
WT Ssp1-M
yc
sfGFP-S
ps1
sfGFP-S
ps1
Ssp1-M
yc H Iy = - 0.0002x + 0.9787
R² = 0.0345
y = - 0.0055x + 0.9747
R² = 0.7542
0
0.2
0.4
0.6
0.8
1.0
1.2
0 10 20 30 40 50
WT
sps1
Rel
ativ
e pr
otei
n le
vel t
o T=
0(S
sp1-
myc
sig
nal/T
ub1
sign
al)
Minutes post-CHX
sps1spo77
ama1WT
ama1 sps1
ama1 spo77
Myc
Myc
Pgk1
Pgk1
Ssp1-Myc - 14hrSsp1-Myc - 10hr
sps1spo77
ama1WT
ama1 sps1
ama1 spo77
00.20.40.60.81.01.21.41.61.8
00.20.40.60.81.01.21.41.61.8
WT
sps1
spo77
ama1
sps1
ama1
spo77
ama1 W
T
sps1
spo77
ama1
sps1
ama1
spo77
ama1
Ssp1
/Pgk
1 ra
tio
(nor
mal
ized
to W
T 10
hr)
Ssp1
/Pgk
1 ra
tio
(nor
mal
ized
to W
T 10
hr)
Figure 8