Embed Size (px)
Citation preview

Timer Digest
May 14, 2018 May 14, 2018
Timer Digest
(Page Down)Copyright © 2018, Timer Digest. All Rights Reserved.
Wall Street Sentiment
www.timerdigest.com
ISSUE 655
Mark Young
Timer Digest
May 14, 2018
(Page Down)
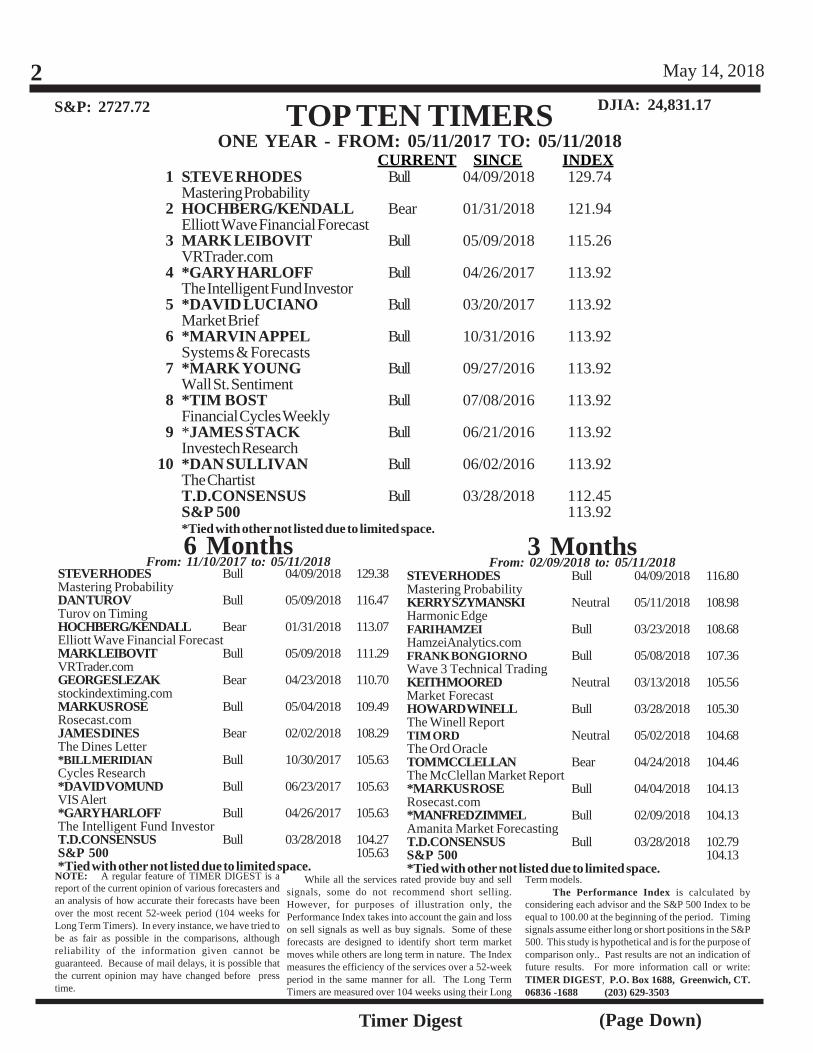
NOTE: A regular feature of TIMER DIGEST is areport of the current opinion of various forecasters andan analysis of how accurate their forecasts have beenover the most recent 52-week period (104 weeks forLong Term Timers). In every instance, we have tried tobe as fair as possible in the comparisons, althoughreliability of the information given cannot beguaranteed. Because of mail delays, it is possible thatthe current opinion may have changed before presstime.
While all the services rated provide buy and sellsignals, some do not recommend short selling.However, for purposes of illustration only, thePerformance Index takes into account the gain and losson sell signals as well as buy signals. Some of theseforecasts are designed to identify short term marketmoves while others are long term in nature. The Indexmeasures the efficiency of the services over a 52-weekperiod in the same manner for all. The Long TermTimers are measured over 104 weeks using their Long
CURRENT SINCE INDEX
6 MonthsFrom: 11/10/2017 to: 05/11/2018
S&P: 2727.72 DJIA: 24,831.17
3 MonthsFrom: 02/09/2018 to: 05/11/2018
2
.
TOP TEN TIMERSONE YEAR - FROM: 05/11/2017 TO: 05/11/2018
Term models. The Performance Index is calculated byconsidering each advisor and the S&P 500 Index to beequal to 100.00 at the beginning of the period. Timingsignals assume either long or short positions in the S&P500. This study is hypothetical and is for the purpose ofcomparison only.. Past results are not an indication offuture results. For more information call or write:TIMER DIGEST, P.O. Box 1688, Greenwich, CT.06836 -1688 (203) 629-3503
1
2
3
4
5
6
7
8
9
10
STEVE RHODES Bull 04/09/2018 129.38Mastering ProbabilityDAN TUROV Bull 05/09/2018 116.47Turov on TimingHOCHBERG/KENDALL Bear 01/31/2018 113.07Elliott Wave Financial ForecastMARK LEIBOVIT Bull 05/09/2018 111.29VRTrader.comGEORGE SLEZAK Bear 04/23/2018 110.70stockindextiming.comMARKUS ROSE Bull 05/04/2018 109.49Rosecast.comJAMES DINES Bear 02/02/2018 108.29The Dines Letter*BILL MERIDIAN Bull 10/30/2017 105.63Cycles Research*DAVID VOMUND Bull 06/23/2017 105.63VIS Alert*GARY HARLOFF Bull 04/26/2017 105.63The Intelligent Fund InvestorT.D.CONSENSUS Bull 03/28/2018 104.27S&P 500 105.63*Tied with other not listed due to limited space.
STEVE RHODES Bull 04/09/2018 129.74Mastering ProbabilityHOCHBERG/KENDALL Bear 01/31/2018 121.94Elliott Wave Financial ForecastMARK LEIBOVIT Bull 05/09/2018 115.26VRTrader.com*GARY HARLOFF Bull 04/26/2017 113.92The Intelligent Fund Investor*DAVID LUCIANO Bull 03/20/2017 113.92Market Brief*MARVIN APPEL Bull 10/31/2016 113.92Systems & Forecasts*MARK YOUNG Bull 09/27/2016 113.92Wall St. Sentiment*TIM BOST Bull 07/08/2016 113.92Financial Cycles Weekly*JAMES STACK Bull 06/21/2016 113.92Investech Research*DAN SULLIVAN Bull 06/02/2016 113.92The ChartistT.D.CONSENSUS Bull 03/28/2018 112.45S&P 500 113.92*Tied with other not listed due to limited space.
STEVE RHODES Bull 04/09/2018 116.80Mastering ProbabilityKERRY SZYMANSKI Neutral 05/11/2018 108.98Harmonic EdgeFARI HAMZEI Bull 03/23/2018 108.68HamzeiAnalytics.comFRANK BONGIORNO Bull 05/08/2018 107.36Wave 3 Technical TradingKEITH MOORED Neutral 03/13/2018 105.56Market ForecastHOWARD WINELL Bull 03/28/2018 105.30The Winell ReportTIM ORD Neutral 05/02/2018 104.68The Ord OracleTOM MCCLELLAN Bear 04/24/2018 104.46The McClellan Market Report*MARKUS ROSE Bull 04/04/2018 104.13Rosecast.com*MANFRED ZIMMEL Bull 02/09/2018 104.13Amanita Market ForecastingT.D.CONSENSUS Bull 03/28/2018 102.79S&P 500 104.13*Tied with other not listed due to limited space.
Timer Digest
May 14, 2018
(Page Down)
3
Next Issue to be postedJune 4, 2018
Summary and OutlookSince the April 23 issue, the
S&P 500 index has gained2.16%, on a price basis. Year-to-date, the index is now up
2.02%. Economic reports have beenfirm over the past three weeks. The AprilEmployment Report was short of esti-mates; but quite respectable, given theproximity to full employment and re-gional skills mismatch with job open-ings. In addition, there was an upwardrevision to March of 32,000. The firstestimate of Q1 2018 GDP surpassedestimates (2.3% vs. 2.0% est.) withsupport from a sharp increase in ser-vice spending. On the manufacturingside, the April ISM Manufacturing In-dex was below consensus and theMarch figure (57.3 vs. 58.6 est. and59.3 prev.); due to tariff influences andlonger delivery times. March FactoryOrders increased 1.6% and Februaryrevised upward by 0.4. Durable GoodsOrders also rose (2.6%) with an up-ward revision to February (0.4). And,the ISM Non-Manufacturing Indexsoftened in April to 56.8 from 58.8.Inflation data were moderate in April.PPI-FD rose 0.2% (+2.06% year-over-year). And, CPI rose 0.2%, while CoreCPI (ex-Energy) was up just 0.1%. Pre-liminary Consumer Sentiment was un-changed in May (98.8 vs. 98.8 April)Expectations were moderate for con-sumer spending and inflation. AprilConsumer Confidence remained strongat 128.7.
The May 1 - 2 FOMC meeting an-nouncement contained no change inrates. The Fed added some latitude toits 2% inflation target by including thewords “symmetric objective” in the tar-get description.
Internationally, geo-political situa-tions remain unchanged (Russia),somewhat worse (Iran), and more op-timistic (summit with North Korea com-bined with the recent prisoner release.
Technically, the market has im-proved with the recent advance abovetrendline resistance established by adeveloping triangle formation. Theresolution of a short-term overboughtcondition along with resistance at pre-vious highs (Feb/Mar and Jan) remainthe next obstacles. Sentiment readingsare still neutral; and seasonality becomesless favorable over several months.
Currently, the Top Ten Consen-sus is Bullish with 9 Bulls, and 1Bear.
Steve Rhodes of MasteringProbability is on an April 9, Buysignal. He suggested someNASDAQ-related contracts havemoved toward overbought readingsbased on shorter-term chartconfigurations.
Steven Hochberg and PeterKendall of The Elliott WaveFinancial Forecast are on aJanuary 31, Sell signal. Theysuggested the current short-termrally could extend to fill price chartgaps left open during the decline inlate March.
Mark Leibovit ofVRTrader.com is on a May 9, Buysignal. He said major indices resolvedtheir price chart formations with thisweek’s rally above respective declin-ing trend lines.
Gary Harloff of TheIntelligent Fund Investor is on anApril 26, 2017, Buy signal. Hecurrently favors allocation toEnergy, Basic Materials, PreciousMetals, and Japan.
David Luciano of MarketBrief is on a March 20, 2017 Buysignal. He continues to suggest thatthe Dow Industrials might driftgenerally higher from their April 2low.
Marvin Appel of Systems &Forecasts is on an October 31,2016 Buy signal. He is encouragedby leadership potential from theTechnology sector in the context ofless favorable seasonality.
Mark Young of Wall St.Sentiment is on a September 27,Buy signal. He noted the prospectfor a continuation of frequent near-term directional changes within thelarger uptrend.
Tim Bost of Financial CyclesWeekly is on a July 8, 2016 Buysignal. He had forecast anextension of market volatility basedon a series of planetary events in lateApril and early May.
James Stack of InvestechResearch is on a June 21, 2016 Buysignal. He noted technical conditionshave improved; but remains concernedabout inflation-driven interest ratehikes by the Federal Reserve.
Dan Sullivan of The Chartist ison a June 2, 2016 Buy signal. Hementioned several factors thatcontribute to the wall of worrytypically ascended by bull markets.
The comments which follow areprovided in response to subscriber re-quests that previous “Timers of theYear” be monitored on a continuingbasis, despite their absence from thecurrent rankings.
George Dagnino of Peter DagPortfolio Strategy is Neutral. He said:“ Emerging markets credit risk is risingas the dollar strengthens. Market mo-mentum remains weak – a sign of cau-tion.”
George Slezak ofstockindextiming.com is Bearish. Hiscurrent forecast includes the prospectfor a generally declining market into theend of May.
David Vomund of VIS Alert isBullish. He allows for consolidation ofa short-term overbought condition; butsaid: “The broader market strength canalso be seen in our very strong stocks-only Advance Decline Line. This indi-cator reached a new high on Friday!”
Peter Eliades of Stock MarketCycles is Bearish. He said: “We con-tinue to believe that the [Sign of theBear] signal will indeed prove to be suc-cessful and, in fact, resolve itself with afinal decline far greater than the arbi-trary 20% decline used to measure a suc-cessful signal.”
Please check the Hotline for thelatest updates. The Hotline is updatedevery Wednesday and Saturday by7:00 p.m. E.T., with special updatesas necessary.
Timer Digest
May 14, 20184
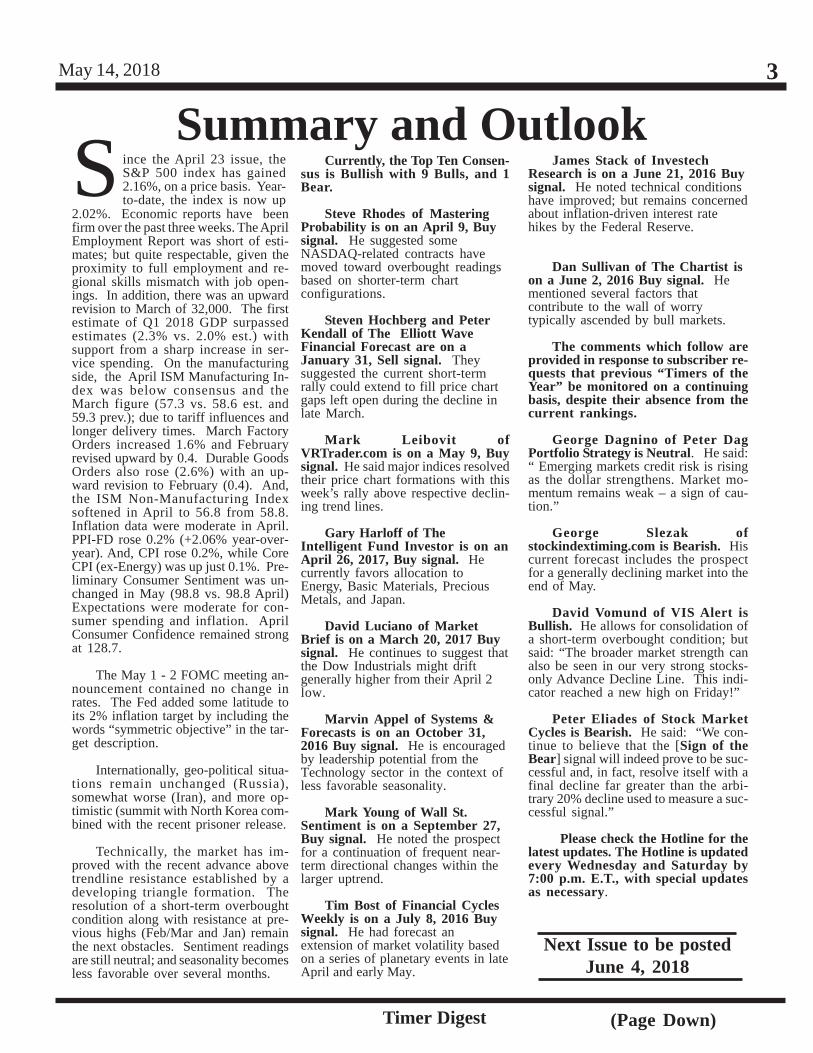
Top Five Gold Timers
Top Five Bond TimersCurrent Since Index
S&P 500 INDEX 2727.72Top Ten Long Term Timers
FRANK BONGIORNO Bear 04/17/2018 113.62Wave 3 Technical TradingHOCHBERG/KENDALL Bear 06/29/2017 111.21Elliott Wave Financial ForecastKERRY SZYMANSKI Bear 03/26/2018 109.45Harmonic EdgeBILL MERIDIAN Bear 09/28/2017 108.59Cycles ResearchSTEVE TODD Bull 04/26/2018 108.04The Todd Market ForecastT.D.CONSENSUS Bear 01/05/2018 105.95T-BOND INDEX 95.27
From: 05/11/2017 To: 05/11/2018
*MICHAEL CINTOLO Bull 04/08/2016 132.13The Cabot Growth Investor*ERIN SWENLIN Bull 04/01/2016 132.13Decision Point Blog on StockCharts.com*GEORGE DAGNINO Bull 03/31/2016 132.13Peter Dag Portfolio Strategy*KEITH MOORED Bull 07/10/2015 132.13Market Forecast*HOWARD WINELL Bull 12/17/2014 132.13The Winell Report*PHILIP MICHALEK Bull 07/05/2012 132.13Focused Growth Investor*STEPHEN LEEB Bull 05/03/2012 132.13The Complete Investor*TIM BOST Bull 11/04/2010 132.13Financial Cycles Weekly*BERNIE SCHAEFFER Bull 07/02/2009 132.13Schaeffer’s Daily Bulletin*MARVIN APPEL Bull 06/03/2009 132.13Systems & ForecastsT.D.CONSENSUS Bull 02/19/2016 132.13S&P 500 132.13* Tied with others not listed due to limited space.
From: 05/11/2016 To: 05/11/2018
In the recent two-year period, the S&P 500 rallied from aFebruary 2016 low to a June high, corrected with the Brexitvote, recovered sharply to a new high (8/15/16); consolidatedinto the election; rallied to the March 1, 2017 high; consoli-dated to mid-May; rallied to a new highs, consolidated in Au-gust, extended gains to more record highs in January 2018,then a sharp decline in early February was followed by mul-tiple direction changes and recent low in early April. Seasonal-ity is less favorable; and sentiment is mixed.
Currently, The Long Term Consensus is Bullish.
Michael Cintolo is Bullish. He said: “the correctionthat started in late January has been relatively normal and putin a firm foundation for a new advance.”
Erin Swenlin is Bullish. She said: “SPY is very positivein this time frame. And the bull market risingtrend channel remains intact.”
George Dagnino is Bullish. He said earnings per shareare up about 16% year-over-year; and credit spreads remainunder control.
Gold, basis the June 2018 future, declined beneath the lowerend of its multi-month range and rebounded slightly. Funda-mentally, geo-political conditions are tentatively less hostile; andthere is selective upward pressure on prices. Technically, goldis positioned to once again test $1300 support as it seeks outthe next trend. Support for the June contract remains $1300 -$1310, then $1275, and $1250. Resistance is $1350 - $1360,$1375, and $1400.
The Consensus is currently Bearish.
Steve Todd is Bullish. He suggested gold’s recent chartpattern confirmed the probability for a tradable rally.
Steve Rhodes is Bullish. His longer-term view con-tains: “anticipated price projections in the 2090 area, a doublingof price from the November 2015 low.”
Hochberg/Kendall are Bearish. They said: “Wave (v)will be a decline that draws gold below $1300 as prices traceout five waves down from the $1365.36 high on April 11.”
COMEX GOLD 1330.20
The bond market, basis the June 2018 T-Bond future, hasdrifted above the 142 level in the recent period. Fundamentally,economic conditions reflect an ongoing growth trend and theFederal Reserve appears to have a conservative view of policyadjustment. Technically, short-term indicators are moderatelyoversold. Support for the June future is still 142, then 140, and138 10/32. Resistance is 144, 147, and 150.
The Consensus is currently Bearish.
Frank Bongiorno is Bearish. He said: “Ideally the Bondsshould trace out weakness through the April low to trace outwave v of 5, to end the decline .”
Hochberg/Kendall are Bearish. They suggested a five-wave decline may be near completion; followed by another bearmarket rally.
Kerry Szymanski is Bearish. He suggested upside po-tential appears limited; and said: “The weekly oscillator is Bear-ish, and the daily oscillator is Bullish overbought.”
STEVE TODD Bull 05/10/2018 121.76The Todd Market ForecastSTEVE RHODES Bull 03/21/2018 120.93Mastering ProbabilityHOCHBERG/KENDALL Bear 02/02/2018 115.82Elliott Wave Financial ForecastDAN TUROV Bear 04/24/2018 114.79Turov on TimingBARRY ROSEN Bear 04/23/2018 113.22Fortucast ETF TimerT.D.CONSENSUS Bear 04/13/2018 97.79CMX GOLD INDEX 108.19
T-BOND INDEX 142.18
(Page Down)
From: 05/11/2017 To: 05/11/2018
Timer Digest
May 14, 2018 5
W hen Mark Steward Young, publisherof the Wall Street Sentiment Newslet-ters and founder of Traders-Talk.comgarnered the honor of being named 2017Timer of the Year, it was less by goodfortune and more by dint of many, manyyears of experience in financial markets.Even as a child, Mark learned to readthe now antiquated ticker-tape. By thetime Mr. Young was studying Econom-ics at Northwestern University, he wasalso trading his own account; firststocks, then options, and then indexoptions. After a summer of activeoptions trading ballooned Mr. Young’slow five-figure trading account intorespectable six-figure fund, his fate wassealed.
During his time trading in school,Mr. Young studied the work of hisfather’s close friend, the legendarySedge Coppock, as well as suchluminaries as Stan Weinstein, BenGarside, Peter Eliades, and others, in asearch for consistent trading results.After graduation, Mr. Young became astock broker with Legg Mason, wherehe learned the utility—and limitations—of value investing.
After the Crash of 1987, theshortcomings of fundamental analysisbecame clear, and his skills withtechnical analysis and market timingbegan opening doors. In 1991, hebecame a registered investment advisorand started his own firm. In addition tomanaging money for clients, Mr. Youngwould occasionally share his uniquemarket analysis with his friends andcolleagues in the industry. When afellow professional money manageroffered him a substantial sum toprovide this analysis on a regular basis,a new business wing was added;independent research.In the early 1990’s, as onlineopportunities became evident to manyforward-thinking traders and investors,Mr. Young became a prominent onlinecontributor and commentator, whichprovided him a unique opportunity totrack and study investor psychology, avery promising addition to his technicalanalysis.
It was around this time thatDecisionPoint founder Carl Swenlinasked Mr. Young to take over theadministration of what was then called
the “Fearless Forecaster SentimentPoll” on DecisionPoint. This surveycontinues now as the well-known WallStreet Sentiment Survey (which is stillpublished at StockCharts.com). Afterobserving Young’s analysis for sometime, Mr. Swenlin remarked, “I don’tknow anyone else who can wring somuch value out of sentiment data.”Using his survey data alone, Mr. Youngwas able to make uncannily accurate,day-by-day predictions for the weekahead. He then piled on three moreproprietary, static-pool surveys, andbuilt a successful stand-alone tradingmodel.
Mr. Young then followed up bytaking over the reins of the longestrunning online technical analysiscommunity, The Fearless Forecasters,and giving them a home at Traders-Talk.com, a diverse online communityfor traders and investors. These activemessage boards at Traders-Talk.comalso provided an opportunity to performdaily polls of (and for) members. True toform, from the poll data and siteactivity, Mr. Young was able to developseveral new sentiment indicators, somewith prodigious predictive power. Somereaders may already be familiar with his“Tipping Point” signals as well as theFully Long/Fully Short indicator oftrader sentiment. Both indicators havebeen tremendously valuable.
Because of the dynamism ofmodern equity markets, as well as theever-changing types of investorsdominating differing size segments ofthe stock market landscape, Mr. Youngunderstood that it was imperative toconstantly scrutinize and weigh thevalue and predictive nature of differentmeasures of speculative and investorsentiment, and if none exist for animportant investor group, to createthem himself.
In addition to his message boardsentiment indicators, Mr. Youngdeveloped the NAAIM Delta Tool,derived from the National Associationof Active Investment Managers weeklysurvey data. Also, Mr. Young is creatorof the Wall St. Sentiment OptionsOscillator indicator, derived from dollar-weighted put/call data.
It has been said that what everyonealready knows isn’t worth knowing. MarkYoung’s primary goal is to providesophisticated traders with a window intoinvestor psychology that no one elsehas—to give his subscribers an edge andthe confidence get and stay on the rightside of the stock market. Expert traders willtell you that 90% of trading success isrelated to market psychology. Theinformation provided in the Wall StreetSentiment publications gives a current &accurate read of not only public sentiment,but the attitudes and concerns of the typesof people who actually move the financialmarkets.
SERVICES & SUBSCRIPTIONINFORMATION:Wall Street Sentiment Weekend ReportThe Wall Street Sentiment Weekend Reportis a two-part basic-level weekly newsletterfor investors and less active tradersproviding a rundown of all relevantsentiment sectors as well as theintermediate and long-term technicalcondition of the stock market. Includes aWeekly ETF Trading Model. This service isinvaluable for minimizing losses in BearMarkets and staying in Bull Markets.Price: $99 per year
Wall Street Sentiment Daily LetterWall Street Sentiment Daily providesanalysis of the very latest from ourproprietary Options Oscillator, Fully Long/Fully Short indicator, NAAIM Delta, VIX P/C, as well as all relevant sentimentindicators as they become available, bethey surveys, polls, options data, ortechnical indicators that have sentimentimplications, like our “Best Fade” indicator.We also monitor systemic risk inCommercial Paper, daily. 3 trading modelsare included in this twice daily letter.Price: $39.99 month, $399 per year
Wall Street Sentiment Premium ServiceThe Wall Street Sentiment Premium Serviceprovides all of the above, PLUS intra-dayupdates with the most current actionablesentiment data, as well as specific tradeideas for day traders of the S&P eminifutures, derived from our best sentimentindicators as well as technical analysis.Two models are traded.
For more information or to request a freetrial, go to www.WallStreetSentiment.com/trial.htmor call 859-393-3335.
(Page Down)
Wall Street Sentiment
Timer Digest
May 14, 2018
(Page Down)
6
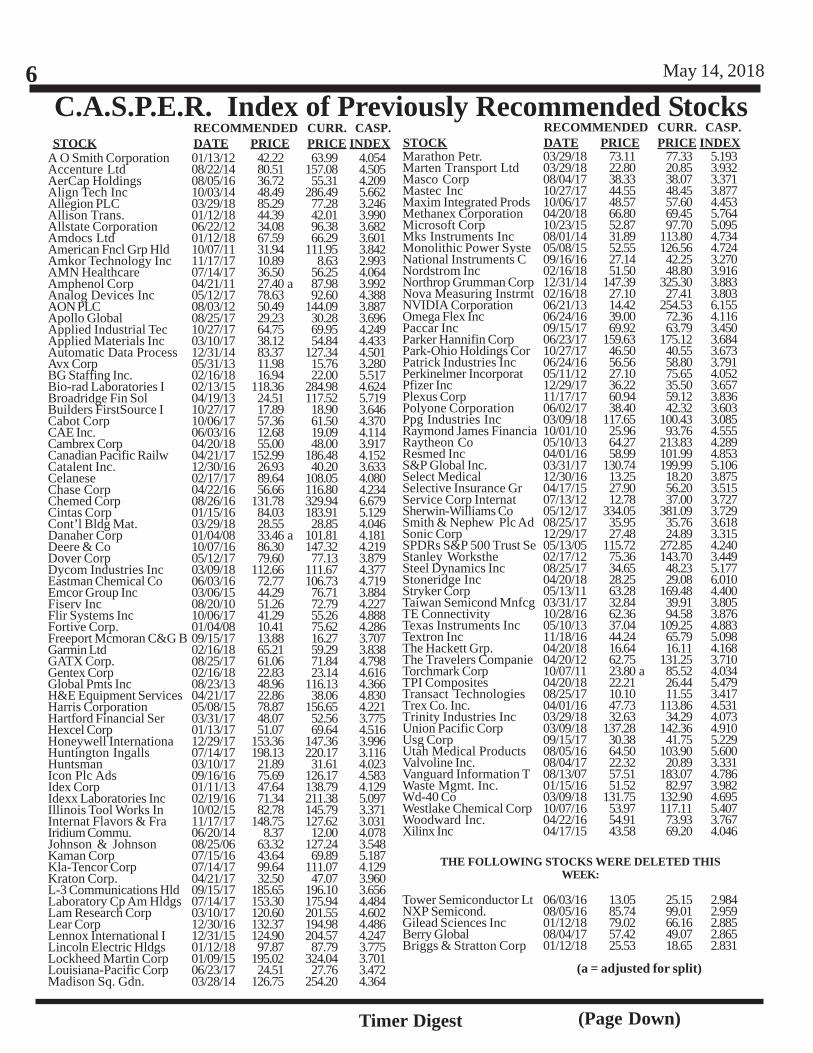
C.A.S.P.E.R. Index of Previously Recommended StocksRECOMMENDED CURR. CASP.
STOCK DATE PRICE PRICE INDEXA O Smith Corporation 01/13/12 42.22 63.99 4.054Accenture Ltd 08/22/14 80.51 157.08 4.505AerCap Holdings 08/05/16 36.72 55.31 4.209Align Tech Inc 10/03/14 48.49 286.49 5.662Allegion PLC 03/29/18 85.29 77.28 3.246Allison Trans. 01/12/18 44.39 42.01 3.990Allstate Corporation 06/22/12 34.08 96.38 3.682Amdocs Ltd 01/12/18 67.59 66.29 3.601American Fncl Grp Hld 10/07/11 31.94 111.95 3.842Amkor Technology Inc 11/17/17 10.89 8.63 2.993AMN Healthcare 07/14/17 36.50 56.25 4.064Amphenol Corp 04/21/11 27.40 a 87.98 3.992Analog Devices Inc 05/12/17 78.63 92.60 4.388AON PLC 08/03/12 50.49 144.09 3.887Apollo Global 08/25/17 29.23 30.28 3.696Applied Industrial Tec 10/27/17 64.75 69.95 4.249Applied Materials Inc 03/10/17 38.12 54.84 4.433Automatic Data Process 12/31/14 83.37 127.34 4.501Avx Corp 05/31/13 11.98 15.76 3.280BG Staffing Inc. 02/16/18 16.94 22.00 5.517Bio-rad Laboratories I 02/13/15 118.36 284.98 4.624Broadridge Fin Sol 04/19/13 24.51 117.52 5.719Builders FirstSource I 10/27/17 17.89 18.90 3.646Cabot Corp 10/06/17 57.36 61.50 4.370CAE Inc. 06/03/16 12.68 19.09 4.114Cambrex Corp 04/20/18 55.00 48.00 3.917Canadian Pacific Railw 04/21/17 152.99 186.48 4.152Catalent Inc. 12/30/16 26.93 40.20 3.633Celanese 02/17/17 89.64 108.05 4.080Chase Corp 04/22/16 56.66 116.80 4.234Chemed Corp 08/26/16 131.78 329.94 6.679Cintas Corp 01/15/16 84.03 183.91 5.129Cont’l Bldg Mat. 03/29/18 28.55 28.85 4.046Danaher Corp 01/04/08 33.46 a 101.81 4.181Deere & Co 10/07/16 86.30 147.32 4.219Dover Corp 05/12/17 79.60 77.13 3.879Dycom Industries Inc 03/09/18 112.66 111.67 4.377Eastman Chemical Co 06/03/16 72.77 106.73 4.719Emcor Group Inc 03/06/15 44.29 76.71 3.884Fiserv Inc 08/20/10 51.26 72.79 4.227Flir Systems Inc 10/06/17 41.29 55.26 4.888Fortive Corp. 01/04/08 10.41 75.62 4.286Freeport Mcmoran C&G B 09/15/17 13.88 16.27 3.707Garmin Ltd 02/16/18 65.21 59.29 3.838GATX Corp. 08/25/17 61.06 71.84 4.798Gentex Corp 02/16/18 22.83 23.14 4.616Global Pmts Inc 08/23/13 48.96 116.13 4.366H&E Equipment Services 04/21/17 22.86 38.06 4.830Harris Corporation 05/08/15 78.87 156.65 4.221Hartford Financial Ser 03/31/17 48.07 52.56 3.775Hexcel Corp 01/13/17 51.07 69.64 4.516Honeywell Internationa 12/29/17 153.36 147.36 3.996Huntington Ingalls 07/14/17 198.13 220.17 3.116Huntsman 03/10/17 21.89 31.61 4.023Icon Plc Ads 09/16/16 75.69 126.17 4.583Idex Corp 01/11/13 47.64 138.79 4.129Idexx Laboratories Inc 02/19/16 71.34 211.38 5.097Illinois Tool Works In 10/02/15 82.78 145.79 3.371Internat Flavors & Fra 11/17/17 148.75 127.62 3.031Iridium Commu. 06/20/14 8.37 12.00 4.078Johnson & Johnson 08/25/06 63.32 127.24 3.548Kaman Corp 07/15/16 43.64 69.89 5.187Kla-Tencor Corp 07/14/17 99.64 111.07 4.129Kraton Corp. 04/21/17 32.50 47.07 3.960L-3 Communications Hld 09/15/17 185.65 196.10 3.656Laboratory Cp Am Hldgs 07/14/17 153.30 175.94 4.484Lam Research Corp 03/10/17 120.60 201.55 4.602Lear Corp 12/30/16 132.37 194.98 4.486Lennox International I 12/31/15 124.90 204.57 4.247Lincoln Electric Hldgs 01/12/18 97.87 87.79 3.775Lockheed Martin Corp 01/09/15 195.02 324.04 3.701Louisiana-Pacific Corp 06/23/17 24.51 27.76 3.472Madison Sq. Gdn. 03/28/14 126.75 254.20 4.364
RECOMMENDED CURR. CASP.STOCK DATE PRICE PRICE INDEXMarathon Petr. 03/29/18 73.11 77.33 5.193Marten Transport Ltd 03/29/18 22.80 20.85 3.932Masco Corp 08/04/17 38.33 38.07 3.371Mastec Inc 10/27/17 44.55 48.45 3.877Maxim Integrated Prods 10/06/17 48.57 57.60 4.453Methanex Corporation 04/20/18 66.80 69.45 5.764Microsoft Corp 10/23/15 52.87 97.70 5.095Mks Instruments Inc 08/01/14 31.89 113.80 4.734Monolithic Power Syste 05/08/15 52.55 126.56 4.724National Instruments C 09/16/16 27.14 42.25 3.270Nordstrom Inc 02/16/18 51.50 48.80 3.916Northrop Grumman Corp 12/31/14 147.39 325.30 3.883Nova Measuring Instrmt 02/16/18 27.10 27.41 3.803NVIDIA Corporation 06/21/13 14.42 254.53 6.155Omega Flex Inc 06/24/16 39.00 72.36 4.116Paccar Inc 09/15/17 69.92 63.79 3.450Parker Hannifin Corp 06/23/17 159.63 175.12 3.684Park-Ohio Holdings Cor 10/27/17 46.50 40.55 3.673Patrick Industries Inc 06/24/16 56.56 58.80 3.791Perkinelmer Incorporat 05/11/12 27.10 75.65 4.052Pfizer Inc 12/29/17 36.22 35.50 3.657Plexus Corp 11/17/17 60.94 59.12 3.836Polyone Corporation 06/02/17 38.40 42.32 3.603Ppg Industries Inc 03/09/18 117.65 100.43 3.085Raymond James Financia 10/01/10 25.96 93.76 4.555Raytheon Co 05/10/13 64.27 213.83 4.289Resmed Inc 04/01/16 58.99 101.99 4.853S&P Global Inc. 03/31/17 130.74 199.99 5.106Select Medical 12/30/16 13.25 18.20 3.875Selective Insurance Gr 04/17/15 27.90 56.20 3.515Service Corp Internat 07/13/12 12.78 37.00 3.727Sherwin-Williams Co 05/12/17 334.05 381.09 3.729Smith & Nephew Plc Ad 08/25/17 35.95 35.76 3.618Sonic Corp 12/29/17 27.48 24.89 3.315SPDRs S&P 500 Trust Se 05/13/05 115.72 272.85 4.240Stanley Worksthe 02/17/12 75.36 143.70 3.449Steel Dynamics Inc 08/25/17 34.65 48.23 5.177Stoneridge Inc 04/20/18 28.25 29.08 6.010Stryker Corp 05/13/11 63.28 169.48 4.400Taiwan Semicond Mnfcg 03/31/17 32.84 39.91 3.805TE Connectivity 10/28/16 62.36 94.58 3.876Texas Instruments Inc 05/10/13 37.04 109.25 4.883Textron Inc 11/18/16 44.24 65.79 5.098The Hackett Grp. 04/20/18 16.64 16.11 4.168The Travelers Companie 04/20/12 62.75 131.25 3.710Torchmark Corp 10/07/11 23.80 a 85.52 4.034TPI Composites 04/20/18 22.21 26.44 5.479Transact Technologies 08/25/17 10.10 11.55 3.417Trex Co. Inc. 04/01/16 47.73 113.86 4.531Trinity Industries Inc 03/29/18 32.63 34.29 4.073Union Pacific Corp 03/09/18 137.28 142.36 4.910Usg Corp 09/15/17 30.38 41.75 5.229Utah Medical Products 08/05/16 64.50 103.90 5.600Valvoline Inc. 08/04/17 22.32 20.89 3.331Vanguard Information T 08/13/07 57.51 183.07 4.786Waste Mgmt. Inc. 01/15/16 51.52 82.97 3.982Wd-40 Co 03/09/18 131.75 132.90 4.695Westlake Chemical Corp 10/07/16 53.97 117.11 5.407Woodward Inc. 04/22/16 54.91 73.93 3.767Xilinx Inc 04/17/15 43.58 69.20 4.046
Tower Semiconductor Lt 06/03/16 13.05 25.15 2.984NXP Semicond. 08/05/16 85.74 99.01 2.959Gilead Sciences Inc 01/12/18 79.02 66.16 2.885Berry Global 08/04/17 57.42 49.07 2.865Briggs & Stratton Corp 01/12/18 25.53 18.65 2.831
(a = adjusted for split)
THE FOLLOWING STOCKS WERE DELETED THISWEEK:
Timer Digest
May 14, 2018
(Page Down)
7
Casper CurrentRank Rank Price Symbol Security Name
Casper CurrentRank Rank Price Symbol Security Name
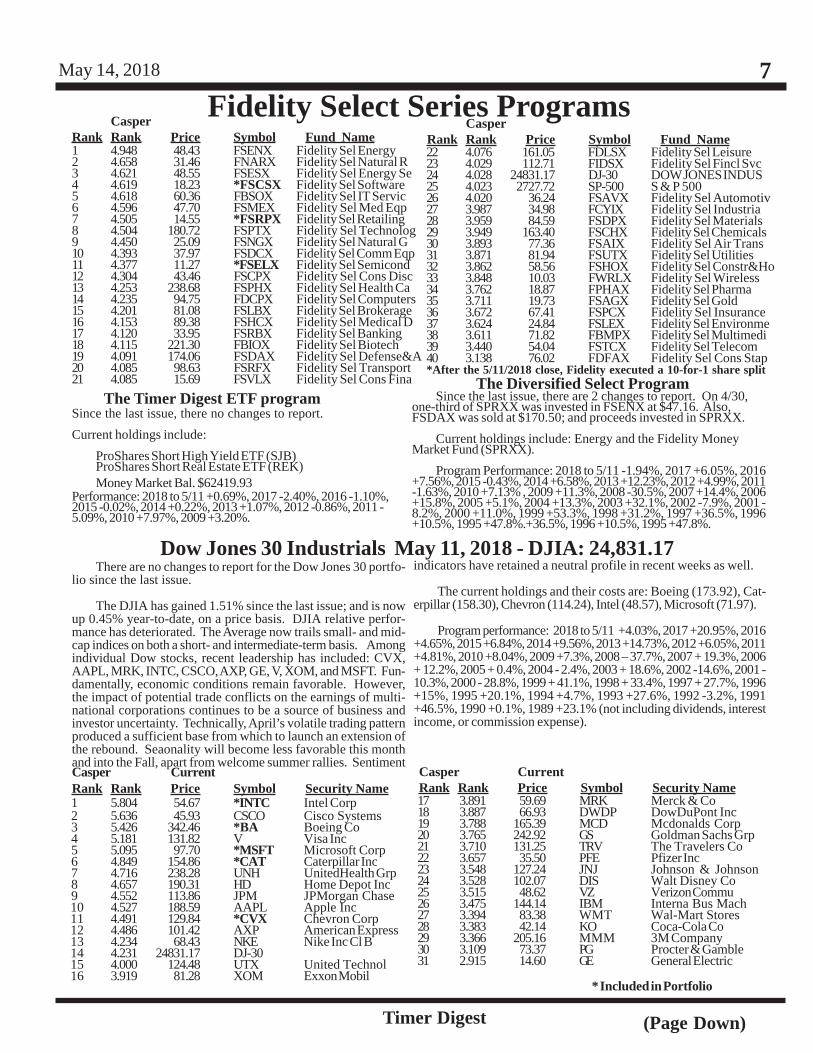
Fidelity Select Series Programs
There are no changes to report for the Dow Jones 30 portfo-lio since the last issue.
The DJIA has gained 1.51% since the last issue; and is nowup 0.45% year-to-date, on a price basis. DJIA relative perfor-mance has deteriorated. The Average now trails small- and mid-cap indices on both a short- and intermediate-term basis. Amongindividual Dow stocks, recent leadership has included: CVX,AAPL, MRK, INTC, CSCO, AXP, GE, V, XOM, and MSFT. Fun-damentally, economic conditions remain favorable. However,the impact of potential trade conflicts on the earnings of multi-national corporations continues to be a source of business andinvestor uncertainty. Technically, April’s volatile trading patternproduced a sufficient base from which to launch an extension ofthe rebound. Seaonality will become less favorable this monthand into the Fall, apart from welcome summer rallies. Sentiment
1 5.804 54.67 *INTC Intel Corp 2 5.636 45.93 CSCO Cisco Systems 3 5.426 342.46 *BA Boeing Co 4 5.181 131.82 V Visa Inc 5 5.095 97.70 *MSFT Microsoft Corp 6 4.849 154.86 *CAT Caterpillar Inc 7 4.716 238.28 UNH UnitedHealth Grp 8 4.657 190.31 HD Home Depot Inc 9 4.552 113.86 JPM JPMorgan Chase 10 4.527 188.59 AAPL Apple Inc 11 4.491 129.84 *CVX Chevron Corp 12 4.486 101.42 AXP American Express 13 4.234 68.43 NKE Nike Inc Cl B 14 4.231 24831.17 DJ-30 15 4.000 124.48 UTX United Technol 16 3.919 81.28 XOM Exxon Mobil
17 3.891 59.69 MRK Merck & Co18 3.887 66.93 DWDP DowDuPont Inc19 3.788 165.39 MCD Mcdonalds Corp20 3.765 242.92 GS Goldman Sachs Grp21 3.710 131.25 TRV The Travelers Co22 3.657 35.50 PFE Pfizer Inc23 3.548 127.24 JNJ Johnson & Johnson24 3.528 102.07 DIS Walt Disney Co25 3.515 48.62 VZ Verizon Commu26 3.475 144.14 IBM Interna Bus Mach27 3.394 83.38 WMT Wal-Mart Stores28 3.383 42.14 KO Coca-Cola Co29 3.366 205.16 MMM 3M Company30 3.109 73.37 PG Procter & Gamble31 2.915 14.60 GE General Electric
Dow Jones 30 Industrials May 11, 2018 - DJIA: 24,831.17
CasperRank Rank Price Symbol Fund Name
CasperRank Rank Price Symbol Fund Name
1 4.948 48.43 FSENX Fidelity Sel Energy2 4.658 31.46 FNARX Fidelity Sel Natural R3 4.621 48.55 FSESX Fidelity Sel Energy Se4 4.619 18.23 *FSCSX Fidelity Sel Software5 4.618 60.36 FBSOX Fidelity Sel IT Servic6 4.596 47.70 FSMEX Fidelity Sel Med Eqp7 4.505 14.55 *FSRPX Fidelity Sel Retailing8 4.504 180.72 FSPTX Fidelity Sel Technolog9 4.450 25.09 FSNGX Fidelity Sel Natural G10 4.393 37.97 FSDCX Fidelity Sel Comm Eqp11 4.377 11.27 *FSELX Fidelity Sel Semicond12 4.304 43.46 FSCPX Fidelity Sel Cons Disc13 4.253 238.68 FSPHX Fidelity Sel Health Ca14 4.235 94.75 FDCPX Fidelity Sel Computers15 4.201 81.08 FSLBX Fidelity Sel Brokerage16 4.153 89.38 FSHCX Fidelity Sel Medical D17 4.120 33.95 FSRBX Fidelity Sel Banking18 4.115 221.30 FBIOX Fidelity Sel Biotech19 4.091 174.06 FSDAX Fidelity Sel Defense&A20 4.085 98.63 FSRFX Fidelity Sel Transport21 4.085 15.69 FSVLX Fidelity Sel Cons Fina
22 4.076 161.05 FDLSX Fidelity Sel Leisure23 4.029 112.71 FIDSX Fidelity Sel Fincl Svc24 4.028 24831.17 DJ-30 DOW JONES INDUS25 4.023 2727.72 SP-500 S & P 50026 4.020 36.24 FSAVX Fidelity Sel Automotiv27 3.987 34.98 FCYIX Fidelity Sel Industria28 3.959 84.59 FSDPX Fidelity Sel Materials29 3.949 163.40 FSCHX Fidelity Sel Chemicals30 3.893 77.36 FSAIX Fidelity Sel Air Trans31 3.871 81.94 FSUTX Fidelity Sel Utilities32 3.862 58.56 FSHOX Fidelity Sel Constr&Ho33 3.848 10.03 FWRLX Fidelity Sel Wireless34 3.762 18.87 FPHAX Fidelity Sel Pharma35 3.711 19.73 FSAGX Fidelity Sel Gold36 3.672 67.41 FSPCX Fidelity Sel Insurance37 3.624 24.84 FSLEX Fidelity Sel Environme38 3.611 71.82 FBMPX Fidelity Sel Multimedi39 3.440 54.04 FSTCX Fidelity Sel Telecom40 3.138 76.02 FDFAX Fidelity Sel Cons Stap*After the 5/11/2018 close, Fidelity executed a 10-for-1 share split
indicators have retained a neutral profile in recent weeks as well.
The current holdings and their costs are: Boeing (173.92), Cat-erpillar (158.30), Chevron (114.24), Intel (48.57), Microsoft (71.97).
Program performance: 2018 to 5/11 +4.03%, 2017 +20.95%, 2016+4.65%, 2015 +6.84%, 2014 +9.56%, 2013 +14.73%, 2012 +6.05%, 2011+4.81%, 2010 +8.04%, 2009 +7.3%, 2008 – 37.7%, 2007 + 19.3%, 2006+ 12.2%, 2005 + 0.4%, 2004 - 2.4%, 2003 + 18.6%, 2002 -14.6%, 2001 -10.3%, 2000 - 28.8%, 1999 + 41.1%, 1998 + 33.4%, 1997 + 27.7%, 1996+15%, 1995 +20.1%, 1994 +4.7%, 1993 +27.6%, 1992 -3.2%, 1991+46.5%, 1990 +0.1%, 1989 +23.1% (not including dividends, interestincome, or commission expense).
Since the last issue, there no changes to report.
Current holdings include:
ProShares Short High Yield ETF (SJB)ProShares Short Real Estate ETF (REK)Money Market Bal. $62419.93
Performance: 2018 to 5/11 +0.69%, 2017 -2.40%, 2016 -1.10%,2015 -0.02%, 2014 +0.22%, 2013 +1.07%, 2012 -0.86%, 2011 -5.09%, 2010 +7.97%, 2009 +3.20%.
The Diversified Select ProgramSince the last issue, there are 2 changes to report. On 4/30,
one-third of SPRXX was invested in FSENX at $47.16. Also,FSDAX was sold at $170.50; and proceeds invested in SPRXX.
Current holdings include: Energy and the Fidelity MoneyMarket Fund (SPRXX).
Program Performance: 2018 to 5/11 -1.94%, 2017 +6.05%, 2016+7.56%, 2015 -0.43%, 2014 +6.58%, 2013 +12.23%, 2012 +4.99%, 2011-1.63%, 2010 +7.13% , 2009 +11.3%, 2008 -30.5%, 2007 +14.4%, 2006+15.8%, 2005 +5.1%, 2004 +13.3%, 2003 +32.1%, 2002 -7.9%, 2001 -8.2%, 2000 +11.0%, 1999 +53.3%, 1998 +31.2%, 1997 +36.5%, 1996+10.5%, 1995 +47.8%.+36.5%, 1996 +10.5%, 1995 +47.8%.
The Timer Digest ETF program
* Included in Portfolio
Timer Digest
May 14, 2018
Timer Digest
Timer Digest is published every third week by TimerDigest Publishing: $225 ANNUALLY (18 issues), 2Years, $395. Address your inquiries to: TimerDigest Publishing, P.O. Box 1688, Greenwich, Con-necticut 06836-1688. We advise readers that thesources of information are believed to be reliableand accurate, but we do not imply that any charts,formulas, theories or methods can guarantee re-sults. Recommendations, opinions or suggestionsare given with the understanding that subscribersacting on information assume all risks involved.The publisher, its officers, employees and clients ofStrategic Portfolio Management may have posi-tions in the same securities that are recommendedor held in the model portfolios. For further informa-tion, phone: (203) 629-3503.
Timer Digest
May 11, 2018 S&P 500: 2727.72
Timer Digest is published every third week byTimer Digest Publishing: $225 ANNUALLY(18 issues), 2 Years, $395. Address your inquir-ies to: Timer Digest Publishing, P.O. Box 1688,Greenwich, Connecticut 06836-1688. Weadvise readers that the sources of informationare believed to be reliable and accurate, but wedo not imply that any charts, formulas, theoriesor methods can guarantee results. Recommen-dations, opinions or suggestions are given withthe understanding that subscribers acting oninformation assume all risks involved. Thepublisher, its officers, employees and clients ofStrategic Portfolio Management may have posi-tions in the same securities that are recom-mended or held in the model portfolios. Forfurther information, phone: (203) 629-3503.
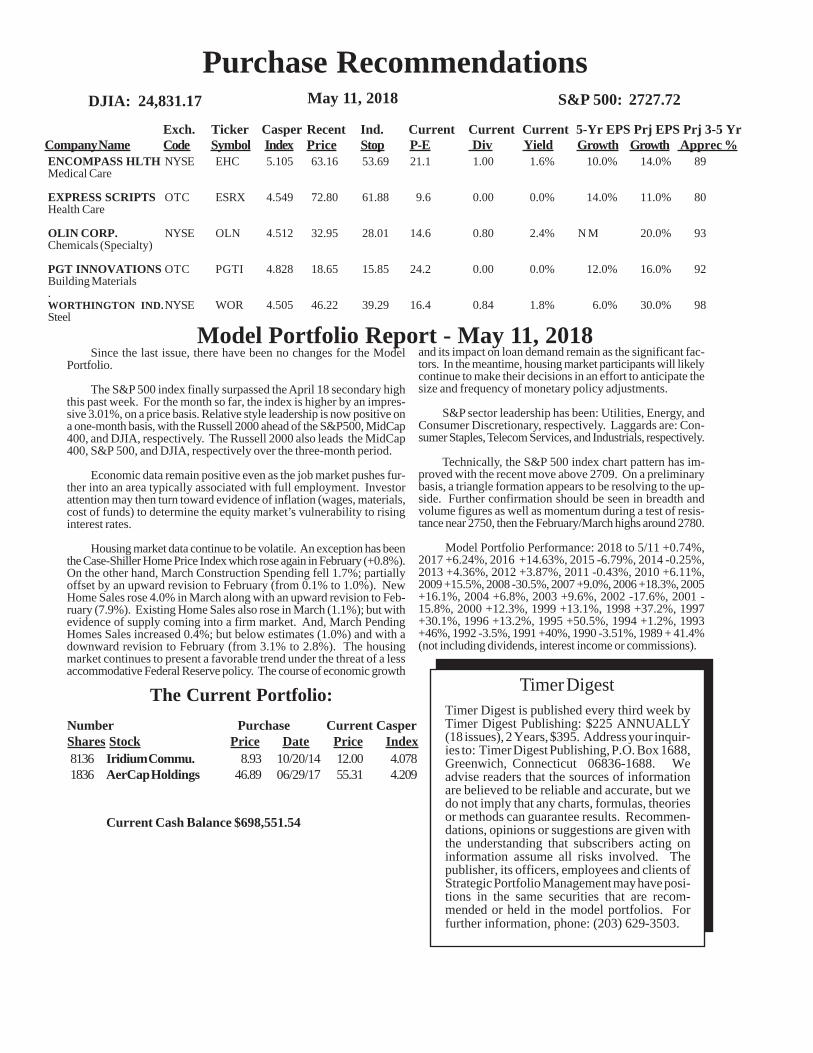
ENCOMPASS HLTH NYSE EHC 5.105 63.16 53.69 21.1 1.00 1.6% 10.0% 14.0% 89Medical Care
EXPRESS SCRIPTS OTC ESRX 4.549 72.80 61.88 9.6 0.00 0.0% 14.0% 11.0% 80Health Care
OLIN CORP. NYSE OLN 4.512 32.95 28.01 14.6 0.80 2.4% N M 20.0% 93Chemicals (Specialty)
PGT INNOVATIONS OTC PGTI 4.828 18.65 15.85 24.2 0.00 0.0% 12.0% 16.0% 92Building Materials.WORTHINGTON IND.NYSE WOR 4.505 46.22 39.29 16.4 0.84 1.8% 6.0% 30.0% 98Steel
Purchase Recommendations
Number Purchase Current CasperShares Stock Price Date Price Index8136 Iridium Commu. 8.93 10/20/14 12.00 4.0781836 AerCap Holdings 46.89 06/29/17 55.31 4.209
Current Cash Balance $698,551.54
Exch. Ticker Casper Recent Ind. Current Current Current 5-Yr EPS Prj EPS Prj 3-5 Yr Company Name Code Symbol Index Price Stop P-E Div Yield Growth Growth Apprec %
The Current Portfolio:
Model Portfolio Report - May 11, 2018Since the last issue, there have been no changes for the Model
Portfolio.
The S&P 500 index finally surpassed the April 18 secondary highthis past week. For the month so far, the index is higher by an impres-sive 3.01%, on a price basis. Relative style leadership is now positive ona one-month basis, with the Russell 2000 ahead of the S&P500, MidCap400, and DJIA, respectively. The Russell 2000 also leads the MidCap400, S&P 500, and DJIA, respectively over the three-month period.
Economic data remain positive even as the job market pushes fur-ther into an area typically associated with full employment. Investorattention may then turn toward evidence of inflation (wages, materials,cost of funds) to determine the equity market’s vulnerability to risinginterest rates.
Housing market data continue to be volatile. An exception has beenthe Case-Shiller Home Price Index which rose again in February (+0.8%).On the other hand, March Construction Spending fell 1.7%; partiallyoffset by an upward revision to February (from 0.1% to 1.0%). NewHome Sales rose 4.0% in March along with an upward revision to Feb-ruary (7.9%). Existing Home Sales also rose in March (1.1%); but withevidence of supply coming into a firm market. And, March PendingHomes Sales increased 0.4%; but below estimates (1.0%) and with adownward revision to February (from 3.1% to 2.8%). The housingmarket continues to present a favorable trend under the threat of a lessaccommodative Federal Reserve policy. The course of economic growth
and its impact on loan demand remain as the significant fac-tors. In the meantime, housing market participants will likelycontinue to make their decisions in an effort to anticipate thesize and frequency of monetary policy adjustments.
S&P sector leadership has been: Utilities, Energy, andConsumer Discretionary, respectively. Laggards are: Con-sumer Staples, Telecom Services, and Industrials, respectively.
Technically, the S&P 500 index chart pattern has im-proved with the recent move above 2709. On a preliminarybasis, a triangle formation appears to be resolving to the up-side. Further confirmation should be seen in breadth andvolume figures as well as momentum during a test of resis-tance near 2750, then the February/March highs around 2780.
Model Portfolio Performance: 2018 to 5/11 +0.74%,2017 +6.24%, 2016 +14.63%, 2015 -6.79%, 2014 -0.25%,2013 +4.36%, 2012 +3.87%, 2011 -0.43%, 2010 +6.11%,2009 +15.5%, 2008 -30.5%, 2007 +9.0%, 2006 +18.3%, 2005+16.1%, 2004 +6.8%, 2003 +9.6%, 2002 -17.6%, 2001 -15.8%, 2000 +12.3%, 1999 +13.1%, 1998 +37.2%, 1997+30.1%, 1996 +13.2%, 1995 +50.5%, 1994 +1.2%, 1993+46%, 1992 -3.5%, 1991 +40%, 1990 -3.51%, 1989 + 41.4%(not including dividends, interest income or commissions).
DJIA: 24,831.17