Embed Size (px)
Citation preview
Oklahoma Ag in the Classroom
Timing is EverythingThe Wheat Crop Depends on the Weather
ObjectiveStudents will play a game to determine how much wheat a section of land will yield based upon a series of setbacks caused by weather, insects, etc. Students will read about the impacts of weather on wheat production. Students will use online resources to find statistics about wheat production and annual precipitation in Oklahoma. Students will graph the information.
Background Everybody talks about the weather, but for a wheat farmer, the weather is serious business. Every weather forecast could bring help or disaster. Wheat producers need sunny days for planting and harvesting crops. In between they need rain, but at just the right time. Precipitation types include rain, snow, sleet and hail. Rain is more available to growing crops than frozen precipitation. Light showers are best because heavy rains erode precious topsoil. Rain is most efficient at recharging the soil profile. Recharge is the process by which water removed from the soil during the growing season is replaced. It occurs in the period between harvest and planting. If the soil is not sufficiently recharged during that period, the possibility of drought increases. Recharge of the soil profile takes place at different times of year, depending on the type of wheat grown—winter wheat or spring wheat. Winter wheat is planted in the fall and sprouts and grows until winter weather sets in. It matures in the spring and is harvested early in the summer. Recharge of the soil for winter wheat occurs in the summer. Spring wheat is planted in the spring, grows through the summer and is harvested in the fall. Recharge for spring wheat occurs in the winter. Frost at the wrong time can damage and/or kill a portion of the winter wheat crop, but snow can be good for winter wheat production. Snow can provide a thermal blanket in far northern climates that helps protect the soil and plants from severe freezing and heaving.
PLANTING SEASON Too much rain at planting time can mean trouble getting into muddy fields with heavy planting equipment. Traffic on or tillage of fields when soil is saturated causes soil compaction. During seed germination either too much or too little rain can influence yields. Too much rain, especially with cool temperatures, can cause seed diseases, resulting in poor stands. Saturated soil causes poor soil aeration. This means poor germination or weak, small plants with shallow roots that may not be strong enough to withstand dry spells during the hot months when the crop is flowering and establishing harvestable grain.
Oklahoma Academic Standards
GRADE 6Number & Operations: 1.3,4; 2.3; 3.1,2,3; 4.3,4
Earth Systems: 2-4Geography: 2,3,4. Environment: 5
GRADE 7Number & Operations: 2.3,5.
Algebra: 2.1,2,3. Data: 1.2Life Science: 1-5. Earth
Systems: 2-5,6Geography: 2,3,4
www.agclassroom.org/ok
Dry soil during planting may result in poor stand establishment and may cause plant stress when dryness occurs during the periods of flowering and seed set.
GROWING SEASON Temperature, precipitation and sunshine determine when a crop will grow, how well a crop will grow and how fast the wheat heads (kernels) will develop. Extreme, high temperatures can cause shriveled and shrunken wheat kernels later in the season. High temperatures and drought conditions may also push the wheat harvest ahead.
HARVEST The weather is particularly important at harvest time. Combines used for cutting, threshing, and separating the wheat kernels from the chaff are exceptionally large and heavy machines. Too much rain makes the fields muddy, and it is difficult to impossible for the heavy machines to move around in them. The support equipment used at harvest also has difficulty in the mud. Harvested wheat is loaded into heavy trucks for delivery to the elevator. The trucks need to get in and out of fields without getting stuck. They also need to travel narrow back roads that may lack gravel or pavement. As these roads become wetter and wetter, harvesters can lose the ability to get to the fields. Even the grain cart, attached to a 550 horsepower tractor with tracks, can be overwhelmed in wet conditions. Cleaning equipment caked in mud costs precious time during the busy harvest season. In addition, the field has to be tilled to even out ruts made by heavy equipment. Tillage burns fuel and can quickly become a substantial cost. The timing of the rain can affect the quality of the wheat. Wheat must be harvested at just the right stage of maturity for best quality. Delayed harvest may cause the wheat kernels to sprout on the plant, making it worthless as a grain crop. Rain at the wrong time can affect value. Durum wheat, used for making pasta, quickly loses its glowing amber color if rain delays harvesting. The amber color is a major factor when it comes to grading. A downgrade from a #1 durum to a #3 can cost $1 per bushel or more. If the weather stays wet long enough, the wheat will have to be sold for animal feed, which brings down the profit. In some cases, rain can wash the wheat kernel so much and so aggressively that it begins to lose test weight. Weight determines quality. Test weight indicates how many pounds will fit into a specific volume. It is expressed as pounds per bushel. The size and shape of kernels, moisture content and the composition of the kernels affect the weight of grain
www.agclassroom.org/ok
Weather Facts• Weather is the condition of the air that
surrounds the earth. The air that surrounds the earth is called the atmosphere. So weather is the condition of the atmosphere.
• The atmosphere contains the gases of nitrogen, oxygen and small amounts of other gases. The atmosphere also contains water vapor and particles of dust.
• The lowest layer of the atmosphere is called the troposphere. The troposphere is where most of the weather occurs. The troposphere begins at the surface of the earth and extends to 6-10 miles from the surface.
• The weather conditions in the troposphere and surface of the earth depend upon temperature, air pressure, wind and moisture.
• Precipitation occurs when the cooling of the air causes moisture to fall in the form of rain, snow, sleet or hail. Rain will fall when the clouds formed by drops of water become so heavy that the air cannot hold it up any longer. Ice crystals form when the temperature of the clouds is below freezing. If the air temperature near the ground is as low as 37 degrees F., the ice crystals can turn to snow. The crystals will change to sleet if the air temperature is between 37 degrees F. and 39 degrees F.
• Normal weather is defined by the World Meteorological Organization as a 30-year period updated every decade. A normal year seldom occurs, if ever, because there is always variability across years and within the year. Some periods are wetter/drier, hotter/cooler, sunnier/cloudier than normal.
• Optimum minimum and maximum temperatures define the temperatures most favorable for wheat production. Optimum minimum temperatures for wheat are between 50 and 68. Optimum maximums are between 73 and 91.
• Heat stress mostly occurs in the summer, while cold stress occurs in the spring and fall, usually when crops are being established or maturing.
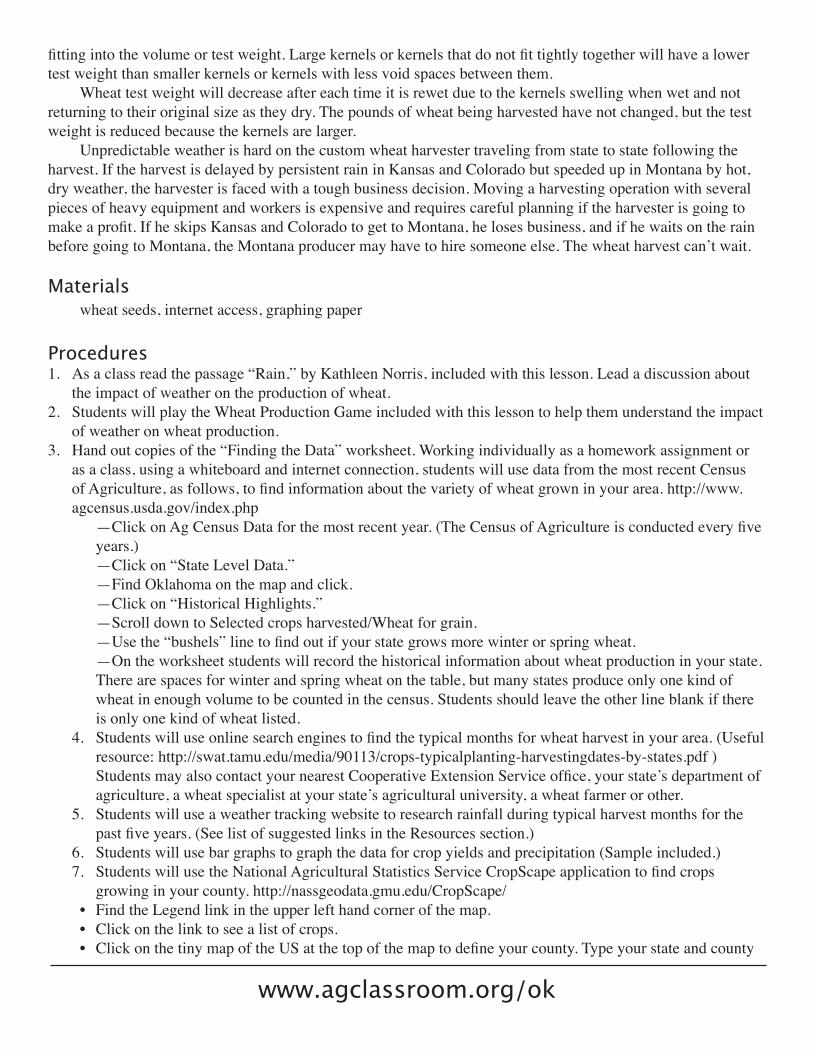
fitting into the volume or test weight. Large kernels or kernels that do not fit tightly together will have a lower test weight than smaller kernels or kernels with less void spaces between them. Wheat test weight will decrease after each time it is rewet due to the kernels swelling when wet and not returning to their original size as they dry. The pounds of wheat being harvested have not changed, but the test weight is reduced because the kernels are larger. Unpredictable weather is hard on the custom wheat harvester traveling from state to state following the harvest. If the harvest is delayed by persistent rain in Kansas and Colorado but speeded up in Montana by hot, dry weather, the harvester is faced with a tough business decision. Moving a harvesting operation with several pieces of heavy equipment and workers is expensive and requires careful planning if the harvester is going to make a profit. If he skips Kansas and Colorado to get to Montana, he loses business, and if he waits on the rain before going to Montana, the Montana producer may have to hire someone else. The wheat harvest can’t wait.
Materialswheat seeds, internet access, graphing paper
Procedures1. As a class read the passage “Rain,” by Kathleen Norris, included with this lesson. Lead a discussion about
the impact of weather on the production of wheat.2. Students will play the Wheat Production Game included with this lesson to help them understand the impact
of weather on wheat production.3. Hand out copies of the “Finding the Data” worksheet. Working individually as a homework assignment or
as a class, using a whiteboard and internet connection, students will use data from the most recent Census of Agriculture, as follows, to find information about the variety of wheat grown in your area. http://www.agcensus.usda.gov/index.php
—Click on Ag Census Data for the most recent year. (The Census of Agriculture is conducted every five years.)—Click on “State Level Data.”—Find Oklahoma on the map and click.—Click on “Historical Highlights.”—Scroll down to Selected crops harvested/Wheat for grain.—Use the “bushels” line to find out if your state grows more winter or spring wheat.—On the worksheet students will record the historical information about wheat production in your state. There are spaces for winter and spring wheat on the table, but many states produce only one kind of wheat in enough volume to be counted in the census. Students should leave the other line blank if there is only one kind of wheat listed.
4. Students will use online search engines to find the typical months for wheat harvest in your area. (Useful resource: http://swat.tamu.edu/media/90113/crops-typicalplanting-harvestingdates-by-states.pdf ) Students may also contact your nearest Cooperative Extension Service office, your state’s department of agriculture, a wheat specialist at your state’s agricultural university, a wheat farmer or other.
5. Students will use a weather tracking website to research rainfall during typical harvest months for the past five years. (See list of suggested links in the Resources section.)
6. Students will use bar graphs to graph the data for crop yields and precipitation (Sample included.)7. Students will use the National Agricultural Statistics Service CropScape application to find crops
growing in your county. http://nassgeodata.gmu.edu/CropScape/• Find the Legend link in the upper left hand corner of the map.• Click on the link to see a list of crops.• Click on the tiny map of the US at the top of the map to define your county. Type your state and county
www.agclassroom.org/ok
in the blanks provided.• Use the legend to determine the crops grown in your county based on the colors shown.
Vocabularyaeration—the process by which air is circulated through, mixed with or dissolved in a liquid or substanceair—the invisible mixture of odorless tasteless gases (as nitrogen and oxygen) that surrounds the earthatmosphere—the whole mass of air surrounding the earthchaff—the seed coverings and other debris separated from the seed in threshing graincompaction— decrease in porosity of soil due to externally or internally applied loadsdormant—having growth or other biological activity much reduced or suspendeddrought—a long period of dry weathererosion—detachment and transport of soil particles via wind or waterfallow—land for crops allowed to lie idlefrost—the temperature that causes freezinggermination—the act of causing to sprout or developmaturity—full developmentnitrogen—a colorless tasteless odorless element that occurs as a gas which makes up 78 percent of the atmosphere and that forms a part of all living tissuesnutrient—a substance or ingredient that furnishes nourishmentoxygen—a colorless tasteless odorless gaseous element that constitutes 21 percent of the atmosphere and is found in water, in most rocks and minerals, and in numerous organic compoundsprecipitation—water or the amount of water that falls to the earth as hail, mist, rain, sleet, or snowrain—water falling in drops from cloudsrecharge— the process by which water removed from the soil during the growing season is replacedsnow—small white ice crystals formed directly from the water vapor of the airsoil profile—a vertical section of the soil that is exposed when a soil pit, or hole, is dug from the surface of the soil to the underlying bedrocksolar radiation—radiant energy emitted by the sun, particularly electromagnetic energystand—a group of plants growing in a continuous areathreshing—separating seed from a harvested plant especially by using a machine or tooltillage—the process of cultivating landtopsoil—surface soil usually including the rich upper layer in which plants have most of their roots and which the farmer turns over in plowingtroposphere—the portion of the atmosphere which extends from the earth’s surface to the bottom of the stratosphere and in which temperature generally decreases rapidly with altitudeweather—the state of the atmosphere in regard to heat or cold, wetness or dryness, calm or storm, clearness or cloudinessyield—the amount or quantity produced
ResourcesCensus of Agriculture: http://www.agcensus.usda.gov/index.phphttp://nassgeodata.gmu.edu/CropScape/National Weather Service: http://www.weather.gov/American Association of State Climatologist: http://www.stateclimate.orgWeather Underground: http://www.wunderground.com/history/Usual Planting and Harvesting Dates for US Field Crops (USDA) http://swat.tamu.edu/media/90113/crops-typicalplanting-harvestingdates-by-states.pdf
Lesson adapted from: “Harvest: Crops and Careers,” National Agriculture in the Classroom, http://oklahoma4h.okstate.edu/aitc/wheat%20lessons/index.html
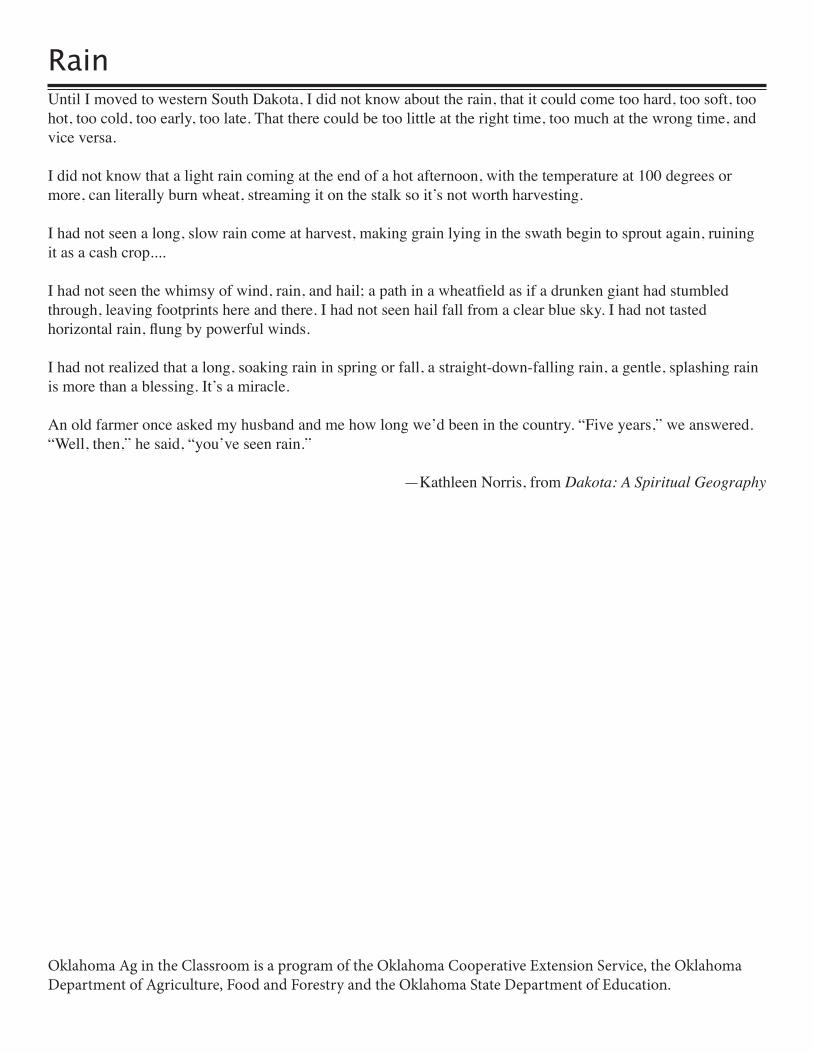
RainUntil I moved to western South Dakota, I did not know about the rain, that it could come too hard, too soft, too hot, too cold, too early, too late. That there could be too little at the right time, too much at the wrong time, and vice versa.
I did not know that a light rain coming at the end of a hot afternoon, with the temperature at 100 degrees or more, can literally burn wheat, streaming it on the stalk so it’s not worth harvesting.
I had not seen a long, slow rain come at harvest, making grain lying in the swath begin to sprout again, ruining it as a cash crop....
I had not seen the whimsy of wind, rain, and hail; a path in a wheatfield as if a drunken giant had stumbled through, leaving footprints here and there. I had not seen hail fall from a clear blue sky. I had not tasted horizontal rain, flung by powerful winds.
I had not realized that a long, soaking rain in spring or fall, a straight-down-falling rain, a gentle, splashing rain is more than a blessing. It’s a miracle.
An old farmer once asked my husband and me how long we’d been in the country. “Five years,” we answered. “Well, then,” he said, “you’ve seen rain.”
—Kathleen Norris, from Dakota: A Spiritual Geography
Oklahoma Ag in the Classroom is a program of the Oklahoma Cooperative Extension Service, the Oklahoma Department of Agriculture, Food and Forestry and the Oklahoma State Department of Education.
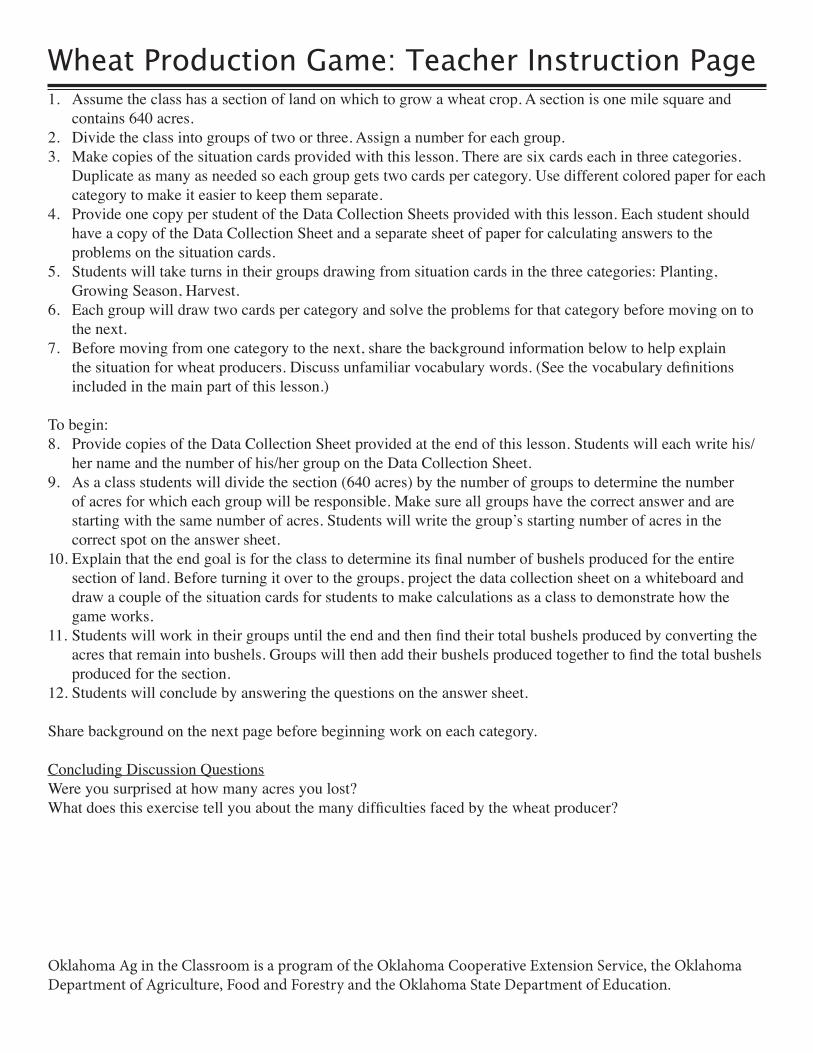
Wheat Production Game: Teacher Instruction Page1. Assume the class has a section of land on which to grow a wheat crop. A section is one mile square and
contains 640 acres. 2. Divide the class into groups of two or three. Assign a number for each group.3. Make copies of the situation cards provided with this lesson. There are six cards each in three categories.
Duplicate as many as needed so each group gets two cards per category. Use different colored paper for each category to make it easier to keep them separate.
4. Provide one copy per student of the Data Collection Sheets provided with this lesson. Each student should have a copy of the Data Collection Sheet and a separate sheet of paper for calculating answers to the problems on the situation cards.
5. Students will take turns in their groups drawing from situation cards in the three categories: Planting, Growing Season, Harvest.
6. Each group will draw two cards per category and solve the problems for that category before moving on to the next.
7. Before moving from one category to the next, share the background information below to help explain the situation for wheat producers. Discuss unfamiliar vocabulary words. (See the vocabulary definitions included in the main part of this lesson.)
To begin:8. Provide copies of the Data Collection Sheet provided at the end of this lesson. Students will each write his/
her name and the number of his/her group on the Data Collection Sheet.9. As a class students will divide the section (640 acres) by the number of groups to determine the number
of acres for which each group will be responsible. Make sure all groups have the correct answer and are starting with the same number of acres. Students will write the group’s starting number of acres in the correct spot on the answer sheet.
10. Explain that the end goal is for the class to determine its final number of bushels produced for the entire section of land. Before turning it over to the groups, project the data collection sheet on a whiteboard and draw a couple of the situation cards for students to make calculations as a class to demonstrate how the game works.
11. Students will work in their groups until the end and then find their total bushels produced by converting the acres that remain into bushels. Groups will then add their bushels produced together to find the total bushels produced for the section.
12. Students will conclude by answering the questions on the answer sheet.
Share background on the next page before beginning work on each category.
Concluding Discussion QuestionsWere you surprised at how many acres you lost?What does this exercise tell you about the many difficulties faced by the wheat producer?
Oklahoma Ag in the Classroom is a program of the Oklahoma Cooperative Extension Service, the Oklahoma Department of Agriculture, Food and Forestry and the Oklahoma State Department of Education.
Category 1. Planting Spring wheat is planted in the spring, grows through the summer and is harvested in the fall. Winter wheat is planted in the fall, grows through the fall, slows in the winter and begins rapid growth again in the spring. It is harvested early in the summer. Too much rain at planting time means trouble getting into muddy fields with heavy planting equipment. Too much rain during seed germination can cause poor soil aeration resulting in seed diseases, poor germination rates and weak plants. Dry soil during planting may result in poor stand establishment and may cause plant stress when dryness occurs during the periods of flowering and seed set.
Category 2. Growing SeasonTemperature, precipitation and sunshine determine when a crop will grow, how well a crop will grow and how fast the wheat heads (kernels) will develop. Extreme high temperatures can cause shriveled and shrunken wheat kernels. High temperatures and drought conditions may also push the wheat harvest ahead.
Category 3. HarvestMost wheat farmers depend on outside harvesting operations to harvest their crops. Harvesting companies invest in the heavy, expensive combines used for harvest and hire crews that travel with them throughout wheat country during the harvest season. Because of the differences in climate from one state to the next, harvesters can make their way from one state to the next following the harvest. The weather can be a tricky problem for harvesting companies, because getting delayed in one part of the country due to rain can cause them to be late getting to another part of the country where the weather may be more favorable and the wheat crop may even be early. Wheat needs to be harvested when it is ready. Waiting can cause losses in weight, quality and value.
Wheat Production Game: Background
Oklahoma Ag in the Classroom is a program of the Oklahoma Cooperative Extension Service, the Oklahoma Department of Agriculture, Food and Forestry and the Oklahoma State Department of Education.
Wheat Production Game: Planting Situation Cards
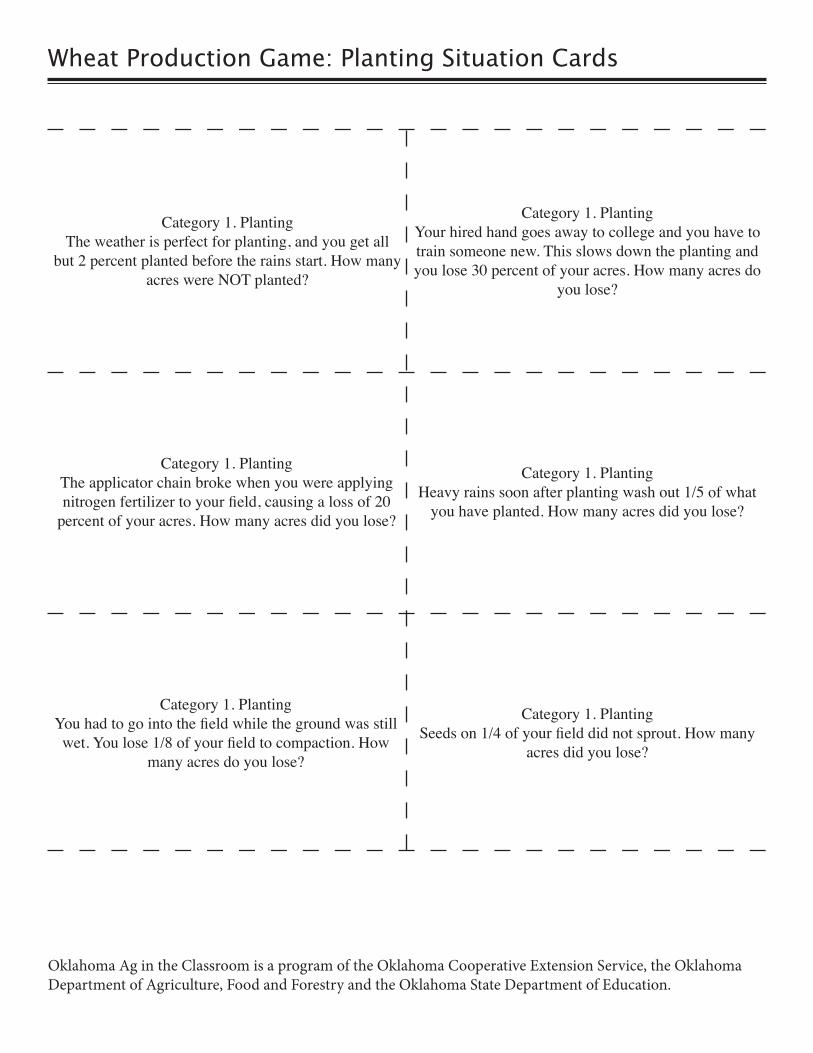
Category 1. PlantingThe weather is perfect for planting, and you get all
but 2 percent planted before the rains start. How many acres were NOT planted?
Category 1. PlantingYour hired hand goes away to college and you have to train someone new. This slows down the planting and you lose 30 percent of your acres. How many acres do
you lose?
Category 1. PlantingThe applicator chain broke when you were applying nitrogen fertilizer to your field, causing a loss of 20
percent of your acres. How many acres did you lose?
Category 1. PlantingHeavy rains soon after planting wash out 1/5 of what
you have planted. How many acres did you lose?
Category 1. PlantingYou had to go into the field while the ground was still wet. You lose 1/8 of your field to compaction. How
many acres do you lose?
Category 1. PlantingSeeds on 1/4 of your field did not sprout. How many
acres did you lose?
Oklahoma Ag in the Classroom is a program of the Oklahoma Cooperative Extension Service, the Oklahoma Department of Agriculture, Food and Forestry and the Oklahoma State Department of Education.
Wheat Production Game: Growing Season Situation Cards
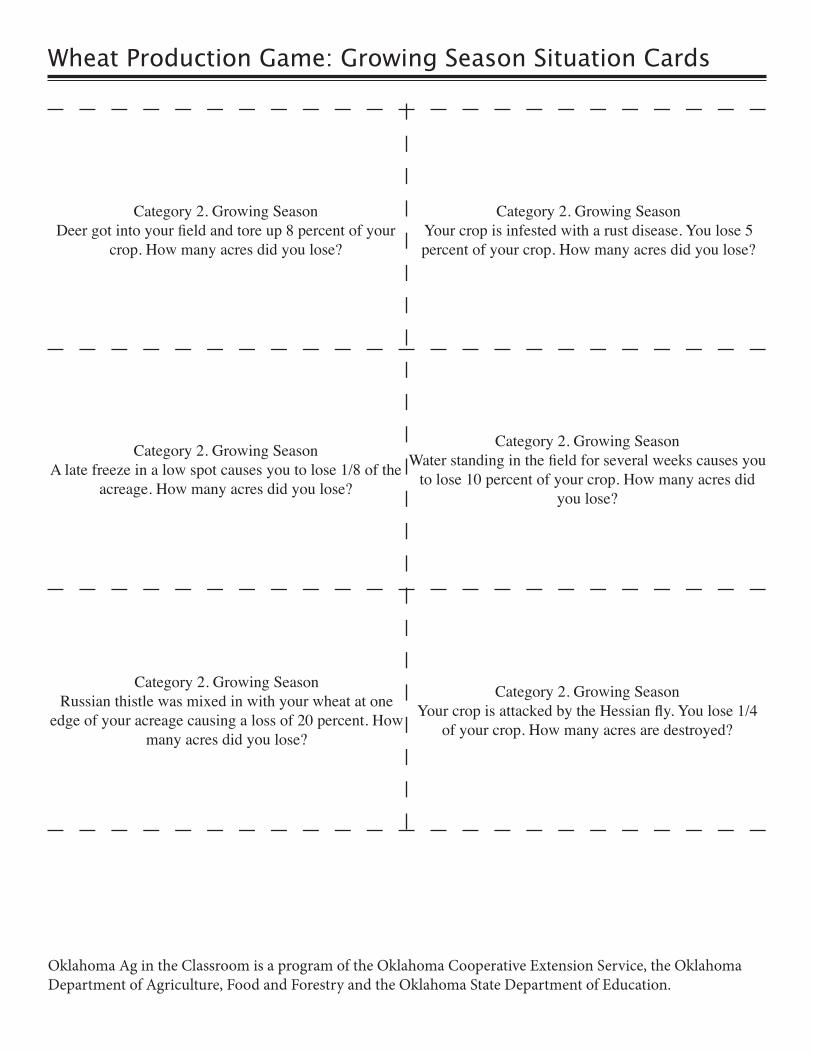
Category 2. Growing Season Deer got into your field and tore up 8 percent of your
crop. How many acres did you lose?
Category 2. Growing Season Water standing in the field for several weeks causes you
to lose 10 percent of your crop. How many acres did you lose?
Category 2. Growing Season A late freeze in a low spot causes you to lose 1/8 of the
acreage. How many acres did you lose?
Category 2. Growing SeasonRussian thistle was mixed in with your wheat at one
edge of your acreage causing a loss of 20 percent. How many acres did you lose?
Category 2. Growing SeasonYour crop is infested with a rust disease. You lose 5 percent of your crop. How many acres did you lose?
Category 2. Growing SeasonYour crop is attacked by the Hessian fly. You lose 1/4
of your crop. How many acres are destroyed?
Oklahoma Ag in the Classroom is a program of the Oklahoma Cooperative Extension Service, the Oklahoma Department of Agriculture, Food and Forestry and the Oklahoma State Department of Education.
Wheat Production Game: Harvest Situation Cards
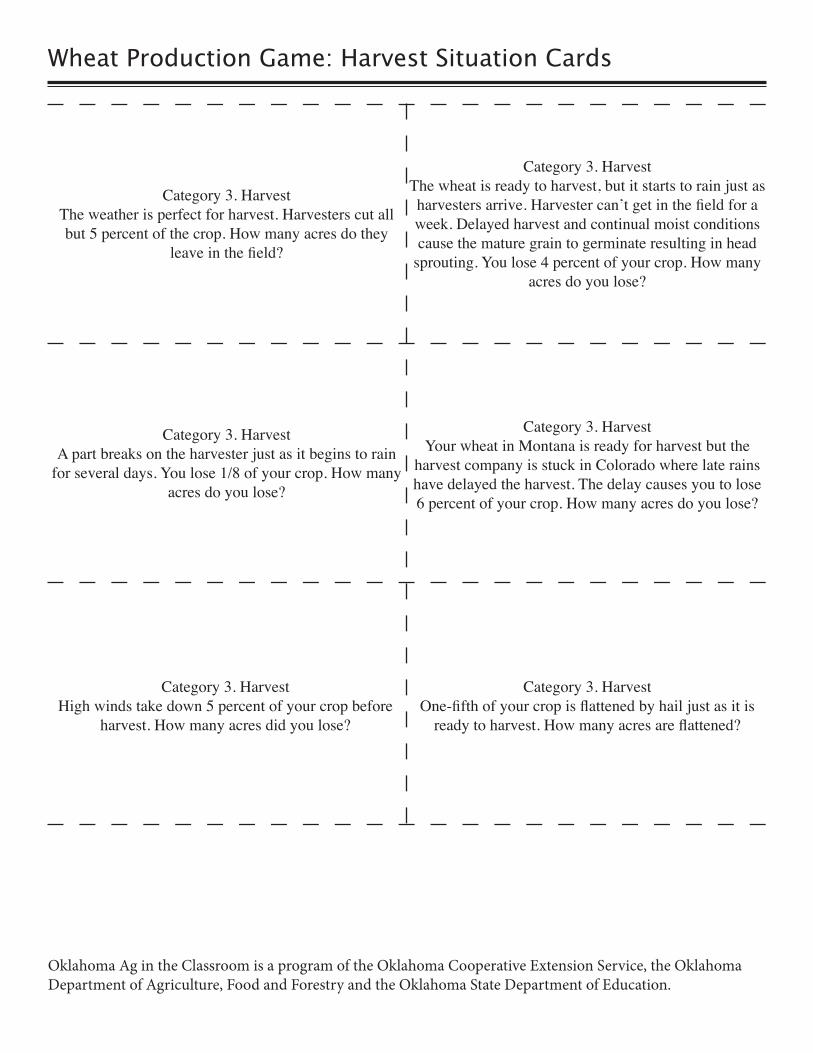
Category 3. HarvestThe weather is perfect for harvest. Harvesters cut all but 5 percent of the crop. How many acres do they
leave in the field?
Category 3. HarvestThe wheat is ready to harvest, but it starts to rain just as harvesters arrive. Harvester can’t get in the field for a week. Delayed harvest and continual moist conditions cause the mature grain to germinate resulting in head
sprouting. You lose 4 percent of your crop. How many acres do you lose?
Category 3. HarvestYour wheat in Montana is ready for harvest but the
harvest company is stuck in Colorado where late rains have delayed the harvest. The delay causes you to lose 6 percent of your crop. How many acres do you lose?
Category 3. HarvestA part breaks on the harvester just as it begins to rain
for several days. You lose 1/8 of your crop. How many acres do you lose?
Category 3. HarvestHigh winds take down 5 percent of your crop before
harvest. How many acres did you lose?
Category 3. Harvest One-fifth of your crop is flattened by hail just as it is
ready to harvest. How many acres are flattened?
Oklahoma Ag in the Classroom is a program of the Oklahoma Cooperative Extension Service, the Oklahoma Department of Agriculture, Food and Forestry and the Oklahoma State Department of Education.
Name________________________________________
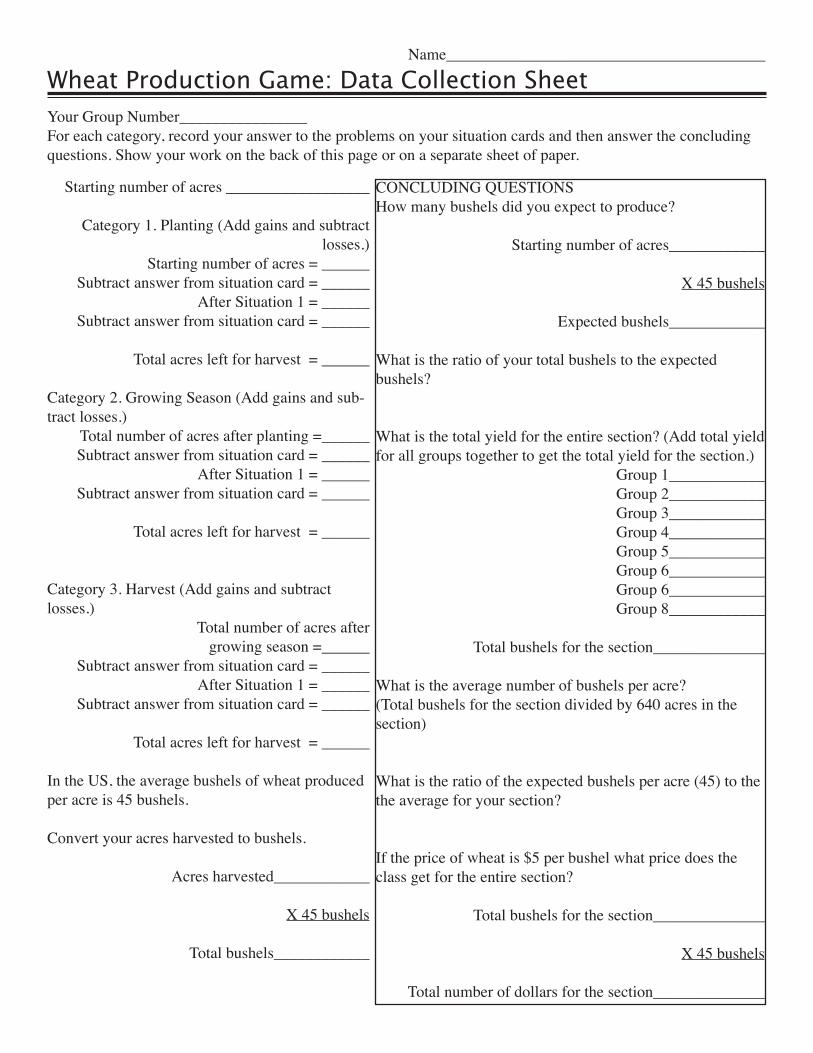
Wheat Production Game: Data Collection Sheet
Starting number of acres __________________
Category 1. Planting (Add gains and subtract losses.)
Starting number of acres = ______Subtract answer from situation card = ______
After Situation 1 = ______Subtract answer from situation card = ______
Total acres left for harvest = ______
Category 2. Growing Season (Add gains and sub-tract losses.)
Total number of acres after planting =______Subtract answer from situation card = ______
After Situation 1 = ______Subtract answer from situation card = ______
Total acres left for harvest = ______
Category 3. Harvest (Add gains and subtract losses.)
Total number of acres aftergrowing season =______
Subtract answer from situation card = ______After Situation 1 = ______
Subtract answer from situation card = ______
Total acres left for harvest = ______
In the US, the average bushels of wheat produced per acre is 45 bushels.
Convert your acres harvested to bushels.
Acres harvested____________
X 45 bushels
Total bushels____________
Your Group Number________________For each category, record your answer to the problems on your situation cards and then answer the concluding questions. Show your work on the back of this page or on a separate sheet of paper.
CONCLUDING QUESTIONSHow many bushels did you expect to produce?
Starting number of acres____________
X 45 bushels
Expected bushels____________
What is the ratio of your total bushels to the expected bushels?
What is the total yield for the entire section? (Add total yield for all groups together to get the total yield for the section.)
Group 1____________Group 2____________Group 3____________Group 4____________Group 5____________Group 6____________Group 6____________Group 8____________
Total bushels for the section______________
What is the average number of bushels per acre?(Total bushels for the section divided by 640 acres in the section)
What is the ratio of the expected bushels per acre (45) to the the average for your section?
If the price of wheat is $5 per bushel what price does the class get for the entire section?
Total bushels for the section______________
X 45 bushels
Total number of dollars for the section______________
Name________________________________________
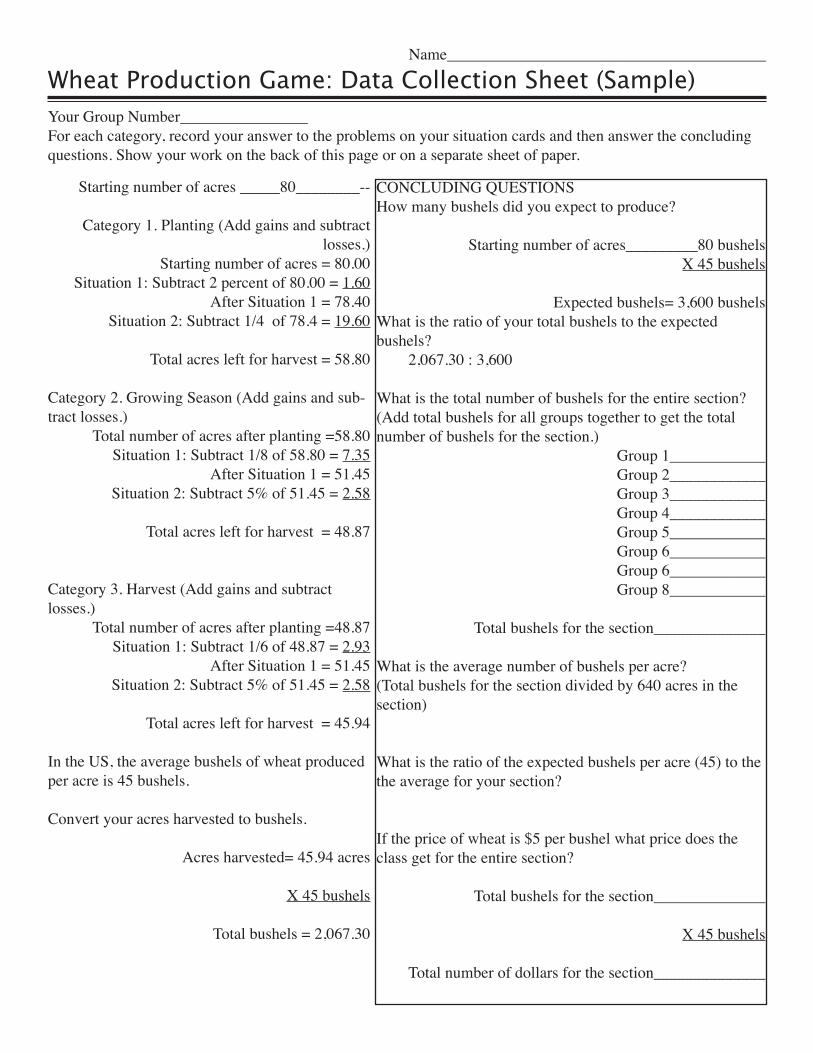
Wheat Production Game: Data Collection Sheet (Sample)
Starting number of acres _____80________--
Category 1. Planting (Add gains and subtract losses.)
Starting number of acres = 80.00Situation 1: Subtract 2 percent of 80.00 = 1.60
After Situation 1 = 78.40 Situation 2: Subtract 1/4 of 78.4 = 19.60
Total acres left for harvest = 58.80
Category 2. Growing Season (Add gains and sub-tract losses.)
Total number of acres after planting =58.80Situation 1: Subtract 1/8 of 58.80 = 7.35
After Situation 1 = 51.45 Situation 2: Subtract 5% of 51.45 = 2.58
Total acres left for harvest = 48.87
Category 3. Harvest (Add gains and subtract losses.)
Total number of acres after planting =48.87Situation 1: Subtract 1/6 of 48.87 = 2.93
After Situation 1 = 51.45 Situation 2: Subtract 5% of 51.45 = 2.58
Total acres left for harvest = 45.94
In the US, the average bushels of wheat produced per acre is 45 bushels.
Convert your acres harvested to bushels.
Acres harvested= 45.94 acres
X 45 bushels
Total bushels = 2,067.30
Your Group Number________________For each category, record your answer to the problems on your situation cards and then answer the concluding questions. Show your work on the back of this page or on a separate sheet of paper.
CONCLUDING QUESTIONSHow many bushels did you expect to produce?
Starting number of acres_________80 bushelsX 45 bushels
Expected bushels= 3,600 bushelsWhat is the ratio of your total bushels to the expected bushels? 2,067.30 : 3,600
What is the total number of bushels for the entire section? (Add total bushels for all groups together to get the total number of bushels for the section.)
Group 1____________Group 2____________Group 3____________Group 4____________ Group 5____________Group 6____________Group 6____________Group 8____________
Total bushels for the section______________
What is the average number of bushels per acre?(Total bushels for the section divided by 640 acres in the section)
What is the ratio of the expected bushels per acre (45) to the the average for your section?
If the price of wheat is $5 per bushel what price does the class get for the entire section?
Total bushels for the section______________
X 45 bushels
Total number of dollars for the section______________
Name________________________________
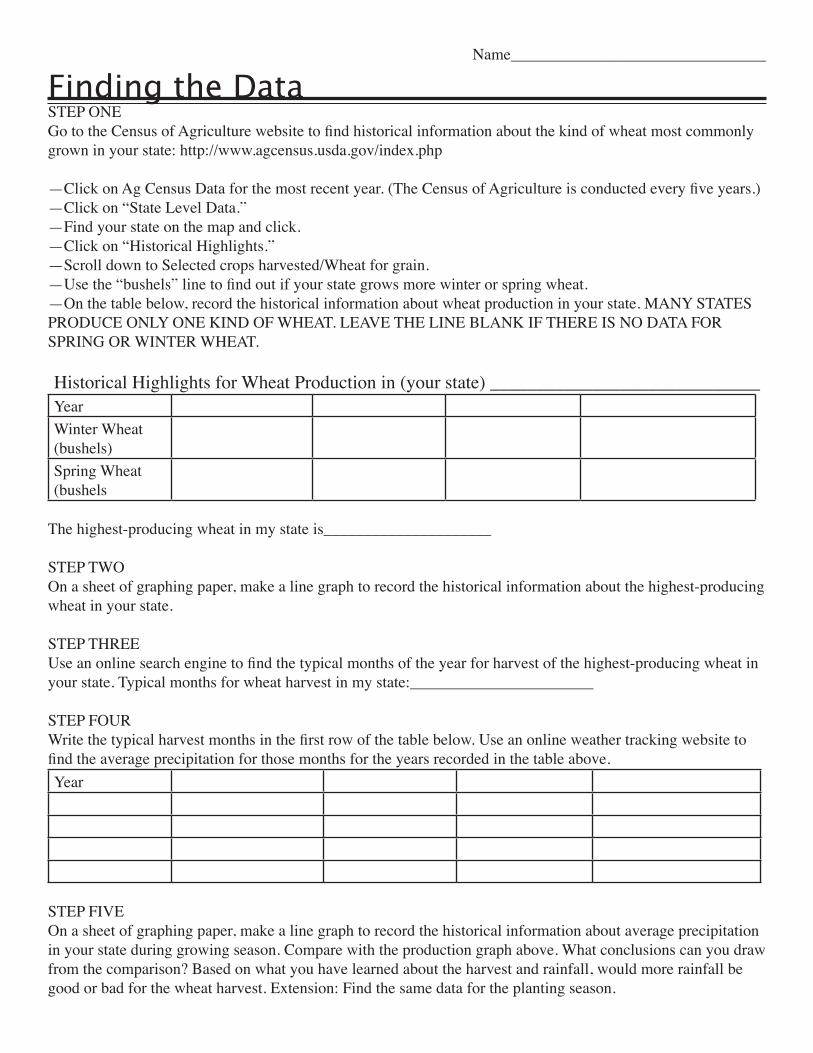
Finding the DataSTEP ONEGo to the Census of Agriculture website to find historical information about the kind of wheat most commonly grown in your state: http://www.agcensus.usda.gov/index.php
—Click on Ag Census Data for the most recent year. (The Census of Agriculture is conducted every five years.)—Click on “State Level Data.”—Find your state on the map and click.—Click on “Historical Highlights.”—Scroll down to Selected crops harvested/Wheat for grain.—Use the “bushels” line to find out if your state grows more winter or spring wheat.—On the table below, record the historical information about wheat production in your state. MANY STATES PRODUCE ONLY ONE KIND OF WHEAT. LEAVE THE LINE BLANK IF THERE IS NO DATA FOR SPRING OR WINTER WHEAT.
Historical Highlights for Wheat Production in (your state) _____________________________YearWinter Wheat(bushels)Spring Wheat(bushels
The highest-producing wheat in my state is_____________________
STEP TWOOn a sheet of graphing paper, make a line graph to record the historical information about the highest-producing wheat in your state.
STEP THREEUse an online search engine to find the typical months of the year for harvest of the highest-producing wheat in your state. Typical months for wheat harvest in my state:_______________________
STEP FOURWrite the typical harvest months in the first row of the table below. Use an online weather tracking website to find the average precipitation for those months for the years recorded in the table above.Year
STEP FIVEOn a sheet of graphing paper, make a line graph to record the historical information about average precipitation in your state during growing season. Compare with the production graph above. What conclusions can you draw from the comparison? Based on what you have learned about the harvest and rainfall, would more rainfall be good or bad for the wheat harvest. Extension: Find the same data for the planting season.
Name________________________________
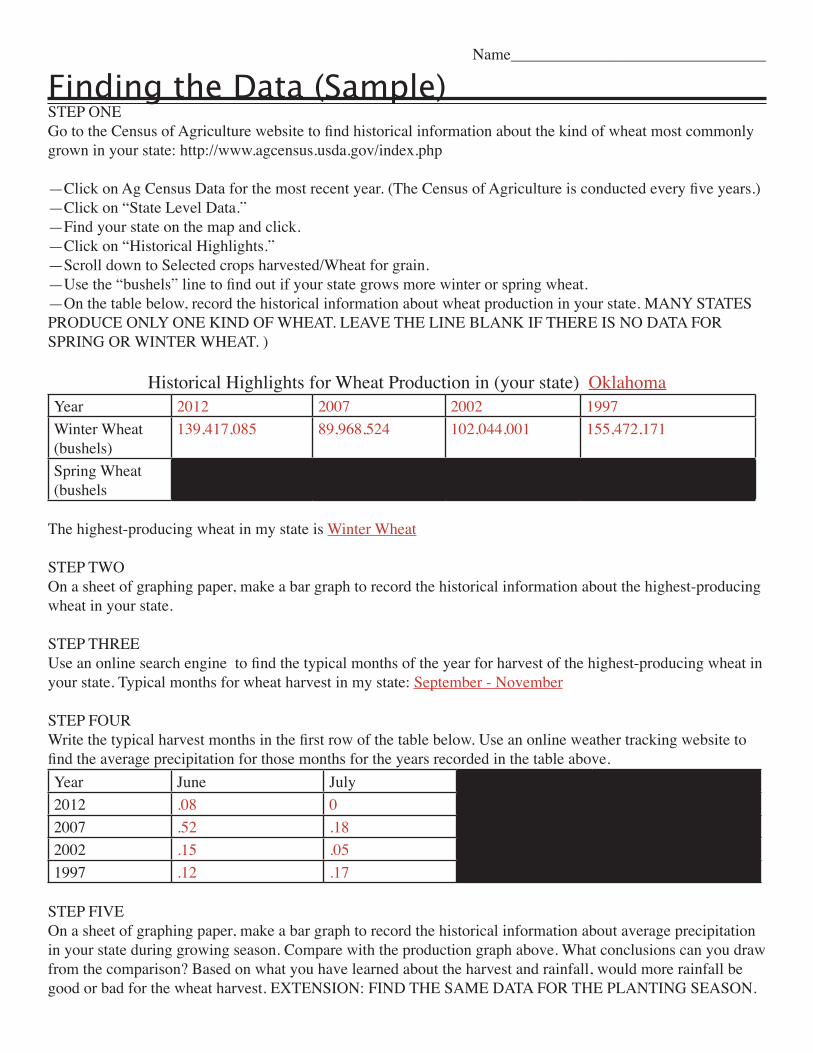
Finding the Data (Sample)STEP ONEGo to the Census of Agriculture website to find historical information about the kind of wheat most commonly grown in your state: http://www.agcensus.usda.gov/index.php
—Click on Ag Census Data for the most recent year. (The Census of Agriculture is conducted every five years.)—Click on “State Level Data.”—Find your state on the map and click.—Click on “Historical Highlights.”—Scroll down to Selected crops harvested/Wheat for grain.—Use the “bushels” line to find out if your state grows more winter or spring wheat.—On the table below, record the historical information about wheat production in your state. MANY STATES PRODUCE ONLY ONE KIND OF WHEAT. LEAVE THE LINE BLANK IF THERE IS NO DATA FOR SPRING OR WINTER WHEAT. )
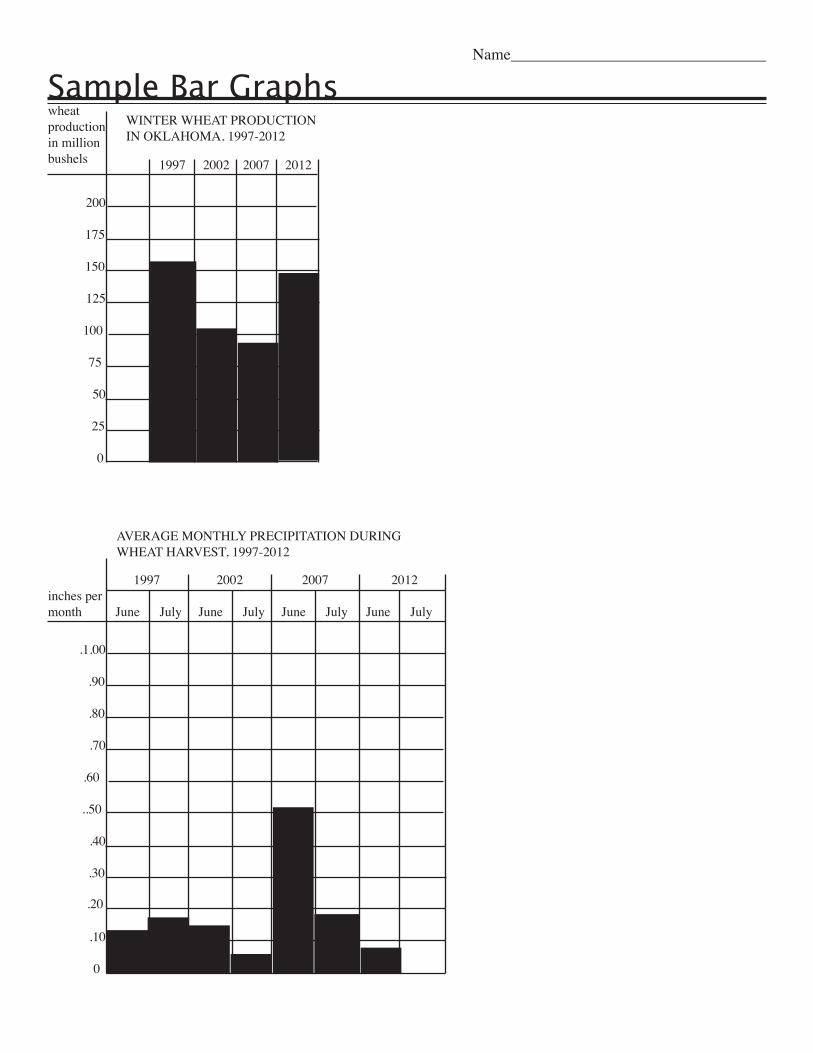
Historical Highlights for Wheat Production in (your state) OklahomaYear 2012 2007 2002 1997Winter Wheat(bushels)
139,417,085 89,968,524 102,044,001 155,472,171
Spring Wheat(bushels
The highest-producing wheat in my state is Winter Wheat
STEP TWOOn a sheet of graphing paper, make a bar graph to record the historical information about the highest-producing wheat in your state.
STEP THREEUse an online search engine to find the typical months of the year for harvest of the highest-producing wheat in your state. Typical months for wheat harvest in my state: September - November
STEP FOURWrite the typical harvest months in the first row of the table below. Use an online weather tracking website to find the average precipitation for those months for the years recorded in the table above.Year June July2012 .08 02007 .52 .182002 .15 .051997 .12 .17
STEP FIVEOn a sheet of graphing paper, make a bar graph to record the historical information about average precipitation in your state during growing season. Compare with the production graph above. What conclusions can you draw from the comparison? Based on what you have learned about the harvest and rainfall, would more rainfall be good or bad for the wheat harvest. EXTENSION: FIND THE SAME DATA FOR THE PLANTING SEASON.
Name________________________________
Sample Bar Graphswheatproduction in million bushels
200
175
150
125
100
75
1997
50
90
25
0
90
2007
90
2012
90
WINTER WHEAT PRODUCTION IN OKLAHOMA, 1997-2012
inches per month
.1.00
.90
.80
.70
.60
..50
.40
90
.30
.20
July
90
90
AVERAGE MONTHLY PRECIPITATION DURING WHEAT HARVEST, 1997-2012
2002
0
.10
1997
June
2002
JulyJune
2007
JulyJune
2012
JulyJune
90 90 90
90