Embed Size (px)
Citation preview
Timing test of the NeuRad neutron detector prototype∗
D. Kostyleva1,2,3, A. Bezbakh2,4, V. Chudoba2,5, A. Fomichev2, A. Gorshkov2,4, O. Kiselev3,S. Krupko2,4, I. Mukha3, and I. Muzalevsky2,6
1JLU Giessen, Germany; 2FLNR JINR Dubna, Russia; 3GSI Helmholtzzentrum, Darmstadt; 4FSBI NRC ”KurchatovInstitute” - ITEP, Moscow, Russia; 5Silesian University in Opava, Czech Republic; 6Dubna State University, Russia
The NeuRad neutron detector is constructed out ofscintillation fibers and is aimed on measuring the neu-tron - heavy fragment angular correlations from exoticneutron decays. The results of the first test of Neu-Rad prototype timing properties are presented in thisreport.
The EXPERT (EXotic Particle Emission and Radioac-tivity by Tracking) is a part of the physics program of theSuper-FRS Experiment Collaboration [1]. The EXPERTexperiments are aimed at studies of the unknown exoticnuclear systems beyond the proton and neutron drip-lines.These experiments will use the first half of the Super-FRSas a radioactive beam separator and its second half as ahigh-resolution spectrometer. NeuRad detector will pro-vide precise information on angular correlations betweennuclear-decay neutrons and the charged decay productsmeasured by the rest of EXPERT setup. An informationon angular correlations will be used to determine the decayenergy of the precursor, its life time and mode of the decay.
The detector is designed in order to provide sufficientdetection efficiency and fine position resolution for neu-trons at expected energies about 200-800 MeV interactingwith the material of fibers, in particular, via elastic scatter-ing. The detector will be constructed of scintillating fibers(≈ 103 units) with 3x3 mm2 cross section and the length of1 m each, which will be grouped into bundles. Two multi-anode PMT’s will be mounted on each side of bundle, eachside of fiber will be read out by one pixel. Bundles willbe oriented along beam axis meaning that the frontal PMTwill be penetrated by neutrons. The detector will be placedat distance of ≈ 30 m from the focal plane FRF1. Suchsetup will ensure total angular acceptance of the detectorup to ±6 mrad which reflects low transfer momentum, cor-responding to the decay energy expected at the range of0.1-100 keV.
One of the significant NeuRad characteristics is the timeresolution. The first neutron hit has to be determined in or-der to distinguish between one multi-scattered neutron andthe event with multiple neutrons. The longitudinal (z) posi-tion, which enhances angular resolution, will be extractedfrom the time difference between the signals collected onboth sides of the detector. In order to obtain required angu-lar resolution, a position resolution about 6 cm is needed.This corresponds to the time-uncertainty of ∼ 0.5 ns. Testmeasurements of timing characteristics has been performed
∗The work was partly supported by grants provided by MEYS CzechRepublic (projects LTT17003 and LM2015049) and RSF (project No. 17-12-01367), A.B., A.G. and S.K have been supported by FAIR-Russia Re-search Center as well.
with NeuRad detector demonstrator at FLNR JINR re-cently.
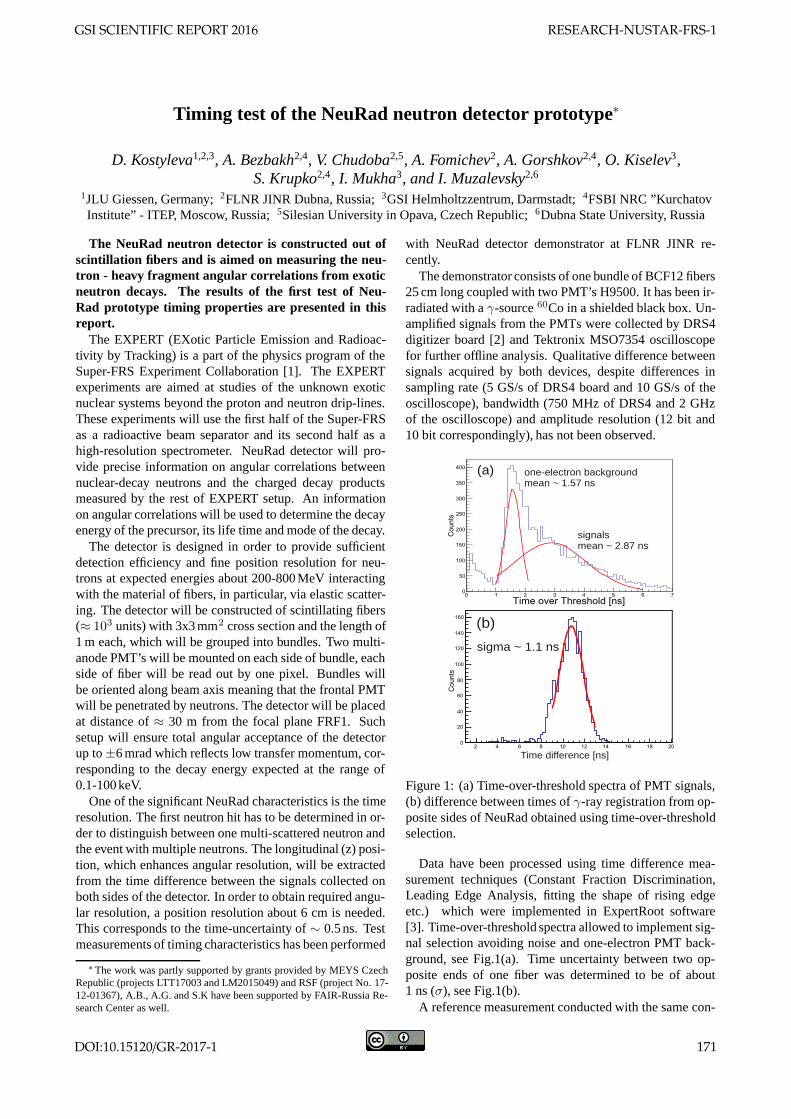
The demonstrator consists of one bundle of BCF12 fibers25 cm long coupled with two PMT’s H9500. It has been ir-radiated with a γ-source 60Co in a shielded black box. Un-amplified signals from the PMTs were collected by DRS4digitizer board [2] and Tektronix MSO7354 oscilloscopefor further offline analysis. Qualitative difference betweensignals acquired by both devices, despite differences insampling rate (5 GS/s of DRS4 board and 10 GS/s of theoscilloscope), bandwidth (750 MHz of DRS4 and 2 GHzof the oscilloscope) and amplitude resolution (12 bit and10 bit correspondingly), has not been observed.
sigma ~ 1.1 ns
Time difference [ns]
one-electron backgroundmean ~ 1.57 ns
signalsmean ~ 2.87 ns
(a)
(b)
Figure 1: (a) Time-over-threshold spectra of PMT signals,(b) difference between times of γ-ray registration from op-posite sides of NeuRad obtained using time-over-thresholdselection.
Data have been processed using time difference mea-surement techniques (Constant Fraction Discrimination,Leading Edge Analysis, fitting the shape of rising edgeetc.) which were implemented in ExpertRoot software[3]. Time-over-threshold spectra allowed to implement sig-nal selection avoiding noise and one-electron PMT back-ground, see Fig.1(a). Time uncertainty between two op-posite ends of one fiber was determined to be of about1 ns (σ), see Fig.1(b).
A reference measurement conducted with the same con-
GSI SCIENTIFIC REPORT 2016 RESEARCH-NUSTAR-FRS-1
DOI:10.15120/GR-2017-1 171
figuration of the setup but a thin (4 mm thick) BC-420square scintillator has shown that the time resolution canbe improved down to σ ≈ 0.5 - 0.7 ns.
The next test of NeuRad prototype is planned with themulti-channel electronics from the company PET SYSElectronics [4].
References
[1] J. Aysto et al. Nucl. Inst. Meth. in Phys. Res. B376 (2016)111
[2] https://www.psi.ch/drs/evaluation-board
[3] http://er.jinr.ru
[4] http://www.petsyselectronics.com/web/
RESEARCH-NUSTAR-FRS-1 GSI SCIENTIFIC REPORT 2016
172 DOI:10.15120/GR-2017-1
Time-of-Flight measurements with a liquid Cherenkov detector as a possibleTOF detector for the Super-FRS
N. Kuzminchuk-Feuerstein∗1, B. Voss1, E. Fiks2, and the SFRS collaboration1
1GSI, Darmstadt, Germany; 2National Research Tomsk Polytechnic University, Tomsk, Russia
Aiming to develop a system with a precision down toabout 50 ps in time and resistant to a high radiationrate of relativistic heavy ions of up to 107 per spill (atthe second focal plane), we have shown a conceptualdesign for a Cherenkov detector envisioned for the fu-ture TOF measurements employing a fluid radiator. Af-ter search of suitable radiator an Iodine-Naphthaleneliquid (C10H7I) is proposed [1]. The choice of theradiator was motivated by its high refractive index(n=1.7003) and relatively low density allowing to detectlow-energetic particles with minimized deterioration ofthe beam quality.
The first proof of principle experiment with a CherenkovTOF prototype detector using a C10H7I radiator was per-formed at the experimental place CaveC of the SIS facilityat GSI in April 2014 with 58Ni beam at 300 - 1500 MeV/u[2] [3]. In the summer 2016 a time-of-flight was measuredwith 124Xe ions with 600 MeV/u at CaveC.
Fig. 1 shows a layout of our experimental setup usedin the measurements with xenon ions. A quadratic plas-tic scintillator (S) is used as a start detector for time-of-flight measurements. Scintillator has a size of 5.5 x 5.5 x2 cm2 and placed in the vacuum chamber perpendicular tothe beam direction, directly at the beginning of HTD-beamline. The scintillation light is directly read out by 4 PMTs(Su, Sd, Sl, Sr), placed on the top, bottom, left and rightsides of the scintillator. For high accuracy timing measure-
Figure 1: Detector arrangement used in timing measure-ments with xenon ions at CaveC.
ments the VME - Module VFTX (VME-FPGA-TDC) [4]was used. First, the signals from two ends of the Cherenkovdetector (PMT1L, PMT2R) and four ends of the scintilla-tor counter were delivered to CFD. Then the TOF between
(Ch) and (S) was recorded by TDC.The timing of the detectors is calculated by taking the
average time detected by four PMTs of a plastic scintilla-tor < TS > and by two PMTs of a Cherenkov detector< TS >. Time-of-flight distribution between (Ch) and (S)detectors was measured as:
TOF (Ch− S) =< TCh > − < TS > (1)
The width of the time distribution is given by
σTOF =√σ2TCh
− σ2TS
(2)
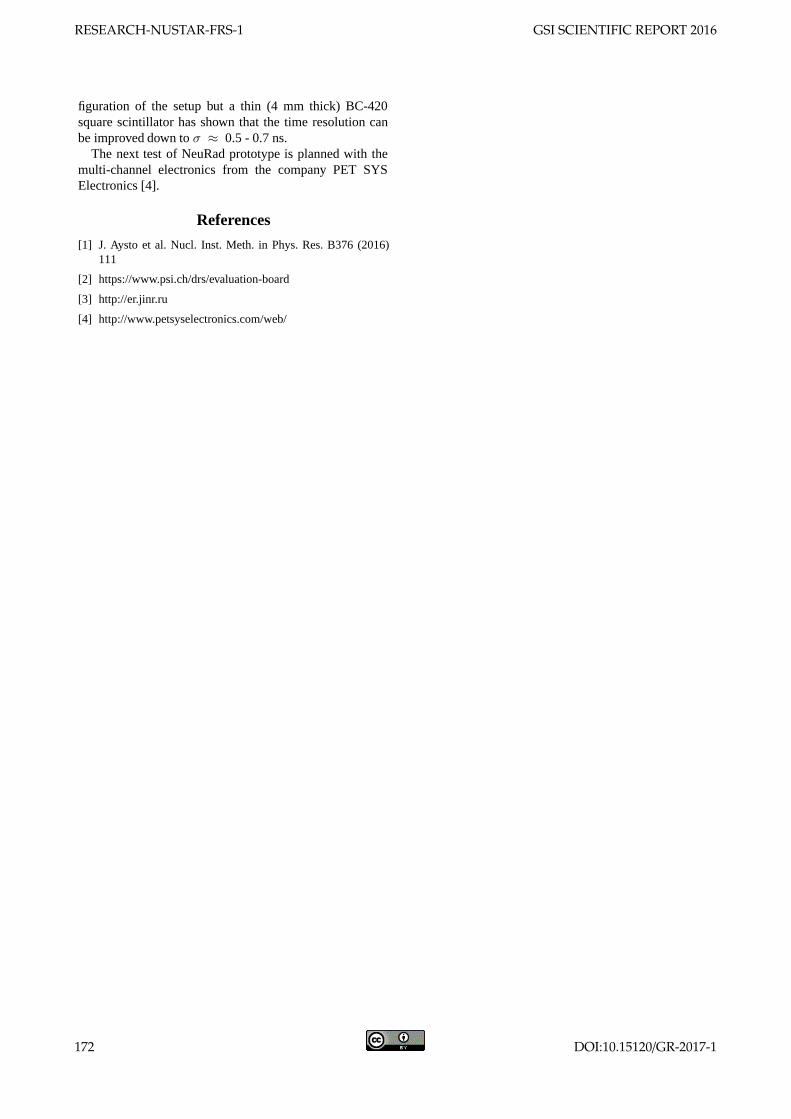
where σ is the accuracy of the TOF measurement. Fig. 2shows resulting time-of-flight distribution TOF (Ch− S).
Figure 2: Time-of-flight spectra TOF(C-S) measured withxenon ions between Cherenkov detector and plastic scin-tillator. The Gaussian fit is indicated with a red solid line.The width of the distribution equals 63 ps.
References
[1] N. Kuzminchuk-Feuerstein et. al., GSI Scientific Report2013, 103.
[2] N. Kuzminchuk-Feuerstein et. al., GSI Scientific Report2014, 141.
[3] N. Kuzminchuk-Feuerstein et. al., First beam test of a liquidCherenkov detector prototype for a future TOF measurementsat the Super-FRS, submitted to Nucl. Instrum. and Meth. A(2017).
[4] J. Fruhauf et. al., GSI Scientific Report 2012, 300.
GSI SCIENTIFIC REPORT 2016 RESEARCH-NUSTAR-FRS-2
DOI:10.15120/GR-2017-1 173
Systematic investigations of charge states and purity of projectile and fissionfragments extracted from the stopping cell of the (Super-)FRS ∗
I. Miskun1, A.-K. Rink1, F. Greiner1, S. Ayet1,2, S. Bagchi2, J. Bergmann1, P. Constantin3, T. Dickel2,J. Ebert1, A. Finley4, H. Geissel1,2, E. Haettner2, C. Hornung1, S. Kaur5, W. Lippert1, I. Mardor6,7,
B. Mei3, I. Moore8, J.-H. Otto1, S. Pietri2, A. Pikhtelev9, W. R. Plaß1,2, I. Pohjalainen8,A. Prochazka2, S. Purushothaman2, C. Rappold2, M. P. Reiter4, C. Scheidenberger1,2, Y. Tanaka2,
H. Toernqvist2, H. Weick2, J. S. Winfield2, X.Xu2, and M. Yavor10
1JLU, Gießen, Germany; 2GSI, Darmstadt, Germany; 3ELI-NP, Bucharest, Romania; 4TRIUMF, Vancouver, Canada;5Saint Mary’s Univ., Halifax, Canada; 6Tel Aviv University, Israel; 7Soreq NRC, Yavne, Israel; 8Univ. of Jyvaskyla,
Finland; 9Inst. for Energy Problems of Chem. Phys., RAS, Chernogolovka, Russia; 10IAI, RAS, St. Petersburg, Russia
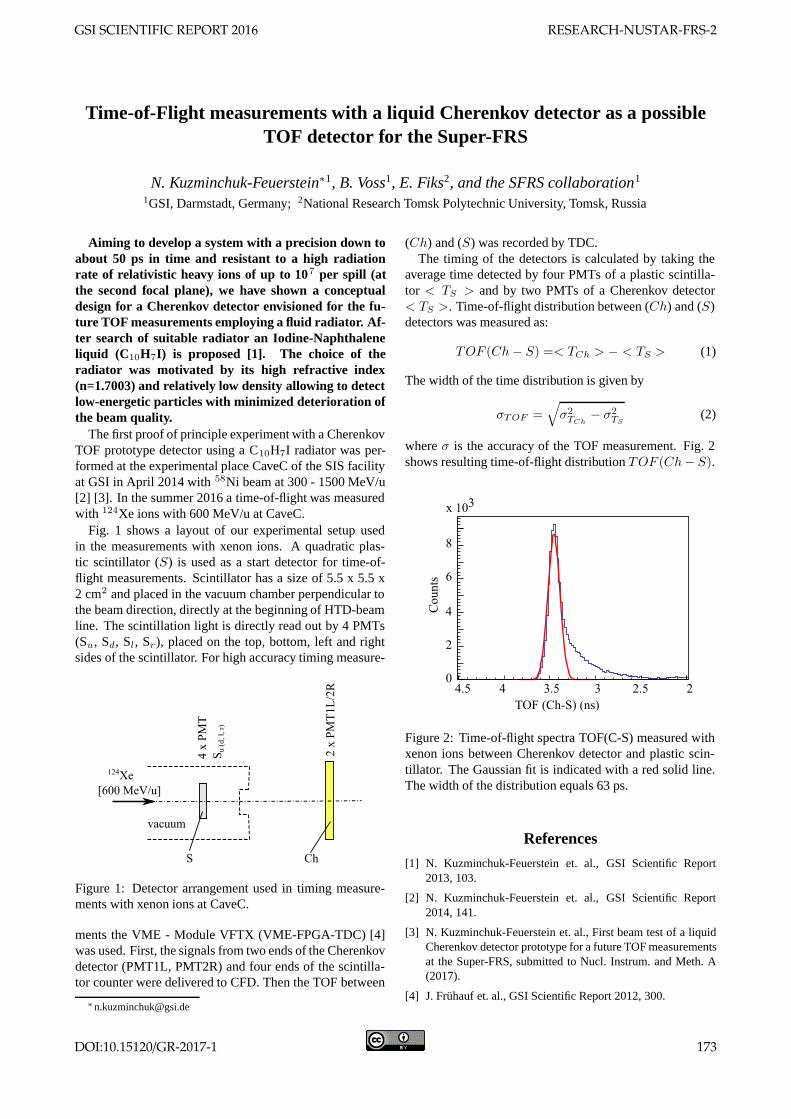
The prototype of the cryogenic stopping cell (CSC) [1]for the Low-Energy Branch of the Super-FRS has been de-veloped and successfully commissioned as a part of theFRS Ion Catcher experiment [2] at GSI. In several experi-ments various 238U and 124Xe projectile and fission frag-ments were produced, separated and range-bunched in theFRS, thermalized, extracted from the CSC and identified.The measured charge states of the extracted ions are shownin the bottom section of each element in Fig.1. In the topsection of each element the predicted charge states are pre-sented, based on the assumption that charge exchange pro-cesses in the CSC are defined by the ionization potentialof its contaminants and dominated by N2 molecules, whichare present in trace amounts in the He buffer gas. The re-sults indicate that this assumption is correct and there areno contaminants such as O2, oil, water, etc. in the CSC.Further purification of the buffer gas can result in the sur-vival of higher charge states of the thermalized ions and,therefore, limitations of the mass range of the ions trans-mitted by the RF carpet. In the future [3] trace gases willbe used to control the charge state of thermalized ions.
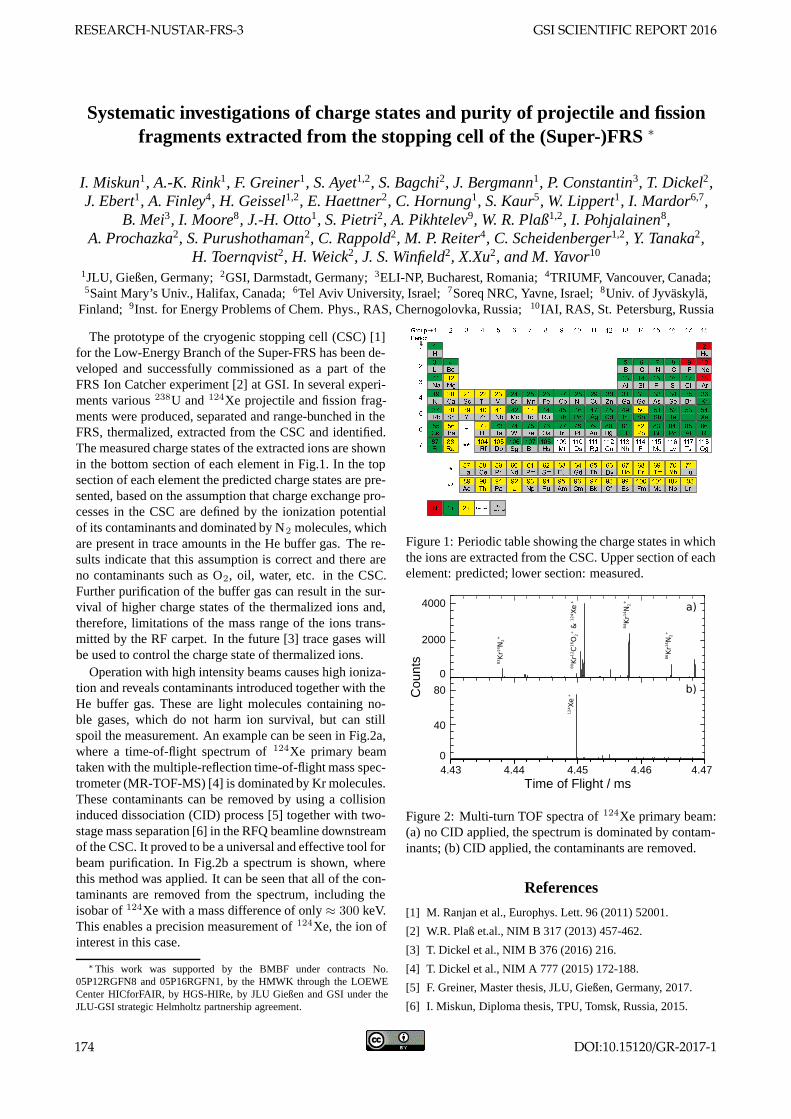
Operation with high intensity beams causes high ioniza-tion and reveals contaminants introduced together with theHe buffer gas. These are light molecules containing no-ble gases, which do not harm ion survival, but can stillspoil the measurement. An example can be seen in Fig.2a,where a time-of-flight spectrum of 124Xe primary beamtaken with the multiple-reflection time-of-flight mass spec-trometer (MR-TOF-MS) [4] is dominated by Kr molecules.These contaminants can be removed by using a collisioninduced dissociation (CID) process [5] together with two-stage mass separation [6] in the RFQ beamline downstreamof the CSC. It proved to be a universal and effective tool forbeam purification. In Fig.2b a spectrum is shown, wherethis method was applied. It can be seen that all of the con-taminants are removed from the spectrum, including theisobar of 124Xe with a mass difference of only ≈ 300 keV.This enables a precision measurement of 124Xe, the ion ofinterest in this case.
∗This work was supported by the BMBF under contracts No.05P12RGFN8 and 05P16RGFN1, by the HMWK through the LOEWECenter HICforFAIR, by HGS-HIRe, by JLU Gießen and GSI under theJLU-GSI strategic Helmholtz partnership agreement.
�
� � � � � � � �� �� �� �� �� �� �� �� �
�
�
�
�
�
�
�
� ����� ���
� ������ �� �� �� �� �� �� � �! " # � � � � ���$% &' (% ) �� *+ �, -. /0 &1 (2 -� $3 -4 /. �5+ #"� #"� #"� #"� #" #"! ##" ### ##� ##� ##� ##� ##� ##� ## �
61 �1 72 89�% �' :� $; &+ 8. :+ 5< =; >? (+ *17,
�#&�&
� � � � ! #"�$� $ 5 = * 7 =�>3#� #� #� #� #� #� # ##81 /2 63 - 6 52 /,=%�" �# �� �� �� �� �� �� � �! �" �# �� �� �� �� ��#!5% 69 (3 @ 5, 8< 7� 54 =3 50 A< B% B� /+ 6� $, C,C� �! �" �# �� �� �� �� �� �� � �! �" �# �� �� ����
/16, D A, =� 84 (9 �0 �; -E 5E �< 6< 6� (�
�� � �! �" �# �� �� �� �� �� �� � �! �" �#:F>% 5� -, =E -G 6G H0 BE (� &4 H, (G D� >0
! !" !# !� !� !� !� !� !� ! !! #"" #"# #"� #"�/9 (; -% I =J -0 /G 5G $K 5' H+ 7G 8E =4 >,
= #L �L
�
��
��
MNONPQN RPSTUVWXYUZ
Figure 1: Periodic table showing the charge states in whichthe ions are extracted from the CSC. Upper section of eachelement: predicted; lower section: measured.
4.43 4.44 4.45 4.46 4.470
40
800
2000
4000
Time of Flight / ms
Cou
nts 83Kr
14N 2
+
80Kr
12C1
6 O2+&
124 Xe+
124 Xe+
84Kr
14N 2
+
86Kr
14N 2
+
a)
b)
Figure 2: Multi-turn TOF spectra of 124Xe primary beam:(a) no CID applied, the spectrum is dominated by contam-inants; (b) CID applied, the contaminants are removed.
References
[1] M. Ranjan et al., Europhys. Lett. 96 (2011) 52001.
[2] W.R. Plaß et.al., NIM B 317 (2013) 457-462.
[3] T. Dickel et al., NIM B 376 (2016) 216.
[4] T. Dickel et al., NIM A 777 (2015) 172-188.
[5] F. Greiner, Master thesis, JLU, Gießen, Germany, 2017.
[6] I. Miskun, Diploma thesis, TPU, Tomsk, Russia, 2015.
RESEARCH-NUSTAR-FRS-3 GSI SCIENTIFIC REPORT 2016
174 DOI:10.15120/GR-2017-1
Complete ion identification by proton and mass number via high-resolutionmass spectrometry at the (Super-)FRS ∗
C. Hornung1, S. Ayet1,2, S. Bagchi2, J. Bergmann1, P. Constantin3, T. Dickel2, J. Ebert1, A. Finlay4,H. Geissel1,2, F. Greiner1, E. Haettner2, S. Kaur5, W. Lippert1, I. Mardor6, B. Mei3, I. Miskun2, I. D.
Moore7, J.-H. Otto1, S. Pietri2, A. Pikhtelev8, W. R. Plaß1,2, I. Pohjalainen7, A. Prochazka2, S.Purushothaman2, C. Rappold2, M. P. Reiter4, A.-K. Rink1, C. Scheidenberger1,2, Y. Tanaka2, H.
Toernqvist2, H. Weick2, J. S. Winfield2, X. Xu1,2, and M. I. Yavor9
1JLU, Gießen, Germany; 2GSI, Darmstadt, Germany; 3ELI-NP, Bucharest, Romania; 4TRIUMF, Vancouver, Canada;5Astronomy and Phys. Dep., Saint Mary’s Univ., Halifax, Canada; 6Soreq NRC, Yavna, Israel; 7Univ. of Jyvaskyla,
Finland; 8Inst. for Energy Problems of Chem. Phys., RAS, Chernogolovka, Russia; 9IAI, RAS, St. Petersburg, Russia
Ion identification and separation are important at allpresent and future rare-isotope facilities. The in-flight sep-arators FRS / Super-FRS [1, 2] use the Bρ − ∆E − Bρmethod to achieve isotopic-spatial separation. At rela-tivistic velocities the verification of the particle identifica-tion (PID) by proton number (Z) and mass number (A) ofthe selected bare ions can be easily performed with par-ticle detectors via velocity, energy-deposition and mag-netic rigidity measurements in coincidence. Still the sep-aration and identification require both an elaborated ab-solute calibration. At lower velocities (300 MeV/u), thefragments emerge from the target in different ionic chargestates which makes an unambiguous PID very difficult.Here, we demonstrate that high-resolution mass spectrom-etry represents a universal method to provide an unambigu-ous PID at the final focal plane of the FRS.
In our previous FRS experiments we reached a massresolving power (MRP) of 450000 with the multiple-reflection time-of-flight mass spectrometer (MR-TOF-MS)[3]. It is part of the FRS Ion Catcher [4], which is a testbench for the Low-Energy-Branch (LEB) of the Super-FRS[2] at FAIR. Together with a cryogenic gas-filled stoppingcell (CSC) the MR-TOF-MS has the capability to performa complete PID of exotic nuclei based on their mass-to-charge ratio only.
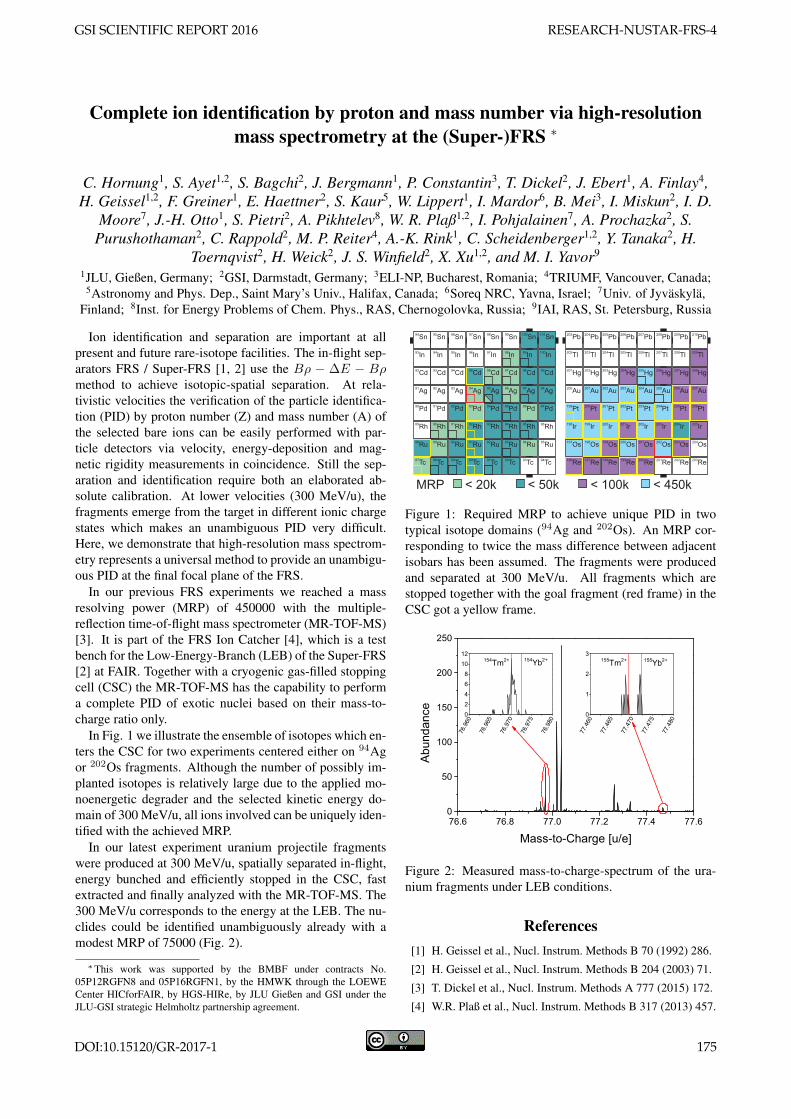
In Fig. 1 we illustrate the ensemble of isotopes which en-ters the CSC for two experiments centered either on 94Agor 202Os fragments. Although the number of possibly im-planted isotopes is relatively large due to the applied mo-noenergetic degrader and the selected kinetic energy do-main of 300 MeV/u, all ions involved can be uniquely iden-tified with the achieved MRP.
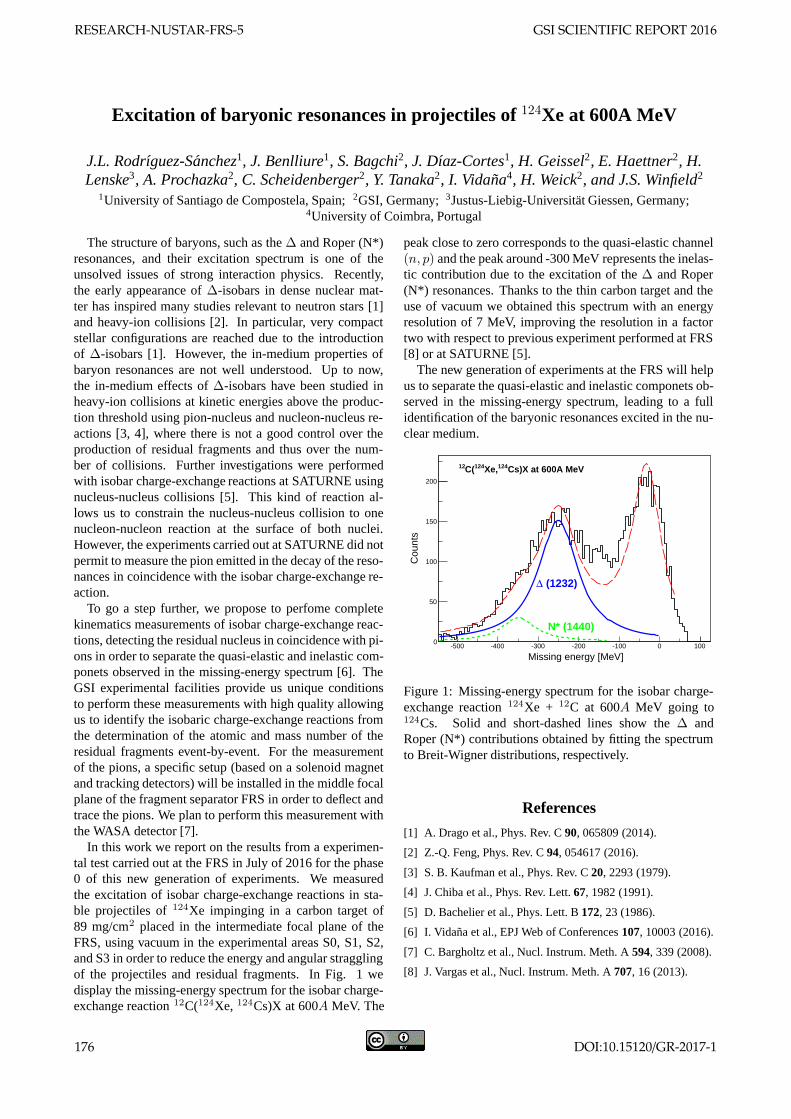
In our latest experiment uranium projectile fragmentswere produced at 300 MeV/u, spatially separated in-flight,energy bunched and efficiently stopped in the CSC, fastextracted and finally analyzed with the MR-TOF-MS. The300 MeV/u corresponds to the energy at the LEB. The nu-clides could be identified unambiguously already with amodest MRP of 75000 (Fig. 2).
∗This work was supported by the BMBF under contracts No.05P12RGFN8 and 05P16RGFN1, by the HMWK through the LOEWECenter HICforFAIR, by HGS-HIRe, by JLU Gießen and GSI under theJLU-GSI strategic Helmholtz partnership agreement.
99Sn
100Sn
101Sn
98Sn
97Sn
96Sn
95Sn
94Sn
98In
97Cd
96Ag
95Pd
90Rh
94Ru
91Tc
99In
100In
97In
96In
95In
94In
93In
98Cd
99Cd
96Cd
95Cd
94Cd
93Cd
92Cd
95Ag
94Ag
93Ag
92Ag
91Ag
97Ag
98Ag
96Pd
97Pd
94Pd
92Pd
93Pd
91Pd
90Pd
93Rh
95Rh
96Rh
91Rh
92Rh
89Rh
94Rh
95Ru
92Ru
91Ru
90Ru
89Ru
88Ru
93Ru
93Tc
94Tc
90Tc
89Tc
88Tc
87Tc
92Tc
208Pb
209Pb
210Pb
207Pb
206Pb
205Pb
204Pb
203Pb
207Tl
206Hg
205Au
204Pt
199Ir
203Os
200Re
208Tl
209Tl
206Tl
205Tl
204Tl
203Tl
202Tl
207Hg
208Hg
205Hg
204Hg
203Hg
202Hg
201Hg
204Au
203Au
202Au
201Au
200Au
206Au
207Au
205Pt
206Pt
203Pt
201Pt
202Pt
200Pt
199Pt
202Ir
204Ir
205Ir
200Ir
201Ir
198Ir
203Ir
204Os
201Os
200Os
199Os
198Os
197Os
202Os
202Re
203Re
199Re
198Re
197Re
196Re
201Re
< 20k < 50k < 100k < 450kMRP
Figure 1: Required MRP to achieve unique PID in twotypical isotope domains (94Ag and 202Os). An MRP cor-responding to twice the mass difference between adjacentisobars has been assumed. The fragments were producedand separated at 300 MeV/u. All fragments which arestopped together with the goal fragment (red frame) in theCSC got a yellow frame.
76.6 76.8 77.0 77.2 77.4 77.60
50
100
150
200
250
Abu
ndan
ce
Mass-to-Charge [u/e]
76.960
76.965
76.970
76.975
76.980
0
24
6
810
12
154Tm2+ 154Yb2+
77.460
77.465
77.470
77.475
77.480
0
1
2
3
155Tm2+ 155Yb2+
Figure 2: Measured mass-to-charge-spectrum of the ura-nium fragments under LEB conditions.
References[1] H. Geissel et al., Nucl. Instrum. Methods B 70 (1992) 286.
[2] H. Geissel et al., Nucl. Instrum. Methods B 204 (2003) 71.
[3] T. Dickel et al., Nucl. Instrum. Methods A 777 (2015) 172.
[4] W.R. Plaß et al., Nucl. Instrum. Methods B 317 (2013) 457.
GSI SCIENTIFIC REPORT 2016 RESEARCH-NUSTAR-FRS-4
DOI:10.15120/GR-2017-1 175
Excitation of baryonic resonances in projectiles of 124Xe at 600A MeV
J.L. Rodrıguez-Sanchez1, J. Benlliure1, S. Bagchi2, J. Dıaz-Cortes1, H. Geissel2, E. Haettner2, H.Lenske3, A. Prochazka2, C. Scheidenberger2, Y. Tanaka2, I. Vidana4, H. Weick2, and J.S. Winfield2
1University of Santiago de Compostela, Spain; 2GSI, Germany; 3Justus-Liebig-Universitat Giessen, Germany;4University of Coimbra, Portugal
The structure of baryons, such as the Δ and Roper (N*)resonances, and their excitation spectrum is one of theunsolved issues of strong interaction physics. Recently,the early appearance of Δ-isobars in dense nuclear mat-ter has inspired many studies relevant to neutron stars [1]and heavy-ion collisions [2]. In particular, very compactstellar configurations are reached due to the introductionof Δ-isobars [1]. However, the in-medium properties ofbaryon resonances are not well understood. Up to now,the in-medium effects of Δ-isobars have been studied inheavy-ion collisions at kinetic energies above the produc-tion threshold using pion-nucleus and nucleon-nucleus re-actions [3, 4], where there is not a good control over theproduction of residual fragments and thus over the num-ber of collisions. Further investigations were performedwith isobar charge-exchange reactions at SATURNE usingnucleus-nucleus collisions [5]. This kind of reaction al-lows us to constrain the nucleus-nucleus collision to onenucleon-nucleon reaction at the surface of both nuclei.However, the experiments carried out at SATURNE did notpermit to measure the pion emitted in the decay of the reso-nances in coincidence with the isobar charge-exchange re-action.
To go a step further, we propose to perfome completekinematics measurements of isobar charge-exchange reac-tions, detecting the residual nucleus in coincidence with pi-ons in order to separate the quasi-elastic and inelastic com-ponets observed in the missing-energy spectrum [6]. TheGSI experimental facilities provide us unique conditionsto perform these measurements with high quality allowingus to identify the isobaric charge-exchange reactions fromthe determination of the atomic and mass number of theresidual fragments event-by-event. For the measurementof the pions, a specific setup (based on a solenoid magnetand tracking detectors) will be installed in the middle focalplane of the fragment separator FRS in order to deflect andtrace the pions. We plan to perform this measurement withthe WASA detector [7].
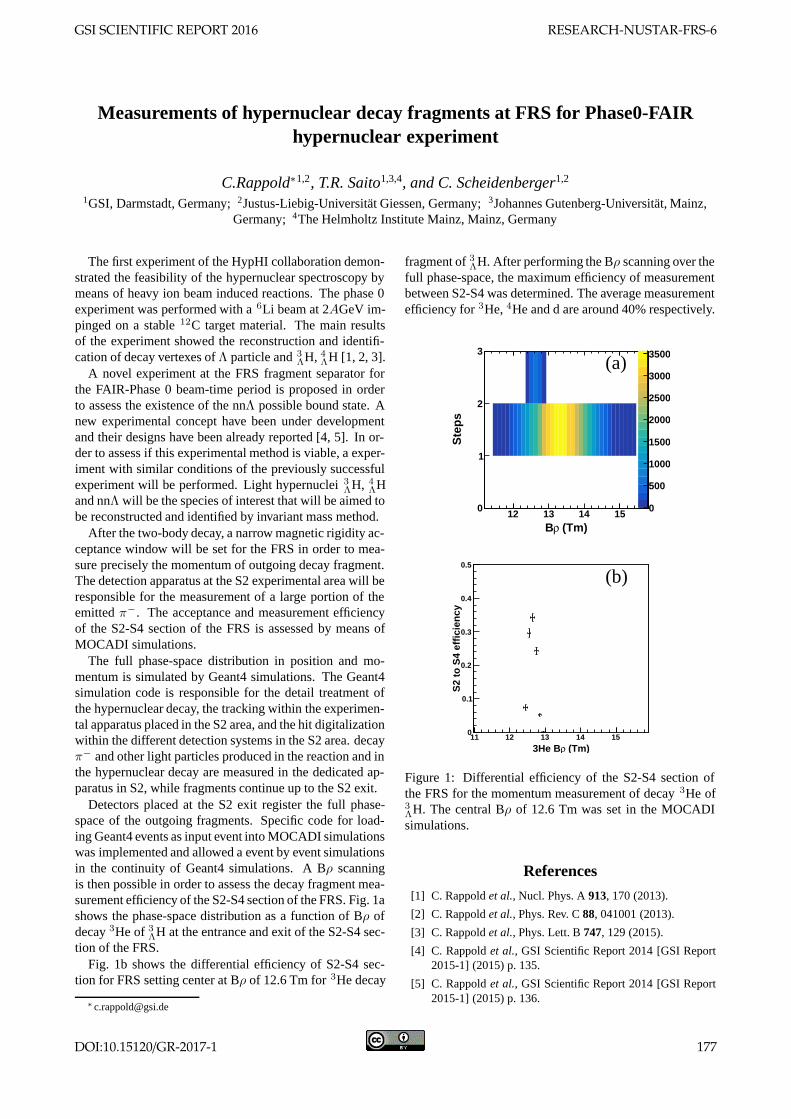
In this work we report on the results from a experimen-tal test carried out at the FRS in July of 2016 for the phase0 of this new generation of experiments. We measuredthe excitation of isobar charge-exchange reactions in sta-ble projectiles of 124Xe impinging in a carbon target of89 mg/cm2 placed in the intermediate focal plane of theFRS, using vacuum in the experimental areas S0, S1, S2,and S3 in order to reduce the energy and angular stragglingof the projectiles and residual fragments. In Fig. 1 wedisplay the missing-energy spectrum for the isobar charge-exchange reaction 12C(124Xe, 124Cs)X at 600A MeV. The
peak close to zero corresponds to the quasi-elastic channel(n, p) and the peak around -300 MeV represents the inelas-tic contribution due to the excitation of the Δ and Roper(N*) resonances. Thanks to the thin carbon target and theuse of vacuum we obtained this spectrum with an energyresolution of 7 MeV, improving the resolution in a factortwo with respect to previous experiment performed at FRS[8] or at SATURNE [5].
The new generation of experiments at the FRS will helpus to separate the quasi-elastic and inelastic componets ob-served in the missing-energy spectrum, leading to a fullidentification of the baryonic resonances excited in the nu-clear medium.
Missing energy [MeV]-500 -400 -300 -200 -100 0 100
Cou
nts
0
50
100
150
200
(1232)Δ
N* (1440)
Cs)X at 600A MeV124Xe,124C(12
Figure 1: Missing-energy spectrum for the isobar charge-exchange reaction 124Xe + 12C at 600A MeV going to124Cs. Solid and short-dashed lines show the Δ andRoper (N*) contributions obtained by fitting the spectrumto Breit-Wigner distributions, respectively.
References
[1] A. Drago et al., Phys. Rev. C 90, 065809 (2014).
[2] Z.-Q. Feng, Phys. Rev. C 94, 054617 (2016).
[3] S. B. Kaufman et al., Phys. Rev. C 20, 2293 (1979).
[4] J. Chiba et al., Phys. Rev. Lett. 67, 1982 (1991).
[5] D. Bachelier et al., Phys. Lett. B 172, 23 (1986).
[6] I. Vidana et al., EPJ Web of Conferences 107, 10003 (2016).
[7] C. Bargholtz et al., Nucl. Instrum. Meth. A 594, 339 (2008).
[8] J. Vargas et al., Nucl. Instrum. Meth. A 707, 16 (2013).
RESEARCH-NUSTAR-FRS-5 GSI SCIENTIFIC REPORT 2016
176 DOI:10.15120/GR-2017-1
Measurements of hypernuclear decay fragments at FRS for Phase0-FAIRhypernuclear experiment
C.Rappold∗1,2, T.R. Saito1,3,4, and C. Scheidenberger1,2
1GSI, Darmstadt, Germany; 2Justus-Liebig-Universitat Giessen, Germany; 3Johannes Gutenberg-Universitat, Mainz,Germany; 4The Helmholtz Institute Mainz, Mainz, Germany
The first experiment of the HypHI collaboration demon-strated the feasibility of the hypernuclear spectroscopy bymeans of heavy ion beam induced reactions. The phase 0experiment was performed with a 6Li beam at 2AGeV im-pinged on a stable 12C target material. The main resultsof the experiment showed the reconstruction and identifi-cation of decay vertexes of Λ particle and 3
ΛH, 4ΛH [1, 2, 3].A novel experiment at the FRS fragment separator for
the FAIR-Phase 0 beam-time period is proposed in orderto assess the existence of the nnΛ possible bound state. Anew experimental concept have been under developmentand their designs have been already reported [4, 5]. In or-der to assess if this experimental method is viable, a exper-iment with similar conditions of the previously successfulexperiment will be performed. Light hypernuclei 3
ΛH, 4ΛH
and nnΛ will be the species of interest that will be aimed tobe reconstructed and identified by invariant mass method.
After the two-body decay, a narrow magnetic rigidity ac-ceptance window will be set for the FRS in order to mea-sure precisely the momentum of outgoing decay fragment.The detection apparatus at the S2 experimental area will beresponsible for the measurement of a large portion of theemitted π−. The acceptance and measurement efficiencyof the S2-S4 section of the FRS is assessed by means ofMOCADI simulations.
The full phase-space distribution in position and mo-mentum is simulated by Geant4 simulations. The Geant4simulation code is responsible for the detail treatment ofthe hypernuclear decay, the tracking within the experimen-tal apparatus placed in the S2 area, and the hit digitalizationwithin the different detection systems in the S2 area. decayπ− and other light particles produced in the reaction and inthe hypernuclear decay are measured in the dedicated ap-paratus in S2, while fragments continue up to the S2 exit.
Detectors placed at the S2 exit register the full phase-space of the outgoing fragments. Specific code for load-ing Geant4 events as input event into MOCADI simulationswas implemented and allowed a event by event simulationsin the continuity of Geant4 simulations. A Bρ scanningis then possible in order to assess the decay fragment mea-surement efficiency of the S2-S4 section of the FRS. Fig. 1ashows the phase-space distribution as a function of Bρ ofdecay 3He of 3
ΛH at the entrance and exit of the S2-S4 sec-tion of the FRS.
Fig. 1b shows the differential efficiency of S2-S4 sec-tion for FRS setting center at Bρ of 12.6 Tm for 3He decay
fragment of 3ΛH. After performing the Bρ scanning over the
full phase-space, the maximum efficiency of measurementbetween S2-S4 was determined. The average measurementefficiency for 3He, 4He and d are around 40% respectively.
(Tm)ρB12 13 14 15
Ste
ps
0
1
2
3
0
500
1000
1500
2000
2500
3000
3500(a)
(Tm)ρ3He B11 12 13 14 15
S2
to S
4 ef
fici
ency
0
0.1
0.2
0.3
0.4
0.5
(b)
Figure 1: Differential efficiency of the S2-S4 section ofthe FRS for the momentum measurement of decay 3He of3ΛH. The central Bρ of 12.6 Tm was set in the MOCADIsimulations.
References
[1] C. Rappold et al., Nucl. Phys. A 913, 170 (2013).
[2] C. Rappold et al., Phys. Rev. C 88, 041001 (2013).
[3] C. Rappold et al., Phys. Lett. B 747, 129 (2015).
[4] C. Rappold et al., GSI Scientific Report 2014 [GSI Report2015-1] (2015) p. 135.
[5] C. Rappold et al., GSI Scientific Report 2014 [GSI Report2015-1] (2015) p. 136.
GSI SCIENTIFIC REPORT 2016 RESEARCH-NUSTAR-FRS-6
DOI:10.15120/GR-2017-1 177
Particle identification using cylindrical detector system for Phase0-FAIRhypernuclear experiment
C.Rappold∗1,2, T.R. Saito1,3,4, and C. Scheidenberger1,2
1GSI, Darmstadt, Germany; 2Justus-Liebig-Universitat Giessen, Germany; 3Johannes Gutenberg-Universitat, Mainz,Germany; 4The Helmholtz Institute Mainz, Mainz, Germany
The feasibility of the hypernuclear spectroscopy bymeans of heavy ion beam induced reactions was demon-strated by the results obtained in the first experiment ofthe HypHI collaboration. A 6Li beam at 2AGeV impingedon a stable 12C target. The main results of the experimentshowed the measurements of Λ hyperon and 3
ΛH, 4ΛH. Re-
sults on the invariant masses, lifetime and production crosssections were published [1, 2, 3].
For the FAIR-Phase 0 beam-time a new hypernuclearspectroscopy experiment is proposed in order to assess theexistence of the nnΛ possible bound state. This novel ex-periment will take place at the FRS fragment separator.The section TA-S1-S2 of FRS will use to deliver the sta-ble beam with a energy of 2AGeV to the S2 experimentalarea. In the S2 area, the possibility to install a cylindricaldetector system that involved a solenoid magnet is consid-ered as described in [4]. A target will placed around 40cm to 60 cm upstream to this detection system. The lighthadrons, π−, π+, K+, K−, and protons will be able to bemeasured by the cylindrical system. A central drift cham-ber and hodoscope barrel will be responsible for the maintracking system for the momentum measurement. Addi-tional planar tracker stations will be placed in the upstreamarea of the detection system. The most important aspect ofthis cylindrical detector system will be to precisely measurethe decay π− from the nnΛ and other produced hypernu-clei. As well the produced kaons from the strangeness s-sproduction will be possible to be measured and identified.After the hypernuclear two-body decay, a narrow magneticrigidity acceptance window will be set for the S2-S4 sec-tion of FRS in order to measure precisely the momentumof outgoing decay fragment.
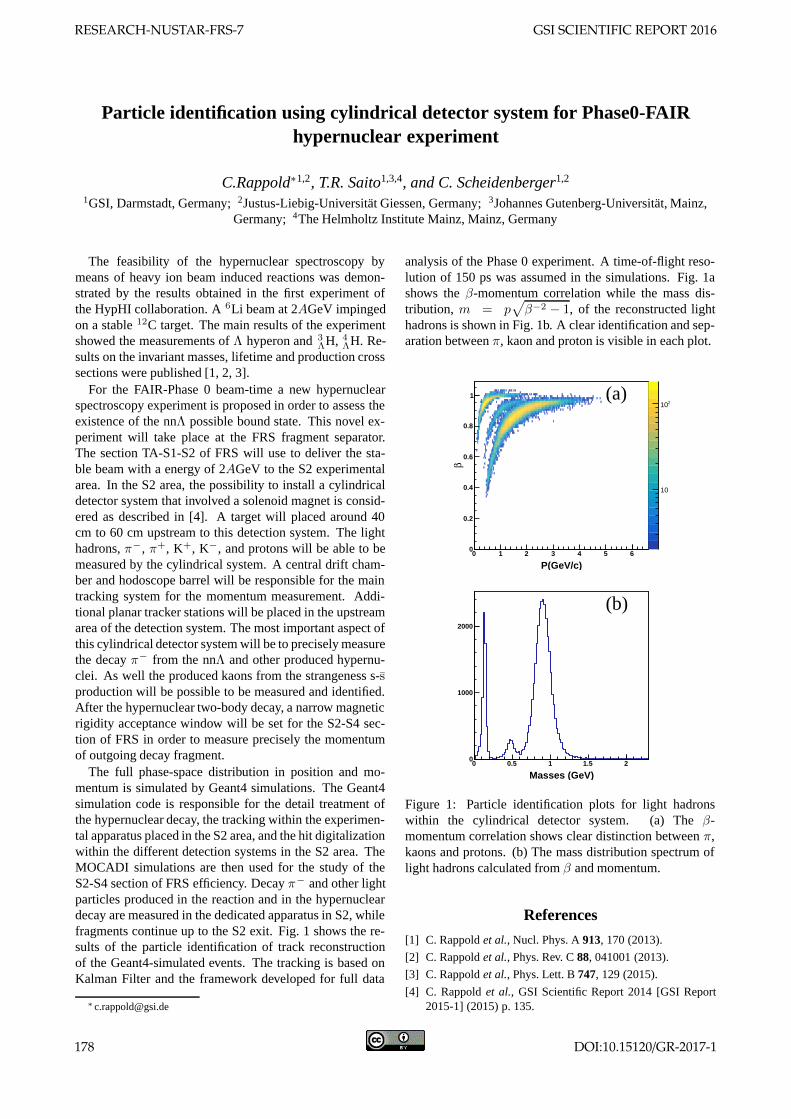
The full phase-space distribution in position and mo-mentum is simulated by Geant4 simulations. The Geant4simulation code is responsible for the detail treatment ofthe hypernuclear decay, the tracking within the experimen-tal apparatus placed in the S2 area, and the hit digitalizationwithin the different detection systems in the S2 area. TheMOCADI simulations are then used for the study of theS2-S4 section of FRS efficiency. Decay π− and other lightparticles produced in the reaction and in the hypernucleardecay are measured in the dedicated apparatus in S2, whilefragments continue up to the S2 exit. Fig. 1 shows the re-sults of the particle identification of track reconstructionof the Geant4-simulated events. The tracking is based onKalman Filter and the framework developed for full data
analysis of the Phase 0 experiment. A time-of-flight reso-lution of 150 ps was assumed in the simulations. Fig. 1ashows the β-momentum correlation while the mass dis-tribution, m = p
√β−2 − 1, of the reconstructed light
hadrons is shown in Fig. 1b. A clear identification and sep-aration between π, kaon and proton is visible in each plot.
P(GeV/c)0 1 2 3 4 5 6
β
0
0.2
0.4
0.6
0.8
1
10
210(a)
Masses (GeV)0 0.5 1 1.5 2
0
1000
2000
(b)
Figure 1: Particle identification plots for light hadronswithin the cylindrical detector system. (a) The β-momentum correlation shows clear distinction between π,kaons and protons. (b) The mass distribution spectrum oflight hadrons calculated from β and momentum.
References
[1] C. Rappold et al., Nucl. Phys. A 913, 170 (2013).
[2] C. Rappold et al., Phys. Rev. C 88, 041001 (2013).
[3] C. Rappold et al., Phys. Lett. B 747, 129 (2015).
[4] C. Rappold et al., GSI Scientific Report 2014 [GSI Report2015-1] (2015) p. 135.
RESEARCH-NUSTAR-FRS-7 GSI SCIENTIFIC REPORT 2016
178 DOI:10.15120/GR-2017-1
Simulations of RCE, ChR & HWC channeling
H. Geissel1, O.V. Bogdanov∗2, C. Scheidenberger1, Yu.L. Pivovarov2, N. Kuzminchuk-Feuerstein1,E.I. Rozhkova2, T.A. Tukhfatullin2, and the Super-FRS Experiment Collaboration1
1GSI, Darmstadt, Germany; 2National Research Tomsk Polytechnic University, Russia
The perspective atomic physics experiments are the partof Super-FRS collaboration program [1], in particular forthe first time to observe the nuclear Okorokov effect ofresonant coherent excitation (RCE) of relativistic nucleipassing through a crystal [2]. The RHI beam energy atSuper-FRS is up to 1500 MeV/u, and perturbation har-monic energy at axial channelling in a crystal is equal to�ωn = (2π�c/d) · γ · β · n, n=1,2,.., where d is the spac-ing between atoms in the crystal axis, γ is the relativisticfactor and β = υ/c, with υ being RHI velocity. For RCE,the transition energy between ground and excited state ofprojectile nucleus should match perturbation harmonic en-ergy. For a case of ¡100¿ channelling in W crystal, theharmonic energy equals �ωn = 3.92 · γ · β · n keV [2].Therefore, at γβ ∼=2 the energies of the first three strongperturbation harmonics are �ω1=7.84 keV, �ω2=15.68 keVand �ω3=23.52 keV. At Super-FRS, RCE experiments willbe performed with exotic nuclei. Detailed simulations ofnuclear RCE using the BCM-2.0 code [3] are in progress.
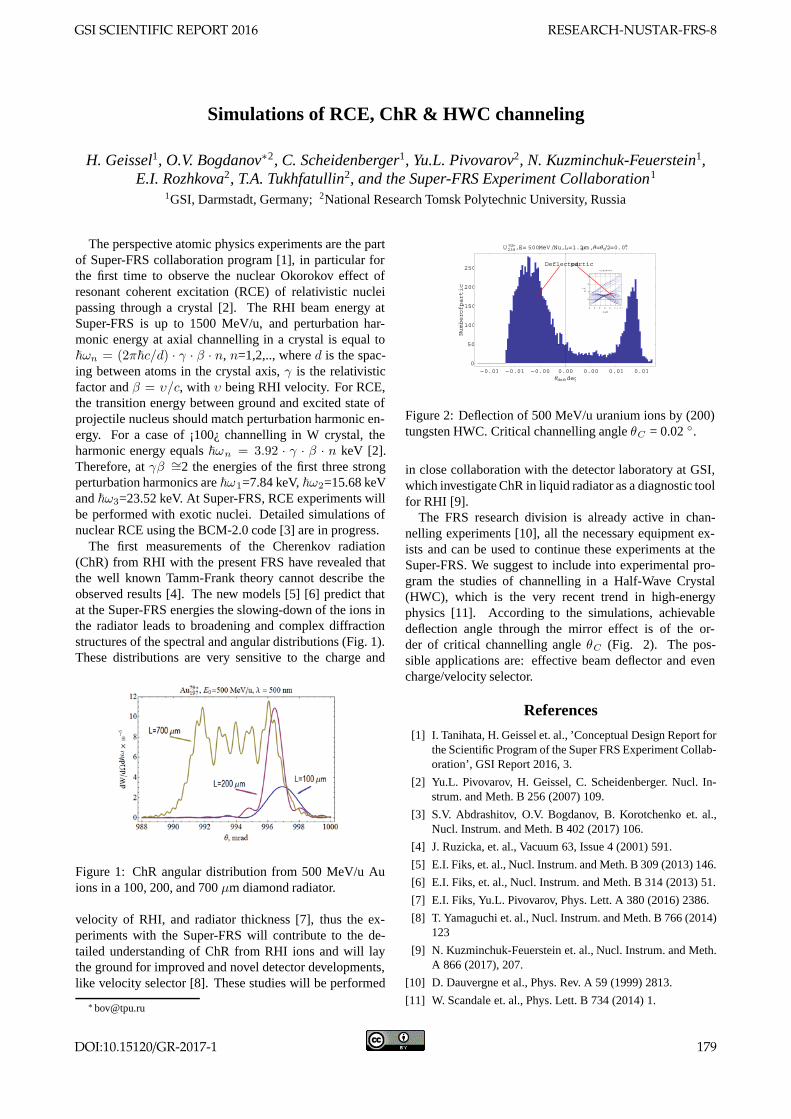
The first measurements of the Cherenkov radiation(ChR) from RHI with the present FRS have revealed thatthe well known Tamm-Frank theory cannot describe theobserved results [4]. The new models [5] [6] predict thatat the Super-FRS energies the slowing-down of the ions inthe radiator leads to broadening and complex diffractionstructures of the spectral and angular distributions (Fig. 1).These distributions are very sensitive to the charge and
Figure 1: ChR angular distribution from 500 MeV/u Auions in a 100, 200, and 700 μm diamond radiator.
velocity of RHI, and radiator thickness [7], thus the ex-periments with the Super-FRS will contribute to the de-tailed understanding of ChR from RHI ions and will laythe ground for improved and novel detector developments,like velocity selector [8]. These studies will be performed
Deflectedparticl
0.00.20.40.60.81.01.2
0
1
2
3
z,Μm
x,Ao
trajecto
�0.01 �0.01 �0.00 0.00 0.00 0.01 0.010
50
100
150
200
250
Θdef,deg
Numberofpartic
U 23892�,E� 500MeV �Nu,L�1.2Μm ,Θ�Θc�2�0.01o
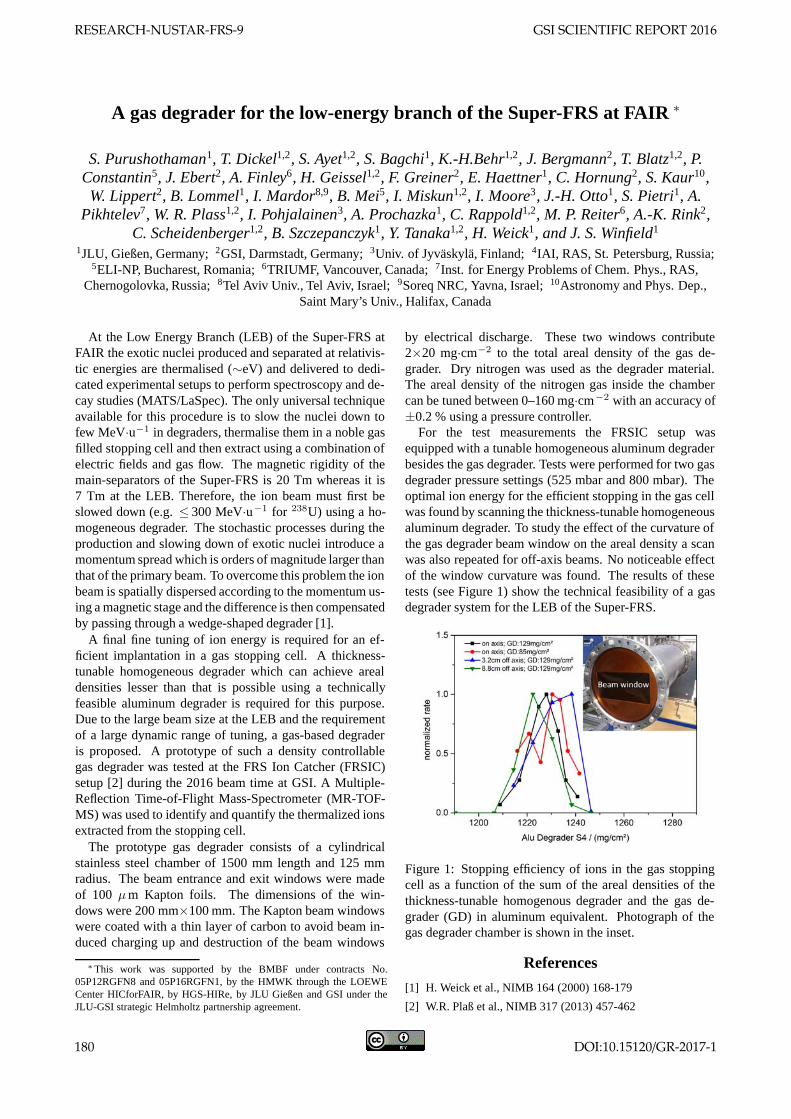
Figure 2: Deflection of 500 MeV/u uranium ions by (200)tungsten HWC. Critical channelling angle θC = 0.02 ◦.
in close collaboration with the detector laboratory at GSI,which investigate ChR in liquid radiator as a diagnostic toolfor RHI [9].
The FRS research division is already active in chan-nelling experiments [10], all the necessary equipment ex-ists and can be used to continue these experiments at theSuper-FRS. We suggest to include into experimental pro-gram the studies of channelling in a Half-Wave Crystal(HWC), which is the very recent trend in high-energyphysics [11]. According to the simulations, achievabledeflection angle through the mirror effect is of the or-der of critical channelling angle θC (Fig. 2). The pos-sible applications are: effective beam deflector and evencharge/velocity selector.
References
[1] I. Tanihata, H. Geissel et. al., ’Conceptual Design Report forthe Scientific Program of the Super FRS Experiment Collab-oration’, GSI Report 2016, 3.
[2] Yu.L. Pivovarov, H. Geissel, C. Scheidenberger. Nucl. In-strum. and Meth. B 256 (2007) 109.
[3] S.V. Abdrashitov, O.V. Bogdanov, B. Korotchenko et. al.,Nucl. Instrum. and Meth. B 402 (2017) 106.
[4] J. Ruzicka, et. al., Vacuum 63, Issue 4 (2001) 591.
[5] E.I. Fiks, et. al., Nucl. Instrum. and Meth. B 309 (2013) 146.
[6] E.I. Fiks, et. al., Nucl. Instrum. and Meth. B 314 (2013) 51.
[7] E.I. Fiks, Yu.L. Pivovarov, Phys. Lett. A 380 (2016) 2386.
[8] T. Yamaguchi et. al., Nucl. Instrum. and Meth. B 766 (2014)123
[9] N. Kuzminchuk-Feuerstein et. al., Nucl. Instrum. and Meth.A 866 (2017), 207.
[10] D. Dauvergne et al., Phys. Rev. A 59 (1999) 2813.
[11] W. Scandale et. al., Phys. Lett. B 734 (2014) 1.
GSI SCIENTIFIC REPORT 2016 RESEARCH-NUSTAR-FRS-8
DOI:10.15120/GR-2017-1 179
A gas degrader for the low-energy branch of the Super-FRS at FAIR ∗
S. Purushothaman1, T. Dickel1,2, S. Ayet1,2, S. Bagchi1, K.-H.Behr1,2, J. Bergmann2, T. Blatz1,2, P.Constantin5, J. Ebert2, A. Finley6, H. Geissel1,2, F. Greiner2, E. Haettner1, C. Hornung2, S. Kaur10,W. Lippert2, B. Lommel1, I. Mardor8,9, B. Mei5, I. Miskun1,2, I. Moore3, J.-H. Otto1, S. Pietri1, A.
Pikhtelev7, W. R. Plass1,2, I. Pohjalainen3, A. Prochazka1, C. Rappold1,2, M. P. Reiter6, A.-K. Rink2,C. Scheidenberger1,2, B. Szczepanczyk1, Y. Tanaka1,2, H. Weick1, and J. S. Winfield1
1JLU, Gießen, Germany; 2GSI, Darmstadt, Germany; 3Univ. of Jyvaskyla, Finland; 4IAI, RAS, St. Petersburg, Russia;5ELI-NP, Bucharest, Romania; 6TRIUMF, Vancouver, Canada; 7Inst. for Energy Problems of Chem. Phys., RAS,
Chernogolovka, Russia; 8Tel Aviv Univ., Tel Aviv, Israel; 9Soreq NRC, Yavna, Israel; 10Astronomy and Phys. Dep.,Saint Mary’s Univ., Halifax, Canada
At the Low Energy Branch (LEB) of the Super-FRS atFAIR the exotic nuclei produced and separated at relativis-tic energies are thermalised (∼eV) and delivered to dedi-cated experimental setups to perform spectroscopy and de-cay studies (MATS/LaSpec). The only universal techniqueavailable for this procedure is to slow the nuclei down tofew MeV·u−1 in degraders, thermalise them in a noble gasfilled stopping cell and then extract using a combination ofelectric fields and gas flow. The magnetic rigidity of themain-separators of the Super-FRS is 20 Tm whereas it is7 Tm at the LEB. Therefore, the ion beam must first beslowed down (e.g. ≤ 300 MeV·u−1 for 238U) using a ho-mogeneous degrader. The stochastic processes during theproduction and slowing down of exotic nuclei introduce amomentum spread which is orders of magnitude larger thanthat of the primary beam. To overcome this problem the ionbeam is spatially dispersed according to the momentum us-ing a magnetic stage and the difference is then compensatedby passing through a wedge-shaped degrader [1].
A final fine tuning of ion energy is required for an ef-ficient implantation in a gas stopping cell. A thickness-tunable homogeneous degrader which can achieve arealdensities lesser than that is possible using a technicallyfeasible aluminum degrader is required for this purpose.Due to the large beam size at the LEB and the requirementof a large dynamic range of tuning, a gas-based degraderis proposed. A prototype of such a density controllablegas degrader was tested at the FRS Ion Catcher (FRSIC)setup [2] during the 2016 beam time at GSI. A Multiple-Reflection Time-of-Flight Mass-Spectrometer (MR-TOF-MS) was used to identify and quantify the thermalized ionsextracted from the stopping cell.
The prototype gas degrader consists of a cylindricalstainless steel chamber of 1500 mm length and 125 mmradius. The beam entrance and exit windows were madeof 100 µm Kapton foils. The dimensions of the win-dows were 200 mm×100 mm. The Kapton beam windowswere coated with a thin layer of carbon to avoid beam in-duced charging up and destruction of the beam windows
∗This work was supported by the BMBF under contracts No.05P12RGFN8 and 05P16RGFN1, by the HMWK through the LOEWECenter HICforFAIR, by HGS-HIRe, by JLU Gießen and GSI under theJLU-GSI strategic Helmholtz partnership agreement.
by electrical discharge. These two windows contribute2×20 mg·cm−2 to the total areal density of the gas de-grader. Dry nitrogen was used as the degrader material.The areal density of the nitrogen gas inside the chambercan be tuned between 0–160 mg·cm−2 with an accuracy of±0.2 % using a pressure controller.
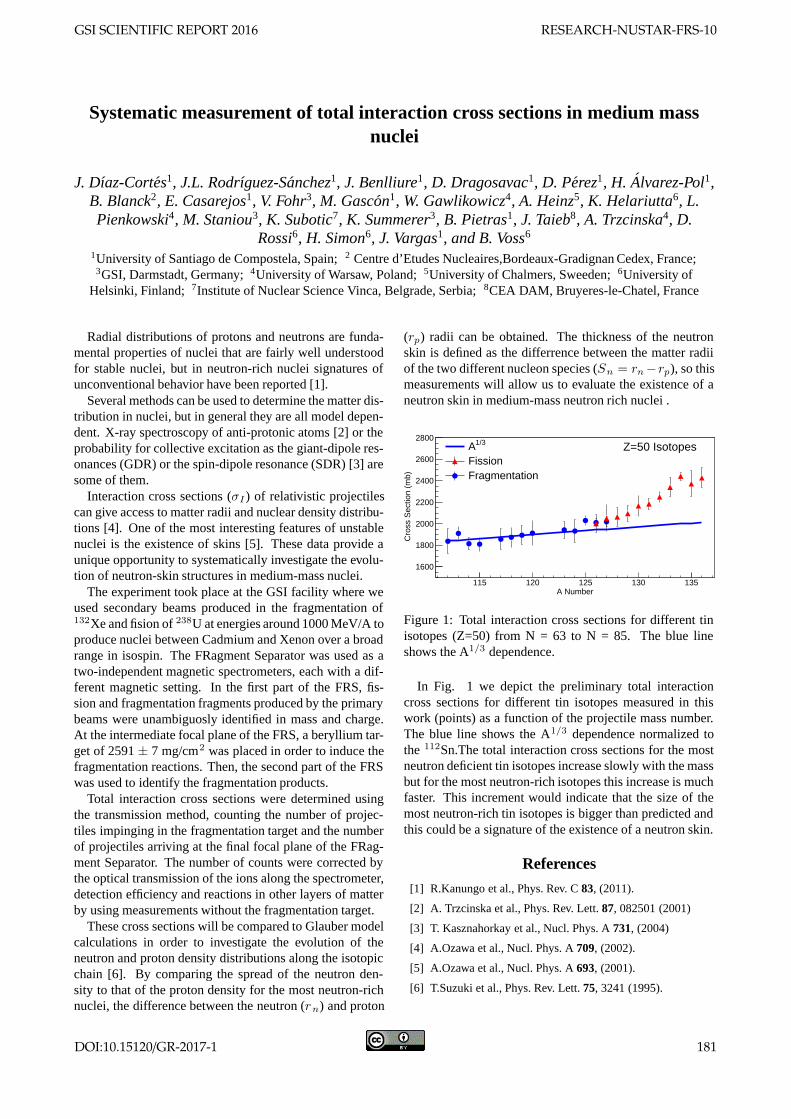
For the test measurements the FRSIC setup wasequipped with a tunable homogeneous aluminum degraderbesides the gas degrader. Tests were performed for two gasdegrader pressure settings (525 mbar and 800 mbar). Theoptimal ion energy for the efficient stopping in the gas cellwas found by scanning the thickness-tunable homogeneousaluminum degrader. To study the effect of the curvature ofthe gas degrader beam window on the areal density a scanwas also repeated for off-axis beams. No noticeable effectof the window curvature was found. The results of thesetests (see Figure 1) show the technical feasibility of a gasdegrader system for the LEB of the Super-FRS.
Figure 1: Stopping efficiency of ions in the gas stoppingcell as a function of the sum of the areal densities of thethickness-tunable homogenous degrader and the gas de-grader (GD) in aluminum equivalent. Photograph of thegas degrader chamber is shown in the inset.
References
[1] H. Weick et al., NIMB 164 (2000) 168-179
[2] W.R. Plaß et al., NIMB 317 (2013) 457-462
RESEARCH-NUSTAR-FRS-9 GSI SCIENTIFIC REPORT 2016
180 DOI:10.15120/GR-2017-1
Systematic measurement of total interaction cross sections in medium massnuclei
J. Dıaz-Cortes1, J.L. Rodrıguez-Sanchez1, J. Benlliure1, D. Dragosavac1, D. Perez1, H. Alvarez-Pol1,B. Blanck2, E. Casarejos1, V. Fohr3, M. Gascon1, W. Gawlikowicz4, A. Heinz5, K. Helariutta6, L.Pienkowski4, M. Staniou3, K. Subotic7, K. Summerer3, B. Pietras1, J. Taieb8, A. Trzcinska4, D.
Rossi6, H. Simon6, J. Vargas1, and B. Voss6
1University of Santiago de Compostela, Spain; 2 Centre d’Etudes Nucleaires,Bordeaux-Gradignan Cedex, France;3GSI, Darmstadt, Germany; 4University of Warsaw, Poland; 5University of Chalmers, Sweeden; 6University of
Helsinki, Finland; 7Institute of Nuclear Science Vinca, Belgrade, Serbia; 8CEA DAM, Bruyeres-le-Chatel, France
Radial distributions of protons and neutrons are funda-mental properties of nuclei that are fairly well understoodfor stable nuclei, but in neutron-rich nuclei signatures ofunconventional behavior have been reported [1].
Several methods can be used to determine the matter dis-tribution in nuclei, but in general they are all model depen-dent. X-ray spectroscopy of anti-protonic atoms [2] or theprobability for collective excitation as the giant-dipole res-onances (GDR) or the spin-dipole resonance (SDR) [3] aresome of them.
Interaction cross sections (σI ) of relativistic projectilescan give access to matter radii and nuclear density distribu-tions [4]. One of the most interesting features of unstablenuclei is the existence of skins [5]. These data provide aunique opportunity to systematically investigate the evolu-tion of neutron-skin structures in medium-mass nuclei.
The experiment took place at the GSI facility where weused secondary beams produced in the fragmentation of132Xe and fision of 238U at energies around 1000 MeV/A toproduce nuclei between Cadmium and Xenon over a broadrange in isospin. The FRagment Separator was used as atwo-independent magnetic spectrometers, each with a dif-ferent magnetic setting. In the first part of the FRS, fis-sion and fragmentation fragments produced by the primarybeams were unambiguosly identified in mass and charge.At the intermediate focal plane of the FRS, a beryllium tar-get of 2591 ± 7 mg/cm2 was placed in order to induce thefragmentation reactions. Then, the second part of the FRSwas used to identify the fragmentation products.
Total interaction cross sections were determined usingthe transmission method, counting the number of projec-tiles impinging in the fragmentation target and the numberof projectiles arriving at the final focal plane of the FRag-ment Separator. The number of counts were corrected bythe optical transmission of the ions along the spectrometer,detection efficiency and reactions in other layers of matterby using measurements without the fragmentation target.
These cross sections will be compared to Glauber modelcalculations in order to investigate the evolution of theneutron and proton density distributions along the isotopicchain [6]. By comparing the spread of the neutron den-sity to that of the proton density for the most neutron-richnuclei, the difference between the neutron (rn) and proton
(rp) radii can be obtained. The thickness of the neutronskin is defined as the differrence between the matter radiiof the two different nucleon species (Sn = rn−rp), so thismeasurements will allow us to evaluate the existence of aneutron skin in medium-mass neutron rich nuclei .
A Number115 120 125 130 135
Cro
ss S
ectio
n (m
b)
1600
1800
2000
2200
2400
2600
2800Z=50 Isotopes1/3A
FissionFragmentation
Figure 1: Total interaction cross sections for different tinisotopes (Z=50) from N = 63 to N = 85. The blue lineshows the A1/3 dependence.
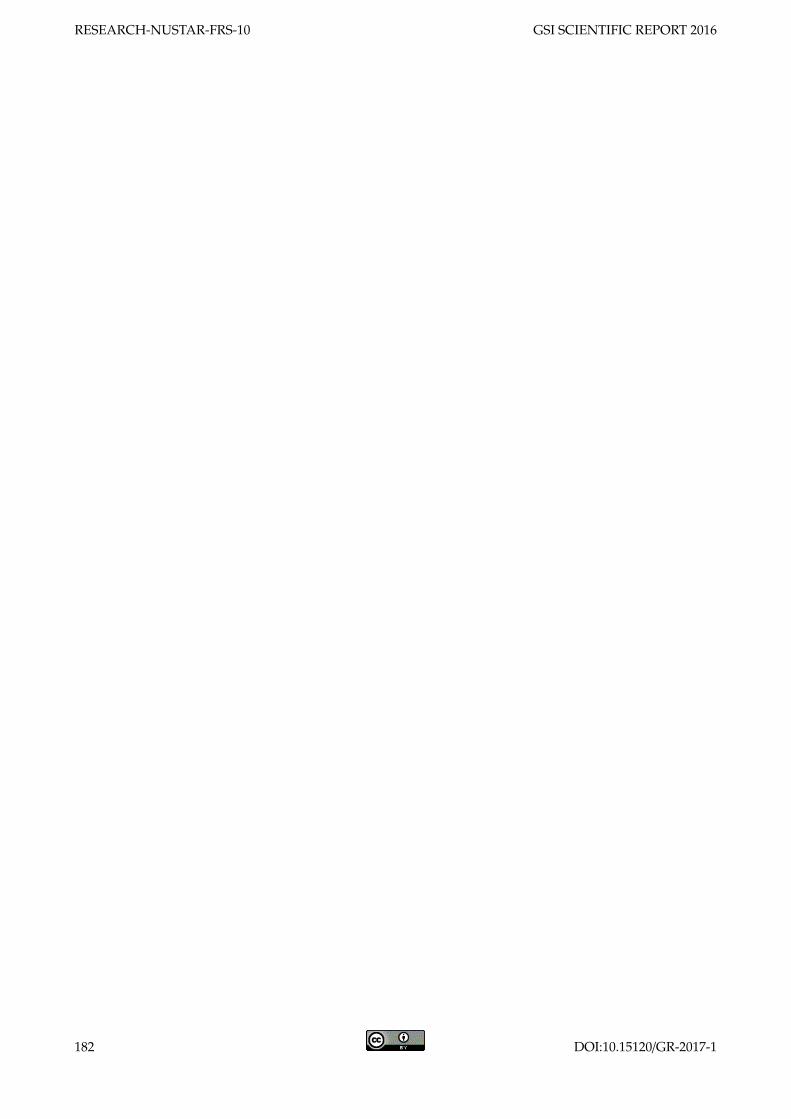
In Fig. 1 we depict the preliminary total interactioncross sections for different tin isotopes measured in thiswork (points) as a function of the projectile mass number.The blue line shows the A1/3 dependence normalized tothe 112Sn.The total interaction cross sections for the mostneutron deficient tin isotopes increase slowly with the massbut for the most neutron-rich isotopes this increase is muchfaster. This increment would indicate that the size of themost neutron-rich tin isotopes is bigger than predicted andthis could be a signature of the existence of a neutron skin.
References
[1] R.Kanungo et al., Phys. Rev. C 83, (2011).
[2] A. Trzcinska et al., Phys. Rev. Lett. 87, 082501 (2001)
[3] T. Kasznahorkay et al., Nucl. Phys. A 731, (2004)
[4] A.Ozawa et al., Nucl. Phys. A 709, (2002).
[5] A.Ozawa et al., Nucl. Phys. A 693, (2001).
[6] T.Suzuki et al., Phys. Rev. Lett. 75, 3241 (1995).
GSI SCIENTIFIC REPORT 2016 RESEARCH-NUSTAR-FRS-10
DOI:10.15120/GR-2017-1 181
RESEARCH-NUSTAR-FRS-10 GSI SCIENTIFIC REPORT 2016
182 DOI:10.15120/GR-2017-1
Offline analysis of Beam Spill structure measurement at GSI
S. Saha ∗1,2, M. Reese1, H. Schaffner1, J. Vesic1,3, J. Gerl1, and M. Gorska1
1GSI, Darmstadt, Germany; 2Technical University Darmstadt, Darmstadt, Germany; 3Jozef Stefan Institute, Ljubljana,Slovenia
Uniform spill structure of high energy ion beams is re-quired for various spectroscopy experiments carried out inGSI fragment separator. We have carried out an offlineanalysis of the Beam spill structure from beam obtainedat Cave C during an experiment in June 2016.
Resonance extraction of particles from SIS can havesome fluctuations from various non-coherent as well ascoherent sources [1]. These fluctuation leads to non uni-formity of the beam current. The random fluctuations inthe beam current can significantly lower the detection effi-ciency of events in slow response detectors like HPGe.
The incoming particles of a steady beam current can beconsidered as homogeneous Poisson events occurring at auniform rate. The time of occurrence of each event is inde-pendent of the time of a previous event. The waiting timedistribution of such events should fall exponentially withincreasing time interval. The rate of beam current is givenby the decay time of this distribution.
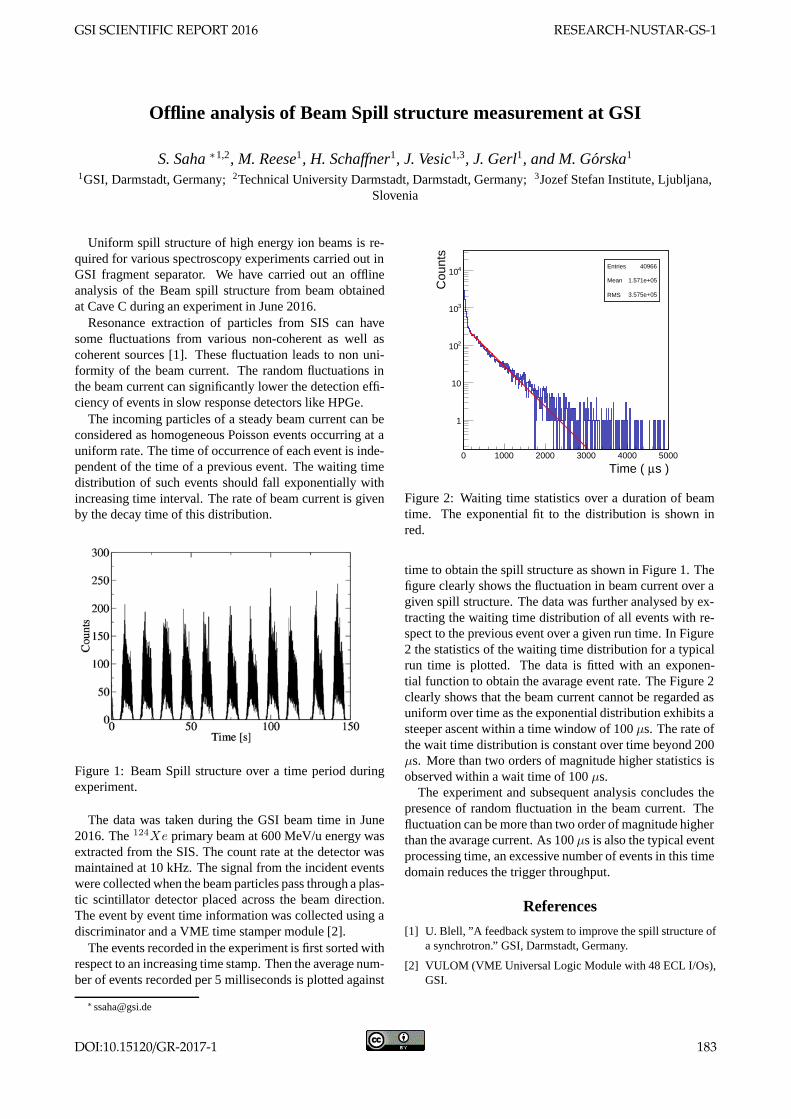
Figure 1: Beam Spill structure over a time period duringexperiment.
The data was taken during the GSI beam time in June2016. The 124Xe primary beam at 600 MeV/u energy wasextracted from the SIS. The count rate at the detector wasmaintained at 10 kHz. The signal from the incident eventswere collected when the beam particles pass through a plas-tic scintillator detector placed across the beam direction.The event by event time information was collected using adiscriminator and a VME time stamper module [2].
The events recorded in the experiment is first sorted withrespect to an increasing time stamp. Then the average num-ber of events recorded per 5 milliseconds is plotted against
Entries 40966
Mean 1.571e+05
RMS 3.575e+05
s )μTime ( 0 1000 2000 3000 4000 5000
Cou
nts
1
10
210
310
410Entries 40966
Mean 1.571e+05
RMS 3.575e+05
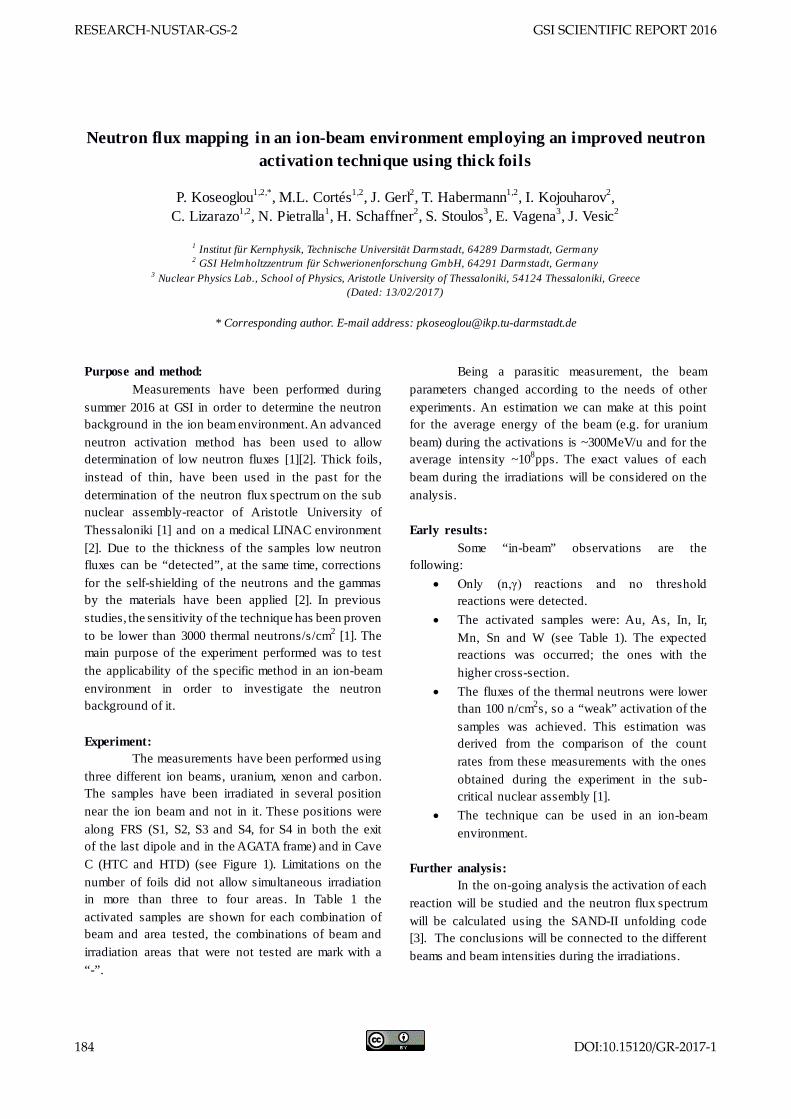
Figure 2: Waiting time statistics over a duration of beamtime. The exponential fit to the distribution is shown inred.
time to obtain the spill structure as shown in Figure 1. Thefigure clearly shows the fluctuation in beam current over agiven spill structure. The data was further analysed by ex-tracting the waiting time distribution of all events with re-spect to the previous event over a given run time. In Figure2 the statistics of the waiting time distribution for a typicalrun time is plotted. The data is fitted with an exponen-tial function to obtain the avarage event rate. The Figure 2clearly shows that the beam current cannot be regarded asuniform over time as the exponential distribution exhibits asteeper ascent within a time window of 100 µs. The rate ofthe wait time distribution is constant over time beyond 200µs. More than two orders of magnitude higher statistics isobserved within a wait time of 100 µs.
The experiment and subsequent analysis concludes thepresence of random fluctuation in the beam current. Thefluctuation can be more than two order of magnitude higherthan the avarage current. As 100 µs is also the typical eventprocessing time, an excessive number of events in this timedomain reduces the trigger throughput.
References
[1] U. Blell, ”A feedback system to improve the spill structure ofa synchrotron.” GSI, Darmstadt, Germany.
[2] VULOM (VME Universal Logic Module with 48 ECL I/Os),GSI.
GSI SCIENTIFIC REPORT 2016 RESEARCH-NUSTAR-GS-1
DOI:10.15120/GR-2017-1 183
Neutron flux mapping in an ion-beam environment employing an improved neutron activation technique using thick foils
P. Koseoglou1,2,*, M.L. Cortés1,2, J. Gerl2, T. Habermann1,2, I. Kojouharov2,
C. Lizarazo1,2, N. Pietralla1, H. Schaffner2, S. Stoulos3, E. Vagena3, J. Vesic2
1 Institut für Kernphysik, Technische Universität Darmstadt, 64289 Darmstadt, Germany 2 GSI Helmholtzzentrum für Schwerionenforschung GmbH, 64291 Darmstadt, Germany
3 Nuclear Physics Lab., School of Physics, Aristotle University of Thessaloniki, 54124 Thessaloniki, Greece (Dated: 13/02/2017)
* Corresponding author. E-mail address: [email protected]
Purpose and method: Measurements have been performed during summer 2016 at GSI in order to determine the neutron background in the ion beam environment. An advanced neutron activation method has been used to allow determination of low neutron fluxes [1][2]. Thick foils, instead of thin, have been used in the past for the determination of the neutron flux spectrum on the sub nuclear assembly-reactor of Aristotle University of Thessaloniki [1] and on a medical LINAC environment [2]. Due to the thickness of the samples low neutron fluxes can be “detected”, at the same time, corrections for the self-shielding of the neutrons and the gammas by the materials have been applied [2]. In previous studies, the sensitivity of the technique has been proven to be lower than 3000 thermal neutrons/s/cm2 [1]. The main purpose of the experiment performed was to test the applicability of the specific method in an ion-beam environment in order to investigate the neutron background of it. Experiment: The measurements have been performed using three different ion beams, uranium, xenon and carbon. The samples have been irradiated in several position near the ion beam and not in it. These positions were along FRS (S1, S2, S3 and S4, for S4 in both the exit of the last dipole and in the AGATA frame) and in Cave C (HTC and HTD) (see Figure 1). Limitations on the number of foils did not allow simultaneous irradiation in more than three to four areas. In Table 1 the activated samples are shown for each combination of beam and area tested, the combinations of beam and irradiation areas that were not tested are mark with a “-”.
Being a parasitic measurement, the beam parameters changed according to the needs of other experiments. An estimation we can make at this point for the average energy of the beam (e.g. for uranium beam) during the activations is ~300MeV/u and for the average intensity ~108pps. The exact values of each beam during the irradiations will be considered on the analysis. Early results: Some “in-beam” observations are the following:
• Only (n,γ) reactions and no threshold reactions were detected.
• The activated samples were: Au, As, In, Ir, Mn, Sn and W (see Table 1). The expected reactions was occurred; the ones with the higher cross-section.
• The fluxes of the thermal neutrons were lower than 100 n/cm2s, so a “weak” activation of the samples was achieved. This estimation was derived from the comparison of the count rates from these measurements with the ones obtained during the experiment in the sub-critical nuclear assembly [1].
• The technique can be used in an ion-beam environment.
Further analysis: In the on-going analysis the activation of each reaction will be studied and the neutron flux spectrum will be calculated using the SAND-II unfolding code [3]. The conclusions will be connected to the different beams and beam intensities during the irradiations.
RESEARCH-NUSTAR-GS-2 GSI SCIENTIFIC REPORT 2016
184 DOI:10.15120/GR-2017-1
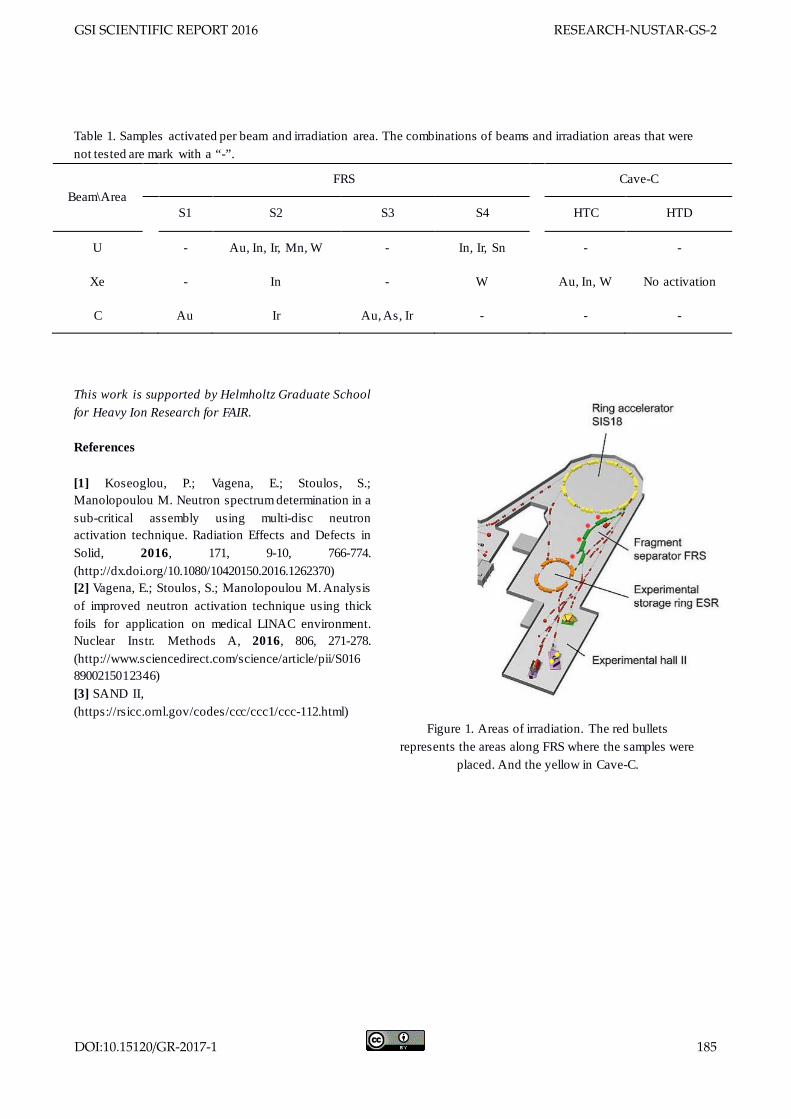
Table 1. Samples activated per beam and irradiation area. The combinations of beams and irradiation areas that were not tested are mark with a “-”.
Beam\Area FRS Cave-C
S1 S2 S3 S4 HTC HTD
U - Au, In, Ir, Mn, W - In, Ir, Sn - -
Xe - In - W Au, In, W No activation
C Au Ir Au, As, Ir - - -
This work is supported by Helmholtz Graduate School for Heavy Ion Research for FAIR. References [1] Koseoglou, P.; Vagena, E.; Stoulos, S.; Manolopoulou M. Neutron spectrum determination in a sub-critical assembly using multi-disc neutron activation technique. Radiation Effects and Defects in Solid, 2016, 171, 9-10, 766-774. (http://dx.doi.org/10.1080/10420150.2016.1262370) [2] Vagena, E.; Stoulos, S.; Manolopoulou M. Analysis of improved neutron activation technique using thick foils for application on medical LINAC environment. Nuclear Instr. Methods A, 2016, 806, 271-278. (http://www.sciencedirect.com/science/article/pii/S0168900215012346) [3] SAND II, (https://rsicc.ornl.gov/codes/ccc/ccc1/ccc-112.html)
Figure 1. Areas of irradiation. The red bullets
represents the areas along FRS where the samples were placed. And the yellow in Cave-C.
GSI SCIENTIFIC REPORT 2016 RESEARCH-NUSTAR-GS-2
DOI:10.15120/GR-2017-1 185
Tests of Sunpower CryoTel CT Stirling cooling engine for DEGAS∗
W. Witt1,2, P. Koseoglou1,2, I. Kojouharov2, and J. Gerl21IKP TU Darmstadt, Darmstadt, Germany; 2GSI, Darmstadt, Germany
Introduction
As one of the four pillars of the FAIR project the NUS-TAR collaboration aims at investigating exotic beams pro-vided by the Super-FRS to study NUclear STructure, As-trophysics and Reactions. High-resolution DEcay SPEC-troscopy of short-lived nuclei and isotopes is performedwithin the DESPEC experiment, which is located at thelow-energy branch of the facility. γ-decays following theion implantation in the active silicon detector (AIDA) areto be detected using the DEGAS germanium-array makingDEGAS a key instrument of DESPEC. It is currently underdevelopment and planned to be used starting at the SIS/FRSbeam-time 2019 as part of the NUSTAR phase-0 program.
Cooling of DEGAS Ge-crystals
Based on γ-ray interactions in semi-conducting matter,high-purity Germanium (HPGe) detectors such as DEGASoperate at temperatures around 90K, which makes coolingan essential aspect of the operation and for design consid-erations. Previous studies have shown a need for coolingpower of < 8W per DEGAS triple-Ge-cluster [1]. As op-posed to the usual liquid nitrogen cooling, free-piston Stir-ling cooling (i.e. a heat engine operated within the Stir-ling circle to transfer heat) was chosen for DEGAS cool-ing. The main reason for that is the box geometry of the ar-ray adapted to the focal plane of the Super-FRS that wouldrequire a specifically tailored dewar too small for reliableoperation and difficult to find. Next to smaller size andmass and lack of failures due to refilling (lifetimes of 10years have been achieved), electrical coolers offer a cool-ing power of up to 10W at 77K, which satisfies the needsfor DEGAS cooling. However, the piston’s motion causesvibrations of the cooler, which affect the detector perfor-mance. The CryoTel CT cooler from Sunpower [2] is oneof such electric coolers and was taken into operation at GSIfor the planned investigation of the vibration effects and fortesting counter-measures.
Ongoing tests of CryoTel CT cooling engine
The cooling engine was delivered by Sunpower aroundmid of 2016 including an active vibration cancellationsystem (AVC by Ametek) to reduce the vibrations typicalfor such coolers. A holding structure as well as a flangeadapter for connection with a DEGAS cluster-cryostat
∗Work supported by Helmholtz Graduate School for Hadron and IonResearch at FAIR.
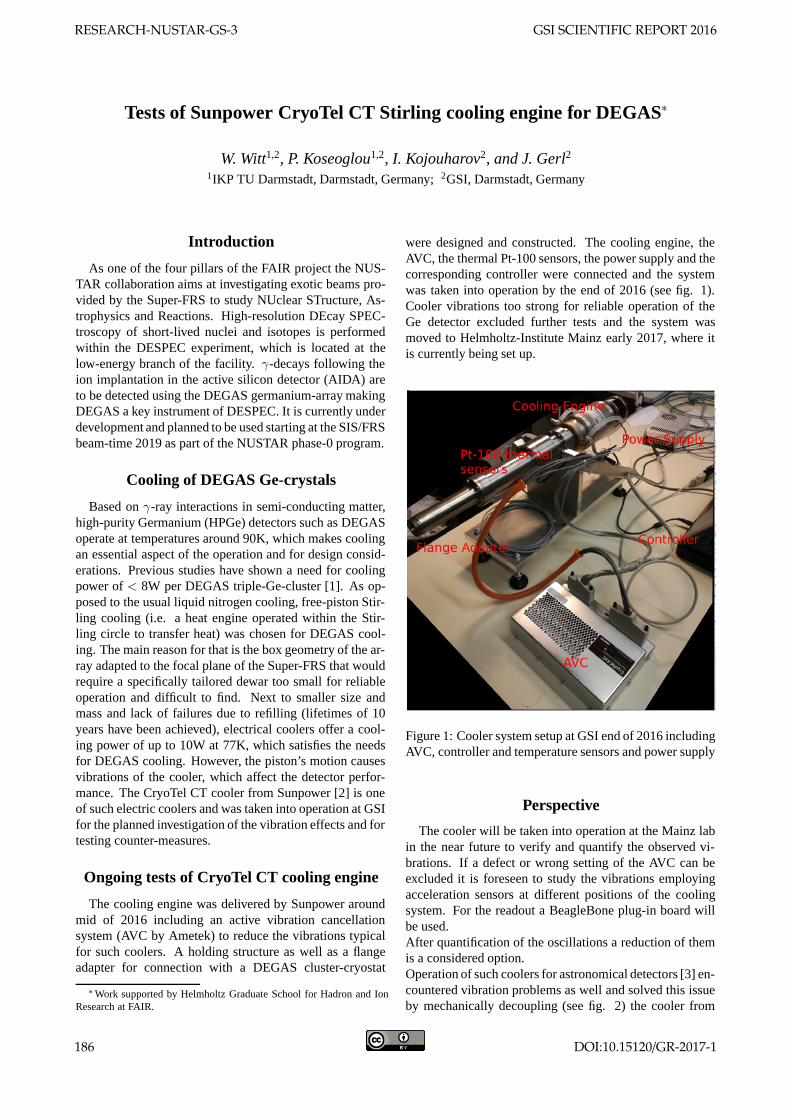
were designed and constructed. The cooling engine, theAVC, the thermal Pt-100 sensors, the power supply and thecorresponding controller were connected and the systemwas taken into operation by the end of 2016 (see fig. 1).Cooler vibrations too strong for reliable operation of theGe detector excluded further tests and the system wasmoved to Helmholtz-Institute Mainz early 2017, where itis currently being set up.
Figure 1: Cooler system setup at GSI end of 2016 includingAVC, controller and temperature sensors and power supply
Perspective
The cooler will be taken into operation at the Mainz labin the near future to verify and quantify the observed vi-brations. If a defect or wrong setting of the AVC can beexcluded it is foreseen to study the vibrations employingacceleration sensors at different positions of the coolingsystem. For the readout a BeagleBone plug-in board willbe used.After quantification of the oscillations a reduction of themis a considered option.Operation of such coolers for astronomical detectors [3] en-countered vibration problems as well and solved this issueby mechanically decoupling (see fig. 2) the cooler from
RESEARCH-NUSTAR-GS-3 GSI SCIENTIFIC REPORT 2016
186 DOI:10.15120/GR-2017-1
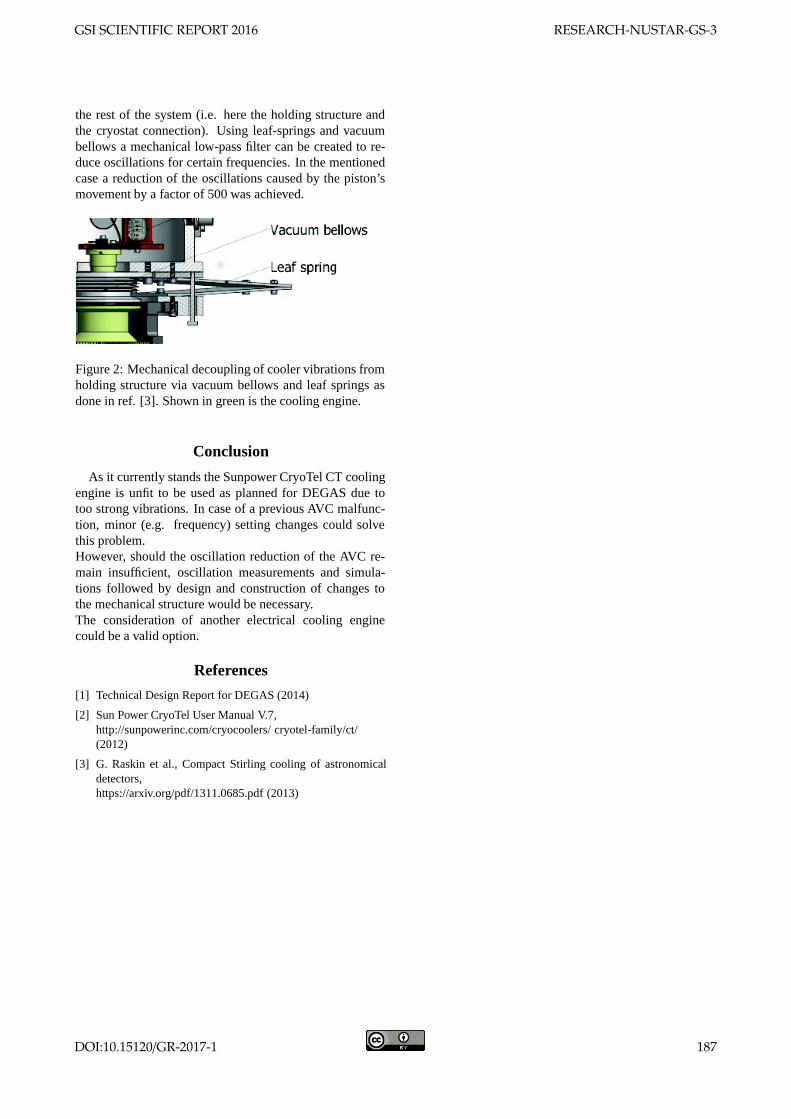
the rest of the system (i.e. here the holding structure andthe cryostat connection). Using leaf-springs and vacuumbellows a mechanical low-pass filter can be created to re-duce oscillations for certain frequencies. In the mentionedcase a reduction of the oscillations caused by the piston’smovement by a factor of 500 was achieved.
Figure 2: Mechanical decoupling of cooler vibrations fromholding structure via vacuum bellows and leaf springs asdone in ref. [3]. Shown in green is the cooling engine.
Conclusion
As it currently stands the Sunpower CryoTel CT coolingengine is unfit to be used as planned for DEGAS due totoo strong vibrations. In case of a previous AVC malfunc-tion, minor (e.g. frequency) setting changes could solvethis problem.However, should the oscillation reduction of the AVC re-main insufficient, oscillation measurements and simula-tions followed by design and construction of changes tothe mechanical structure would be necessary.The consideration of another electrical cooling enginecould be a valid option.
References
[1] Technical Design Report for DEGAS (2014)
[2] Sun Power CryoTel User Manual V.7,http://sunpowerinc.com/cryocoolers/ cryotel-family/ct/(2012)
[3] G. Raskin et al., Compact Stirling cooling of astronomicaldetectors,https://arxiv.org/pdf/1311.0685.pdf (2013)
GSI SCIENTIFIC REPORT 2016 RESEARCH-NUSTAR-GS-3
DOI:10.15120/GR-2017-1 187
Bayes-Tracking – A novel approach to γ-ray tracking
P. Napiralla1,2, H. Egger3, P. R. John2, N. Pietralla2, M. Reese1, and C. Stahl2
1Institut fur Kernphysik, TU Darmstadt, Darmstadt, Germany; 2GSI, Darmstadt, Germany; 3AG Numerik undwissenschaftliches Rechnen, TU Darmstadt, Darmstadt, Germany
The Advanced GAmma Tracking Array AGATA [1] willbe the key instrument for nuclear structure investigationsin the upcoming HISPEC and DESPEC experimentalcampaigns at the Facility for Antiproton and Ion ResearchFAIR.In the photon energy range of 0.2 − 8MeV, the Compton-scattering is the dominating interaction process in HPGedetectors. This leads to numerous Compton-escapedphotons, which are typically suppressed or appear asbackground in the γ-ray spectra. Although it is possibleto reconstruct photon paths between different HPGedetectors of AGATA using Pulse Shape Analysis [5]and γ-ray tracking algorithms [3], photons that haveCompton-scattered and subsequently left the array stillonly contribute to the background of the γ-ray spectra.Using Bayesian inference, some of these events can bereconstructed via a new type of γ-ray tracking algorithm,called Bayes-Tracking, when it is most likely that theyoriginate from Compton-escape.
In contrast to existing γ-ray tracking algorithms basedon the Forward/Back-Tracking method [3], the Bayes-Tracking algorithm quantifies the probability of an initiallyincident photon, given the measured hit pattern in the de-tector. It is based on Bayes’ Theorem [2, 4]
P (B|A) = P (A|B) · P (B)
P (A). (1)
The conditional probability for two arbitrary events A andB is defined as
P (A|B) :=P (A ∩B)
P (B). (2)
The incident photon energy Eγ can be identified in thecase of full energy absorption (photoelectric effect at lastinteraction point) and in the case of a Compton-escapedphoton. In contrast to existing tracking algorithms, thelatter events can be partially recovered.
Using Bayes’ theorem and the measured deposited en-ergies {Edep1 , . . . , EdepN } at the corresponding interactionpoints {~x1, . . . , ~xN} identified via Pulse Shape Analysis[5], a conditional probability distribution P for hypothet-ical incident photon energies e0 can be derived
P(e0|{{~x1, Edep1}, . . . , {~xN , EdepN }
})
∝∑
π
L(π({~x1, Edep1}, . . . , {~xN , EdepN }
)|e0). (3)
π denotes the permutation function over all possiblepermutations of the measured energies Edepi (at interactionpoints ~xi) and L the corresponding likelihood function(corresponds to P (A|B) in Equation (1)). By using theprinciple of so-called marginalization [4], a calculableform of the likelihood function can be derived.
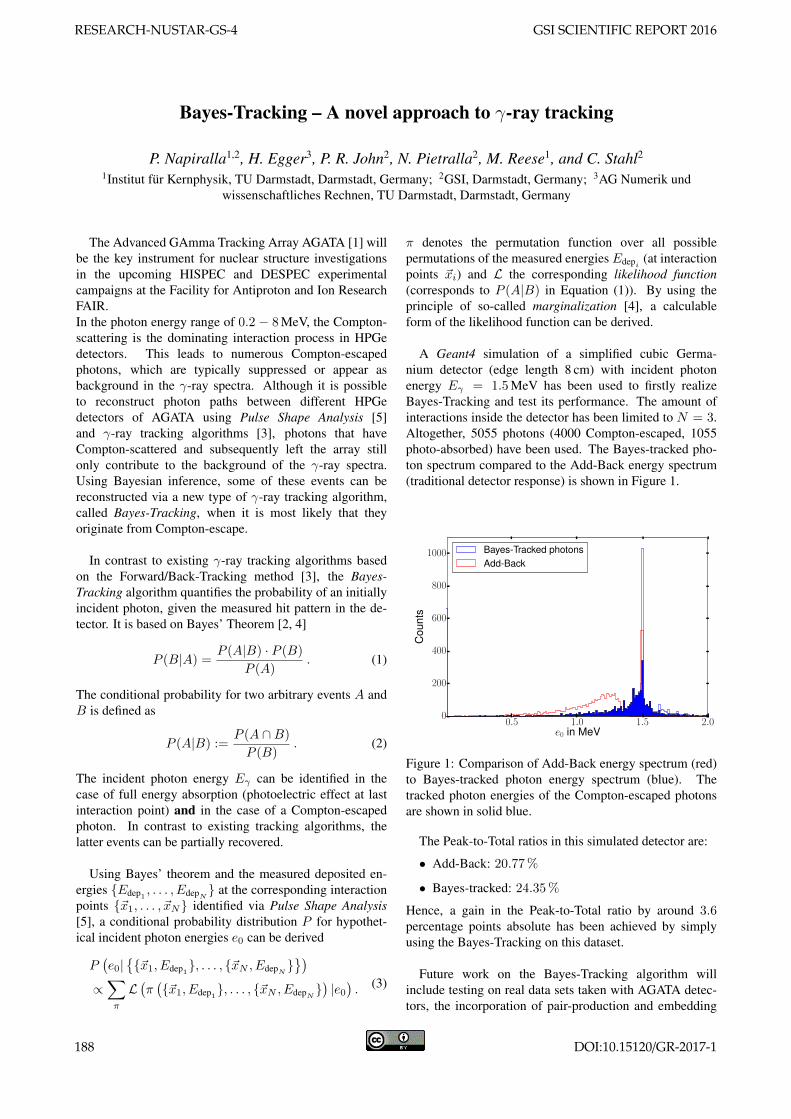
A Geant4 simulation of a simplified cubic Germa-nium detector (edge length 8 cm) with incident photonenergy Eγ = 1.5MeV has been used to firstly realizeBayes-Tracking and test its performance. The amount ofinteractions inside the detector has been limited to N = 3.Altogether, 5055 photons (4000 Compton-escaped, 1055photo-absorbed) have been used. The Bayes-tracked pho-ton spectrum compared to the Add-Back energy spectrum(traditional detector response) is shown in Figure 1.
0.5 1.0 1.5 2.0e0 in MeV
0
200
400
600
800
1000
Cou
nts
Bayes-Tracked photonsAdd-Back
Figure 1: Comparison of Add-Back energy spectrum (red)to Bayes-tracked photon energy spectrum (blue). Thetracked photon energies of the Compton-escaped photonsare shown in solid blue.
The Peak-to-Total ratios in this simulated detector are:
• Add-Back: 20.77%
• Bayes-tracked: 24.35%
Hence, a gain in the Peak-to-Total ratio by around 3.6percentage points absolute has been achieved by simplyusing the Bayes-Tracking on this dataset.
Future work on the Bayes-Tracking algorithm willinclude testing on real data sets taken with AGATA detec-tors, the incorporation of pair-production and embedding
RESEARCH-NUSTAR-GS-4 GSI SCIENTIFIC REPORT 2016
188 DOI:10.15120/GR-2017-1
the algorithm into the AGATA framework Femul to enablethe usage of the Bayes-Tracking on upcoming AGATAexperiments.
Especially for radioactive ion beam experiments withlimited intensities, this algorithm can be applied with theaim to increase the statistics in the γ-ray peaks. It willpotentially decrease the statistical uncertainties of futureHISPEC experiments with very exotic relativistic radioac-tive ion beams using AGATA at FAIR.
References[1] A. Akkoyun et al., AGATA – Advanced GAmma Tracking
Array, Nuclear Instruments and Methods in Physics ResearchA, 668:26–58, March 2012.
[2] H.-O. Georgii. Stochastik – Einfuhrung in die Wahrschein-lichkeitstheorie und Statistik, volume 4. Walter de Gruyter,Berlin, 2009.
[3] A. Lopez-Martens et al. γ-ray tracking algorithms: a compar-ison. Nuclear Instruments and Methods in Physics ResearchA, 533:454–466, 2004.
[4] D. Sivia and J. Skilling. Data Analysis – A Bayesian Tutorial,volume 2. Oxford University Press, Oxford, 2006.
[5] R. Venturelli and D. Bazzacco. Adaptive Grid Search as PulseShape Analysis Algorithm for γ-Tracking and Results. LNLAnnual Report, 2004.
GSI SCIENTIFIC REPORT 2016 RESEARCH-NUSTAR-GS-4
DOI:10.15120/GR-2017-1 189
Upgrade and commissioning of the Lund-York-Cologne CAlorimeter∗
B. Fu1, K. Wolf1, P. Reiter1, M. A. Bentley2, P. Coleman-Smith4, S. Fox2, C. Goergen1, P. Golubev3, I.Lazarus4, C. Lorenz3, D. Rudolph3, L. Scruton2, and S. Thiel1
1IKP, Universitat zu Koln, Germany; 2University of York, UK; 3Lund University, Sweden; 4STFC DaresburyLaboratory, UK
Introduction
The Lund-York-Cologne CAlorimeter (LYCCA) is acharged-particle detector for the FAIR/NUSTAR collab-oration, to discriminate heavy ions produced in nuclearreactions of relativistic radioactive-ion beams (RIB). Thecharge number Z and mass number A of the reactionproducts can be determined measuring their Time-of-Flight (ToF), energy loss and total energy. Employing theposition sensitivity of LYCCA the flight paths of the reac-tion products can be tracked event-by-event, enabling theHIgh-resolution in-beam γ-ray SPECtropscopy (HISPEC)far from the line of stability (concept and design of LYCCAsee Ref. [1]).
Upgrade of Electronics
The precursor LYCCA-0 using 12 ΔE-E telescopes andanalog electronics was employed in the PreSPEC cam-paign from 2009 to 2014. A high resolution of Z and Awas proven for proton number around 33 and mass regionaround 100 [2,3,4]. Afterwords the major upgrade fromanalog to digital electronics for LYCCA was carried outby the STFC Daresbury Laboratory. Using high-integratedFront-End Electronics (FEE) with Application-specific In-tegrated Circuits (ASICs), the electronic arrangement anddata-acquisition process were significantly simplified. As
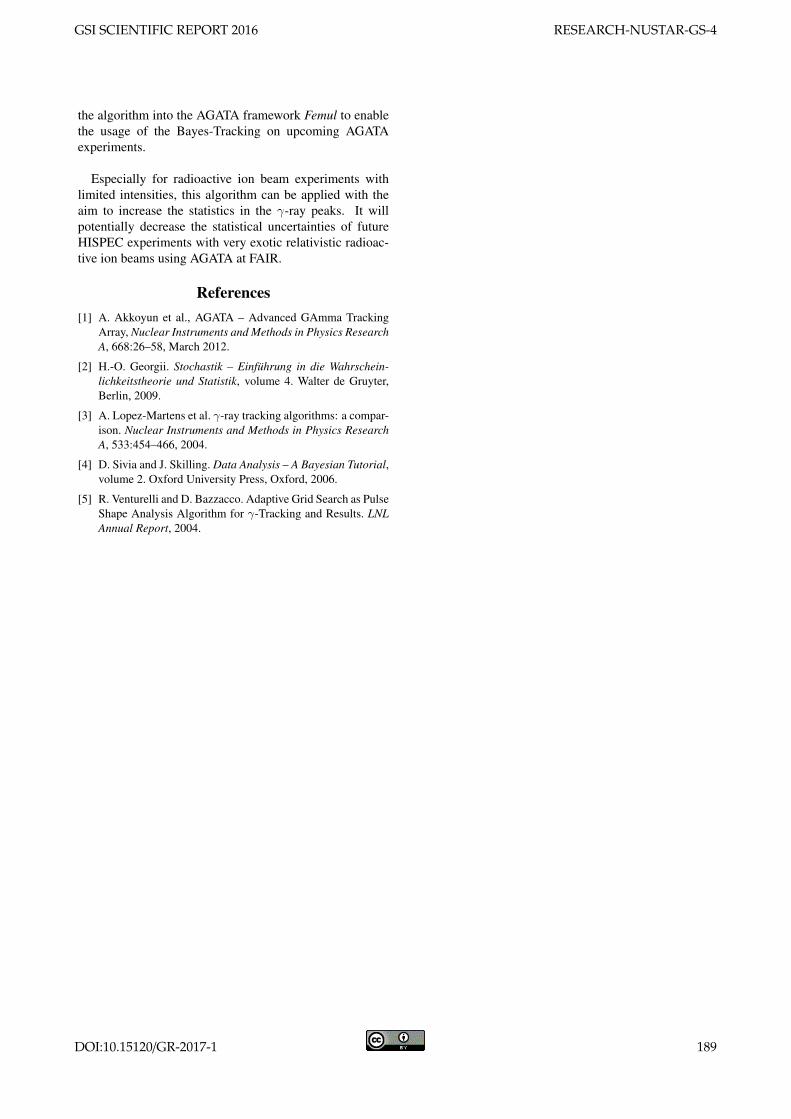
Figure 1: The view of a FEE-card. (a) four 16-channelASICs; (b) eight 14-bit ADCs; (c) Virtex-5 PowerPC; (d)Connections: HDMI (Clock), Power and Gbit-Ethernet.
shown in Fig. 1, each FEE card contains four 16-channelASICs, which amplify the signals from all 64 channelsof one Double-Sided Silicon Strip Detector (DSSSD). TheASIC is optimized for high dynamic range with excellentlinearity and noise performance. Each ASIC covers threeenergy ranges: (i) high gain up to 20 MeV, (ii) mediumgain up to 1 GeV, and (iii) low gain up to 20 GeV. The pre-amplified signals are digitalised in ADCs, processed in the
∗This work supported by the German BMBF (05P12PKFNE TP5) andGSI F&E KREITE 1416.
Virtex-5 PowerPC and then stored in a LYCCA-Server. Amaster-slave control delivers a synchronous time stamp viaHDMI-cables on all FEE cards in use. The Multi-InstanceData-Acquisition System (MIDAS) ensures the hardwareconfiguration, experiment control, data merging and datastorage.
Commissioning at IKP Cologne
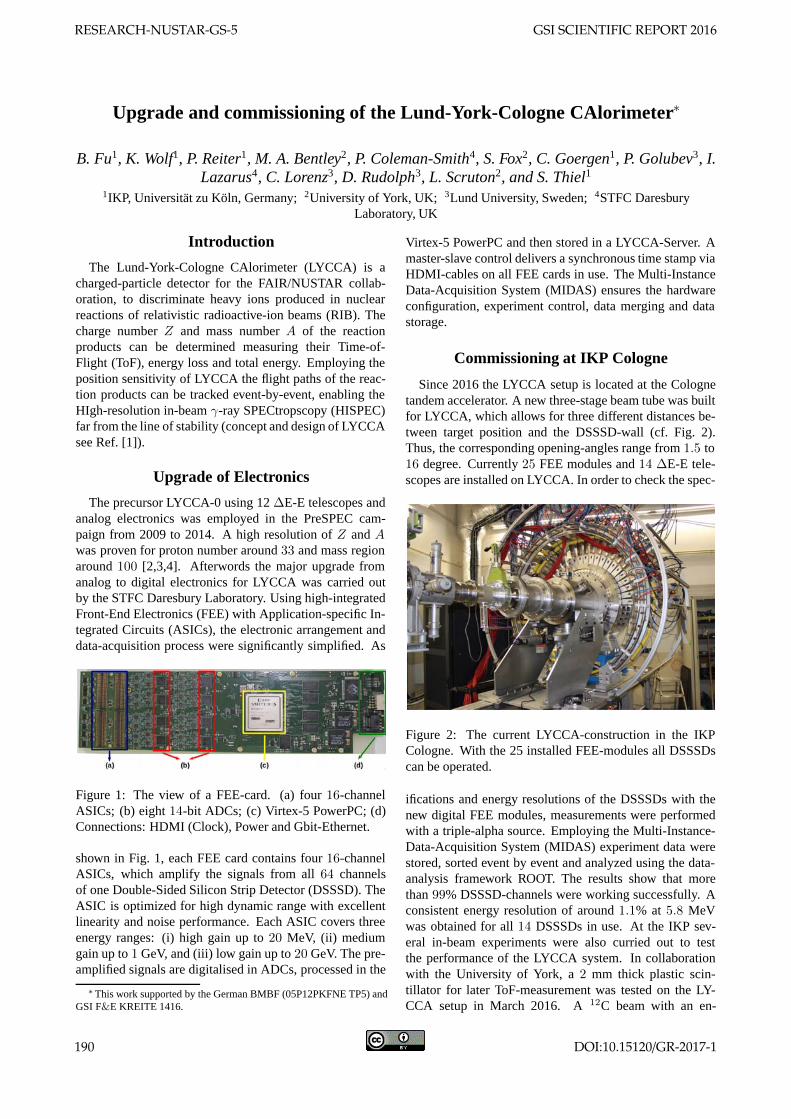
Since 2016 the LYCCA setup is located at the Colognetandem accelerator. A new three-stage beam tube was builtfor LYCCA, which allows for three different distances be-tween target position and the DSSSD-wall (cf. Fig. 2).Thus, the corresponding opening-angles range from 1.5 to16 degree. Currently 25 FEE modules and 14 ΔE-E tele-scopes are installed on LYCCA. In order to check the spec-
Figure 2: The current LYCCA-construction in the IKPCologne. With the 25 installed FEE-modules all DSSSDscan be operated.
ifications and energy resolutions of the DSSSDs with thenew digital FEE modules, measurements were performedwith a triple-alpha source. Employing the Multi-Instance-Data-Acquisition System (MIDAS) experiment data werestored, sorted event by event and analyzed using the data-analysis framework ROOT. The results show that morethan 99% DSSSD-channels were working successfully. Aconsistent energy resolution of around 1.1% at 5.8 MeVwas obtained for all 14 DSSSDs in use. At the IKP sev-eral in-beam experiments were also curried out to testthe performance of the LYCCA system. In collaborationwith the University of York, a 2 mm thick plastic scin-tillator for later ToF-measurement was tested on the LY-CCA setup in March 2016. A 12C beam with an en-
RESEARCH-NUSTAR-GS-5 GSI SCIENTIFIC REPORT 2016
190 DOI:10.15120/GR-2017-1
ergy of 60 MeV was scattered on the 197Au target with athickness of 0.2 mg/cm2, and stopped in the ToF-detector.The generated light signals were detected with 32 photo-multipliers (PMTs) mounted around the plastic scintilla-tor. Together with the Lund University in May 2016, an-other beam time was scheduled to test the performance ofthe ΔE-E telescopes. A proton beam with an energy of18 MeV was scattered on a thin gold foil and then detectedin the DSSSDs and CsI-detectors. In November 2016 afurther in-beam experiment of elastic scattering of heavyions was conducted. In this measurement the medium-gainrange (up to 1 GeV) of the FEE modules was tested suc-cessfully for the first time. A 12C beam with a kinetic en-ergy of 60 MeV was scattered on the 197Au target with athickness of 0.17mg/cm2. At a distance of 120 cm betweenthe target and the DSSSDs, a continuous scattering-anglecoverage of 1.5 to 9.5 degrees was obtained. The measuredFull Width at Half Maximum (FWHM) of the DSSSDs are350 keV to 400 keV at approximately 60 MeV. In order
0
500
1000
1500
2000
2500
3000
3500
4000
1 2 3 4 5 6 7 8
Counts/
1pixel
Scattering Angleθ [Degree]
Intensity of 60MeV 12C-beamRutherford-Scattering: const*sin−4(θ/ 2)
Figure 3: The measured intensity distribution of the elasti-cally scattered 12C-nuclei on 197Au-target follows the ex-pected distribution of the Rutherford scattering.
to investigate the exact angular distribution of the beamintensity after the elastic scattering, the measured data ofthe p- and n-side were correlated and, thus, the events inthe DSSSDs were analyzed pixel by pixel. Figure 3 showsthe intensity distribution of 64 contiguous pixels from twoDSSSDs located vertically below the beam axis. The mea-sured values, covering a range of 1.5 to 7.2 degree, repro-duced the theoretically expected scattering-angle depen-dence of sin−4(θ/2) nicely.
Outlook
For further in-beam experiments at the Cologne tan-dem accelerator, a modified mechanical construction of theLYCCA chamber was realized by IKP’s mechanical work-shop. The new design consists of two octagon brackets anda back wall, which support up to 24 ΔE-E telescopes in op-eration (see Figure 4). The target ladder is located betweenthe octagon brackets. This new construction increases thescattering-angle coverage from a maximum of 16 to a max-imum of 120 degree, as well as the solid-angle coverage
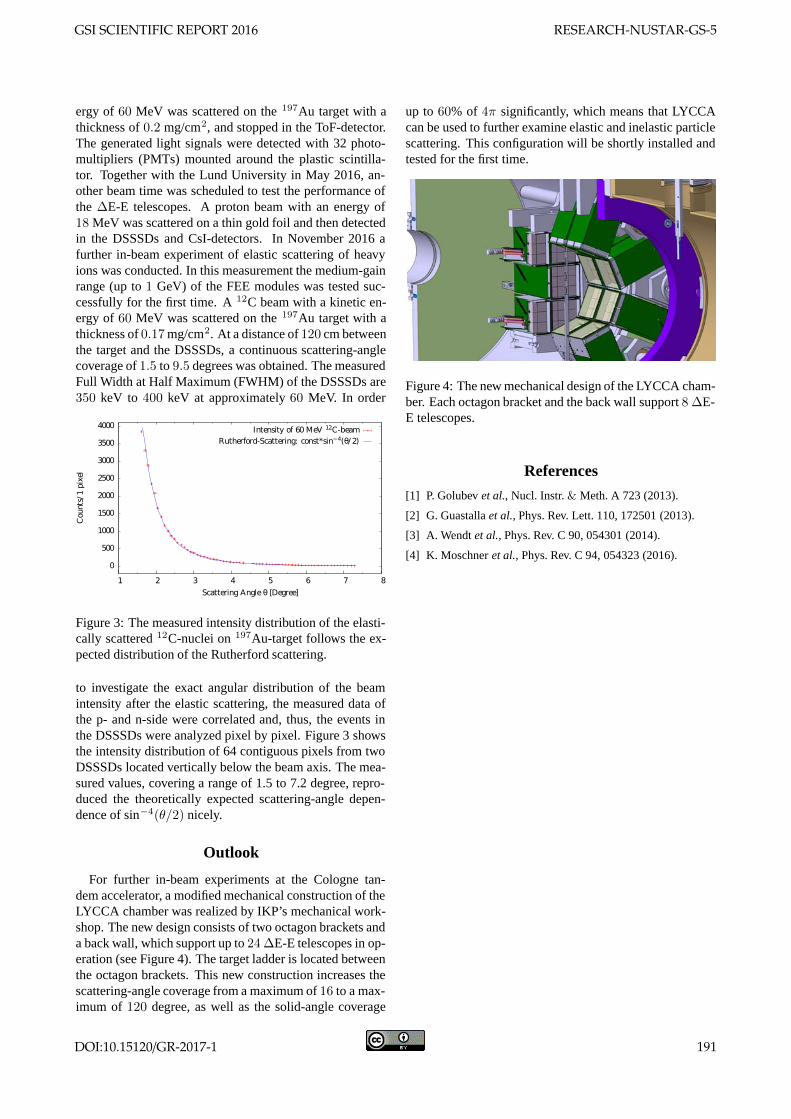
up to 60% of 4π significantly, which means that LYCCAcan be used to further examine elastic and inelastic particlescattering. This configuration will be shortly installed andtested for the first time.
Figure 4: The new mechanical design of the LYCCA cham-ber. Each octagon bracket and the back wall support 8 ΔE-E telescopes.
References
[1] P. Golubev et al., Nucl. Instr. & Meth. A 723 (2013).
[2] G. Guastalla et al., Phys. Rev. Lett. 110, 172501 (2013).
[3] A. Wendt et al., Phys. Rev. C 90, 054301 (2014).
[4] K. Moschner et al., Phys. Rev. C 94, 054323 (2016).
GSI SCIENTIFIC REPORT 2016 RESEARCH-NUSTAR-GS-5
DOI:10.15120/GR-2017-1 191
Collective behaviour of p-rich nuclei around A = 70
T. Arici ∗1,2, J. Gerl1, and W.Korten3
1GSI, Darmstadt, Germany; 2Justus-Liebig University, Giessen, Germany; 3CEA-Saclay, DAPNIA/SPhN, France
In N = Z nuclei, neutrons and protons occupy the sameorbitals. This creates an opportunity to study the effectof the nucleon sequence on deformation changing effectscaused by proton-neutron correlations. Moreover, in thisregion towards the proton drip line, nuclei experience alow binding energy which results in a shape change andin the vicinity of N = Z and around A = 70 this becomeseven more rapidly due to the large shell gaps in the Nils-son diagram for nucleon numbers 34, 36 and 38. The 70Kr,72Kr, 70Br and 68Se isotopes of this region were studied,where the valence protons and neutrons occupy these shellsand let us to answer the fundamental questions of nuclearphysics, such as the charge symmetry, independence of nu-clear force and the collectivity.
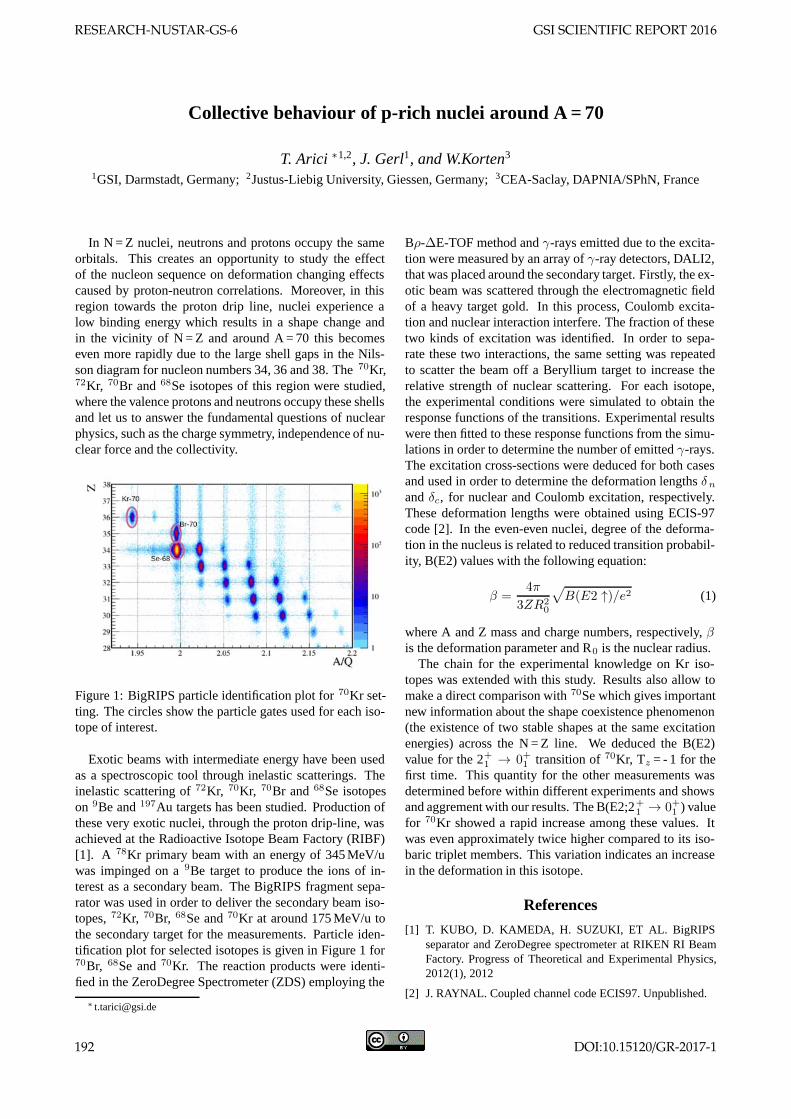
Figure 1: BigRIPS particle identification plot for 70Kr set-ting. The circles show the particle gates used for each iso-tope of interest.
Exotic beams with intermediate energy have been usedas a spectroscopic tool through inelastic scatterings. Theinelastic scattering of 72Kr, 70Kr, 70Br and 68Se isotopeson 9Be and 197Au targets has been studied. Production ofthese very exotic nuclei, through the proton drip-line, wasachieved at the Radioactive Isotope Beam Factory (RIBF)[1]. A 78Kr primary beam with an energy of 345 MeV/uwas impinged on a 9Be target to produce the ions of in-terest as a secondary beam. The BigRIPS fragment sepa-rator was used in order to deliver the secondary beam iso-topes, 72Kr, 70Br, 68Se and 70Kr at around 175 MeV/u tothe secondary target for the measurements. Particle iden-tification plot for selected isotopes is given in Figure 1 for70Br, 68Se and 70Kr. The reaction products were identi-fied in the ZeroDegree Spectrometer (ZDS) employing the
Bρ-ΔE-TOF method and γ-rays emitted due to the excita-tion were measured by an array of γ-ray detectors, DALI2,that was placed around the secondary target. Firstly, the ex-otic beam was scattered through the electromagnetic fieldof a heavy target gold. In this process, Coulomb excita-tion and nuclear interaction interfere. The fraction of thesetwo kinds of excitation was identified. In order to sepa-rate these two interactions, the same setting was repeatedto scatter the beam off a Beryllium target to increase therelative strength of nuclear scattering. For each isotope,the experimental conditions were simulated to obtain theresponse functions of the transitions. Experimental resultswere then fitted to these response functions from the simu-lations in order to determine the number of emitted γ-rays.The excitation cross-sections were deduced for both casesand used in order to determine the deformation lengths δn
and δc, for nuclear and Coulomb excitation, respectively.These deformation lengths were obtained using ECIS-97code [2]. In the even-even nuclei, degree of the deforma-tion in the nucleus is related to reduced transition probabil-ity, B(E2) values with the following equation:
β =4π
3ZR20
√B(E2 ↑)/e2 (1)
where A and Z mass and charge numbers, respectively, βis the deformation parameter and R0 is the nuclear radius.
The chain for the experimental knowledge on Kr iso-topes was extended with this study. Results also allow tomake a direct comparison with 70Se which gives importantnew information about the shape coexistence phenomenon(the existence of two stable shapes at the same excitationenergies) across the N = Z line. We deduced the B(E2)value for the 2+
1 → 0+1 transition of 70Kr, Tz = - 1 for thefirst time. This quantity for the other measurements wasdetermined before within different experiments and showsand aggrement with our results. The B(E2;2+
1 → 0+1 ) valuefor 70Kr showed a rapid increase among these values. Itwas even approximately twice higher compared to its iso-baric triplet members. This variation indicates an increasein the deformation in this isotope.
References
[1] T. KUBO, D. KAMEDA, H. SUZUKI, ET AL. BigRIPSseparator and ZeroDegree spectrometer at RIKEN RI BeamFactory. Progress of Theoretical and Experimental Physics,2012(1), 2012
[2] J. RAYNAL. Coupled channel code ECIS97. Unpublished.
RESEARCH-NUSTAR-GS-6 GSI SCIENTIFIC REPORT 2016
192 DOI:10.15120/GR-2017-1
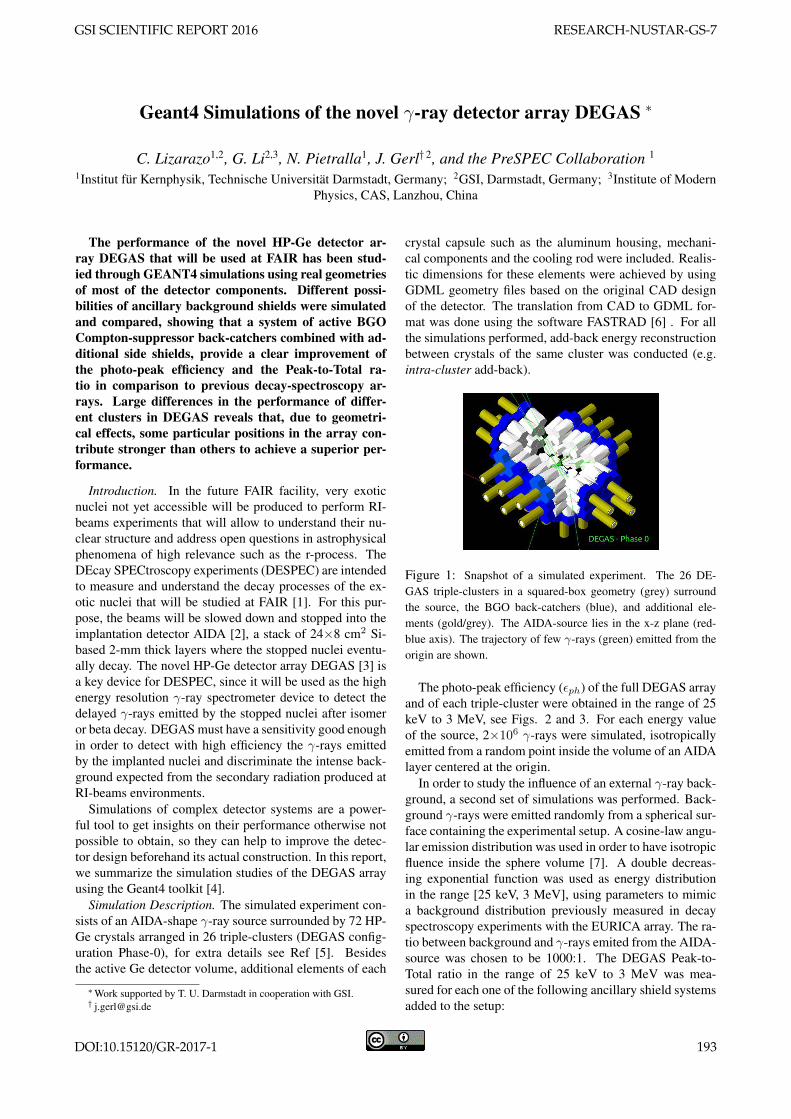
Geant4 Simulations of the novel γ-ray detector array DEGAS ∗
C. Lizarazo1,2, G. Li2,3, N. Pietralla1, J. Gerl† 2, and the PreSPEC Collaboration 1
1Institut fur Kernphysik, Technische Universitat Darmstadt, Germany; 2GSI, Darmstadt, Germany; 3Institute of ModernPhysics, CAS, Lanzhou, China
The performance of the novel HP-Ge detector ar-ray DEGAS that will be used at FAIR has been stud-ied through GEANT4 simulations using real geometriesof most of the detector components. Different possi-bilities of ancillary background shields were simulatedand compared, showing that a system of active BGOCompton-suppressor back-catchers combined with ad-ditional side shields, provide a clear improvement ofthe photo-peak efficiency and the Peak-to-Total ra-tio in comparison to previous decay-spectroscopy ar-rays. Large differences in the performance of differ-ent clusters in DEGAS reveals that, due to geometri-cal effects, some particular positions in the array con-tribute stronger than others to achieve a superior per-formance.
Introduction. In the future FAIR facility, very exoticnuclei not yet accessible will be produced to perform RI-beams experiments that will allow to understand their nu-clear structure and address open questions in astrophysicalphenomena of high relevance such as the r-process. TheDEcay SPECtroscopy experiments (DESPEC) are intendedto measure and understand the decay processes of the ex-otic nuclei that will be studied at FAIR [1]. For this pur-pose, the beams will be slowed down and stopped into theimplantation detector AIDA [2], a stack of 24×8 cm2 Si-based 2-mm thick layers where the stopped nuclei eventu-ally decay. The novel HP-Ge detector array DEGAS [3] isa key device for DESPEC, since it will be used as the highenergy resolution γ-ray spectrometer device to detect thedelayed γ-rays emitted by the stopped nuclei after isomeror beta decay. DEGAS must have a sensitivity good enoughin order to detect with high efficiency the γ-rays emittedby the implanted nuclei and discriminate the intense back-ground expected from the secondary radiation produced atRI-beams environments.
Simulations of complex detector systems are a power-ful tool to get insights on their performance otherwise notpossible to obtain, so they can help to improve the detec-tor design beforehand its actual construction. In this report,we summarize the simulation studies of the DEGAS arrayusing the Geant4 toolkit [4].
Simulation Description. The simulated experiment con-sists of an AIDA-shape γ-ray source surrounded by 72 HP-Ge crystals arranged in 26 triple-clusters (DEGAS config-uration Phase-0), for extra details see Ref [5]. Besidesthe active Ge detector volume, additional elements of each
∗Work supported by T. U. Darmstadt in cooperation with GSI.† [email protected]
crystal capsule such as the aluminum housing, mechani-cal components and the cooling rod were included. Realis-tic dimensions for these elements were achieved by usingGDML geometry files based on the original CAD designof the detector. The translation from CAD to GDML for-mat was done using the software FASTRAD [6] . For allthe simulations performed, add-back energy reconstructionbetween crystals of the same cluster was conducted (e.g.intra-cluster add-back).
Figure 1: Snapshot of a simulated experiment. The 26 DE-GAS triple-clusters in a squared-box geometry (grey) surroundthe source, the BGO back-catchers (blue), and additional ele-ments (gold/grey). The AIDA-source lies in the x-z plane (red-blue axis). The trajectory of few γ-rays (green) emitted from theorigin are shown.
The photo-peak efficiency (εph) of the full DEGAS arrayand of each triple-cluster were obtained in the range of 25keV to 3 MeV, see Figs. 2 and 3. For each energy valueof the source, 2×10⁶ γ-rays were simulated, isotropicallyemitted from a random point inside the volume of an AIDAlayer centered at the origin.
In order to study the influence of an external γ-ray back-ground, a second set of simulations was performed. Back-ground γ-rays were emitted randomly from a spherical sur-face containing the experimental setup. A cosine-law angu-lar emission distribution was used in order to have isotropicfluence inside the sphere volume [7]. A double decreas-ing exponential function was used as energy distributionin the range [25 keV, 3 MeV], using parameters to mimica background distribution previously measured in decayspectroscopy experiments with the EURICA array. The ra-tio between background and γ-rays emited from the AIDA-source was chosen to be 1000:1. The DEGAS Peak-to-Total ratio in the range of 25 keV to 3 MeV was mea-sured for each one of the following ancillary shield systemsadded to the setup:
GSI SCIENTIFIC REPORT 2016 RESEARCH-NUSTAR-GS-7
DOI:10.15120/GR-2017-1 193
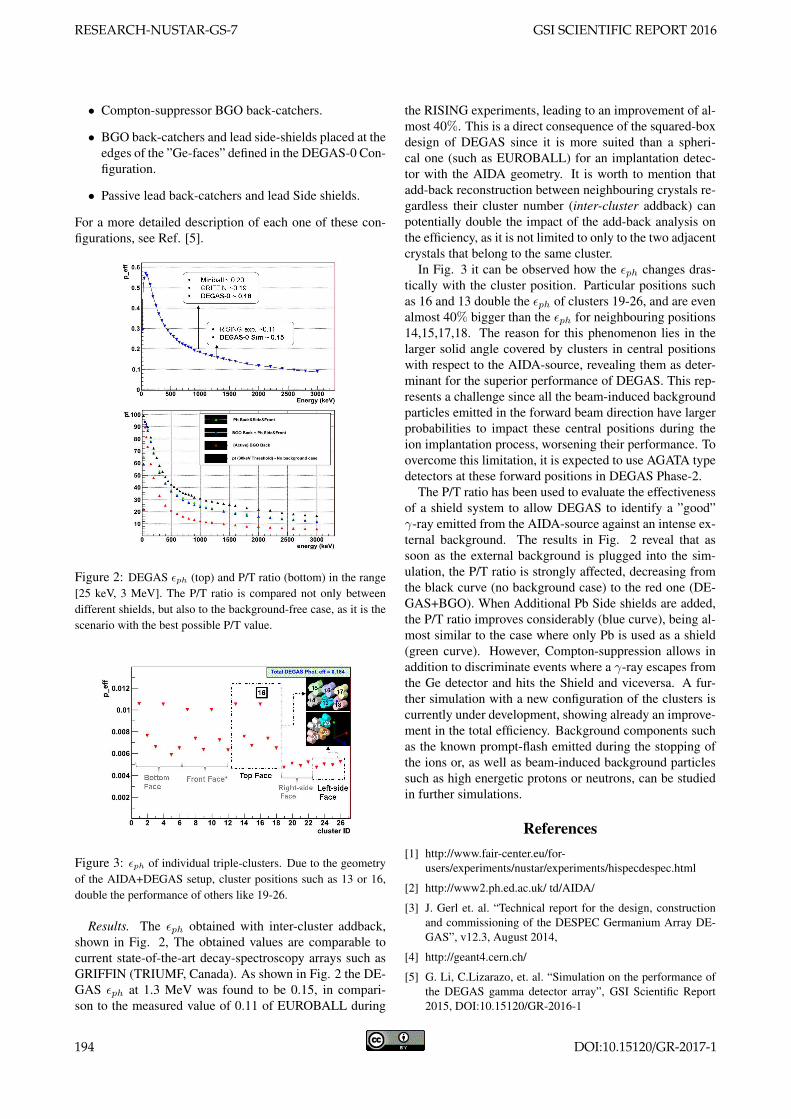
• Compton-suppressor BGO back-catchers.
• BGO back-catchers and lead side-shields placed at theedges of the ”Ge-faces” defined in the DEGAS-0 Con-figuration.
• Passive lead back-catchers and lead Side shields.
For a more detailed description of each one of these con-figurations, see Ref. [5].
Figure 2: DEGAS εph (top) and P/T ratio (bottom) in the range[25 keV, 3 MeV]. The P/T ratio is compared not only betweendifferent shields, but also to the background-free case, as it is thescenario with the best possible P/T value.
Figure 3: εph of individual triple-clusters. Due to the geometryof the AIDA+DEGAS setup, cluster positions such as 13 or 16,double the performance of others like 19-26.
Results. The εph obtained with inter-cluster addback,shown in Fig. 2, The obtained values are comparable tocurrent state-of-the-art decay-spectroscopy arrays such asGRIFFIN (TRIUMF, Canada). As shown in Fig. 2 the DE-GAS εph at 1.3 MeV was found to be 0.15, in compari-son to the measured value of 0.11 of EUROBALL during
the RISING experiments, leading to an improvement of al-most 40%. This is a direct consequence of the squared-boxdesign of DEGAS since it is more suited than a spheri-cal one (such as EUROBALL) for an implantation detec-tor with the AIDA geometry. It is worth to mention thatadd-back reconstruction between neighbouring crystals re-gardless their cluster number (inter-cluster addback) canpotentially double the impact of the add-back analysis onthe efficiency, as it is not limited to only to the two adjacentcrystals that belong to the same cluster.
In Fig. 3 it can be observed how the εph changes dras-tically with the cluster position. Particular positions suchas 16 and 13 double the εph of clusters 19-26, and are evenalmost 40% bigger than the εph for neighbouring positions14,15,17,18. The reason for this phenomenon lies in thelarger solid angle covered by clusters in central positionswith respect to the AIDA-source, revealing them as deter-minant for the superior performance of DEGAS. This rep-resents a challenge since all the beam-induced backgroundparticles emitted in the forward beam direction have largerprobabilities to impact these central positions during theion implantation process, worsening their performance. Toovercome this limitation, it is expected to use AGATA typedetectors at these forward positions in DEGAS Phase-2.
The P/T ratio has been used to evaluate the effectivenessof a shield system to allow DEGAS to identify a ”good”γ-ray emitted from the AIDA-source against an intense ex-ternal background. The results in Fig. 2 reveal that assoon as the external background is plugged into the sim-ulation, the P/T ratio is strongly affected, decreasing fromthe black curve (no background case) to the red one (DE-GAS+BGO). When Additional Pb Side shields are added,the P/T ratio improves considerably (blue curve), being al-most similar to the case where only Pb is used as a shield(green curve). However, Compton-suppression allows inaddition to discriminate events where a γ-ray escapes fromthe Ge detector and hits the Shield and viceversa. A fur-ther simulation with a new configuration of the clusters iscurrently under development, showing already an improve-ment in the total efficiency. Background components suchas the known prompt-flash emitted during the stopping ofthe ions or, as well as beam-induced background particlessuch as high energetic protons or neutrons, can be studiedin further simulations.
References[1] http://www.fair-center.eu/for-
users/experiments/nustar/experiments/hispecdespec.html
[2] http://www2.ph.ed.ac.uk/ td/AIDA/
[3] J. Gerl et. al. “Technical report for the design, constructionand commissioning of the DESPEC Germanium Array DE-GAS”, v12.3, August 2014,
[4] http://geant4.cern.ch/
[5] G. Li, C.Lizarazo, et. al. “Simulation on the performance ofthe DEGAS gamma detector array”, GSI Scientific Report2015, DOI:10.15120/GR-2016-1
RESEARCH-NUSTAR-GS-7 GSI SCIENTIFIC REPORT 2016
194 DOI:10.15120/GR-2017-1
[6] http://www.fastrad.net/
[7] G. Santin, ESA / ESTEC and RheaTech Ltd - Seminar at”Ecole Geant4”, Annecy, 18-21 and 25-28 Nov 2008.
GSI SCIENTIFIC REPORT 2016 RESEARCH-NUSTAR-GS-7
DOI:10.15120/GR-2017-1 195
RESEARCH-NUSTAR-GS-7 GSI SCIENTIFIC REPORT 2016
196 DOI:10.15120/GR-2017-1
Superheavy element research – Status report 2016
M. Block1,2,3, P. Chhetri 2,4, H. David2, A. Di Nitto1,2, C. Droese6, Ch.E. Düllmann1,2,3, F. Giacop-po2,3, M. Götz1,2,3, S. Götz 1,2,3, F.P. Heßberger2,3, E. Jäger2, O. Kaleja1,5, J. Khuyagbaatar2,3, J. Krier2, M. Laatiaoui2,3, L. Lens1,2, A. Mistry2,3, V. Pershina2, S. Raeder2,3, J. Runke1,2, P. Schar-
rer1,2,3, B. Schausten2, A. Yakushev2,3for the SHE Physics and SHE Chemistry Departments 1Johannes-Gutenberg University Mainz, Germany; 2GSI, Darmstadt, Germany; 3Helmholtz-Institute Mainz, Germany;
4TU Darmstadt, Germany; 5Max-Planck Institute Heidelberg, Germany; 6University Greifswald, Germany
The main activity at GSI was the 48Ca UNILAC beam-time, where the experiments were devoted to the continu-ation of the laser spectroscopy study in No [1] and to the chemical investigation of element 113, which was recent-ly named nihonium (Nh).
In 2015, for the first time optical spectroscopy of nobe-
lium atoms was performed at SHIP, making nobelium the heaviest elements for which such studies were feasible. A strong atomic ground state-transition and several Rydberg states in the nobelium atom were identified by resonance ionization laser spectroscopy [1]. The data showed good agreement with theoretical predictions using relativistic coupled cluster and multi configuration Dirac-Fock ap-proaches. Among the atomic and nuclear properties, a limit for the first ionization potential (IP) of nobelium was obtained. However, a more accurate determination of the IP from the convergence of a Rydberg series was ham-pered by quenching collisions with buffer gas atoms pop-ulating also lower-lying metastable states. In 2016, the laser spectroscopy in nobelium thus focused on the identi-fication of different Rydberg series. To this end, meas-urements in which the second laser pulse (exciting to a Rydberg state) was delayed compared to the laser for the first excitation step were performed for different pressures in the optical cell. The decay of the RIS signal is indica-tive of the lifetime of the populated state and allowed us to identify different Rydberg series originating from either the 1P1 state or the metastable 3D1 state. From the conver-gence of the Rydberg series now the IP of nobelium can be determined with high precision. The data analysis is close to completion and the results will be subject of a forthcoming publication. A rate equation model describ-ing the quenching process was developed and showed good agreement with the data. In addition, the location of the 3D1 state that cannot be excited directly from the ground state was determined indirectly [2]. In the second part of the beamtime, first steps towards laser spectrosco-py in the next heavier element, lawrencium, were per-formed. The stopping and neutralization followed by the evaporation from different filaments was investigated to optimized the conditions for the level search in Lr. In ad-dition, the feasibility of producing 255No by EC decay of 255Lr for laser spectroscopy was demonstrated. This will allow us to extend the measurements of nuclear properties in the nobelium isotope chain.
Besides the laser spectroscopy experiment, the SHE physics department was engaged in several technical de-velopments and upgrades of the setup. The relocation of the
SHIPTRAP setup was completed to fully integrate the new cryogenic stopping cell. The new gas cell operated at 40 K will boost the overall efficiency of SHIPTRAP by up to an order of magnitude and extend the reach for Pen-ning trap mass measurements to heavier elements availa-ble with lower yield. In 2016, extensive commissioning experiments with radioactive source (offline) and in para-sitic beamtime with 254No were performed. In addition, the recently developed novel phase imaging method (PI-PICR) was further improved by installing new extraction optics. First online mass measurements with upgraded SHIPTRAP system are foreseen for 2018.
The new focal plane detector system for decay spec-
troscopy at SHIP was characterized in parasitic beamtime by measuring α- and α-γ – decay of 253,254No produced in irradiations of 207,208Pb with 48Ca. The measurements were followed by studies of neutron-deficiency Np isotopes, produced in irradiations of 181Ta with 48Ca where specific emphasis was devoted to the isotopes 225,226Np. The inves-tigation of nuclides in this region near the N=126 shell at the proton drip line can be extended with the new detector system. This system features practically dead time free digital electronics and thus gives access to short-lived nuclides. The data analysis is ongoing. The further analy-sis of the decay studies of 257Rf and 258Db performed in 2014 resulted in confirmation of two low-lying isomeric states in 258Db, the identification of two short-lived iso-meric states in 258Rf, populated by EC decay of 258Db [3], and a low-lying isomer in 257Lr, populated by EC decay of 257Rf [4].
At TASCA, a first attempt on the chemical study of Nh
(nihonium, element 113) was performed in 2016. The nuclear fusion reaction 48Ca + 243Am, recently investigat-ed at TASCA in the Mc (moscovium, element 115) decay spectroscopy experiment [5], was selected for the produc-tion. The 288Mc recoils were guided through TASCA to an exit window, and were thermalized in a gas flow inside a recoil transfer chamber. The short-lived 288Mc (T1/2 = 0.17 s) isotope decayed via alpha-particle emission to 284Nh (T1/2 = 0.97 s), the lifetime of which is long enough for the transport to the detection setup. A similar detection setup as in the recent experiments on Fl chemistry was used [6].
GSI SCIENTIFIC REPORT 2016 RESEARCH-NUSTAR-SHEP-1
DOI:10.15120/GR-2017-1 197
However, to account for the expected higher reactivity of Nh compared to Fl, the first half of the first COMPACT detector array was covered with a SiO2 surface, while the second half as well as the full second COMPACT array with gold. The latter was cooled to low temperature with a liquid nitrogen cryostat. Fl chemistry experiments at TASCA have demonstrated that one Fl decay chain per week can be observed. Similar cross sections for the pro-duction of Fl [7] and Mc [5], as well as comparable beam intensities and target thicknesses led us to expect the ob-servation of about two to three decay chains originating from 288Nh, if the volatility and reactivity of Nh is similar to that of Fl. However, no Nh atoms were detected. The final data analysis is ongoing.
A second chemical system, where studies continued in
2016, is that of carbonyl compounds of transition metal complexes, with Sg(CO)6 having been first synthesized in 2013 [8]. Current techniques include the Sg synthesis, its isolation in a recoil separation, followed by chemical syn-thesis of the compound behind the separator [8]. A next step included an experiment designed to measure the thermal stability of the compounds in the spirit of [9], which was performed under the lead of the heavy element group from Paul Scherrer Institute (PSI), Villingen, Swit-zerland, at the RIKEN Nishina Center, Wako, Japan. The focus of the work of our group was on further develop-ments to extend studies of carbonyl compounds of the heaviest elements to those beyond Sg. Fusion products from the asymmetric nuclear fusion reactions, as needed for the carbonyl studies with Sg, Bh, and Hs, have a rela-tively large angular and energy spread, thus the transmis-sion efficiency through an on-line recoil separator is rela-tively low. In case of TASCA or GARIS (which was used in [8]), the efficiencies are in order of 13% for Sg [10]. Thus, the overall efficiency of the synthesis of carbonyl complexes in combination with physical preseparation is rather low. For future experiments, the possibilities for chemical investigation of the metal carbonyl complexes of SHE without using a preseparation stage are currently being explored, with the goal to avoid the corresponding losses of close to 90%. First experiments performed at the Tandem accelerator at JAEA Tokai, Japan, suggested the successful the synthesis of Os and W carbonyl com-plexes also without a preseparator to be feasible, if the thermalization of the evaporation residues is spatially decoupled from the chemical synthesis. The latter is re-quired to occur in a beam-free environment [11]. Further experiments were performed at the research reactor TRI-GA Mainz [12].
With the aim to support gas-phase experiments on
study of stability and volatility of carbonyls of the heavi-est elements, calculations of the electronic structure and properties of group-6 M(CO)6 [13] and group-8 M(CO)5 [14] have been performed using the most advanced rela-tivistic quantum-chemical methods (ADF BAND, X2c-DFT, DIRAC). The results have shown that in contrast to earlier published works the carbonyls of Sg and Hs should
be less stable than those of the lighter 5d-homologs. This finding is valuable for fixing the right conditions in meas-urements of the first bond dissociation energies of these complexes. In addition, using results of these calculations, volatilities of goup-8 carbonyls as adsorption energies on inert surfaces have been predicted via a model of mobile adsorption. It was shown that Hs(CO)5 should slightly more strongly adsorb on neutral surfaces than Os(CO)5.
To render assistance to gas-phase experiments on study of reactivity of elements 112 through 114 with various surfaces, calculations of the adsorption energies of these elements and their lighter homologs on a hydroxylated quartz surface have been performed using a periodic ADF BAND code [15, 16]. Such periodic calculations of ad-sorption energies have been performed for the first time for superheavy element systems. The results have shown that Cn should be indeed the most volatile element out of those under consideration. Also, Fl should not interact with quartz at room temperature. Element 113, Nh, on the contrary should strongly interact with quartz [16]. Such a different adsorption behavior allows for a good separation between all these elements using a combination of quartz and gold surfaces.
A further activity of the SHE Chemistry division con-
cerned the development of a new detector system for AL-pha-BEta-Gamma (ALBEGA) multicoincidence spectros-copy for chemically separated samples [17]. Efforts in 2016 were mainly dedicated to the study and development of the new alpha/beta detector. The new version will be characterized by a more densely packed configuration and a thinner dead-layer on the side in contact with the gas flux. The production of the device was performed at the ITE, Warsaw (Poland), for which an ad hoc technological development for its assembling was required. The new alpha/beta detector will not only provide a higher energy resolution and efficiency, but will also feature increased mechanical stability to sustain the pressure difference inside and outside of the gas channel.
Presently, one of the hot topics in the superheavy ele-
ment research is the synthesis of elements beyond Og (Z=118). The lack of sufficient amounts of heavier acti-nides prevents a continuation beyond Og with 48Ca-induced reactions. An obvious path is to continue with fusion-evaporation reactions, but with projectiles heavier than 48Ca. Several experiments have already been per-formed to synthesize Z=119 and 120 by using the reac-tions 50Ti+249Bk (TASCA, GSI), 64Ni+238U (SHIP, GSI), 58Fe+244Pu (DGFRS, FLNR, JINR), 54Cr+248Cm (SHIP, GSI), and 50Ti+249Cf (TASCA, GSI). In total, about one year of accelerator beam time has been spent for these search experiments. However, none of them led to the discovery of a new element, suggesting that cross sections are significantly lower than for 48Ca-induced reactions. To get a better guidance for future search experiments, a bet-ter understanding of the fusion reaction is needed. There-fore, to understand the reaction mechanism better, an in-tensive experimental campaign involving various heavy
RESEARCH-NUSTAR-SHEP-1 GSI SCIENTIFIC REPORT 2016
198 DOI:10.15120/GR-2017-1
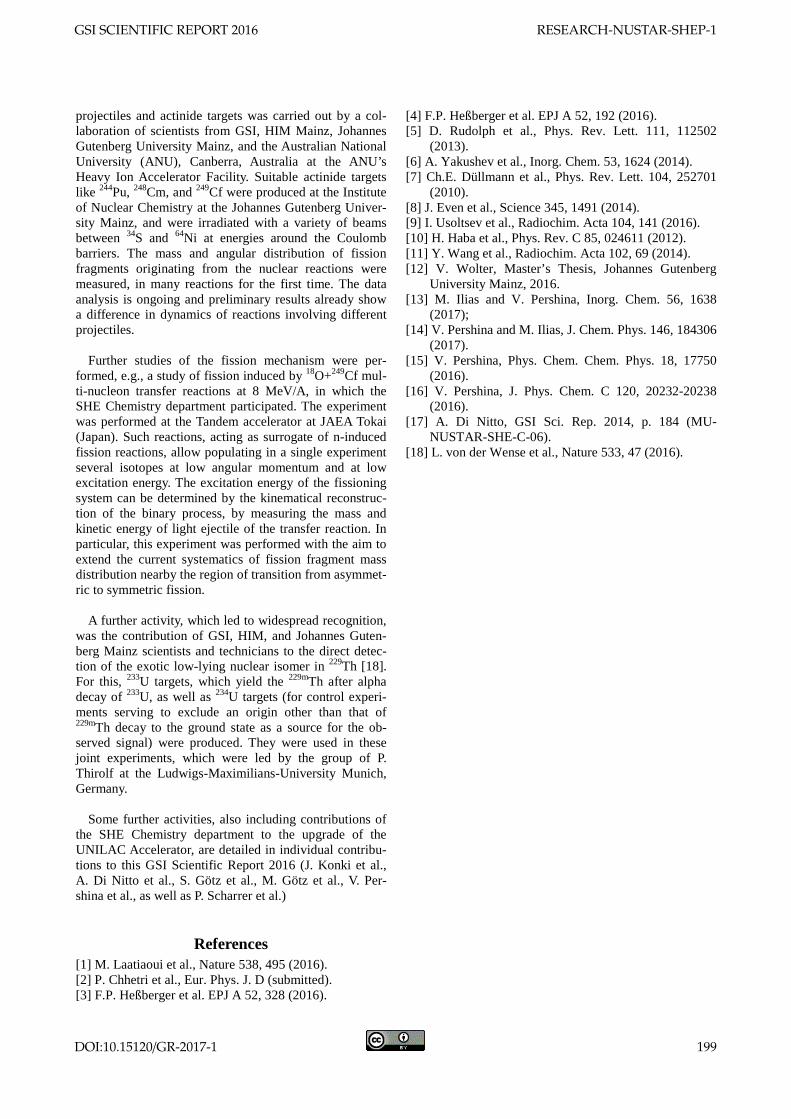
projectiles and actinide targets was carried out by a col-laboration of scientists from GSI, HIM Mainz, Johannes Gutenberg University Mainz, and the Australian National University (ANU), Canberra, Australia at the ANU’s Heavy Ion Accelerator Facility. Suitable actinide targets like 244Pu, 248Cm, and 249Cf were produced at the Institute of Nuclear Chemistry at the Johannes Gutenberg Univer-sity Mainz, and were irradiated with a variety of beams between 34S and 64Ni at energies around the Coulomb barriers. The mass and angular distribution of fission fragments originating from the nuclear reactions were measured, in many reactions for the first time. The data analysis is ongoing and preliminary results already show a difference in dynamics of reactions involving different projectiles.
Further studies of the fission mechanism were per-
formed, e.g., a study of fission induced by 18O+249Cf mul-ti-nucleon transfer reactions at 8 MeV/A, in which the SHE Chemistry department participated. The experiment was performed at the Tandem accelerator at JAEA Tokai (Japan). Such reactions, acting as surrogate of n-induced fission reactions, allow populating in a single experiment several isotopes at low angular momentum and at low excitation energy. The excitation energy of the fissioning system can be determined by the kinematical reconstruc-tion of the binary process, by measuring the mass and kinetic energy of light ejectile of the transfer reaction. In particular, this experiment was performed with the aim to extend the current systematics of fission fragment mass distribution nearby the region of transition from asymmet-ric to symmetric fission.
A further activity, which led to widespread recognition,
was the contribution of GSI, HIM, and Johannes Guten-berg Mainz scientists and technicians to the direct detec-tion of the exotic low-lying nuclear isomer in 229Th [18]. For this, 233U targets, which yield the 229mTh after alpha decay of 233U, as well as 234U targets (for control experi-ments serving to exclude an origin other than that of 229mTh decay to the ground state as a source for the ob-served signal) were produced. They were used in these joint experiments, which were led by the group of P. Thirolf at the Ludwigs-Maximilians-University Munich, Germany.
Some further activities, also including contributions of
the SHE Chemistry department to the upgrade of the UNILAC Accelerator, are detailed in individual contribu-tions to this GSI Scientific Report 2016 (J. Konki et al., A. Di Nitto et al., S. Götz et al., M. Götz et al., V. Per-shina et al., as well as P. Scharrer et al.)
References [1] M. Laatiaoui et al., Nature 538, 495 (2016). [2] P. Chhetri et al., Eur. Phys. J. D (submitted). [3] F.P. Heßberger et al. EPJ A 52, 328 (2016).
[4] F.P. Heßberger et al. EPJ A 52, 192 (2016). [5] D. Rudolph et al., Phys. Rev. Lett. 111, 112502
(2013). [6] A. Yakushev et al., Inorg. Chem. 53, 1624 (2014). [7] Ch.E. Düllmann et al., Phys. Rev. Lett. 104, 252701
(2010). [8] J. Even et al., Science 345, 1491 (2014). [9] I. Usoltsev et al., Radiochim. Acta 104, 141 (2016). [10] H. Haba et al., Phys. Rev. C 85, 024611 (2012). [11] Y. Wang et al., Radiochim. Acta 102, 69 (2014). [12] V. Wolter, Master’s Thesis, Johannes Gutenberg
University Mainz, 2016. [13] M. Ilias and V. Pershina, Inorg. Chem. 56, 1638
(2017); [14] V. Pershina and M. Ilias, J. Chem. Phys. 146, 184306
(2017). [15] V. Pershina, Phys. Chem. Chem. Phys. 18, 17750
(2016). [16] V. Pershina, J. Phys. Chem. C 120, 20232-20238
(2016). [17] A. Di Nitto, GSI Sci. Rep. 2014, p. 184 (MU-
NUSTAR-SHE-C-06). [18] L. von der Wense et al., Nature 533, 47 (2016).
GSI SCIENTIFIC REPORT 2016 RESEARCH-NUSTAR-SHEP-1
DOI:10.15120/GR-2017-1 199

RESEARCH-NUSTAR-SHEP-1 GSI SCIENTIFIC REPORT 2016
200 DOI:10.15120/GR-2017-1
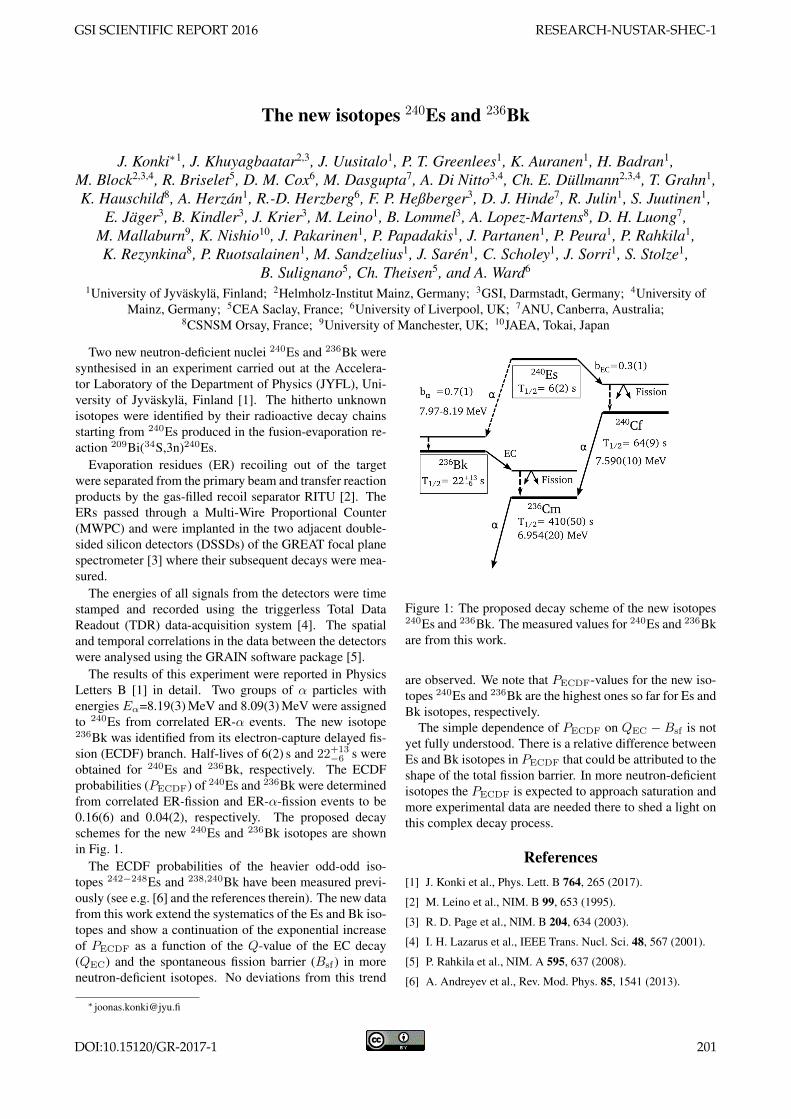
The new isotopes 240Es and 236Bk
J. Konki∗1, J. Khuyagbaatar2,3, J. Uusitalo1, P. T. Greenlees1, K. Auranen1, H. Badran1,M. Block2,3,4, R. Briselet5, D. M. Cox6, M. Dasgupta7, A. Di Nitto3,4, Ch. E. Dullmann2,3,4, T. Grahn1,K. Hauschild8, A. Herzan1, R.-D. Herzberg6, F. P. Heßberger3, D. J. Hinde7, R. Julin1, S. Juutinen1,
E. Jager3, B. Kindler3, J. Krier3, M. Leino1, B. Lommel3, A. Lopez-Martens8, D. H. Luong7,M. Mallaburn9, K. Nishio10, J. Pakarinen1, P. Papadakis1, J. Partanen1, P. Peura1, P. Rahkila1,K. Rezynkina8, P. Ruotsalainen1, M. Sandzelius1, J. Saren1, C. Scholey1, J. Sorri1, S. Stolze1,
B. Sulignano5, Ch. Theisen5, and A. Ward6
1University of Jyvaskyla, Finland; 2Helmholz-Institut Mainz, Germany; 3GSI, Darmstadt, Germany; 4University ofMainz, Germany; 5CEA Saclay, France; 6University of Liverpool, UK; 7ANU, Canberra, Australia;
8CSNSM Orsay, France; 9University of Manchester, UK; 10JAEA, Tokai, Japan
Two new neutron-deficient nuclei 240Es and 236Bk weresynthesised in an experiment carried out at the Accelera-tor Laboratory of the Department of Physics (JYFL), Uni-versity of Jyvaskyla, Finland [1]. The hitherto unknownisotopes were identified by their radioactive decay chainsstarting from 240Es produced in the fusion-evaporation re-action 209Bi(34S,3n)240Es.
Evaporation residues (ER) recoiling out of the targetwere separated from the primary beam and transfer reactionproducts by the gas-filled recoil separator RITU [2]. TheERs passed through a Multi-Wire Proportional Counter(MWPC) and were implanted in the two adjacent double-sided silicon detectors (DSSDs) of the GREAT focal planespectrometer [3] where their subsequent decays were mea-sured.
The energies of all signals from the detectors were timestamped and recorded using the triggerless Total DataReadout (TDR) data-acquisition system [4]. The spatialand temporal correlations in the data between the detectorswere analysed using the GRAIN software package [5].
The results of this experiment were reported in PhysicsLetters B [1] in detail. Two groups of α particles withenergies Eα=8.19(3) MeV and 8.09(3) MeV were assignedto 240Es from correlated ER-α events. The new isotope236Bk was identified from its electron-capture delayed fis-sion (ECDF) branch. Half-lives of 6(2) s and 22+13
−6 s wereobtained for 240Es and 236Bk, respectively. The ECDFprobabilities (PECDF) of 240Es and 236Bk were determinedfrom correlated ER-fission and ER-α-fission events to be0.16(6) and 0.04(2), respectively. The proposed decayschemes for the new 240Es and 236Bk isotopes are shownin Fig. 1.
The ECDF probabilities of the heavier odd-odd iso-topes 242−248Es and 238,240Bk have been measured previ-ously (see e.g. [6] and the references therein). The new datafrom this work extend the systematics of the Es and Bk iso-topes and show a continuation of the exponential increaseof PECDF as a function of the Q-value of the EC decay(QEC) and the spontaneous fission barrier (Bsf ) in moreneutron-deficient isotopes. No deviations from this trend
Figure 1: The proposed decay scheme of the new isotopes240Es and 236Bk. The measured values for 240Es and 236Bkare from this work.
are observed. We note that PECDF-values for the new iso-topes 240Es and 236Bk are the highest ones so far for Es andBk isotopes, respectively.
The simple dependence of PECDF on QEC − Bsf is notyet fully understood. There is a relative difference betweenEs and Bk isotopes in PECDF that could be attributed to theshape of the total fission barrier. In more neutron-deficientisotopes the PECDF is expected to approach saturation andmore experimental data are needed there to shed a light onthis complex decay process.
References[1] J. Konki et al., Phys. Lett. B 764, 265 (2017).
[2] M. Leino et al., NIM. B 99, 653 (1995).
[3] R. D. Page et al., NIM. B 204, 634 (2003).
[4] I. H. Lazarus et al., IEEE Trans. Nucl. Sci. 48, 567 (2001).
[5] P. Rahkila et al., NIM. A 595, 637 (2008).
[6] A. Andreyev et al., Rev. Mod. Phys. 85, 1541 (2013).
GSI SCIENTIFIC REPORT 2016 RESEARCH-NUSTAR-SHEC-1
DOI:10.15120/GR-2017-1 201
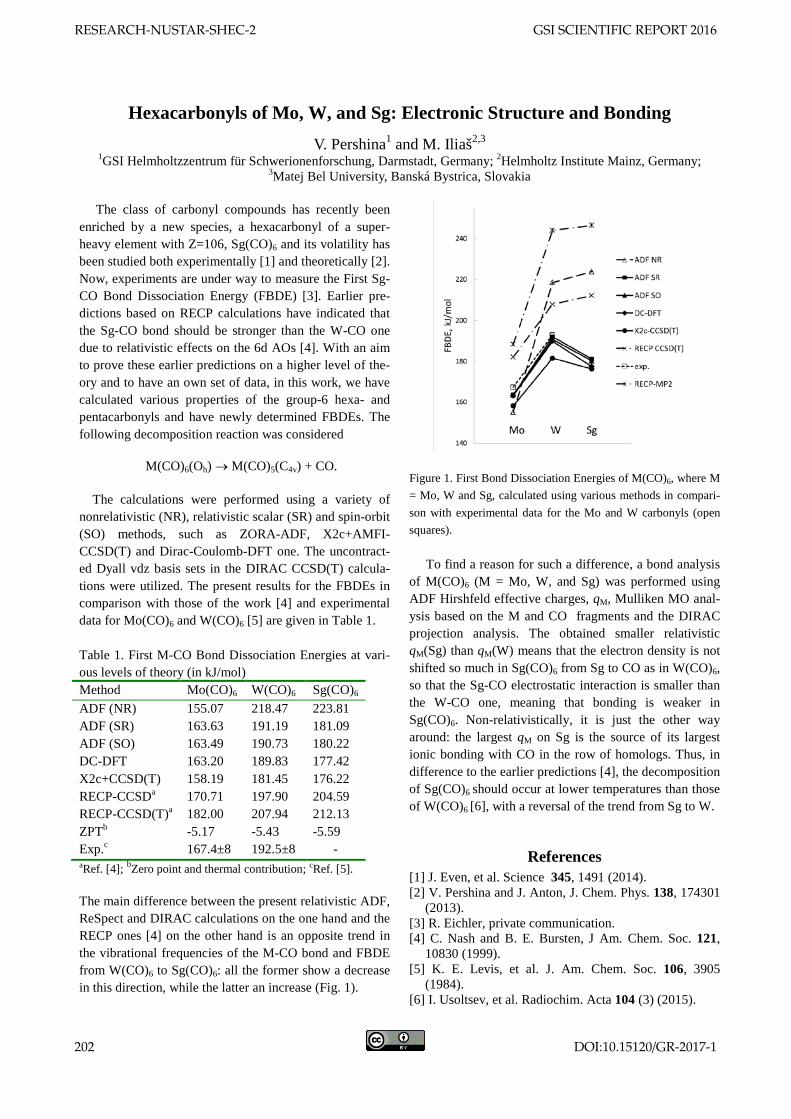
GSITemplate2007
Hexacarbonyls of Mo, W, and Sg: Electronic Structure and Bonding V. Pershina1 and M. Iliaš2,3
1GSI Helmholtzzentrum für Schwerionenforschung, Darmstadt, Germany; 2Helmholtz Institute Mainz, Germany; 3Matej Bel University, Banská Bystrica, Slovakia
The class of carbonyl compounds has recently been enriched by a new species, a hexacarbonyl of a super-heavy element with Z=106, Sg(CO)6 and its volatility has been studied both experimentally [1] and theoretically [2]. Now, experiments are under way to measure the First Sg-CO Bond Dissociation Energy (FBDE) [3]. Earlier pre-dictions based on RECP calculations have indicated that the Sg-CO bond should be stronger than the W-CO one due to relativistic effects on the 6d AOs [4]. With an aim to prove these earlier predictions on a higher level of the-ory and to have an own set of data, in this work, we have calculated various properties of the group-6 hexa- and pentacarbonyls and have newly determined FBDEs. The following decomposition reaction was considered
M(CO)6(Oh) → M(CO)5(C4v) + CO.
The calculations were performed using a variety of nonrelativistic (NR), relativistic scalar (SR) and spin-orbit (SO) methods, such as ZORA-ADF, X2c+AMFI-CCSD(T) and Dirac-Coulomb-DFT one. The uncontract-ed Dyall vdz basis sets in the DIRAC CCSD(T) calcula-tions were utilized. The present results for the FBDEs in comparison with those of the work [4] and experimental data for Mo(CO)6 and W(CO)6 [5] are given in Table 1. Table 1. First M-CO Bond Dissociation Energies at vari-ous levels of theory (in kJ/mol) Method Mo(CO)6 W(CO)6 Sg(CO)6 ADF (NR) 155.07 218.47 223.81 ADF (SR) 163.63 191.19 181.09 ADF (SO) 163.49 190.73 180.22 DC-DFT 163.20 189.83 177.42 X2c+CCSD(T) 158.19 181.45 176.22 RECP-CCSDa 170.71 197.90 204.59 RECP-CCSD(T)a 182.00 207.94 212.13 ZPTb -5.17 -5.43 -5.59 Exp.c 167.4±8 192.5±8 - aRef. [4]; bZero point and thermal contribution; cRef. [5]. The main difference between the present relativistic ADF, ReSpect and DIRAC calculations on the one hand and the RECP ones [4] on the other hand is an opposite trend in the vibrational frequencies of the M-CO bond and FBDE from W(CO)6 to Sg(CO)6: all the former show a decrease in this direction, while the latter an increase (Fig. 1).
Figure 1. First Bond Dissociation Energies of M(CO)6, where M = Mo, W and Sg, calculated using various methods in compari-son with experimental data for the Mo and W carbonyls (open squares). To find a reason for such a difference, a bond analysis of M(CO)6 (M = Mo, W, and Sg) was performed using ADF Hirshfeld effective charges, qM, Mulliken MO anal-ysis based on the M and CO fragments and the DIRAC projection analysis. The obtained smaller relativistic qM(Sg) than qM(W) means that the electron density is not shifted so much in Sg(CO)6 from Sg to CO as in W(CO)6, so that the Sg-CO electrostatic interaction is smaller than the W-CO one, meaning that bonding is weaker in Sg(CO)6. Non-relativistically, it is just the other way around: the largest qM on Sg is the source of its largest ionic bonding with CO in the row of homologs. Thus, in difference to the earlier predictions [4], the decomposition of Sg(CO)6 should occur at lower temperatures than those of W(CO)6 [6], with a reversal of the trend from Sg to W.
References [1] J. Even, et al. Science 345, 1491 (2014). [2] V. Pershina and J. Anton, J. Chem. Phys. 138, 174301
(2013). [3] R. Eichler, private communication. [4] C. Nash and B. E. Bursten, J Am. Chem. Soc. 121,
10830 (1999). [5] K. E. Levis, et al. J. Am. Chem. Soc. 106, 3905
(1984). [6] I. Usoltsev, et al. Radiochim. Acta 104 (3) (2015).
RESEARCH-NUSTAR-SHEC-2 GSI SCIENTIFIC REPORT 2016
202 DOI:10.15120/GR-2017-1
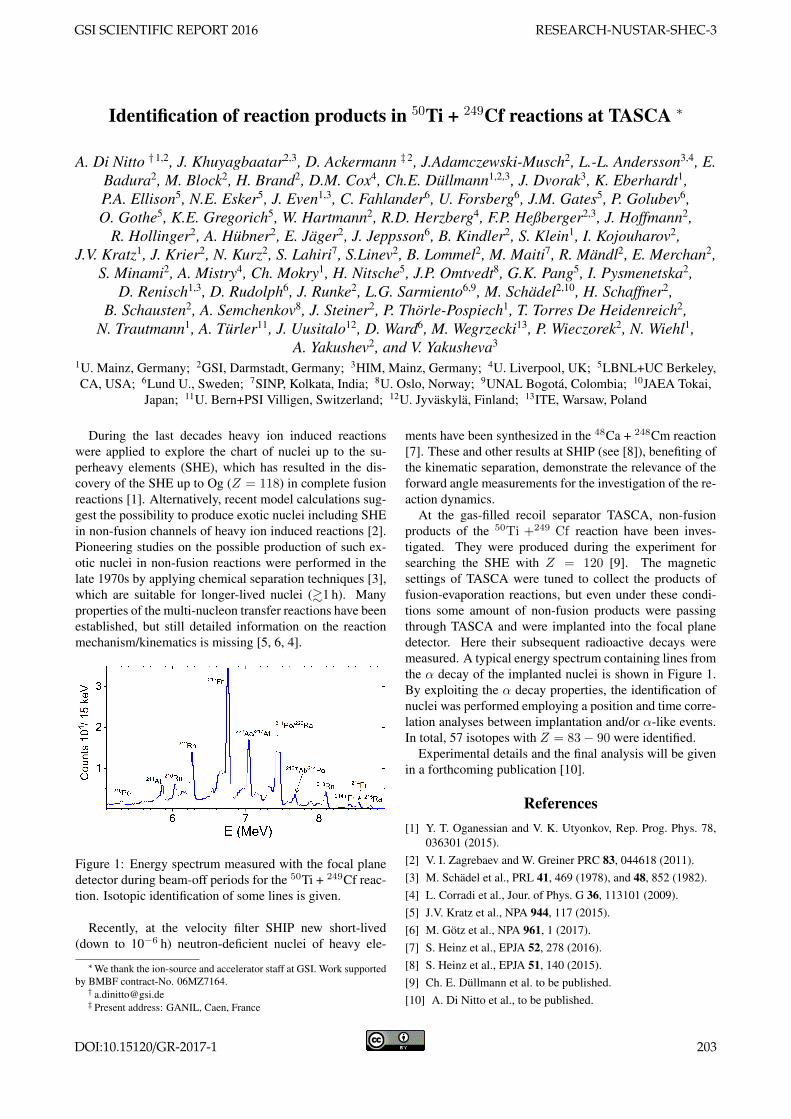
Identification of reaction products in 50Ti + 249Cf reactions at TASCA ∗
A. Di Nitto † 1,2, J. Khuyagbaatar2,3, D. Ackermann ‡ 2, J.Adamczewski-Musch2, L.-L. Andersson3,4, E.Badura2, M. Block2, H. Brand2, D.M. Cox4, Ch.E. Dullmann1,2,3, J. Dvorak3, K. Eberhardt1,P.A. Ellison5, N.E. Esker5, J. Even1,3, C. Fahlander6, U. Forsberg6, J.M. Gates5, P. Golubev6,O. Gothe5, K.E. Gregorich5, W. Hartmann2, R.D. Herzberg4, F.P. Heßberger2,3, J. Hoffmann2,
R. Hollinger2, A. Hubner2, E. Jager2, J. Jeppsson6, B. Kindler2, S. Klein1, I. Kojouharov2,J.V. Kratz1, J. Krier2, N. Kurz2, S. Lahiri7, S.Linev2, B. Lommel2, M. Maiti7, R. Mandl2, E. Merchan2,
S. Minami2, A. Mistry4, Ch. Mokry1, H. Nitsche5, J.P. Omtvedt8, G.K. Pang5, I. Pysmenetska2,D. Renisch1,3, D. Rudolph6, J. Runke2, L.G. Sarmiento6,9, M. Schadel2,10, H. Schaffner2,
B. Schausten2, A. Semchenkov8, J. Steiner2, P. Thorle-Pospiech1, T. Torres De Heidenreich2,N. Trautmann1, A. Turler11, J. Uusitalo12, D. Ward6, M. Wegrzecki13, P. Wieczorek2, N. Wiehl1,
A. Yakushev2, and V. Yakusheva3
1U. Mainz, Germany; 2GSI, Darmstadt, Germany; 3HIM, Mainz, Germany; 4U. Liverpool, UK; 5LBNL+UC Berkeley,CA, USA; 6Lund U., Sweden; 7SINP, Kolkata, India; 8U. Oslo, Norway; 9UNAL Bogota, Colombia; 10JAEA Tokai,
Japan; 11U. Bern+PSI Villigen, Switzerland; 12U. Jyvaskyla, Finland; 13ITE, Warsaw, Poland
During the last decades heavy ion induced reactionswere applied to explore the chart of nuclei up to the su-perheavy elements (SHE), which has resulted in the dis-covery of the SHE up to Og (Z = 118) in complete fusionreactions [1]. Alternatively, recent model calculations sug-gest the possibility to produce exotic nuclei including SHEin non-fusion channels of heavy ion induced reactions [2].Pioneering studies on the possible production of such ex-otic nuclei in non-fusion reactions were performed in thelate 1970s by applying chemical separation techniques [3],which are suitable for longer-lived nuclei (&1 h). Manyproperties of the multi-nucleon transfer reactions have beenestablished, but still detailed information on the reactionmechanism/kinematics is missing [5, 6, 4].
Figure 1: Energy spectrum measured with the focal planedetector during beam-off periods for the 50Ti + 249Cf reac-tion. Isotopic identification of some lines is given.
Recently, at the velocity filter SHIP new short-lived(down to 10−6 h) neutron-deficient nuclei of heavy ele-
∗We thank the ion-source and accelerator staff at GSI. Work supportedby BMBF contract-No. 06MZ7164.† [email protected]‡ Present address: GANIL, Caen, France
ments have been synthesized in the 48Ca + 248Cm reaction[7]. These and other results at SHIP (see [8]), benefiting ofthe kinematic separation, demonstrate the relevance of theforward angle measurements for the investigation of the re-action dynamics.
At the gas-filled recoil separator TASCA, non-fusionproducts of the 50Ti +249 Cf reaction have been inves-tigated. They were produced during the experiment forsearching the SHE with Z = 120 [9]. The magneticsettings of TASCA were tuned to collect the products offusion-evaporation reactions, but even under these condi-tions some amount of non-fusion products were passingthrough TASCA and were implanted into the focal planedetector. Here their subsequent radioactive decays weremeasured. A typical energy spectrum containing lines fromthe α decay of the implanted nuclei is shown in Figure 1.By exploiting the α decay properties, the identification ofnuclei was performed employing a position and time corre-lation analyses between implantation and/or α-like events.In total, 57 isotopes with Z = 83− 90 were identified.
Experimental details and the final analysis will be givenin a forthcoming publication [10].
References[1] Y. T. Oganessian and V. K. Utyonkov, Rep. Prog. Phys. 78,
036301 (2015).[2] V. I. Zagrebaev and W. Greiner PRC 83, 044618 (2011).[3] M. Schadel et al., PRL 41, 469 (1978), and 48, 852 (1982).[4] L. Corradi et al., Jour. of Phys. G 36, 113101 (2009).[5] J.V. Kratz et al., NPA 944, 117 (2015).[6] M. Gotz et al., NPA 961, 1 (2017).[7] S. Heinz et al., EPJA 52, 278 (2016).[8] S. Heinz et al., EPJA 51, 140 (2015).[9] Ch. E. Dullmann et al. to be published.[10] A. Di Nitto et al., to be published.
GSI SCIENTIFIC REPORT 2016 RESEARCH-NUSTAR-SHEC-3
DOI:10.15120/GR-2017-1 203
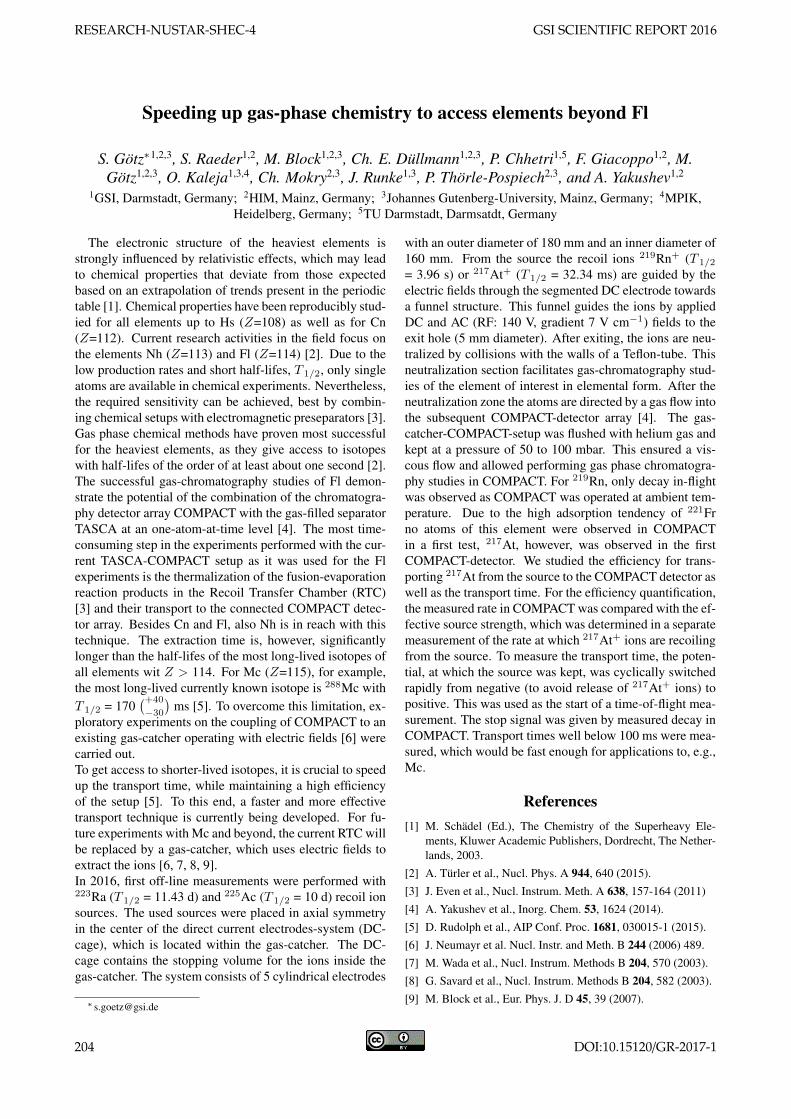
Speeding up gas-phase chemistry to access elements beyond Fl
S. Gotz∗1,2,3, S. Raeder1,2, M. Block1,2,3, Ch. E. Dullmann1,2,3, P. Chhetri1,5, F. Giacoppo1,2, M.Gotz1,2,3, O. Kaleja1,3,4, Ch. Mokry2,3, J. Runke1,3, P. Thorle-Pospiech2,3, and A. Yakushev1,2
1GSI, Darmstadt, Germany; 2HIM, Mainz, Germany; 3Johannes Gutenberg-University, Mainz, Germany; 4MPIK,Heidelberg, Germany; 5TU Darmstadt, Darmsatdt, Germany
The electronic structure of the heaviest elements isstrongly influenced by relativistic effects, which may leadto chemical properties that deviate from those expectedbased on an extrapolation of trends present in the periodictable [1]. Chemical properties have been reproducibly stud-ied for all elements up to Hs (Z=108) as well as for Cn(Z=112). Current research activities in the field focus onthe elements Nh (Z=113) and Fl (Z=114) [2]. Due to thelow production rates and short half-lifes, T 1/2, only singleatoms are available in chemical experiments. Nevertheless,the required sensitivity can be achieved, best by combin-ing chemical setups with electromagnetic preseparators [3].Gas phase chemical methods have proven most successfulfor the heaviest elements, as they give access to isotopeswith half-lifes of the order of at least about one second [2].The successful gas-chromatography studies of Fl demon-strate the potential of the combination of the chromatogra-phy detector array COMPACT with the gas-filled separatorTASCA at an one-atom-at-time level [4]. The most time-consuming step in the experiments performed with the cur-rent TASCA-COMPACT setup as it was used for the Flexperiments is the thermalization of the fusion-evaporationreaction products in the Recoil Transfer Chamber (RTC)[3] and their transport to the connected COMPACT detec-tor array. Besides Cn and Fl, also Nh is in reach with thistechnique. The extraction time is, however, significantlylonger than the half-lifes of the most long-lived isotopes ofall elements wit Z > 114. For Mc (Z=115), for example,the most long-lived currently known isotope is 288Mc withT 1/2 = 170
(+40
−30
)ms [5]. To overcome this limitation, ex-
ploratory experiments on the coupling of COMPACT to anexisting gas-catcher operating with electric fields [6] werecarried out.To get access to shorter-lived isotopes, it is crucial to speedup the transport time, while maintaining a high efficiencyof the setup [5]. To this end, a faster and more effectivetransport technique is currently being developed. For fu-ture experiments with Mc and beyond, the current RTC willbe replaced by a gas-catcher, which uses electric fields toextract the ions [6, 7, 8, 9].In 2016, first off-line measurements were performed with223Ra (T 1/2 = 11.43 d) and 225Ac (T 1/2 = 10 d) recoil ionsources. The used sources were placed in axial symmetryin the center of the direct current electrodes-system (DC-cage), which is located within the gas-catcher. The DC-cage contains the stopping volume for the ions inside thegas-catcher. The system consists of 5 cylindrical electrodes
with an outer diameter of 180 mm and an inner diameter of160 mm. From the source the recoil ions 219Rn+ (T 1/2
= 3.96 s) or 217At+ (T 1/2 = 32.34 ms) are guided by theelectric fields through the segmented DC electrode towardsa funnel structure. This funnel guides the ions by appliedDC and AC (RF: 140 V, gradient 7 V cm−1) fields to theexit hole (5 mm diameter). After exiting, the ions are neu-tralized by collisions with the walls of a Teflon-tube. Thisneutralization section facilitates gas-chromatography stud-ies of the element of interest in elemental form. After theneutralization zone the atoms are directed by a gas flow intothe subsequent COMPACT-detector array [4]. The gas-catcher-COMPACT-setup was flushed with helium gas andkept at a pressure of 50 to 100 mbar. This ensured a vis-cous flow and allowed performing gas phase chromatogra-phy studies in COMPACT. For 219Rn, only decay in-flightwas observed as COMPACT was operated at ambient tem-perature. Due to the high adsorption tendency of 221Frno atoms of this element were observed in COMPACTin a first test, 217At, however, was observed in the firstCOMPACT-detector. We studied the efficiency for trans-porting 217At from the source to the COMPACT detector aswell as the transport time. For the efficiency quantification,the measured rate in COMPACT was compared with the ef-fective source strength, which was determined in a separatemeasurement of the rate at which 217At+ ions are recoilingfrom the source. To measure the transport time, the poten-tial, at which the source was kept, was cyclically switchedrapidly from negative (to avoid release of 217At+ ions) topositive. This was used as the start of a time-of-flight mea-surement. The stop signal was given by measured decay inCOMPACT. Transport times well below 100 ms were mea-sured, which would be fast enough for applications to, e.g.,Mc.
References[1] M. Schadel (Ed.), The Chemistry of the Superheavy Ele-
ments, Kluwer Academic Publishers, Dordrecht, The Nether-lands, 2003.
[2] A. Turler et al., Nucl. Phys. A 944, 640 (2015).[3] J. Even et al., Nucl. Instrum. Meth. A 638, 157-164 (2011)[4] A. Yakushev et al., Inorg. Chem. 53, 1624 (2014).[5] D. Rudolph et al., AIP Conf. Proc. 1681, 030015-1 (2015).[6] J. Neumayr et al. Nucl. Instr. and Meth. B 244 (2006) 489.[7] M. Wada et al., Nucl. Instrum. Methods B 204, 570 (2003).[8] G. Savard et al., Nucl. Instrum. Methods B 204, 582 (2003).[9] M. Block et al., Eur. Phys. J. D 45, 39 (2007).
RESEARCH-NUSTAR-SHEC-4 GSI SCIENTIFIC REPORT 2016
204 DOI:10.15120/GR-2017-1
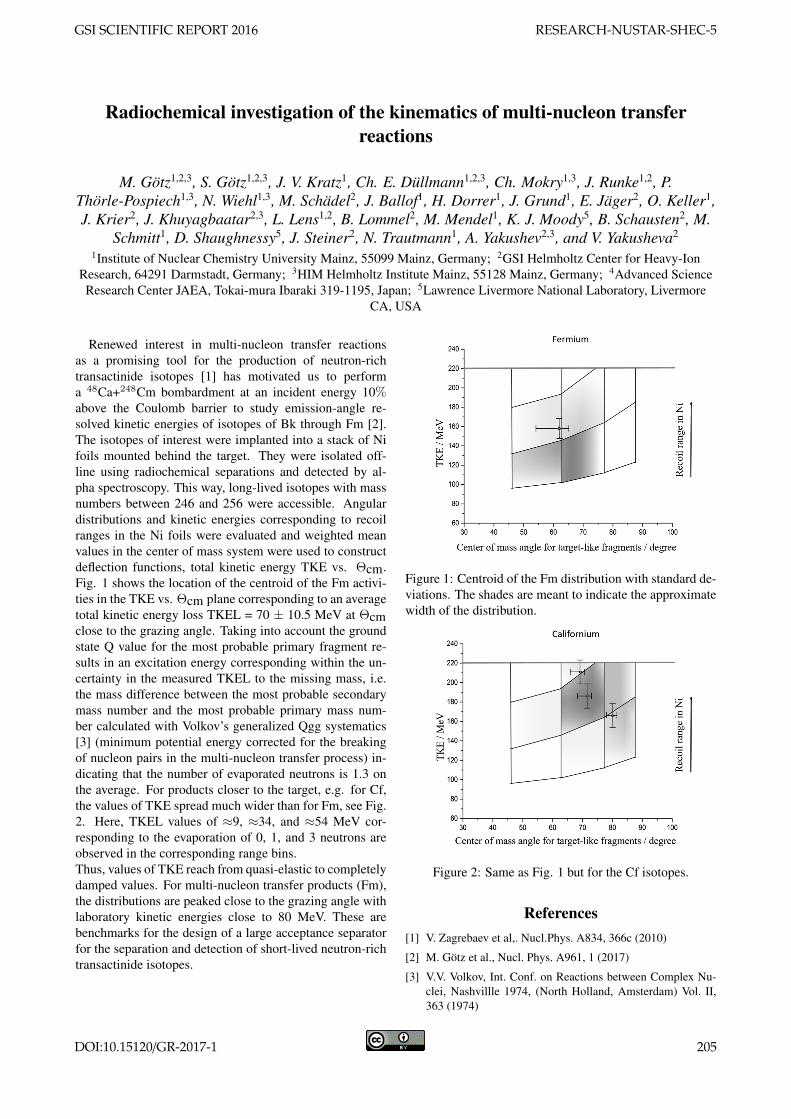
Radiochemical investigation of the kinematics of multi-nucleon transferreactions
M. Götz1,2,3, S. Götz1,2,3, J. V. Kratz1, Ch. E. Düllmann1,2,3, Ch. Mokry1,3, J. Runke1,2, P.Thörle-Pospiech1,3, N. Wiehl1,3, M. Schädel2, J. Ballof1, H. Dorrer1, J. Grund1, E. Jäger2, O. Keller1,J. Krier2, J. Khuyagbaatar2,3, L. Lens1,2, B. Lommel2, M. Mendel1, K. J. Moody5, B. Schausten2, M.
Schmitt1, D. Shaughnessy5, J. Steiner2, N. Trautmann1, A. Yakushev2,3, and V. Yakusheva2
1Institute of Nuclear Chemistry University Mainz, 55099 Mainz, Germany; 2GSI Helmholtz Center for Heavy-IonResearch, 64291 Darmstadt, Germany; 3HIM Helmholtz Institute Mainz, 55128 Mainz, Germany; 4Advanced ScienceResearch Center JAEA, Tokai-mura Ibaraki 319-1195, Japan; 5Lawrence Livermore National Laboratory, Livermore
CA, USA
Renewed interest in multi-nucleon transfer reactionsas a promising tool for the production of neutron-richtransactinide isotopes [1] has motivated us to performa 48Ca+248Cm bombardment at an incident energy 10%above the Coulomb barrier to study emission-angle re-solved kinetic energies of isotopes of Bk through Fm [2].The isotopes of interest were implanted into a stack of Nifoils mounted behind the target. They were isolated off-line using radiochemical separations and detected by al-pha spectroscopy. This way, long-lived isotopes with massnumbers between 246 and 256 were accessible. Angulardistributions and kinetic energies corresponding to recoilranges in the Ni foils were evaluated and weighted meanvalues in the center of mass system were used to constructdeflection functions, total kinetic energy TKE vs. Θcm.Fig. 1 shows the location of the centroid of the Fm activi-ties in the TKE vs. Θcm plane corresponding to an averagetotal kinetic energy loss TKEL = 70 ± 10.5 MeV at Θcmclose to the grazing angle. Taking into account the groundstate Q value for the most probable primary fragment re-sults in an excitation energy corresponding within the un-certainty in the measured TKEL to the missing mass, i.e.the mass difference between the most probable secondarymass number and the most probable primary mass num-ber calculated with Volkov’s generalized Qgg systematics[3] (minimum potential energy corrected for the breakingof nucleon pairs in the multi-nucleon transfer process) in-dicating that the number of evaporated neutrons is 1.3 onthe average. For products closer to the target, e.g. for Cf,the values of TKE spread much wider than for Fm, see Fig.2. Here, TKEL values of ≈9, ≈34, and ≈54 MeV cor-responding to the evaporation of 0, 1, and 3 neutrons areobserved in the corresponding range bins.Thus, values of TKE reach from quasi-elastic to completelydamped values. For multi-nucleon transfer products (Fm),the distributions are peaked close to the grazing angle withlaboratory kinetic energies close to 80 MeV. These arebenchmarks for the design of a large acceptance separatorfor the separation and detection of short-lived neutron-richtransactinide isotopes.
Figure 1: Centroid of the Fm distribution with standard de-viations. The shades are meant to indicate the approximatewidth of the distribution.
Figure 2: Same as Fig. 1 but for the Cf isotopes.
References[1] V. Zagrebaev et al,. Nucl.Phys. A834, 366c (2010)
[2] M. Götz et al., Nucl. Phys. A961, 1 (2017)
[3] V.V. Volkov, Int. Conf. on Reactions between Complex Nu-clei, Nashvillle 1974, (North Holland, Amsterdam) Vol. II,363 (1974)
GSI SCIENTIFIC REPORT 2016 RESEARCH-NUSTAR-SHEC-5
DOI:10.15120/GR-2017-1 205
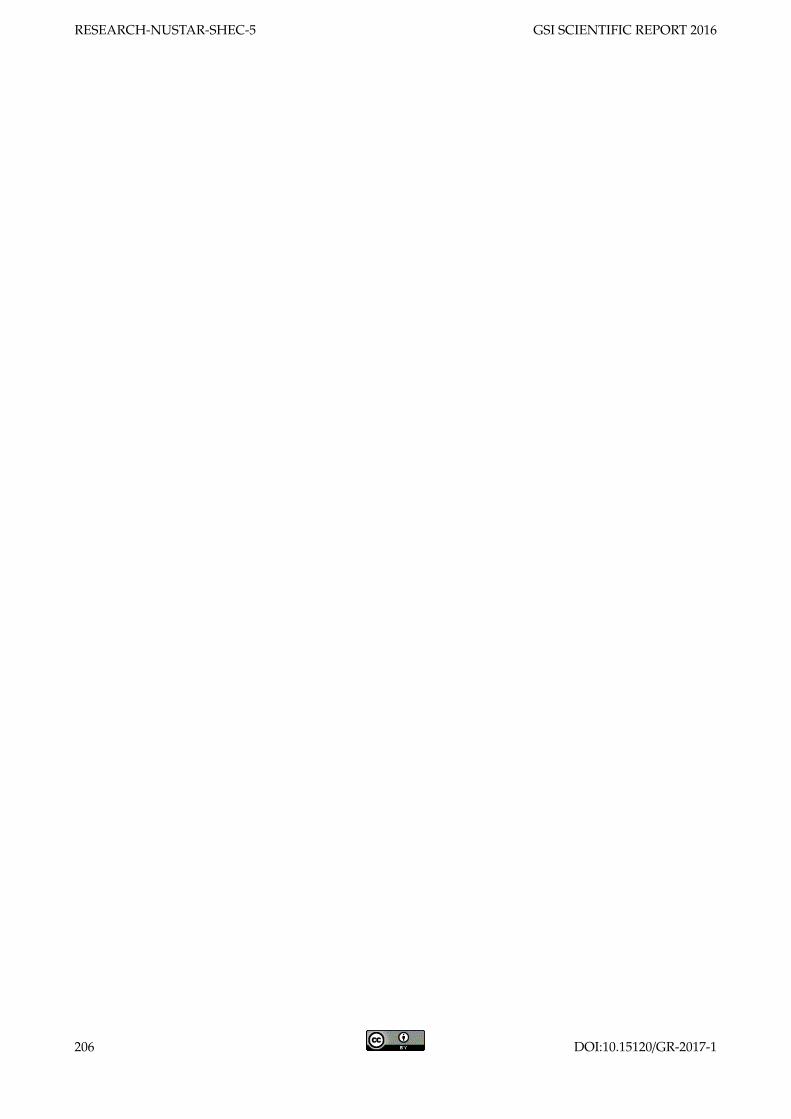
RESEARCH-NUSTAR-SHEC-5 GSI SCIENTIFIC REPORT 2016
206 DOI:10.15120/GR-2017-1
NeuLAND - from the demonstrator to the start version∗
K. Boretzky† 3, G. Alkhazov1, L. Atar2,3,4, T. Aumann2,3, C. Beinrucker13, D. Bemmerer5, C. Caesar3,M. Cherciu6, L. Chulkov7, T. Cowan5,8, C.A. Douma9, Z. Elekes10, J. Enders2, J. Fruhauf3,
D. Galaviz Redondo11, I. Gasparic12, N. Gruzinsky1, K. Gobel13, T. Heftrich13, H. Heggen3, M. Heil3,A. Heinz14, J. Hoffmann3, M. Holl2, A. Horvat2, A. Horvath15, H.T. Johansson14, B. Jonson14,J. Kahlbow2, N. Kalantar-Nayestanaki9, A. Kelic-Heil3, K. Koch3, N. Kozlenko1, D. Kresan3,
N. Kurz3, V. Kuznetsov1, D. Korper3, C. Langer13,3, S. Lindberg14, J. Mayer16, M. Najafi9,T. Nilsson14, G. Nyman14, A. Pelizza14, S.G. Pickstone16, R. Plag3, M. Pohl13, P. Potlog6,
R. Reifarth13, S. Reinhardt8, S. Reinicke5, C. Rigollet9, S. Roder5, D. Rossi2, D. Savran17, H. Scheit2,F. Schindler2, P. Schrock2, H. Simon3, E. Stan6, R. Thies14, H. Tornqvist2, L. Uvarov1, S. Volkov1,
A. Wagner5, V. Wagner2, A. Zilges16, K. Zuber8, and the R3B Collaboration1
1Petersburg Nuclear Physics Institute Gatchina, Russia; 2Technische Universitat Darmstadt, Darmstadt, Germany; 3GSIHelmholtzzentrum fur Schwerionenforschung, Darmstadt, Germany; 4University of Guelph, Canada;
5Helmholtz-Zentrum Dresden-Rossendorf, Dresden, Germany; 6Institute of Space Sciences, Magurele, Romania;7NRC Kurchatov Institute, Moscow, Russia; 8Technische Universitat Dresden, Germany; 9KVI - CART, University of
Groningen, The Netherlands; 10ATOMKI Debrecen, Hungary; 11Laboratory for Instrumentation and ExperimentalParticle Physics, Lisbon, Portugal; 12RBI Zagreb, Croatia; 13Johann Wolfgang Goethe-Universitat Frankfurt, Germany;
14Chalmers University of Technology, Gothenburg, Sweden; 15Eoetvoes Lorand University, Budapest, Hungary;16Universitat zu Koln, Germany; 17Extreme Matter Institute, Darmstadt, Germany
Introduction
NeuLAND (New Large Area Neutron Detector) [1] isone of the key elements of the R3B experiment, designedto measure fast neutrons with energies of typically 100 to1000 MeV, and to determine their four-momenta with highprecision. Acting primarily as a time-of-flight spectrome-ter with a time resolution of σt ≤ 150 ps and spatial res-olutions of σx,y,z ≈ 1.5 cm, the calorimetric properties ofthis detector are essential for the reconstruction of multi-neutron events. NeuLAND with its front size of 2.5x2.5m2 and a total depth of 3 m is built from organic scintil-lator bars arranged in a double-plane structure. For detailswe refer to the GSI annual reports [2, 3]. In this document,we report about the achievements in the last two years. Thetwo major activities are the continous production of furtherdetector components, and the experimental campaign car-ried out at RIKEN with the NeuLAND demonstrator.
Production Status
Double Planes The final NeuLAND detector will con-sist of 30 double planes, each with a depth of 10 cmconstitutes an independent subunit of 100 scintillators and200 photomultipliers, see figure 1. The read-out electron-ics and the high voltage supply are mounted on each doubleplane frame, the form factor enables the dense packing ofdouble planes, limited only by the depth of the scintillatorbars.
∗This work is supported by the BMBF projects 05P15RDFN1,05P2015PKFNA,05P15RFFN1, University of Groningen, the Croat-ian Science Foundation project SR-ETNo, HIC for FAIR and GSI(KZILGE1416)
The NeuLAND demonstrator, consists of four double-planes, which are still supplied by a commercially availablehigh voltage system and the read-out system TacQuila [4]previously used for LAND. While it was shipped to RIKENin 2014, the production of new double planes at GSI con-tinued and big steps were made towards the final design. Atthe time of writing this report, a total of 11 double planesare complete. One to two more double planes will be builtduring 2017, thus providing a 40% detector.
Readout Electronics The read-out electronics forNeuLAND (NeuLAND-TAMEX) is a GSI in-house devel-opment based on the former TacQuila electronics. It deliv-ers a very precise time measurement from an FPGA TDCand a charge measurement using the Time-over-Threshold(ToT) method. After in-beam tests of the first prototypes[5], major improvements in terms of compactness and per-formance were implemented. The functionality of the for-mer frontend electronics (LANDFEE), the charge measur-ing board (QTC), and the monitoring and controls board(TRIPLEX) have been combined into one newly designedboard (FQT). Together with the improved FPGA TDCboard (TAMEX3), a very compact and cost-effective de-sign has been established. This setup was tested in a GSIbeam time in 2016 as read-out for the new Time-of-Flightwall for R3B and demonstrated excellent performance withrespect to timing and charge resolution, far beyond theneeds for NeuLAND. The pre-series of the new read-outelectronics (200 channels) was mounted inside the elec-tronic boxes of one double-plane (see figure 1) and suc-cessfully taken into operation. The timing properties of thedouble-plane, determined using cosmic rays, exhibit resultsof typicallyσmean
t ≈ 120 ps similar to earlier extracted val-
GSI SCIENTIFIC REPORT 2016 RESEARCH-NUSTAR-KR-1
DOI:10.15120/GR-2017-1 207
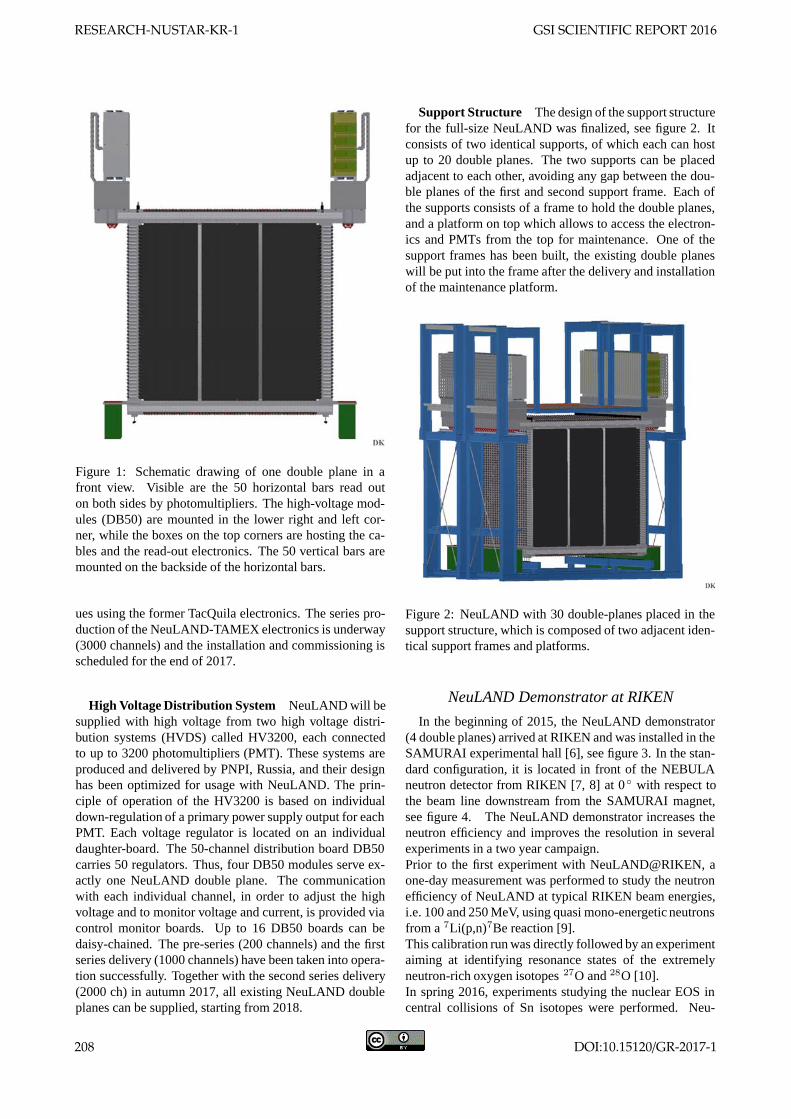
Figure 1: Schematic drawing of one double plane in afront view. Visible are the 50 horizontal bars read outon both sides by photomultipliers. The high-voltage mod-ules (DB50) are mounted in the lower right and left cor-ner, while the boxes on the top corners are hosting the ca-bles and the read-out electronics. The 50 vertical bars aremounted on the backside of the horizontal bars.
ues using the former TacQuila electronics. The series pro-duction of the NeuLAND-TAMEX electronics is underway(3000 channels) and the installation and commissioning isscheduled for the end of 2017.
High Voltage Distribution System NeuLAND will besupplied with high voltage from two high voltage distri-bution systems (HVDS) called HV3200, each connectedto up to 3200 photomultipliers (PMT). These systems areproduced and delivered by PNPI, Russia, and their designhas been optimized for usage with NeuLAND. The prin-ciple of operation of the HV3200 is based on individualdown-regulation of a primary power supply output for eachPMT. Each voltage regulator is located on an individualdaughter-board. The 50-channel distribution board DB50carries 50 regulators. Thus, four DB50 modules serve ex-actly one NeuLAND double plane. The communicationwith each individual channel, in order to adjust the highvoltage and to monitor voltage and current, is provided viacontrol monitor boards. Up to 16 DB50 boards can bedaisy-chained. The pre-series (200 channels) and the firstseries delivery (1000 channels) have been taken into opera-tion successfully. Together with the second series delivery(2000 ch) in autumn 2017, all existing NeuLAND doubleplanes can be supplied, starting from 2018.
Support Structure The design of the support structurefor the full-size NeuLAND was finalized, see figure 2. Itconsists of two identical supports, of which each can hostup to 20 double planes. The two supports can be placedadjacent to each other, avoiding any gap between the dou-ble planes of the first and second support frame. Each ofthe supports consists of a frame to hold the double planes,and a platform on top which allows to access the electron-ics and PMTs from the top for maintenance. One of thesupport frames has been built, the existing double planeswill be put into the frame after the delivery and installationof the maintenance platform.
Figure 2: NeuLAND with 30 double-planes placed in thesupport structure, which is composed of two adjacent iden-tical support frames and platforms.
NeuLAND Demonstrator at RIKEN
In the beginning of 2015, the NeuLAND demonstrator(4 double planes) arrived at RIKEN and was installed in theSAMURAI experimental hall [6], see figure 3. In the stan-dard configuration, it is located in front of the NEBULAneutron detector from RIKEN [7, 8] at 0◦ with respect tothe beam line downstream from the SAMURAI magnet,see figure 4. The NeuLAND demonstrator increases theneutron efficiency and improves the resolution in severalexperiments in a two year campaign.Prior to the first experiment with NeuLAND@RIKEN, aone-day measurement was performed to study the neutronefficiency of NeuLAND at typical RIKEN beam energies,i.e. 100 and 250 MeV, using quasi mono-energetic neutronsfrom a 7Li(p,n)7Be reaction [9].This calibration run was directly followed by an experimentaiming at identifying resonance states of the extremelyneutron-rich oxygen isotopes 27O and 28O [10].In spring 2016, experiments studying the nuclear EOS incentral collisions of Sn isotopes were performed. Neu-
RESEARCH-NUSTAR-KR-1 GSI SCIENTIFIC REPORT 2016
208 DOI:10.15120/GR-2017-1
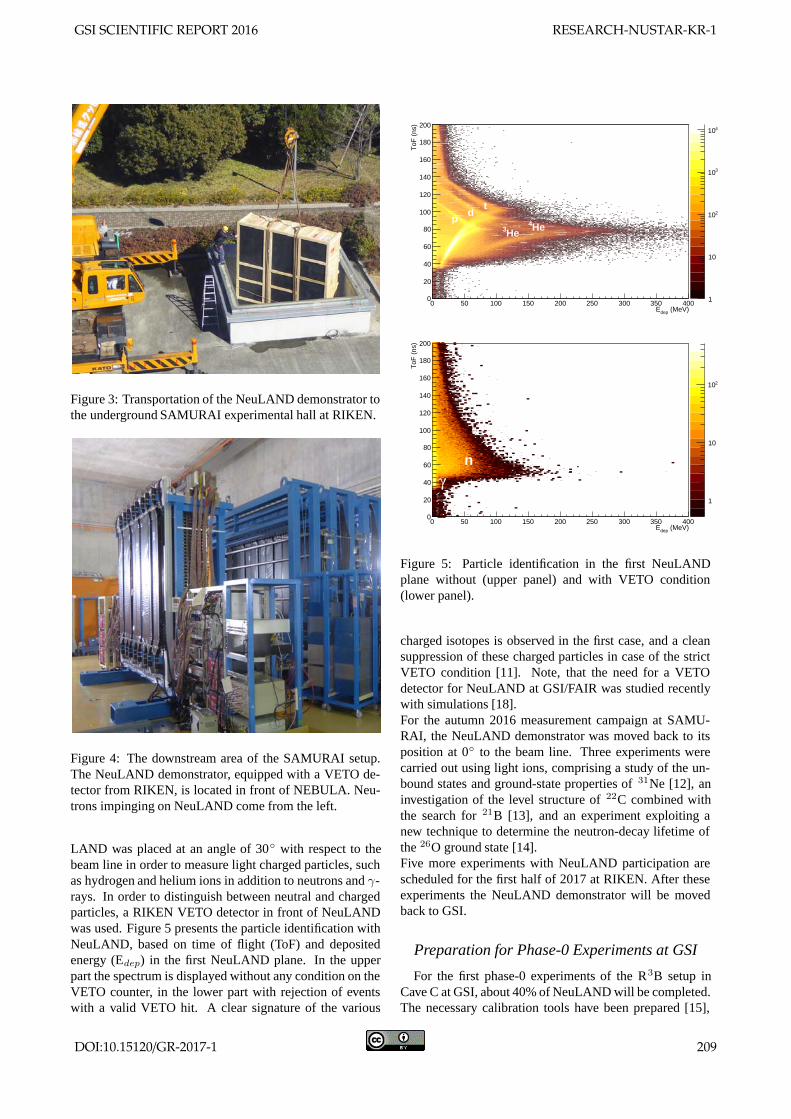
Figure 3: Transportation of the NeuLAND demonstrator tothe underground SAMURAI experimental hall at RIKEN.
Figure 4: The downstream area of the SAMURAI setup.The NeuLAND demonstrator, equipped with a VETO de-tector from RIKEN, is located in front of NEBULA. Neu-trons impinging on NeuLAND come from the left.
LAND was placed at an angle of 30◦ with respect to thebeam line in order to measure light charged particles, suchas hydrogen and helium ions in addition to neutrons and γ-rays. In order to distinguish between neutral and chargedparticles, a RIKEN VETO detector in front of NeuLANDwas used. Figure 5 presents the particle identification withNeuLAND, based on time of flight (ToF) and depositedenergy (Edep) in the first NeuLAND plane. In the upperpart the spectrum is displayed without any condition on theVETO counter, in the lower part with rejection of eventswith a valid VETO hit. A clear signature of the various
(MeV)depE0 50 100 150 200 250 300 350 400
ToF
(ns
)
0
20
40
60
80
100
120
140
160
180
200
1
10
210
310
410
pd
t
He4
He3
(MeV)depE0 50 100 150 200 250 300 350 400
ToF
(ns
)
0
20
40
60
80
100
120
140
160
180
200
1
10
210
n
γ
Figure 5: Particle identification in the first NeuLANDplane without (upper panel) and with VETO condition(lower panel).
charged isotopes is observed in the first case, and a cleansuppression of these charged particles in case of the strictVETO condition [11]. Note, that the need for a VETOdetector for NeuLAND at GSI/FAIR was studied recentlywith simulations [18].For the autumn 2016 measurement campaign at SAMU-RAI, the NeuLAND demonstrator was moved back to itsposition at 0◦ to the beam line. Three experiments werecarried out using light ions, comprising a study of the un-bound states and ground-state properties of 31Ne [12], aninvestigation of the level structure of 22C combined withthe search for 21B [13], and an experiment exploiting anew technique to determine the neutron-decay lifetime ofthe 26O ground state [14].Five more experiments with NeuLAND participation arescheduled for the first half of 2017 at RIKEN. After theseexperiments the NeuLAND demonstrator will be movedback to GSI.
Preparation for Phase-0 Experiments at GSI
For the first phase-0 experiments of the R3B setup inCave C at GSI, about 40% of NeuLAND will be completed.The necessary calibration tools have been prepared [15],
GSI SCIENTIFIC REPORT 2016 RESEARCH-NUSTAR-KR-1
DOI:10.15120/GR-2017-1 209
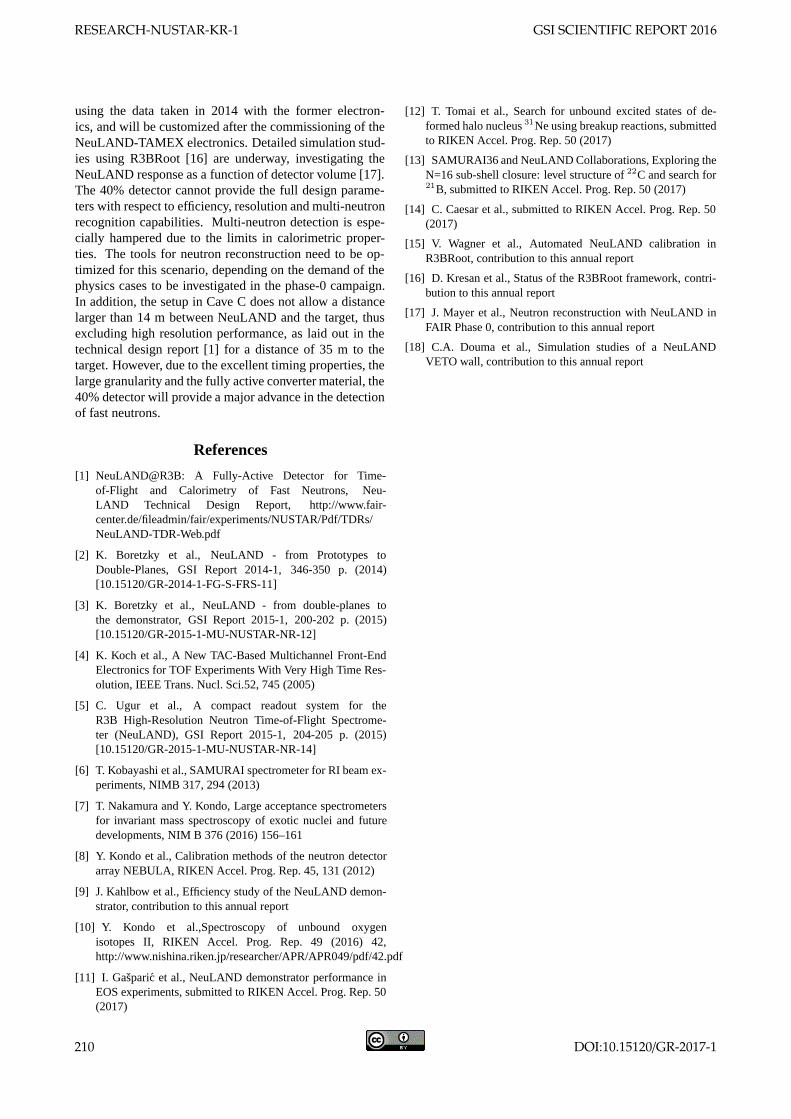
using the data taken in 2014 with the former electron-ics, and will be customized after the commissioning of theNeuLAND-TAMEX electronics. Detailed simulation stud-ies using R3BRoot [16] are underway, investigating theNeuLAND response as a function of detector volume [17].The 40% detector cannot provide the full design parame-ters with respect to efficiency, resolution and multi-neutronrecognition capabilities. Multi-neutron detection is espe-cially hampered due to the limits in calorimetric proper-ties. The tools for neutron reconstruction need to be op-timized for this scenario, depending on the demand of thephysics cases to be investigated in the phase-0 campaign.In addition, the setup in Cave C does not allow a distancelarger than 14 m between NeuLAND and the target, thusexcluding high resolution performance, as laid out in thetechnical design report [1] for a distance of 35 m to thetarget. However, due to the excellent timing properties, thelarge granularity and the fully active converter material, the40% detector will provide a major advance in the detectionof fast neutrons.
References
[1] NeuLAND@R3B: A Fully-Active Detector for Time-of-Flight and Calorimetry of Fast Neutrons, Neu-LAND Technical Design Report, http://www.fair-center.de/fileadmin/fair/experiments/NUSTAR/Pdf/TDRs/NeuLAND-TDR-Web.pdf
[2] K. Boretzky et al., NeuLAND - from Prototypes toDouble-Planes, GSI Report 2014-1, 346-350 p. (2014)[10.15120/GR-2014-1-FG-S-FRS-11]
[3] K. Boretzky et al., NeuLAND - from double-planes tothe demonstrator, GSI Report 2015-1, 200-202 p. (2015)[10.15120/GR-2015-1-MU-NUSTAR-NR-12]
[4] K. Koch et al., A New TAC-Based Multichannel Front-EndElectronics for TOF Experiments With Very High Time Res-olution, IEEE Trans. Nucl. Sci.52, 745 (2005)
[5] C. Ugur et al., A compact readout system for theR3B High-Resolution Neutron Time-of-Flight Spectrome-ter (NeuLAND), GSI Report 2015-1, 204-205 p. (2015)[10.15120/GR-2015-1-MU-NUSTAR-NR-14]
[6] T. Kobayashi et al., SAMURAI spectrometer for RI beam ex-periments, NIMB 317, 294 (2013)
[7] T. Nakamura and Y. Kondo, Large acceptance spectrometersfor invariant mass spectroscopy of exotic nuclei and futuredevelopments, NIM B 376 (2016) 156–161
[8] Y. Kondo et al., Calibration methods of the neutron detectorarray NEBULA, RIKEN Accel. Prog. Rep. 45, 131 (2012)
[9] J. Kahlbow et al., Efficiency study of the NeuLAND demon-strator, contribution to this annual report
[10] Y. Kondo et al.,Spectroscopy of unbound oxygenisotopes II, RIKEN Accel. Prog. Rep. 49 (2016) 42,http://www.nishina.riken.jp/researcher/APR/APR049/pdf/42.pdf
[11] I. Gasparic et al., NeuLAND demonstrator performance inEOS experiments, submitted to RIKEN Accel. Prog. Rep. 50(2017)
[12] T. Tomai et al., Search for unbound excited states of de-formed halo nucleus 31Ne using breakup reactions, submittedto RIKEN Accel. Prog. Rep. 50 (2017)
[13] SAMURAI36 and NeuLAND Collaborations, Exploring theN=16 sub-shell closure: level structure of 22C and search for21B, submitted to RIKEN Accel. Prog. Rep. 50 (2017)
[14] C. Caesar et al., submitted to RIKEN Accel. Prog. Rep. 50(2017)
[15] V. Wagner et al., Automated NeuLAND calibration inR3BRoot, contribution to this annual report
[16] D. Kresan et al., Status of the R3BRoot framework, contri-bution to this annual report
[17] J. Mayer et al., Neutron reconstruction with NeuLAND inFAIR Phase 0, contribution to this annual report
[18] C.A. Douma et al., Simulation studies of a NeuLANDVETO wall, contribution to this annual report
RESEARCH-NUSTAR-KR-1 GSI SCIENTIFIC REPORT 2016
210 DOI:10.15120/GR-2017-1
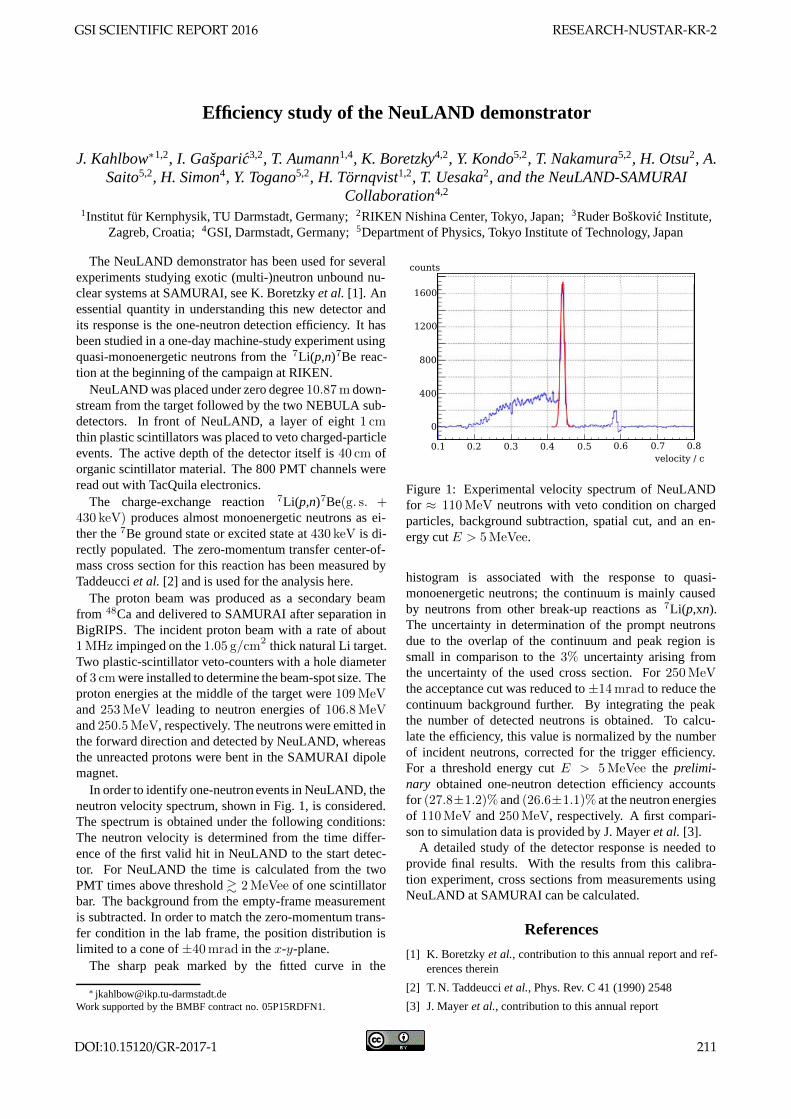
Efficiency study of the NeuLAND demonstrator
J. Kahlbow∗1,2, I. Gasparic3,2, T. Aumann1,4, K. Boretzky4,2, Y. Kondo5,2, T. Nakamura5,2, H. Otsu2, A.Saito5,2, H. Simon4, Y. Togano5,2, H. Tornqvist1,2, T. Uesaka2, and the NeuLAND-SAMURAI
Collaboration4,2
1Institut fur Kernphysik, TU Darmstadt, Germany; 2RIKEN Nishina Center, Tokyo, Japan; 3Ruder Boskovic Institute,Zagreb, Croatia; 4GSI, Darmstadt, Germany; 5Department of Physics, Tokyo Institute of Technology, Japan
The NeuLAND demonstrator has been used for severalexperiments studying exotic (multi-)neutron unbound nu-clear systems at SAMURAI, see K. Boretzky et al. [1]. Anessential quantity in understanding this new detector andits response is the one-neutron detection efficiency. It hasbeen studied in a one-day machine-study experiment usingquasi-monoenergetic neutrons from the 7Li(p,n)7Be reac-tion at the beginning of the campaign at RIKEN.
NeuLAND was placed under zero degree 10.87m down-stream from the target followed by the two NEBULA sub-detectors. In front of NeuLAND, a layer of eight 1 cmthin plastic scintillators was placed to veto charged-particleevents. The active depth of the detector itself is 40 cm oforganic scintillator material. The 800 PMT channels wereread out with TacQuila electronics.
The charge-exchange reaction 7Li(p,n)7Be(g. s. +430 keV) produces almost monoenergetic neutrons as ei-ther the 7Be ground state or excited state at 430 keV is di-rectly populated. The zero-momentum transfer center-of-mass cross section for this reaction has been measured byTaddeucci et al. [2] and is used for the analysis here.
The proton beam was produced as a secondary beamfrom 48Ca and delivered to SAMURAI after separation inBigRIPS. The incident proton beam with a rate of about1MHz impinged on the 1.05 g/cm2 thick natural Li target.Two plastic-scintillator veto-counters with a hole diameterof 3 cmwere installed to determine the beam-spot size. Theproton energies at the middle of the target were 109MeVand 253MeV leading to neutron energies of 106.8MeVand 250.5MeV, respectively. The neutrons were emitted inthe forward direction and detected by NeuLAND, whereasthe unreacted protons were bent in the SAMURAI dipolemagnet.
In order to identify one-neutron events in NeuLAND, theneutron velocity spectrum, shown in Fig. 1, is considered.The spectrum is obtained under the following conditions:The neutron velocity is determined from the time differ-ence of the first valid hit in NeuLAND to the start detec-tor. For NeuLAND the time is calculated from the twoPMT times above threshold � 2MeVee of one scintillatorbar. The background from the empty-frame measurementis subtracted. In order to match the zero-momentum trans-fer condition in the lab frame, the position distribution islimited to a cone of ±40mrad in the x-y-plane.
The sharp peak marked by the fitted curve in the
∗ [email protected] supported by the BMBF contract no. 05P15RDFN1.
0.1 0.2 0.3 0.4 0.5 0.6 0.7 0.8velocity / c
1600
1200
800
400
0
counts
Figure 1: Experimental velocity spectrum of NeuLANDfor ≈ 110MeV neutrons with veto condition on chargedparticles, background subtraction, spatial cut, and an en-ergy cut E > 5MeVee.
histogram is associated with the response to quasi-monoenergetic neutrons; the continuum is mainly causedby neutrons from other break-up reactions as 7Li(p,xn).The uncertainty in determination of the prompt neutronsdue to the overlap of the continuum and peak region issmall in comparison to the 3% uncertainty arising fromthe uncertainty of the used cross section. For 250MeVthe acceptance cut was reduced to ±14mrad to reduce thecontinuum background further. By integrating the peakthe number of detected neutrons is obtained. To calcu-late the efficiency, this value is normalized by the numberof incident neutrons, corrected for the trigger efficiency.For a threshold energy cut E > 5MeVee the prelimi-nary obtained one-neutron detection efficiency accountsfor (27.8±1.2)% and (26.6±1.1)% at the neutron energiesof 110MeV and 250MeV, respectively. A first compari-son to simulation data is provided by J. Mayer et al. [3].
A detailed study of the detector response is needed toprovide final results. With the results from this calibra-tion experiment, cross sections from measurements usingNeuLAND at SAMURAI can be calculated.
References
[1] K. Boretzky et al., contribution to this annual report and ref-erences therein
[2] T. N. Taddeucci et al., Phys. Rev. C 41 (1990) 2548
[3] J. Mayer et al., contribution to this annual report
GSI SCIENTIFIC REPORT 2016 RESEARCH-NUSTAR-KR-2
DOI:10.15120/GR-2017-1 211
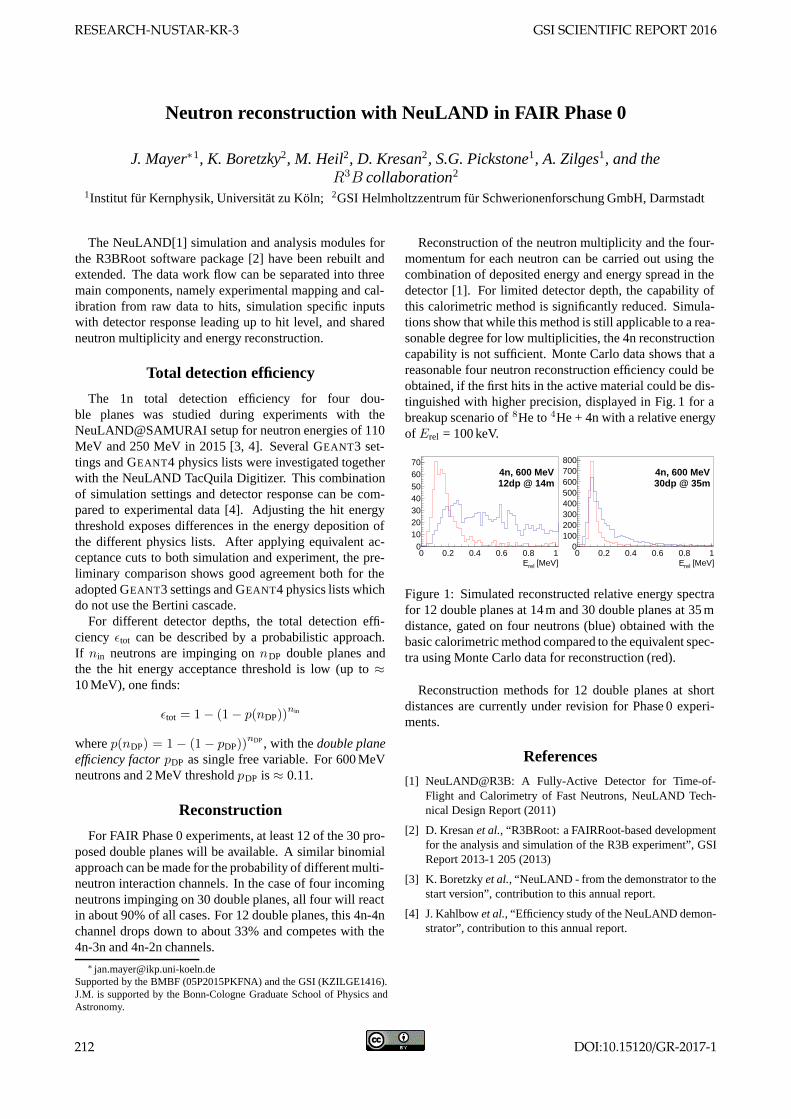
Neutron reconstruction with NeuLAND in FAIR Phase 0
J. Mayer∗1, K. Boretzky2, M. Heil2, D. Kresan2, S.G. Pickstone1, A. Zilges1, and theR3B collaboration2
1Institut fur Kernphysik, Universitat zu Koln; 2GSI Helmholtzzentrum fur Schwerionenforschung GmbH, Darmstadt
The NeuLAND[1] simulation and analysis modules forthe R3BRoot software package [2] have been rebuilt andextended. The data work flow can be separated into threemain components, namely experimental mapping and cal-ibration from raw data to hits, simulation specific inputswith detector response leading up to hit level, and sharedneutron multiplicity and energy reconstruction.
Total detection efficiency
The 1n total detection efficiency for four dou-ble planes was studied during experiments with theNeuLAND@SAMURAI setup for neutron energies of 110MeV and 250 MeV in 2015 [3, 4]. Several GEANT3 set-tings and GEANT4 physics lists were investigated togetherwith the NeuLAND TacQuila Digitizer. This combinationof simulation settings and detector response can be com-pared to experimental data [4]. Adjusting the hit energythreshold exposes differences in the energy deposition ofthe different physics lists. After applying equivalent ac-ceptance cuts to both simulation and experiment, the pre-liminary comparison shows good agreement both for theadopted GEANT3 settings and GEANT4 physics lists whichdo not use the Bertini cascade.
For different detector depths, the total detection effi-ciency εtot can be described by a probabilistic approach.If nin neutrons are impinging on nDP double planes andthe the hit energy acceptance threshold is low (up to ≈10 MeV), one finds:
εtot = 1− (1− p(nDP))nin
where p(nDP) = 1 − (1− pDP))nDP , with the double plane
efficiency factor pDP as single free variable. For 600 MeVneutrons and 2 MeV threshold pDP is ≈ 0.11.
Reconstruction
For FAIR Phase 0 experiments, at least 12 of the 30 pro-posed double planes will be available. A similar binomialapproach can be made for the probability of different multi-neutron interaction channels. In the case of four incomingneutrons impinging on 30 double planes, all four will reactin about 90% of all cases. For 12 double planes, this 4n-4nchannel drops down to about 33% and competes with the4n-3n and 4n-2n channels.
∗ [email protected] by the BMBF (05P2015PKFNA) and the GSI (KZILGE1416).J.M. is supported by the Bonn-Cologne Graduate School of Physics andAstronomy.
Reconstruction of the neutron multiplicity and the four-momentum for each neutron can be carried out using thecombination of deposited energy and energy spread in thedetector [1]. For limited detector depth, the capability ofthis calorimetric method is significantly reduced. Simula-tions show that while this method is still applicable to a rea-sonable degree for low multiplicities, the 4n reconstructioncapability is not sufficient. Monte Carlo data shows that areasonable four neutron reconstruction efficiency could beobtained, if the first hits in the active material could be dis-tinguished with higher precision, displayed in Fig. 1 for abreakup scenario of 8He to 4He + 4n with a relative energyof Erel = 100 keV.
[MeV]relE0 0.2 0.4 0.6 0.8 1
0
1020304050
6070
4n, 600 MeV12dp @ 14m
[MeV]relE0 0.2 0.4 0.6 0.8 1
0100200300400500600700800
4n, 600 MeV30dp @ 35m
Figure 1: Simulated reconstructed relative energy spectrafor 12 double planes at 14 m and 30 double planes at 35 mdistance, gated on four neutrons (blue) obtained with thebasic calorimetric method compared to the equivalent spec-tra using Monte Carlo data for reconstruction (red).
Reconstruction methods for 12 double planes at shortdistances are currently under revision for Phase 0 experi-ments.
References
[1] NeuLAND@R3B: A Fully-Active Detector for Time-of-Flight and Calorimetry of Fast Neutrons, NeuLAND Tech-nical Design Report (2011)
[2] D. Kresan et al., “R3BRoot: a FAIRRoot-based developmentfor the analysis and simulation of the R3B experiment”, GSIReport 2013-1 205 (2013)
[3] K. Boretzky et al., “NeuLAND - from the demonstrator to thestart version”, contribution to this annual report.
[4] J. Kahlbow et al., “Efficiency study of the NeuLAND demon-strator”, contribution to this annual report.
RESEARCH-NUSTAR-KR-3 GSI SCIENTIFIC REPORT 2016
212 DOI:10.15120/GR-2017-1
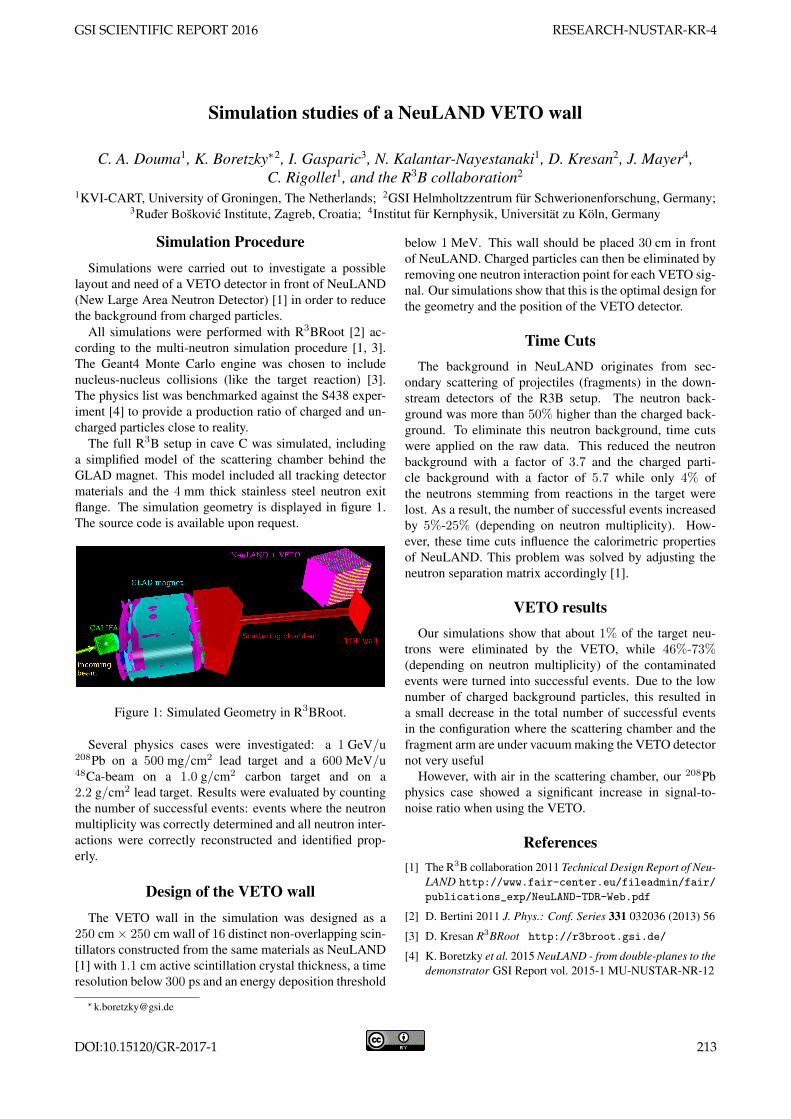
Simulation studies of a NeuLAND VETO wall
C. A. Douma1, K. Boretzky∗2, I. Gasparic3, N. Kalantar-Nayestanaki1, D. Kresan2, J. Mayer4,C. Rigollet1, and the R3B collaboration2
1KVI-CART, University of Groningen, The Netherlands; 2GSI Helmholtzzentrum fur Schwerionenforschung, Germany;3Ruder Boskovic Institute, Zagreb, Croatia; 4Institut fur Kernphysik, Universitat zu Koln, Germany
Simulation ProcedureSimulations were carried out to investigate a possible
layout and need of a VETO detector in front of NeuLAND(New Large Area Neutron Detector) [1] in order to reducethe background from charged particles.
All simulations were performed with R3BRoot [2] ac-cording to the multi-neutron simulation procedure [1, 3].The Geant4 Monte Carlo engine was chosen to includenucleus-nucleus collisions (like the target reaction) [3].The physics list was benchmarked against the S438 exper-iment [4] to provide a production ratio of charged and un-charged particles close to reality.
The full R3B setup in cave C was simulated, includinga simplified model of the scattering chamber behind theGLAD magnet. This model included all tracking detectormaterials and the 4 mm thick stainless steel neutron exitflange. The simulation geometry is displayed in figure 1.The source code is available upon request.
Figure 1: Simulated Geometry in R3BRoot.
Several physics cases were investigated: a 1 GeV/u208Pb on a 500 mg/cm2 lead target and a 600 MeV/u48Ca-beam on a 1.0 g/cm2 carbon target and on a2.2 g/cm2 lead target. Results were evaluated by countingthe number of successful events: events where the neutronmultiplicity was correctly determined and all neutron inter-actions were correctly reconstructed and identified prop-erly.
Design of the VETO wallThe VETO wall in the simulation was designed as a
250 cm × 250 cm wall of 16 distinct non-overlapping scin-tillators constructed from the same materials as NeuLAND[1] with 1.1 cm active scintillation crystal thickness, a timeresolution below 300 ps and an energy deposition threshold
below 1 MeV. This wall should be placed 30 cm in frontof NeuLAND. Charged particles can then be eliminated byremoving one neutron interaction point for each VETO sig-nal. Our simulations show that this is the optimal design forthe geometry and the position of the VETO detector.
Time CutsThe background in NeuLAND originates from sec-
ondary scattering of projectiles (fragments) in the down-stream detectors of the R3B setup. The neutron back-ground was more than 50% higher than the charged back-ground. To eliminate this neutron background, time cutswere applied on the raw data. This reduced the neutronbackground with a factor of 3.7 and the charged parti-cle background with a factor of 5.7 while only 4% ofthe neutrons stemming from reactions in the target werelost. As a result, the number of successful events increasedby 5%-25% (depending on neutron multiplicity). How-ever, these time cuts influence the calorimetric propertiesof NeuLAND. This problem was solved by adjusting theneutron separation matrix accordingly [1].
VETO resultsOur simulations show that about 1% of the target neu-
trons were eliminated by the VETO, while 46%-73%(depending on neutron multiplicity) of the contaminatedevents were turned into successful events. Due to the lownumber of charged background particles, this resulted ina small decrease in the total number of successful eventsin the configuration where the scattering chamber and thefragment arm are under vacuum making the VETO detectornot very useful
However, with air in the scattering chamber, our 208Pbphysics case showed a significant increase in signal-to-noise ratio when using the VETO.
References[1] The R3B collaboration 2011 Technical Design Report of Neu-
LAND http://www.fair-center.eu/fileadmin/fair/
publications_exp/NeuLAND-TDR-Web.pdf
[2] D. Bertini 2011 J. Phys.: Conf. Series 331 032036 (2013) 56
[3] D. Kresan R3BRoot http://r3broot.gsi.de/
[4] K. Boretzky et al. 2015 NeuLAND - from double-planes to thedemonstrator GSI Report vol. 2015-1 MU-NUSTAR-NR-12
GSI SCIENTIFIC REPORT 2016 RESEARCH-NUSTAR-KR-4
DOI:10.15120/GR-2017-1 213
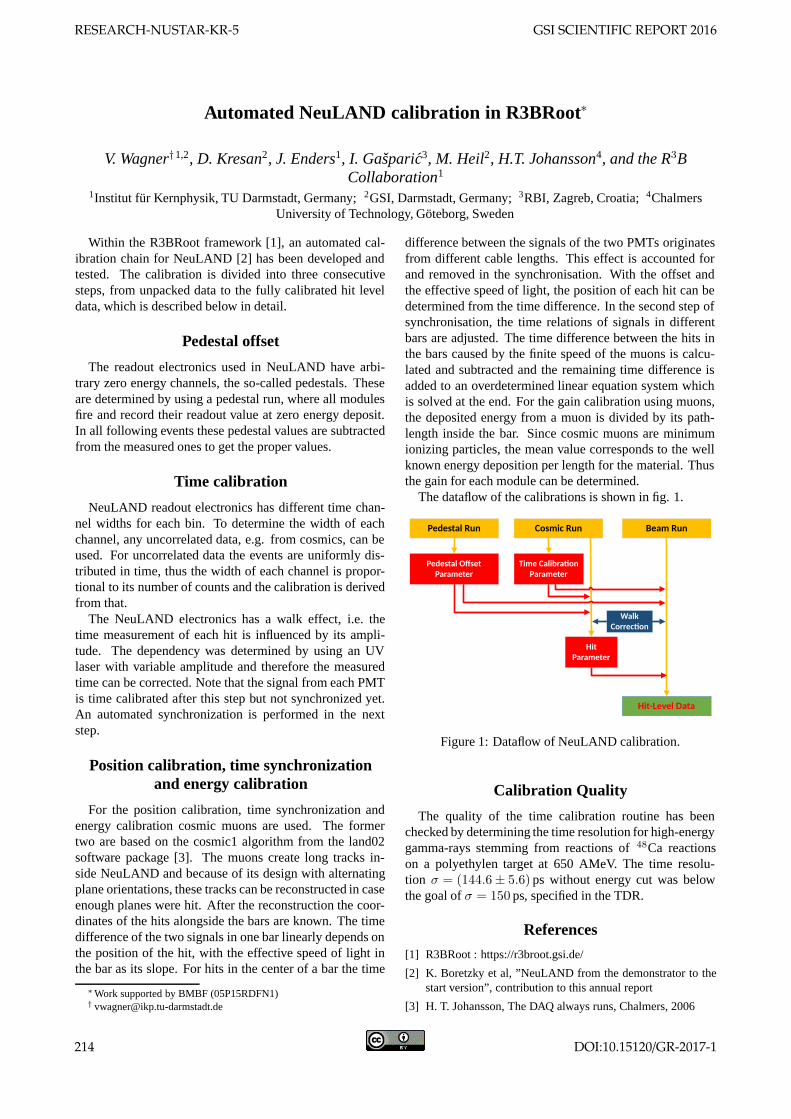
Automated NeuLAND calibration in R3BRoot∗
V. Wagner†1,2, D. Kresan2, J. Enders1, I. Gasparic3, M. Heil2, H.T. Johansson4, and the R3BCollaboration1
1Institut fur Kernphysik, TU Darmstadt, Germany; 2GSI, Darmstadt, Germany; 3RBI, Zagreb, Croatia; 4ChalmersUniversity of Technology, Goteborg, Sweden
Within the R3BRoot framework [1], an automated cal-ibration chain for NeuLAND [2] has been developed andtested. The calibration is divided into three consecutivesteps, from unpacked data to the fully calibrated hit leveldata, which is described below in detail.
Pedestal offset
The readout electronics used in NeuLAND have arbi-trary zero energy channels, the so-called pedestals. Theseare determined by using a pedestal run, where all modulesfire and record their readout value at zero energy deposit.In all following events these pedestal values are subtractedfrom the measured ones to get the proper values.
Time calibration
NeuLAND readout electronics has different time chan-nel widths for each bin. To determine the width of eachchannel, any uncorrelated data, e.g. from cosmics, can beused. For uncorrelated data the events are uniformly dis-tributed in time, thus the width of each channel is propor-tional to its number of counts and the calibration is derivedfrom that.
The NeuLAND electronics has a walk effect, i.e. thetime measurement of each hit is influenced by its ampli-tude. The dependency was determined by using an UVlaser with variable amplitude and therefore the measuredtime can be corrected. Note that the signal from each PMTis time calibrated after this step but not synchronized yet.An automated synchronization is performed in the nextstep.
Position calibration, time synchronizationand energy calibration
For the position calibration, time synchronization andenergy calibration cosmic muons are used. The formertwo are based on the cosmic1 algorithm from the land02software package [3]. The muons create long tracks in-side NeuLAND and because of its design with alternatingplane orientations, these tracks can be reconstructed in caseenough planes were hit. After the reconstruction the coor-dinates of the hits alongside the bars are known. The timedifference of the two signals in one bar linearly depends onthe position of the hit, with the effective speed of light inthe bar as its slope. For hits in the center of a bar the time
∗Work supported by BMBF (05P15RDFN1)† [email protected]
difference between the signals of the two PMTs originatesfrom different cable lengths. This effect is accounted forand removed in the synchronisation. With the offset andthe effective speed of light, the position of each hit can bedetermined from the time difference. In the second step ofsynchronisation, the time relations of signals in differentbars are adjusted. The time difference between the hits inthe bars caused by the finite speed of the muons is calcu-lated and subtracted and the remaining time difference isadded to an overdetermined linear equation system whichis solved at the end. For the gain calibration using muons,the deposited energy from a muon is divided by its path-length inside the bar. Since cosmic muons are minimumionizing particles, the mean value corresponds to the wellknown energy deposition per length for the material. Thusthe gain for each module can be determined.
The dataflow of the calibrations is shown in fig. 1.
Pedestal Run Cosmic Run Beam Run
Pedestal OffsetParameter
HitParameter
Hit-Level Data
Time Calibra onParameter
WalkCorrec on
Figure 1: Dataflow of NeuLAND calibration.
Calibration Quality
The quality of the time calibration routine has beenchecked by determining the time resolution for high-energygamma-rays stemming from reactions of 48Ca reactionson a polyethylen target at 650 AMeV. The time resolu-tion σ = (144.6± 5.6) ps without energy cut was belowthe goal of σ = 150 ps, specified in the TDR.
References
[1] R3BRoot : https://r3broot.gsi.de/
[2] K. Boretzky et al, ”NeuLAND from the demonstrator to thestart version”, contribution to this annual report
[3] H. T. Johansson, The DAQ always runs, Chalmers, 2006
RESEARCH-NUSTAR-KR-5 GSI SCIENTIFIC REPORT 2016
214 DOI:10.15120/GR-2017-1
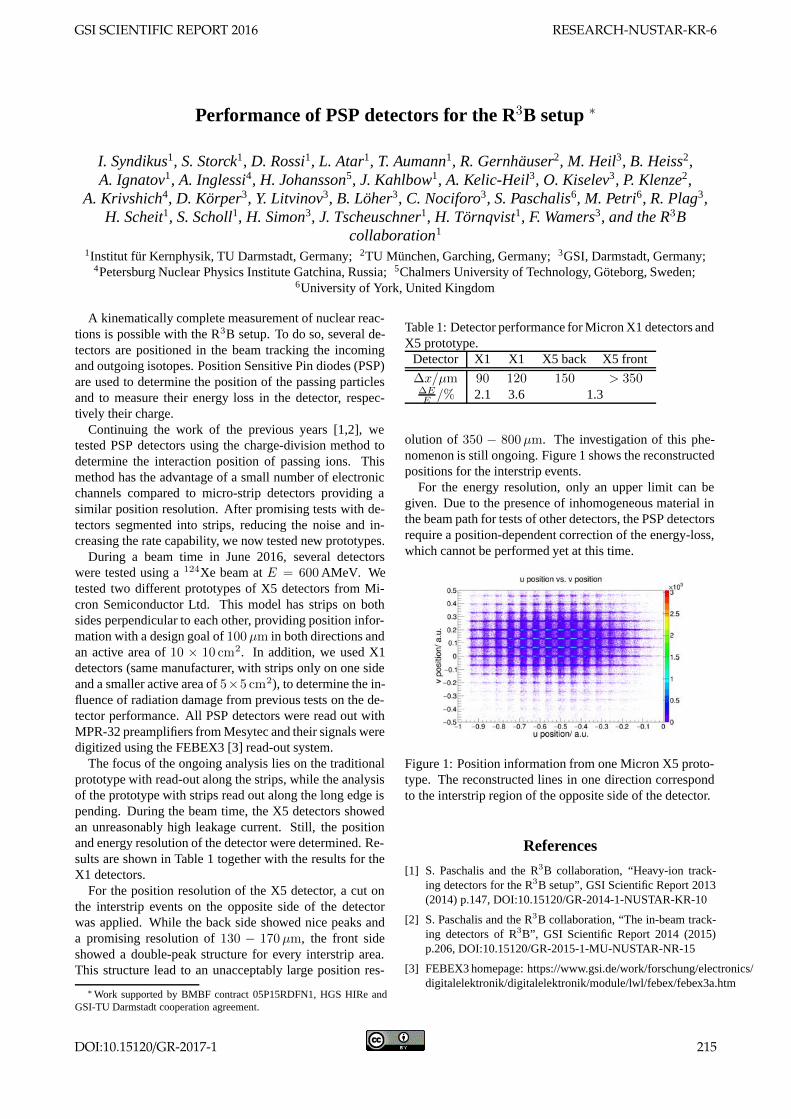
Performance of PSP detectors for the R3B setup ∗
I. Syndikus1, S. Storck1, D. Rossi1, L. Atar1, T. Aumann1, R. Gernhauser2, M. Heil3, B. Heiss2,A. Ignatov1, A. Inglessi4, H. Johansson5, J. Kahlbow1, A. Kelic-Heil3, O. Kiselev3, P. Klenze2,
A. Krivshich4, D. Korper3, Y. Litvinov3, B. Loher3, C. Nociforo3, S. Paschalis6, M. Petri6, R. Plag3,H. Scheit1, S. Scholl1, H. Simon3, J. Tscheuschner1, H. Tornqvist1, F. Wamers3, and the R3B
collaboration1
1Institut fur Kernphysik, TU Darmstadt, Germany; 2TU Munchen, Garching, Germany; 3GSI, Darmstadt, Germany;4Petersburg Nuclear Physics Institute Gatchina, Russia; 5Chalmers University of Technology, Goteborg, Sweden;
6University of York, United Kingdom
A kinematically complete measurement of nuclear reac-tions is possible with the R3B setup. To do so, several de-tectors are positioned in the beam tracking the incomingand outgoing isotopes. Position Sensitive Pin diodes (PSP)are used to determine the position of the passing particlesand to measure their energy loss in the detector, respec-tively their charge.
Continuing the work of the previous years [1,2], wetested PSP detectors using the charge-division method todetermine the interaction position of passing ions. Thismethod has the advantage of a small number of electronicchannels compared to micro-strip detectors providing asimilar position resolution. After promising tests with de-tectors segmented into strips, reducing the noise and in-creasing the rate capability, we now tested new prototypes.
During a beam time in June 2016, several detectorswere tested using a 124Xe beam at E = 600AMeV. Wetested two different prototypes of X5 detectors from Mi-cron Semiconductor Ltd. This model has strips on bothsides perpendicular to each other, providing position infor-mation with a design goal of 100µm in both directions andan active area of 10 × 10 cm2. In addition, we used X1detectors (same manufacturer, with strips only on one sideand a smaller active area of 5×5 cm2), to determine the in-fluence of radiation damage from previous tests on the de-tector performance. All PSP detectors were read out withMPR-32 preamplifiers from Mesytec and their signals weredigitized using the FEBEX3 [3] read-out system.
The focus of the ongoing analysis lies on the traditionalprototype with read-out along the strips, while the analysisof the prototype with strips read out along the long edge ispending. During the beam time, the X5 detectors showedan unreasonably high leakage current. Still, the positionand energy resolution of the detector were determined. Re-sults are shown in Table 1 together with the results for theX1 detectors.
For the position resolution of the X5 detector, a cut onthe interstrip events on the opposite side of the detectorwas applied. While the back side showed nice peaks anda promising resolution of 130 − 170µm, the front sideshowed a double-peak structure for every interstrip area.This structure lead to an unacceptably large position res-
∗Work supported by BMBF contract 05P15RDFN1, HGS HIRe andGSI-TU Darmstadt cooperation agreement.
Table 1: Detector performance for Micron X1 detectors andX5 prototype.
Detector X1 X1 X5 back X5 front
Δx/µm 90 120 150 > 350ΔEE /% 2.1 3.6 1.3
olution of 350 − 800µm. The investigation of this phe-nomenon is still ongoing. Figure 1 shows the reconstructedpositions for the interstrip events.
For the energy resolution, only an upper limit can begiven. Due to the presence of inhomogeneous material inthe beam path for tests of other detectors, the PSP detectorsrequire a position-dependent correction of the energy-loss,which cannot be performed yet at this time.
Figure 1: Position information from one Micron X5 proto-type. The reconstructed lines in one direction correspondto the interstrip region of the opposite side of the detector.
References
[1] S. Paschalis and the R3B collaboration, “Heavy-ion track-ing detectors for the R3B setup”, GSI Scientific Report 2013(2014) p.147, DOI:10.15120/GR-2014-1-NUSTAR-KR-10
[2] S. Paschalis and the R3B collaboration, “The in-beam track-ing detectors of R3B”, GSI Scientific Report 2014 (2015)p.206, DOI:10.15120/GR-2015-1-MU-NUSTAR-NR-15
[3] FEBEX3 homepage: https://www.gsi.de/work/forschung/electronics/digitalelektronik/digitalelektronik/module/lwl/febex/febex3a.htm
GSI SCIENTIFIC REPORT 2016 RESEARCH-NUSTAR-KR-6
DOI:10.15120/GR-2017-1 215
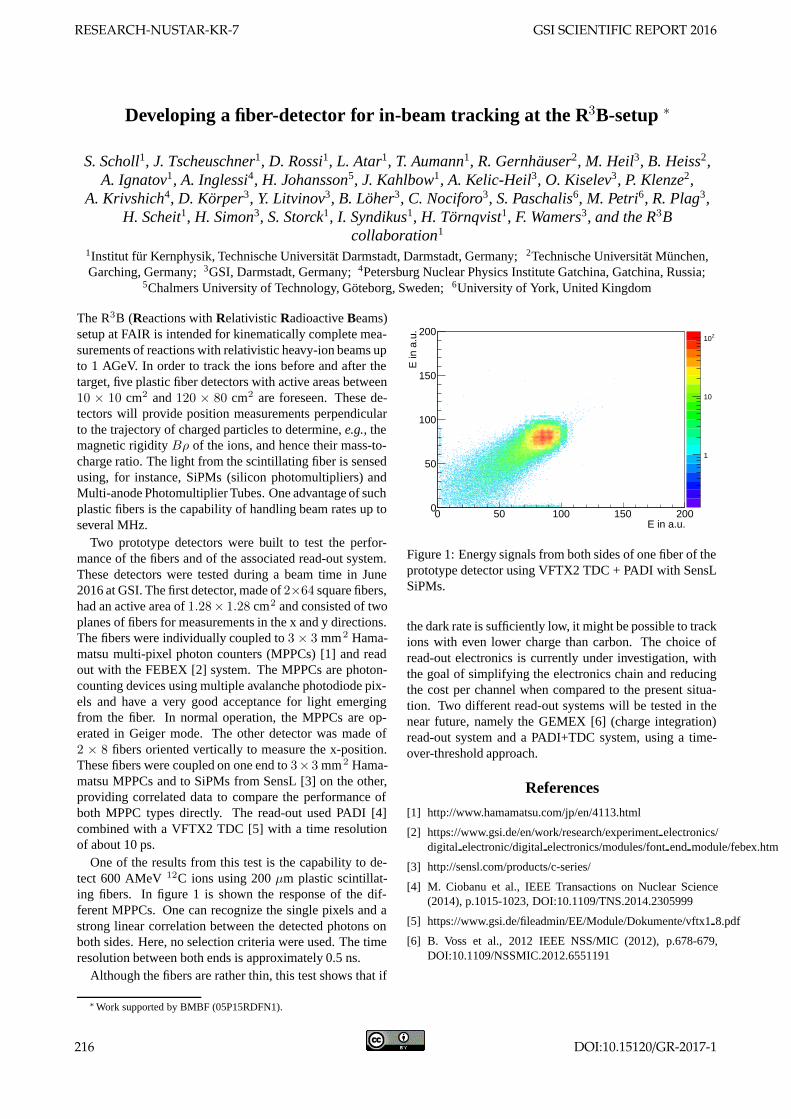
Developing a fiber-detector for in-beam tracking at the R3B-setup ∗
S. Scholl1, J. Tscheuschner1, D. Rossi1, L. Atar1, T. Aumann1, R. Gernhauser2, M. Heil3, B. Heiss2,A. Ignatov1, A. Inglessi4, H. Johansson5, J. Kahlbow1, A. Kelic-Heil3, O. Kiselev3, P. Klenze2,
A. Krivshich4, D. Korper3, Y. Litvinov3, B. Loher3, C. Nociforo3, S. Paschalis6, M. Petri6, R. Plag3,H. Scheit1, H. Simon3, S. Storck1, I. Syndikus1, H. Tornqvist1, F. Wamers3, and the R3B
collaboration1
1Institut fur Kernphysik, Technische Universitat Darmstadt, Darmstadt, Germany; 2Technische Universitat Munchen,Garching, Germany; 3GSI, Darmstadt, Germany; 4Petersburg Nuclear Physics Institute Gatchina, Gatchina, Russia;
5Chalmers University of Technology, Goteborg, Sweden; 6University of York, United Kingdom
The R3B (Reactions with Relativistic Radioactive Beams)setup at FAIR is intended for kinematically complete mea-surements of reactions with relativistic heavy-ion beams upto 1 AGeV. In order to track the ions before and after thetarget, five plastic fiber detectors with active areas between10 × 10 cm2 and 120 × 80 cm2 are foreseen. These de-tectors will provide position measurements perpendicularto the trajectory of charged particles to determine, e.g., themagnetic rigidity Bρ of the ions, and hence their mass-to-charge ratio. The light from the scintillating fiber is sensedusing, for instance, SiPMs (silicon photomultipliers) andMulti-anode Photomultiplier Tubes. One advantage of suchplastic fibers is the capability of handling beam rates up toseveral MHz.
Two prototype detectors were built to test the perfor-mance of the fibers and of the associated read-out system.These detectors were tested during a beam time in June2016 at GSI. The first detector, made of 2×64 square fibers,had an active area of 1.28× 1.28 cm2 and consisted of twoplanes of fibers for measurements in the x and y directions.The fibers were individually coupled to 3 × 3 mm2 Hama-matsu multi-pixel photon counters (MPPCs) [1] and readout with the FEBEX [2] system. The MPPCs are photon-counting devices using multiple avalanche photodiode pix-els and have a very good acceptance for light emergingfrom the fiber. In normal operation, the MPPCs are op-erated in Geiger mode. The other detector was made of2 × 8 fibers oriented vertically to measure the x-position.These fibers were coupled on one end to 3× 3 mm2 Hama-matsu MPPCs and to SiPMs from SensL [3] on the other,providing correlated data to compare the performance ofboth MPPC types directly. The read-out used PADI [4]combined with a VFTX2 TDC [5] with a time resolutionof about 10 ps.
One of the results from this test is the capability to de-tect 600 AMeV 12C ions using 200 μm plastic scintillat-ing fibers. In figure 1 is shown the response of the dif-ferent MPPCs. One can recognize the single pixels and astrong linear correlation between the detected photons onboth sides. Here, no selection criteria were used. The timeresolution between both ends is approximately 0.5 ns.
Although the fibers are rather thin, this test shows that if
∗Work supported by BMBF (05P15RDFN1).
E in a.u.0 50 100 150 200
E in
a.u
.
0
50
100
150
200h2_e_e_0_0Entries 141603Mean x 77.68Mean y 72.74RMS x 17.31RMS y 17.09
1
10
210h2_e_e_0_0Entries 141603Mean x 77.68Mean y 72.74RMS x 17.31RMS y 17.09
Figure 1: Energy signals from both sides of one fiber of theprototype detector using VFTX2 TDC + PADI with SensLSiPMs.
the dark rate is sufficiently low, it might be possible to trackions with even lower charge than carbon. The choice ofread-out electronics is currently under investigation, withthe goal of simplifying the electronics chain and reducingthe cost per channel when compared to the present situa-tion. Two different read-out systems will be tested in thenear future, namely the GEMEX [6] (charge integration)read-out system and a PADI+TDC system, using a time-over-threshold approach.
References
[1] http://www.hamamatsu.com/jp/en/4113.html
[2] https://www.gsi.de/en/work/research/experiment electronics/digital electronic/digital electronics/modules/font end module/febex.htm
[3] http://sensl.com/products/c-series/
[4] M. Ciobanu et al., IEEE Transactions on Nuclear Science(2014), p.1015-1023, DOI:10.1109/TNS.2014.2305999
[5] https://www.gsi.de/fileadmin/EE/Module/Dokumente/vftx1 8.pdf
[6] B. Voss et al., 2012 IEEE NSS/MIC (2012), p.678-679,DOI:10.1109/NSSMIC.2012.6551191
RESEARCH-NUSTAR-KR-7 GSI SCIENTIFIC REPORT 2016
216 DOI:10.15120/GR-2017-1
Preliminary results of the PAS prototype test with a 12C beam* A. Krivshich1, G. Alkhazov1, V. Andreev1, L. Atar2, T. Aumann2, R. Gernhäuser3, M. Heil4, B. Heiss3, A. Ignatov2, D. Ilin1, A. Inglessi1, H. T. Johansson5, J. Kahlbow2, A. Kelic-Heil4,
O. A. Kiselev4, P. Klenze3, D. Körper4, Y. Litvinov4, B. Löher2, D. Maisuzenko1, A. Nadtochiy1, C. Nociforo4, S. Paschalis6, M. Petri6,R. Plag4, D. M. Rossi2, H. Scheit2, S. Scholl2, N. Shvetsova1,
H. Simon4, S. Storck2, I. J. Syndikus2, J. M. Tscheuschner2, H. T. Törnqvist2, F. Wamers4, V. Yatsyura1, and the R3B collaboration
1Petersburg Nuclear Physics Institute Gatchina, Orlova Roscha, Leningrad district 188300, Gatchina, Russia; 2Institut für Kernphysik, Technische Universität Darmstadt, 64289 Darmstadt, Germany; 3Technische Universität München,
James-Franck-Str 1, 85748, Garching, Germany; 4GSI Helmholtzzentrum für Schwerionenforschung, Planckstraße 1, 64291, Darmstadt, Germany; 5Chalmers University of Technology, Kemivagen 9, 412 96, Göteborg, Sweden;
6University of York, United Kingdom
To test the operability of the PAS detector [1], we have fabricated a prototype of the detector module, struc-turally corresponding to the STW-X2 station. The per-formance of this prototype was studied at PNPI (using β-sources 90Sr and photon source 55Fe) and at a high-energy (600 MeV/u) beam of carbon ions at GSI. PAS is de-signed to measure precisely trajectory coordinates of pro-tons emitted in nuclear reactions. The coordinate resolu-tion of PAS is expected to be about 200 μm. The final version of PAS will be located in the vacuum chamber of the dipole magnet GLAD.
The PAS prototype consists of 96 thin-wall aluminum drift tubes (straws), which are arranged in three layers. Each layer is shifted by one tube radius with respect to the previous layer. All the tubes are of 110 cm length, diame-ter 10 mm and the wall thickness being 0.2 mm. The straw anode is a gold-plated tungsten wire with the di-ameter of 35 µm. The gas mixture is Ar+30%C2H6. The scheme of the experimental setup is presented in Fig. 1a. The general view of the detector and its location on a car-bon beam at GSI is shown in Fig. 1b.
Figure 1: Scheme of the experimental setup (a); general view of the detector on a carbon beam (b).
During the beam test, data sampling and readout was performed using the VFTX-2 VME TDC module with the 10 ps time resolution. All events included a timestamp code which was distributed throughout all active detectors (LOS, TOF, PSP) providing synchronization of the time with other systems of the setup. A preliminary analysis was performed via standalone ROOT scripts, while an activity to integrate the Prototype in the R3BRoot frame-work is on the way.
The observed structure of the beam profile (Fig. 2a) and the dependence of the counting rate (Fig. 2b) on the high voltage do not match the same characteristics which are generated by monoenergetic particles (emitted pro-tons). The map of the straw arrangement and the beam position are presented in Fig. 2c.
Figure 2: Counting rates of different straws for different high voltages (a); the counting rates via high voltage for different straws (b); straw map in the STW-X2 prototype and the beam position (c).
These results indicate that the carbon beam had a pro-nounced halo which contained a lot of accompanying particles (including delta-electrons) with different ioniz- ___________________________________________
* Work supported in part by BMBF contracts 05P15RDFN1 and 05P15WOFNA, HGS HIRe and GSI-TU Darmstadt cooperation agreement.
GSI SCIENTIFIC REPORT 2016 RESEARCH-NUSTAR-KR-8
DOI:10.15120/GR-2017-1 217
ing power, which resulted in different counting rates from different straws. Such groups of particles are highlighted by dotted circles in Fig. 2b. This halo distorted the ob-tained time spectra due to a significant time dispersion of the detected signals with respect to the LOS trigger sig-nal. It was shown that for correct selection of particle tracks, special algorithms are required. Two of them were ap-plied for the off-line data analysis (Fig.3), which allowed us to select events using information from either two or three layers of the detector straws.
Figure 3: Time spectra and special algorithms for particle selection. Straw map and drift time information (c).
Both algorithms are based on the fact that the sum of the drift times of electrons from the single particle track to the anodes of two adjacent straws which are placed in two neighboring layers is a constant equal to the maxi-mum electron drift time from the cathode to the anode (about 100 ns). The first algorithm (t23+t24=constant), which was initially used, was not sufficient to perform effective selection of events (Fig. 3a). To improve the particle selection, the third straw layer should be involved in the analysis. As one can see, the second algorithm ((t23 + t24) – (t24 + t25) = 0) makes it possible to detect most of particles within the time jitter of about ±8 ns, which corresponds to fluctuations in the measurement of the absolute coordinate of the particle track in the ±400 μm range (Fig. 3b). This data analysis has shown that the three layer design of each STWs was a proper choice.
A further development of the algorithms should in-clude two following stages: (a) selection of useful events from PAS by using the scintillator wall TOFD; (b) syn-chronization of our data with the data from position-sensitive Si detector PSP. This will allow us to select the required events and to carry out measurements of the spa-tial resolution and the X-T relation of the PAS detector.
References [1] Technical Report for the Design, Construction and
Commissioning of the Tracking Detectors for R3B, pages 101-117, November 20.
RESEARCH-NUSTAR-KR-8 GSI SCIENTIFIC REPORT 2016
218 DOI:10.15120/GR-2017-1
In-beam test of a CALIFA Demonstrator segment of R3B ∗
P. Cabanelas†1,2, P. Teubig3, P. Remmels4, P. Klenze4, E. Galiana1,2, H. Alvarez-Pol1,2, E. Alves5,J. M. Boillos1,2, R. C. da Silva5, D. Cortina-Gil1,2, J. Cruz7, D. Ferreira3, M. Fonseca7, D. Galaviz3,6,R. Gernhauser4, D. Gonzalez1,2, A. Henriques3, A.P. Jesus7, H. Luıs5, J. Machado7, L. Peralta3,6, J.
Rocha5, A. M. Sanchez-Benıtez8, H. Silva7, P. Velho3, and the R3B Collaboration1Dpt. de Fısica de Partıculas, Universidade de Santiago deCompostela, E-15782 Santiago de Compostela, Spain;2Instituto Galego de Fısica de Altas Enerxıas (IGFAE), E-15782 Universidade de Santiago de Compostela, Spain;
3Laboratorio de Instrumentacao e Fısica Experimental de Partıculas (Lip), Av. Prof. Gama Pinto 2, 1640-003 Lisbon,Portugal; 4Technische Universitat Munchen, 80333 Garching , Germany; 5Campus Tecnologico e Nuclear, Instituto
Superior Tecnico, Universidade de Lisboa, 2695-066 Bobadela LRS, Portugal;6Departamento de Fısica, Faculdade deCiencias da Universidade de Lisboa, Campo Grande, P-1749-016 Lisbon, Portugal;7Laboratorio de Instrumentacao,
Engenharia Biomedica e Fısica da Radiacao (LIBPhys-UNL), Departamento de Fısica, Faculdade de Ciencias eTecnologia, Universidade Nova de Lisboa, P-2829-516 Caparica, Portugal;8Departamento de Ciencias Integradas,
Facultad de Ciencias Experimentales, Campus de El Carmen, Universidad de Huelva, 21071 Huelva, Spain
Introduction
A devoted experiment to test the CALIFA [1] BarrelDemonstrator together with its Data Acquisition Chain wascarried out in November of 2016. Two modules of theCALIFA Demonstrator, also known as petals, were ex-posed to gamma-rays up to 15 MeV coming from reactionsof a proton beam with Al and LiF thin targets. A High Pu-rity Germanium detector was included in the setup. Theperformances of the full detection system are being ana-lyzed, and the physics of the produced nuclear reactions isbeing studied as well.
In this report, a complete description of the experimentis provided, together with a short summary on the status ofthe data analysis and the simulations of the experimentalsetup.
Experimental setup
Each of the two CALIFA modules consist of a petalbox made of high resistance 5083 Aluminium with a 3µmthick mylar window in the interaction point direction. In-side, a total of 64 CsI(Tl) scintillator crystals, with differ-ent shapes in groups of four, are located. The light collec-tion and signal creation is made with Large Area AvalanchePhoto Diodes (LAAPDs) directly coupled to the crystals,so that one read-out channel per crystal is available. Thecrystal + APD system used has an average energy resolu-tion of∆E/E < 6% for 1 MeV gamma rays and very goodlight output uniformity. In this experiment, each petal hadan approximate coverage of 30◦ in polar angle and 20◦ inazimuthal angle.
After a first pre-amplification stage, the signals were sentto a FEBEX-based Data Acquisition and trigger system [2],with 9 FEBEX boards available with 16 channels each (144
∗Work supported by project No. POS-B/2016/015 of Xunta de Gali-cia, Grant 654002, ENSAR2, H2020-INFRAIA-2014-2015 of EuropeanCommission and Grant POCI-01-0145-FEDER-007334
channels in total). The signal from the HPGe detector wasread out with the FEBEX boards as well. The online dataunpacking was done using a stand-alone program based ona MBS event structure [3]. The online monitoring was per-formed with Go4 [4]. A preliminary calibration was doneand applied to the data on flight. In total, about 2 TB ofdata were recorded.
The experiment was performed at the 3 MV Cockcroft-Walton Tandem accelerator of the LATR (Laboratorio deAceleradores e Tecnologıas de Radiacao) facility locatedat the CTN/IST (Campus Tecnologico e Nuclear) campusnear Lisbon, Portugal. Negatively charged hydrogen ionswere produced in a duoplasmatron ion source and wereinjected with 14 keV energy into the Tandem accelerator.The final proton energies considered during this experi-ment ranged between 2 and 3 MeV. Following the two-step acceleration process, the positively charged ions weredirected via an analysing magnet (90 degree) and furtherguided towards the reaction line where the detectors weremounted. Typical beam intensities of 100 - 300 nA wereachieved throughout the experiment.
For this experimental campaign the nuclear reaction linewas adapted to include a reaction chamber from the Tech-nische Universitat Munchen. The reaction targets preparedfor this experiment consisted in thin pure27Al foils as wellas evaporated LiF foils (with thicknesses lower than 1µmin both cases). A view of the experimental setup with theposition of the CALIFA modules around the reaction cham-ber can be observed in figure 1.
The HPGe detector (40% relative efficiency) was alsoinstalled around the reaction target, positioned at 90 and180 degrees from the nominal position of the two CALIFApetals. This detector provides a higher resolution of theenergy lines observed during the measurements, and willalso allow correlation studies between the CALIFA petalsand the photons measured with this device.
Prior to the start of the experiment, calibration sourceswere used to verify the response of the detectors as well as
GSI SCIENTIFIC REPORT 2016 RESEARCH-NUSTAR-KR-9
DOI:10.15120/GR-2017-1 219
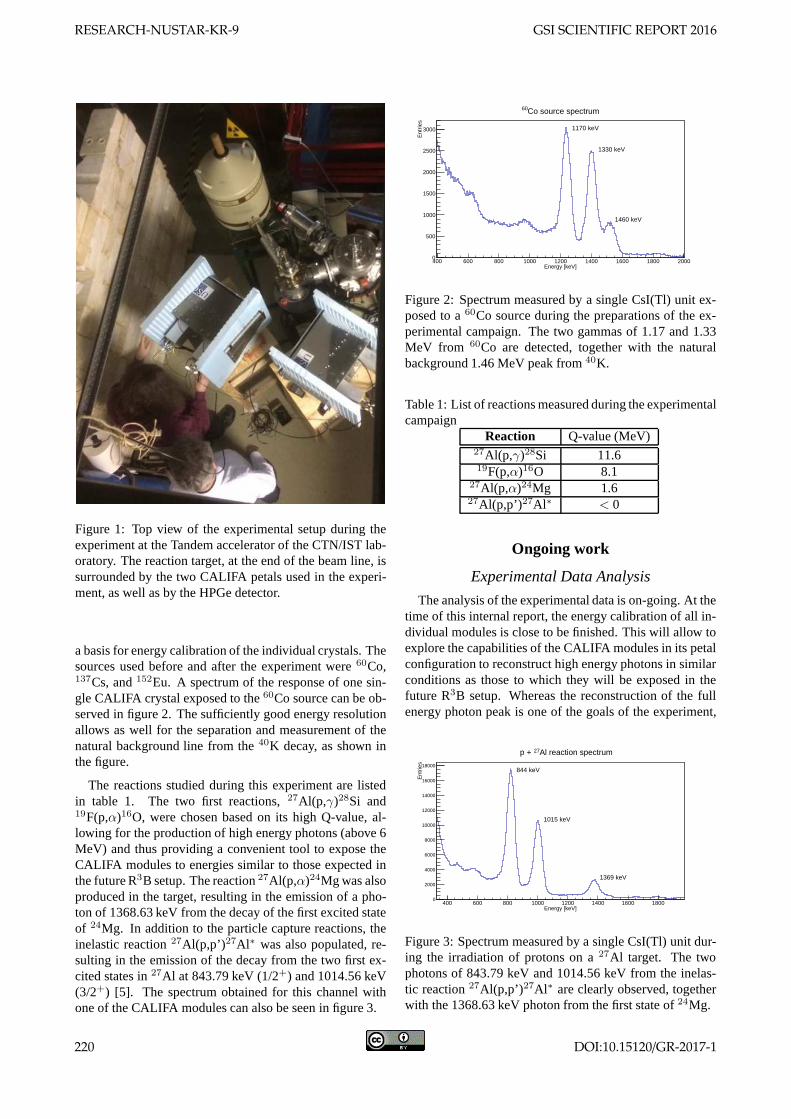
Figure 1: Top view of the experimental setup during theexperiment at the Tandem accelerator of the CTN/IST lab-oratory. The reaction target, at the end of the beam line, issurrounded by the two CALIFA petals used in the experi-ment, as well as by the HPGe detector.
a basis for energy calibration of the individual crystals. Thesources used before and after the experiment were60Co,137Cs, and152Eu. A spectrum of the response of one sin-gle CALIFA crystal exposed to the60Co source can be ob-served in figure 2. The sufficiently good energy resolutionallows as well for the separation and measurement of thenatural background line from the40K decay, as shown inthe figure.
The reactions studied during this experiment are listedin table 1. The two first reactions,27Al(p,γ)28Si and19F(p,α)16O, were chosen based on its high Q-value, al-lowing for the production of high energy photons (above 6MeV) and thus providing a convenient tool to expose theCALIFA modules to energies similar to those expected inthe future R3B setup. The reaction27Al(p,α)24Mg was alsoproduced in the target, resulting in the emission of a pho-ton of 1368.63 keV from the decay of the first excited stateof 24Mg. In addition to the particle capture reactions, theinelastic reaction27Al(p,p’)27Al∗ was also populated, re-sulting in the emission of the decay from the two first ex-cited states in27Al at 843.79 keV (1/2+) and 1014.56 keV(3/2+) [5]. The spectrum obtained for this channel withone of the CALIFA modules can also be seen in figure 3.
Energy [keV]400 600 800 1000 1200 1400 1600 1800 2000
Ent
ries
0
500
1000
1500
2000
2500
3000
Co source spectrum60
1170 keV
1330 keV
1460 keV
Figure 2: Spectrum measured by a single CsI(Tl) unit ex-posed to a60Co source during the preparations of the ex-perimental campaign. The two gammas of 1.17 and 1.33MeV from 60Co are detected, together with the naturalbackground 1.46 MeV peak from40K.
Table 1: List of reactions measured during the experimentalcampaign
Reaction Q-value (MeV)27Al(p,γ)28Si 11.619F(p,α)16O 8.1
27Al(p,α)24Mg 1.627Al(p,p’)27Al∗ < 0
Ongoing work
Experimental Data Analysis
The analysis of the experimental data is on-going. At thetime of this internal report, the energy calibration of all in-dividual modules is close to be finished. This will allow toexplore the capabilities of the CALIFA modules in its petalconfiguration to reconstruct high energy photons in similarconditions as those to which they will be exposed in thefuture R3B setup. Whereas the reconstruction of the fullenergy photon peak is one of the goals of the experiment,
Energy [keV]400 600 800 1000 1200 1400 1600 1800
Ent
ries
0
2000
4000
6000
8000
10000
12000
14000
16000
18000
Al reaction spectrum27p +
844 keV
1015 keV
1369 keV
Figure 3: Spectrum measured by a single CsI(Tl) unit dur-ing the irradiation of protons on a27Al target. The twophotons of 843.79 keV and 1014.56 keV from the inelas-tic reaction27Al(p,p’)27Al∗ are clearly observed, togetherwith the 1368.63 keV photon from the first state of24Mg.
RESEARCH-NUSTAR-KR-9 GSI SCIENTIFIC REPORT 2016
220 DOI:10.15120/GR-2017-1
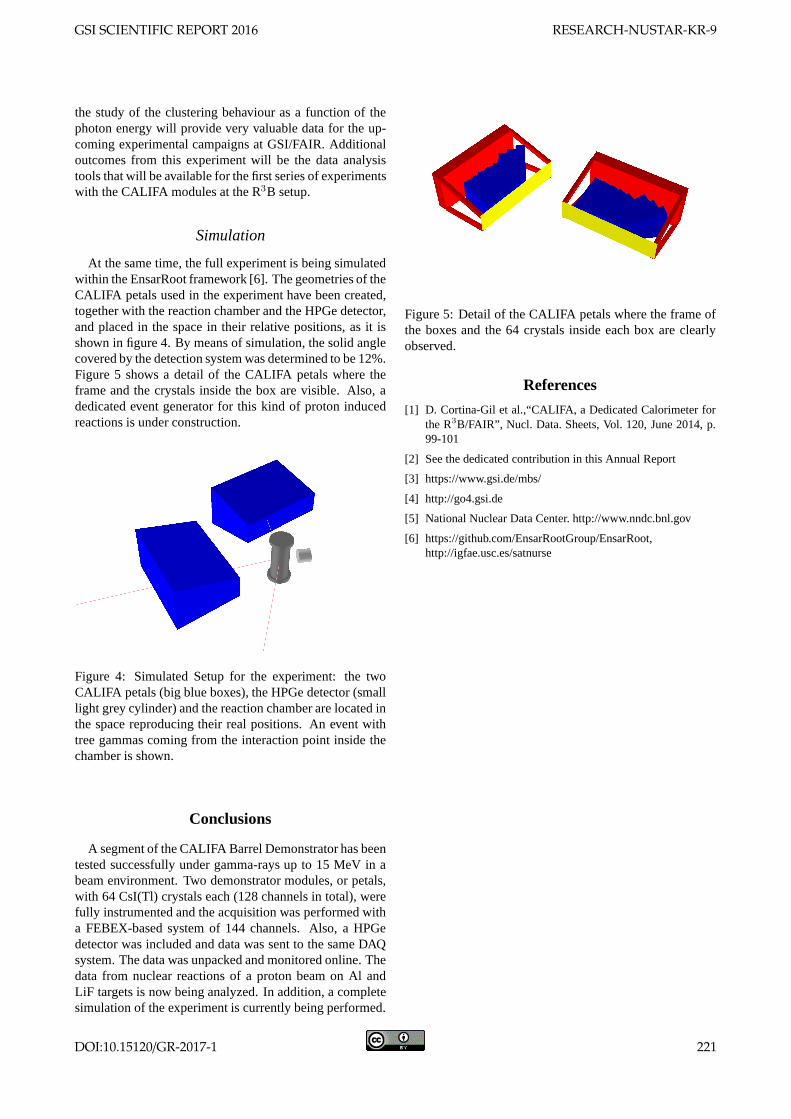
the study of the clustering behaviour as a function of thephoton energy will provide very valuable data for the up-coming experimental campaigns at GSI/FAIR. Additionaloutcomes from this experiment will be the data analysistools that will be available for the first series of experimentswith the CALIFA modules at the R3B setup.
Simulation
At the same time, the full experiment is being simulatedwithin the EnsarRoot framework [6]. The geometries of theCALIFA petals used in the experiment have been created,together with the reaction chamber and the HPGe detector,and placed in the space in their relative positions, as it isshown in figure 4. By means of simulation, the solid anglecovered by the detection system was determined to be 12%.Figure 5 shows a detail of the CALIFA petals where theframe and the crystals inside the box are visible. Also, adedicated event generator for this kind of proton inducedreactions is under construction.
Figure 4: Simulated Setup for the experiment: the twoCALIFA petals (big blue boxes), the HPGe detector (smalllight grey cylinder) and the reaction chamber are located inthe space reproducing their real positions. An event withtree gammas coming from the interaction point inside thechamber is shown.
Conclusions
A segment of the CALIFA Barrel Demonstrator has beentested successfully under gamma-rays up to 15 MeV in abeam environment. Two demonstrator modules, or petals,with 64 CsI(Tl) crystals each (128 channels in total), werefully instrumented and the acquisition was performed witha FEBEX-based system of 144 channels. Also, a HPGedetector was included and data was sent to the same DAQsystem. The data was unpacked and monitored online. Thedata from nuclear reactions of a proton beam on Al andLiF targets is now being analyzed. In addition, a completesimulation of the experiment is currently being performed.
Figure 5: Detail of the CALIFA petals where the frame ofthe boxes and the 64 crystals inside each box are clearlyobserved.
References
[1] D. Cortina-Gil et al.,“CALIFA, a Dedicated Calorimeterforthe R3B/FAIR”, Nucl. Data. Sheets, Vol. 120, June 2014, p.99-101
[2] See the dedicated contribution in this Annual Report
[3] https://www.gsi.de/mbs/
[4] http://go4.gsi.de
[5] National Nuclear Data Center. http://www.nndc.bnl.gov
[6] https://github.com/EnsarRootGroup/EnsarRoot,http://igfae.usc.es/satnurse
GSI SCIENTIFIC REPORT 2016 RESEARCH-NUSTAR-KR-9
DOI:10.15120/GR-2017-1 221
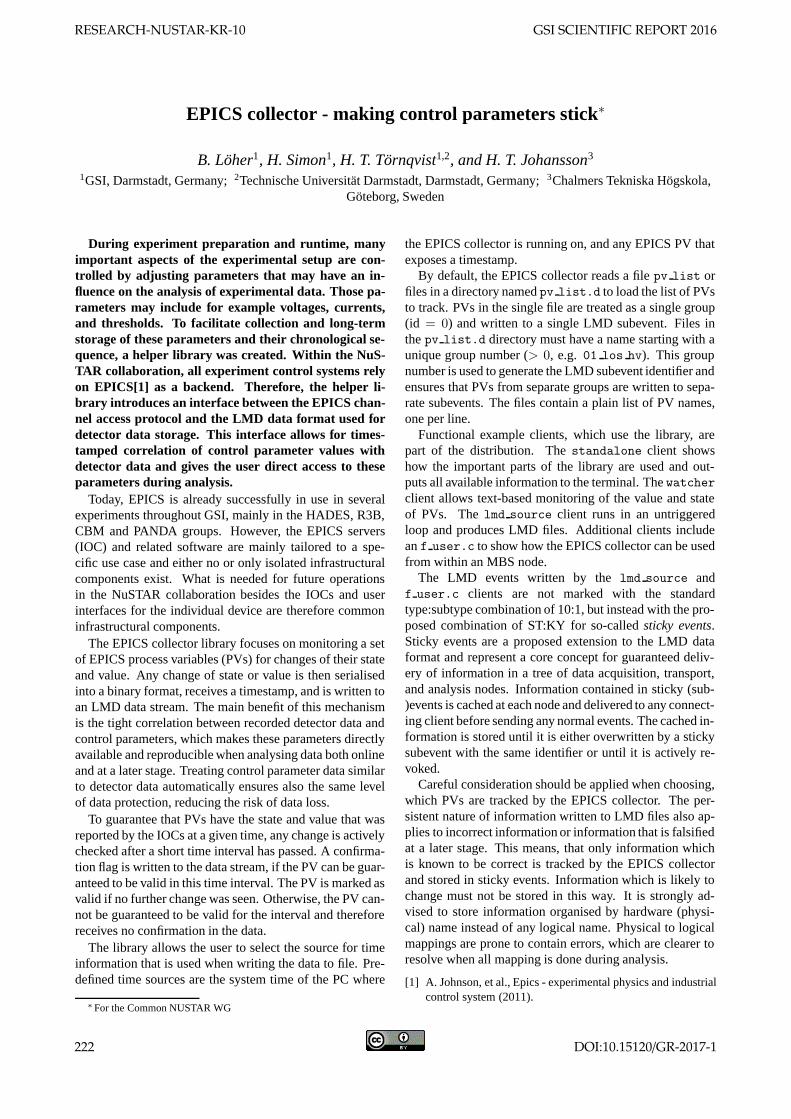
EPICS collector - making control parameters stick∗
B. Loher1, H. Simon1, H. T. Tornqvist1,2, and H. T. Johansson3
1GSI, Darmstadt, Germany; 2Technische Universitat Darmstadt, Darmstadt, Germany; 3Chalmers Tekniska Hogskola,Goteborg, Sweden
During experiment preparation and runtime, manyimportant aspects of the experimental setup are con-trolled by adjusting parameters that may have an in-fluence on the analysis of experimental data. Those pa-rameters may include for example voltages, currents,and thresholds. To facilitate collection and long-termstorage of these parameters and their chronological se-quence, a helper library was created. Within the NuS-TAR collaboration, all experiment control systems relyon EPICS[1] as a backend. Therefore, the helper li-brary introduces an interface between the EPICS chan-nel access protocol and the LMD data format used fordetector data storage. This interface allows for times-tamped correlation of control parameter values withdetector data and gives the user direct access to theseparameters during analysis.
Today, EPICS is already successfully in use in severalexperiments throughout GSI, mainly in the HADES, R3B,CBM and PANDA groups. However, the EPICS servers(IOC) and related software are mainly tailored to a spe-cific use case and either no or only isolated infrastructuralcomponents exist. What is needed for future operationsin the NuSTAR collaboration besides the IOCs and userinterfaces for the individual device are therefore commoninfrastructural components.
The EPICS collector library focuses on monitoring a setof EPICS process variables (PVs) for changes of their stateand value. Any change of state or value is then serialisedinto a binary format, receives a timestamp, and is written toan LMD data stream. The main benefit of this mechanismis the tight correlation between recorded detector data andcontrol parameters, which makes these parameters directlyavailable and reproducible when analysing data both onlineand at a later stage. Treating control parameter data similarto detector data automatically ensures also the same levelof data protection, reducing the risk of data loss.
To guarantee that PVs have the state and value that wasreported by the IOCs at a given time, any change is activelychecked after a short time interval has passed. A confirma-tion flag is written to the data stream, if the PV can be guar-anteed to be valid in this time interval. The PV is marked asvalid if no further change was seen. Otherwise, the PV can-not be guaranteed to be valid for the interval and thereforereceives no confirmation in the data.
The library allows the user to select the source for timeinformation that is used when writing the data to file. Pre-defined time sources are the system time of the PC where
∗For the Common NUSTAR WG
the EPICS collector is running on, and any EPICS PV thatexposes a timestamp.
By default, the EPICS collector reads a file pv list orfiles in a directory named pv list.d to load the list of PVsto track. PVs in the single file are treated as a single group(id = 0) and written to a single LMD subevent. Files inthe pv list.d directory must have a name starting with aunique group number (> 0, e.g. 01 los hv). This groupnumber is used to generate the LMD subevent identifier andensures that PVs from separate groups are written to sepa-rate subevents. The files contain a plain list of PV names,one per line.
Functional example clients, which use the library, arepart of the distribution. The standalone client showshow the important parts of the library are used and out-puts all available information to the terminal. The watcherclient allows text-based monitoring of the value and stateof PVs. The lmd source client runs in an untriggeredloop and produces LMD files. Additional clients includean f user.c to show how the EPICS collector can be usedfrom within an MBS node.
The LMD events written by the lmd source andf user.c clients are not marked with the standardtype:subtype combination of 10:1, but instead with the pro-posed combination of ST:KY for so-called sticky events.Sticky events are a proposed extension to the LMD dataformat and represent a core concept for guaranteed deliv-ery of information in a tree of data acquisition, transport,and analysis nodes. Information contained in sticky (sub-)events is cached at each node and delivered to any connect-ing client before sending any normal events. The cached in-formation is stored until it is either overwritten by a stickysubevent with the same identifier or until it is actively re-voked.
Careful consideration should be applied when choosing,which PVs are tracked by the EPICS collector. The per-sistent nature of information written to LMD files also ap-plies to incorrect information or information that is falsifiedat a later stage. This means, that only information whichis known to be correct is tracked by the EPICS collectorand stored in sticky events. Information which is likely tochange must not be stored in this way. It is strongly ad-vised to store information organised by hardware (physi-cal) name instead of any logical name. Physical to logicalmappings are prone to contain errors, which are clearer toresolve when all mapping is done during analysis.
[1] A. Johnson, et al., Epics - experimental physics and industrialcontrol system (2011).
RESEARCH-NUSTAR-KR-10 GSI SCIENTIFIC REPORT 2016
222 DOI:10.15120/GR-2017-1
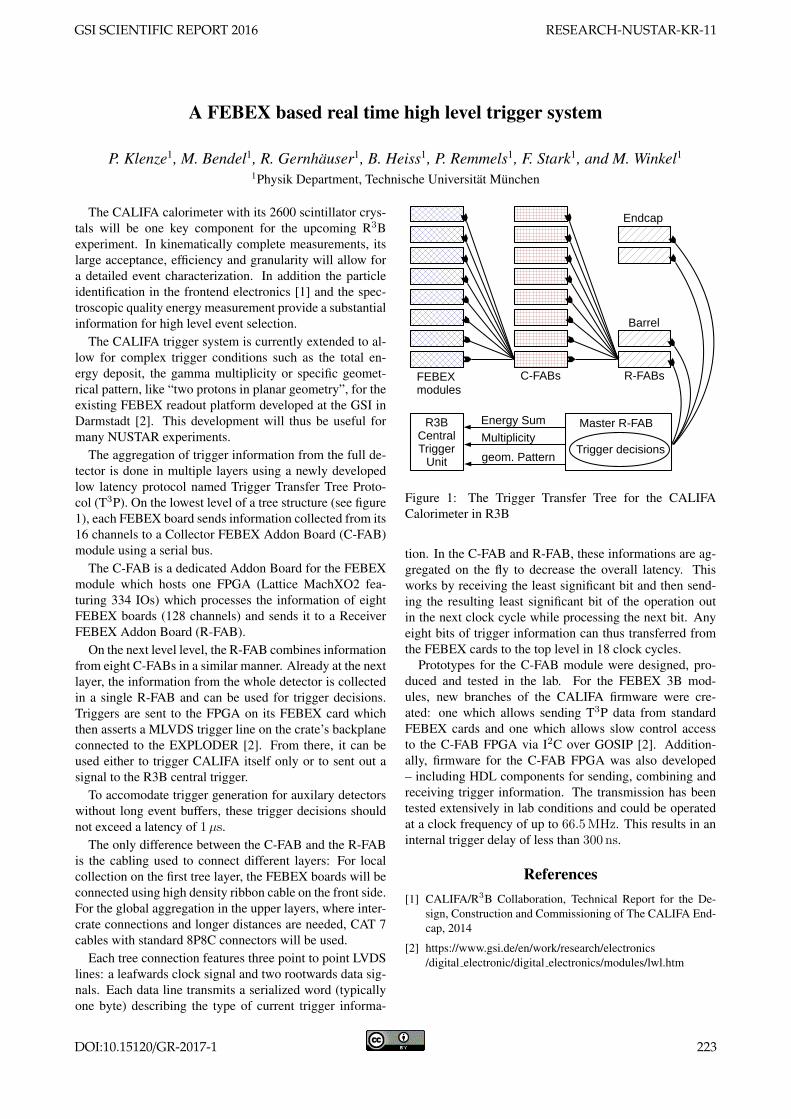
A FEBEX based real time high level trigger system
P. Klenze1, M. Bendel1, R. Gernhauser1, B. Heiss1, P. Remmels1, F. Stark1, and M. Winkel1
1Physik Department, Technische Universitat Munchen
The CALIFA calorimeter with its 2600 scintillator crys-tals will be one key component for the upcoming R3Bexperiment. In kinematically complete measurements, itslarge acceptance, efficiency and granularity will allow fora detailed event characterization. In addition the particleidentification in the frontend electronics [1] and the spec-troscopic quality energy measurement provide a substantialinformation for high level event selection.
The CALIFA trigger system is currently extended to al-low for complex trigger conditions such as the total en-ergy deposit, the gamma multiplicity or specific geomet-rical pattern, like “two protons in planar geometry”, for theexisting FEBEX readout platform developed at the GSI inDarmstadt [2]. This development will thus be useful formany NUSTAR experiments.
The aggregation of trigger information from the full de-tector is done in multiple layers using a newly developedlow latency protocol named Trigger Transfer Tree Proto-col (T3P). On the lowest level of a tree structure (see figure1), each FEBEX board sends information collected from its16 channels to a Collector FEBEX Addon Board (C-FAB)module using a serial bus.
The C-FAB is a dedicated Addon Board for the FEBEXmodule which hosts one FPGA (Lattice MachXO2 fea-turing 334 IOs) which processes the information of eightFEBEX boards (128 channels) and sends it to a ReceiverFEBEX Addon Board (R-FAB).
On the next level level, the R-FAB combines informationfrom eight C-FABs in a similar manner. Already at the nextlayer, the information from the whole detector is collectedin a single R-FAB and can be used for trigger decisions.Triggers are sent to the FPGA on its FEBEX card whichthen asserts a MLVDS trigger line on the crate’s backplaneconnected to the EXPLODER [2]. From there, it can beused either to trigger CALIFA itself only or to sent out asignal to the R3B central trigger.
To accomodate trigger generation for auxilary detectorswithout long event buffers, these trigger decisions shouldnot exceed a latency of 1µs.
The only difference between the C-FAB and the R-FABis the cabling used to connect different layers: For localcollection on the first tree layer, the FEBEX boards will beconnected using high density ribbon cable on the front side.For the global aggregation in the upper layers, where inter-crate connections and longer distances are needed, CAT 7cables with standard 8P8C connectors will be used.
Each tree connection features three point to point LVDSlines: a leafwards clock signal and two rootwards data sig-nals. Each data line transmits a serialized word (typicallyone byte) describing the type of current trigger informa-
FEBEXmodules
C-FABs R-FABs
Master R-FAB
Trigger decisions
Barrel
Endcap
R3BCentralTrigger
Unit
Energy Sum
Multiplicity
geom. Pattern
Figure 1: The Trigger Transfer Tree for the CALIFACalorimeter in R3B
tion. In the C-FAB and R-FAB, these informations are ag-gregated on the fly to decrease the overall latency. Thisworks by receiving the least significant bit and then send-ing the resulting least significant bit of the operation outin the next clock cycle while processing the next bit. Anyeight bits of trigger information can thus transferred fromthe FEBEX cards to the top level in 18 clock cycles.
Prototypes for the C-FAB module were designed, pro-duced and tested in the lab. For the FEBEX 3B mod-ules, new branches of the CALIFA firmware were cre-ated: one which allows sending T3P data from standardFEBEX cards and one which allows slow control accessto the C-FAB FPGA via I2C over GOSIP [2]. Addition-ally, firmware for the C-FAB FPGA was also developed– including HDL components for sending, combining andreceiving trigger information. The transmission has beentested extensively in lab conditions and could be operatedat a clock frequency of up to 66.5MHz. This results in aninternal trigger delay of less than 300 ns.
References[1] CALIFA/R3B Collaboration, Technical Report for the De-
sign, Construction and Commissioning of The CALIFA End-cap, 2014
[2] https://www.gsi.de/en/work/research/electronics/digital electronic/digital electronics/modules/lwl.htm
GSI SCIENTIFIC REPORT 2016 RESEARCH-NUSTAR-KR-11
DOI:10.15120/GR-2017-1 223
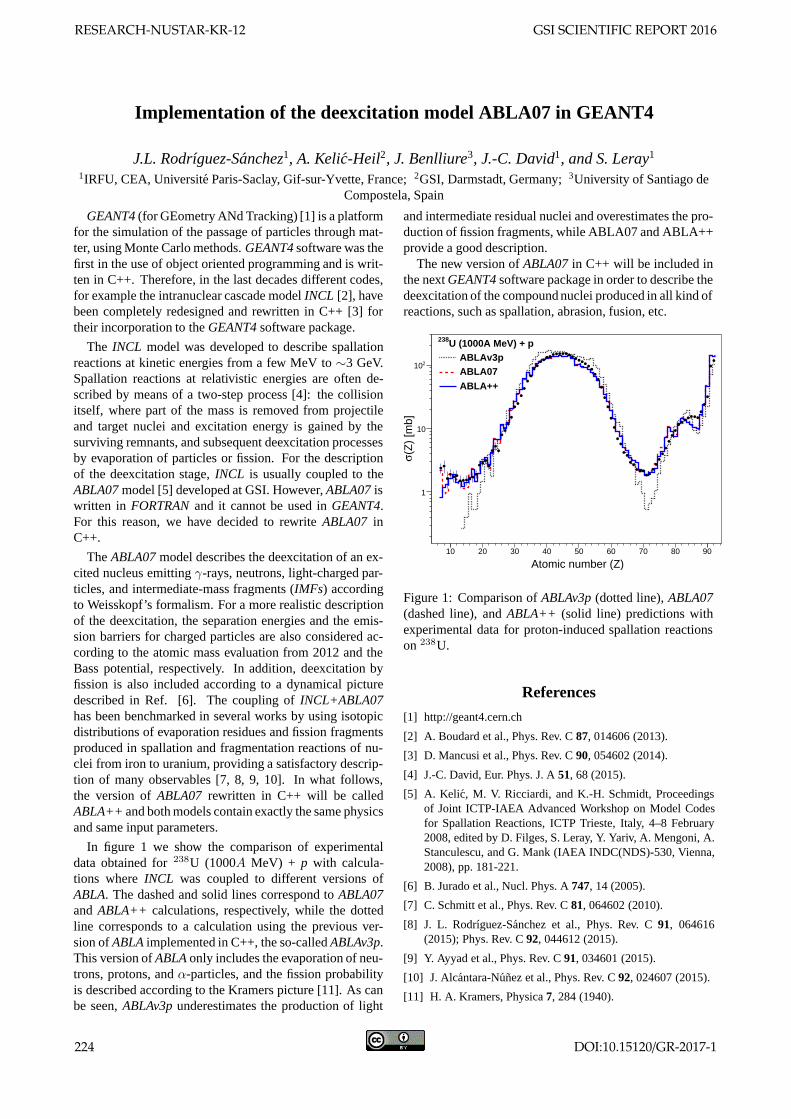
Implementation of the deexcitation model ABLA07 in GEANT4
J.L. Rodrıguez-Sanchez1, A. Kelic-Heil2, J. Benlliure3, J.-C. David1, and S. Leray1
1IRFU, CEA, Universite Paris-Saclay, Gif-sur-Yvette, France; 2GSI, Darmstadt, Germany; 3University of Santiago deCompostela, Spain
GEANT4 (for GEometry ANd Tracking) [1] is a platformfor the simulation of the passage of particles through mat-ter, using Monte Carlo methods. GEANT4 software was thefirst in the use of object oriented programming and is writ-ten in C++. Therefore, in the last decades different codes,for example the intranuclear cascade model INCL [2], havebeen completely redesigned and rewritten in C++ [3] fortheir incorporation to the GEANT4 software package.
The INCL model was developed to describe spallationreactions at kinetic energies from a few MeV to ∼3 GeV.Spallation reactions at relativistic energies are often de-scribed by means of a two-step process [4]: the collisionitself, where part of the mass is removed from projectileand target nuclei and excitation energy is gained by thesurviving remnants, and subsequent deexcitation processesby evaporation of particles or fission. For the descriptionof the deexcitation stage, INCL is usually coupled to theABLA07 model [5] developed at GSI. However, ABLA07 iswritten in FORTRAN and it cannot be used in GEANT4.For this reason, we have decided to rewrite ABLA07 inC++.
The ABLA07 model describes the deexcitation of an ex-cited nucleus emitting γ-rays, neutrons, light-charged par-ticles, and intermediate-mass fragments (IMFs) accordingto Weisskopf’s formalism. For a more realistic descriptionof the deexcitation, the separation energies and the emis-sion barriers for charged particles are also considered ac-cording to the atomic mass evaluation from 2012 and theBass potential, respectively. In addition, deexcitation byfission is also included according to a dynamical picturedescribed in Ref. [6]. The coupling of INCL+ABLA07has been benchmarked in several works by using isotopicdistributions of evaporation residues and fission fragmentsproduced in spallation and fragmentation reactions of nu-clei from iron to uranium, providing a satisfactory descrip-tion of many observables [7, 8, 9, 10]. In what follows,the version of ABLA07 rewritten in C++ will be calledABLA++ and both models contain exactly the same physicsand same input parameters.
In figure 1 we show the comparison of experimentaldata obtained for 238U (1000A MeV) + p with calcula-tions where INCL was coupled to different versions ofABLA. The dashed and solid lines correspond to ABLA07and ABLA++ calculations, respectively, while the dottedline corresponds to a calculation using the previous ver-sion of ABLA implemented in C++, the so-called ABLAv3p.This version of ABLA only includes the evaporation of neu-trons, protons, and α-particles, and the fission probabilityis described according to the Kramers picture [11]. As canbe seen, ABLAv3p underestimates the production of light
and intermediate residual nuclei and overestimates the pro-duction of fission fragments, while ABLA07 and ABLA++provide a good description.
The new version of ABLA07 in C++ will be included inthe next GEANT4 software package in order to describe thedeexcitation of the compound nuclei produced in all kind ofreactions, such as spallation, abrasion, fusion, etc.
Atomic number (Z)10 20 30 40 50 60 70 80 90
(Z)
[mb]
σ
1
10
210
U (1000A MeV) + p238
ABLAv3pABLA07ABLA++
Figure 1: Comparison of ABLAv3p (dotted line), ABLA07(dashed line), and ABLA++ (solid line) predictions withexperimental data for proton-induced spallation reactionson 238U.
References
[1] http://geant4.cern.ch
[2] A. Boudard et al., Phys. Rev. C 87, 014606 (2013).
[3] D. Mancusi et al., Phys. Rev. C 90, 054602 (2014).
[4] J.-C. David, Eur. Phys. J. A 51, 68 (2015).
[5] A. Kelic, M. V. Ricciardi, and K.-H. Schmidt, Proceedingsof Joint ICTP-IAEA Advanced Workshop on Model Codesfor Spallation Reactions, ICTP Trieste, Italy, 4–8 February2008, edited by D. Filges, S. Leray, Y. Yariv, A. Mengoni, A.Stanculescu, and G. Mank (IAEA INDC(NDS)-530, Vienna,2008), pp. 181-221.
[6] B. Jurado et al., Nucl. Phys. A 747, 14 (2005).
[7] C. Schmitt et al., Phys. Rev. C 81, 064602 (2010).
[8] J. L. Rodrıguez-Sanchez et al., Phys. Rev. C 91, 064616(2015); Phys. Rev. C 92, 044612 (2015).
[9] Y. Ayyad et al., Phys. Rev. C 91, 034601 (2015).
[10] J. Alcantara-Nunez et al., Phys. Rev. C 92, 024607 (2015).
[11] H. A. Kramers, Physica 7, 284 (1940).
RESEARCH-NUSTAR-KR-12 GSI SCIENTIFIC REPORT 2016
224 DOI:10.15120/GR-2017-1