Embed Size (px)
Citation preview
By
Emilia Pires Minister of Finance of Timor-Leste
1
TIMOR-LESTE ECONOMIC AND FINANCIAL STRENGTH

2
1. Timor-Leste’s SDP - SDP Vision - Strategy to Modernize and Diversify Economy 2. Major Economic Policies 3. Timor-Leste’s Economic Growth 4. Tax & Custom Reforms 5. Revenue for Timor-Leste 6. Infrastructure Development 7. Public-Private Partnership 8. Loans 9. Transparency Portals

3
STAGE I
• Human Resources Development;
• Infrastructure; • Strategic Industries.
STAGE II
• Infrastructure; • Strengthening Human Resources;
• Market Formation.
Stage III
• Eradication of Extreme Poverty;
• Strong Private Sector;
• Diversified Non-oil Economy.
Short-Term 2011-2015 Mid-Term 2016-2020 Long-Term 2021-2030
STRATEGIC DEVELOPMENT PLAN 2011-2030 “Vision :Timor-Leste to be an upper-middle income country by 20130”
4
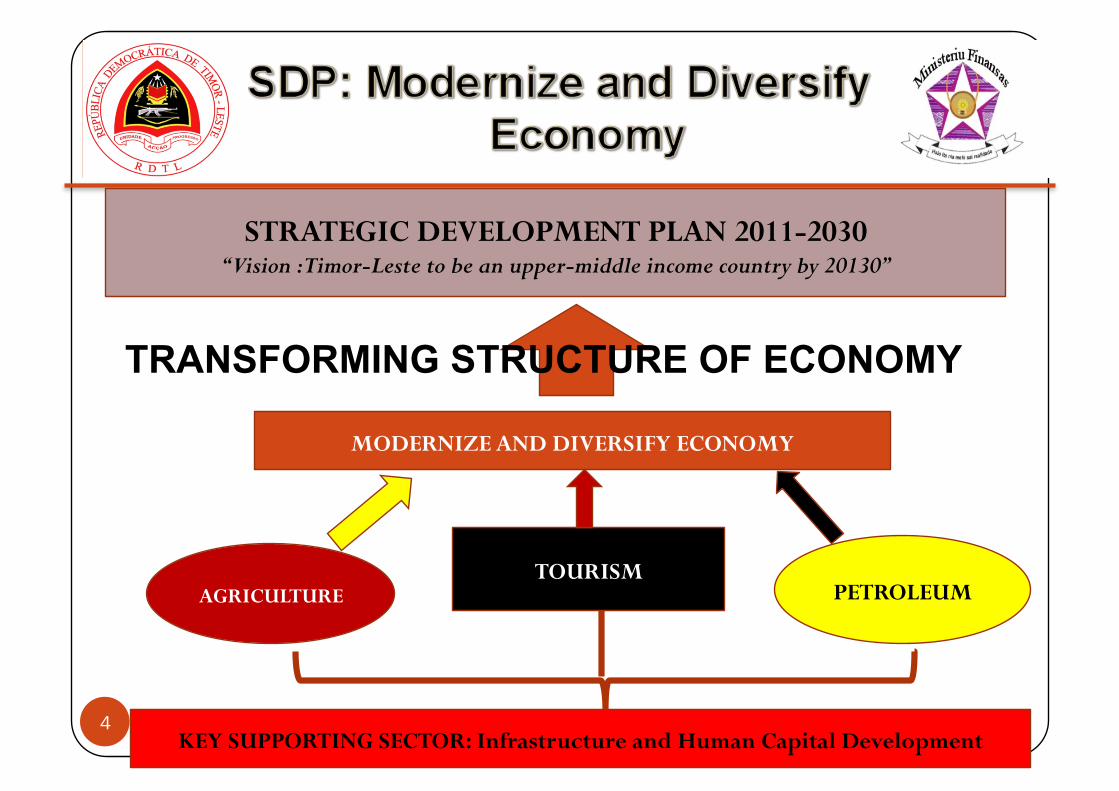
STRATEGIC DEVELOPMENT PLAN 2011-2030 “Vision :Timor-Leste to be an upper-middle income country by 20130”
AGRICULTURE TOURISM
PETROLEUM
MODERNIZE AND DIVERSIFY ECONOMY
TRANSFORMING STRUCTURE OF ECONOMY
KEY SUPPORTING SECTOR: Infrastructure and Human Capital Development
Major Economic Policies
5
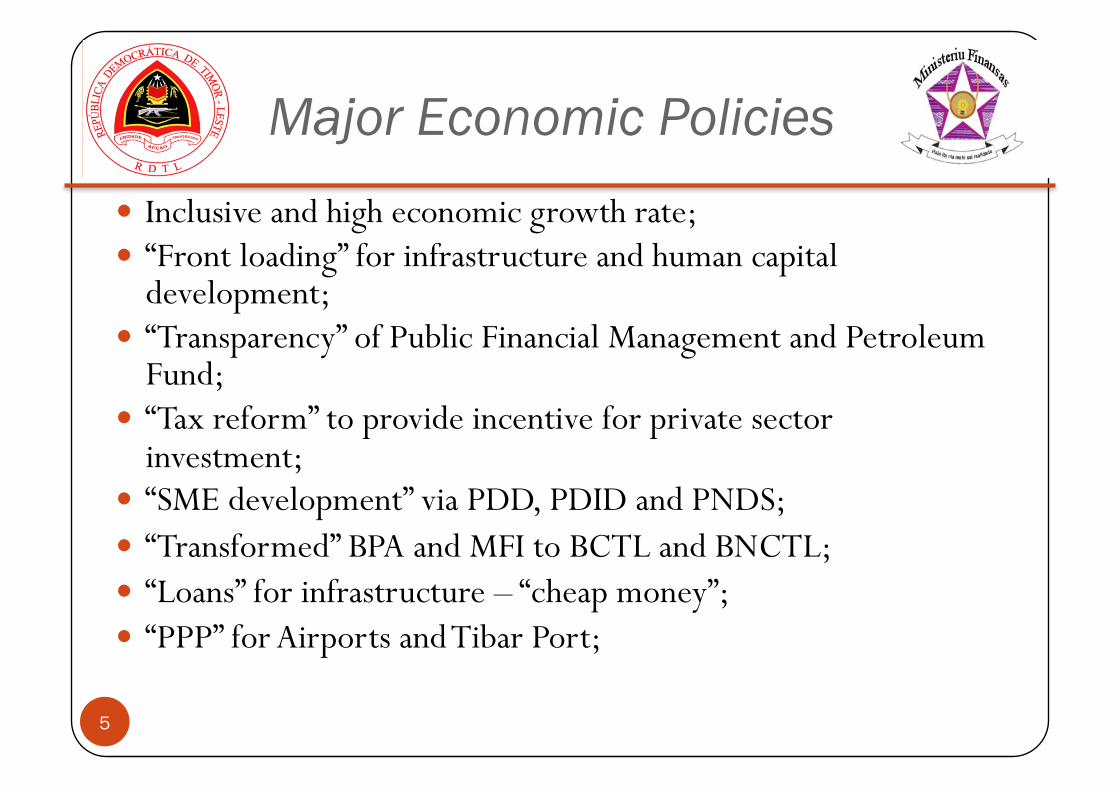
Inclusive and high economic growth rate; “Front loading” for infrastructure and human capital
development; “Transparency” of Public Financial Management and Petroleum
Fund; “Tax reform” to provide incentive for private sector
investment; “SME development” via PDD, PDID and PNDS; “Transformed” BPA and MFI to BCTL and BNCTL; “Loans” for infrastructure – “cheap money”; “PPP” for Airports and Tibar Port;
6
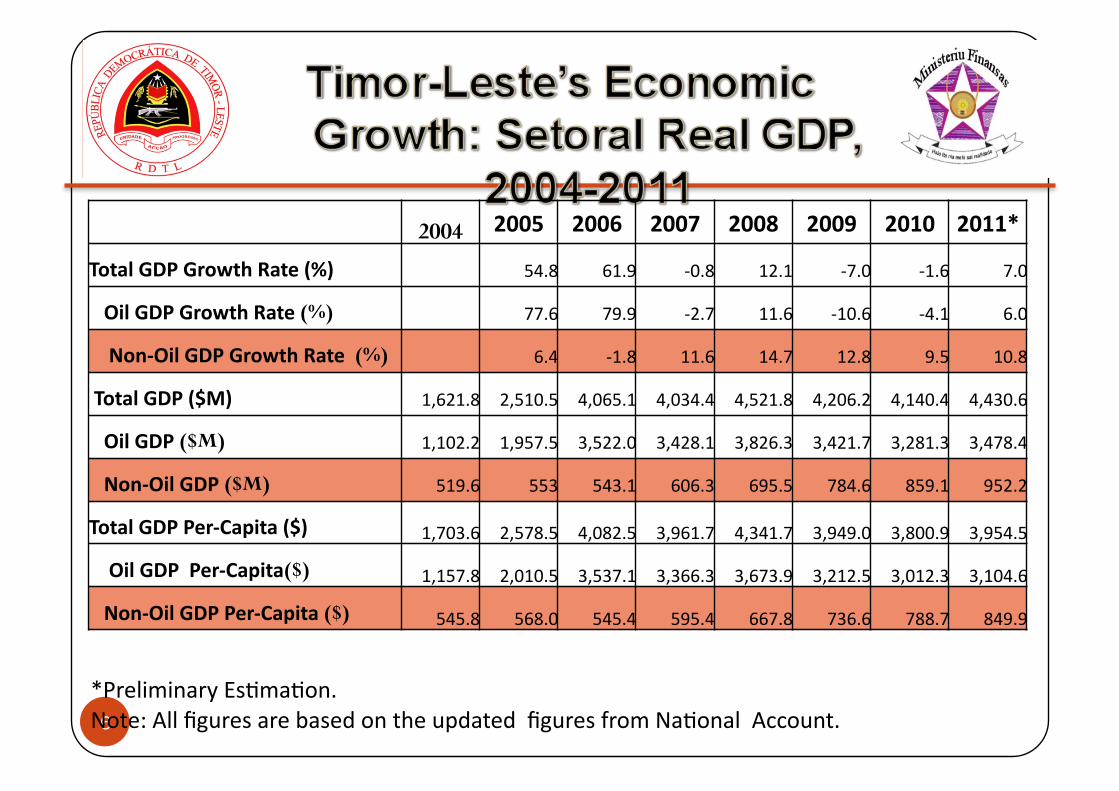
*PreliminaryEs.ma.on.Note:AllfiguresarebasedontheupdatedfiguresfromNa.onalAccount.
2004 2005 2006 2007 2008 2009 2010 2011*
TotalGDPGrowthRate(%) 54.8 61.9 ‐0.8 12.1 ‐7.0 ‐1.6 7.0
OilGDPGrowthRate(%) 77.6 79.9 ‐2.7 11.6 ‐10.6 ‐4.1 6.0
Non‐OilGDPGrowthRate(%) 6.4 ‐1.8 11.6 14.7 12.8 9.5 10.8
TotalGDP($M) 1,621.8 2,510.5 4,065.1 4,034.4 4,521.8 4,206.2 4,140.4 4,430.6
OilGDP($M) 1,102.2 1,957.5 3,522.0 3,428.1 3,826.3 3,421.7 3,281.3 3,478.4
Non‐OilGDP($M) 519.6 553 543.1 606.3 695.5 784.6 859.1 952.2
TotalGDPPer‐Capita($) 1,703.6 2,578.5 4,082.5 3,961.7 4,341.7 3,949.0 3,800.9 3,954.5
OilGDPPer‐Capita($) 1,157.8 2,010.5 3,537.1 3,366.3 3,673.9 3,212.5 3,012.3 3,104.6
Non‐OilGDPPer‐Capita($) 545.8 568.0 545.4 595.4 667.8 736.6 788.7 849.9
7
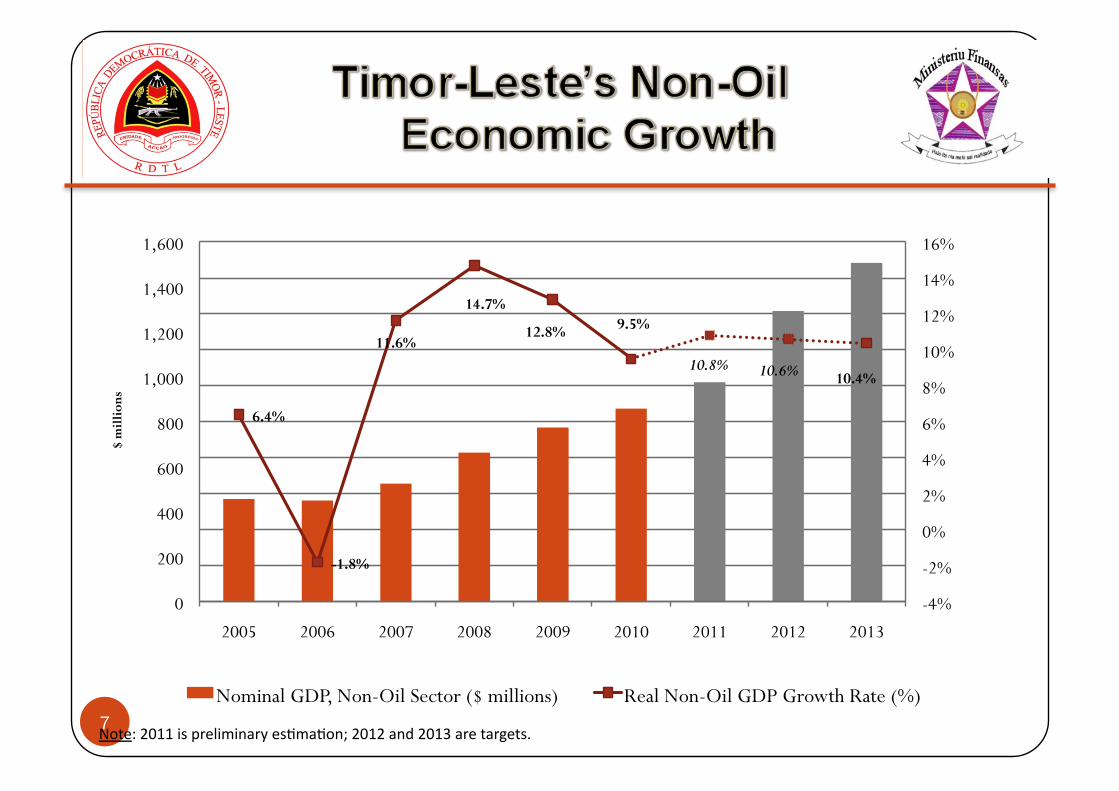
6.4%
-1.8%
11.6%
14.7%
12.8% 9.5%
10.8% 10.6% 10.4%
-4%
-2%
0%
2%
4%
6%
8%
10%
12%
14%
16%
0
200
400
600
800
1,000
1,200
1,400
1,600
2005 2006 2007 2008 2009 2010 2011 2012 2013
$ m
illio
ns
Nominal GDP, Non-Oil Sector ($ millions) Real Non-Oil GDP Growth Rate (%)
Note:2011ispreliminaryes.ma.on;2012and2013aretargets.
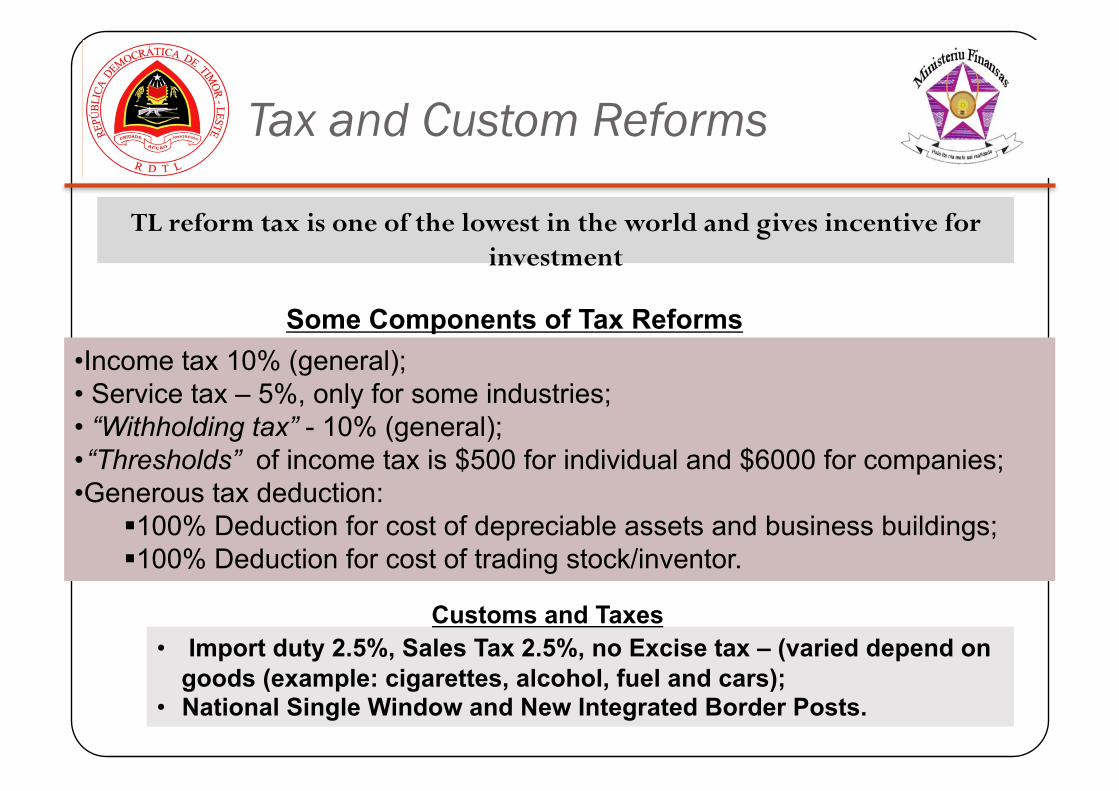
Tax and Custom Reforms
TL reform tax is one of the lowest in the world and gives incentive for investment
• Income tax 10% (general); • Service tax – 5%, only for some industries; • “Withholding tax” - 10% (general); • “Thresholds” of income tax is $500 for individual and $6000 for companies; • Generous tax deduction:
100% Deduction for cost of depreciable assets and business buildings; 100% Deduction for cost of trading stock/inventor.
• Import duty 2.5%, Sales Tax 2.5%, no Excise tax – (varied depend on goods (example: cigarettes, alcohol, fuel and cars);
• National Single Window and New Integrated Border Posts.
Customs and Taxes
Some Components of Tax Reforms
9
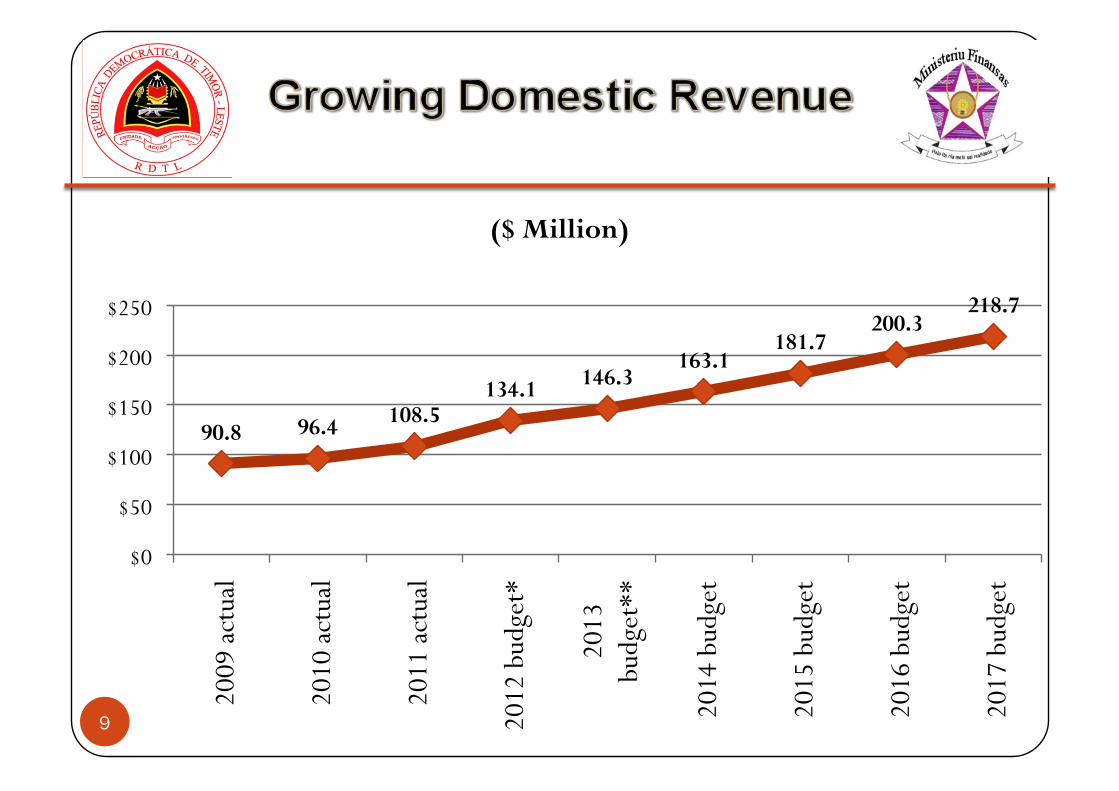
90.8 96.4 108.5 134.1 146.3
163.1 181.7
200.3 218.7
$0
$50
$100
$150
$200
$250
2009
act
ual
2010
act
ual
2011
act
ual
2012
bud
get*
2013
bu
dget
**
2014
bud
get
2015
bud
get
2016
bud
get
2017
bud
get
($ Million)
10
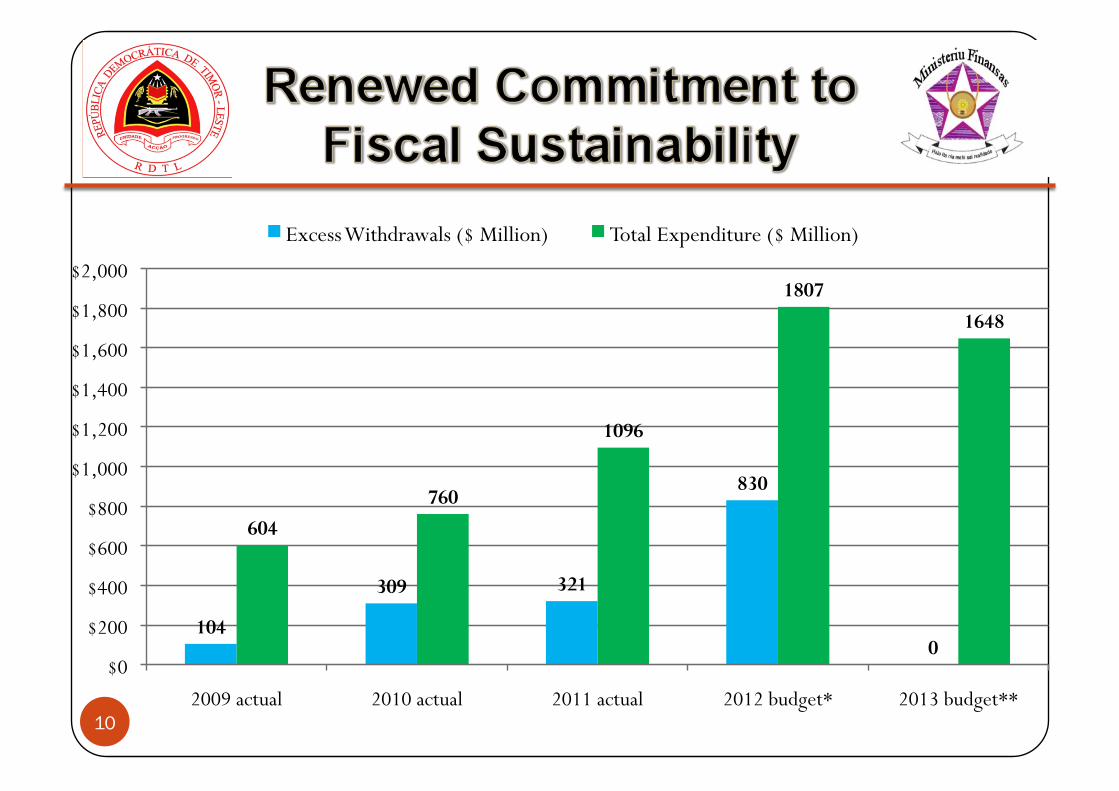
104
309 321
830
0
604 760
1096
1807 1648
$0
$200
$400
$600
$800
$1,000
$1,200
$1,400
$1,600
$1,800
$2,000
2009 actual 2010 actual 2011 actual 2012 budget* 2013 budget**
Excess Withdrawals ($ Million) Total Expenditure ($ Million)
11
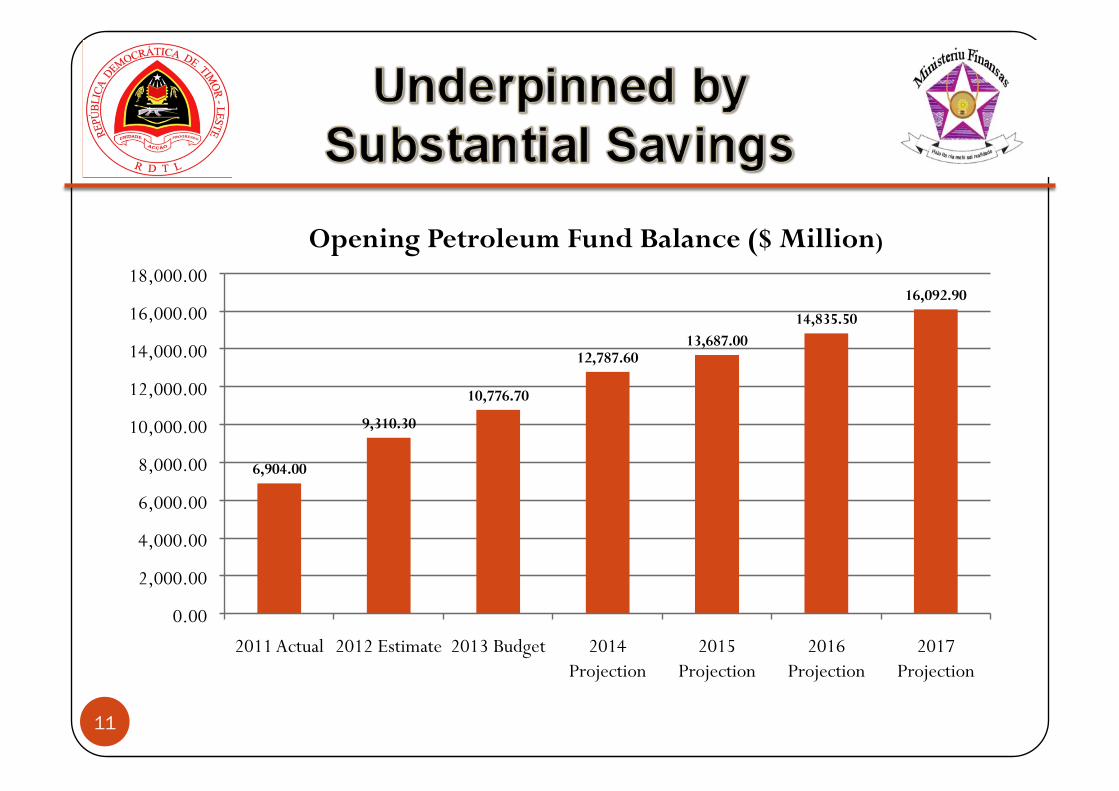
6,904.00
9,310.30
10,776.70
12,787.60 13,687.00
14,835.50 16,092.90
0.00
2,000.00
4,000.00
6,000.00
8,000.00
10,000.00
12,000.00
14,000.00
16,000.00
18,000.00
2011 Actual 2012 Estimate 2013 Budget 2014 Projection
2015 Projection
2016 Projection
2017 Projection
Opening Petroleum Fund Balance ($ Million)
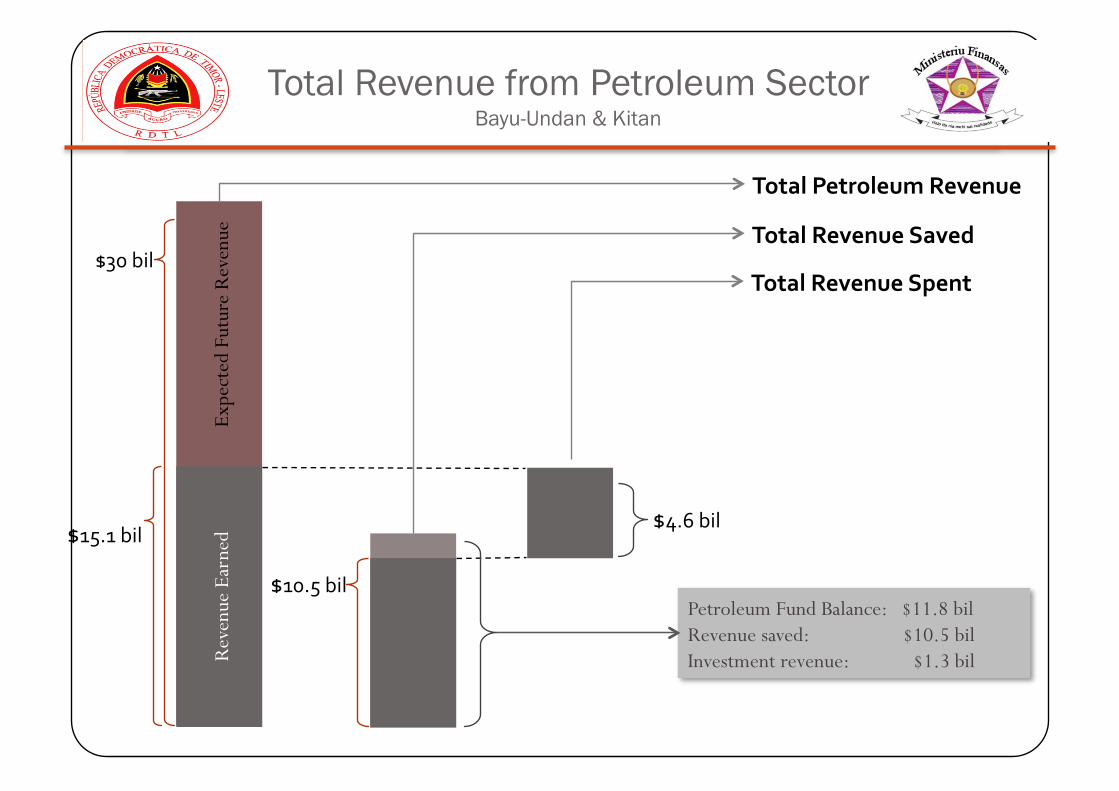
Total Revenue from Petroleum Sector Bayu-Undan & Kitan
Exp
ecte
d Fu
ture
Rev
enue
R
even
ue E
arne
d
$30bil
$10.5bilPetroleum Fund Balance: $11.8 bil Revenue saved: $10.5 bil Investment revenue: $1.3 bil
$4.6bil
TotalPetroleumRevenue
TotalRevenueSaved
TotalRevenueSpent
$15.1bil
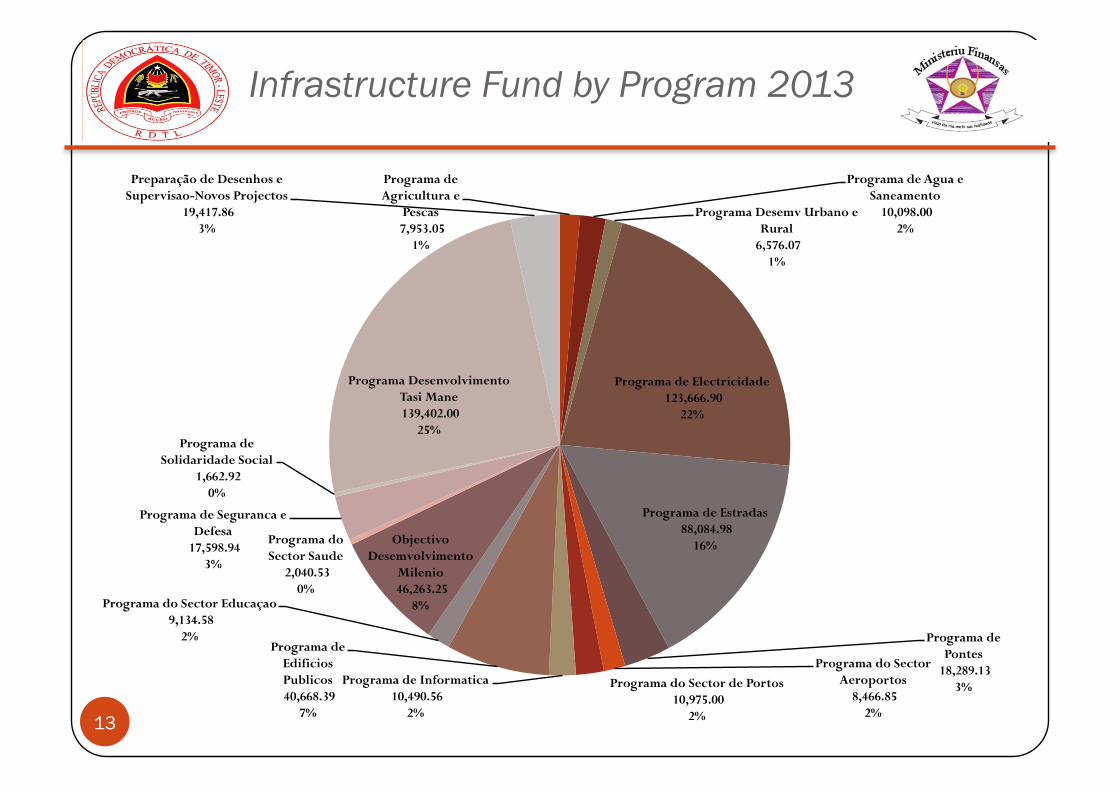
Infrastructure Fund by Program 2013
13
Programa de Agricultura e
Pescas 7,953.05
1%
Programa de Agua e Saneamento
10,098.00 2%
Programa Desemv Urbano e Rural
6,576.07 1%
Programa de Electricidade 123,666.90
22%
Programa de Estradas 88,084.98
16%
Programa de Pontes
18,289.13 3%
Programa do Sector Aeroportos
8,466.85 2%
Programa do Sector de Portos 10,975.00
2%
Programa de Informatica 10,490.56
2%
Programa de Edificios Publicos 40,668.39
7%
Programa do Sector Educaçao 9,134.58
2%
Objectivo Desemvolvimento
Milenio 46,263.25
8%
Programa do Sector Saude
2,040.53 0%
Programa de Seguranca e Defesa
17,598.94 3%
Programa de Solidaridade Social
1,662.92 0%
Programa Desenvolvimento Tasi Mane 139,402.00
25%
Preparação de Desenhos e Supervisao-Novos Projectos
19,417.86 3%
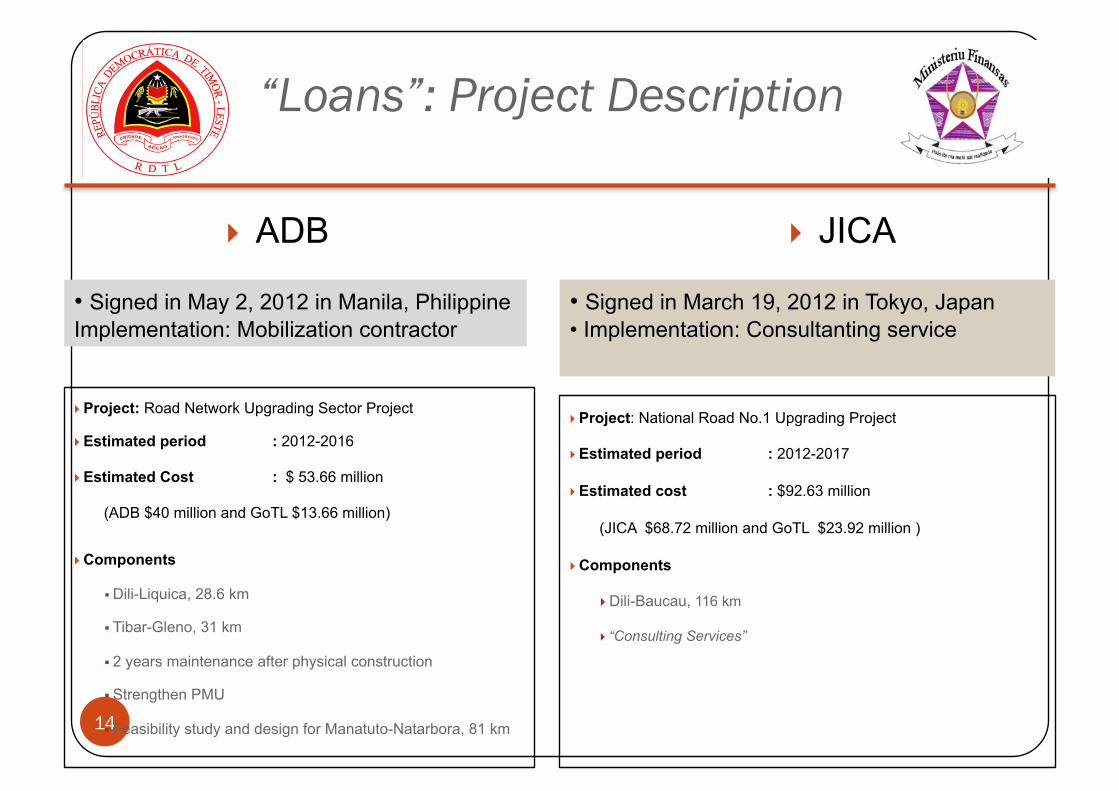
“Loans”: Project Description
14
ADB JICA
Project: Road Network Upgrading Sector Project
Estimated period : 2012-2016
Estimated Cost : $ 53.66 million
(ADB $40 million and GoTL $13.66 million)
Components
Dili-Liquica, 28.6 km
Tibar-Gleno, 31 km
2 years maintenance after physical construction
Strengthen PMU
Feasibility study and design for Manatuto-Natarbora, 81 km
Project: National Road No.1 Upgrading Project
Estimated period : 2012-2017
Estimated cost : $92.63 million
(JICA $68.72 million and GoTL $23.92 million )
Components
Dili-Baucau, 116 km
“Consulting Services”
• Signed in May 2, 2012 in Manila, Philippine Implementation: Mobilization contractor
• Signed in March 19, 2012 in Tokyo, Japan • Implementation: Consultanting service
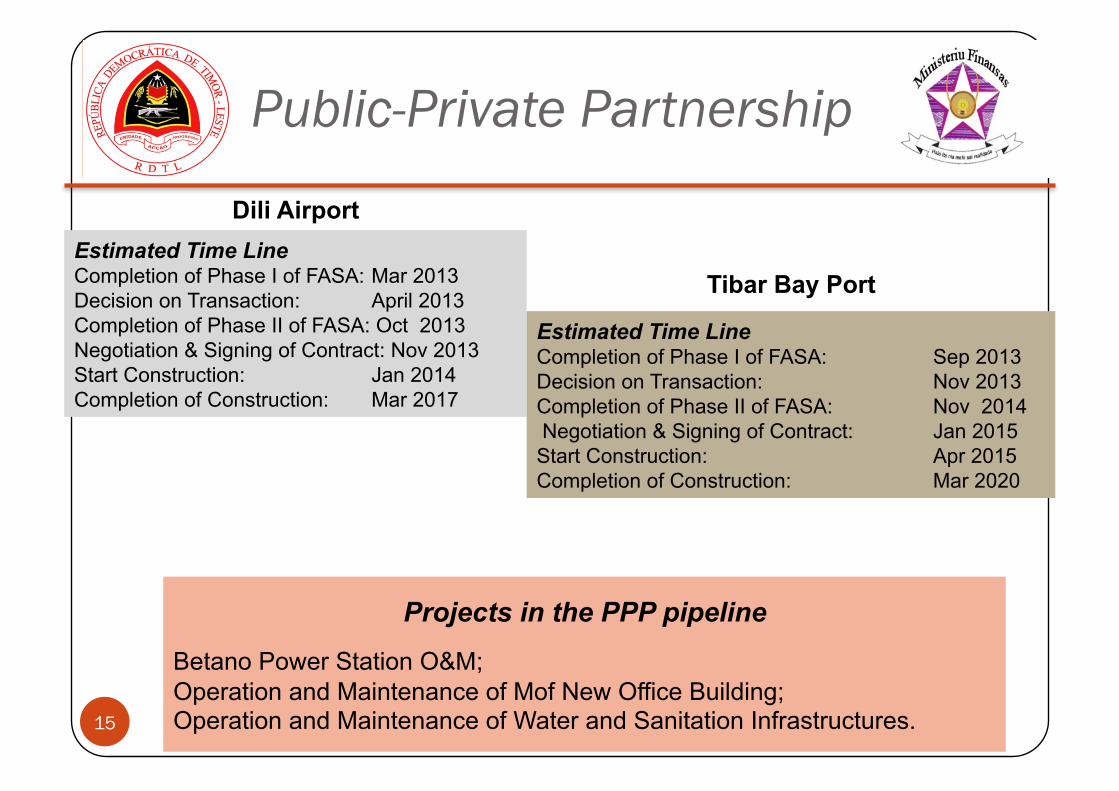
Public-Private Partnership
15
Estimated Time Line Completion of Phase I of FASA: Mar 2013 Decision on Transaction: April 2013 Completion of Phase II of FASA: Oct 2013 Negotiation & Signing of Contract: Nov 2013 Start Construction: Jan 2014 Completion of Construction: Mar 2017
Estimated Time Line Completion of Phase I of FASA: Sep 2013 Decision on Transaction: Nov 2013 Completion of Phase II of FASA: Nov 2014 Negotiation & Signing of Contract: Jan 2015 Start Construction: Apr 2015 Completion of Construction: Mar 2020
Projects in the PPP pipeline
Betano Power Station O&M; Operation and Maintenance of Mof New Office Building; Operation and Maintenance of Water and Sanitation Infrastructures.
Dili Airport
Tibar Bay Port
Timor-Leste IFMIS Systems 16