Embed Size (px)
Citation preview
TIMOR-LESTE NATIONAL ACCOUNTS
2010-2015
MINISTRY OF FINANCE OF TIMOR-LESTE General Directorate of Statistics

Timor-Leste's National Accounts 2010-2015 December 2016
General Directorate of Statistics (GDS) Page Ie I I
MINISTRY OF FINANCE OF TIMOR-LESTE
GENERAL DIRECTORATE OF STATISTICS
TIMOR-LESTE NATIONAL ACCOUNTS 2010-2015
DILI, DECEMBER 2016

Timor-Leste's National Accounts 2010-2015 December 2016
General Directorate of Statistics (GDS) Page II
CONTENTS
CONTENTS ............................................................................................................................................... II
FOREWORD ............................................................................................................................................ III
PREFACE ................................................................................................................................................. IV
ABBREVIATIONS AND ACRONYMS ......................................................................................................... VI
SUMMARY ............................................................................................................................................ VIII
LIST OF TABLES ...................................................................................................................................... XV
Section I: MAIN AGGREGATES .......................................................................................................... 1
Section II: EXPENDITURE APPROACH ............................................................................................... 6
Section III: PRODUCTION APPROACH ............................................................................................. 24
Section IV: INCOME APPROACH ..................................................................................................... 32
Section V: PRODUCT, INCOME AND SAVINGS ……………………………………………………………………………33
Section VI: NON-OIL SECTOR .......................................................................................................... 34
Section VII: QUARTERLY NON-OIL GROSS DOMESTIC PRODUCT BY EXPENDITURE ....................... 43
Appendix GLOSSARY OF TERMS .......................................................................................................................... 44


Timor-Leste's National Accounts 2010-2015 December 2016
General Directorate of Statistics (GDS) Page IV
ABBREVIATIONS AND ACRONYMS
AA Autonomous Agencies AED Aid Effectiveness Directorate, MOF AFR Annual Financial Reports also known as auditors' reports AIC Akaike Information Criterion BEC Classification of Broad Economic Categories BCTL Central Bank of Timor-Leste (Banco Central de Timor-Leste) Bldg. Building BOP Balance of Payments BPM Balance of Payments and International Investment Position Manual CFC Consumption of Fixed Capital CG Central Government CIF Cost, Insurance and Freight Interstate CoE Compensation of Employees COFOG Classification of the Functions of Government CPC Central Product Classification CPI Consumer Price Index Curr Current CY Calendar Year D&TA Development and Technical Assistance DP Development Partner DP&TA Development Partners and Technical Assistance Eqpt. Equipment F&HR Financial and Human Resources FAO Food and Agriculture Organization FCE Final Consumption Expenditure FDI Foreign Direct Investment FISIM Financial Intermediation Services Indirectly Measured FOB Free on Board FY Financial Year GCS Gross Capital Stock GDP Gross Domestic Product GDP (E) Gross Domestic Product Expenditure Approach GDP (P) Gross Domestic Product Production Approach GDP (I) Gross Domestic Product Income Approach GFCF Gross Fixed Capital Formation GFS Government Finance Statistics GFSM Government Finance Statistics Manual GG General Government GNDI Gross National Disposable Income GNI Gross National Income GoTL Government of Timor-Leste GVA Gross Value Added HIES Household Income and Expenditure Survey HS Harmonized Commodity Description and Coding System IC Intermediate Consumption ICT Information, Communication and Telecommunications IIP International Investment Position IMF International Monetary Fund IMTS International Merchandise Trade Statistics
Timor-Leste's National Accounts 2010-2015 December 2016
General Directorate of Statistics (GDS) Page V
Ins. Insurance IO International Organization IPD Implicit Price Deflator ISF International Stabilization Force ISIC International Standard Industrial Classification of All Economic Activities ISWGNA Inter-Secretariat Working Group on National Accounts JPDA Joint Petroleum Development Area (in Timor Sea) LNG Liquefied Natural gas LPG Liquid Petroleum gas LSMS Living Standards Measurement Study MPI Import Price Index n.e.c. Not elsewhere classified n.i.e. Not included elsewhere NCS Net Capital Stock ND National Directorate NPI Non-Profit Institution NPISH Non-Profit Institution Serving Households NR Non-Resident ODI Overseas Development Institute OECD Organization for Economic Cooperation and Development NF&F Non-financial and Financial P&HC Professional and Higher Categories R&D Research and Development R Resident RGNRDI Real Gross 'Net' Real Disposable Income R&NR Resident and Non-resident RoW Rest of the World qGDPi Non-Oil Quarterly GDP (E) Indicator SA Staff Assessment SD Statistical Discrepancy SD (E) Expenditure Statistical Discrepancy SD (P) Production Statistical Discrepancy SFA Self-Funded Agencies SITC Standard International Trade Classification SNA System of National Accounts STA Statistics Department (IMF) TFET Trust Fund for East Timor (World Bank and ADB) SHA System of Health Accounts TL Timor-Leste TL-NA Timor-Leste’s National Accounts TL-SLS Timor-Leste Survey of Living Standards Trf Transfer UN United Nations UNAC-TL UN Assessed Contribution (core UN paid personnel working for the GoTL) UNMIT United Nations Integrated Mission in Timor-Leste WEO World Economic Outlook XMPI Export and Import Price Indices XPI Export Price Index ZEESM Zona Especial de Economía Social de Mercado
Timor-Leste's National Accounts 2010-2015 December 2016
General Directorate of Statistics (GDS) Page VIe VI VI
SUMMARY
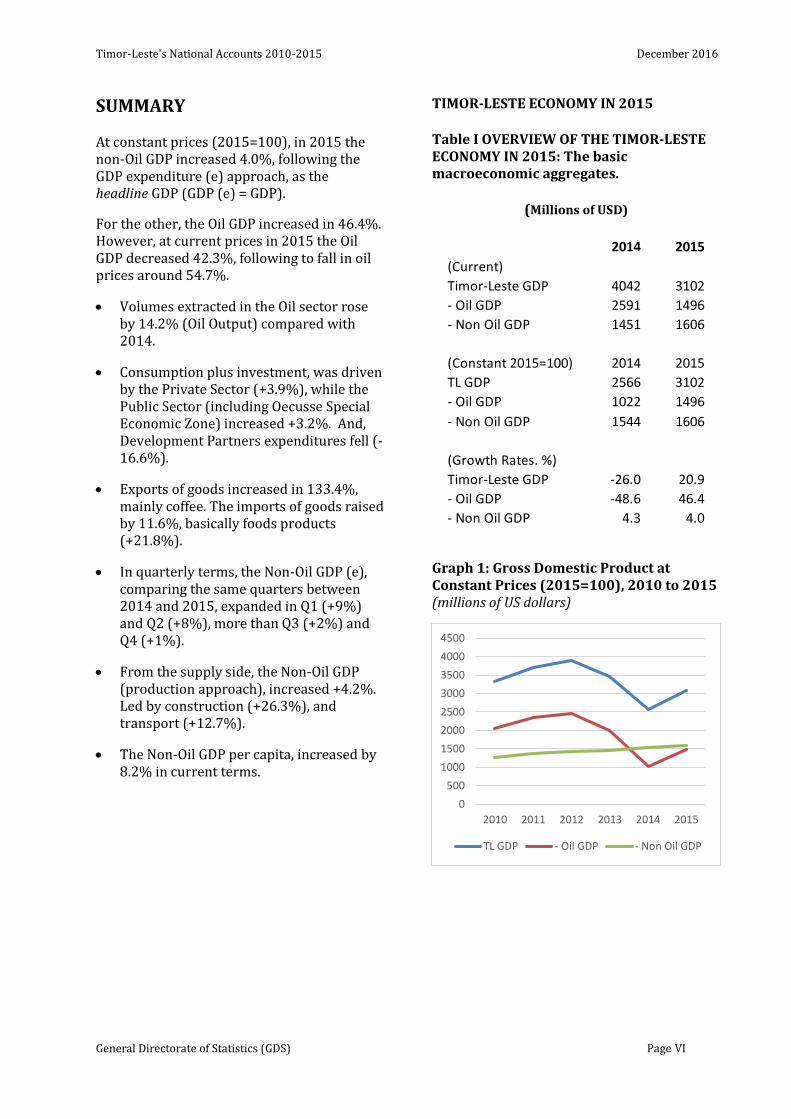
At constant prices (2015=100), in 2015 the non-Oil GDP increased 4.0%, following the GDP expenditure (e) approach, as the headline GDP (GDP (e) = GDP).
For the other, the Oil GDP increased in 46.4%. However, at current prices in 2015 the Oil GDP decreased 42.3%, following to fall in oil prices around 54.7%.
Volumes extracted in the Oil sector rose by 14.2% (Oil Output) compared with 2014.
Consumption plus investment, was driven by the Private Sector (+3.9%), while the Public Sector (including Oecusse Special Economic Zone) increased +3.2%. And, Development Partners expenditures fell (-16.6%).
Exports of goods increased in 133.4%, mainly coffee. The imports of goods raised by 11.6%, basically foods products (+21.8%).
In quarterly terms, the Non-Oil GDP (e), comparing the same quarters between 2014 and 2015, expanded in Q1 (+9%) and Q2 (+8%), more than Q3 (+2%) and Q4 (+1%).
From the supply side, the Non-Oil GDP (production approach), increased +4.2%. Led by construction (+26.3%), and transport (+12.7%).
The Non-Oil GDP per capita, increased by 8.2% in current terms.
TIMOR-LESTE ECONOMY IN 2015
Table I OVERVIEW OF THE TIMOR-LESTE ECONOMY IN 2015: The basic macroeconomic aggregates.
(Millions of USD)
2014 2015
(Current)
Timor-Leste GDP 4042 3102
- Oil GDP 2591 1496
- Non Oil GDP 1451 1606
(Constant 2015=100) 2014 2015
TL GDP 2566 3102
- Oil GDP 1022 1496
- Non Oil GDP 1544 1606
(Growth Rates. %)
Timor-Leste GDP -26.0 20.9
- Oil GDP -48.6 46.4
- Non Oil GDP 4.3 4.0
Graph 1: Gross Domestic Product at Constant Prices (2015=100), 2010 to 2015 (millions of US dollars)
0
500
1000
1500
2000
2500
3000
3500
4000
4500
2010 2011 2012 2013 2014 2015
TL GDP - Oil GDP - Non Oil GDP
Timor-Leste's National Accounts 2010-2015 December 2016
General Directorate of Statistics (GDS) Page VII
Key Points
Total Gross Domestic Product (GDP) in current prices for Timor-Leste in 2015 was $3,102 million. Of this:
o The oil industry accounted for $1,496 million (48.2% of total GDP).
o The non-oil industry accounted for $1,607 million (51.8% of total GDP).
The GDP per capita in current prices was $2,619 in 2015. Of this:
o The oil industry provided $1,262 o The non-oil industry contributed
with $1,356 ($1,254 in 2014)
In constant prices, total GDP rose in 2015 by 20.9% (compared with negative growth of 26.0% in 2014) of which:
The Oil sector rose by 46.4% in 2015 (in contrast to the negative growth of 48.6% in 2014). Volumes extracted in the Oil sector were considerably higher than those of 2014 (13.8% in Oil Output). The increase in the Oil sector was mainly as a recovery from the fall in 2014 ( -26.8%) in a context where intermediate consumption decreased by 19.6%, mainly by the Upstream Operative Costs, in contrast with the big increase in 2014 (+34.1%)
The Non-oil sector grew by 4.0% in 2015 compared with 4.3%2 in 2014. This recovery was result of the increase of consumption and investment of the private sector (3.9% in constant terms).
2 Reviewed value, given the benchmarking and
rebasing compilation process. See Technical Note.
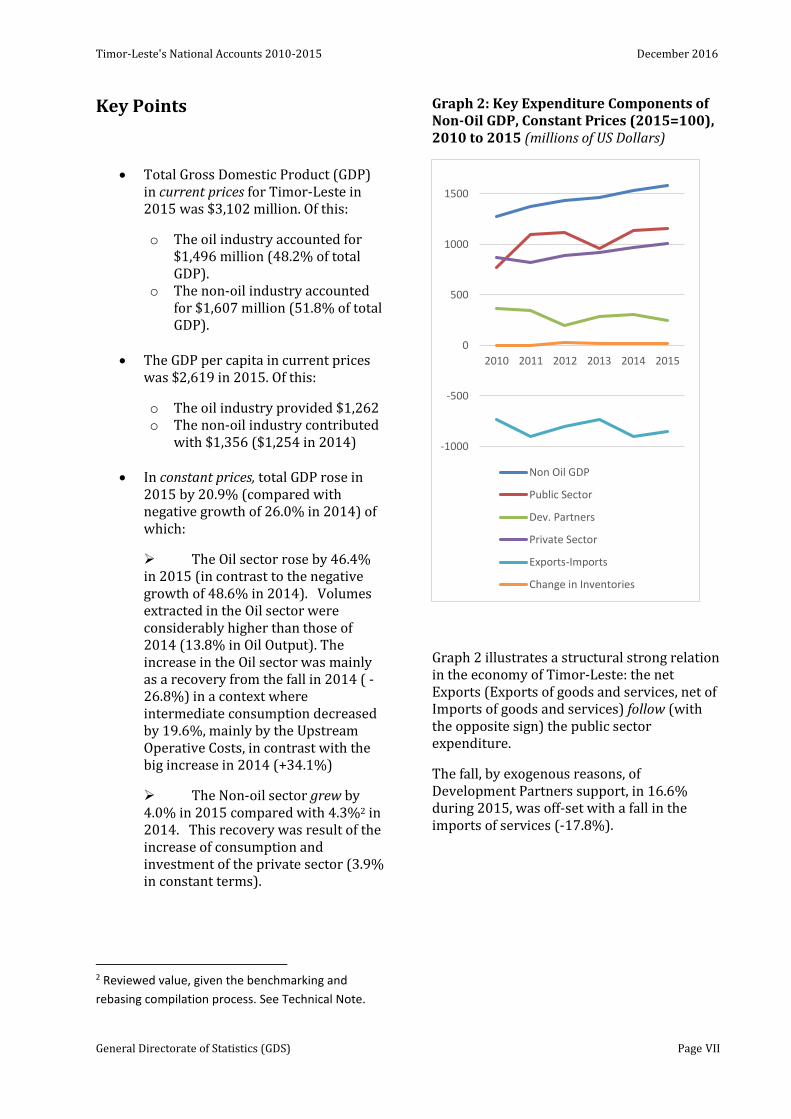
Graph 2: Key Expenditure Components of Non-Oil GDP, Constant Prices (2015=100), 2010 to 2015 (millions of US Dollars)
Graph 2 illustrates a structural strong relation in the economy of Timor-Leste: the net Exports (Exports of goods and services, net of Imports of goods and services) follow (with the opposite sign) the public sector expenditure.
The fall, by exogenous reasons, of Development Partners support, in 16.6% during 2015, was off-set with a fall in the imports of services (-17.8%).
-1000
-500
0
500
1000
1500
2010 2011 2012 2013 2014 2015
Non Oil GDP
Public Sector
Dev. Partners
Private Sector
Exports-Imports
Change in Inventories
Timor-Leste's National Accounts 2010-2015 December 2016
General Directorate of Statistics (GDS) Page VIII
Non-Oil GDP Components in 2015
Non-Oil GDP in constant prices, by the expenditure approach, grew by 4.0% in 2015, compared with a 4.3% growth in 2014.
Non-Oil GDP production approach at factor cost, or Gross Value Added3, grew +6.0% in 2015 (4.5% in 2014). But, at constant prices, the Non-Oil GDP production approach, at market prices, grew +4.2% in 2015, compared to a growth rate of +4.4% in 20144, according to the reviewed registers. The difference in growth at factor cost and at market prices is due to the fact that the Tax less Subsidies contribution to GDP at market prices declined, given the rise of the Electricity subsidy between 2014 and 2015 at constant prices (2015=100).
Expenditure Approach. Annually
Table II shows the growth rates of the expenditures from the public sector, the private sector, development partners and from the external sector.
3 GDP production less [Taxes less Subsidies on
Products]
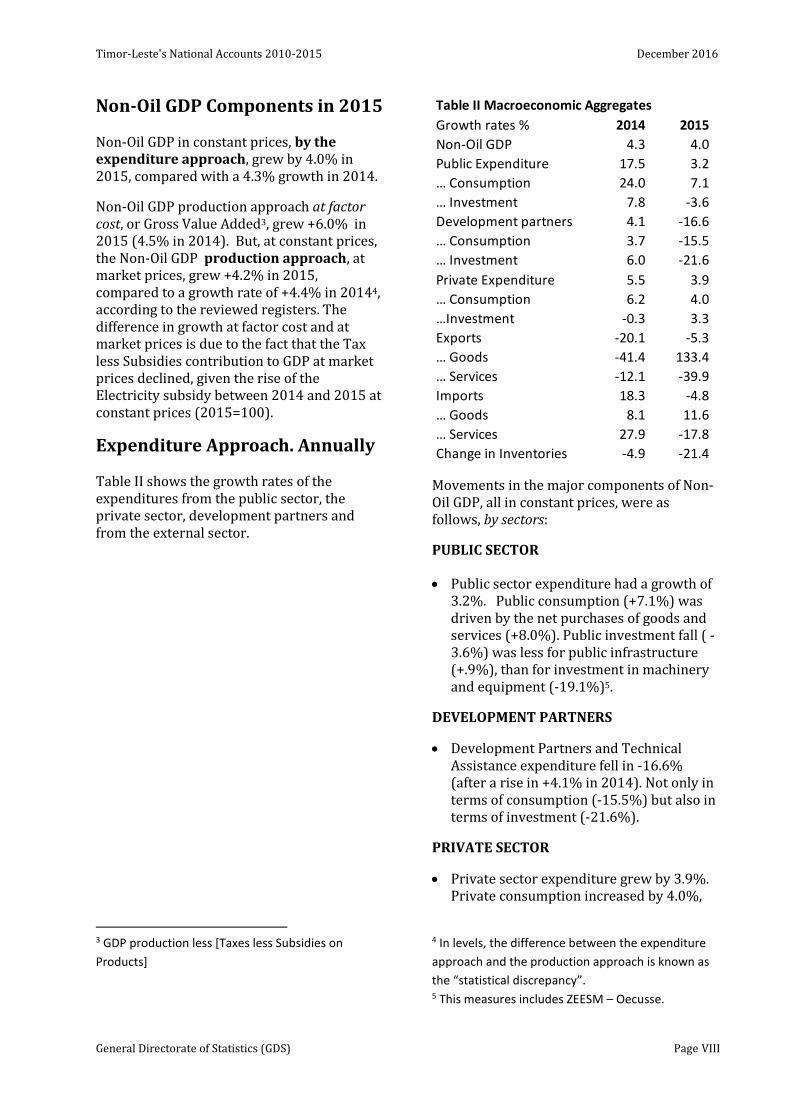
Table II Macroeconomic Aggregates
Growth rates % 2014 2015
Non-Oil GDP 4.3 4.0
Public Expenditure 17.5 3.2
… Consumption 24.0 7.1
… Investment 7.8 -3.6
Development partners 4.1 -16.6
… Consumption 3.7 -15.5
… Investment 6.0 -21.6
Private Expenditure 5.5 3.9
… Consumption 6.2 4.0
…Investment -0.3 3.3
Exports -20.1 -5.3
… Goods -41.4 133.4
… Services -12.1 -39.9
Imports 18.3 -4.8
… Goods 8.1 11.6
… Services 27.9 -17.8
Change in Inventories -4.9 -21.4
Movements in the major components of Non-Oil GDP, all in constant prices, were as follows, by sectors:
PUBLIC SECTOR
Public sector expenditure had a growth of 3.2%. Public consumption (+7.1%) was driven by the net purchases of goods and services (+8.0%). Public investment fall ( -3.6%) was less for public infrastructure (+.9%), than for investment in machinery and equipment (-19.1%)5.
DEVELOPMENT PARTNERS
Development Partners and Technical Assistance expenditure fell in -16.6% (after a rise in +4.1% in 2014). Not only in terms of consumption (-15.5%) but also in terms of investment (-21.6%).
PRIVATE SECTOR
Private sector expenditure grew by 3.9%. Private consumption increased by 4.0%,
4 In levels, the difference between the expenditure
approach and the production approach is known as
the “statistical discrepancy”. 5 This measures includes ZEESM – Oecusse.
Timor-Leste's National Accounts 2010-2015 December 2016
General Directorate of Statistics (GDS) Page IX
and by 3.7% in its domestic concept, mainly in services (+14.7%). In 2015, Private investment increased by 3.3%, less through the private corporation, whose investment virtually have not changed (+0.6%), and more through households increasing their investment in housing, in + 13.4%.
CHANGE IN INVENTORIES
The Change in Inventories fell from $21 to $17 USD million in 2015. Basically for lower inventories in rice, given the fall in local production.
EXPORTS AND IMPORTS
The Exports of Goods and Services declined -5.3%, mainly by Services. The exports of goods (+133.4%) increased because Coffee exports rose from 10.1 thousands of tons in 2014 to 23.8 thousands of tons in 2015.
Finally, imports of goods and services decreased (-5.2%). In the case of goods (+11.6%) the imports were led by mineral products (fuel) with +43.1%, and +34.6 in Electrical Machinery, given the fall in the years 2013 and 2014. The import of services decreased -18.2%, associated with the fall in public investment and development partner’s contributions.
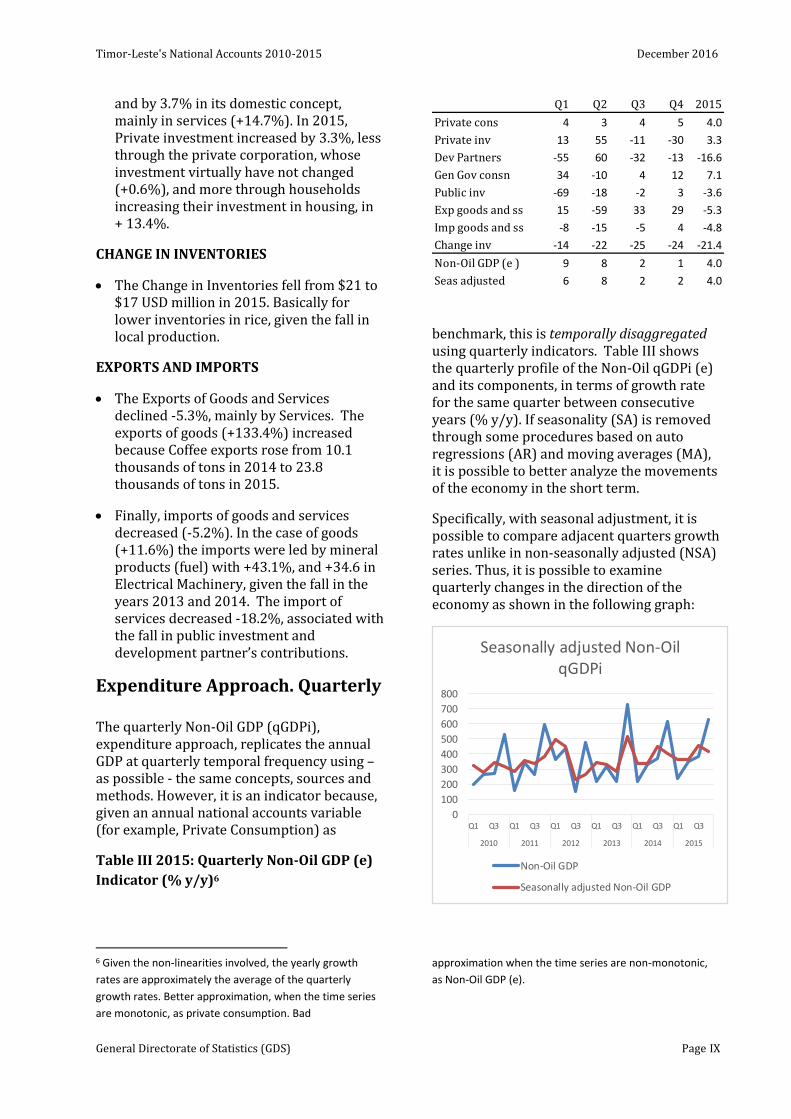
Expenditure Approach. Quarterly
The quarterly Non-Oil GDP (qGDPi), expenditure approach, replicates the annual GDP at quarterly temporal frequency using –as possible - the same concepts, sources and methods. However, it is an indicator because, given an annual national accounts variable (for example, Private Consumption) as
Table III 2015: Quarterly Non-Oil GDP (e)
Indicator (% y/y)6
6 Given the non-linearities involved, the yearly growth
rates are approximately the average of the quarterly
growth rates. Better approximation, when the time series
are monotonic, as private consumption. Bad
Q1 Q2 Q3 Q4 2015
Private cons 4 3 4 5 4.0
Private inv 13 55 -11 -30 3.3
Dev Partners -55 60 -32 -13 -16.6
Gen Gov consn 34 -10 4 12 7.1
Public inv -69 -18 -2 3 -3.6
Exp goods and ss 15 -59 33 29 -5.3
Imp goods and ss -8 -15 -5 4 -4.8
Change inv -14 -22 -25 -24 -21.4
Non-Oil GDP (e ) 9 8 2 1 4.0
Seas adjusted 6 8 2 2 4.0
benchmark, this is temporally disaggregated using quarterly indicators. Table III shows the quarterly profile of the Non-Oil qGDPi (e) and its components, in terms of growth rate for the same quarter between consecutive years (% y/y). If seasonality (SA) is removed through some procedures based on auto regressions (AR) and moving averages (MA), it is possible to better analyze the movements of the economy in the short term.
Specifically, with seasonal adjustment, it is possible to compare adjacent quarters growth rates unlike in non-seasonally adjusted (NSA) series. Thus, it is possible to examine quarterly changes in the direction of the economy as shown in the following graph:
0
100
200
300
400
500
600
700
800
Q1 Q3 Q1 Q3 Q1 Q3 Q1 Q3 Q1 Q3 Q1 Q3
2010 2011 2012 2013 2014 2015
Seasonally adjusted Non-Oil qGDPi
Non-Oil GDP
Seasonally adjusted Non-Oil GDP
approximation when the time series are non-monotonic,
as Non-Oil GDP (e).
Timor-Leste's National Accounts 2010-2015 December 2016
General Directorate of Statistics (GDS) Page X
In this case, the difference between the
original series and the seasonally adjusted
series is due to seasonal factors7, and the
seasonally adjusted series reflects the trend-
cycle and the irregular factors. Given that the
seasonal factors are identified inside the year,
then the year growth rate (4.0%) does not
change. Only the quarterly % q/q growth
rates change.
Production Approach
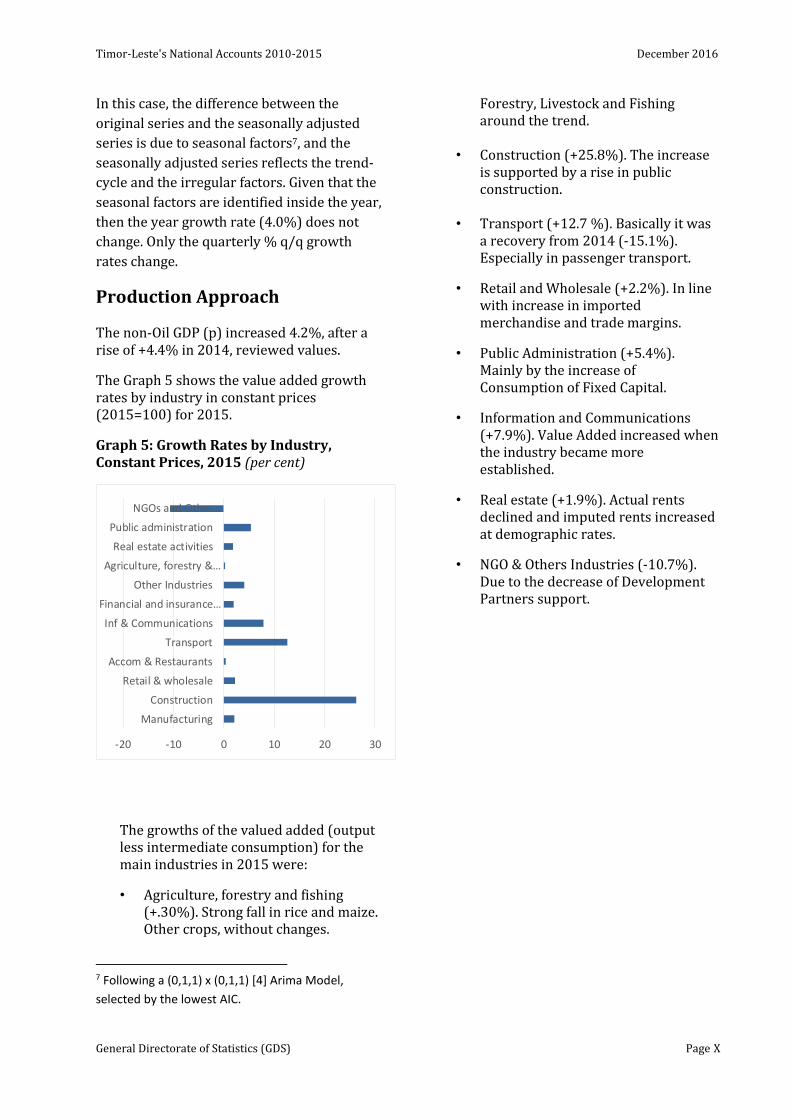
The non-Oil GDP (p) increased 4.2%, after a rise of +4.4% in 2014, reviewed values.
The Graph 5 shows the value added growth rates by industry in constant prices (2015=100) for 2015.
Graph 5: Growth Rates by Industry, Constant Prices, 2015 (per cent)
-20 -10 0 10 20 30
Manufacturing
Construction
Retail & wholesale
Accom & Restaurants
Transport
Inf & Communications
Financial and insurance…
Other Industries
Agriculture, forestry &…
Real estate activities
Public administration
NGOs and Other…
The growths of the valued added (output less intermediate consumption) for the main industries in 2015 were:
• Agriculture, forestry and fishing (+.30%). Strong fall in rice and maize. Other crops, without changes.
7 Following a (0,1,1) x (0,1,1) [4] Arima Model,
selected by the lowest AIC.
Forestry, Livestock and Fishing around the trend.
• Construction (+25.8%). The increase is supported by a rise in public construction.
• Transport (+12.7 %). Basically it was a recovery from 2014 (-15.1%). Especially in passenger transport.
• Retail and Wholesale (+2.2%). In line with increase in imported merchandise and trade margins.
• Public Administration (+5.4%). Mainly by the increase of Consumption of Fixed Capital.
• Information and Communications (+7.9%). Value Added increased when the industry became more established.
• Real estate (+1.9%). Actual rents declined and imputed rents increased at demographic rates.
• NGO & Others Industries (-10.7%). Due to the decrease of Development Partners support.
Timor-Leste's National Accounts 2010-2015 December 2016
General Directorate of Statistics (GDS) Page XI
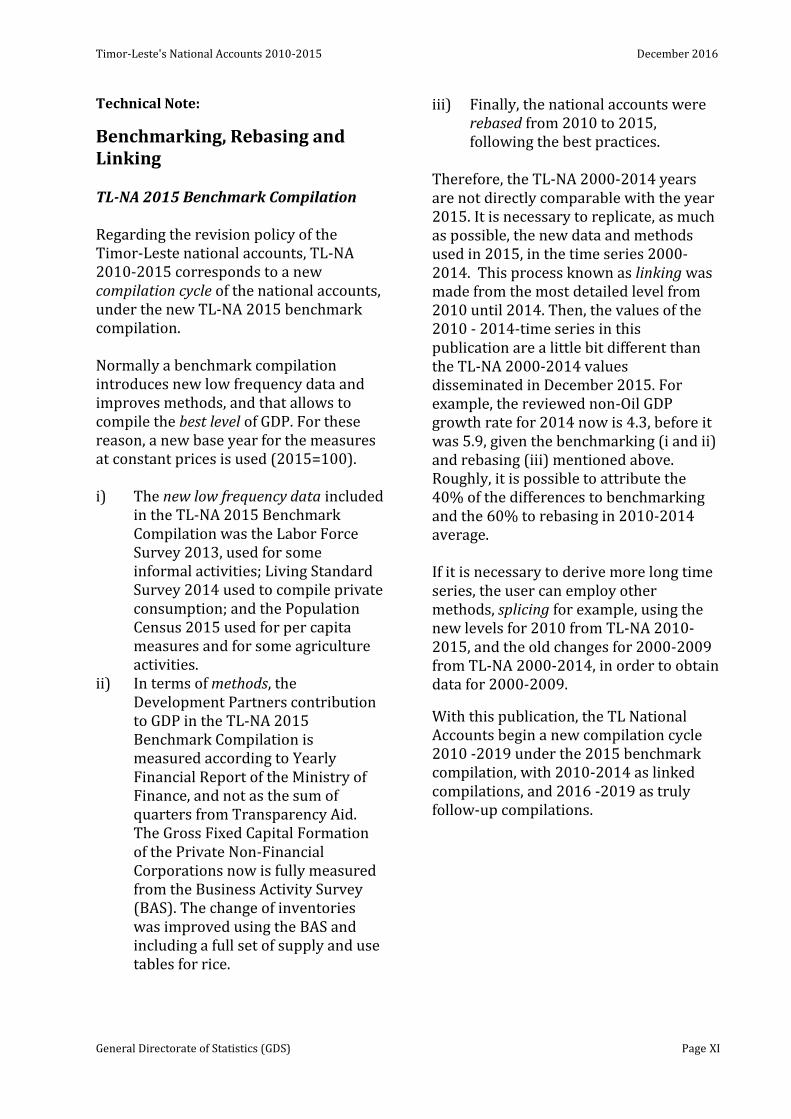
Technical Note:
Benchmarking, Rebasing and Linking
TL-NA 2015 Benchmark Compilation
Regarding the revision policy of the Timor-Leste national accounts, TL-NA 2010-2015 corresponds to a new compilation cycle of the national accounts, under the new TL-NA 2015 benchmark compilation.
Normally a benchmark compilation introduces new low frequency data and improves methods, and that allows to compile the best level of GDP. For these reason, a new base year for the measures at constant prices is used (2015=100).
i) The new low frequency data included in the TL-NA 2015 Benchmark Compilation was the Labor Force Survey 2013, used for some informal activities; Living Standard Survey 2014 used to compile private consumption; and the Population Census 2015 used for per capita measures and for some agriculture activities.
ii) In terms of methods, the Development Partners contribution to GDP in the TL-NA 2015 Benchmark Compilation is measured according to Yearly Financial Report of the Ministry of Finance, and not as the sum of quarters from Transparency Aid. The Gross Fixed Capital Formation of the Private Non-Financial Corporations now is fully measured from the Business Activity Survey (BAS). The change of inventories was improved using the BAS and including a full set of supply and use tables for rice.
iii) Finally, the national accounts were rebased from 2010 to 2015, following the best practices.
Therefore, the TL-NA 2000-2014 years are not directly comparable with the year 2015. It is necessary to replicate, as much as possible, the new data and methods used in 2015, in the time series 2000-2014. This process known as linking was made from the most detailed level from 2010 until 2014. Then, the values of the 2010 - 2014-time series in this publication are a little bit different than the TL-NA 2000-2014 values disseminated in December 2015. For example, the reviewed non-Oil GDP growth rate for 2014 now is 4.3, before it was 5.9, given the benchmarking (i and ii) and rebasing (iii) mentioned above. Roughly, it is possible to attribute the 40% of the differences to benchmarking and the 60% to rebasing in 2010-2014 average.
If it is necessary to derive more long time series, the user can employ other methods, splicing for example, using the new levels for 2010 from TL-NA 2010-2015, and the old changes for 2000-2009 from TL-NA 2000-2014, in order to obtain data for 2000-2009.
With this publication, the TL National Accounts begin a new compilation cycle 2010 -2019 under the 2015 benchmark compilation, with 2010-2014 as linked compilations, and 2016 -2019 as truly follow-up compilations.
Timor-Leste's National Accounts 2010 – 2015 December 2016
General Directorate of Statistics (GDS) Page XII
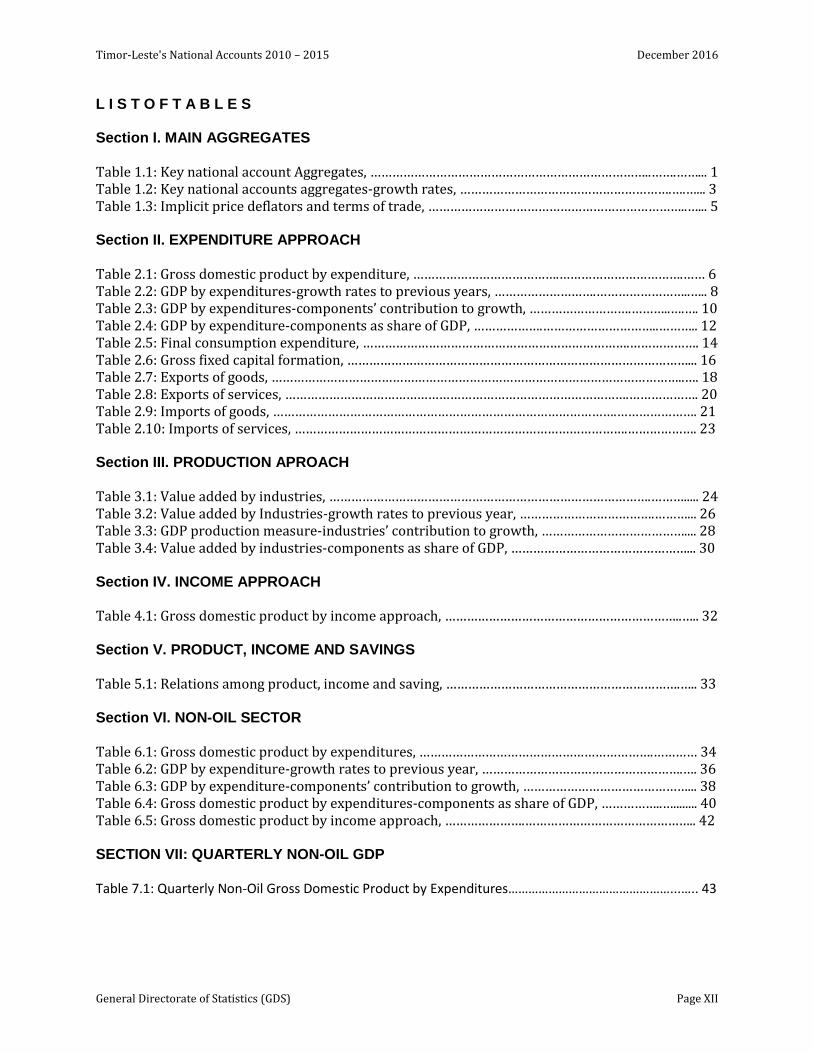
L I S T O F T A B L E S Section I. MAIN AGGREGATES
Table 1.1: Key national account Aggregates, …………………………………………………………………..…….……... 1 Table 1.2: Key national accounts aggregates-growth rates, ………………………………………………….….…... 3 Table 1.3: Implicit price deflators and terms of trade, ……………………………………………………………..…... 5 Section II. EXPENDITURE APPROACH
Table 2.1: Gross domestic product by expenditure, ………………………………….…………………………….…… 6 Table 2.2: GDP by expenditures-growth rates to previous years, ……………………….……………………..….. 8 Table 2.3: GDP by expenditures-components’ contribution to growth, ……………………….………..….…. 10 Table 2.4: GDP by expenditure-components as share of GDP, ……………….…………………………..……….. 12 Table 2.5: Final consumption expenditure, ……………………………………………………………….………………. 14 Table 2.6: Gross fixed capital formation, …………………………………………………………………………………... 16 Table 2.7: Exports of goods, …………………………………………………………………………………………………..…. 18 Table 2.8: Exports of services, ………………………………………………………………………………….………………. 20 Table 2.9: Imports of goods, ………………………………………………………………………………….…………………. 21 Table 2.10: Imports of services, ……………………………………………………………………………….………………. 23 Section III. PRODUCTION APROACH
Table 3.1: Value added by industries, …………………………………………………………………………….………..... 24 Table 3.2: Value added by Industries-growth rates to previous year, ……………………………….………... 26 Table 3.3: GDP production measure-industries’ contribution to growth, ………………………………….... 28 Table 3.4: Value added by industries-components as share of GDP, …………………………………………... 30 Section IV. INCOME APPROACH
Table 4.1: Gross domestic product by income approach, ………………………………………………………..….. 32 Section V. PRODUCT, INCOME AND SAVINGS
Table 5.1: Relations among product, income and saving, ……………………………………………………….….. 33 Section VI. NON-OIL SECTOR
Table 6.1: Gross domestic product by expenditures, ……………………………………………………….………… 34 Table 6.2: GDP by expenditure-growth rates to previous year, ……………………………………………….…. 36 Table 6.3: GDP by expenditure-components’ contribution to growth, ………………………………………... 38 Table 6.4: Gross domestic product by expenditures-components as share of GDP, ……………..…........ 40 Table 6.5: Gross domestic product by income approach, ………………….……………………………………….. 42 SECTION VII: QUARTERLY NON-OIL GDP
Table 7.1: Quarterly Non-Oil Gross Domestic Product by Expenditures…………………………………………...….. 43
Timor-Leste's National Accounts 2010 -2015, Statistics and Analysis December 2016
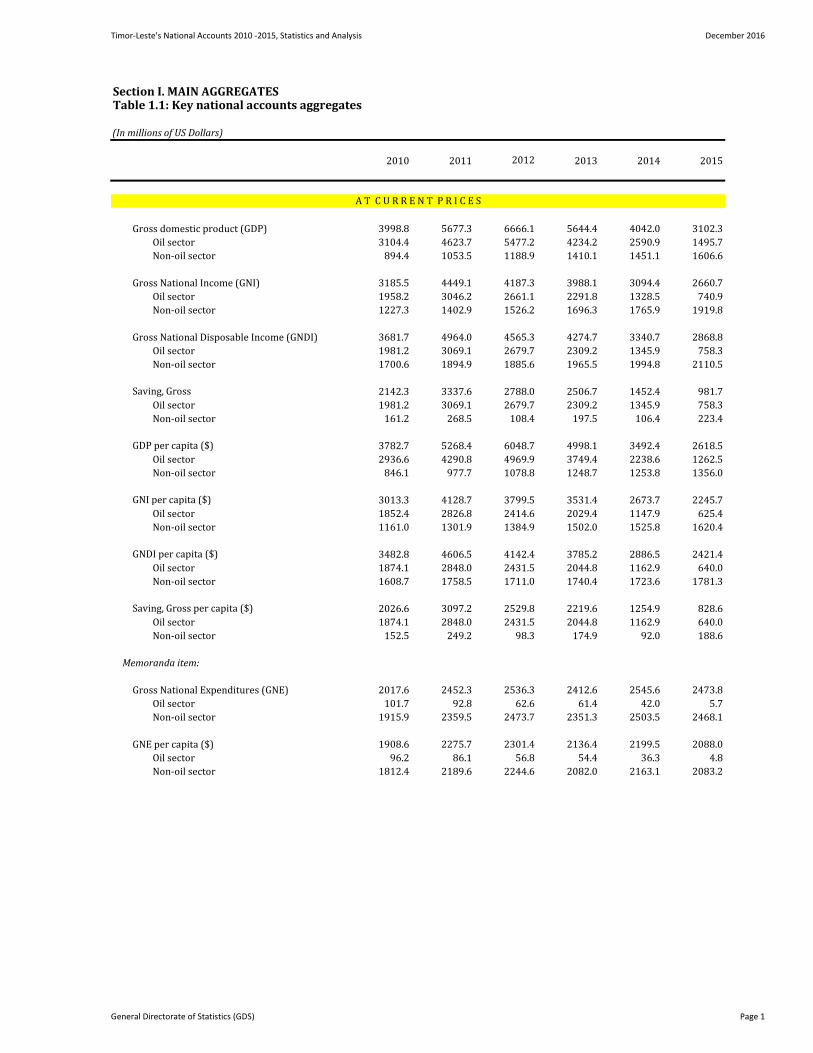
Section I. MAIN AGGREGATESTable 1.1: Key national accounts aggregates
(In millions of US Dollars)
2010 2011 2013 2014 2015
Gross domestic product (GDP) 3998.8 5677.3 6666.1 5644.4 4042.0 3102.3
Oil sector 3104.4 4623.7 5477.2 4234.2 2590.9 1495.7
Non-oil sector 894.4 1053.5 1188.9 1410.1 1451.1 1606.6
Gross National Income (GNI) 3185.5 4449.1 4187.3 3988.1 3094.4 2660.7
Oil sector 1958.2 3046.2 2661.1 2291.8 1328.5 740.9
Non-oil sector 1227.3 1402.9 1526.2 1696.3 1765.9 1919.8
Gross National Disposable Income (GNDI) 3681.7 4964.0 4565.3 4274.7 3340.7 2868.8
Oil sector 1981.2 3069.1 2679.7 2309.2 1345.9 758.3
Non-oil sector 1700.6 1894.9 1885.6 1965.5 1994.8 2110.5
Saving, Gross 2142.3 3337.6 2788.0 2506.7 1452.4 981.7
Oil sector 1981.2 3069.1 2679.7 2309.2 1345.9 758.3
Non-oil sector 161.2 268.5 108.4 197.5 106.4 223.4
GDP per capita ($) 3782.7 5268.4 6048.7 4998.1 3492.4 2618.5
Oil sector 2936.6 4290.8 4969.9 3749.4 2238.6 1262.5
Non-oil sector 846.1 977.7 1078.8 1248.7 1253.8 1356.0
GNI per capita ($) 3013.3 4128.7 3799.5 3531.4 2673.7 2245.7
Oil sector 1852.4 2826.8 2414.6 2029.4 1147.9 625.4
Non-oil sector 1161.0 1301.9 1384.9 1502.0 1525.8 1620.4
GNDI per capita ($) 3482.8 4606.5 4142.4 3785.2 2886.5 2421.4
Oil sector 1874.1 2848.0 2431.5 2044.8 1162.9 640.0
Non-oil sector 1608.7 1758.5 1711.0 1740.4 1723.6 1781.3
Saving, Gross per capita ($) 2026.6 3097.2 2529.8 2219.6 1254.9 828.6
Oil sector 1874.1 2848.0 2431.5 2044.8 1162.9 640.0
Non-oil sector 152.5 249.2 98.3 174.9 92.0 188.6
Memoranda item:
Gross National Expenditures (GNE) 2017.6 2452.3 2536.3 2412.6 2545.6 2473.8
Oil sector 101.7 92.8 62.6 61.4 42.0 5.7
Non-oil sector 1915.9 2359.5 2473.7 2351.3 2503.5 2468.1
GNE per capita ($) 1908.6 2275.7 2301.4 2136.4 2199.5 2088.0
Oil sector 96.2 86.1 56.8 54.4 36.3 4.8
Non-oil sector 1812.4 2189.6 2244.6 2082.0 2163.1 2083.2
2012
A T C U R R E N T P R I C E S
General Directorate of Statistics (GDS) Page 1
Timor-Leste's National Accounts 2010 -2015, Statistics and Analysis December 2016
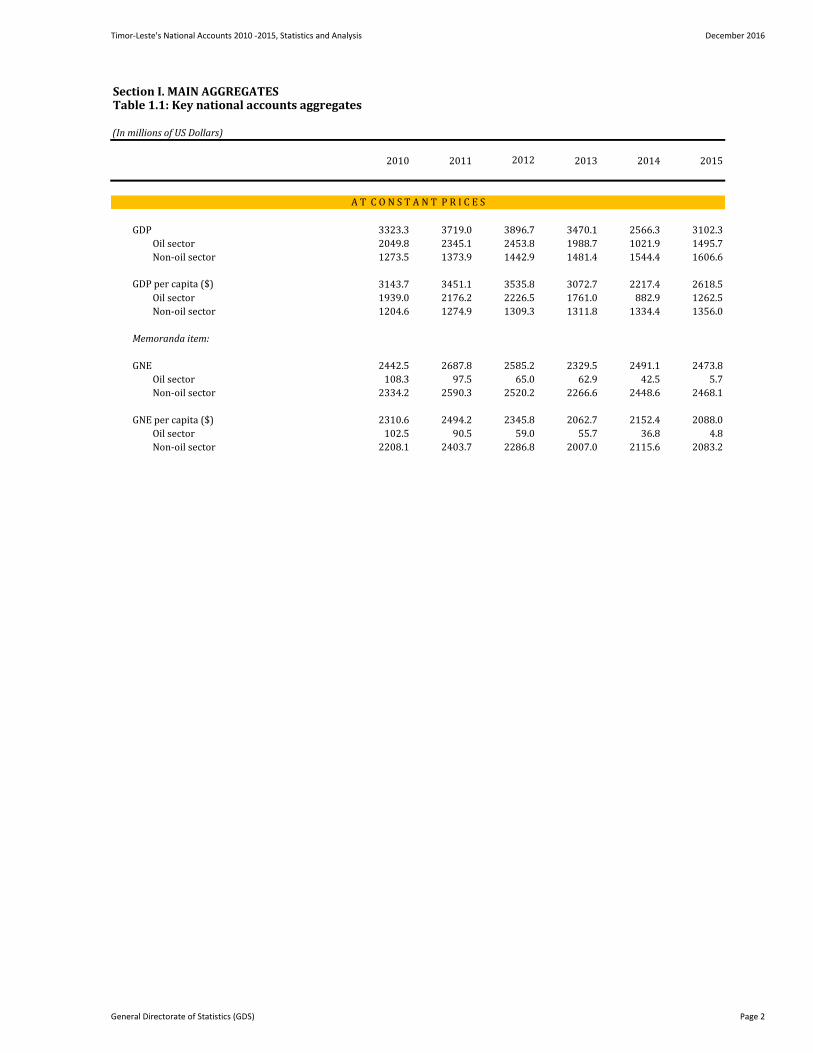
Section I. MAIN AGGREGATESTable 1.1: Key national accounts aggregates
(In millions of US Dollars)
2010 2011 2013 2014 20152012
GDP 3323.3 3719.0 3896.7 3470.1 2566.3 3102.3
Oil sector 2049.8 2345.1 2453.8 1988.7 1021.9 1495.7
Non-oil sector 1273.5 1373.9 1442.9 1481.4 1544.4 1606.6
GDP per capita ($) 3143.7 3451.1 3535.8 3072.7 2217.4 2618.5
Oil sector 1939.0 2176.2 2226.5 1761.0 882.9 1262.5
Non-oil sector 1204.6 1274.9 1309.3 1311.8 1334.4 1356.0
Memoranda item:
GNE 2442.5 2687.8 2585.2 2329.5 2491.1 2473.8
Oil sector 108.3 97.5 65.0 62.9 42.5 5.7
Non-oil sector 2334.2 2590.3 2520.2 2266.6 2448.6 2468.1
GNE per capita ($) 2310.6 2494.2 2345.8 2062.7 2152.4 2088.0
Oil sector 102.5 90.5 59.0 55.7 36.8 4.8
Non-oil sector 2208.1 2403.7 2286.8 2007.0 2115.6 2083.2
A T C O N S T A N T P R I C E S
General Directorate of Statistics (GDS) Page 2
Timor-Leste's National Accounts 2010 -2015, Statistics and Analysis December 2016
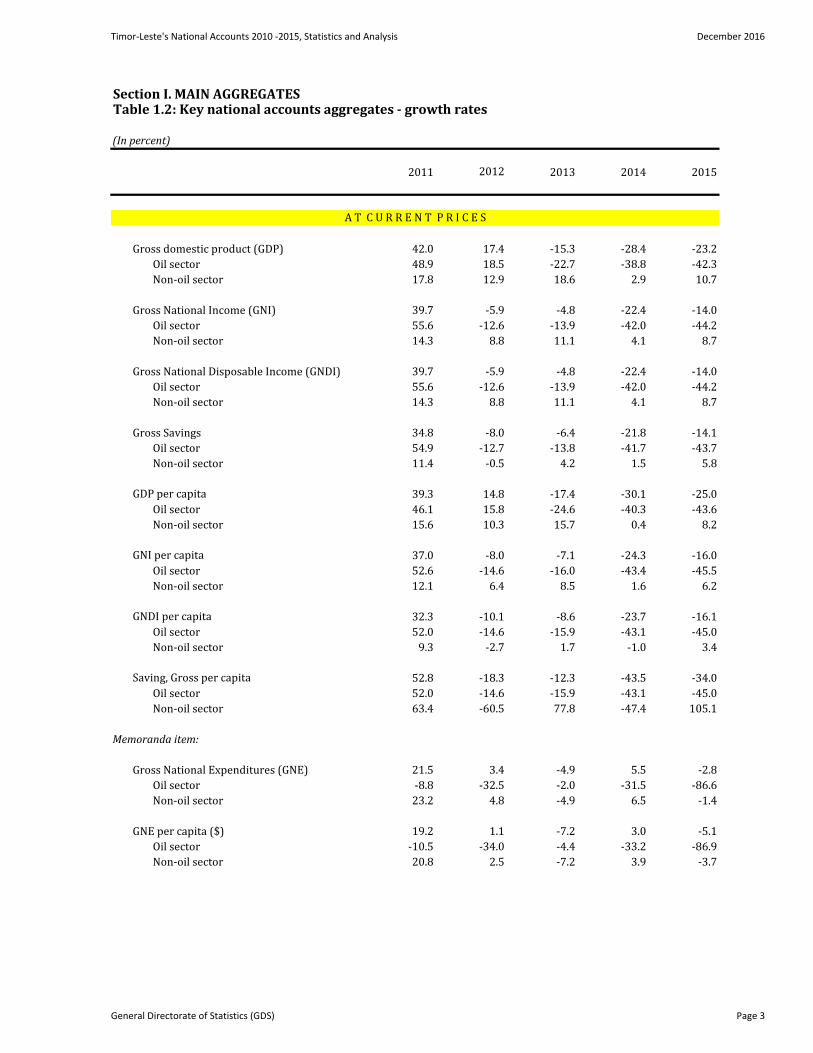
Section I. MAIN AGGREGATESTable 1.2: Key national accounts aggregates - growth rates
(In percent)
2011 2013 2014 2015
Gross domestic product (GDP) 42.0 17.4 -15.3 -28.4 -23.2
Oil sector 48.9 18.5 -22.7 -38.8 -42.3
Non-oil sector 17.8 12.9 18.6 2.9 10.7
Gross National Income (GNI) 39.7 -5.9 -4.8 -22.4 -14.0
Oil sector 55.6 -12.6 -13.9 -42.0 -44.2
Non-oil sector 14.3 8.8 11.1 4.1 8.7
Gross National Disposable Income (GNDI) 39.7 -5.9 -4.8 -22.4 -14.0
Oil sector 55.6 -12.6 -13.9 -42.0 -44.2
Non-oil sector 14.3 8.8 11.1 4.1 8.7
Gross Savings 34.8 -8.0 -6.4 -21.8 -14.1
Oil sector 54.9 -12.7 -13.8 -41.7 -43.7
Non-oil sector 11.4 -0.5 4.2 1.5 5.8
GDP per capita 39.3 14.8 -17.4 -30.1 -25.0
Oil sector 46.1 15.8 -24.6 -40.3 -43.6
Non-oil sector 15.6 10.3 15.7 0.4 8.2
GNI per capita 37.0 -8.0 -7.1 -24.3 -16.0
Oil sector 52.6 -14.6 -16.0 -43.4 -45.5
Non-oil sector 12.1 6.4 8.5 1.6 6.2
GNDI per capita 32.3 -10.1 -8.6 -23.7 -16.1
Oil sector 52.0 -14.6 -15.9 -43.1 -45.0
Non-oil sector 9.3 -2.7 1.7 -1.0 3.4
Saving, Gross per capita 52.8 -18.3 -12.3 -43.5 -34.0
Oil sector 52.0 -14.6 -15.9 -43.1 -45.0
Non-oil sector 63.4 -60.5 77.8 -47.4 105.1
Memoranda item:
Gross National Expenditures (GNE) 21.5 3.4 -4.9 5.5 -2.8
Oil sector -8.8 -32.5 -2.0 -31.5 -86.6
Non-oil sector 23.2 4.8 -4.9 6.5 -1.4
GNE per capita ($) 19.2 1.1 -7.2 3.0 -5.1
Oil sector -10.5 -34.0 -4.4 -33.2 -86.9
Non-oil sector 20.8 2.5 -7.2 3.9 -3.7
2012
A T C U R R E N T P R I C E S
General Directorate of Statistics (GDS) Page 3
Timor-Leste's National Accounts 2010 -2015, Statistics and Analysis December 2016
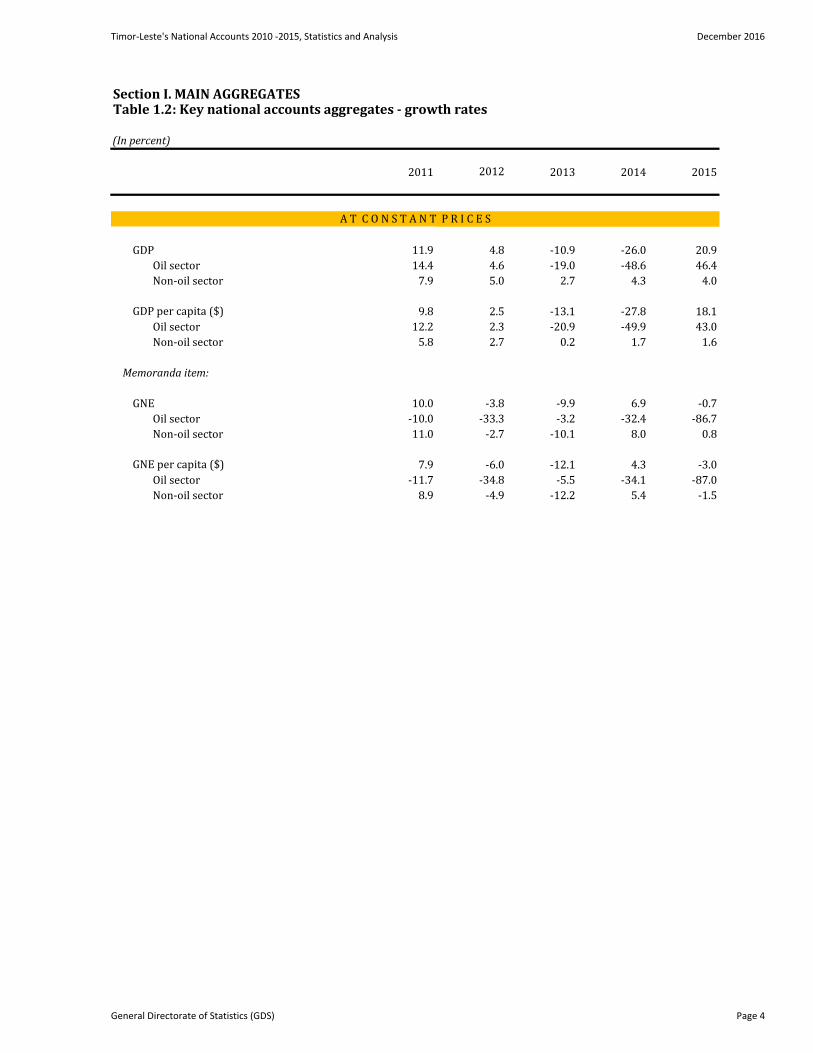
Section I. MAIN AGGREGATESTable 1.2: Key national accounts aggregates - growth rates
(In percent)
2011 2013 2014 20152012
GDP 11.9 4.8 -10.9 -26.0 20.9
Oil sector 14.4 4.6 -19.0 -48.6 46.4
Non-oil sector 7.9 5.0 2.7 4.3 4.0
GDP per capita ($) 9.8 2.5 -13.1 -27.8 18.1
Oil sector 12.2 2.3 -20.9 -49.9 43.0
Non-oil sector 5.8 2.7 0.2 1.7 1.6
Memoranda item:
GNE 10.0 -3.8 -9.9 6.9 -0.7
Oil sector -10.0 -33.3 -3.2 -32.4 -86.7
Non-oil sector 11.0 -2.7 -10.1 8.0 0.8
GNE per capita ($) 7.9 -6.0 -12.1 4.3 -3.0
Oil sector -11.7 -34.8 -5.5 -34.1 -87.0
Non-oil sector 8.9 -4.9 -12.2 5.4 -1.5
A T C O N S T A N T P R I C E S
General Directorate of Statistics (GDS) Page 4
Timor-Leste's National Accounts 2010 -2015, Statistics and Analysis December 2016
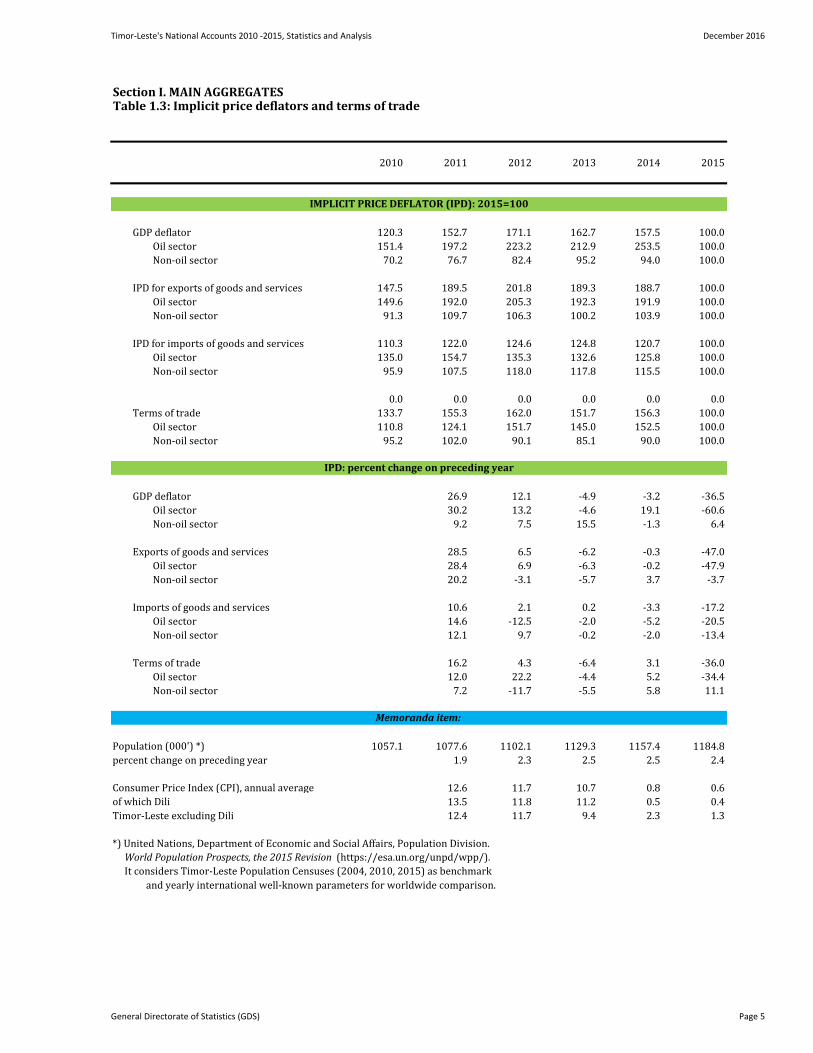
Section I. MAIN AGGREGATESTable 1.3: Implicit price deflators and terms of trade
2010 2011 2012 2013 2014 2015
GDP deflator 120.3 152.7 171.1 162.7 157.5 100.0
Oil sector 151.4 197.2 223.2 212.9 253.5 100.0
Non-oil sector 70.2 76.7 82.4 95.2 94.0 100.0
IPD for exports of goods and services 147.5 189.5 201.8 189.3 188.7 100.0
Oil sector 149.6 192.0 205.3 192.3 191.9 100.0
Non-oil sector 91.3 109.7 106.3 100.2 103.9 100.0
IPD for imports of goods and services 110.3 122.0 124.6 124.8 120.7 100.0
Oil sector 135.0 154.7 135.3 132.6 125.8 100.0
Non-oil sector 95.9 107.5 118.0 117.8 115.5 100.0
0.0 0.0 0.0 0.0 0.0 0.0
Terms of trade 133.7 155.3 162.0 151.7 156.3 100.0
Oil sector 110.8 124.1 151.7 145.0 152.5 100.0
Non-oil sector 95.2 102.0 90.1 85.1 90.0 100.0
GDP deflator 26.9 12.1 -4.9 -3.2 -36.5
Oil sector 30.2 13.2 -4.6 19.1 -60.6
Non-oil sector 9.2 7.5 15.5 -1.3 6.4
Exports of goods and services 28.5 6.5 -6.2 -0.3 -47.0
Oil sector 28.4 6.9 -6.3 -0.2 -47.9
Non-oil sector 20.2 -3.1 -5.7 3.7 -3.7
Imports of goods and services 10.6 2.1 0.2 -3.3 -17.2
Oil sector 14.6 -12.5 -2.0 -5.2 -20.5
Non-oil sector 12.1 9.7 -0.2 -2.0 -13.4
Terms of trade 16.2 4.3 -6.4 3.1 -36.0
Oil sector 12.0 22.2 -4.4 5.2 -34.4
Non-oil sector 7.2 -11.7 -5.5 5.8 11.1
Population (000') *) 1057.1 1077.6 1102.1 1129.3 1157.4 1184.8
percent change on preceding year 1.9 2.3 2.5 2.5 2.4
Consumer Price Index (CPI), annual average 12.6 11.7 10.7 0.8 0.6
of which Dili 13.5 11.8 11.2 0.5 0.4
Timor-Leste excluding Dili 12.4 11.7 9.4 2.3 1.3
*) United Nations, Department of Economic and Social Affairs, Population Division.
World Population Prospects, the 2015 Revision (https://esa.un.org/unpd/wpp/).
It considers Timor-Leste Population Censuses (2004, 2010, 2015) as benchmark
Memoranda item:
and yearly international well-known parameters for worldwide comparison.
IMPLICIT PRICE DEFLATOR (IPD): 2015=100
IPD: percent change on preceding year
General Directorate of Statistics (GDS) Page 5
Timor-Leste's National Accounts 2010 -2015 Statistics and Analysis December 2016
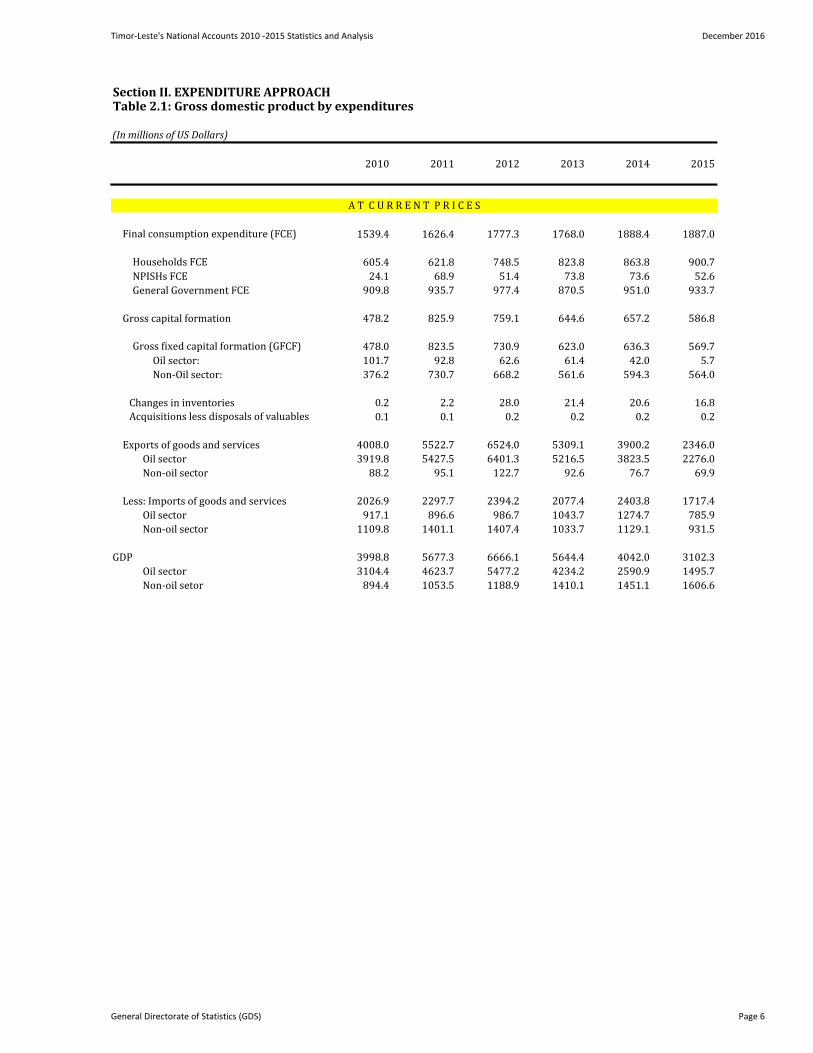
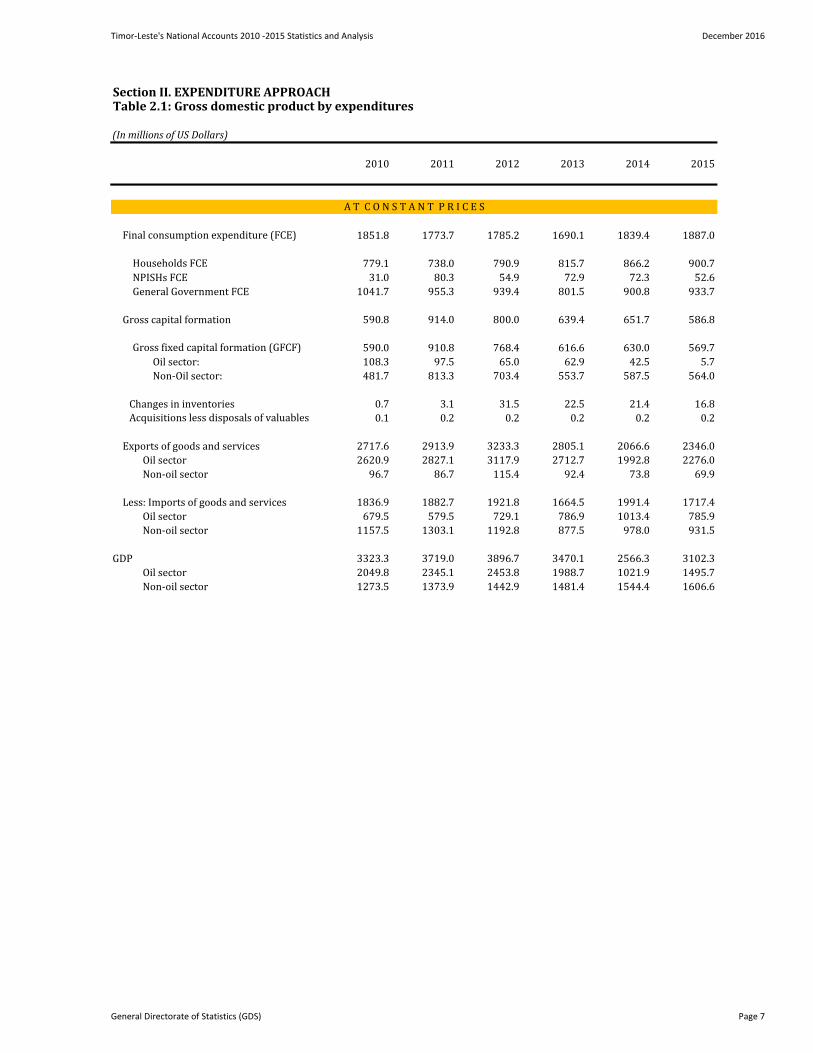
Section II. EXPENDITURE APPROACHTable 2.1: Gross domestic product by expenditures
(In millions of US Dollars)
2010 2011 2012 2013 2014 2015
Final consumption expenditure (FCE) 1539.4 1626.4 1777.3 1768.0 1888.4 1887.0
Households FCE 605.4 621.8 748.5 823.8 863.8 900.7
NPISHs FCE 24.1 68.9 51.4 73.8 73.6 52.6
General Government FCE 909.8 935.7 977.4 870.5 951.0 933.7
Gross capital formation 478.2 825.9 759.1 644.6 657.2 586.8
Gross fixed capital formation (GFCF) 478.0 823.5 730.9 623.0 636.3 569.7
Oil sector: 101.7 92.8 62.6 61.4 42.0 5.7
Non-Oil sector: 376.2 730.7 668.2 561.6 594.3 564.0
Changes in inventories 0.2 2.2 28.0 21.4 20.6 16.8
Acquisitions less disposals of valuables 0.1 0.1 0.2 0.2 0.2 0.2
Exports of goods and services 4008.0 5522.7 6524.0 5309.1 3900.2 2346.0
Oil sector 3919.8 5427.5 6401.3 5216.5 3823.5 2276.0
Non-oil sector 88.2 95.1 122.7 92.6 76.7 69.9
Less: Imports of goods and services 2026.9 2297.7 2394.2 2077.4 2403.8 1717.4
Oil sector 917.1 896.6 986.7 1043.7 1274.7 785.9
Non-oil sector 1109.8 1401.1 1407.4 1033.7 1129.1 931.5
GDP 3998.8 5677.3 6666.1 5644.4 4042.0 3102.3
Oil sector 3104.4 4623.7 5477.2 4234.2 2590.9 1495.7
Non-oil setor 894.4 1053.5 1188.9 1410.1 1451.1 1606.6
A T C U R R E N T P R I C E S
General Directorate of Statistics (GDS) Page 6
Timor-Leste's National Accounts 2010 -2015 Statistics and Analysis December 2016
Section II. EXPENDITURE APPROACHTable 2.1: Gross domestic product by expenditures
(In millions of US Dollars)
2010 2011 2012 2013 2014 2015
Final consumption expenditure (FCE) 1851.8 1773.7 1785.2 1690.1 1839.4 1887.0
Households FCE 779.1 738.0 790.9 815.7 866.2 900.7
NPISHs FCE 31.0 80.3 54.9 72.9 72.3 52.6
General Government FCE 1041.7 955.3 939.4 801.5 900.8 933.7
Gross capital formation 590.8 914.0 800.0 639.4 651.7 586.8
Gross fixed capital formation (GFCF) 590.0 910.8 768.4 616.6 630.0 569.7
Oil sector: 108.3 97.5 65.0 62.9 42.5 5.7
Non-Oil sector: 481.7 813.3 703.4 553.7 587.5 564.0
Changes in inventories 0.7 3.1 31.5 22.5 21.4 16.8
Acquisitions less disposals of valuables 0.1 0.2 0.2 0.2 0.2 0.2
Exports of goods and services 2717.6 2913.9 3233.3 2805.1 2066.6 2346.0
Oil sector 2620.9 2827.1 3117.9 2712.7 1992.8 2276.0
Non-oil sector 96.7 86.7 115.4 92.4 73.8 69.9
Less: Imports of goods and services 1836.9 1882.7 1921.8 1664.5 1991.4 1717.4
Oil sector 679.5 579.5 729.1 786.9 1013.4 785.9
Non-oil sector 1157.5 1303.1 1192.8 877.5 978.0 931.5
GDP 3323.3 3719.0 3896.7 3470.1 2566.3 3102.3
Oil sector 2049.8 2345.1 2453.8 1988.7 1021.9 1495.7
Non-oil sector 1273.5 1373.9 1442.9 1481.4 1544.4 1606.6
A T C O N S T A N T P R I C E S
General Directorate of Statistics (GDS) Page 7
Timor-Leste's National Accounts 2010 -2015, Statistics and Analysis December 2016
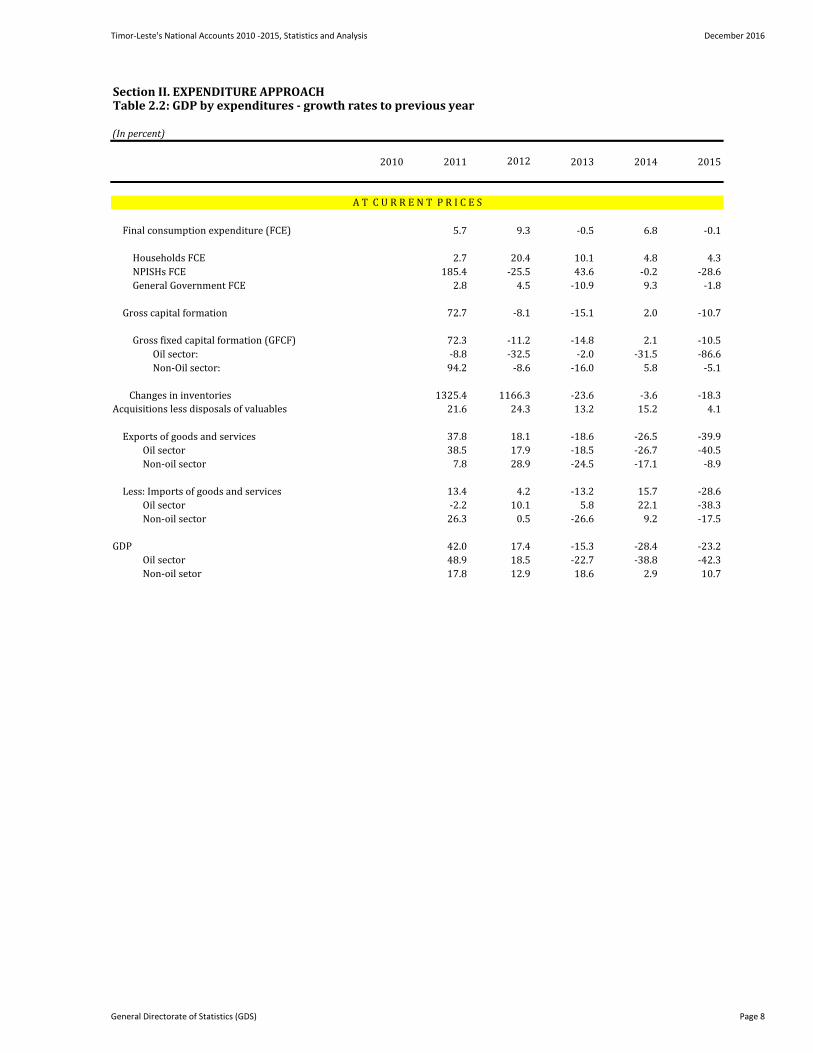
Section II. EXPENDITURE APPROACHTable 2.2: GDP by expenditures - growth rates to previous year
(In percent)
2010 2011 2013 2014 2015
Final consumption expenditure (FCE) 5.7 9.3 -0.5 6.8 -0.1
Households FCE 2.7 20.4 10.1 4.8 4.3
NPISHs FCE 185.4 -25.5 43.6 -0.2 -28.6
General Government FCE 2.8 4.5 -10.9 9.3 -1.8
Gross capital formation 72.7 -8.1 -15.1 2.0 -10.7
Gross fixed capital formation (GFCF) 72.3 -11.2 -14.8 2.1 -10.5
Oil sector: -8.8 -32.5 -2.0 -31.5 -86.6
Non-Oil sector: 94.2 -8.6 -16.0 5.8 -5.1
Changes in inventories 1325.4 1166.3 -23.6 -3.6 -18.3
Acquisitions less disposals of valuables 21.6 24.3 13.2 15.2 4.1
Exports of goods and services 37.8 18.1 -18.6 -26.5 -39.9
Oil sector 38.5 17.9 -18.5 -26.7 -40.5
Non-oil sector 7.8 28.9 -24.5 -17.1 -8.9
Less: Imports of goods and services 13.4 4.2 -13.2 15.7 -28.6
Oil sector -2.2 10.1 5.8 22.1 -38.3
Non-oil sector 26.3 0.5 -26.6 9.2 -17.5
GDP 42.0 17.4 -15.3 -28.4 -23.2
Oil sector 48.9 18.5 -22.7 -38.8 -42.3
Non-oil setor 17.8 12.9 18.6 2.9 10.7
2012
A T C U R R E N T P R I C E S
General Directorate of Statistics (GDS) Page 8
Timor-Leste's National Accounts 2010 -2015, Statistics and Analysis December 2016
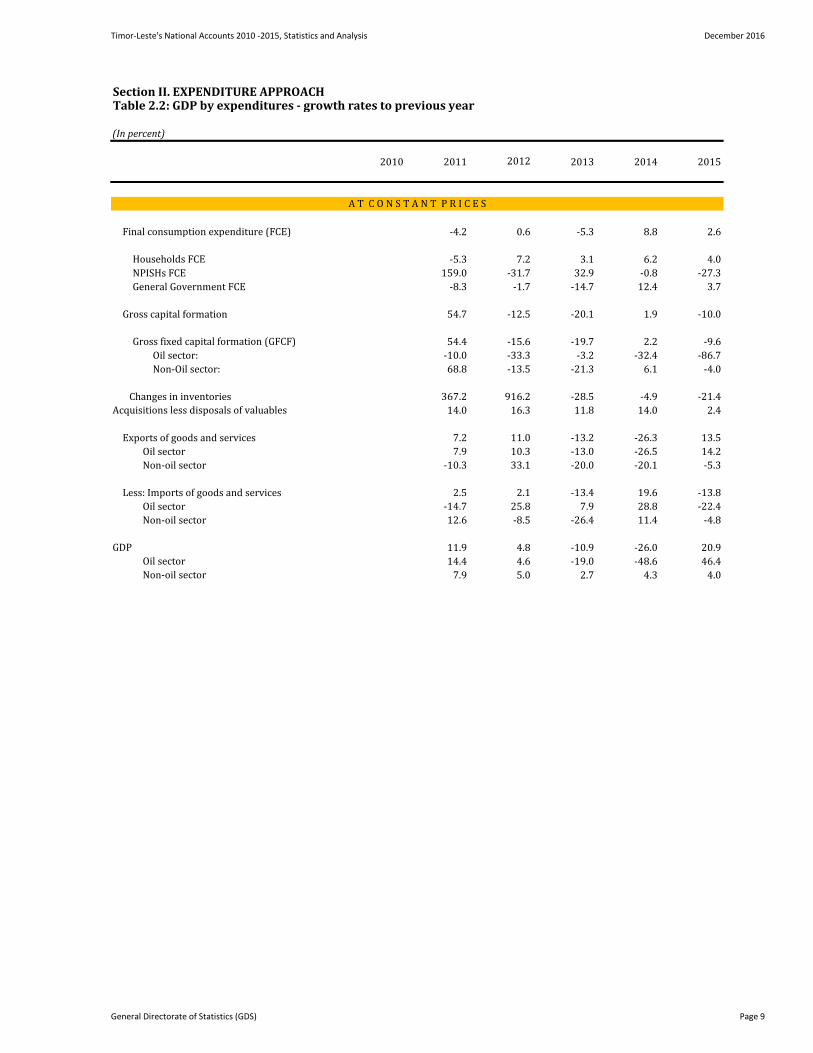
Section II. EXPENDITURE APPROACHTable 2.2: GDP by expenditures - growth rates to previous year
(In percent)
2010 2011 2013 2014 20152012
Final consumption expenditure (FCE) -4.2 0.6 -5.3 8.8 2.6
Households FCE -5.3 7.2 3.1 6.2 4.0
NPISHs FCE 159.0 -31.7 32.9 -0.8 -27.3
General Government FCE -8.3 -1.7 -14.7 12.4 3.7
Gross capital formation 54.7 -12.5 -20.1 1.9 -10.0
Gross fixed capital formation (GFCF) 54.4 -15.6 -19.7 2.2 -9.6
Oil sector: -10.0 -33.3 -3.2 -32.4 -86.7
Non-Oil sector: 68.8 -13.5 -21.3 6.1 -4.0
Changes in inventories 367.2 916.2 -28.5 -4.9 -21.4
Acquisitions less disposals of valuables 14.0 16.3 11.8 14.0 2.4
Exports of goods and services 7.2 11.0 -13.2 -26.3 13.5
Oil sector 7.9 10.3 -13.0 -26.5 14.2
Non-oil sector -10.3 33.1 -20.0 -20.1 -5.3
Less: Imports of goods and services 2.5 2.1 -13.4 19.6 -13.8
Oil sector -14.7 25.8 7.9 28.8 -22.4
Non-oil sector 12.6 -8.5 -26.4 11.4 -4.8
GDP 11.9 4.8 -10.9 -26.0 20.9
Oil sector 14.4 4.6 -19.0 -48.6 46.4
Non-oil sector 7.9 5.0 2.7 4.3 4.0
A T C O N S T A N T P R I C E S
General Directorate of Statistics (GDS) Page 9
Timor-Leste's National Accounts 2010 -2015, Statistics and Analysis December 2016
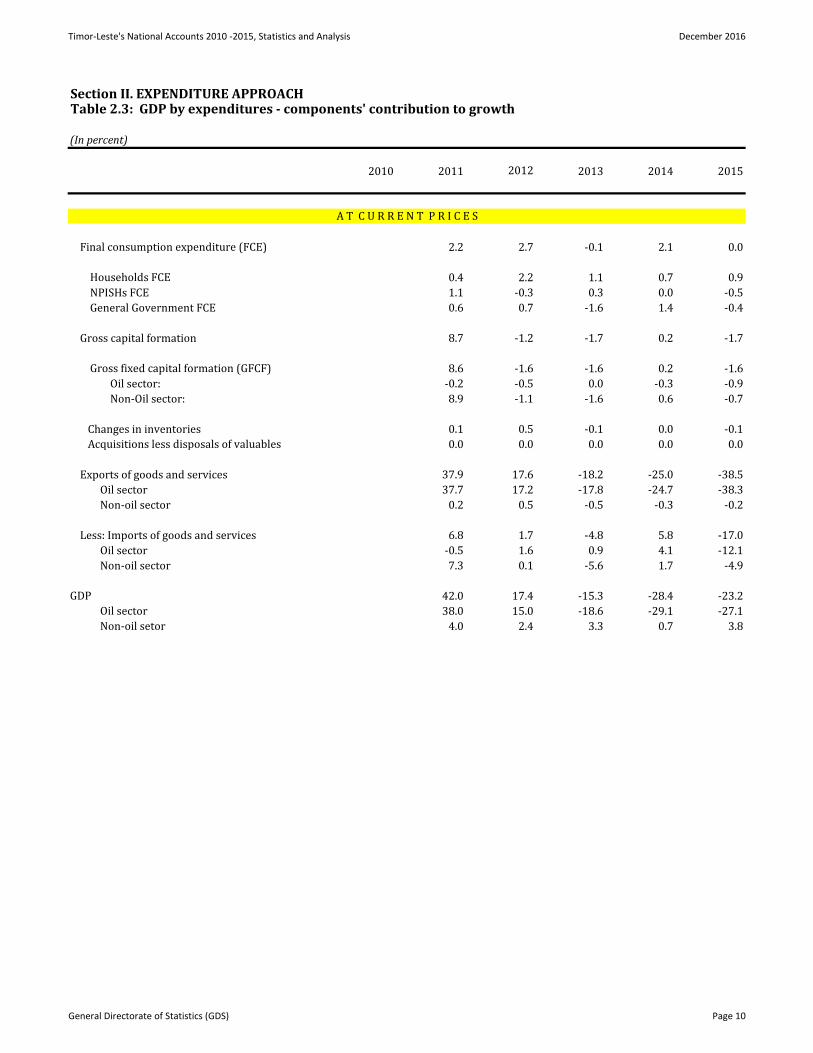
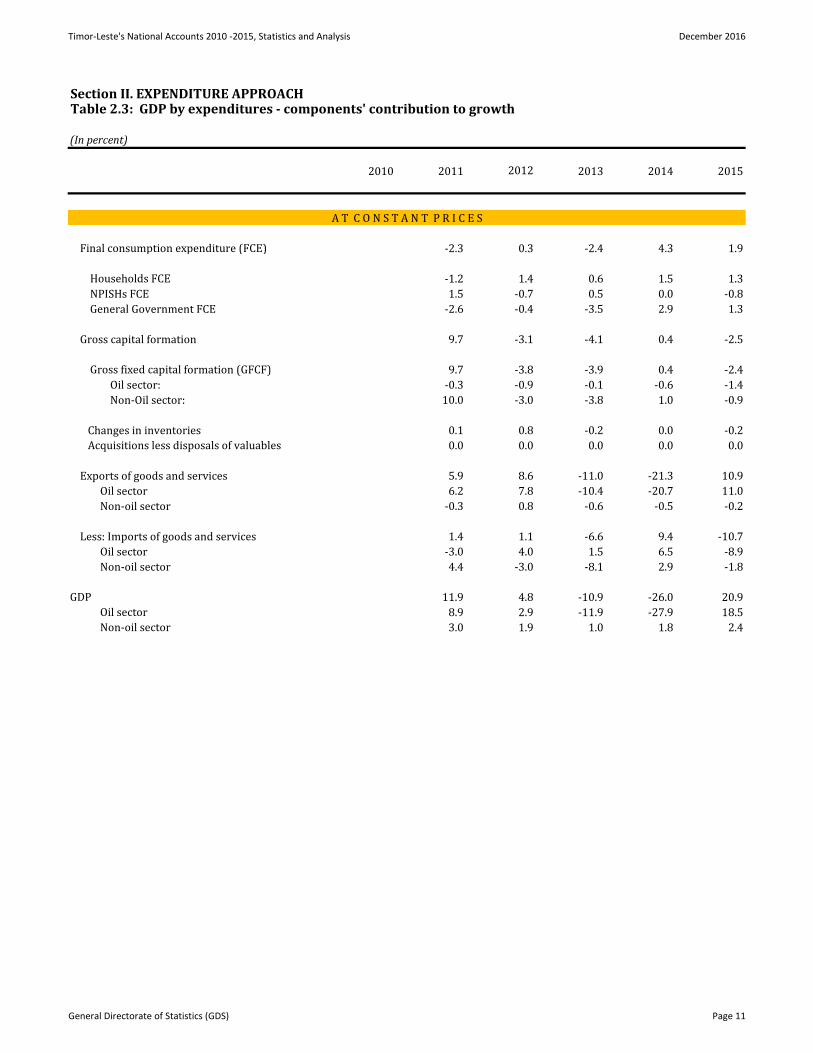
Section II. EXPENDITURE APPROACHTable 2.3: GDP by expenditures - components' contribution to growth
(In percent)
2010 2011 2013 2014 2015
Final consumption expenditure (FCE) 2.2 2.7 -0.1 2.1 0.0
Households FCE 0.4 2.2 1.1 0.7 0.9
NPISHs FCE 1.1 -0.3 0.3 0.0 -0.5
General Government FCE 0.6 0.7 -1.6 1.4 -0.4
Gross capital formation 8.7 -1.2 -1.7 0.2 -1.7
Gross fixed capital formation (GFCF) 8.6 -1.6 -1.6 0.2 -1.6
Oil sector: -0.2 -0.5 0.0 -0.3 -0.9
Non-Oil sector: 8.9 -1.1 -1.6 0.6 -0.7
Changes in inventories 0.1 0.5 -0.1 0.0 -0.1
Acquisitions less disposals of valuables 0.0 0.0 0.0 0.0 0.0
Exports of goods and services 37.9 17.6 -18.2 -25.0 -38.5
Oil sector 37.7 17.2 -17.8 -24.7 -38.3
Non-oil sector 0.2 0.5 -0.5 -0.3 -0.2
Less: Imports of goods and services 6.8 1.7 -4.8 5.8 -17.0
Oil sector -0.5 1.6 0.9 4.1 -12.1
Non-oil sector 7.3 0.1 -5.6 1.7 -4.9
GDP 42.0 17.4 -15.3 -28.4 -23.2
Oil sector 38.0 15.0 -18.6 -29.1 -27.1
Non-oil setor 4.0 2.4 3.3 0.7 3.8
2012
A T C U R R E N T P R I C E S
General Directorate of Statistics (GDS) Page 10
Timor-Leste's National Accounts 2010 -2015, Statistics and Analysis December 2016
Section II. EXPENDITURE APPROACHTable 2.3: GDP by expenditures - components' contribution to growth
(In percent)
2010 2011 2013 2014 20152012
Final consumption expenditure (FCE) -2.3 0.3 -2.4 4.3 1.9
Households FCE -1.2 1.4 0.6 1.5 1.3
NPISHs FCE 1.5 -0.7 0.5 0.0 -0.8
General Government FCE -2.6 -0.4 -3.5 2.9 1.3
Gross capital formation 9.7 -3.1 -4.1 0.4 -2.5
Gross fixed capital formation (GFCF) 9.7 -3.8 -3.9 0.4 -2.4
Oil sector: -0.3 -0.9 -0.1 -0.6 -1.4
Non-Oil sector: 10.0 -3.0 -3.8 1.0 -0.9
Changes in inventories 0.1 0.8 -0.2 0.0 -0.2
Acquisitions less disposals of valuables 0.0 0.0 0.0 0.0 0.0
Exports of goods and services 5.9 8.6 -11.0 -21.3 10.9
Oil sector 6.2 7.8 -10.4 -20.7 11.0
Non-oil sector -0.3 0.8 -0.6 -0.5 -0.2
Less: Imports of goods and services 1.4 1.1 -6.6 9.4 -10.7
Oil sector -3.0 4.0 1.5 6.5 -8.9
Non-oil sector 4.4 -3.0 -8.1 2.9 -1.8
GDP 11.9 4.8 -10.9 -26.0 20.9
Oil sector 8.9 2.9 -11.9 -27.9 18.5
Non-oil sector 3.0 1.9 1.0 1.8 2.4
A T C O N S T A N T P R I C E S
General Directorate of Statistics (GDS) Page 11
Timor-Leste's National Accounts 2010 -2015, Statistics and Analysis December 2016
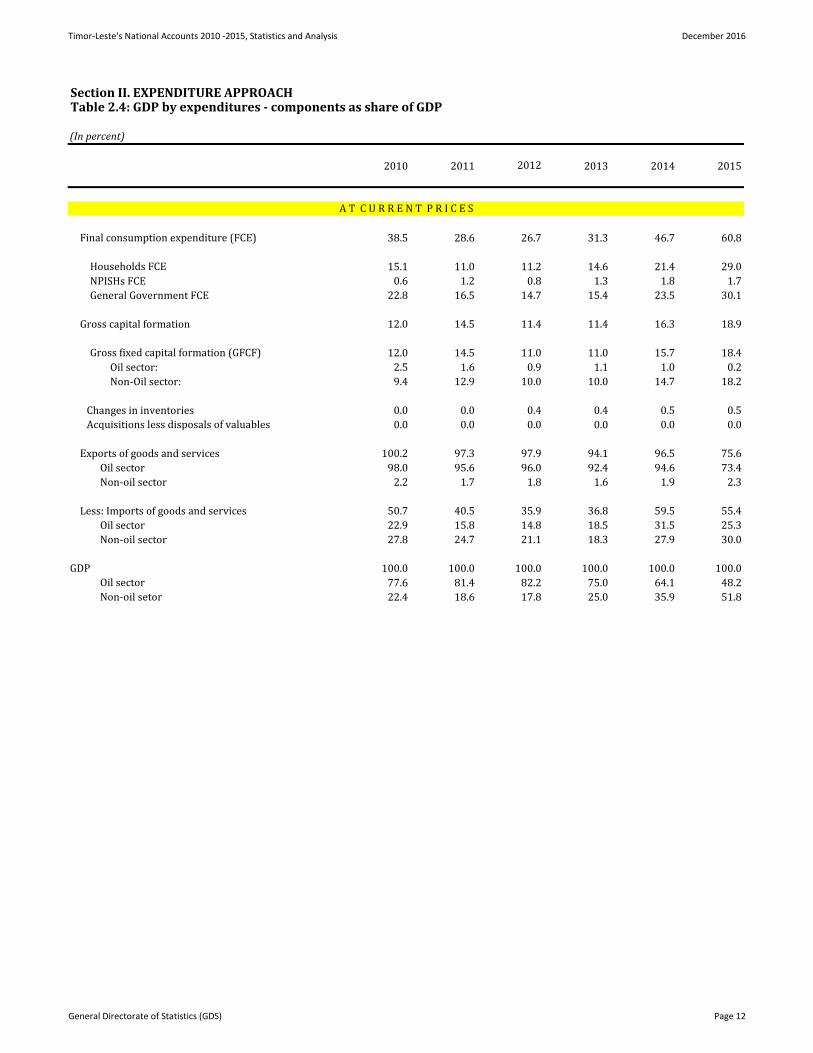
Section II. EXPENDITURE APPROACHTable 2.4: GDP by expenditures - components as share of GDP
(In percent)
2010 2011 2013 2014 2015
Final consumption expenditure (FCE) 38.5 28.6 26.7 31.3 46.7 60.8
Households FCE 15.1 11.0 11.2 14.6 21.4 29.0
NPISHs FCE 0.6 1.2 0.8 1.3 1.8 1.7
General Government FCE 22.8 16.5 14.7 15.4 23.5 30.1
Gross capital formation 12.0 14.5 11.4 11.4 16.3 18.9
Gross fixed capital formation (GFCF) 12.0 14.5 11.0 11.0 15.7 18.4
Oil sector: 2.5 1.6 0.9 1.1 1.0 0.2
Non-Oil sector: 9.4 12.9 10.0 10.0 14.7 18.2
Changes in inventories 0.0 0.0 0.4 0.4 0.5 0.5
Acquisitions less disposals of valuables 0.0 0.0 0.0 0.0 0.0 0.0
Exports of goods and services 100.2 97.3 97.9 94.1 96.5 75.6
Oil sector 98.0 95.6 96.0 92.4 94.6 73.4
Non-oil sector 2.2 1.7 1.8 1.6 1.9 2.3
Less: Imports of goods and services 50.7 40.5 35.9 36.8 59.5 55.4
Oil sector 22.9 15.8 14.8 18.5 31.5 25.3
Non-oil sector 27.8 24.7 21.1 18.3 27.9 30.0
GDP 100.0 100.0 100.0 100.0 100.0 100.0
Oil sector 77.6 81.4 82.2 75.0 64.1 48.2
Non-oil setor 22.4 18.6 17.8 25.0 35.9 51.8
2012
A T C U R R E N T P R I C E S
General Directorate of Statistics (GDS) Page 12
Timor-Leste's National Accounts 2010 -2015, Statistics and Analysis December 2016
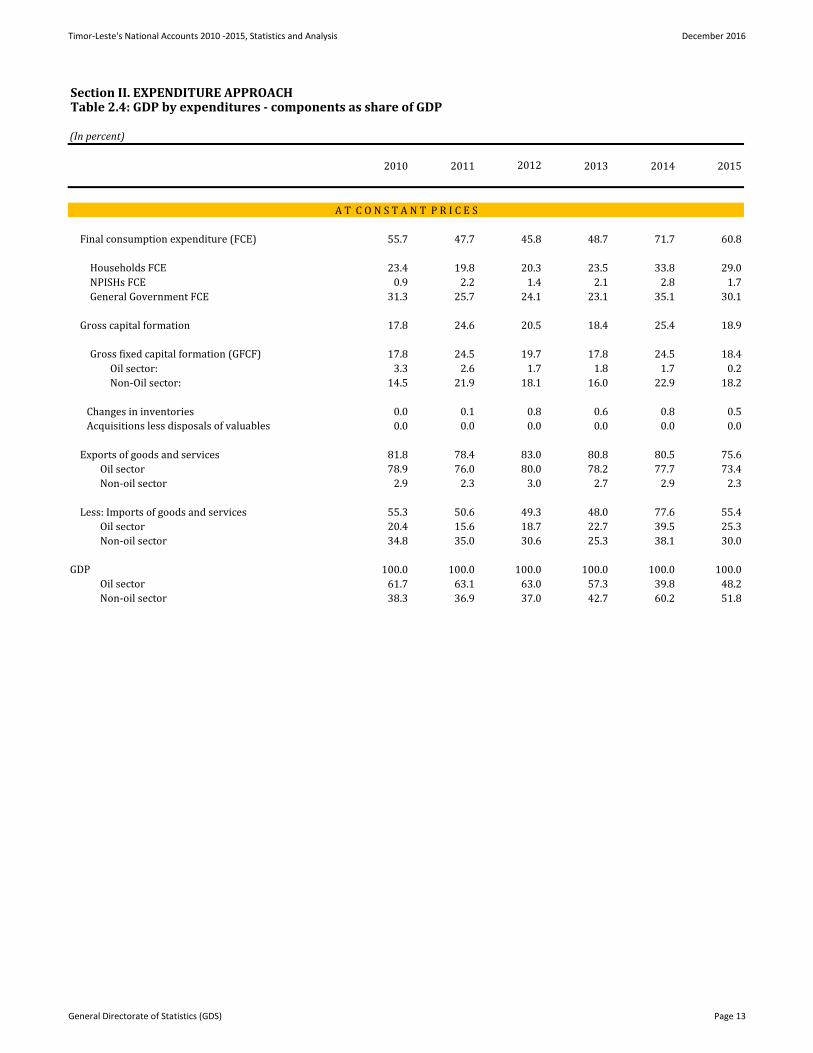
Section II. EXPENDITURE APPROACHTable 2.4: GDP by expenditures - components as share of GDP
(In percent)
2010 2011 2013 2014 20152012
Final consumption expenditure (FCE) 55.7 47.7 45.8 48.7 71.7 60.8
Households FCE 23.4 19.8 20.3 23.5 33.8 29.0
NPISHs FCE 0.9 2.2 1.4 2.1 2.8 1.7
General Government FCE 31.3 25.7 24.1 23.1 35.1 30.1
Gross capital formation 17.8 24.6 20.5 18.4 25.4 18.9
Gross fixed capital formation (GFCF) 17.8 24.5 19.7 17.8 24.5 18.4
Oil sector: 3.3 2.6 1.7 1.8 1.7 0.2
Non-Oil sector: 14.5 21.9 18.1 16.0 22.9 18.2
Changes in inventories 0.0 0.1 0.8 0.6 0.8 0.5
Acquisitions less disposals of valuables 0.0 0.0 0.0 0.0 0.0 0.0
Exports of goods and services 81.8 78.4 83.0 80.8 80.5 75.6
Oil sector 78.9 76.0 80.0 78.2 77.7 73.4
Non-oil sector 2.9 2.3 3.0 2.7 2.9 2.3
Less: Imports of goods and services 55.3 50.6 49.3 48.0 77.6 55.4
Oil sector 20.4 15.6 18.7 22.7 39.5 25.3
Non-oil sector 34.8 35.0 30.6 25.3 38.1 30.0
GDP 100.0 100.0 100.0 100.0 100.0 100.0
Oil sector 61.7 63.1 63.0 57.3 39.8 48.2
Non-oil sector 38.3 36.9 37.0 42.7 60.2 51.8
A T C O N S T A N T P R I C E S
General Directorate of Statistics (GDS) Page 13
Timor-Leste's National Accounts 2010 -2015, Statistics and Analysis December 2016
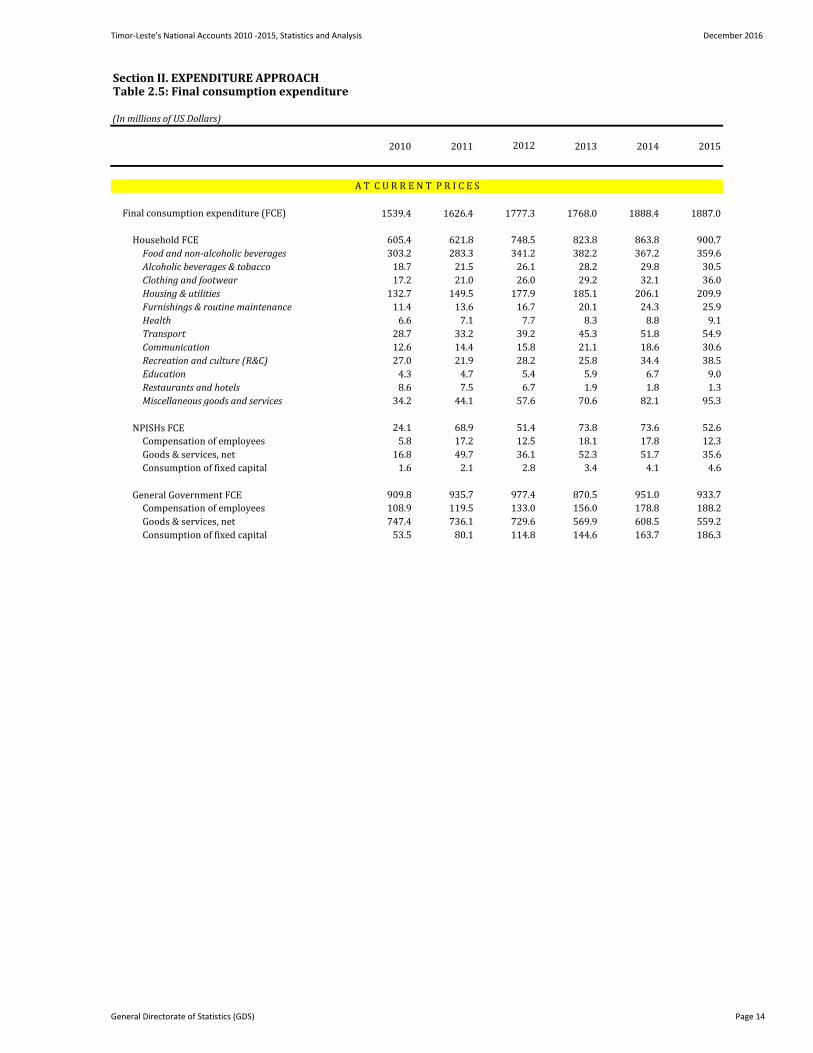
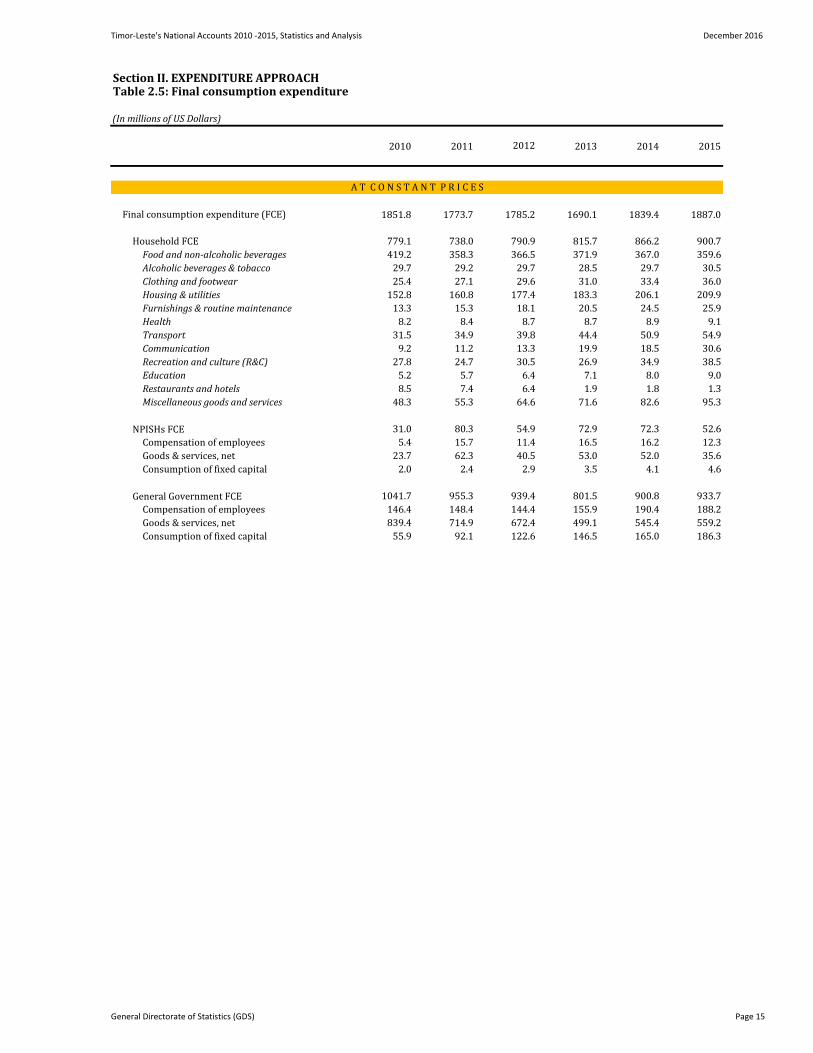
Section II. EXPENDITURE APPROACHTable 2.5: Final consumption expenditure
(In millions of US Dollars)
2010 2011 2013 2014 2015
Final consumption expenditure (FCE) 1539.4 1626.4 1777.3 1768.0 1888.4 1887.0
Household FCE 605.4 621.8 748.5 823.8 863.8 900.7
Food and non‑alcoholic beverages 303.2 283.3 341.2 382.2 367.2 359.6
Alcoholic beverages & tobacco 18.7 21.5 26.1 28.2 29.8 30.5
Clothing and footwear 17.2 21.0 26.0 29.2 32.1 36.0
Housing & utilities 132.7 149.5 177.9 185.1 206.1 209.9
Furnishings & routine maintenance 11.4 13.6 16.7 20.1 24.3 25.9
Health 6.6 7.1 7.7 8.3 8.8 9.1
Transport 28.7 33.2 39.2 45.3 51.8 54.9
Communication 12.6 14.4 15.8 21.1 18.6 30.6
Recreation and culture (R&C) 27.0 21.9 28.2 25.8 34.4 38.5
Education 4.3 4.7 5.4 5.9 6.7 9.0
Restaurants and hotels 8.6 7.5 6.7 1.9 1.8 1.3
Miscellaneous goods and services 34.2 44.1 57.6 70.6 82.1 95.3
NPISHs FCE 24.1 68.9 51.4 73.8 73.6 52.6
Compensation of employees 5.8 17.2 12.5 18.1 17.8 12.3
Goods & services, net 16.8 49.7 36.1 52.3 51.7 35.6
Consumption of fixed capital 1.6 2.1 2.8 3.4 4.1 4.6
General Government FCE 909.8 935.7 977.4 870.5 951.0 933.7
Compensation of employees 108.9 119.5 133.0 156.0 178.8 188.2
Goods & services, net 747.4 736.1 729.6 569.9 608.5 559.2
Consumption of fixed capital 53.5 80.1 114.8 144.6 163.7 186.3
2012
A T C U R R E N T P R I C E S
General Directorate of Statistics (GDS) Page 14
Timor-Leste's National Accounts 2010 -2015, Statistics and Analysis December 2016
Section II. EXPENDITURE APPROACHTable 2.5: Final consumption expenditure
(In millions of US Dollars)
2010 2011 2013 2014 20152012
Final consumption expenditure (FCE) 1851.8 1773.7 1785.2 1690.1 1839.4 1887.0
Household FCE 779.1 738.0 790.9 815.7 866.2 900.7
Food and non‑alcoholic beverages 419.2 358.3 366.5 371.9 367.0 359.6
Alcoholic beverages & tobacco 29.7 29.2 29.7 28.5 29.7 30.5
Clothing and footwear 25.4 27.1 29.6 31.0 33.4 36.0
Housing & utilities 152.8 160.8 177.4 183.3 206.1 209.9
Furnishings & routine maintenance 13.3 15.3 18.1 20.5 24.5 25.9
Health 8.2 8.4 8.7 8.7 8.9 9.1
Transport 31.5 34.9 39.8 44.4 50.9 54.9
Communication 9.2 11.2 13.3 19.9 18.5 30.6
Recreation and culture (R&C) 27.8 24.7 30.5 26.9 34.9 38.5
Education 5.2 5.7 6.4 7.1 8.0 9.0
Restaurants and hotels 8.5 7.4 6.4 1.9 1.8 1.3
Miscellaneous goods and services 48.3 55.3 64.6 71.6 82.6 95.3
NPISHs FCE 31.0 80.3 54.9 72.9 72.3 52.6
Compensation of employees 5.4 15.7 11.4 16.5 16.2 12.3
Goods & services, net 23.7 62.3 40.5 53.0 52.0 35.6
Consumption of fixed capital 2.0 2.4 2.9 3.5 4.1 4.6
General Government FCE 1041.7 955.3 939.4 801.5 900.8 933.7
Compensation of employees 146.4 148.4 144.4 155.9 190.4 188.2
Goods & services, net 839.4 714.9 672.4 499.1 545.4 559.2
Consumption of fixed capital 55.9 92.1 122.6 146.5 165.0 186.3
A T C O N S T A N T P R I C E S
General Directorate of Statistics (GDS) Page 15
Timor-Leste's National Accounts 2010 -2015, Statistics and Analysis December 2016
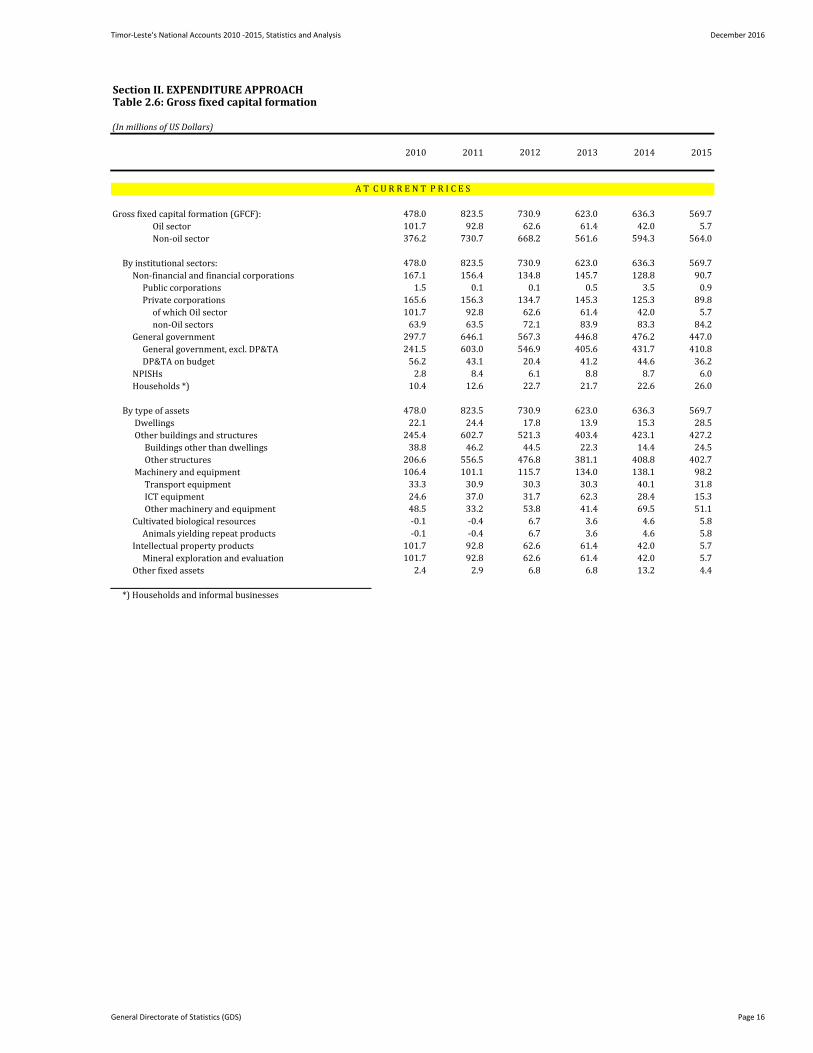
Section II. EXPENDITURE APPROACHTable 2.6: Gross fixed capital formation
(In millions of US Dollars)
2010 2011 2012 2013 2014 2015
Gross fixed capital formation (GFCF): 478.0 823.5 730.9 623.0 636.3 569.7
Oil sector 101.7 92.8 62.6 61.4 42.0 5.7
Non-oil sector 376.2 730.7 668.2 561.6 594.3 564.0
By institutional sectors: 478.0 823.5 730.9 623.0 636.3 569.7
Non-financial and financial corporations 167.1 156.4 134.8 145.7 128.8 90.7
Public corporations 1.5 0.1 0.1 0.5 3.5 0.9
Private corporations 165.6 156.3 134.7 145.3 125.3 89.8
of which Oil sector 101.7 92.8 62.6 61.4 42.0 5.7
non-Oil sectors 63.9 63.5 72.1 83.9 83.3 84.2
General government 297.7 646.1 567.3 446.8 476.2 447.0
General government, excl. DP&TA 241.5 603.0 546.9 405.6 431.7 410.8
DP&TA on budget 56.2 43.1 20.4 41.2 44.6 36.2
NPISHs 2.8 8.4 6.1 8.8 8.7 6.0
Households *) 10.4 12.6 22.7 21.7 22.6 26.0
By type of assets 478.0 823.5 730.9 623.0 636.3 569.7
Dwellings 22.1 24.4 17.8 13.9 15.3 28.5
Other buildings and structures 245.4 602.7 521.3 403.4 423.1 427.2
Buildings other than dwellings 38.8 46.2 44.5 22.3 14.4 24.5
Other structures 206.6 556.5 476.8 381.1 408.8 402.7
Machinery and equipment 106.4 101.1 115.7 134.0 138.1 98.2
Transport equipment 33.3 30.9 30.3 30.3 40.1 31.8
ICT equipment 24.6 37.0 31.7 62.3 28.4 15.3
Other machinery and equipment 48.5 33.2 53.8 41.4 69.5 51.1
Cultivated biological resources -0.1 -0.4 6.7 3.6 4.6 5.8
Animals yielding repeat products -0.1 -0.4 6.7 3.6 4.6 5.8
Intellectual property products 101.7 92.8 62.6 61.4 42.0 5.7
Mineral exploration and evaluation 101.7 92.8 62.6 61.4 42.0 5.7
Other fixed assets 2.4 2.9 6.8 6.8 13.2 4.4
*) Households and informal businesses
A T C U R R E N T P R I C E S
General Directorate of Statistics (GDS) Page 16
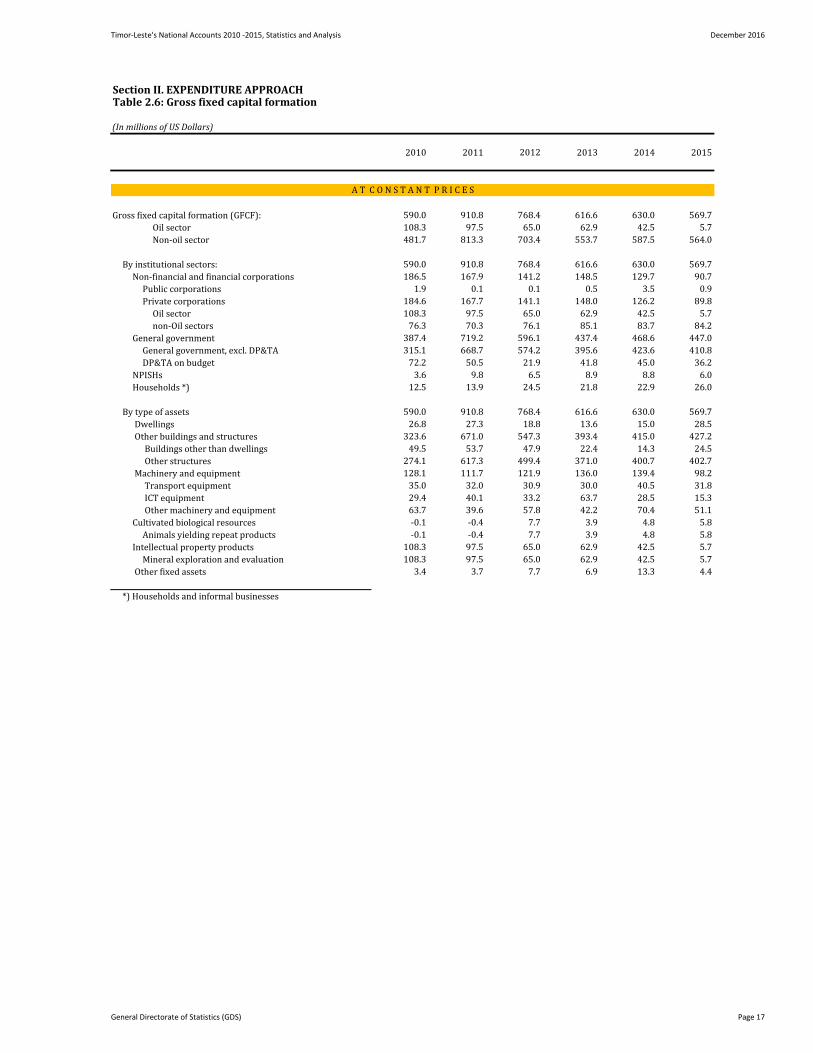
Timor-Leste's National Accounts 2010 -2015, Statistics and Analysis December 2016
Section II. EXPENDITURE APPROACHTable 2.6: Gross fixed capital formation
(In millions of US Dollars)
2010 2011 2012 2013 2014 2015
Gross fixed capital formation (GFCF): 590.0 910.8 768.4 616.6 630.0 569.7
Oil sector 108.3 97.5 65.0 62.9 42.5 5.7
Non-oil sector 481.7 813.3 703.4 553.7 587.5 564.0
By institutional sectors: 590.0 910.8 768.4 616.6 630.0 569.7
Non-financial and financial corporations 186.5 167.9 141.2 148.5 129.7 90.7
Public corporations 1.9 0.1 0.1 0.5 3.5 0.9
Private corporations 184.6 167.7 141.1 148.0 126.2 89.8
Oil sector 108.3 97.5 65.0 62.9 42.5 5.7
non-Oil sectors 76.3 70.3 76.1 85.1 83.7 84.2
General government 387.4 719.2 596.1 437.4 468.6 447.0
General government, excl. DP&TA 315.1 668.7 574.2 395.6 423.6 410.8
DP&TA on budget 72.2 50.5 21.9 41.8 45.0 36.2
NPISHs 3.6 9.8 6.5 8.9 8.8 6.0
Households *) 12.5 13.9 24.5 21.8 22.9 26.0
By type of assets 590.0 910.8 768.4 616.6 630.0 569.7
Dwellings 26.8 27.3 18.8 13.6 15.0 28.5
Other buildings and structures 323.6 671.0 547.3 393.4 415.0 427.2
Buildings other than dwellings 49.5 53.7 47.9 22.4 14.3 24.5
Other structures 274.1 617.3 499.4 371.0 400.7 402.7
Machinery and equipment 128.1 111.7 121.9 136.0 139.4 98.2
Transport equipment 35.0 32.0 30.9 30.0 40.5 31.8
ICT equipment 29.4 40.1 33.2 63.7 28.5 15.3
Other machinery and equipment 63.7 39.6 57.8 42.2 70.4 51.1
Cultivated biological resources -0.1 -0.4 7.7 3.9 4.8 5.8
Animals yielding repeat products -0.1 -0.4 7.7 3.9 4.8 5.8
Intellectual property products 108.3 97.5 65.0 62.9 42.5 5.7
Mineral exploration and evaluation 108.3 97.5 65.0 62.9 42.5 5.7
Other fixed assets 3.4 3.7 7.7 6.9 13.3 4.4
*) Households and informal businesses
A T C O N S T A N T P R I C E S
General Directorate of Statistics (GDS) Page 17
Timor-Leste's National Accounts 2010 -2015, Statistics and Analysis December 2016
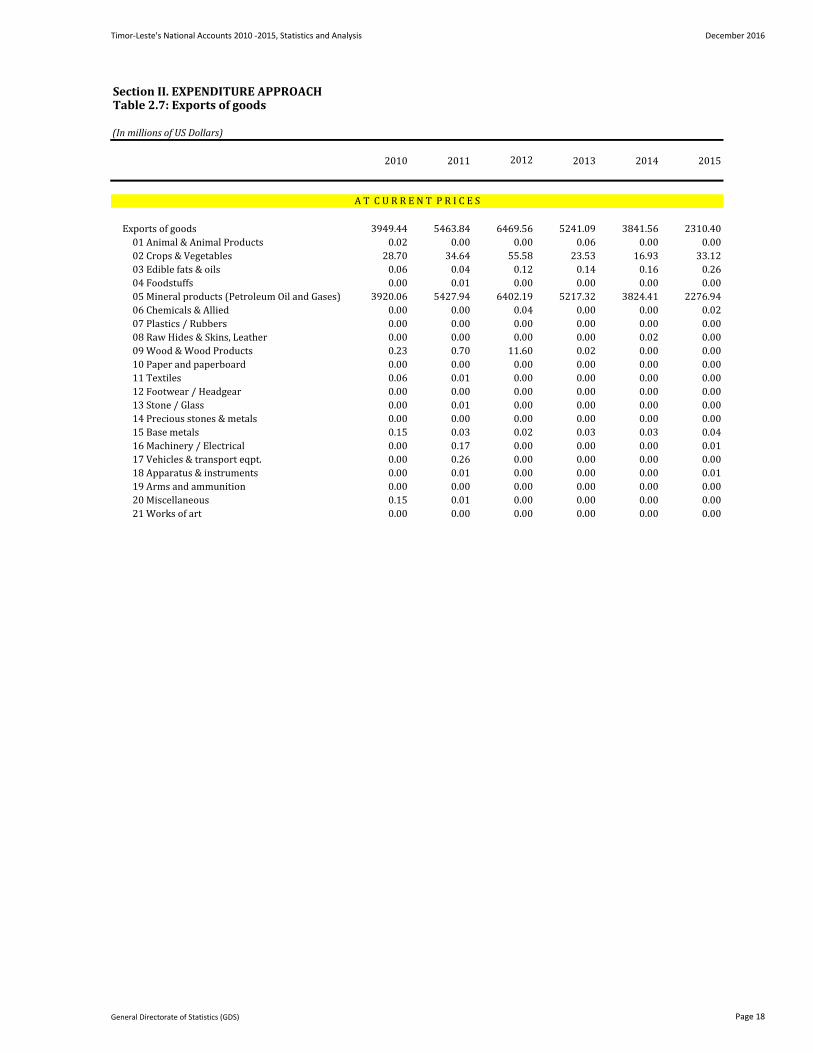
Section II. EXPENDITURE APPROACHTable 2.7: Exports of goods
(In millions of US Dollars)
2010 2011 2013 2014 2015
Exports of goods 3949.44 5463.84 6469.56 5241.09 3841.56 2310.40
01 Animal & Animal Products 0.02 0.00 0.00 0.06 0.00 0.00
02 Crops & Vegetables 28.70 34.64 55.58 23.53 16.93 33.12
03 Edible fats & oils 0.06 0.04 0.12 0.14 0.16 0.26
04 Foodstuffs 0.00 0.01 0.00 0.00 0.00 0.00
05 Mineral products (Petroleum Oil and Gases) 3920.06 5427.94 6402.19 5217.32 3824.41 2276.94
06 Chemicals & Allied 0.00 0.00 0.04 0.00 0.00 0.02
07 Plastics / Rubbers 0.00 0.00 0.00 0.00 0.00 0.00
08 Raw Hides & Skins, Leather 0.00 0.00 0.00 0.00 0.02 0.00
09 Wood & Wood Products 0.23 0.70 11.60 0.02 0.00 0.00
10 Paper and paperboard 0.00 0.00 0.00 0.00 0.00 0.00
11 Textiles 0.06 0.01 0.00 0.00 0.00 0.00
12 Footwear / Headgear 0.00 0.00 0.00 0.00 0.00 0.00
13 Stone / Glass 0.00 0.01 0.00 0.00 0.00 0.00
14 Precious stones & metals 0.00 0.00 0.00 0.00 0.00 0.00
15 Base metals 0.15 0.03 0.02 0.03 0.03 0.04
16 Machinery / Electrical 0.00 0.17 0.00 0.00 0.00 0.01
17 Vehicles & transport eqpt. 0.00 0.26 0.00 0.00 0.00 0.00
18 Apparatus & instruments 0.00 0.01 0.00 0.00 0.00 0.01
19 Arms and ammunition 0.00 0.00 0.00 0.00 0.00 0.00
20 Miscellaneous 0.15 0.01 0.00 0.00 0.00 0.00
21 Works of art 0.00 0.00 0.00 0.00 0.00 0.00
2012
A T C U R R E N T P R I C E S
General Directorate of Statistics (GDS) Page 18
Timor-Leste's National Accounts 2010 -2015, Statistics and Analysis December 2016
Section II. EXPENDITURE APPROACHTable 2.7: Exports of goods
(In millions of US Dollars)
2010 2011 2013 2014 20152012
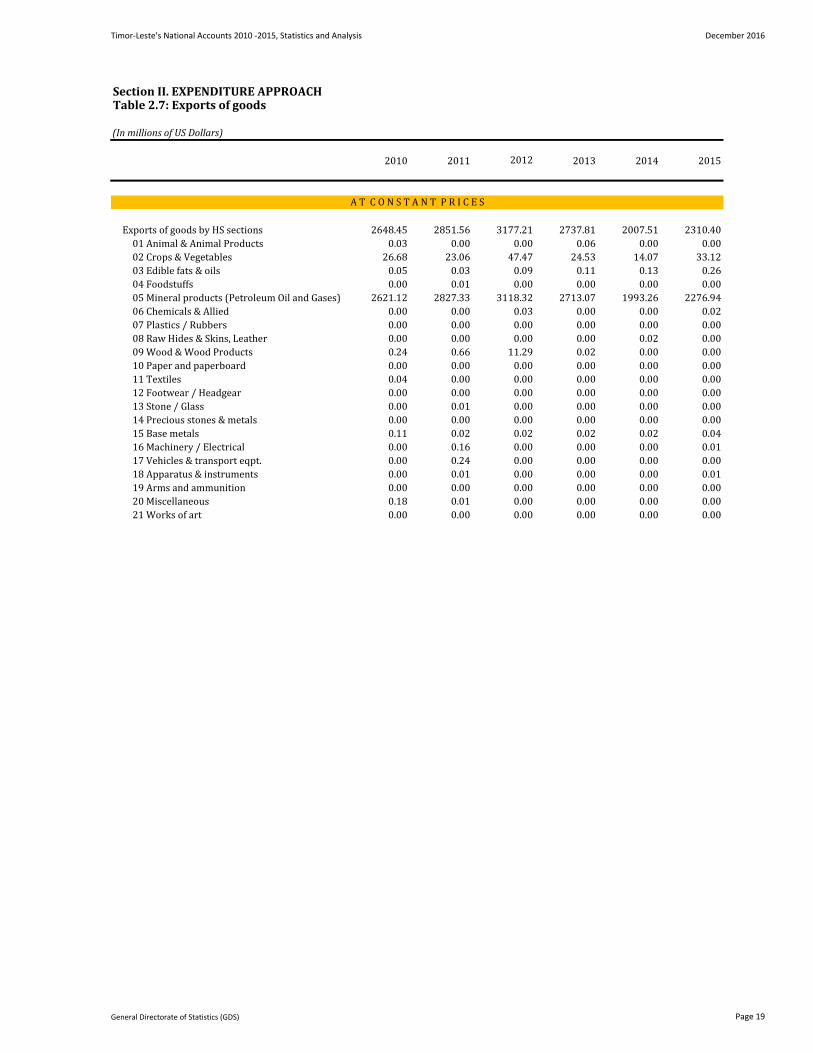
Exports of goods by HS sections 2648.45 2851.56 3177.21 2737.81 2007.51 2310.40
01 Animal & Animal Products 0.03 0.00 0.00 0.06 0.00 0.00
02 Crops & Vegetables 26.68 23.06 47.47 24.53 14.07 33.12
03 Edible fats & oils 0.05 0.03 0.09 0.11 0.13 0.26
04 Foodstuffs 0.00 0.01 0.00 0.00 0.00 0.00
05 Mineral products (Petroleum Oil and Gases) 2621.12 2827.33 3118.32 2713.07 1993.26 2276.94
06 Chemicals & Allied 0.00 0.00 0.03 0.00 0.00 0.02
07 Plastics / Rubbers 0.00 0.00 0.00 0.00 0.00 0.00
08 Raw Hides & Skins, Leather 0.00 0.00 0.00 0.00 0.02 0.00
09 Wood & Wood Products 0.24 0.66 11.29 0.02 0.00 0.00
10 Paper and paperboard 0.00 0.00 0.00 0.00 0.00 0.00
11 Textiles 0.04 0.00 0.00 0.00 0.00 0.00
12 Footwear / Headgear 0.00 0.00 0.00 0.00 0.00 0.00
13 Stone / Glass 0.00 0.01 0.00 0.00 0.00 0.00
14 Precious stones & metals 0.00 0.00 0.00 0.00 0.00 0.00
15 Base metals 0.11 0.02 0.02 0.02 0.02 0.04
16 Machinery / Electrical 0.00 0.16 0.00 0.00 0.00 0.01
17 Vehicles & transport eqpt. 0.00 0.24 0.00 0.00 0.00 0.00
18 Apparatus & instruments 0.00 0.01 0.00 0.00 0.00 0.01
19 Arms and ammunition 0.00 0.00 0.00 0.00 0.00 0.00
20 Miscellaneous 0.18 0.01 0.00 0.00 0.00 0.00
21 Works of art 0.00 0.00 0.00 0.00 0.00 0.00
A T C O N S T A N T P R I C E S
General Directorate of Statistics (GDS) Page 19
Timor-Leste's National Accounts 2010-2015, Statistics and Analysis December 2016
Section II. EXPENDITURE APPROACHTable 2.8: Exports of services
(In millions of US Dollars)
2010 2011 2013 2014 2015
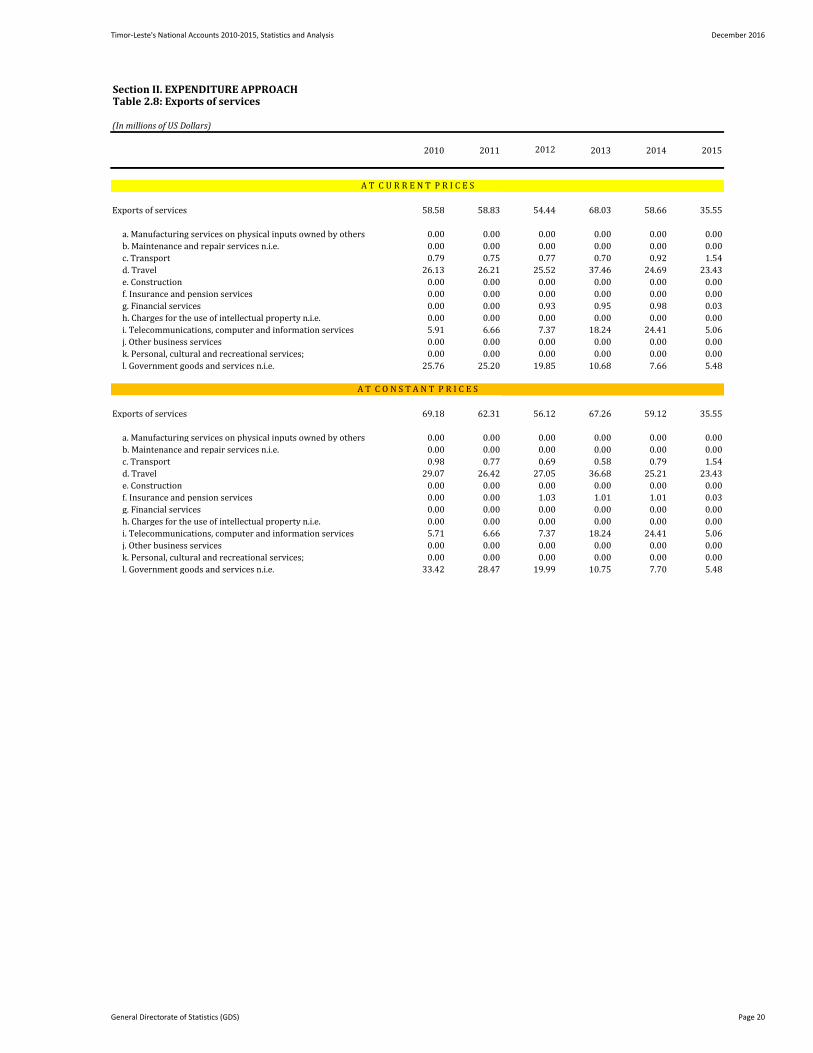
Exports of services 58.58 58.83 54.44 68.03 58.66 35.55
a. Manufacturing services on physical inputs owned by others 0.00 0.00 0.00 0.00 0.00 0.00
b. Maintenance and repair services n.i.e. 0.00 0.00 0.00 0.00 0.00 0.00
c. Transport 0.79 0.75 0.77 0.70 0.92 1.54
d. Travel 26.13 26.21 25.52 37.46 24.69 23.43
e. Construction 0.00 0.00 0.00 0.00 0.00 0.00
f. Insurance and pension services 0.00 0.00 0.00 0.00 0.00 0.00
g. Financial services 0.00 0.00 0.93 0.95 0.98 0.03
h. Charges for the use of intellectual property n.i.e. 0.00 0.00 0.00 0.00 0.00 0.00
i. Telecommunications, computer and information services 5.91 6.66 7.37 18.24 24.41 5.06
j. Other business services 0.00 0.00 0.00 0.00 0.00 0.00
k. Personal, cultural and recreational services; 0.00 0.00 0.00 0.00 0.00 0.00
l. Government goods and services n.i.e. 25.76 25.20 19.85 10.68 7.66 5.48
Exports of services 69.18 62.31 56.12 67.26 59.12 35.55
a. Manufacturing services on physical inputs owned by others 0.00 0.00 0.00 0.00 0.00 0.00
b. Maintenance and repair services n.i.e. 0.00 0.00 0.00 0.00 0.00 0.00
c. Transport 0.98 0.77 0.69 0.58 0.79 1.54
d. Travel 29.07 26.42 27.05 36.68 25.21 23.43
e. Construction 0.00 0.00 0.00 0.00 0.00 0.00
f. Insurance and pension services 0.00 0.00 1.03 1.01 1.01 0.03
g. Financial services 0.00 0.00 0.00 0.00 0.00 0.00
h. Charges for the use of intellectual property n.i.e. 0.00 0.00 0.00 0.00 0.00 0.00
i. Telecommunications, computer and information services 5.71 6.66 7.37 18.24 24.41 5.06
j. Other business services 0.00 0.00 0.00 0.00 0.00 0.00
k. Personal, cultural and recreational services; 0.00 0.00 0.00 0.00 0.00 0.00
l. Government goods and services n.i.e. 33.42 28.47 19.99 10.75 7.70 5.48
2012
A T C O N S T A N T P R I C E S
A T C U R R E N T P R I C E S
General Directorate of Statistics (GDS) Page 20
Timor-Leste's National Accounts 2010 -2015, Statistics and Analysis December 2016
Section II. EXPENDITURE APPROACHTable 2.9: Imports of goods
(In millions of US Dollars)
2010 2011 2012 2013 2014 2015
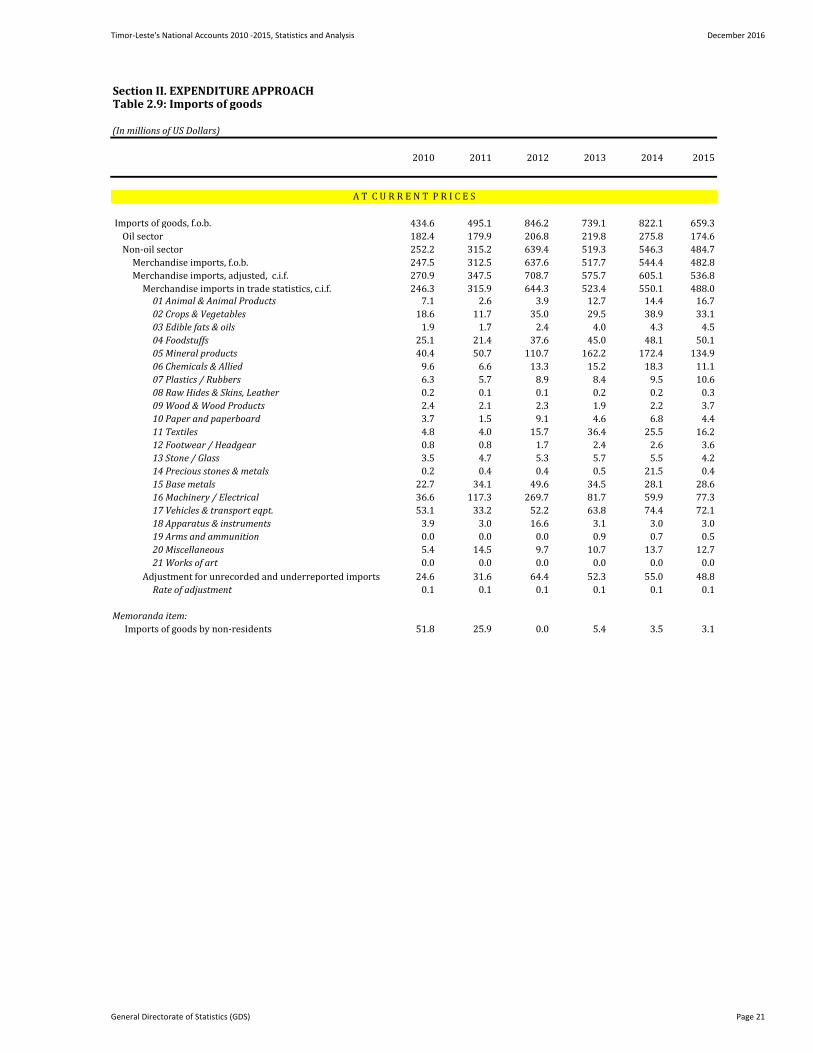
Imports of goods, f.o.b. 434.6 495.1 846.2 739.1 822.1 659.3
Oil sector 182.4 179.9 206.8 219.8 275.8 174.6
Non-oil sector 252.2 315.2 639.4 519.3 546.3 484.7
Merchandise imports, f.o.b. 247.5 312.5 637.6 517.7 544.4 482.8
Merchandise imports, adjusted, c.i.f. 270.9 347.5 708.7 575.7 605.1 536.8
Merchandise imports in trade statistics, c.i.f. 246.3 315.9 644.3 523.4 550.1 488.001 Animal & Animal Products 7.1 2.6 3.9 12.7 14.4 16.7
02 Crops & Vegetables 18.6 11.7 35.0 29.5 38.9 33.1
03 Edible fats & oils 1.9 1.7 2.4 4.0 4.3 4.5
04 Foodstuffs 25.1 21.4 37.6 45.0 48.1 50.1
05 Mineral products 40.4 50.7 110.7 162.2 172.4 134.9
06 Chemicals & Allied 9.6 6.6 13.3 15.2 18.3 11.1
07 Plastics / Rubbers 6.3 5.7 8.9 8.4 9.5 10.6
08 Raw Hides & Skins, Leather 0.2 0.1 0.1 0.2 0.2 0.3
09 Wood & Wood Products 2.4 2.1 2.3 1.9 2.2 3.7
10 Paper and paperboard 3.7 1.5 9.1 4.6 6.8 4.4
11 Textiles 4.8 4.0 15.7 36.4 25.5 16.2
12 Footwear / Headgear 0.8 0.8 1.7 2.4 2.6 3.6
13 Stone / Glass 3.5 4.7 5.3 5.7 5.5 4.2
14 Precious stones & metals 0.2 0.4 0.4 0.5 21.5 0.4
15 Base metals 22.7 34.1 49.6 34.5 28.1 28.6
16 Machinery / Electrical 36.6 117.3 269.7 81.7 59.9 77.3
17 Vehicles & transport eqpt. 53.1 33.2 52.2 63.8 74.4 72.1
18 Apparatus & instruments 3.9 3.0 16.6 3.1 3.0 3.0
19 Arms and ammunition 0.0 0.0 0.0 0.9 0.7 0.5
20 Miscellaneous 5.4 14.5 9.7 10.7 13.7 12.7
21 Works of art 0.0 0.0 0.0 0.0 0.0 0.0
Adjustment for unrecorded and underreported imports 24.6 31.6 64.4 52.3 55.0 48.8
Rate of adjustment 0.1 0.1 0.1 0.1 0.1 0.1
Memoranda item:
Imports of goods by non-residents 51.8 25.9 0.0 5.4 3.5 3.1
A T C U R R E N T P R I C E S
General Directorate of Statistics (GDS) Page 21
Timor-Leste's National Accounts 2010 -2015, Statistics and Analysis December 2016
Section II. EXPENDITURE APPROACHTable 2.9: Imports of goods
(In millions of US Dollars)
2010 2011 2012 2013 2014 2015
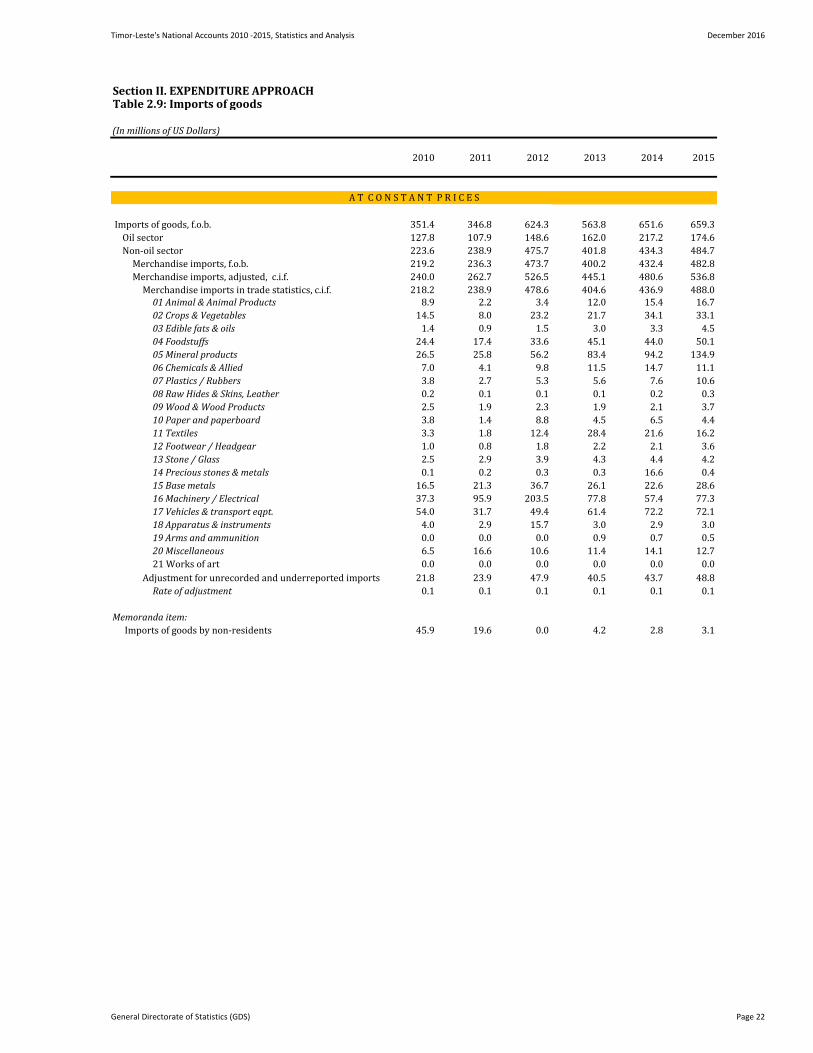
Imports of goods, f.o.b. 351.4 346.8 624.3 563.8 651.6 659.3
Oil sector 127.8 107.9 148.6 162.0 217.2 174.6
Non-oil sector 223.6 238.9 475.7 401.8 434.3 484.7
Merchandise imports, f.o.b. 219.2 236.3 473.7 400.2 432.4 482.8
Merchandise imports, adjusted, c.i.f. 240.0 262.7 526.5 445.1 480.6 536.8
Merchandise imports in trade statistics, c.i.f. 218.2 238.9 478.6 404.6 436.9 488.001 Animal & Animal Products 8.9 2.2 3.4 12.0 15.4 16.7
02 Crops & Vegetables 14.5 8.0 23.2 21.7 34.1 33.1
03 Edible fats & oils 1.4 0.9 1.5 3.0 3.3 4.5
04 Foodstuffs 24.4 17.4 33.6 45.1 44.0 50.1
05 Mineral products 26.5 25.8 56.2 83.4 94.2 134.9
06 Chemicals & Allied 7.0 4.1 9.8 11.5 14.7 11.1
07 Plastics / Rubbers 3.8 2.7 5.3 5.6 7.6 10.6
08 Raw Hides & Skins, Leather 0.2 0.1 0.1 0.1 0.2 0.3
09 Wood & Wood Products 2.5 1.9 2.3 1.9 2.1 3.7
10 Paper and paperboard 3.8 1.4 8.8 4.5 6.5 4.4
11 Textiles 3.3 1.8 12.4 28.4 21.6 16.2
12 Footwear / Headgear 1.0 0.8 1.8 2.2 2.1 3.6
13 Stone / Glass 2.5 2.9 3.9 4.3 4.4 4.2
14 Precious stones & metals 0.1 0.2 0.3 0.3 16.6 0.4
15 Base metals 16.5 21.3 36.7 26.1 22.6 28.6
16 Machinery / Electrical 37.3 95.9 203.5 77.8 57.4 77.3
17 Vehicles & transport eqpt. 54.0 31.7 49.4 61.4 72.2 72.1
18 Apparatus & instruments 4.0 2.9 15.7 3.0 2.9 3.0
19 Arms and ammunition 0.0 0.0 0.0 0.9 0.7 0.5
20 Miscellaneous 6.5 16.6 10.6 11.4 14.1 12.7
21 Works of art 0.0 0.0 0.0 0.0 0.0 0.0
Adjustment for unrecorded and underreported imports 21.8 23.9 47.9 40.5 43.7 48.8
Rate of adjustment 0.1 0.1 0.1 0.1 0.1 0.1
Memoranda item:
Imports of goods by non-residents 45.9 19.6 0.0 4.2 2.8 3.1
A T C O N S T A N T P R I C E S
General Directorate of Statistics (GDS) Page 22
Timor-Leste's National Accounts 2010-2015, Statistics and Analysis December 2016
Section II. EXPENDITURE APPROACHTable 2.10: Imports of services
(In millions of US Dollars)
2010 2011 2013 2014 2015
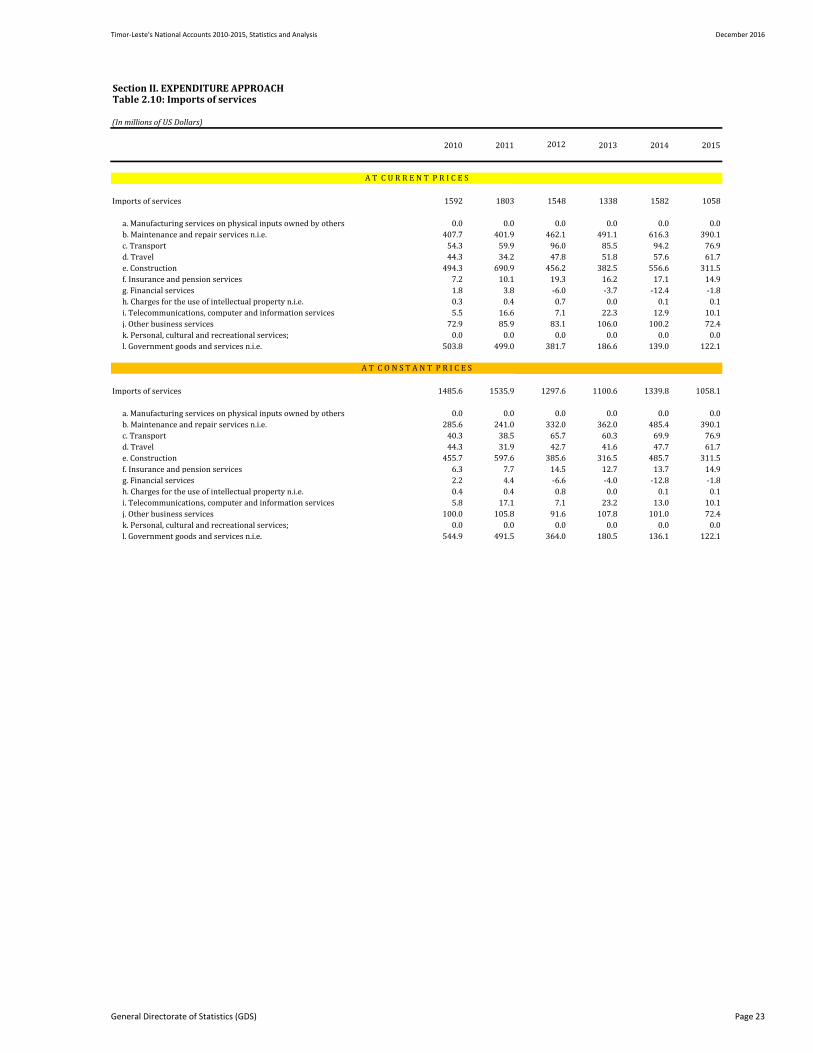
Imports of services 1592 1803 1548 1338 1582 1058
a. Manufacturing services on physical inputs owned by others 0.0 0.0 0.0 0.0 0.0 0.0
b. Maintenance and repair services n.i.e. 407.7 401.9 462.1 491.1 616.3 390.1
c. Transport 54.3 59.9 96.0 85.5 94.2 76.9
d. Travel 44.3 34.2 47.8 51.8 57.6 61.7
e. Construction 494.3 690.9 456.2 382.5 556.6 311.5
f. Insurance and pension services 7.2 10.1 19.3 16.2 17.1 14.9
g. Financial services 1.8 3.8 -6.0 -3.7 -12.4 -1.8
h. Charges for the use of intellectual property n.i.e. 0.3 0.4 0.7 0.0 0.1 0.1
i. Telecommunications, computer and information services 5.5 16.6 7.1 22.3 12.9 10.1
j. Other business services 72.9 85.9 83.1 106.0 100.2 72.4
k. Personal, cultural and recreational services; 0.0 0.0 0.0 0.0 0.0 0.0
l. Government goods and services n.i.e. 503.8 499.0 381.7 186.6 139.0 122.1
Imports of services 1485.6 1535.9 1297.6 1100.6 1339.8 1058.1
a. Manufacturing services on physical inputs owned by others 0.0 0.0 0.0 0.0 0.0 0.0
b. Maintenance and repair services n.i.e. 285.6 241.0 332.0 362.0 485.4 390.1
c. Transport 40.3 38.5 65.7 60.3 69.9 76.9
d. Travel 44.3 31.9 42.7 41.6 47.7 61.7
e. Construction 455.7 597.6 385.6 316.5 485.7 311.5
f. Insurance and pension services 6.3 7.7 14.5 12.7 13.7 14.9
g. Financial services 2.2 4.4 -6.6 -4.0 -12.8 -1.8
h. Charges for the use of intellectual property n.i.e. 0.4 0.4 0.8 0.0 0.1 0.1
i. Telecommunications, computer and information services 5.8 17.1 7.1 23.2 13.0 10.1
j. Other business services 100.0 105.8 91.6 107.8 101.0 72.4
k. Personal, cultural and recreational services; 0.0 0.0 0.0 0.0 0.0 0.0
l. Government goods and services n.i.e. 544.9 491.5 364.0 180.5 136.1 122.1
2012
A T C O N S T A N T P R I C E S
A T C U R R E N T P R I C E S
General Directorate of Statistics (GDS) Page 23
Timor-Leste's National Accounts 2010 -2015, Statistics and Analysis December 2016
Section III. PRODUCTION APPROACHTable 3.1: Value added by industries
(In millions of US Dollars)
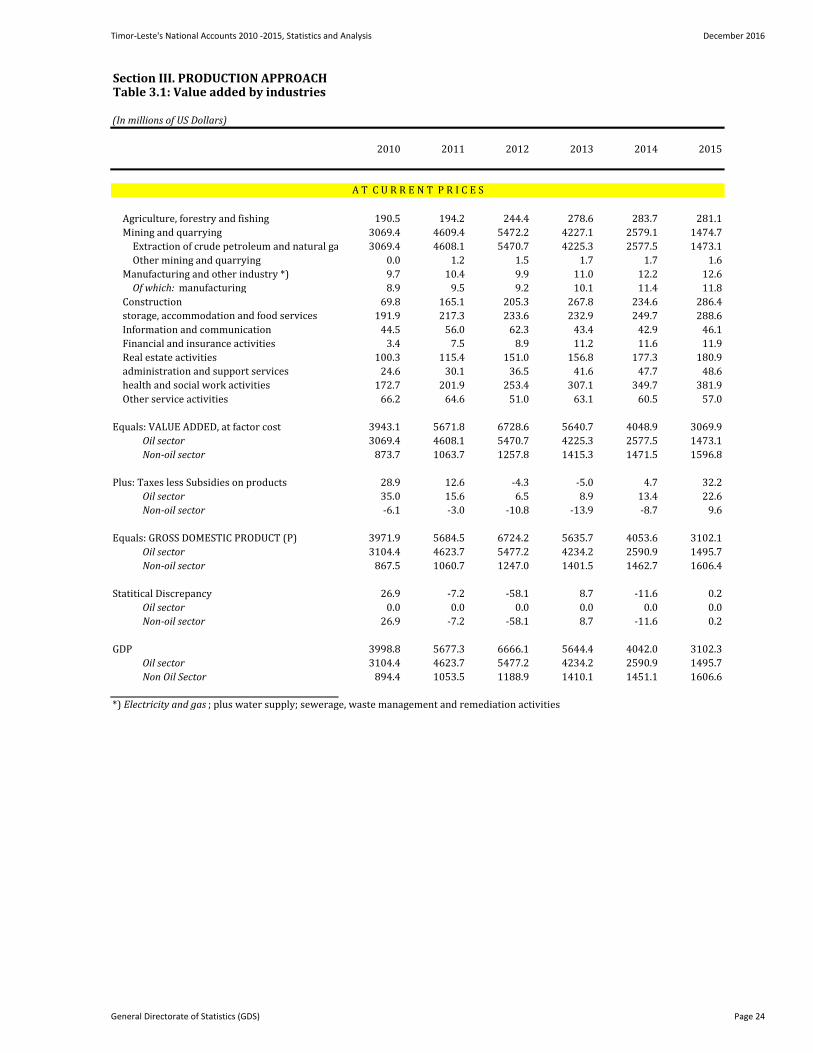
2010 2011 2012 2013 2014 2015
Agriculture, forestry and fishing 190.5 194.2 244.4 278.6 283.7 281.1
Mining and quarrying 3069.4 4609.4 5472.2 4227.1 2579.1 1474.7
Extraction of crude petroleum and natural gas 3069.4 4608.1 5470.7 4225.3 2577.5 1473.1
Other mining and quarrying 0.0 1.2 1.5 1.7 1.7 1.6
Manufacturing and other industry *) 9.7 10.4 9.9 11.0 12.2 12.6
Of which: manufacturing 8.9 9.5 9.2 10.1 11.4 11.8
Construction 69.8 165.1 205.3 267.8 234.6 286.4Wholesale and retail trade, transportation and
storage, accommodation and food services 191.9 217.3 233.6 232.9 249.7 288.6
Information and communication 44.5 56.0 62.3 43.4 42.9 46.1
Financial and insurance activities 3.4 7.5 8.9 11.2 11.6 11.9
Real estate activities 100.3 115.4 151.0 156.8 177.3 180.9Professional, scientific, technical,
administration and support services 24.6 30.1 36.5 41.6 47.7 48.6Public admin., defence, education, human
health and social work activities 172.7 201.9 253.4 307.1 349.7 381.9
Other service activities 66.2 64.6 51.0 63.1 60.5 57.0
Equals: VALUE ADDED, at factor cost 3943.1 5671.8 6728.6 5640.7 4048.9 3069.9
Oil sector 3069.4 4608.1 5470.7 4225.3 2577.5 1473.1
Non-oil sector 873.7 1063.7 1257.8 1415.3 1471.5 1596.8
Plus: Taxes less Subsidies on products 28.9 12.6 -4.3 -5.0 4.7 32.2
Oil sector 35.0 15.6 6.5 8.9 13.4 22.6
Non-oil sector -6.1 -3.0 -10.8 -13.9 -8.7 9.6
Equals: GROSS DOMESTIC PRODUCT (P) 3971.9 5684.5 6724.2 5635.7 4053.6 3102.1
Oil sector 3104.4 4623.7 5477.2 4234.2 2590.9 1495.7
Non-oil sector 867.5 1060.7 1247.0 1401.5 1462.7 1606.4
Statitical Discrepancy 26.9 -7.2 -58.1 8.7 -11.6 0.2
Oil sector 0.0 0.0 0.0 0.0 0.0 0.0
Non-oil sector 26.9 -7.2 -58.1 8.7 -11.6 0.2
GDP 3998.8 5677.3 6666.1 5644.4 4042.0 3102.3
Oil sector 3104.4 4623.7 5477.2 4234.2 2590.9 1495.7
Non Oil Sector 894.4 1053.5 1188.9 1410.1 1451.1 1606.6
*) Electricity and gas ; plus water supply; sewerage, waste management and remediation activities
A T C U R R E N T P R I C E S
General Directorate of Statistics (GDS) Page 24
Timor-Leste's National Accounts 2010 -2015, Statistics and Analysis December 2016
Section III. PRODUCTION APPROACHTable 3.1: Value added by industries
(In millions of US Dollars)
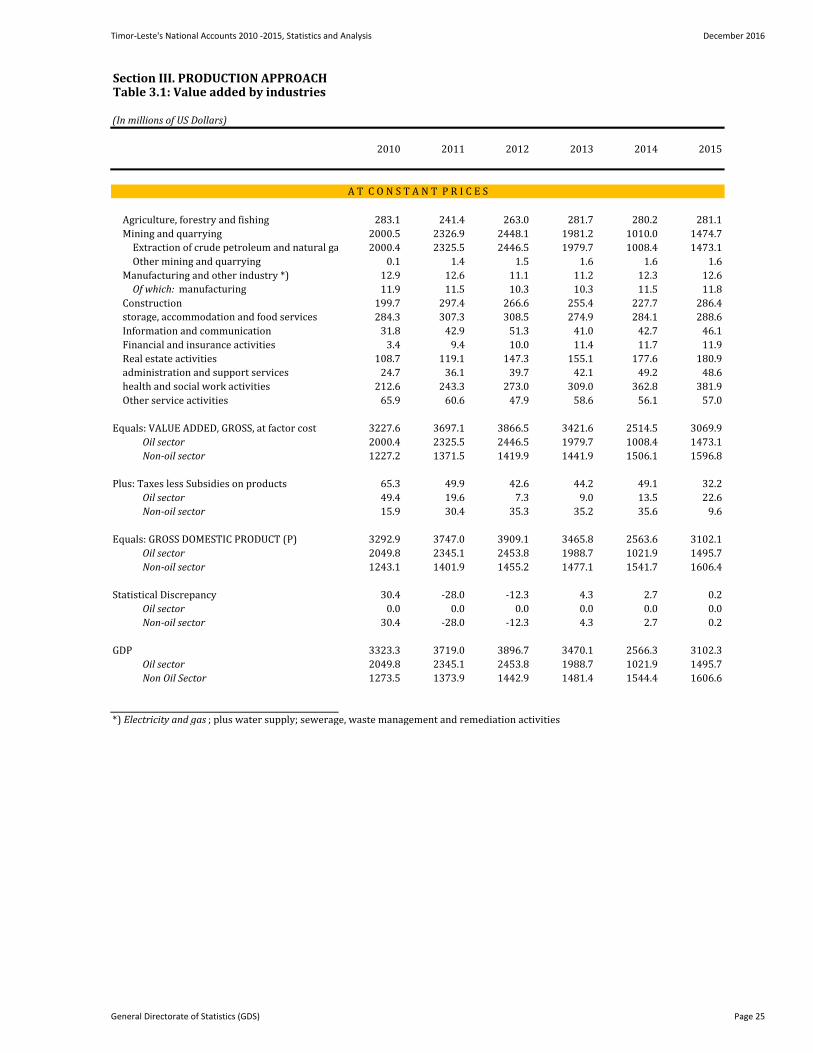
2010 2011 2012 2013 2014 2015
Agriculture, forestry and fishing 283.1 241.4 263.0 281.7 280.2 281.1
Mining and quarrying 2000.5 2326.9 2448.1 1981.2 1010.0 1474.7
Extraction of crude petroleum and natural gas 2000.4 2325.5 2446.5 1979.7 1008.4 1473.1
Other mining and quarrying 0.1 1.4 1.5 1.6 1.6 1.6
Manufacturing and other industry *) 12.9 12.6 11.1 11.2 12.3 12.6
Of which: manufacturing 11.9 11.5 10.3 10.3 11.5 11.8
Construction 199.7 297.4 266.6 255.4 227.7 286.4Wholesale and retail trade, transportation and
storage, accommodation and food services 284.3 307.3 308.5 274.9 284.1 288.6
Information and communication 31.8 42.9 51.3 41.0 42.7 46.1
Financial and insurance activities 3.4 9.4 10.0 11.4 11.7 11.9
Real estate activities 108.7 119.1 147.3 155.1 177.6 180.9Professional, scientific, technical,
administration and support services 24.7 36.1 39.7 42.1 49.2 48.6Public admin., defence, education, human
health and social work activities 212.6 243.3 273.0 309.0 362.8 381.9
Other service activities 65.9 60.6 47.9 58.6 56.1 57.0
Equals: VALUE ADDED, GROSS, at factor cost 3227.6 3697.1 3866.5 3421.6 2514.5 3069.9
Oil sector 2000.4 2325.5 2446.5 1979.7 1008.4 1473.1
Non-oil sector 1227.2 1371.5 1419.9 1441.9 1506.1 1596.8
Plus: Taxes less Subsidies on products 65.3 49.9 42.6 44.2 49.1 32.2
Oil sector 49.4 19.6 7.3 9.0 13.5 22.6
Non-oil sector 15.9 30.4 35.3 35.2 35.6 9.6
Equals: GROSS DOMESTIC PRODUCT (P) 3292.9 3747.0 3909.1 3465.8 2563.6 3102.1
Oil sector 2049.8 2345.1 2453.8 1988.7 1021.9 1495.7
Non-oil sector 1243.1 1401.9 1455.2 1477.1 1541.7 1606.4
Statistical Discrepancy 30.4 -28.0 -12.3 4.3 2.7 0.2
Oil sector 0.0 0.0 0.0 0.0 0.0 0.0
Non-oil sector 30.4 -28.0 -12.3 4.3 2.7 0.2
GDP 3323.3 3719.0 3896.7 3470.1 2566.3 3102.3
Oil sector 2049.8 2345.1 2453.8 1988.7 1021.9 1495.7
Non Oil Sector 1273.5 1373.9 1442.9 1481.4 1544.4 1606.6
*) Electricity and gas ; plus water supply; sewerage, waste management and remediation activities
A T C O N S T A N T P R I C E S
General Directorate of Statistics (GDS) Page 25
Timor-Leste's National Accounts 2010 -2015, Statistics and Analysis December 2016
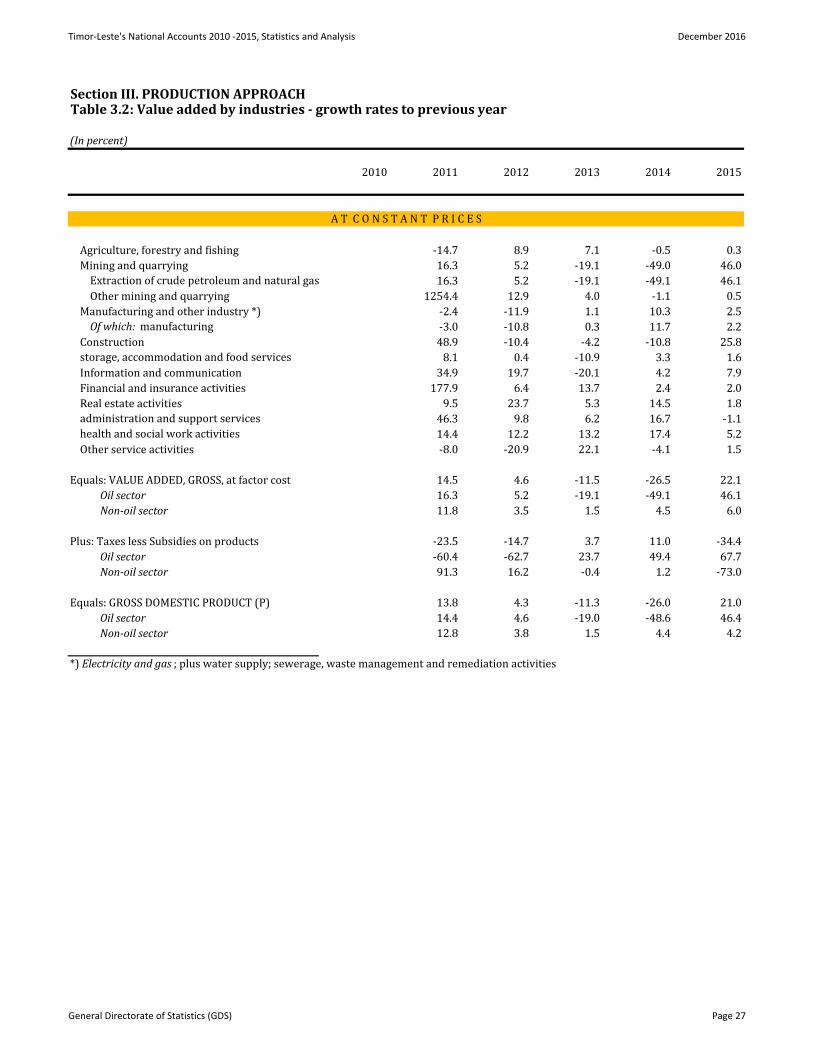
Section III. PRODUCTION APPROACHTable 3.2: Value added by industries - growth rates to previous year
(In percent)
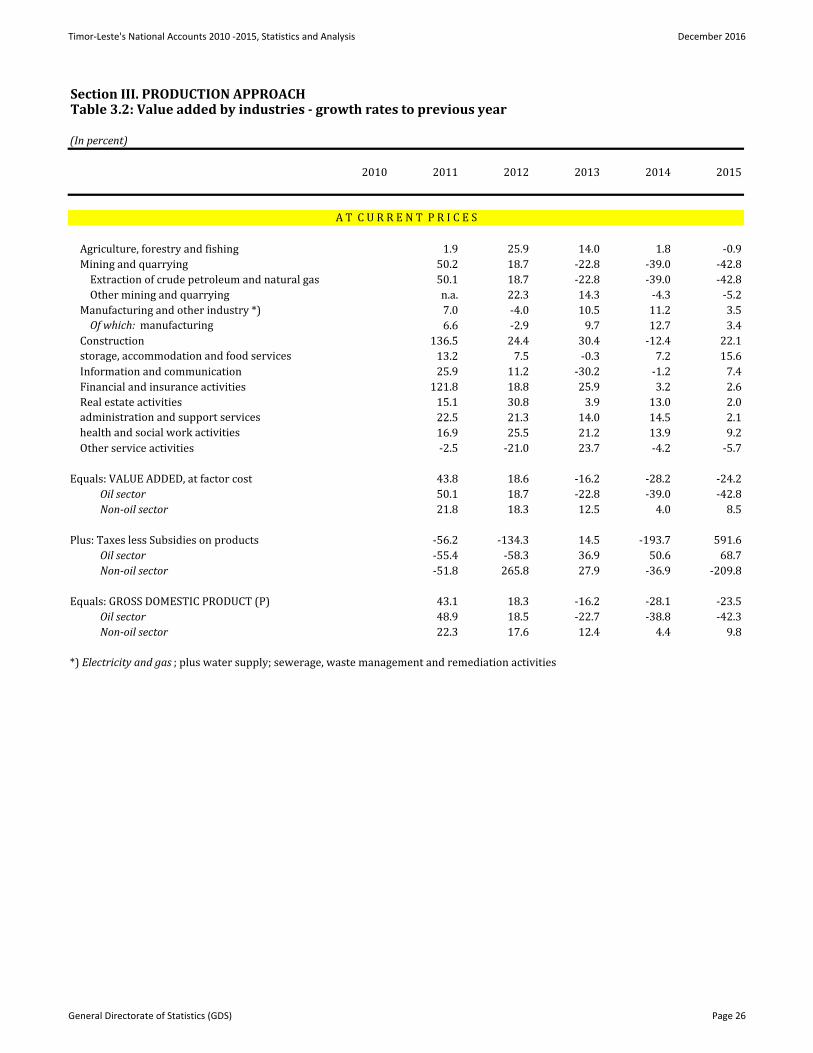
2010 2011 2012 2013 2014 2015
Agriculture, forestry and fishing 1.9 25.9 14.0 1.8 -0.9
Mining and quarrying 50.2 18.7 -22.8 -39.0 -42.8
Extraction of crude petroleum and natural gas 50.1 18.7 -22.8 -39.0 -42.8
Other mining and quarrying n.a. 22.3 14.3 -4.3 -5.2
Manufacturing and other industry *) 7.0 -4.0 10.5 11.2 3.5
Of which: manufacturing 6.6 -2.9 9.7 12.7 3.4
Construction 136.5 24.4 30.4 -12.4 22.1Wholesale and retail trade, transportation and
storage, accommodation and food services 13.2 7.5 -0.3 7.2 15.6
Information and communication 25.9 11.2 -30.2 -1.2 7.4
Financial and insurance activities 121.8 18.8 25.9 3.2 2.6
Real estate activities 15.1 30.8 3.9 13.0 2.0Professional, scientific, technical,
administration and support services 22.5 21.3 14.0 14.5 2.1Public admin., defence, education, human
health and social work activities 16.9 25.5 21.2 13.9 9.2
Other service activities -2.5 -21.0 23.7 -4.2 -5.7
Equals: VALUE ADDED, at factor cost 43.8 18.6 -16.2 -28.2 -24.2
Oil sector 50.1 18.7 -22.8 -39.0 -42.8
Non-oil sector 21.8 18.3 12.5 4.0 8.5
Plus: Taxes less Subsidies on products -56.2 -134.3 14.5 -193.7 591.6
Oil sector -55.4 -58.3 36.9 50.6 68.7
Non-oil sector -51.8 265.8 27.9 -36.9 -209.8
Equals: GROSS DOMESTIC PRODUCT (P) 43.1 18.3 -16.2 -28.1 -23.5
Oil sector 48.9 18.5 -22.7 -38.8 -42.3
Non-oil sector 22.3 17.6 12.4 4.4 9.8
*) Electricity and gas ; plus water supply; sewerage, waste management and remediation activities
A T C U R R E N T P R I C E S
General Directorate of Statistics (GDS) Page 26
Timor-Leste's National Accounts 2010 -2015, Statistics and Analysis December 2016
Section III. PRODUCTION APPROACHTable 3.2: Value added by industries - growth rates to previous year
(In percent)
2010 2011 2012 2013 2014 2015
Agriculture, forestry and fishing -14.7 8.9 7.1 -0.5 0.3
Mining and quarrying 16.3 5.2 -19.1 -49.0 46.0
Extraction of crude petroleum and natural gas 16.3 5.2 -19.1 -49.1 46.1
Other mining and quarrying 1254.4 12.9 4.0 -1.1 0.5
Manufacturing and other industry *) -2.4 -11.9 1.1 10.3 2.5
Of which: manufacturing -3.0 -10.8 0.3 11.7 2.2
Construction 48.9 -10.4 -4.2 -10.8 25.8Wholesale and retail trade, transportation and
storage, accommodation and food services 8.1 0.4 -10.9 3.3 1.6
Information and communication 34.9 19.7 -20.1 4.2 7.9
Financial and insurance activities 177.9 6.4 13.7 2.4 2.0
Real estate activities 9.5 23.7 5.3 14.5 1.8Professional, scientific, technical,
administration and support services 46.3 9.8 6.2 16.7 -1.1Public admin., defence, education, human
health and social work activities 14.4 12.2 13.2 17.4 5.2
Other service activities -8.0 -20.9 22.1 -4.1 1.5
Equals: VALUE ADDED, GROSS, at factor cost 14.5 4.6 -11.5 -26.5 22.1
Oil sector 16.3 5.2 -19.1 -49.1 46.1
Non-oil sector 11.8 3.5 1.5 4.5 6.0
Plus: Taxes less Subsidies on products -23.5 -14.7 3.7 11.0 -34.4
Oil sector -60.4 -62.7 23.7 49.4 67.7
Non-oil sector 91.3 16.2 -0.4 1.2 -73.0
Equals: GROSS DOMESTIC PRODUCT (P) 13.8 4.3 -11.3 -26.0 21.0
Oil sector 14.4 4.6 -19.0 -48.6 46.4
Non-oil sector 12.8 3.8 1.5 4.4 4.2
*) Electricity and gas ; plus water supply; sewerage, waste management and remediation activities
A T C O N S T A N T P R I C E S
General Directorate of Statistics (GDS) Page 27
Timor-Leste's National Accounts 2010 -2015, Statistics and Analysis December 2016
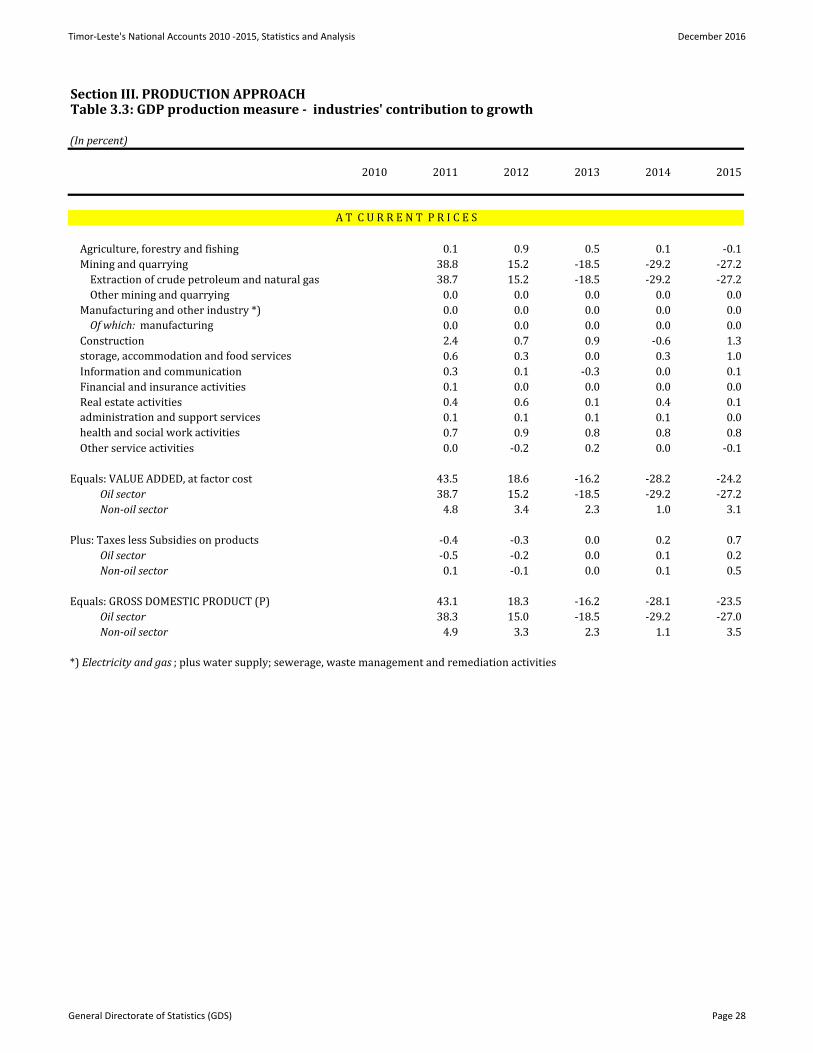
Section III. PRODUCTION APPROACHTable 3.3: GDP production measure - industries' contribution to growth
(In percent)
2010 2011 2012 2013 2014 2015
Agriculture, forestry and fishing 0.1 0.9 0.5 0.1 -0.1
Mining and quarrying 38.8 15.2 -18.5 -29.2 -27.2
Extraction of crude petroleum and natural gas 38.7 15.2 -18.5 -29.2 -27.2
Other mining and quarrying 0.0 0.0 0.0 0.0 0.0
Manufacturing and other industry *) 0.0 0.0 0.0 0.0 0.0
Of which: manufacturing 0.0 0.0 0.0 0.0 0.0
Construction 2.4 0.7 0.9 -0.6 1.3Wholesale and retail trade, transportation and
storage, accommodation and food services 0.6 0.3 0.0 0.3 1.0
Information and communication 0.3 0.1 -0.3 0.0 0.1
Financial and insurance activities 0.1 0.0 0.0 0.0 0.0
Real estate activities 0.4 0.6 0.1 0.4 0.1Professional, scientific, technical,
administration and support services 0.1 0.1 0.1 0.1 0.0Public admin., defence, education, human
health and social work activities 0.7 0.9 0.8 0.8 0.8
Other service activities 0.0 -0.2 0.2 0.0 -0.1
Equals: VALUE ADDED, at factor cost 43.5 18.6 -16.2 -28.2 -24.2
Oil sector 38.7 15.2 -18.5 -29.2 -27.2
Non-oil sector 4.8 3.4 2.3 1.0 3.1
Plus: Taxes less Subsidies on products -0.4 -0.3 0.0 0.2 0.7
Oil sector -0.5 -0.2 0.0 0.1 0.2
Non-oil sector 0.1 -0.1 0.0 0.1 0.5
Equals: GROSS DOMESTIC PRODUCT (P) 43.1 18.3 -16.2 -28.1 -23.5
Oil sector 38.3 15.0 -18.5 -29.2 -27.0
Non-oil sector 4.9 3.3 2.3 1.1 3.5
*) Electricity and gas ; plus water supply; sewerage, waste management and remediation activities
A T C U R R E N T P R I C E S
General Directorate of Statistics (GDS) Page 28
Timor-Leste's National Accounts 2010 -2015, Statistics and Analysis December 2016
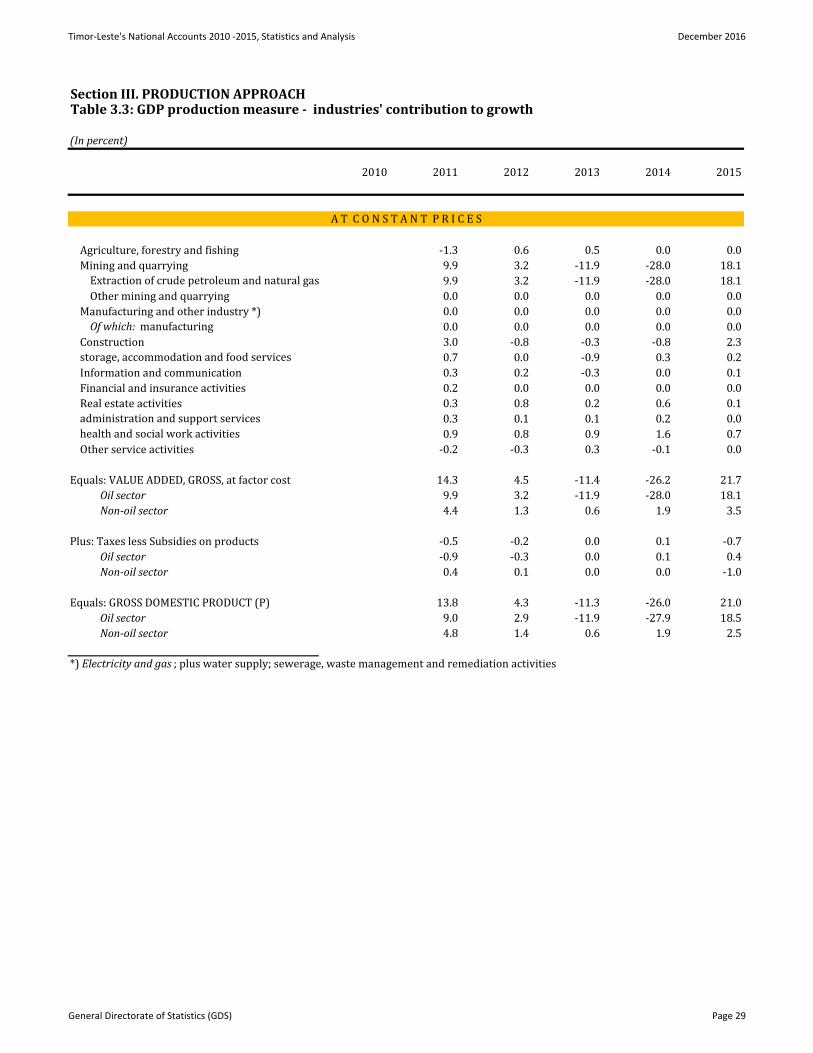
Section III. PRODUCTION APPROACHTable 3.3: GDP production measure - industries' contribution to growth
(In percent)
2010 2011 2012 2013 2014 2015
Agriculture, forestry and fishing -1.3 0.6 0.5 0.0 0.0
Mining and quarrying 9.9 3.2 -11.9 -28.0 18.1
Extraction of crude petroleum and natural gas 9.9 3.2 -11.9 -28.0 18.1
Other mining and quarrying 0.0 0.0 0.0 0.0 0.0
Manufacturing and other industry *) 0.0 0.0 0.0 0.0 0.0
Of which: manufacturing 0.0 0.0 0.0 0.0 0.0
Construction 3.0 -0.8 -0.3 -0.8 2.3Wholesale and retail trade, transportation and
storage, accommodation and food services 0.7 0.0 -0.9 0.3 0.2
Information and communication 0.3 0.2 -0.3 0.0 0.1
Financial and insurance activities 0.2 0.0 0.0 0.0 0.0
Real estate activities 0.3 0.8 0.2 0.6 0.1Professional, scientific, technical,
administration and support services 0.3 0.1 0.1 0.2 0.0Public admin., defence, education, human
health and social work activities 0.9 0.8 0.9 1.6 0.7
Other service activities -0.2 -0.3 0.3 -0.1 0.0
Equals: VALUE ADDED, GROSS, at factor cost 14.3 4.5 -11.4 -26.2 21.7
Oil sector 9.9 3.2 -11.9 -28.0 18.1
Non-oil sector 4.4 1.3 0.6 1.9 3.5
Plus: Taxes less Subsidies on products -0.5 -0.2 0.0 0.1 -0.7
Oil sector -0.9 -0.3 0.0 0.1 0.4
Non-oil sector 0.4 0.1 0.0 0.0 -1.0
Equals: GROSS DOMESTIC PRODUCT (P) 13.8 4.3 -11.3 -26.0 21.0
Oil sector 9.0 2.9 -11.9 -27.9 18.5
Non-oil sector 4.8 1.4 0.6 1.9 2.5
*) Electricity and gas ; plus water supply; sewerage, waste management and remediation activities
A T C O N S T A N T P R I C E S
General Directorate of Statistics (GDS) Page 29
Timor-Leste's National Accounts 2010 -2015, Statistics and Analysis December 2016
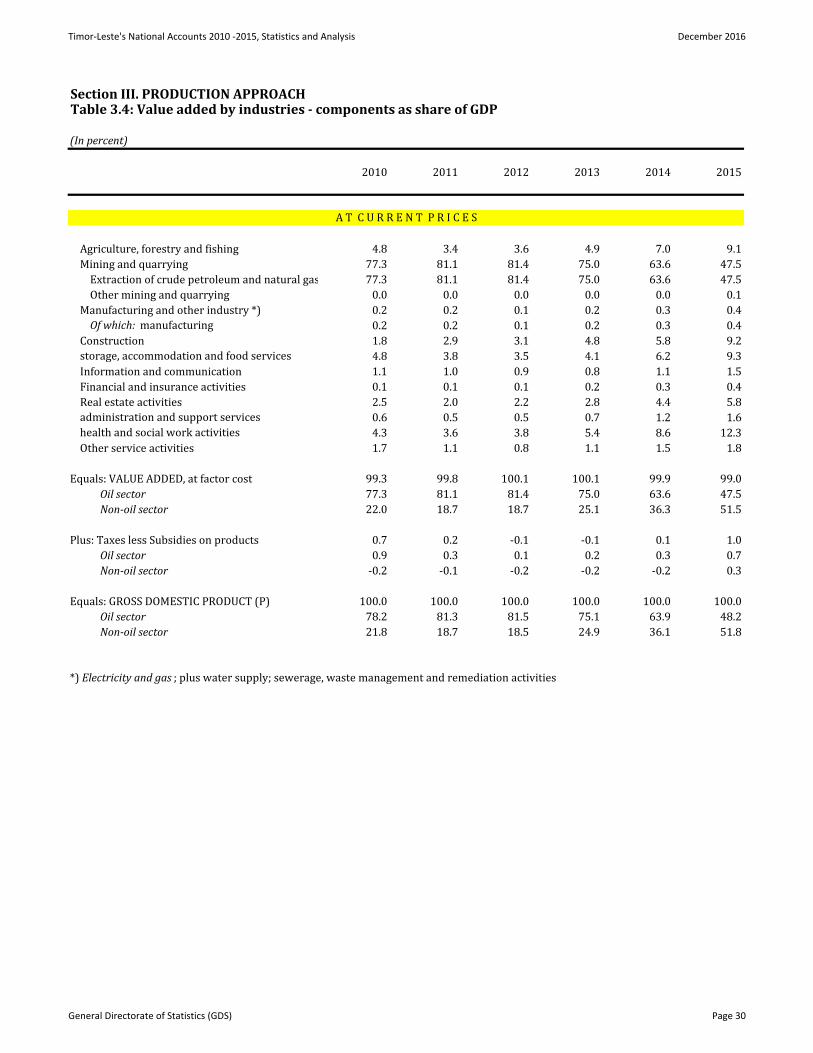
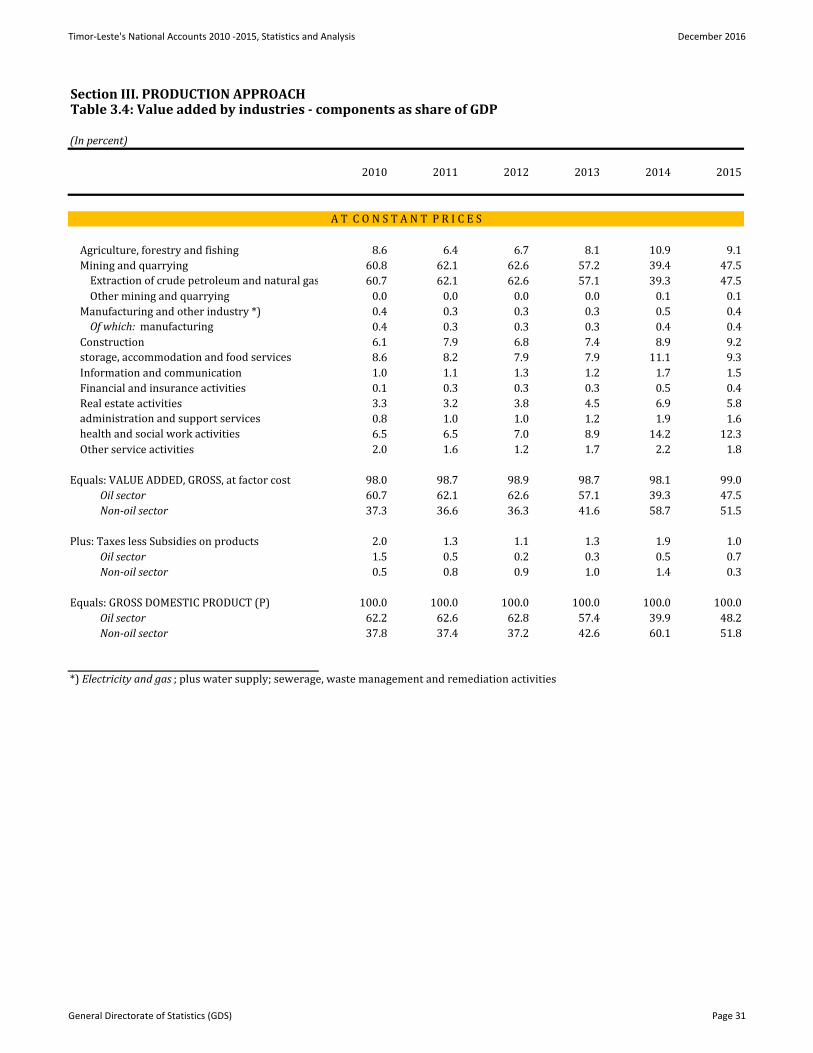
Section III. PRODUCTION APPROACHTable 3.4: Value added by industries - components as share of GDP
(In percent)
2010 2011 2012 2013 2014 2015
Agriculture, forestry and fishing 4.8 3.4 3.6 4.9 7.0 9.1
Mining and quarrying 77.3 81.1 81.4 75.0 63.6 47.5
Extraction of crude petroleum and natural gas 77.3 81.1 81.4 75.0 63.6 47.5
Other mining and quarrying 0.0 0.0 0.0 0.0 0.0 0.1
Manufacturing and other industry *) 0.2 0.2 0.1 0.2 0.3 0.4
Of which: manufacturing 0.2 0.2 0.1 0.2 0.3 0.4
Construction 1.8 2.9 3.1 4.8 5.8 9.2Wholesale and retail trade, transportation and
storage, accommodation and food services 4.8 3.8 3.5 4.1 6.2 9.3
Information and communication 1.1 1.0 0.9 0.8 1.1 1.5
Financial and insurance activities 0.1 0.1 0.1 0.2 0.3 0.4
Real estate activities 2.5 2.0 2.2 2.8 4.4 5.8Professional, scientific, technical,
administration and support services 0.6 0.5 0.5 0.7 1.2 1.6Public admin., defence, education, human
health and social work activities 4.3 3.6 3.8 5.4 8.6 12.3
Other service activities 1.7 1.1 0.8 1.1 1.5 1.8
Equals: VALUE ADDED, at factor cost 99.3 99.8 100.1 100.1 99.9 99.0
Oil sector 77.3 81.1 81.4 75.0 63.6 47.5
Non-oil sector 22.0 18.7 18.7 25.1 36.3 51.5
Plus: Taxes less Subsidies on products 0.7 0.2 -0.1 -0.1 0.1 1.0
Oil sector 0.9 0.3 0.1 0.2 0.3 0.7
Non-oil sector -0.2 -0.1 -0.2 -0.2 -0.2 0.3
Equals: GROSS DOMESTIC PRODUCT (P) 100.0 100.0 100.0 100.0 100.0 100.0
Oil sector 78.2 81.3 81.5 75.1 63.9 48.2
Non-oil sector 21.8 18.7 18.5 24.9 36.1 51.8
*) Electricity and gas ; plus water supply; sewerage, waste management and remediation activities
A T C U R R E N T P R I C E S
General Directorate of Statistics (GDS) Page 30
Timor-Leste's National Accounts 2010 -2015, Statistics and Analysis December 2016
Section III. PRODUCTION APPROACHTable 3.4: Value added by industries - components as share of GDP
(In percent)
2010 2011 2012 2013 2014 2015
Agriculture, forestry and fishing 8.6 6.4 6.7 8.1 10.9 9.1
Mining and quarrying 60.8 62.1 62.6 57.2 39.4 47.5
Extraction of crude petroleum and natural gas 60.7 62.1 62.6 57.1 39.3 47.5
Other mining and quarrying 0.0 0.0 0.0 0.0 0.1 0.1
Manufacturing and other industry *) 0.4 0.3 0.3 0.3 0.5 0.4
Of which: manufacturing 0.4 0.3 0.3 0.3 0.4 0.4
Construction 6.1 7.9 6.8 7.4 8.9 9.2Wholesale and retail trade, transportation and
storage, accommodation and food services 8.6 8.2 7.9 7.9 11.1 9.3
Information and communication 1.0 1.1 1.3 1.2 1.7 1.5
Financial and insurance activities 0.1 0.3 0.3 0.3 0.5 0.4
Real estate activities 3.3 3.2 3.8 4.5 6.9 5.8Professional, scientific, technical,
administration and support services 0.8 1.0 1.0 1.2 1.9 1.6Public admin., defence, education, human
health and social work activities 6.5 6.5 7.0 8.9 14.2 12.3
Other service activities 2.0 1.6 1.2 1.7 2.2 1.8
Equals: VALUE ADDED, GROSS, at factor cost 98.0 98.7 98.9 98.7 98.1 99.0
Oil sector 60.7 62.1 62.6 57.1 39.3 47.5
Non-oil sector 37.3 36.6 36.3 41.6 58.7 51.5
Plus: Taxes less Subsidies on products 2.0 1.3 1.1 1.3 1.9 1.0
Oil sector 1.5 0.5 0.2 0.3 0.5 0.7
Non-oil sector 0.5 0.8 0.9 1.0 1.4 0.3
Equals: GROSS DOMESTIC PRODUCT (P) 100.0 100.0 100.0 100.0 100.0 100.0
Oil sector 62.2 62.6 62.8 57.4 39.9 48.2
Non-oil sector 37.8 37.4 37.2 42.6 60.1 51.8
*) Electricity and gas ; plus water supply; sewerage, waste management and remediation activities
A T C O N S T A N T P R I C E S
General Directorate of Statistics (GDS) Page 31
Timor-Leste's National Accounts 2010 -2015, Statistics and Analysis December 2016
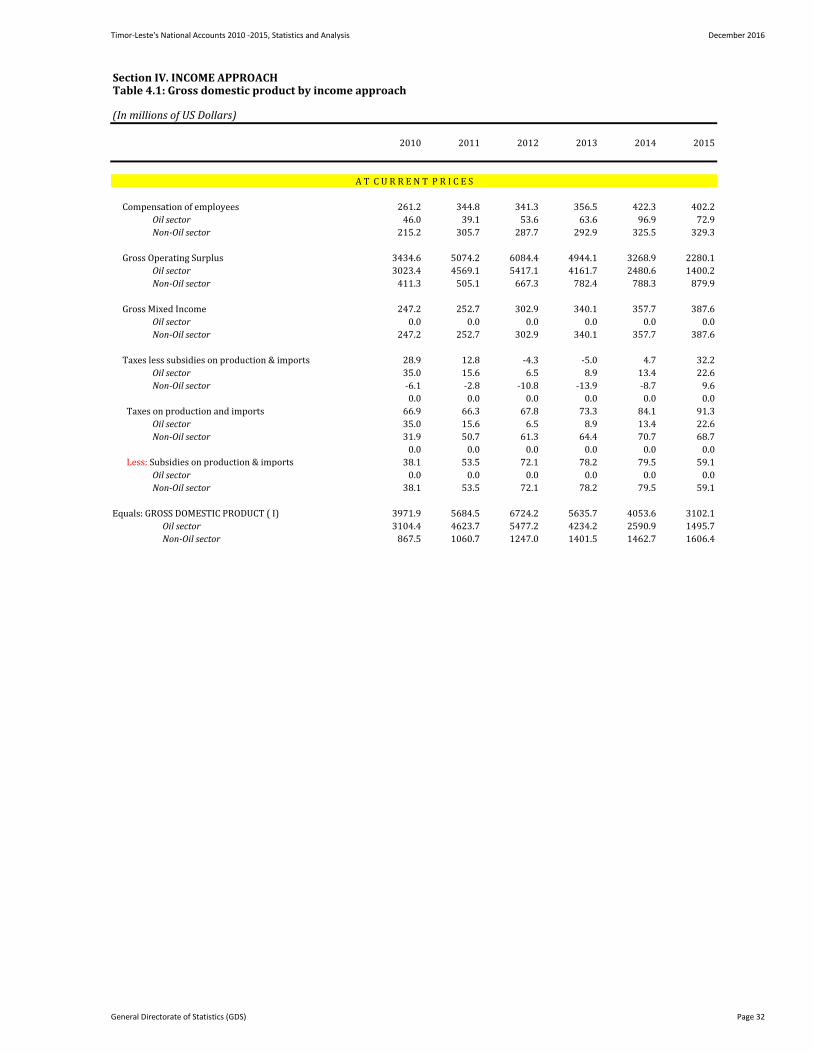
Section IV. INCOME APPROACHTable 4.1: Gross domestic product by income approach
(In millions of US Dollars)
2010 2011 2012 2013 2014 2015
Compensation of employees 261.2 344.8 341.3 356.5 422.3 402.2
Oil sector 46.0 39.1 53.6 63.6 96.9 72.9
Non-Oil sector 215.2 305.7 287.7 292.9 325.5 329.3
Gross Operating Surplus 3434.6 5074.2 6084.4 4944.1 3268.9 2280.1
Oil sector 3023.4 4569.1 5417.1 4161.7 2480.6 1400.2
Non-Oil sector 411.3 505.1 667.3 782.4 788.3 879.9
Gross Mixed Income 247.2 252.7 302.9 340.1 357.7 387.6
Oil sector 0.0 0.0 0.0 0.0 0.0 0.0
Non-Oil sector 247.2 252.7 302.9 340.1 357.7 387.6
Taxes less subsidies on production & imports 28.9 12.8 -4.3 -5.0 4.7 32.2
Oil sector 35.0 15.6 6.5 8.9 13.4 22.6
Non-Oil sector -6.1 -2.8 -10.8 -13.9 -8.7 9.6
0.0 0.0 0.0 0.0 0.0 0.0
Taxes on production and imports 66.9 66.3 67.8 73.3 84.1 91.3
Oil sector 35.0 15.6 6.5 8.9 13.4 22.6
Non-Oil sector 31.9 50.7 61.3 64.4 70.7 68.7
0.0 0.0 0.0 0.0 0.0 0.0
Less: Subsidies on production & imports 38.1 53.5 72.1 78.2 79.5 59.1
Oil sector 0.0 0.0 0.0 0.0 0.0 0.0
Non-Oil sector 38.1 53.5 72.1 78.2 79.5 59.1
Equals: GROSS DOMESTIC PRODUCT ( I) 3971.9 5684.5 6724.2 5635.7 4053.6 3102.1
Oil sector 3104.4 4623.7 5477.2 4234.2 2590.9 1495.7
Non-Oil sector 867.5 1060.7 1247.0 1401.5 1462.7 1606.4
A T C U R R E N T P R I C E S
General Directorate of Statistics (GDS) Page 32
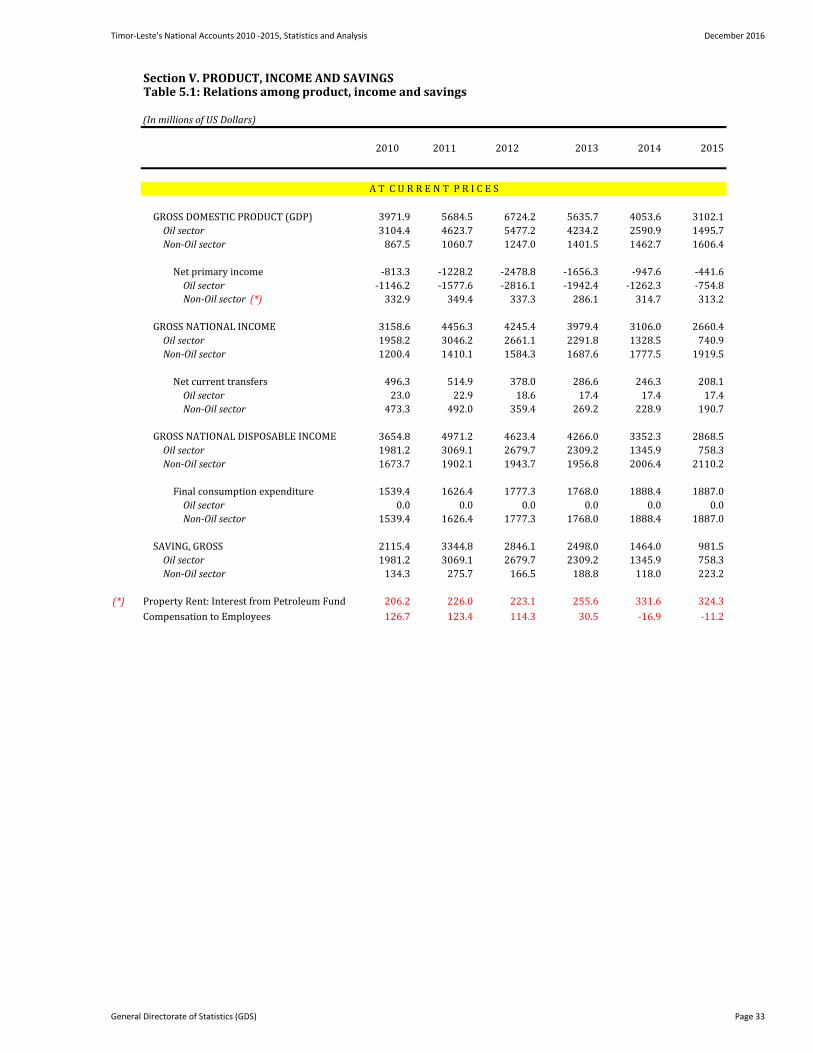
Timor-Leste's National Accounts 2010 -2015, Statistics and Analysis December 2016
Section V. PRODUCT, INCOME AND SAVINGSTable 5.1: Relations among product, income and savings
(In millions of US Dollars)
2010 2011 2012 2013 2014 2015
GROSS DOMESTIC PRODUCT (GDP) 3971.9 5684.5 6724.2 5635.7 4053.6 3102.1
Oil sector 3104.4 4623.7 5477.2 4234.2 2590.9 1495.7
Non-Oil sector 867.5 1060.7 1247.0 1401.5 1462.7 1606.4
Net primary income -813.3 -1228.2 -2478.8 -1656.3 -947.6 -441.6
Oil sector -1146.2 -1577.6 -2816.1 -1942.4 -1262.3 -754.8
Non-Oil sector (*) 332.9 349.4 337.3 286.1 314.7 313.2
GROSS NATIONAL INCOME 3158.6 4456.3 4245.4 3979.4 3106.0 2660.4
Oil sector 1958.2 3046.2 2661.1 2291.8 1328.5 740.9
Non-Oil sector 1200.4 1410.1 1584.3 1687.6 1777.5 1919.5
Net current transfers 496.3 514.9 378.0 286.6 246.3 208.1
Oil sector 23.0 22.9 18.6 17.4 17.4 17.4
Non-Oil sector 473.3 492.0 359.4 269.2 228.9 190.7
GROSS NATIONAL DISPOSABLE INCOME 3654.8 4971.2 4623.4 4266.0 3352.3 2868.5
Oil sector 1981.2 3069.1 2679.7 2309.2 1345.9 758.3
Non-Oil sector 1673.7 1902.1 1943.7 1956.8 2006.4 2110.2
Final consumption expenditure 1539.4 1626.4 1777.3 1768.0 1888.4 1887.0
Oil sector 0.0 0.0 0.0 0.0 0.0 0.0
Non-Oil sector 1539.4 1626.4 1777.3 1768.0 1888.4 1887.0
SAVING, GROSS 2115.4 3344.8 2846.1 2498.0 1464.0 981.5
Oil sector 1981.2 3069.1 2679.7 2309.2 1345.9 758.3
Non-Oil sector 134.3 275.7 166.5 188.8 118.0 223.2
(*) Property Rent: Interest from Petroleum Fund 206.2 226.0 223.1 255.6 331.6 324.3
Compensation to Employees 126.7 123.4 114.3 30.5 -16.9 -11.2
A T C U R R E N T P R I C E S
General Directorate of Statistics (GDS) Page 33
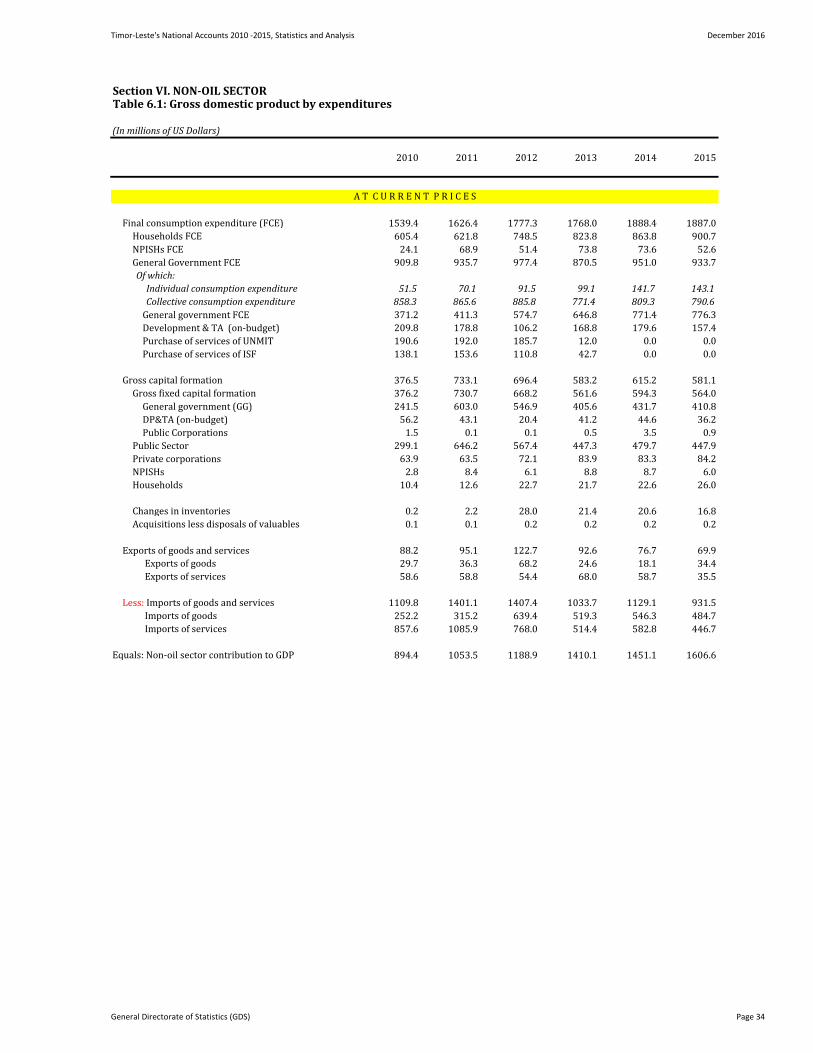
Timor-Leste's National Accounts 2010 -2015, Statistics and Analysis December 2016
Section VI. NON-OIL SECTORTable 6.1: Gross domestic product by expenditures
(In millions of US Dollars)
2010 2011 2012 2013 2014 2015
Final consumption expenditure (FCE) 1539.4 1626.4 1777.3 1768.0 1888.4 1887.0
Households FCE 605.4 621.8 748.5 823.8 863.8 900.7
NPISHs FCE 24.1 68.9 51.4 73.8 73.6 52.6
General Government FCE 909.8 935.7 977.4 870.5 951.0 933.7
Of which:
Individual consumption expenditure 51.5 70.1 91.5 99.1 141.7 143.1
Collective consumption expenditure 858.3 865.6 885.8 771.4 809.3 790.6
General government FCE 371.2 411.3 574.7 646.8 771.4 776.3
Development & TA (on-budget) 209.8 178.8 106.2 168.8 179.6 157.4
Purchase of services of UNMIT 190.6 192.0 185.7 12.0 0.0 0.0
Purchase of services of ISF 138.1 153.6 110.8 42.7 0.0 0.0
Gross capital formation 376.5 733.1 696.4 583.2 615.2 581.1
Gross fixed capital formation 376.2 730.7 668.2 561.6 594.3 564.0
General government (GG) 241.5 603.0 546.9 405.6 431.7 410.8
DP&TA (on-budget) 56.2 43.1 20.4 41.2 44.6 36.2
Public Corporations 1.5 0.1 0.1 0.5 3.5 0.9
Public Sector 299.1 646.2 567.4 447.3 479.7 447.9
Private corporations 63.9 63.5 72.1 83.9 83.3 84.2
NPISHs 2.8 8.4 6.1 8.8 8.7 6.0
Households 10.4 12.6 22.7 21.7 22.6 26.0
Changes in inventories 0.2 2.2 28.0 21.4 20.6 16.8
Acquisitions less disposals of valuables 0.1 0.1 0.2 0.2 0.2 0.2
Exports of goods and services 88.2 95.1 122.7 92.6 76.7 69.9
Exports of goods 29.7 36.3 68.2 24.6 18.1 34.4
Exports of services 58.6 58.8 54.4 68.0 58.7 35.5
Less: Imports of goods and services 1109.8 1401.1 1407.4 1033.7 1129.1 931.5
Imports of goods 252.2 315.2 639.4 519.3 546.3 484.7
Imports of services 857.6 1085.9 768.0 514.4 582.8 446.7
Equals: Non-oil sector contribution to GDP 894.4 1053.5 1188.9 1410.1 1451.1 1606.6
A T C U R R E N T P R I C E S
General Directorate of Statistics (GDS) Page 34
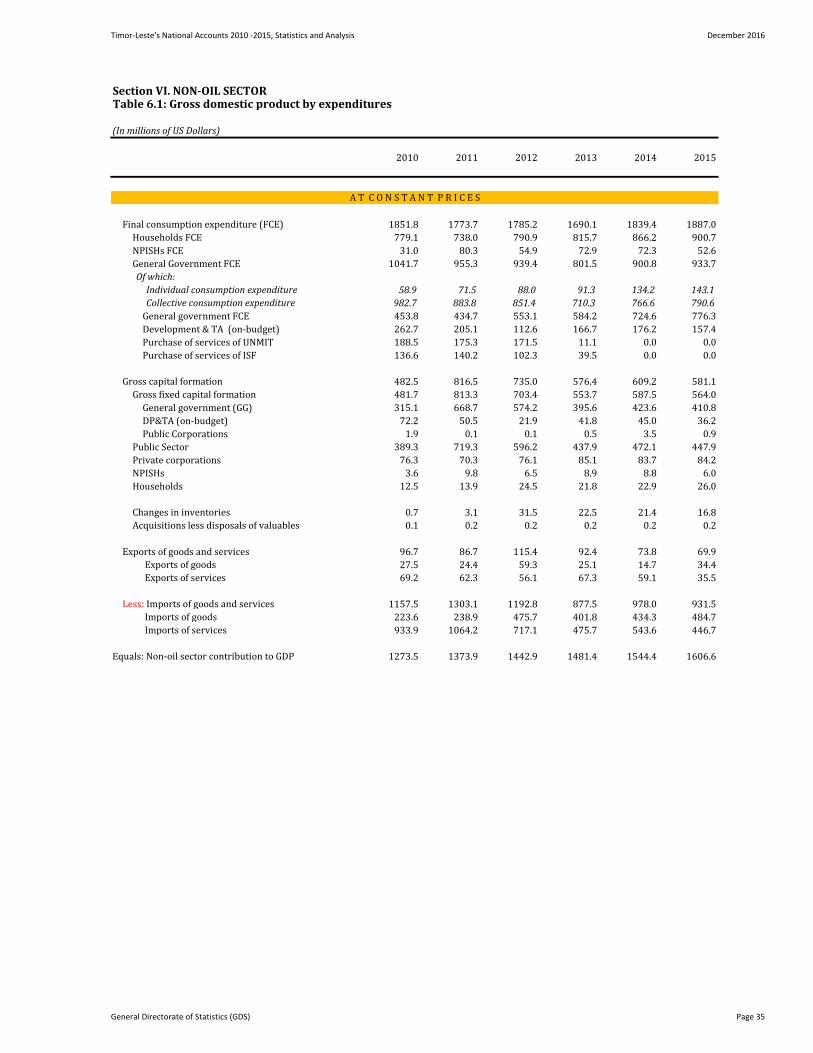
Timor-Leste's National Accounts 2010 -2015, Statistics and Analysis December 2016
Section VI. NON-OIL SECTORTable 6.1: Gross domestic product by expenditures
(In millions of US Dollars)
2010 2011 2012 2013 2014 2015
Final consumption expenditure (FCE) 1851.8 1773.7 1785.2 1690.1 1839.4 1887.0
Households FCE 779.1 738.0 790.9 815.7 866.2 900.7
NPISHs FCE 31.0 80.3 54.9 72.9 72.3 52.6
General Government FCE 1041.7 955.3 939.4 801.5 900.8 933.7
Of which:
Individual consumption expenditure 58.9 71.5 88.0 91.3 134.2 143.1
Collective consumption expenditure 982.7 883.8 851.4 710.3 766.6 790.6
General government FCE 453.8 434.7 553.1 584.2 724.6 776.3
Development & TA (on-budget) 262.7 205.1 112.6 166.7 176.2 157.4
Purchase of services of UNMIT 188.5 175.3 171.5 11.1 0.0 0.0
Purchase of services of ISF 136.6 140.2 102.3 39.5 0.0 0.0
Gross capital formation 482.5 816.5 735.0 576.4 609.2 581.1
Gross fixed capital formation 481.7 813.3 703.4 553.7 587.5 564.0
General government (GG) 315.1 668.7 574.2 395.6 423.6 410.8
DP&TA (on-budget) 72.2 50.5 21.9 41.8 45.0 36.2
Public Corporations 1.9 0.1 0.1 0.5 3.5 0.9
Public Sector 389.3 719.3 596.2 437.9 472.1 447.9
Private corporations 76.3 70.3 76.1 85.1 83.7 84.2
NPISHs 3.6 9.8 6.5 8.9 8.8 6.0
Households 12.5 13.9 24.5 21.8 22.9 26.0
Changes in inventories 0.7 3.1 31.5 22.5 21.4 16.8
Acquisitions less disposals of valuables 0.1 0.2 0.2 0.2 0.2 0.2
Exports of goods and services 96.7 86.7 115.4 92.4 73.8 69.9
Exports of goods 27.5 24.4 59.3 25.1 14.7 34.4
Exports of services 69.2 62.3 56.1 67.3 59.1 35.5
Less: Imports of goods and services 1157.5 1303.1 1192.8 877.5 978.0 931.5
Imports of goods 223.6 238.9 475.7 401.8 434.3 484.7
Imports of services 933.9 1064.2 717.1 475.7 543.6 446.7
Equals: Non-oil sector contribution to GDP 1273.5 1373.9 1442.9 1481.4 1544.4 1606.6
A T C O N S T A N T P R I C E S
General Directorate of Statistics (GDS) Page 35
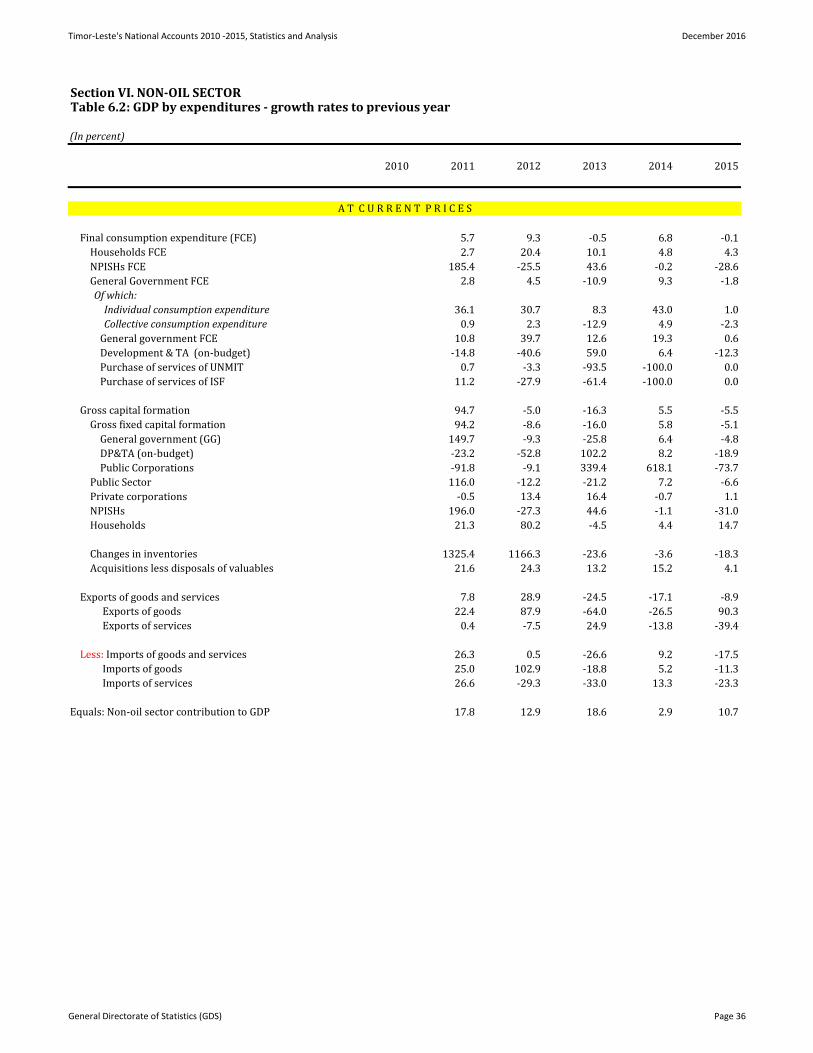
Timor-Leste's National Accounts 2010 -2015, Statistics and Analysis December 2016
Section VI. NON-OIL SECTORTable 6.2: GDP by expenditures - growth rates to previous year
(In percent)
2010 2011 2012 2013 2014 2015
Final consumption expenditure (FCE) 5.7 9.3 -0.5 6.8 -0.1
Households FCE 2.7 20.4 10.1 4.8 4.3
NPISHs FCE 185.4 -25.5 43.6 -0.2 -28.6
General Government FCE 2.8 4.5 -10.9 9.3 -1.8
Of which:
Individual consumption expenditure 36.1 30.7 8.3 43.0 1.0
Collective consumption expenditure 0.9 2.3 -12.9 4.9 -2.3
General government FCE 10.8 39.7 12.6 19.3 0.6
Development & TA (on-budget) -14.8 -40.6 59.0 6.4 -12.3
Purchase of services of UNMIT 0.7 -3.3 -93.5 -100.0 0.0
Purchase of services of ISF 11.2 -27.9 -61.4 -100.0 0.0
Gross capital formation 94.7 -5.0 -16.3 5.5 -5.5
Gross fixed capital formation 94.2 -8.6 -16.0 5.8 -5.1
General government (GG) 149.7 -9.3 -25.8 6.4 -4.8
DP&TA (on-budget) -23.2 -52.8 102.2 8.2 -18.9
Public Corporations -91.8 -9.1 339.4 618.1 -73.7
Public Sector 116.0 -12.2 -21.2 7.2 -6.6
Private corporations -0.5 13.4 16.4 -0.7 1.1
NPISHs 196.0 -27.3 44.6 -1.1 -31.0
Households 21.3 80.2 -4.5 4.4 14.7
Changes in inventories 1325.4 1166.3 -23.6 -3.6 -18.3
Acquisitions less disposals of valuables 21.6 24.3 13.2 15.2 4.1
Exports of goods and services 7.8 28.9 -24.5 -17.1 -8.9
Exports of goods 22.4 87.9 -64.0 -26.5 90.3
Exports of services 0.4 -7.5 24.9 -13.8 -39.4
Less: Imports of goods and services 26.3 0.5 -26.6 9.2 -17.5
Imports of goods 25.0 102.9 -18.8 5.2 -11.3
Imports of services 26.6 -29.3 -33.0 13.3 -23.3
Equals: Non-oil sector contribution to GDP 17.8 12.9 18.6 2.9 10.7
A T C U R R E N T P R I C E S
General Directorate of Statistics (GDS) Page 36
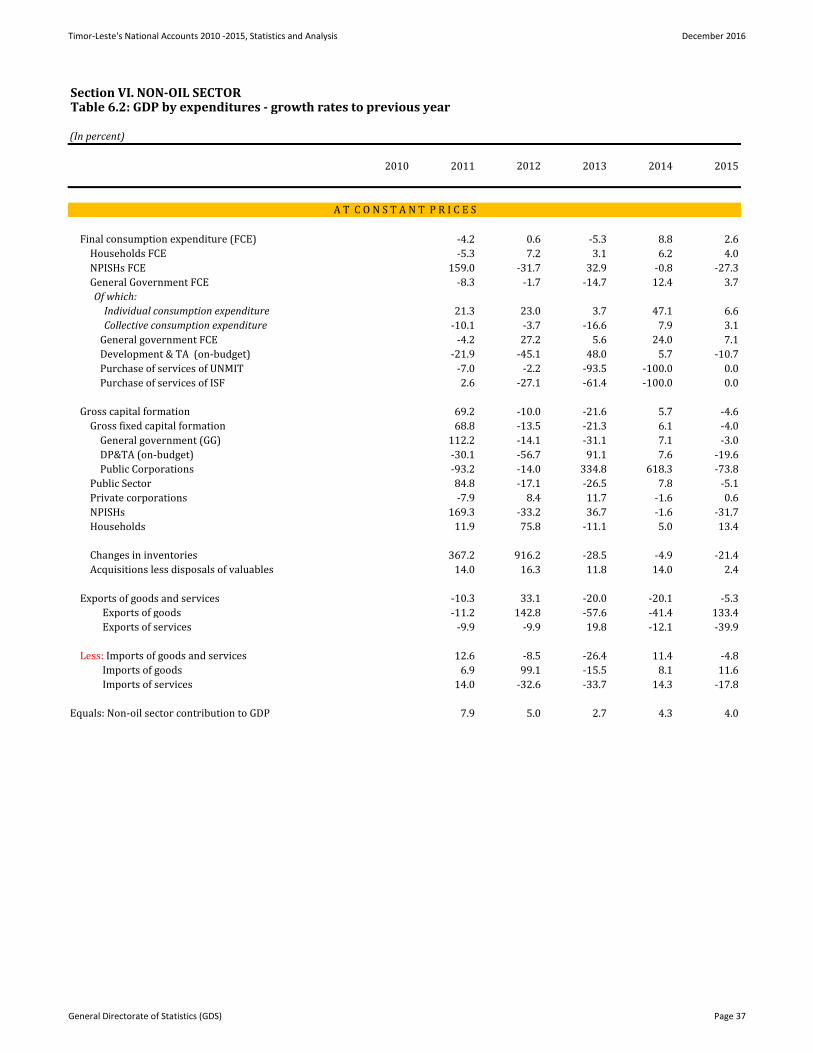
Timor-Leste's National Accounts 2010 -2015, Statistics and Analysis December 2016
Section VI. NON-OIL SECTORTable 6.2: GDP by expenditures - growth rates to previous year
(In percent)
2010 2011 2012 2013 2014 2015
Final consumption expenditure (FCE) -4.2 0.6 -5.3 8.8 2.6
Households FCE -5.3 7.2 3.1 6.2 4.0
NPISHs FCE 159.0 -31.7 32.9 -0.8 -27.3
General Government FCE -8.3 -1.7 -14.7 12.4 3.7
Of which:
Individual consumption expenditure 21.3 23.0 3.7 47.1 6.6
Collective consumption expenditure -10.1 -3.7 -16.6 7.9 3.1
General government FCE -4.2 27.2 5.6 24.0 7.1
Development & TA (on-budget) -21.9 -45.1 48.0 5.7 -10.7
Purchase of services of UNMIT -7.0 -2.2 -93.5 -100.0 0.0
Purchase of services of ISF 2.6 -27.1 -61.4 -100.0 0.0
Gross capital formation 69.2 -10.0 -21.6 5.7 -4.6
Gross fixed capital formation 68.8 -13.5 -21.3 6.1 -4.0
General government (GG) 112.2 -14.1 -31.1 7.1 -3.0
DP&TA (on-budget) -30.1 -56.7 91.1 7.6 -19.6
Public Corporations -93.2 -14.0 334.8 618.3 -73.8
Public Sector 84.8 -17.1 -26.5 7.8 -5.1
Private corporations -7.9 8.4 11.7 -1.6 0.6
NPISHs 169.3 -33.2 36.7 -1.6 -31.7
Households 11.9 75.8 -11.1 5.0 13.4
Changes in inventories 367.2 916.2 -28.5 -4.9 -21.4
Acquisitions less disposals of valuables 14.0 16.3 11.8 14.0 2.4
Exports of goods and services -10.3 33.1 -20.0 -20.1 -5.3
Exports of goods -11.2 142.8 -57.6 -41.4 133.4
Exports of services -9.9 -9.9 19.8 -12.1 -39.9
Less: Imports of goods and services 12.6 -8.5 -26.4 11.4 -4.8
Imports of goods 6.9 99.1 -15.5 8.1 11.6
Imports of services 14.0 -32.6 -33.7 14.3 -17.8
Equals: Non-oil sector contribution to GDP 7.9 5.0 2.7 4.3 4.0
A T C O N S T A N T P R I C E S
General Directorate of Statistics (GDS) Page 37
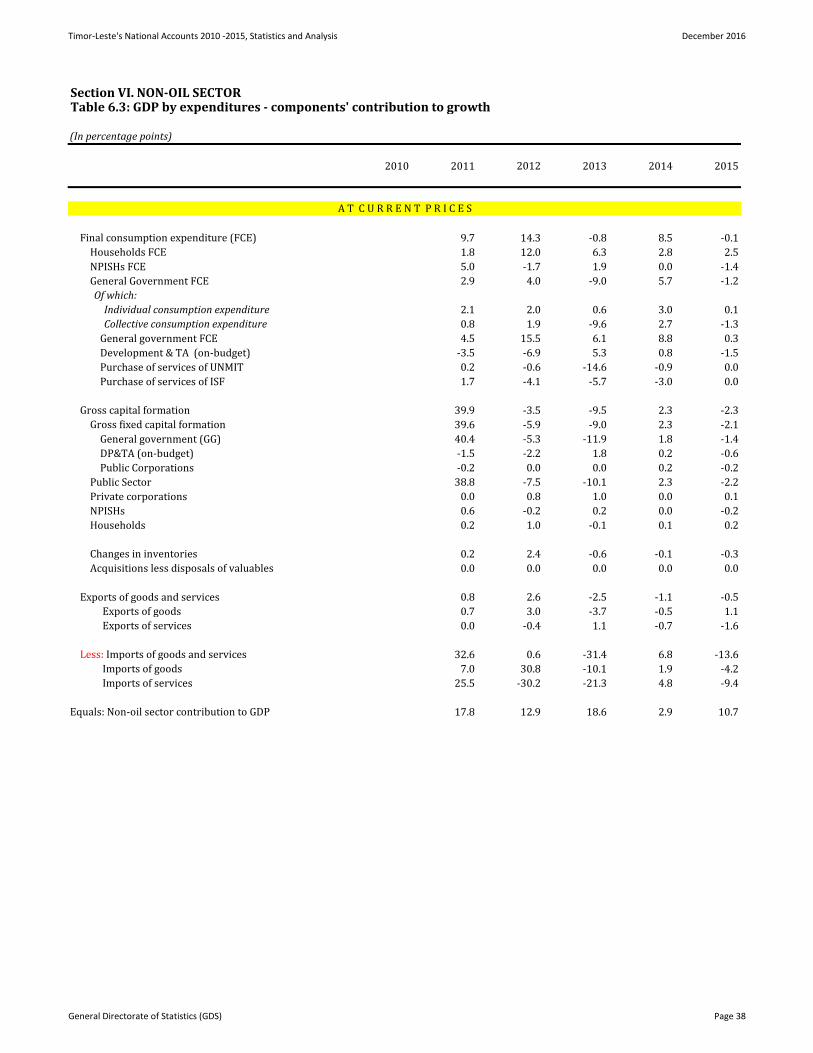
Timor-Leste's National Accounts 2010 -2015, Statistics and Analysis December 2016
Section VI. NON-OIL SECTORTable 6.3: GDP by expenditures - components' contribution to growth
(In percentage points)
2010 2011 2012 2013 2014 2015
Final consumption expenditure (FCE) 9.7 14.3 -0.8 8.5 -0.1
Households FCE 1.8 12.0 6.3 2.8 2.5
NPISHs FCE 5.0 -1.7 1.9 0.0 -1.4
General Government FCE 2.9 4.0 -9.0 5.7 -1.2
Of which:
Individual consumption expenditure 2.1 2.0 0.6 3.0 0.1
Collective consumption expenditure 0.8 1.9 -9.6 2.7 -1.3
General government FCE 4.5 15.5 6.1 8.8 0.3
Development & TA (on-budget) -3.5 -6.9 5.3 0.8 -1.5
Purchase of services of UNMIT 0.2 -0.6 -14.6 -0.9 0.0
Purchase of services of ISF 1.7 -4.1 -5.7 -3.0 0.0
Gross capital formation 39.9 -3.5 -9.5 2.3 -2.3
Gross fixed capital formation 39.6 -5.9 -9.0 2.3 -2.1
General government (GG) 40.4 -5.3 -11.9 1.8 -1.4
DP&TA (on-budget) -1.5 -2.2 1.8 0.2 -0.6
Public Corporations -0.2 0.0 0.0 0.2 -0.2
Public Sector 38.8 -7.5 -10.1 2.3 -2.2
Private corporations 0.0 0.8 1.0 0.0 0.1
NPISHs 0.6 -0.2 0.2 0.0 -0.2
Households 0.2 1.0 -0.1 0.1 0.2
Changes in inventories 0.2 2.4 -0.6 -0.1 -0.3
Acquisitions less disposals of valuables 0.0 0.0 0.0 0.0 0.0
Exports of goods and services 0.8 2.6 -2.5 -1.1 -0.5
Exports of goods 0.7 3.0 -3.7 -0.5 1.1
Exports of services 0.0 -0.4 1.1 -0.7 -1.6
Less: Imports of goods and services 32.6 0.6 -31.4 6.8 -13.6
Imports of goods 7.0 30.8 -10.1 1.9 -4.2
Imports of services 25.5 -30.2 -21.3 4.8 -9.4
Equals: Non-oil sector contribution to GDP 17.8 12.9 18.6 2.9 10.7
A T C U R R E N T P R I C E S
General Directorate of Statistics (GDS) Page 38
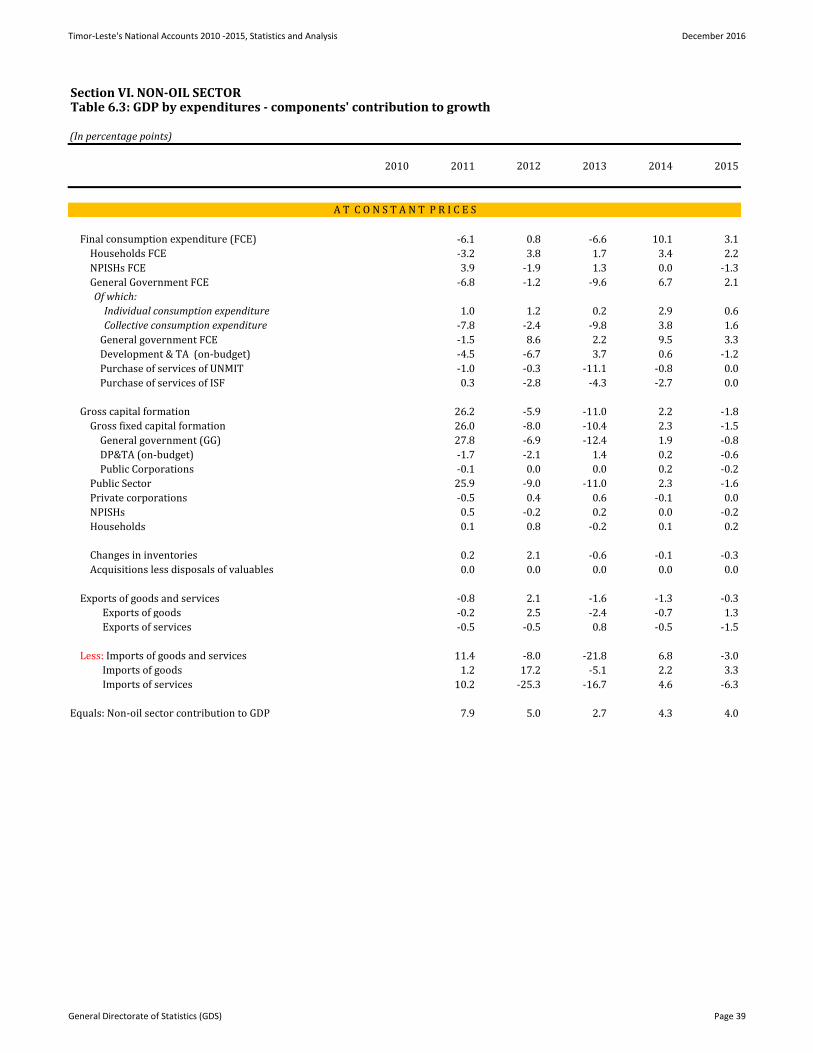
Timor-Leste's National Accounts 2010 -2015, Statistics and Analysis December 2016
Section VI. NON-OIL SECTORTable 6.3: GDP by expenditures - components' contribution to growth
(In percentage points)
2010 2011 2012 2013 2014 2015
Final consumption expenditure (FCE) -6.1 0.8 -6.6 10.1 3.1
Households FCE -3.2 3.8 1.7 3.4 2.2
NPISHs FCE 3.9 -1.9 1.3 0.0 -1.3
General Government FCE -6.8 -1.2 -9.6 6.7 2.1
Of which:
Individual consumption expenditure 1.0 1.2 0.2 2.9 0.6
Collective consumption expenditure -7.8 -2.4 -9.8 3.8 1.6
General government FCE -1.5 8.6 2.2 9.5 3.3
Development & TA (on-budget) -4.5 -6.7 3.7 0.6 -1.2
Purchase of services of UNMIT -1.0 -0.3 -11.1 -0.8 0.0
Purchase of services of ISF 0.3 -2.8 -4.3 -2.7 0.0
Gross capital formation 26.2 -5.9 -11.0 2.2 -1.8
Gross fixed capital formation 26.0 -8.0 -10.4 2.3 -1.5
General government (GG) 27.8 -6.9 -12.4 1.9 -0.8
DP&TA (on-budget) -1.7 -2.1 1.4 0.2 -0.6
Public Corporations -0.1 0.0 0.0 0.2 -0.2
Public Sector 25.9 -9.0 -11.0 2.3 -1.6
Private corporations -0.5 0.4 0.6 -0.1 0.0
NPISHs 0.5 -0.2 0.2 0.0 -0.2
Households 0.1 0.8 -0.2 0.1 0.2
Changes in inventories 0.2 2.1 -0.6 -0.1 -0.3
Acquisitions less disposals of valuables 0.0 0.0 0.0 0.0 0.0
Exports of goods and services -0.8 2.1 -1.6 -1.3 -0.3
Exports of goods -0.2 2.5 -2.4 -0.7 1.3
Exports of services -0.5 -0.5 0.8 -0.5 -1.5
Less: Imports of goods and services 11.4 -8.0 -21.8 6.8 -3.0
Imports of goods 1.2 17.2 -5.1 2.2 3.3
Imports of services 10.2 -25.3 -16.7 4.6 -6.3
Equals: Non-oil sector contribution to GDP 7.9 5.0 2.7 4.3 4.0
A T C O N S T A N T P R I C E S
General Directorate of Statistics (GDS) Page 39
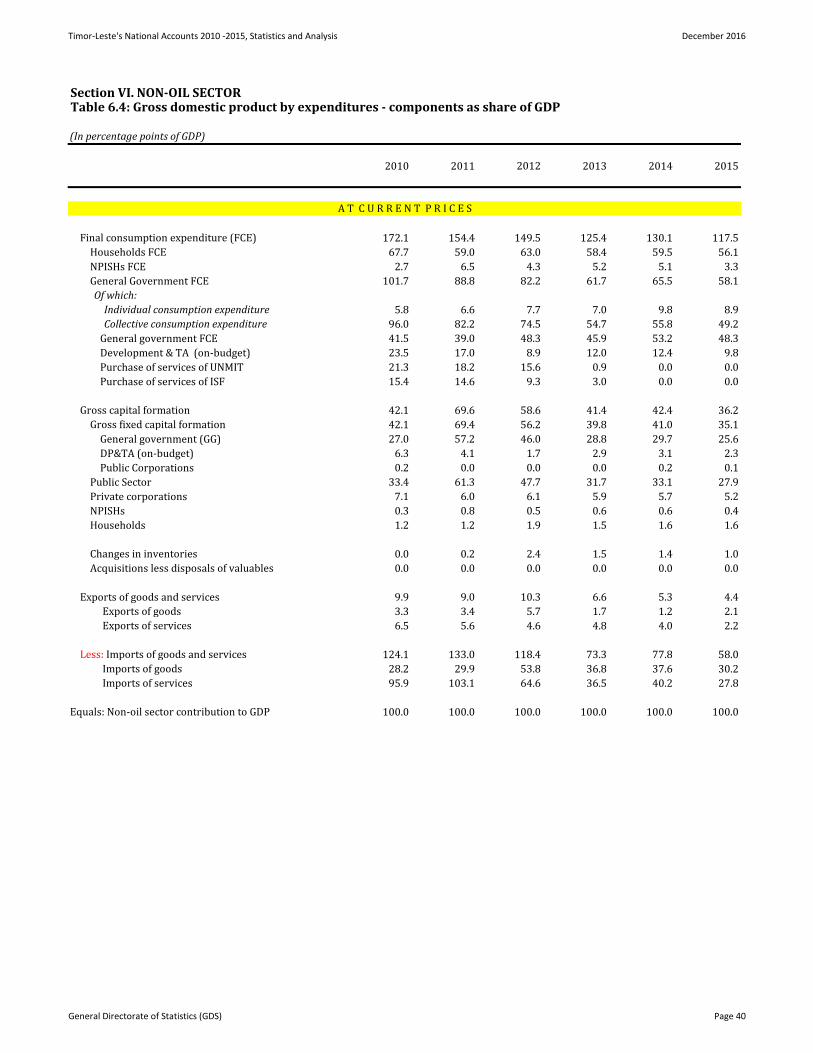
Timor-Leste's National Accounts 2010 -2015, Statistics and Analysis December 2016
Section VI. NON-OIL SECTORTable 6.4: Gross domestic product by expenditures - components as share of GDP
(In percentage points of GDP)
2010 2011 2012 2013 2014 2015
Final consumption expenditure (FCE) 172.1 154.4 149.5 125.4 130.1 117.5
Households FCE 67.7 59.0 63.0 58.4 59.5 56.1
NPISHs FCE 2.7 6.5 4.3 5.2 5.1 3.3
General Government FCE 101.7 88.8 82.2 61.7 65.5 58.1
Of which:
Individual consumption expenditure 5.8 6.6 7.7 7.0 9.8 8.9
Collective consumption expenditure 96.0 82.2 74.5 54.7 55.8 49.2
General government FCE 41.5 39.0 48.3 45.9 53.2 48.3
Development & TA (on-budget) 23.5 17.0 8.9 12.0 12.4 9.8
Purchase of services of UNMIT 21.3 18.2 15.6 0.9 0.0 0.0
Purchase of services of ISF 15.4 14.6 9.3 3.0 0.0 0.0
Gross capital formation 42.1 69.6 58.6 41.4 42.4 36.2
Gross fixed capital formation 42.1 69.4 56.2 39.8 41.0 35.1
General government (GG) 27.0 57.2 46.0 28.8 29.7 25.6
DP&TA (on-budget) 6.3 4.1 1.7 2.9 3.1 2.3
Public Corporations 0.2 0.0 0.0 0.0 0.2 0.1
Public Sector 33.4 61.3 47.7 31.7 33.1 27.9
Private corporations 7.1 6.0 6.1 5.9 5.7 5.2
NPISHs 0.3 0.8 0.5 0.6 0.6 0.4
Households 1.2 1.2 1.9 1.5 1.6 1.6
Changes in inventories 0.0 0.2 2.4 1.5 1.4 1.0
Acquisitions less disposals of valuables 0.0 0.0 0.0 0.0 0.0 0.0
Exports of goods and services 9.9 9.0 10.3 6.6 5.3 4.4
Exports of goods 3.3 3.4 5.7 1.7 1.2 2.1
Exports of services 6.5 5.6 4.6 4.8 4.0 2.2
Less: Imports of goods and services 124.1 133.0 118.4 73.3 77.8 58.0
Imports of goods 28.2 29.9 53.8 36.8 37.6 30.2
Imports of services 95.9 103.1 64.6 36.5 40.2 27.8
Equals: Non-oil sector contribution to GDP 100.0 100.0 100.0 100.0 100.0 100.0
A T C U R R E N T P R I C E S
General Directorate of Statistics (GDS) Page 40
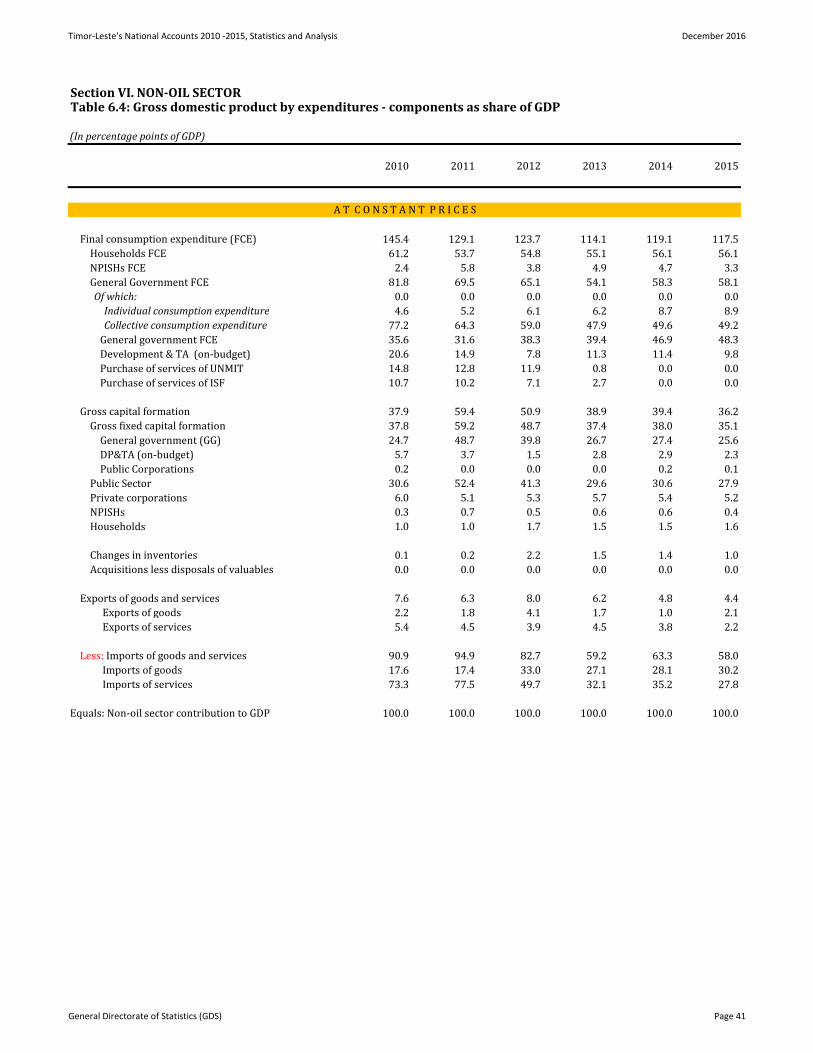
Timor-Leste's National Accounts 2010 -2015, Statistics and Analysis December 2016
Section VI. NON-OIL SECTORTable 6.4: Gross domestic product by expenditures - components as share of GDP
(In percentage points of GDP)
2010 2011 2012 2013 2014 2015
Final consumption expenditure (FCE) 145.4 129.1 123.7 114.1 119.1 117.5
Households FCE 61.2 53.7 54.8 55.1 56.1 56.1
NPISHs FCE 2.4 5.8 3.8 4.9 4.7 3.3
General Government FCE 81.8 69.5 65.1 54.1 58.3 58.1
Of which: 0.0 0.0 0.0 0.0 0.0 0.0
Individual consumption expenditure 4.6 5.2 6.1 6.2 8.7 8.9
Collective consumption expenditure 77.2 64.3 59.0 47.9 49.6 49.2
General government FCE 35.6 31.6 38.3 39.4 46.9 48.3
Development & TA (on-budget) 20.6 14.9 7.8 11.3 11.4 9.8
Purchase of services of UNMIT 14.8 12.8 11.9 0.8 0.0 0.0
Purchase of services of ISF 10.7 10.2 7.1 2.7 0.0 0.0
Gross capital formation 37.9 59.4 50.9 38.9 39.4 36.2
Gross fixed capital formation 37.8 59.2 48.7 37.4 38.0 35.1
General government (GG) 24.7 48.7 39.8 26.7 27.4 25.6
DP&TA (on-budget) 5.7 3.7 1.5 2.8 2.9 2.3
Public Corporations 0.2 0.0 0.0 0.0 0.2 0.1
Public Sector 30.6 52.4 41.3 29.6 30.6 27.9
Private corporations 6.0 5.1 5.3 5.7 5.4 5.2
NPISHs 0.3 0.7 0.5 0.6 0.6 0.4
Households 1.0 1.0 1.7 1.5 1.5 1.6
Changes in inventories 0.1 0.2 2.2 1.5 1.4 1.0
Acquisitions less disposals of valuables 0.0 0.0 0.0 0.0 0.0 0.0
Exports of goods and services 7.6 6.3 8.0 6.2 4.8 4.4
Exports of goods 2.2 1.8 4.1 1.7 1.0 2.1
Exports of services 5.4 4.5 3.9 4.5 3.8 2.2
Less: Imports of goods and services 90.9 94.9 82.7 59.2 63.3 58.0
Imports of goods 17.6 17.4 33.0 27.1 28.1 30.2
Imports of services 73.3 77.5 49.7 32.1 35.2 27.8
Equals: Non-oil sector contribution to GDP 100.0 100.0 100.0 100.0 100.0 100.0
A T C O N S T A N T P R I C E S
General Directorate of Statistics (GDS) Page 41
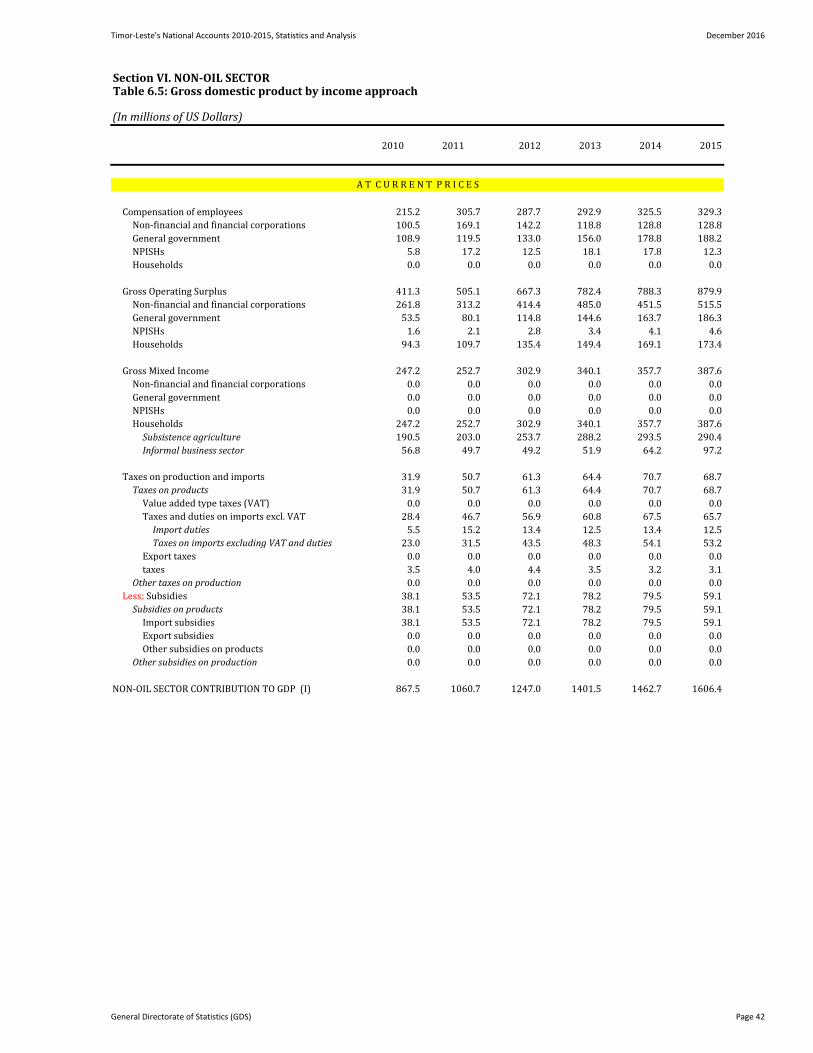
Timor-Leste's National Accounts 2010-2015, Statistics and Analysis December 2016
Section VI. NON-OIL SECTORTable 6.5: Gross domestic product by income approach
(In millions of US Dollars)
2010 2011 2012 2013 2014 2015
Compensation of employees 215.2 305.7 287.7 292.9 325.5 329.3
Non-financial and financial corporations 100.5 169.1 142.2 118.8 128.8 128.8
General government 108.9 119.5 133.0 156.0 178.8 188.2
NPISHs 5.8 17.2 12.5 18.1 17.8 12.3
Households 0.0 0.0 0.0 0.0 0.0 0.0
Gross Operating Surplus 411.3 505.1 667.3 782.4 788.3 879.9
Non-financial and financial corporations 261.8 313.2 414.4 485.0 451.5 515.5
General government 53.5 80.1 114.8 144.6 163.7 186.3
NPISHs 1.6 2.1 2.8 3.4 4.1 4.6
Households 94.3 109.7 135.4 149.4 169.1 173.4
Gross Mixed Income 247.2 252.7 302.9 340.1 357.7 387.6
Non-financial and financial corporations 0.0 0.0 0.0 0.0 0.0 0.0
General government 0.0 0.0 0.0 0.0 0.0 0.0
NPISHs 0.0 0.0 0.0 0.0 0.0 0.0
Households 247.2 252.7 302.9 340.1 357.7 387.6
Subsistence agriculture 190.5 203.0 253.7 288.2 293.5 290.4
Informal business sector 56.8 49.7 49.2 51.9 64.2 97.2
Taxes on production and imports 31.9 50.7 61.3 64.4 70.7 68.7
Taxes on products 31.9 50.7 61.3 64.4 70.7 68.7
Value added type taxes (VAT) 0.0 0.0 0.0 0.0 0.0 0.0
Taxes and duties on imports excl. VAT 28.4 46.7 56.9 60.8 67.5 65.7
Import duties 5.5 15.2 13.4 12.5 13.4 12.5
Taxes on imports excluding VAT and duties 23.0 31.5 43.5 48.3 54.1 53.2
Export taxes 0.0 0.0 0.0 0.0 0.0 0.0Taxes on products except VAT, import and export
taxes 3.5 4.0 4.4 3.5 3.2 3.1
Other taxes on production 0.0 0.0 0.0 0.0 0.0 0.0
Less: Subsidies 38.1 53.5 72.1 78.2 79.5 59.1
Subsidies on products 38.1 53.5 72.1 78.2 79.5 59.1
Import subsidies 38.1 53.5 72.1 78.2 79.5 59.1
Export subsidies 0.0 0.0 0.0 0.0 0.0 0.0
Other subsidies on products 0.0 0.0 0.0 0.0 0.0 0.0
Other subsidies on production 0.0 0.0 0.0 0.0 0.0 0.0
NON-OIL SECTOR CONTRIBUTION TO GDP (I) 867.5 1060.7 1247.0 1401.5 1462.7 1606.4
A T C U R R E N T P R I C E S
General Directorate of Statistics (GDS) Page 42
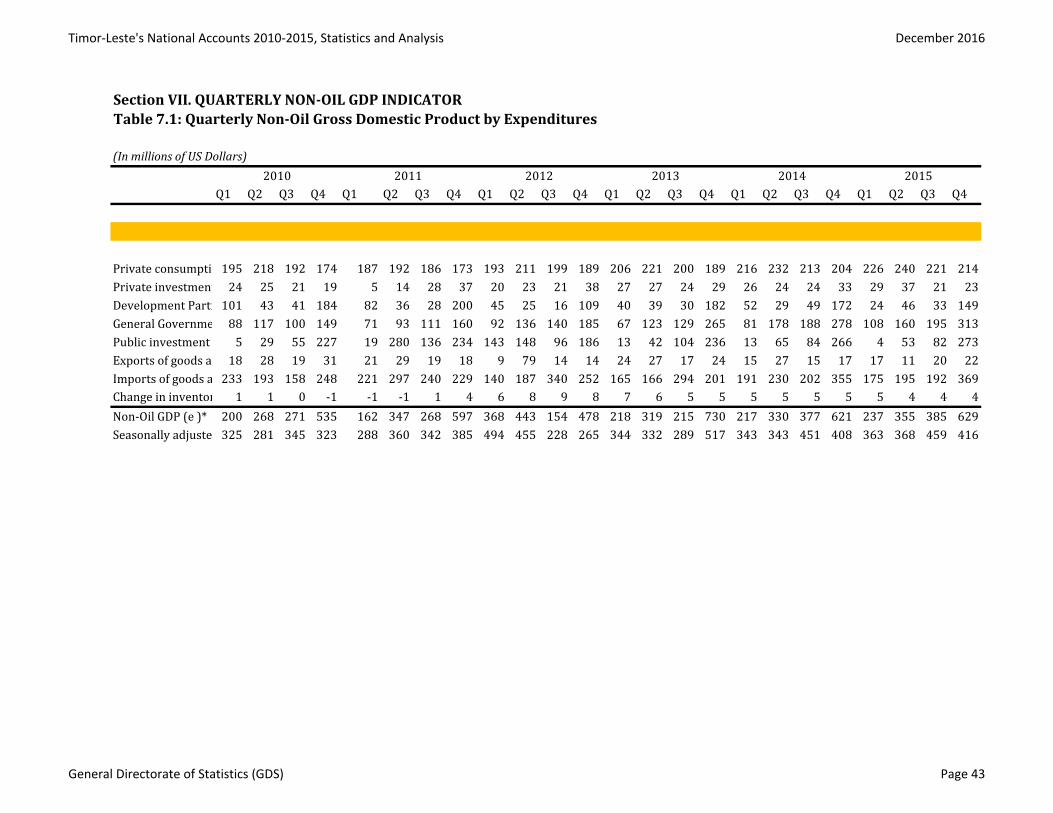
Timor-Leste's National Accounts 2010-2015, Statistics and Analysis December 2016
Section VII. QUARTERLY NON-OIL GDP INDICATOR
Table 7.1: Quarterly Non-Oil Gross Domestic Product by Expenditures
(In millions of US Dollars)
Q1 Q2 Q3 Q4 Q1 Q2 Q3 Q4 Q1 Q2 Q3 Q4 Q1 Q2 Q3 Q4 Q1 Q2 Q3 Q4 Q1 Q2 Q3 Q4
Private consumption195 218 192 174 187 192 186 173 193 211 199 189 206 221 200 189 216 232 213 204 226 240 221 214
Private investment 24 25 21 19 5 14 28 37 20 23 21 38 27 27 24 29 26 24 24 33 29 37 21 23
Development Partners101 43 41 184 82 36 28 200 45 25 16 109 40 39 30 182 52 29 49 172 24 46 33 149
General Government consumption88 117 100 149 71 93 111 160 92 136 140 185 67 123 129 265 81 178 188 278 108 160 195 313
Public investment 5 29 55 227 19 280 136 234 143 148 96 186 13 42 104 236 13 65 84 266 4 53 82 273
Exports of goods and services18 28 19 31 21 29 19 18 9 79 14 14 24 27 17 24 15 27 15 17 17 11 20 22
Imports of goods and services233 193 158 248 221 297 240 229 140 187 340 252 165 166 294 201 191 230 202 355 175 195 192 369
Change in inventories 1 1 0 -1 -1 -1 1 4 6 8 9 8 7 6 5 5 5 5 5 5 5 4 4 4
Non-Oil GDP (e )* 200 268 271 535 162 347 268 597 368 443 154 478 218 319 215 730 217 330 377 621 237 355 385 629
Seasonally adjusted-classical325 281 345 323 288 360 342 385 494 455 228 265 344 332 289 517 343 343 451 408 363 368 459 416
20152010 2011 2012 2013 2014
General Directorate of Statistics (GDS) Page 43
Timor-Leste's National Accounts 2010-2015 December 2016
General Directorate of Statistics (GDS) Page 44
GLOSSARY OF TERMS
Actual consumption
To allow for the fact that the consumption of goods and services by households may be paid for, in cash or in kind by the general government sector, an alternative measure of consumption called actual consumption has been defined. It is measured by first separating government final consumption expenditure (GFCE) into individual and collective consumption. Individual consumption refers to services that are provided by general government to households that are consumed individually, for example health and education. Collective consumption, on the other hand, relates to the provision of public services such as policing and defense. Household actual consumption is measured as household final consumption expenditure plus individual consumption within GFCE. General government actual consumption is measured as GFCE less individual consumption. Actual consumption is a particularly useful measure for international comparison since countries often have different systems for providing individual services. Capital transfers Transactions in which the ownership of an asset (other than cash and inventories) is transferred from
one institutional unit to another, in which cash is transferred to enable the recipient to acquire another
asset or in which the funds realized by the disposal of another asset are transferred.
Changes in inventories held by enterprises and general government
This is an estimate of the change in the book value of inventories held by enterprises and the
government from the start of the reference year to the end of the year. In other terms, it is the value at
the level of establishment and for an accounting period, of the additions less withdrawals to the stock of
inventories of raw materials and finished products. The additions originate in production and imports,
and withdrawals for use as intermediate consumption and final demand.
Collective consumption
Services provided simultaneously to all members of the community or to all members of a particular section of the community, such as all households living in a particular region. Collective services are automatically acquired and consumed by all members of the community, or group of households in question, without any action on their part. Typical examples are public administration and the provision of security, either at a national or local level. Collective services are the ‘public goods’ of economic theory. By their nature, collective services cannot be sold to individuals on the market, and they are financed by government units out of taxation or other incomes.
Compensation of employees
The total remuneration, in cash or in kind, payable by an enterprise to an employee in return for work done by the employee during the accounting period. It is further classified into two sub-components: wages and salaries; and employers’ social contributions. Compensation of employees is not payable in respect of unpaid work undertaken voluntarily, including the work done by members of a household within an unincorporated enterprise owned by the same household. Compensation of employees excludes any taxes payable by the employer on the wage and salary bill (e.g. payroll tax). See also Employers’ social contributions; Wages and salaries.
Timor-Leste's National Accounts 2010 -2015 December 2016
General Directorate of Statistics (GDS) Page 45
Constant price measures
The current price values of production-based and expenditure-based gross domestic product estimates and their components can be conceived as the product of the underlying quantities of goods and services and their prices. Deflating the current price values by appropriate price indexes removes the effect of changing prices on the values. The resulting estimates are referred to as constant price estimates (or quantities, or volumes). Constant price estimates are calculated by applying the prices applying in a particular year (the base year) to all of the years in the series. The Timor-Leste national accounts have adopted 2010 as the base year for its constant price series.
Consumption of fixed capital
The reduction in the value of fixed assets used in production during the accounting period resulting from
physical deterioration, normal obsolescence or normal accidental damage. Unforeseen obsolescence,
major catastrophes and the depletion of natural resources are not taken into account.
Contributions to Growth in GDP
A contribution to growth in GDP is the addition of some aggregate to GDP in percentage points. The sum of the percentage points, or contributions to growth of all the aggregates, gives the rate of growth of the GDP. It is calculated as {(Ag t – Ag t-1)/ GDP t-1} x 100. Where: Ag t is value of aggregate in year under consideration, Ag t-1 is value of aggregate A in previous year and, GDP t-1 is value of GDP in previous year. Also, it can be interpreted as “incidence” of aggregate A, defined as the rate of growth of an aggregate, weighted by the share of the aggregate in the GDP in previous year: (Ag t/ Ag t-1 – 1) x 100 x (Agt-1/GDP t-1) Current prices Estimates are valued at the prices of the period to which the observation relates. For example, estimates for 2009 are valued using 2009 prices. This contrast with constant price measures where the prices used in valuation refer to the prices of the base year. See also constant price measures. Current transfers Transfers, other than those classified as capital transfers, in which one institutional unit provides a good, service or cash to another unit without receiving from the latter anything of economic value in return. Economically significant prices Prices that have a significant influence on both the amounts producers are willing to supply and the amounts purchasers wish to buy. Employers' social contributions Payments by employers that are intended to secure for their employees the entitlement to social benefits should certain events occur, or certain circumstances exist, that may adversely affect their employees' income or welfare - namely work-related accidents and retirement.
Timor-Leste's National Accounts 2010 -2015 December 2016
General Directorate of Statistics (GDS) Page 46
Exports of goods and services The value of goods exported and amounts receivable from non-residents for the provision of non -factorial services by residents. Final consumption expenditure - general government Government final consumption expenditure is current expenditure by general government bodies on services to the community such as defense, education, and public order and safety less any explicit charges for these services. If these are provided free of charge or at charges which cover only a small proportion of costs, the government is considered to be the consumer of its own output. This output has no directly observable market value, and so it is valued in the national accounts at its cost of production. It also includes the value of the portion of market output purchased by the General Government sector on behalf of beneficiaries. Final consumption expenditure – households Net expenditure on goods and services by persons. This item excludes expenditures by unincorporated businesses and expenditures on assets by non-profit institutions (included in gross fixed capital formation). Also excluded is expenditure on maintenance of dwellings (treated as intermediate expenses of private enterprises), but personal expenditure on motor cycles and other durable goods and the imputed rent of owner-occupied dwellings are included. The value of 'backyard' production (including food produced and consumed on farms) is included in household final consumption expenditure and the payment of wages and salaries in kind (e.g. food and lodging supplied free to employees) is counted in both household income and household final consumption expenditure. Final consumption expenditure – non-profit institutions serving households
Current expenditure by non-profit institutions on provision of goods and services to households. This
output has no directly observable market value and so is valued in the national accounts at its cost of
production.
Fixed Assets
Are defined as produced assets that are used repeatedly, or continuously, in processes of production for more than one year. Fixed assets not only include structures, machinery and equipment and intellectual property products but also cultivated assets such as trees and animals that are used repeatedly or continuously to produce other products such as fruit and dairy products. Gross domestic product, GDP, GDP (E), GDP (P), GDP (I) In Timor-Leste, from 2010 onwards, the GDP is measured from the Production Approach (GDP (P)), Expenditure Approach (GDP (E)) and Income Approach (GDP (I)). Only the first two are true independent measures: The GDP (P) is the total market value of goods and services produced in Timor-Leste within a given period after deducting the cost of goods and services used up in the process of production but before deducting allowances for the consumption of fixed capital. The GDP (E) is equivalent to gross national expenditure plus exports of goods and non-factorial services less imports of goods and non-factorial services. In TL-NA the headline GDP is GDP (E).
Timor-Leste's National Accounts 2010 -2015 December 2016
General Directorate of Statistics (GDS) Page 47
GDP per capita
The ratio of the current or constant price estimate of GDP to an estimate of the resident Timor-Leste population. Population estimates according United Nations, Department of Economic and Social Affairs, Population Division. World Population Prospects, the 2015 Revision (https://esa.un.org/unpd/wpp/). It considers GDS Population Censuses (2004, 2010, 2015) and international well-known parameters for worldwide comparison.
Gross fixed capital formation - general government
Expenditure on new fixed assets plus net expenditure on second-hand fixed assets whether for additions or replacements. Expenditure on new road works (or upgrading existing roads) is included but expenditure on road repair and maintenance is classified as government final consumption expenditure. Gross fixed capital formation – private
Expenditure on fixed assets. Expenditure on repair and maintenance of fixed assets is excluded, being chargeable to the production account. Additions to fixed assets are regarded as capital formation. Also included is compensation of employees and other costs paid by private enterprise in connection with own-account capital formation. Expenditure on mineral and petroleum exploration is regarded as gross fixed capital formation.
Gross fixed capital formation - public corporations
Expenditure on new fixed assets plus net expenditure on second-hand fixed assets and including both additions and replacements. Also included is compensation of employees and other costs paid by public corporations in connection with capital works undertaken on own account. Gross mixed income of unincorporated enterprises The surplus or deficit accruing from production by unincorporated enterprises. It includes elements of both compensation of employees (returns on labour inputs) and operating surplus (returns on capital inputs). Also included are estimates of the imputed income derived from subsistence agriculture and other informal production activities. Gross national disposable income (GNDI) Is equivalent to gross national income plus all secondary income in cash or in kind receivable by resident institutional units from the rest of the world, less all secondary income in cash or in kind payable by resident institutional units to the rest of the world. Gross national expenditure The total expenditure within a given period by Timor-Leste residents on final goods and services (i.e. excluding goods and services used up during the period in the process of production). It is equivalent to gross domestic product plus imports of goods and services less exports of goods and services. Gross national income (GNI)
The aggregate value of gross primary incomes for all institutional sectors, including net primary income receivable from non-residents.
Timor-Leste's National Accounts 2010 -2015 December 2016
General Directorate of Statistics (GDS) Page 48
Gross national savings
Is calculated as gross national disposable income less final consumption expenditures of households, general government and non-profit institutions serving households. Gross national savings is the surplus generated in the reference year and available to finance investments, including in fixed capital formation.
Gross operating surplus
The operating surplus accruing to all enterprises, except unincorporated enterprises, from their operations in Timor-Leste. It is the excess of gross output over the sum of intermediate consumption, compensation of employees, and taxes less subsidies on production and imports. It is calculated before deduction of consumption of fixed capital, dividends, interest, royalties and land rent, and direct taxes payable. Gross operating surplus is also calculated for general government and it equals general government's consumption of fixed capital. Gross value added The value of output, in Timor-Leste National Accounts at producer’s prices, minus the value of intermediate consumption at purchaser’s prices. The term is used to describe gross product by industry. And includes, Compensation of employees, Taxes on products and others on production and imports, less subsidies on products and others on production, Gross Operating Surplus, and Gross Mixed Income. Implicit price deflator.
Obtained by dividing a current price value by its real counterpart (the constant price measure). When calculated from the major national accounting aggregates, such as gross domestic product, implicit price deflators relate to a broader range of goods and services in the economy than that represented by any of the individual price indexes such as the consumer price index.
Imports of goods and services
The value of goods imported and amounts payable to non-residents for the provision of non-factorial
services to residents.
Individual consumption
An individual consumption good or service is one that is acquired by a household and used to satisfy the needs and wants of members of that household. Individual goods and services can always be bought and sold on the market, although they may also be provided free, or at prices that are not economically significant, or as transfers in kind. Individual goods and services are essentially ‘private’, as distinct from ‘public’. See also Collective consumption. Institutional unit An institutional unit is an economic entity that is capable, in its own right, of owning assets, incurring liabilities, engaging in economic activities and engaging in transactions with other entities.
Intermediate consumption
Consists of the value of the goods and services used as inputs by a process of production, excluding
Timor-Leste's National Accounts 2010 -2015 December 2016
General Directorate of Statistics (GDS) Page 49
compensation of employees and the consumption of fixed capital. Inventories Consist of stocks of outputs that are held at the end of a period by the units that produced them prior to their being further processed, sold, delivered to other units or used in other ways and stocks of products acquired from other units that are intended to be used for intermediate consumption or for resale without further processing. Livestock Livestock assets are classified as either fixed assets or inventories. Those livestock that are used in
production of other products (e.g. breeding stock and dairy cattle) are fixed assets. Inventories cover all
other livestock types and include those animals raised for meat or other one-off products (e.g. leather).
Market output
Output that is sold at prices that are economically significant or otherwise disposed off on the market, or
intended for sale or disposal on the market.
Net secondary income from non-residents
All transfers to or from non-residents to resident government or private institutional units which are not
payments for goods and services, compensation of employees or property income.
Non-market output
Goods and services produced by any institutional unit that are supplied free or at prices that are not economically significant. Other subsidies on production Consist of all subsidies, except subsidies on products, which resident enterprises may receive as a consequence of engaging in production. Other subsidies on production include: subsidies related to the payroll or workforce numbers, including subsidies payable on the total wage or salary bill, on numbers employed, or on the employment of particular types of persons, e.g. persons with disabilities or persons who have been unemployed for a long period. The subsidies may also be intended to cover some or all of the costs of training schemes organized or financed by enterprises. Subsidies aimed at reducing pollution is also included. See also Subsidies on products. Other taxes on production Consist of all taxes that enterprises incur as a result of engaging in production, except taxes on products.
Other taxes on production include: taxes related to the payroll or workforce excluding compulsory social
security contributions paid by employers and any taxes paid by the employees themselves out of their
wages or salaries; recurrent taxes on land, buildings or other structures; some business and professional
licenses where no service is provided by the Government in return; taxes on the use of fixed assets or
other activities; stamp duties; taxes on pollution; and taxes on international transactions.
Timor-Leste's National Accounts 2010 -2015 December 2016
General Directorate of Statistics (GDS) Page 50
Output
This consists of those goods and services that are produced within an establishment that become available for use outside that establishment, plus any goods and services produced for own final use.
Primary incomes
Consist of incomes that accrue to institutional units as a consequence of their involvement in processes of production or their ownership of assets that may be needed for the purposes of production. Property income
Is the income receivable by the owner of a financial asset or a tangible non-produced asset in return for
providing funds, or putting a tangible non-produced asset at the disposal of another institutional unit.
Purchasers' price
The amount paid by the purchaser, excluding any deductible tax, in order to take delivery of a unit of a
good or service at the time and place required by the purchaser. The purchaser’s price of a good includes
any transport charges paid separately by the purchaser to take delivery at the required time and place.
Secondary income
Consists of receipt and payment of current transfers.
Social assistance benefits in cash to residents
Includes current transfers to persons from general government in return for which no services are rendered or goods supplied. Principal components include: scholarships; maternity, sickness and unemployment benefits; family allowances; and widows', age, invalid and repatriation pensions. Statistical discrepancy, SD, SD (E) and SD (P)
Statistical discrepancy is normally the numerical difference obtained for the estimation of a same variable using different approaches, sources and methods. Applied to GDP, there are different approaches, GDP (E) or GDP (P) for example. In TL-NA 2000-2013, given that GDP (E) is the headline GDP, then the Statistical Discrepancy is SD = SD (E) = GDP(E) – GDP(P).
Subsidies on products
Subsidies payable per unit of a good or service. The subsidy may be a specific amount of money per unit of quantity of a good or service, or it may be calculated ad valorem as a specified percentage of the price per unit. A subsidy may also be calculated as the difference between a specified target price and the market price actually paid by a purchaser. A subsidy on a product usually becomes payable when the product is produced, sold or imported, but it may also become payable in other circumstances, such as when a product is exported, leased, transferred, delivered or used for own consumption or own capital formation.
Timor-Leste's National Accounts 2010 -2015 December 2016
General Directorate of Statistics (GDS) Page 51
Taxes less subsidies on production and imports
Defined as ‘taxes on products’ plus ‘other taxes on production’ less 'subsidies on products' less 'other subsidies on production'.
Taxes on production and imports
Consist of ‘taxes on products’ and ‘other taxes on production’. These taxes do not include any taxes on the profits or other income received by an enterprise. They are payable irrespective of the profitability of the production process. They may be payable on the land, fixed assets or labour employed in the production process, or on certain activities or transactions. Taxes on products Taxes payable per unit of some good or service. The tax may be a specific amount of money per unit of quantity of a good or service (quantity being measured either in terms of discrete units or continuous physical variables such as volume, weight, strength, distance, time, etc.), or it may be calculated ad valorem as a specified percentage of the price per unit or value of the goods or services transacted. A tax on a product usually becomes payable when the product is produced, sold or imported, but it may also become payable in other circumstances, such as when a good is exported, leased, transferred, delivered, or used for own consumption or own capital formation. Terms of trade Calculated by dividing the export implicit price deflator by the import implicit price deflator and multiplying by 100. Total factor income That part of the cost of producing the gross domestic product that consists of gross payments to factors of production (labour and capital). It represents the value added by these factors in the process of production and is equivalent to gross domestic product less taxes plus subsidies on production and imports. Wages and salaries
Consist of amounts payable in cash including the value of any social contributions, income taxes, fringe benefits tax, etc., payable by the employee even if they are actually withheld by the employer for administrative convenience or other reasons and paid directly to social insurance schemes, tax authorities, etc., on behalf of the employee. Wages and salaries may be paid as remuneration in kind instead of, or in addition to, remuneration in cash. Separation, termination and redundancy payments are also included in wages and salaries. Wages and salaries are also measured as far as possible on an accrual rather than a strict cash basis. See also Employers’ social contributions; Compensation of employees.


Direcção Geral de Estatística Rua de Caicoli, Po BOX 10 Dili, Timor-Leste Web. www.statistics.gov.tl E-Mail:[email protected]