Embed Size (px)
Citation preview

Timothy G. BromageBiomaterials & BiomimeticsNew York University College of Dentistry
Avoid Infection, and While You’re At It, Have a Demographic Transition
or
Allocating Energy: What Social Activists Know About Metabolism
Sophie Wenzel Population Studies 370-380 Shanks HallNovember 7,2013
for
1. TEETH AND METABOLISM
2. MICROBES TO METABOLISM
3. SOLUTIONS TO PROBLEMS
OUTLINE
Striae of Retzius
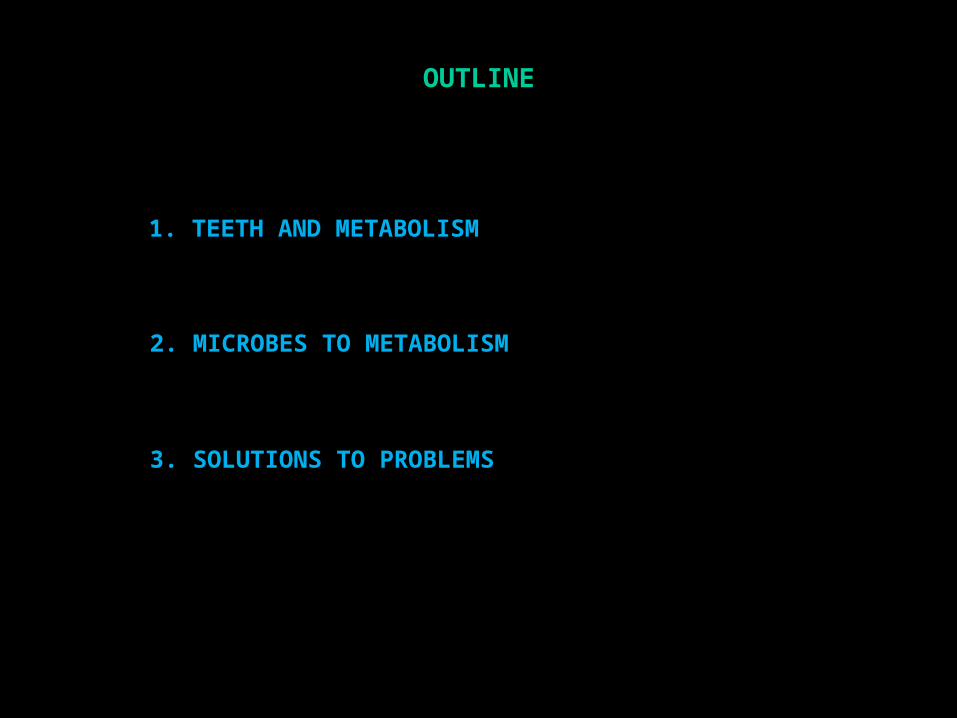
scar fromforest fire
first year growth
rainyyear
dryyear
1, WHAT HAVE TEETH GOT TO DO WITH IT?
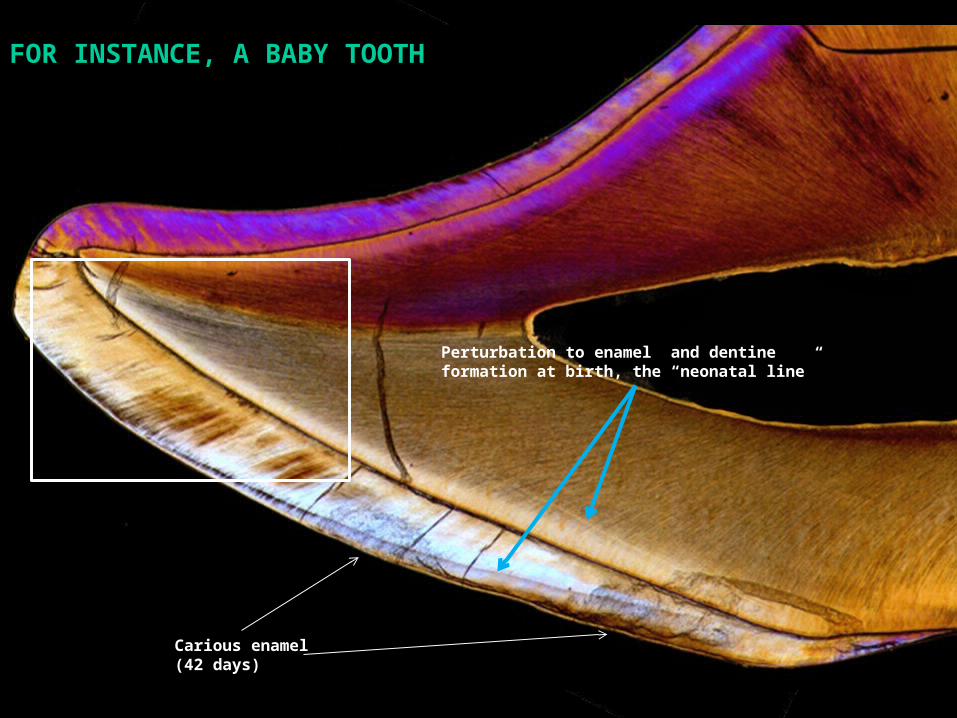
Perturbation to enamel and dentine formation at birth, the “neonatal line”
Carious enamel(42 days)
FOR INSTANCE, A BABY TOOTH

striae of Retzius
daily increments:
The number of increments between striae is called the “repeat interval”
A QUICK REFRESHER ON ENAMEL STRUCTURE AND, YES, ITS RELATION TO METABOLISM !

Striae of Retzius
ENAMEL STRIAE OF RETZIUS

Basal Metabolic Rate (log)
r = 0.90, p < 0.001Callithrix pygmaea, Callithrix jacchus ,
Sagunius oedipus
Callimico goeldii, Leontopithecus rosalia, Aotus sp., Saimiri sciureus
Erythrocebus patas, Hylobates lar
Alouatta palliata Pan troglodytes
Papio anubis
Homo sapiens sapeins
Pongo pygmaeus
RELATIONSHIP BETWEEN STRIAE OF RETZIUS REPEAT INTERVAL AND BMR (ml O2/h) AMONG PRIMATES
Stri
ae o
f R
etzi
us
Rep
eat
Inte
rval
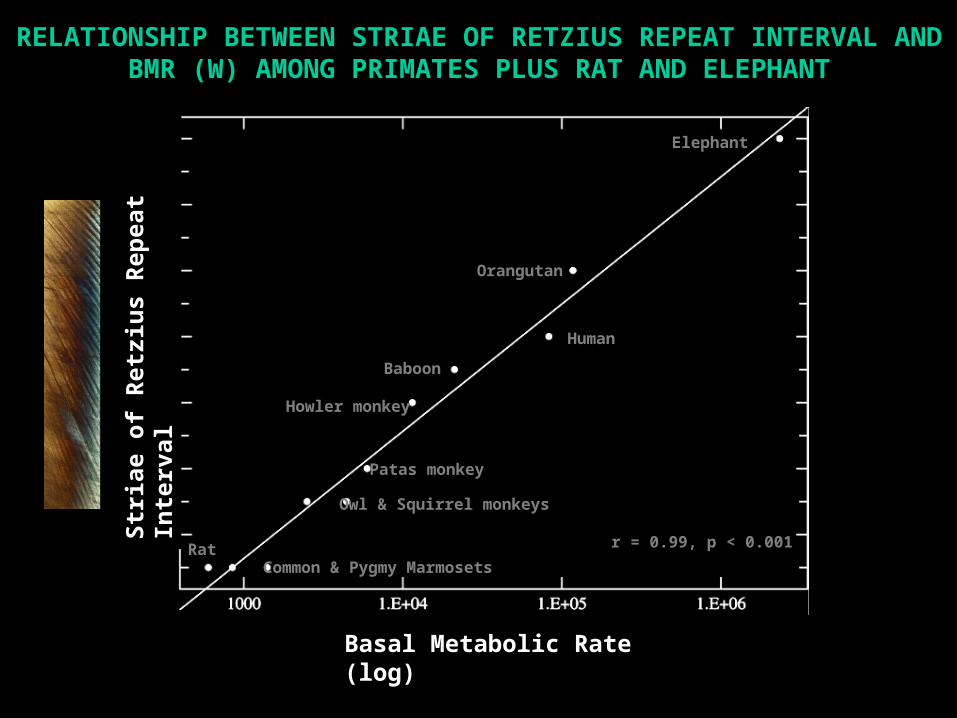
r = 0.99, p < 0.001
Orangutan
Rat
Elephant
Howler monkey
Baboon
Human
Patas monkey
Owl & Squirrel monkeys
Common & Pygmy Marmosets
Basal Metabolic Rate (log)
Stri
ae o
f R
etzi
us
Rep
eat
Inte
rval
RELATIONSHIP BETWEEN STRIAE OF RETZIUS REPEAT INTERVAL AND BMR (W) AMONG PRIMATES PLUS RAT AND ELEPHANT
THE MAIN ELEMENTS
MICROBES AND METABOLIC ADAPTATION
ECONOMIC STOICHIOMETRY
2. THE HUMAN ECONOMIC PRODUCTION SYSTEM FROM MICROBES TO METABOLISM
ENERGY, METABOLISM & GROWTHIIIa
IIIb
IIIc
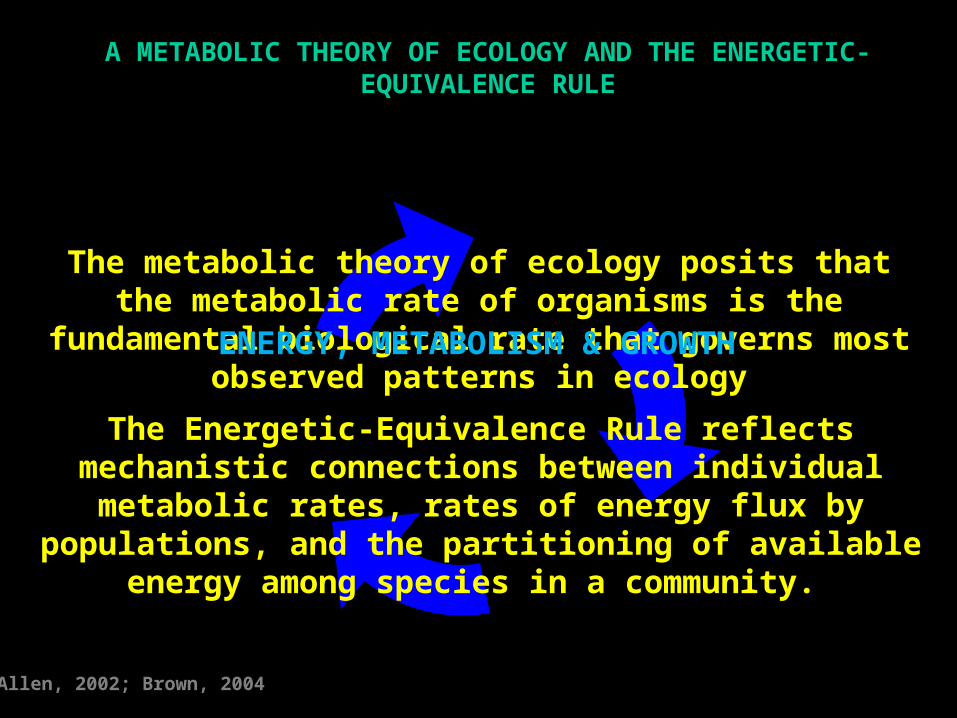
The metabolic theory of ecology posits that the metabolic rate of organisms is the fundamental biological rate that
governs most observed patterns in ecology
Allen, 2002; Brown, 2004
A METABOLIC THEORY OF ECOLOGY AND THE ENERGETIC-EQUIVALENCE RULE
The Energetic-Equivalence Rule reflects mechanistic connections between individual metabolic rates, rates of
energy flux by populations, and the partitioning of available energy among species in a community.
ENERGY, METABOLISM & GROWTH
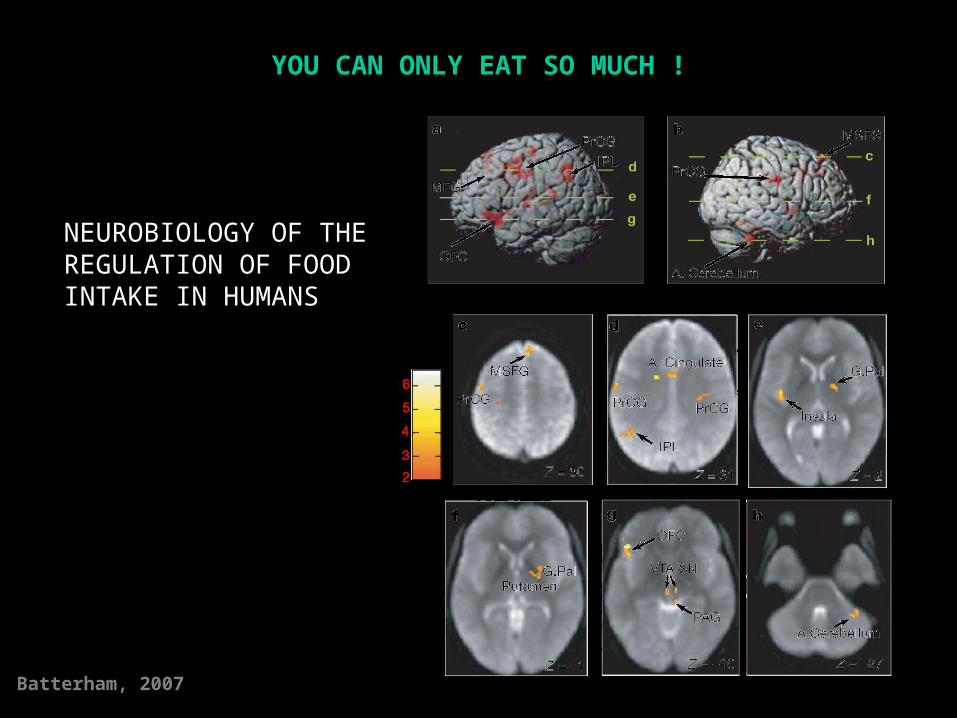
YOU CAN ONLY EAT SO MUCH !
Batterham, 2007
NEUROBIOLOGY OF THE REGULATION OF FOOD INTAKE IN HUMANS
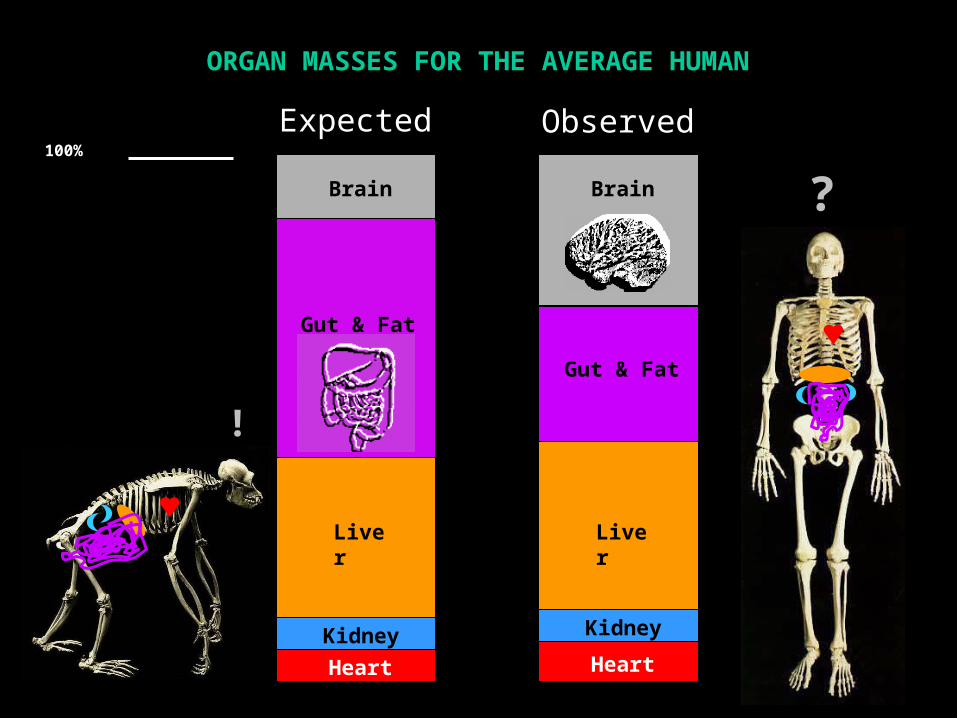
Brain Brain ?
!
Kidney Kidney
Liver Liver
Gut & Fat
Gut & Fat
ORGAN MASSES FOR THE AVERAGE HUMAN
Heart Heart
Expected Observed100%
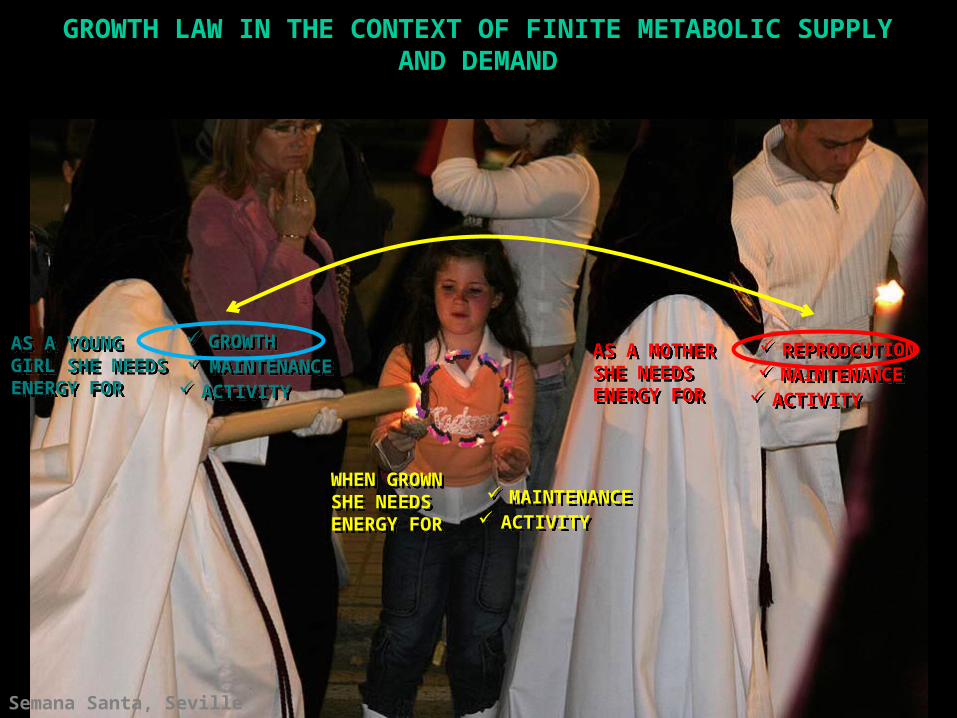
GROWTH LAW IN THE CONTEXT OF FINITE METABOLIC SUPPLY AND DEMAND
GROWTH GROWTH MAINTENANCE MAINTENANCE ACTIVITY ACTIVITY
AS A YOUNGGIRL SHE NEEDSENERGY FOR
AS A YOUNGGIRL SHE NEEDSENERGY FOR
MAINTENANCE MAINTENANCE ACTIVITY ACTIVITY
WHEN GROWNSHE NEEDSENERGY FOR
WHEN GROWNSHE NEEDSENERGY FOR
MAINTENANCE MAINTENANCE ACTIVITY ACTIVITY
AS A MOTHER SHE NEEDS ENERGY FOR
AS A MOTHER SHE NEEDS ENERGY FOR
REPRODCUTION REPRODCUTION
Semana Santa, Seville
months
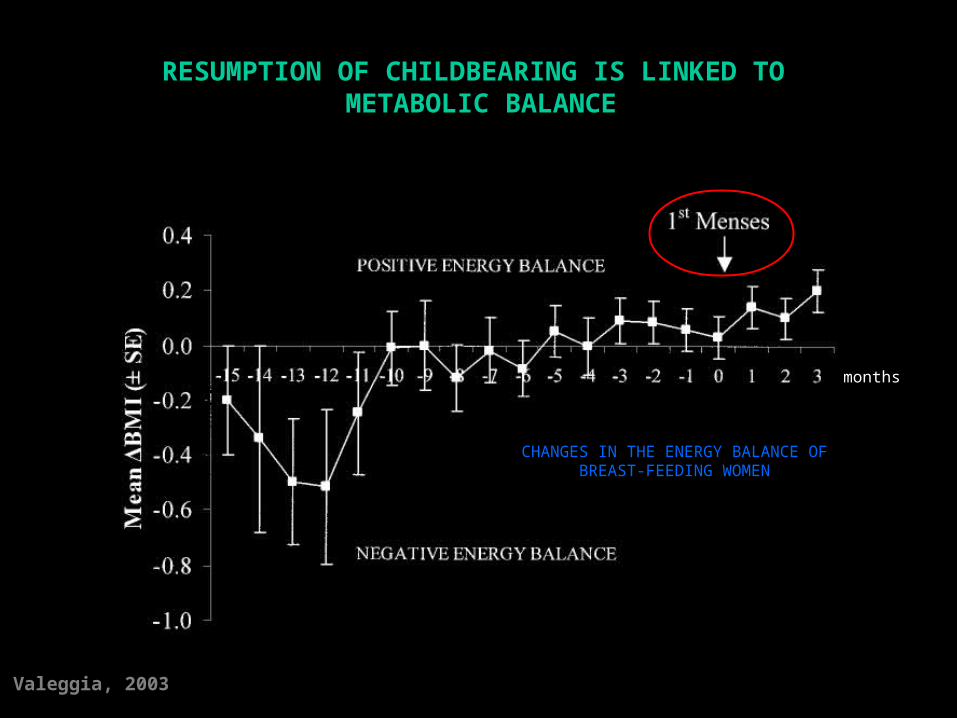
Valeggia, 2003
CHANGES IN THE ENERGY BALANCE OF BREAST-FEEDING WOMEN
RESUMPTION OF CHILDBEARING IS LINKED TO METABOLIC BALANCE
Nekola, 2007; Vicsek, 2002
The world is indeed made of many highly interconnected parts on many scales, the interactions of which result in a complex behaviour that requires separate interpretations of each level… New features emerge as one moves from one scale to another, so it follows that the science of complexity is about revealing the principles that govern the ways in which these new properties appear. These principles include, for instance, self-organization, self-adaptation, rugged energy landscapes, and scaling (e.g. power-law dependence) of the parameters and the underlying network of connections.
They are open systems which require exchanges of energy, materials, and/or information from extrinsic sources to maintain highly organized states far from thermodynamic equilibrium.
They are historically contingent, so that their present configurations reflect the influence of initial conditions and subsequent perturbations.
They are often nested within other complex systems, giving rise to hierarchical organizations that can be approximated by fractal geometry and dynamic scaling laws.
WHAT IS COMPLEXITY?
MICROBES AND HUMAN METABOLIC ADAPTIONWITH SOMETHING TO SAY ABOUT COMPLEXITY

Maternal care: (i) mother’s sleeping proximity to infant (ii) parental response to infant crying(iii) bodily contact in early infancy
Quinlan, 2007
PARENTAL CARE: THE MICROBIAL LINK
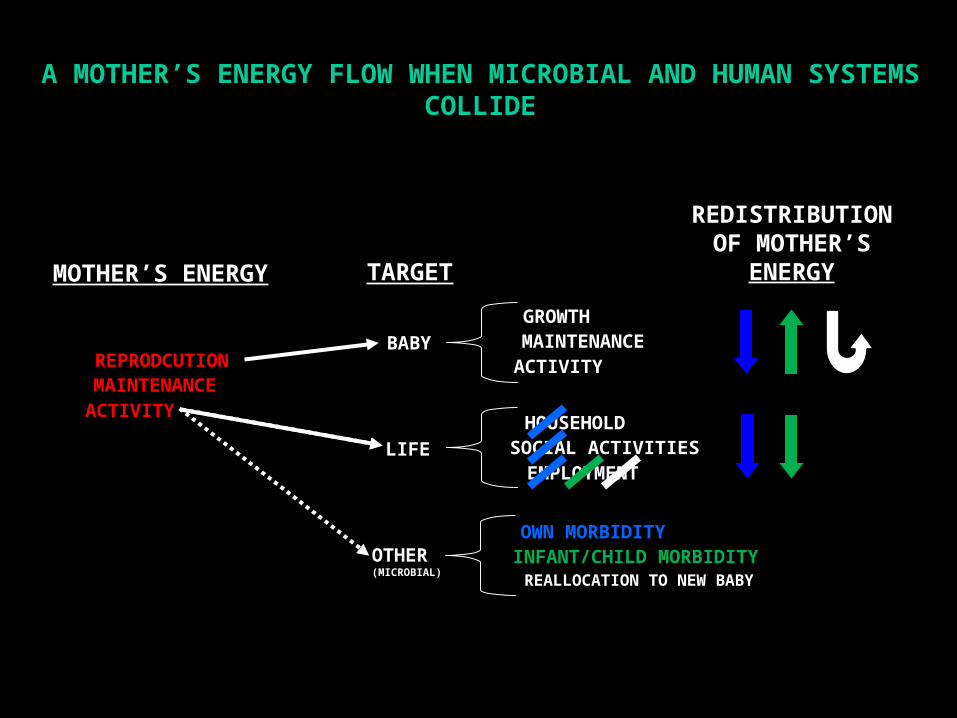
A MOTHER’S ENERGY FLOW WHEN MICROBIAL AND HUMAN SYSTEMS COLLIDE
MAINTENANCEACTIVITY
REPRODCUTION
MOTHER’S ENERGY
HOUSEHOLDSOCIAL ACTIVITIESEMPLOYMENT
LIFE
OTHER(MICROBIAL)
BABY
GROWTHMAINTENANCEACTIVITY
TARGET
INFANT/CHILD MORBIDITYOWN MORBIDITY
REDISTRIBUTION OF MOTHER’S
ENERGY
REALLOCATION TO NEW BABY

MIGHT BIRTH RATES IN THE PRESENCE OF HIGH LEVELS OF
INFECTIOUS DISEASE RELATE TO REDUCED EMPLOYMENT AND
NATIONAL PRODUCTION?
A POWER LAW !
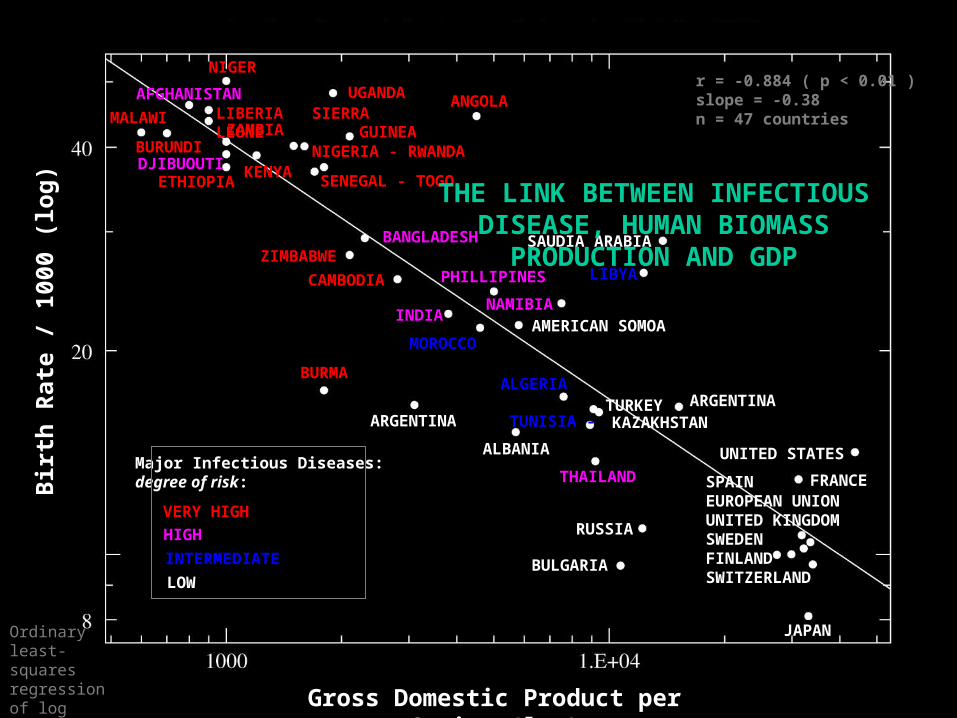
r = -0.884 ( p < 0.01 )n = 47 countries
Ordinary least-squares regression of log transformed data on linear scales
Bir
th R
ate
/ 100
0
Gross Domestic Product per Capita (log)
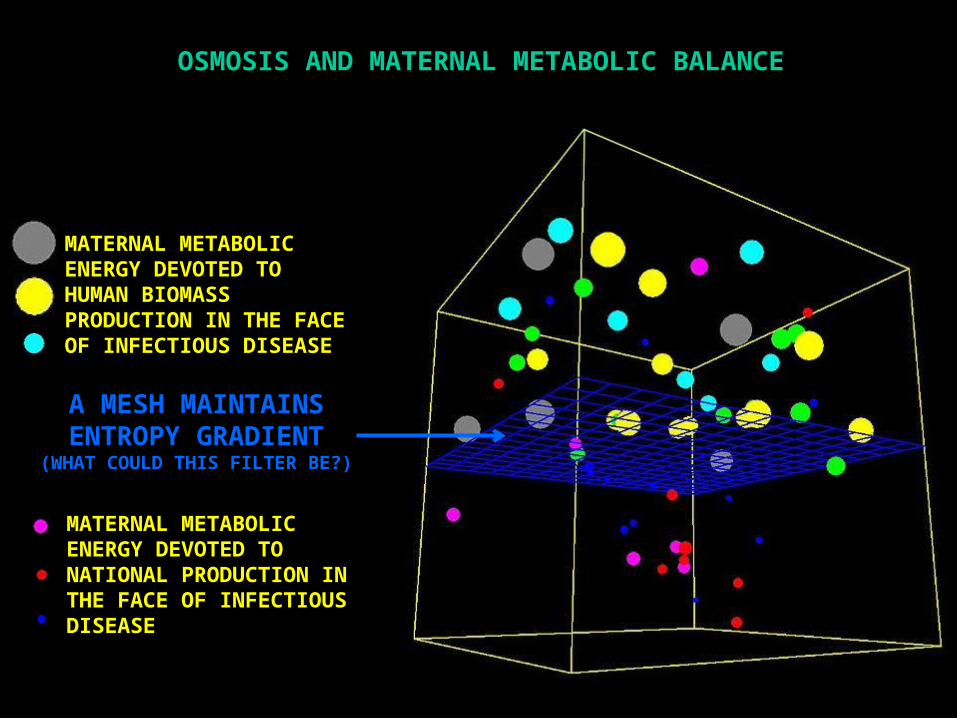
OSMOSIS AND MATERNAL METABOLIC BALANCE
A MESH MAINTAINS ENTROPY GRADIENT
(WHAT COULD THIS FILTER BE?)
MATERNAL METABOLIC ENERGY DEVOTED TO HUMAN BIOMASS PRODUCTION IN THE FACE OF INFECTIOUS DISEASE
MATERNAL METABOLIC ENERGY DEVOTED TO NATIONAL PRODUCTION IN THE FACE OF INFECTIOUS DISEASE
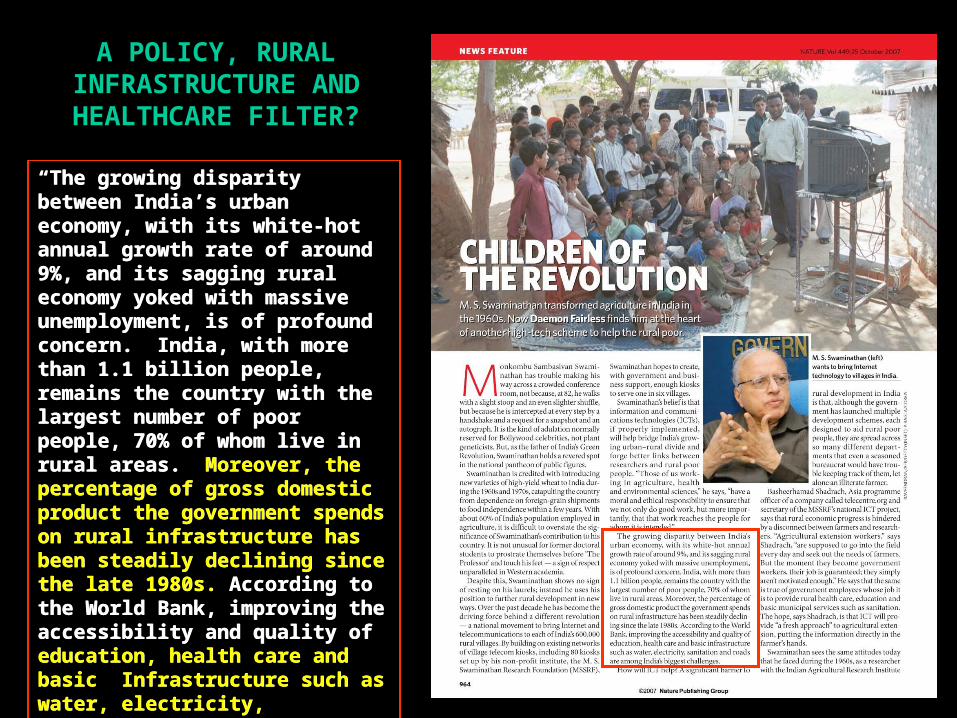
A POLICY, RURAL INFRASTRUCTURE AND HEALTHCARE FILTER?
“The growing disparity between India’s urban economy, with its white-hot annual growth rate of around 9%, and its sagging rural economy yoked with massive unemployment, is of profound concern. India, with more than 1.1 billion people, remains the country with the largest number of poor people, 70% of whom live in rural areas. Moreover, the percentage of gross domestic product the government spends on rural infrastructure has been steadily declining since the late 1980s. According to the World Bank, improving the accessibility and quality of education, health care and basic Infrastructure such as water, electricity, sanitation and roads are among India’s biggest challenges.”
“The growing disparity between India’s urban economy, with its white-hot annual growth rate of around 9%, and its sagging rural economy yoked with massive unemployment, is of profound concern. India, with more than 1.1 billion people, remains the country with the largest number of poor people, 70% of whom live in rural areas. Moreover, the percentage of gross domestic product the government spends on rural infrastructure has been steadily declining since the late 1980s. According to the World Bank, improving the accessibility and quality of education, health care and basic Infrastructure such as water, electricity, sanitation and roads are among India’s biggest challenges.”
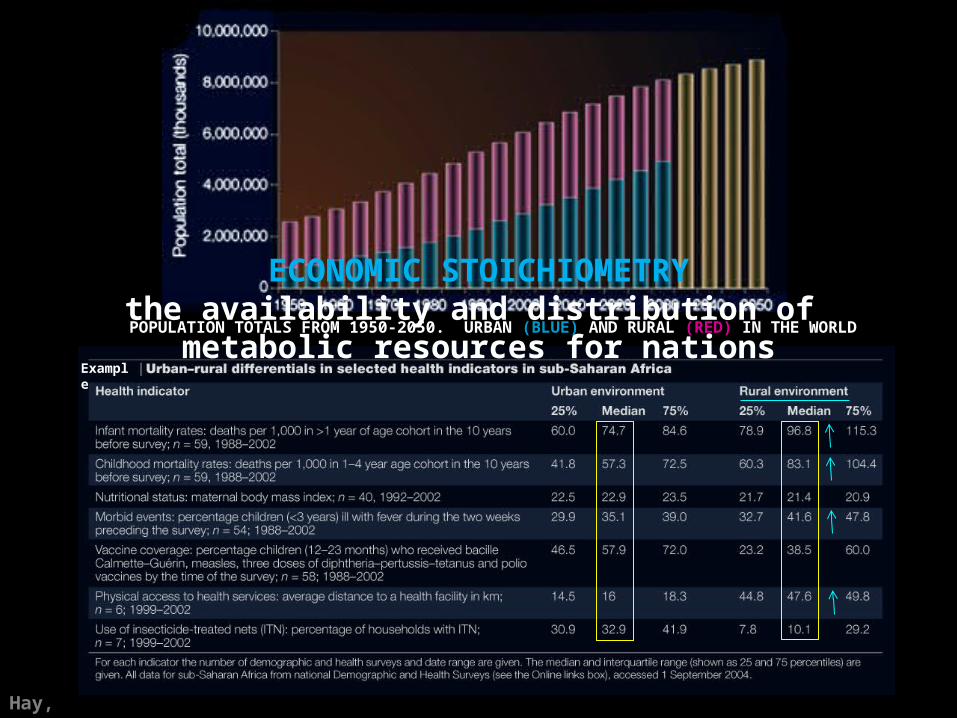
POPULATION TOTALS FROM 1950-2050. URBAN (BLUE) AND RURAL (RED) IN THE WORLD
Hay, 2005
Example
ECONOMIC STOICHIOMETRYthe availability and distribution of metabolic resources for nations
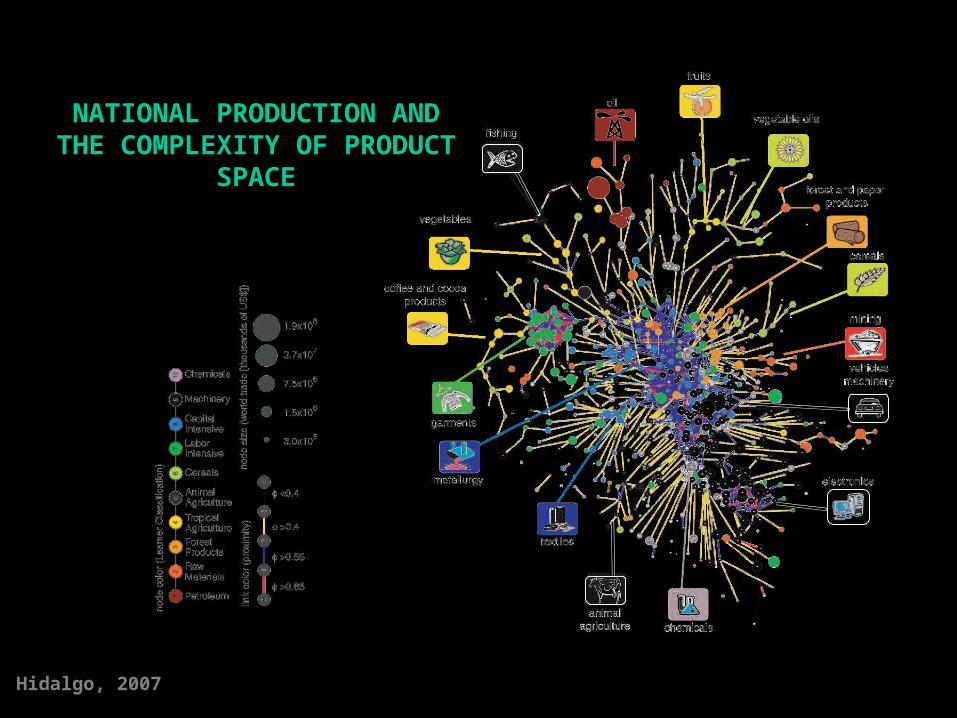
Hidalgo, 2007
NATIONAL PRODUCTION AND THE COMPLEXITY OF
PRODUCT SPACE
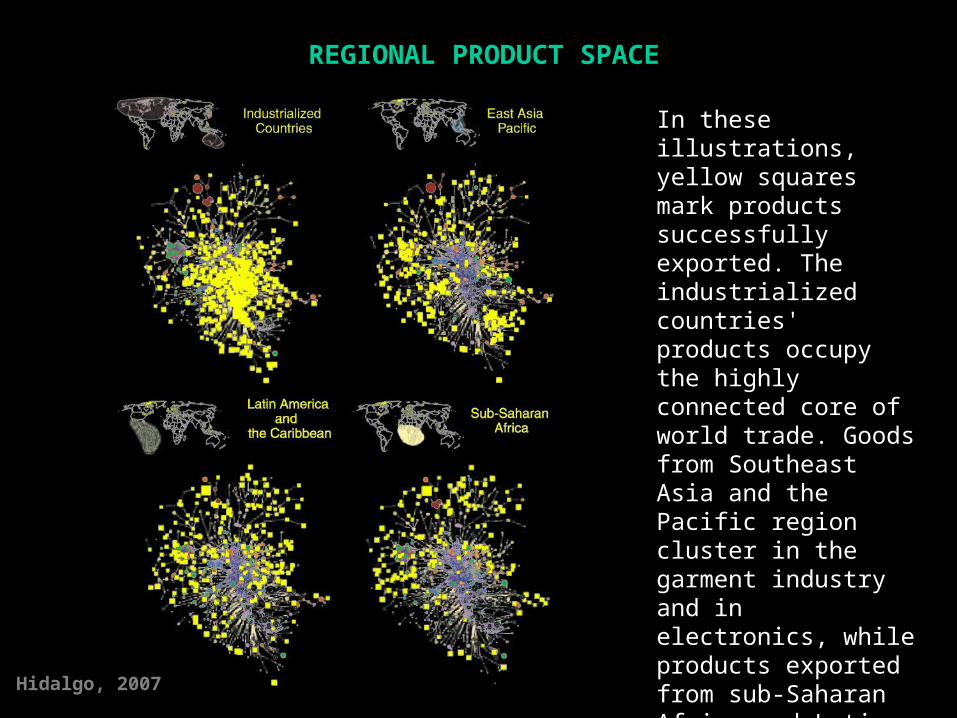
In these illustrations, yellow squares mark products successfullyexported. The industrialized countries' products occupy the highly connected core of world trade. Goods from Southeast Asia and the Pacific region cluster in the garment industry and in electronics, while products exported from sub-Saharan Africa and Latin America are mostly peripheral.
REGIONAL PRODUCT SPACE
Hidalgo, 2007

TO THE FINAL QUESTION, IS THERE A RELATIONSHIP BETWEEN INFECTIOUS
MATERNAL METABOLIC BURDON, INFECTIOUS
DISEASE, AND NATIONAL PRODUCTION?
LIBYA
MOROCCO
ALGERIA
TUNISIA -
INTERMEDIATE
r = -0.884 ( p < 0.01 )slope = -0.38n = 47 countries
Ordinary least-squares regression of log transformed data on log scales
AFGHANISTAN
BANGLADESH
PHILLIPINES
NAMIBIAINDIA
THAILAND
HIGH
DJIBUOUTI
SAUDIA ARABIA
AMERICAN SOMOA
ARGENTINATURKEYKAZAKHSTAN
ALBANIA
BULGARIA
RUSSIA
ARGENTINA
FRANCE
JAPAN
UNITED STATES
LOW
SPAINEUROPEAN UNIONUNITED KINGDOMSWEDENFINLANDSWITZERLAND
Major Infectious Diseases:degree of risk:
ETHIOPIA
MALAWI
BURUNDI
NIGER
UGANDALIBERIA - SIERRA LEONE
ANGOLA
GUINEA ZAMBIANIGERIA - RWANDA
KENYASENEGAL - TOGO
ZIMBABWE
CAMBODIA
BURMA
VERY HIGH
Bir
th R
ate
/ 100
0 (l
og)
Gross Domestic Product per Capita (log)
THE LINK BETWEEN INFECTIOUS DISEASE, HUMAN
BIOMASS PRODUCTION AND GDP
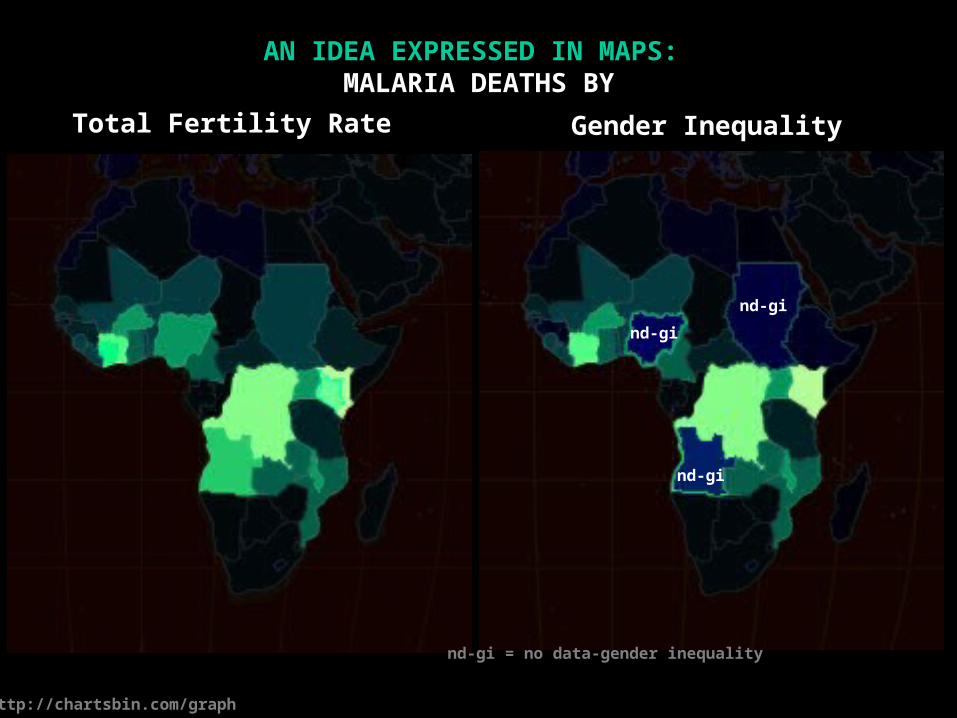
AN IDEA EXPRESSED IN MAPS: MALARIA DEATHS BY
Total Fertility Rate
http://chartsbin.com/graph
Gender Inequality
nd-gi
nd-gi
nd-gi
nd-gi = no data-gender inequality
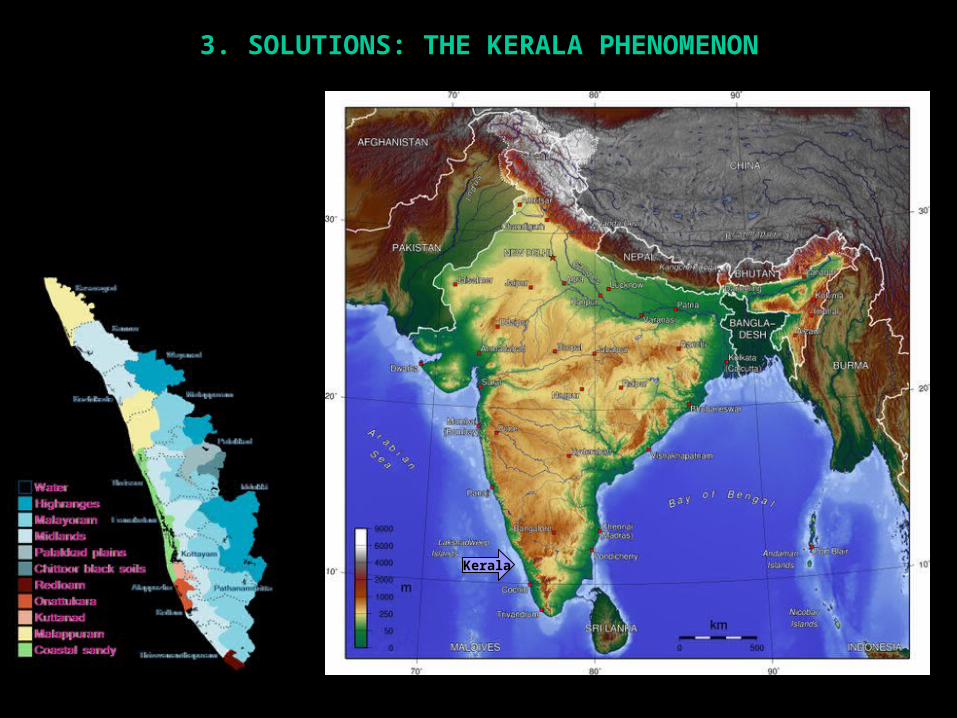
Kerala
3. SOLUTIONS: THE KERALA PHENOMENON
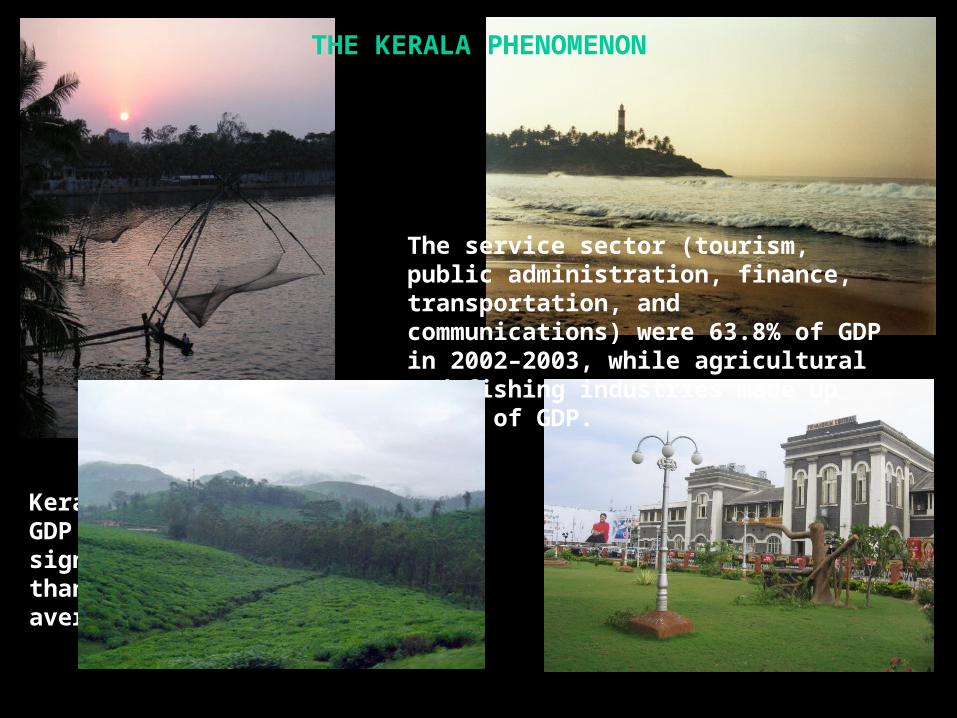
Kerala's per capita GDP of 11,819 INR is significantly higher than the all India average.
The service sector (tourism, public administration, finance, transportation, and communications) were 63.8% of GDP in 2002–2003, while agricultural and fishing industries made up 17.2% of GDP.
THE KERALA PHENOMENON
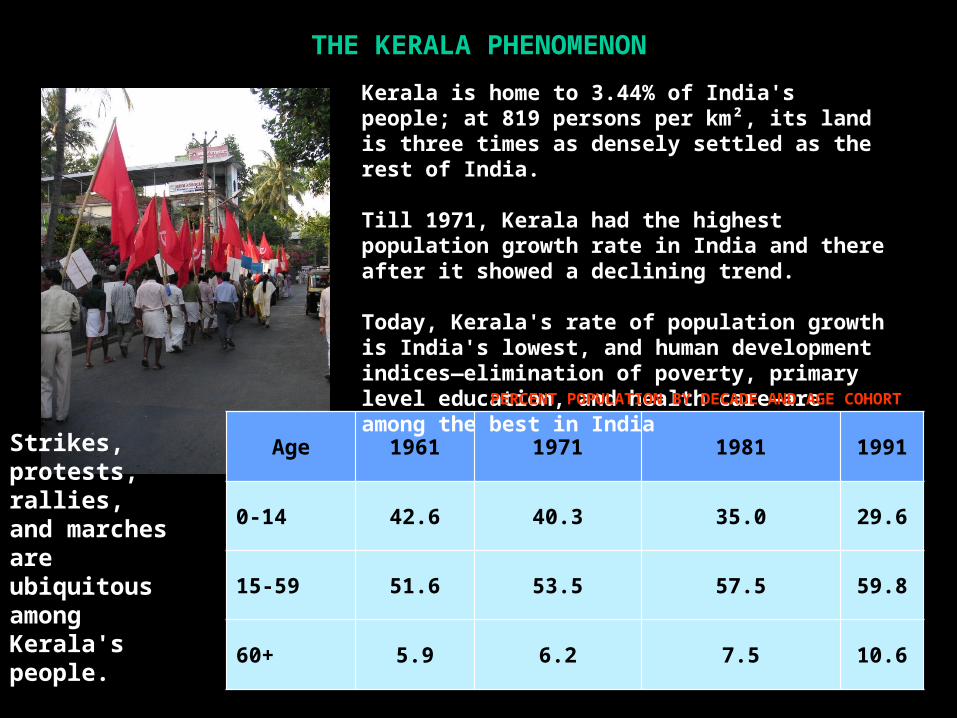
Age 1961 1971 1981 1991
0-14 42.6 40.3 35.0 29.6
15-59 51.6 53.5 57.5 59.8
60+ 5.9 6.2 7.5 10.6
Kerala is home to 3.44% of India's people; at 819 persons per km², its land is three times as densely settled as the rest of India. Till 1971, Kerala had the highest population growth rate in India and there after it showed a declining trend.
Today, Kerala's rate of population growth is India's lowest, and human development indices—elimination of poverty, primary level education, and health care—are among the best in India
Strikes, protests, rallies, and marches are ubiquitous among Kerala's people.
PERCENT POPULATION BY DECADE AND AGE COHORT
THE KERALA PHENOMENON

Low birth rate and death rate along with higher female life expectancy and low infant mortality due to:
Wide network of health infrastructure and manpower.
Social factors like women’s education, general health awareness.
THE KERALA PHENOMENON

TODAY WE KNOW THAT SCALE-FREE NETWORK ARCHITECTURES LAY AT THE HEART OF NATURAL SYSTEMS
AND SOLUTIONS TO VEXING PROBLEMS
Few nodes with many connections, while remaining nodes have reduced connectivity with other nodes. (obey power law)
REGULAR RANDOM

THE BLUE NODE IS THE FOCAL NODE OF A NEIGHBORHOOD TO WHICH A PERSON IS
ASSIGNED
CLUSTERED LATTICE OF NEIGHBORS
RANOM NETWORK OF NEIGHBORS

CAN A VIRTUAL COMMUNICATIONS
NETWORK TRANSFORM INDIA’S HEALTH
LANDSCAPE?
“Patients with TB must take their drugs every day for six to eight months to eliminate infection, but often stop as soon as they feel better. With mobile phones now more common in poor countries, the researchers have come up with an idea. A text message reminds patients to take their pill. On opening the pill wrapper they get a code that gives them three minutes’ free call time.”
“India boasts the fastest-growing mobile-phone market in the world. One-fifth of its 218 million mobile-phone users live in rural areas and the country’s service providers are rapidly expanding wireless coverage to villages.” (Fairless, 2007)

“India now surpasses the United States in terms of annual cancer deaths, and wants to find ways to treat the disease cheaply. But this desire runs counter to the goals of drug makers, who see middle-income nations as central to their growth plans. “
“Once the scourge of the developing world, infectious diseases such as malaria, tuberculosis and AIDS can now be fought with cheap drugs. But as people in poorer nations live longer and adopt Western habits, non-communicable diseases such as heart disease, diabetes and cancer have become the main killers — and paying for their treatment has become a thorny problem.”(Hayden)
HOW ELSE DOES EFFICACIOUS TREATMENT
OF INFECTIOUS DISEASE AFFECT THE HEALTH
LANDSCAPE?
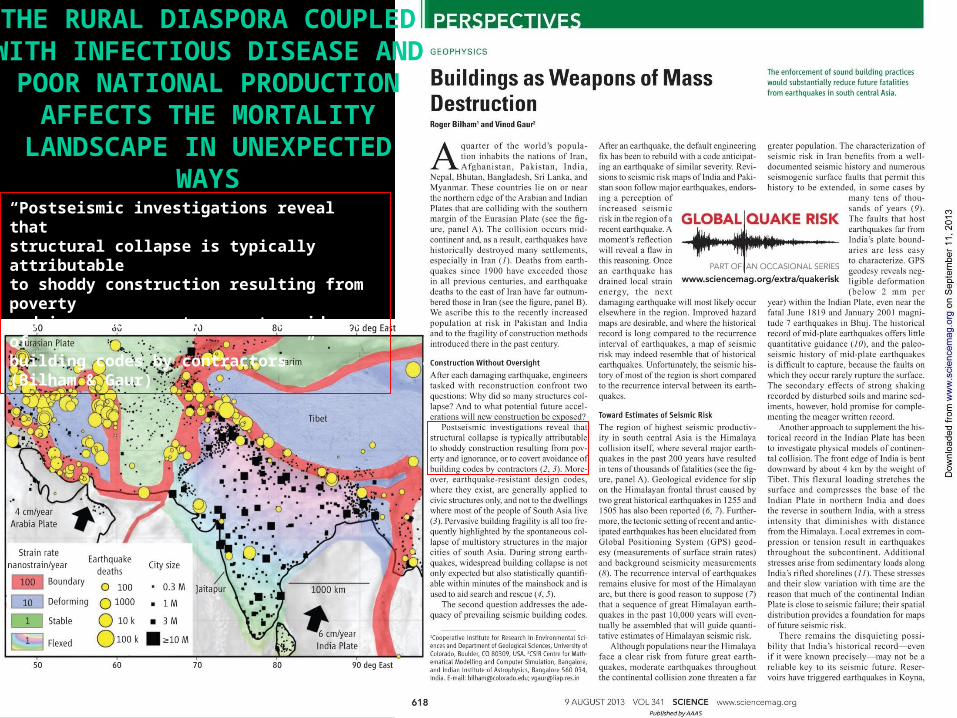
THE RURAL DIASPORA COUPLED WITH INFECTIOUS DISEASE AND POOR NATIONAL PRODUCTION
AFFECTS THE MORTALITY LANDSCAPE IN UNEXPECTED
WAYS“Postseismic investigations reveal thatstructural collapse is typically attributableto shoddy construction resulting from povertyand ignorance, or to covert avoidance ofbuilding codes by contractors.” (Bilham & Gaur)

THIS SIDE UP
Many thanks to:and forThinking Out of the Box
Phi Beta Kappa Mu of Virginia Chapter