Embed Size (px)
Citation preview

DEMOGRAPHIC RESEARCH
VOLUME 39, ARTICLE 17, PAGES 487,524PUBLISHED 18 SEPTEMBER 2018http://www.demographic-research.org/Volumes/Vol39/17/DOI: 10.4054/DemRes.2018.39.17
Research Article
Co-ethnic marriage versus intermarriage amongimmigrants and their descendants:A comparison across seven European countries usingevent-history analysis
Tina Hannemann
Hill Kulu
Leen Rahnu
Allan Puur
Mihaela Hărăguș
Ognjen Obućina
Amparo González Ferrer
Karel Neels
Layla Van den Berg
Ariane Pailhé
Gina Potarca
Laura BernardiThis publication is part of the Special Collection “A New Look Into the Dynamics ofMixed Couples in Europe,” organized by Guest Editors Amparo González-Ferrer,Laura Bernardi & Alícia Adserà.
© 2018 Tina Hannemann et al.
This open-access work is published under the terms of the Creative CommonsAttribution 3.0 Germany (CC BY 3.0 DE), which permits use, reproduction, anddistribution in any medium, provided the original author(s) and source are givencredit. See https://creativecommons.org/licenses/by/3.0/de/legalcode.

Contents
1 Introduction 488
2 Theoretical framework 4902.1 Individual-level factors in intermarriage 4902.2 Structural constraints and opportunities for intermarriage 4922.3 Cultural factors, assimilation, and integration 492
3 Data 4933.1 Included countries and sampling 4933.2 Country-specific and harmonisation limitations 498
4 Methods 498
5 Results 5005.1 Descriptive statistics 5005.2 Separate analysis of co-ethnic marriage and intermarriage 5025.3 Simultaneous analysis of co-ethnic marriage and intermarriage 505
6 Conclusions 509
7 Acknowledgements 513
References 514
Appendix 521

Demographic Research: Volume 39, Article 17Research Article
http://www.demographic-research.org 487
Co-ethnic marriage versus intermarriage among immigrantsand their descendants: A comparison across seven European
countries using event-history analysis
Tina Hannemann1
Hill Kulu2
Leen Rahnu3
Allan Puur3
Mihaela Hărăguș4
Ognjen Obućina5
Amparo González Ferrer6
Karel Neels7
Layla Van den Berg8
Ariane Pailhé5
Gina Potarca9
Laura Bernardi10
Abstract
BACKGROUNDImmigrants and their descendants often marry a co-ethnic partner despite the abundanceof native-born marriage candidates. The prevalence of co-ethnic marriages andintermarriage among migrants is influenced by their integration level and culturalbackground as much as individual preferences and structural factors.OBJECTIVEThis paper expands existing literature on intermarriage by analysing first marriagesacross European countries, distinguishing marriage type (endogamous versusexogamous) and migrant generations (immigrants versus their descendants).
1 Cathie Marsh Institute for Social Research, University of Manchester, UK.Email: [email protected] School of Geography and Sustainable Development, University of St. Andrews, UK.3 Estonian Institute for Population Studies, Tallinn University, Tallinn, Estonia.4 Centre for Population Studies, Babeș-Bolyai University Cluj-Napoca, Romania.5 Institut National d’Études Démographiques, Paris, France.6 Research Group on Demographic Dynamics, Spanish National Research Council, Madrid, Spain.7 Department of Sociology, University of Antwerp, Belgium.8 Centre for Longitudinal and Life Course Studies, University of Antwerp, Belgium.9 Institute of Demography and Socioeconomics/ NCCR LIVES, University of Geneva, Switzerland.10 Institute of Social Sciences, University of Lausanne and NCCR/LIVES, University of Geneva, Switzerland.
Hannemann et al.: Co-ethnic marriage versus intermarriage among immigrants and their descendants
488 http://www.demographic-research.org
METHODSData from seven countries was aggregated using the count-data method and wassubsequently pooled and analysed together; first, to estimate unadjusted first marriagerates; second, to calculate marriage risks separately by marriage type; and, finally, todirectly compare the risk of exogamous and endogamous marriage.RESULTSThere are substantial differences in the prevalence of co-ethnic marriage andintermarriage across the migrant groups. Migrants from non-EU countries often show ahigh prevalence of co-ethnic marriages and a low risk of intermarriage, whereasmigrants from neighbouring countries show a relatively high risk of intermarriage.CONCLUSIONSEthnic background and early socialisation have strong impacts on the partner choice ofmigrants and their descendants. The results suggest a strong influence of minoritysubcultures for some migrant groups, but also intergenerational adaptation processes forothers.
CONTRIBUTIONThis paper provides an up-to-date comparison of intermarriage rates across sevenEuropean countries and two migrant generations, presenting evidence of bothsimilarities and differences across countries.
1. Introduction
Many European countries have experienced an increase in their foreign-born populationand ethnic minorities over the past decades (Andersson, Obućina, and Scott 2015;Zimmermann 2005). However, the scale of immigration, the origin of immigrants, andthe experience with cultural integration varies greatly across European countries andrespective migrant groups. The lives of immigrants and their descendants in Europe arethe topic of a large body of empirical literature that focuses on the fertility and familybehaviour of immigrants and, more recently, of their descendants as well (Coleman andDubuc 2010; Goldscheider, Goldscheider, and Bernhardt 2011; Kulu and Hannemann2016; Toulemon 2004; Kulu et al. 2017). The current study contributes to this strand ofresearch, analysing the formation of first marriages and distinguishing betweenintermarriage (exogamous) and co-ethnic (endogamous) partner choice comparativelyacross seven European countries: the United Kingdom, France, Belgium, Switzerland,Estonia, Romania, and Spain.
Many studies aim to identify and explain differences in demographic behaviouracross various migrant groups as well as in comparison with the native population. A
Demographic Research: Volume 39, Article 17
http://www.demographic-research.org 489
high level of intermarriage between foreign and native individuals is interpreted as anindicator of general acceptance of immigrants by the majority population, and viceversa (Alba and Nee 2003; Coleman 1994; Feng et al. 2012; Kalmijn 1998). Asindividuals generally search for a partner with similar sociocultural characteristics(Becker 1973, 1974), marriage between a native individual and a foreign-bornindividual can also be viewed as an indicator of successful integration (Dribe andLundh 2008; Furtado 2012). However, high levels of exogamy may also be the result ofinherently lower cultural and socioeconomic distance between certain migrant groupsand the respective native population, as is the case of migration between neighbouringcountries that share historic, economic, and social bonds. The level and stability ofintermarriage (e.g., mixed ethnic origins) and co-ethnic marriages (e.g., shared ethnicbackground) have been analysed in several European countries (Dribe and Lundh 2012;González-Ferrer 2006b; Kalmijn and Van Tubergen 2006; Milewski and Kulu 2014).However, given the importance of inter-ethnic unions as an underlying mechanism andindicator of integration, it is surprising that the topic has received limited attention in acomparative perspective, especially in Europe.
In the same way as migration history and the share of foreign-born individualsvary across European countries, government-supported integration strategies andcultural differences between foreign and native populations also differ betweencountries (Bail 2008; Freeman 2004). Therefore, an analysis of the prevalence of co-ethnic marriage and intermarriage across various migration groups in several Europeancountries could provide valuable insights for policymakers shaping future migration,integration, and family policies.
The aim of this study is to examine differences in the prevalence of mixedmarriages among immigrants and their descendants groups in seven Europeancountries. The study extends previous literature in several ways. First, this is one of thefirst studies to compare mixed marriage risks across a number of European countries, asonly a few previous studies on this topic use a comparative approach (Lanzieri 2012).Furthermore, existing research on exogamy focuses primarily on Western Europeancountries. The sample in this study covers a wider range of European countries thatincludes Eastern European countries and therefore provides a more holistic perspectiveon endogamy and exogamy in contemporary Europe. The first research question is howthe risk of co-ethnic marriage and intermarriage varies across migrant groups withinand between the seven countries.
Second, the study investigates immigrants’ and their descendants’ propensity tochoose a partner of the same or of a different ethnic background. The inclusion of bothimmigrant generations provides an insight into intergenerational changes in partnerchoice. The second research question is: To what extent does the risk of intermarriagechange between the first and the second generation of immigrants?

Hannemann et al.: Co-ethnic marriage versus intermarriage among immigrants and their descendants
490 http://www.demographic-research.org
Finally, separate analyses are conducted for men and women, to measure possiblegender differences in the effect of individual characteristics such as age and education.Therefore, the third and last research question is whether the risk of co-ethnic marriageand intermarriage varies between men and women across migrant groups, controllingfor important socioeconomic characteristics. In summary, this study will broaden ourunderstanding of the variation in intermarriage among immigrants and their descendantsacross seven European countries.
2. Theoretical framework
Explanations of intermarriage trends combine theoretical approaches from a wide rangeof research fields (for an overview, see Adserà and Ferrer 2014). Furthermore, acomplex set of explanations touching different levels of social interaction have to beconsidered when interpreting intermarriage trends. As marriage is intended to be a life-long bond, a partner is typically chosen with much care, and the choice reflects acombination of individual preferences (micro-level explanation) and contextualopportunities (macro-level explanation) (González-Ferrer 2006a; Kalmijn 1998). Thispaper is limited to the analysis of first marriage. Cohabitation as an alternative uniontype is often seen as an indicator of modern family values and has spread among thenative populations of many European countries, especially as the first union (Hiekel,Liefbroer, and Poortman 2014; Lesthaeghe 2010). A comparative investigation ofendogamous and exogamous unions other than marriage, such as cohabitation, or ofhigher order marriages would therefore be of great interest. Unfortunately, data on non-traditional union types is rare and often incomplete.
2.1 Individual-level factors in intermarriage
In addition to physical attraction, in their partner selection criteria individuals stronglyprefer similarity in terms of socioeconomic position and shared cultural values (Kalmijn1998). The dominant trend of marital partner choice, positive assortative mating, isviewed as a natural consequence of searching for a similar partner. In regard toimmigrants, especially those from culturally distant origins such as non-EU countries,marital endogamy is an expected consequence due to the socioeconomic and culturaldifferences between them and the native population (Dribe and Lundh 2011). Severaloutcomes are possible for descendants of immigrants who grew up experiencing thecultural heritage of their parents at home but surrounded by the cultural expressions ofthe native population. In families that have largely adopted the native culture, the

Demographic Research: Volume 39, Article 17
http://www.demographic-research.org 491
descendants will tend to follow native trends and consider natives as marriage partnersequivalent to members of their own ethnic origin. Alternatively, if descendants ofimmigrants grow up mainly under the impact of the minority subculture (culturalenclave predominantly influenced by the ethnic background of its members) andisolated from native influences, it is possible that their family formation decisions willrelate very closely to those of their parents. Adherence to traditional marriage patternsmay be a way of compromising and gaining independence in other life domains.
The level of human capital is another important individual-level factor. Previousresearch in the Netherlands finds a higher likelihood of exogamy among immigrantswith a higher education level (Kalmijn and Van Tubergen 2006; Van Tubergen andMaas 2007). These results are supported by the analysis of post-war immigrants inFrance (Hamel and Moisy 2013; Safi 2010). Furthermore, high exogamy rates are foundamong individuals with better native language skills. Therefore, the wish for a partnerwith a similar socioeconomic status can outweigh the preference for a co-ethnic partner.
Merton’s status exchange theory is a different approach to human capital in themarriage market and explains the phenomenon of intermarriage as an exchange ofvaluable human, social, or economic assets between the two parties (Merton 1941; Qianand Lichter 2007). A highly educated immigrant can offer economic stability whilereceiving access to native social and cultural capital (which would otherwise be harderto accomplish) through his/her native spouse (Behtoui 2010; Meng and Gregory 2005).In the opposite case, low-educated native men with few economic resources mightmarry migrant women because they have few prospects in the native marriage market,given the tendency for men to marry downwards and women to marry upwards inregards to socioeconomic status. However, status exchange theory has received mixedempirical support in the United States (Gullickson 2006; Rosenfeld 2010). Althoughsocioeconomic status is an important factor that influences mating choices, it is not theonly exchangeable individual trait. Economic resources, physical appearance, andyounger age can also be used as bargaining tools. It can be expected that there aredifferences in the distribution and use of socioeconomic status and human capital asassets to attract a partner for both sexes, as well as across the various immigrant groupsand countries.
Although those bargaining assets would work in similar ways for both migrantgenerations, the second-generation has the advantage of being more familiar with thenative language and customs during the period of searching for a marriage partner, dueto their upbringing in the destination country. This could explain the higher prevalenceof intermarriage among the second generation compared to the first generation. Thisstudy includes individual education level to account for the impact of socioeconomicstatus on intermarriage trends. Although the inclusion of the individuals’ income,wealth, or occupation would be desirable, education is the best single measure of
Hannemann et al.: Co-ethnic marriage versus intermarriage among immigrants and their descendants
492 http://www.demographic-research.org
socioeconomic status in the absence of comparable information on other socioeconomiccharacteristics.
2.2 Structural constraints and opportunities for intermarriage
The operation of individual factors is often supported or hindered by the structure of thelocal marriage market. Exogamy as a result of structural limitations in the marriagemarket is explained by the structural opportunity theory (Blau 1977; Cretser 1999). Alimited availability of matching partners with preferred characteristics within the ownmigrant group can influence and consequently alter individual preferences. Suchstructural limitations in the marriage market can occur due to small migrant group size,an unbalanced sex ratio, limited residential proximity, unfavourable age structure, etc..A higher level of exogamy would therefore be expected among very small migrantgroups, independent of cultural distance (Chiswick and Houseworth 2011; Coleman1994; González-Ferrer 2006a). Because the focus of this study is a multi-countrycomparison of immigrants and their descendants, the sample contains only the largestmigrant groups in each country, thus substantially reducing the impact of suchstructural limitations. Given the focus of this study and the choice of migration groups,it will not test any hypothesis regarding structural constraints on intermarriage.
2.3 Cultural factors, assimilation, and integration
Besides the aforementioned factors, cultural and normative factors also impact partnerchoice. These factors are specific to each migrant group or ethnic community. Some ofthe most studied cultural factors of intermarriage are religion and religiosity, sincedifferent religious beliefs are often associated with larger cultural distance betweenpeople (Carol 2013). Previous studies have shown that exogamy is higher amongEuropean immigrants whose culture and faith is similar to those of Western Europeancountries (Lucassen and Laarman 2009), whereas it is lower for immigrants with moredistant religious and cultural backgrounds (Kalmijn and Van Tubergen 2006).
The prevalence of intermarriage between immigrant and native individuals is oftenassociated with a high level of integration of specific migrant groups in the host society(Gordon 1964; Kulu and González-Ferrer 2014). Well-integrated immigrants would beconsidered as equals and present an alternative to natives in the marriage market.However, high levels of exogamy may have causes other than the successful integrationof the foreign-born population (Song 2009). A similar culture, language, andbehavioural code could be enough to dilute perceived migrant differences.

Demographic Research: Volume 39, Article 17
http://www.demographic-research.org 493
The classical assimilation/adaptation theory states that immigrants will integrateinto the host society with time (Gordon 1964), which could increase their propensity forintermarriage over time. Longer time of exposure to the host society will promote theacculturation process, integration into labour and marriage markets, and theaccumulation of country-specific human and economic capital such as language skills,residence permits, and social ties. Although many immigrants will ultimately spendmany years and decades in the destination country, depending on their age at arrivalthey may have chosen a partner from their origin country before migrating, or searchfor a matching partner shortly after arrival with little exposure to the destinationcountry. Unlike their parents, descendants of immigrants spent their childhood in thehost society. If their parents are well integrated into the host society, the descendantsshould have relatively unrestricted access to the native marriage market and thereforeshow high levels of marriages with a native partner (Clark-Ibáñez and Felmlee 2004;Van Niekerk 2007). However, several studies have found that second-generationimmigrants from some origins have very low levels of exogamy, mostly following theirparents’ partner-choice pattern. This behaviour could be explained by the socialisationtheory, which states that preferences for life course decisions are established early inlife and are heavily influenced by the cultural system of the country of origin (Hervitz1985; Kulu and Milewski 2007). For descendants of immigrants who are raised inhighly segregated environments under the influence of the ethnic minority subculture,the socialisation effect could be transferred between the generations and lead to lowexogamy levels. To determine whether there are inter-generational changes in thepreference for co-ethnic or mixed-ethnic first marriages, this study examines groups ofimmigrants and their descendants separately by origin.
Finally, the mechanisms of bargaining power and desirable assets in the marriagemarket will vary between men and women, given the aforementioned tendency forupward marriage among women and downward marriage among men. Possibleinteraction effects between migrant group, gender, and education increase thecomplexity of the analytical model. Therefore, this study analyses men and womenseparately, which is essential to shed light on the interaction effects of individualdemographic, cultural, and economic characteristics (Nikiforov and Mamaev 1998).
3. Data
3.1 Included countries and sampling
This study uses data from seven European countries: the United Kingdom, France,Belgium, Switzerland, Estonia, Romania, and Spain. Prior to this study, five country

Hannemann et al.: Co-ethnic marriage versus intermarriage among immigrants and their descendants
494 http://www.demographic-research.org
case studies have been conducted that provide detailed analysis of inter-ethnicpartnership in the United Kingdom, Spain, Estonia, Switzerland, and Romania(González-Ferrer et al. 2016; Hărăguș 2016; Kulu and Hannemann 2018; Potârcă andBernardi 2018; Puur et al. 2018), which inspired the idea for this comparative paper. Inorder to make this paper even more representative of the European context, furtherresearch partners from France and Belgium were recruited to participate in this study.
Data for the United Kingdom is derived from the first wave (2009/2010) of theUnderstanding Society study (University of Essex, Institute for Social and EconomicResearch, and NatCen Social Research 2014), which collected detailed information onpartnership histories. For France, this study uses data from the Trajectories and Originssurvey (TeO), which was conducted in 2008 by the French Institute for DemographicStudies (INED) and the French National Statistical Office (INSEE). The surveycontains retrospective information on partnership formation, including the country ofbirth for marital partner.
The Romanian data was taken from a replication of the first wave of theGenerations and Gender Survey (GGS) in combination with the Hungarian TurningPoints of Our Life Course panel survey in 2006. The information focuses on the ethnicHungarian population in the region of Transylvania and contains retrospectivepartnership information, including the ethnic background of each partner. In the case ofSwitzerland, data from the Family and Generations Survey (originally Enquête sur lesfamilles et les générations (EFG) 2013) is used. This survey was conducted by theFederal Statistical Office as part of the new census of the Swiss population. Amongother factors, the EFG survey collected information on the individual’s current marriageand retrospective information on marital union history.
Estonian data was retrieved from two retrospective studies: The EstonianGenerations and Gender Survey (2004/2005) and the Estonian Family and FertilitySurvey (1994). For Belgium, this study uses data from the 2001 Census, which containsretrospective information on the first marriage of women, including the ethnicity of thepartner. For Spain, this study exploits data from the 2007 National Immigrant Survey(NIS), which was conducted by the Spanish National Institute of Statistics.
In this study, immigrants are defined as individuals who were born outside of theircurrent country of residence (with the exception of ethnic Hungarians in Romania).Their native-born children are therefore defined as descendants of immigrants. Apartfrom native-born children with two foreign-born parents, the latter group also includesindividuals with one foreign-born and one native parent (they amount to only verysmall case numbers and therefore could not be analysed separately).
Overall, a co-ethnic or endogamous marriage is defined as a marriage betweenindividuals with the same ethnic background (country of birth for immigrants andethnic origin for descendants of immigrants). This definition includes the marriage of

Demographic Research: Volume 39, Article 17
http://www.demographic-research.org 495
individuals from the same ethnic background but different migrant generations. Forexample, the marriage between an immigrant from Turkey and a native-borndescendant of Turkish parents is categorised as an endogamous marriage in this study.As a result, an intermarriage is defined as a marriage between individuals of differentethnic backgrounds. The majority of these are unions between a native individual and aperson from an ethnic minority. (The rare cases of intermarriage between immigrants ordescendants of different ethnic backgrounds could not be analysed separately in thisstudy due to very small case numbers).
Furthermore, several countries of origin had to be aggregated for the purpose ofrobust statistical analysis due to small numbers in specific migrant origin groups. Inthose cases, the specific combination of the country of origin of the individual andhis/her partner remains the indicator for distinguishing endogamous from exogamousmarriages. For example, although both partners of a French-Spanish couple mightbelong to the aggregated group of Western Europe, their marriage is defined asintermarriage because their specific countries of birth still differ. For Romania, thedifferentiation between the two types of marriage is done solely on the basis of self-reported ethnicity, due to the fact that country of birth is the same for the Romaniansand the ethnic Hungarians.
In total, this study distinguishes between thirty-six individual migrant groups. AsTable 1 shows, the UK data differentiates between four groups of origin for bothimmigrant generations: (1) Europe and other industrialised countries (referred to asEurope and West), (2) India, (3) Pakistan and Bangladesh, and (4) Caribbean countries.For France, immigrants and their descendants from the following origins areinvestigated: (1) Maghreb states, (2) sub-Saharan African countries, (3) Turkey, and (4)Southern Europe. For Switzerland, immigrants and their descendants are classified intothree groups: (1) former Yugoslavia and Turkey, (2) Germany, France, and Austria(referred to as Western Europe), and (3) Southern Europe. Immigrants and theirdescendants in Estonia consist of individuals from Russia, Ukraine, and Belarus(referred to as Russian-speaking).
The Romanian data source focuses on the ethnic Hungarians in Transylvania, whorepresent the largest minority group in the country. The main groups of origin for thefirst- and second-generation immigrants in Belgium are: (1) Italy, (2) Morocco, and (3)Turkey. Spain contributes to this sample with first-generation immigrants only, fromseven different origins: (1) Morocco, (2) Romania, (3) Ecuador, (4) Colombia, and (5)countries of the EU25 region. In order to increase clarity in figures and tables, theremainder of the study will refer to immigrants as 1G and to descendants of immigrants,the so-called second generation, as 2G, in combination with the respective ethnicminority name.

Hannemann et al.: Co-ethnic marriage versus intermarriage among immigrants and their descendants
496 http://www.demographic-research.org
Given the comparative nature of this study and the harmonisation process betweenthe different data sources, only the most important demographic and socioeconomicconfounders could be included. This study analyses time until first marriage using ageas the baseline, categorised into five-year age groups (15–19; 20–24; 25–29; 30–34; 35and older). Individuals become at risk of marriage at their 15th birthday. Legal age formarriage varies across the seven countries analysed here, as well as among the variouscountries of origin. For immigrants who arrived in the country of destination at laterages, risk time also includes time spent in the country of origin. Therefore, the start ageis set early deliberately in order to capture young age marriages in some migrantgroups. Rare cases where an individual stated that s/he married before the age of 15were removed from the sample. Individuals are censored at the age of 45 in cases whereno first marriage was recorded.
Our research sample consists of women and men born between 1950 and 1989,grouped into four 10-year birth cohorts. The analysis includes highest achievededucation level as an indicator of socioeconomic status. Information on education levelis treated as a time-constant variable and was measured at the time of the interview.Education is categorised into low, medium, and high levels of achieved educationaldegree (ISCED (1997) levels 0–2, 3–4, and 5–6, respectively). Some countries hadmissing information on education level, which was introduced as an additional categoryin order to avoid unnecessary reduction in the sample size.
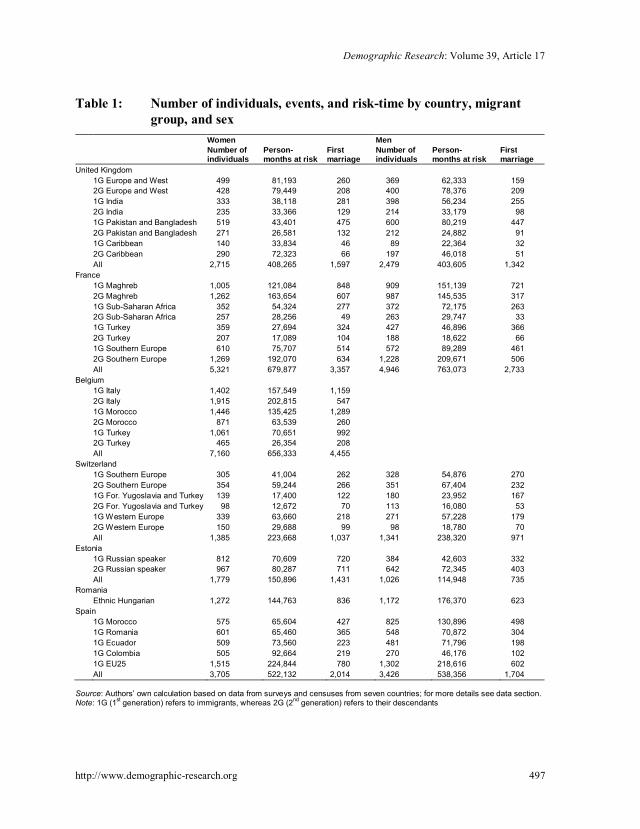
Table 1 provides the size of the risk population and the number of events (firstmarriage) and person-months for each of the seven countries, disaggregated by migrantgroup, migrant generation, and sex.
Demographic Research: Volume 39, Article 17
http://www.demographic-research.org 497
Table 1: Number of individuals, events, and risk-time by country, migrantgroup, and sex
Women MenNumber ofindividuals
Person-months at risk
Firstmarriage
Number ofindividuals
Person-months at risk
Firstmarriage
United Kingdom1G Europe and West 499 81,193 260 369 62,333 1592G Europe and West 428 79,449 208 400 78,376 2091G India 333 38,118 281 398 56,234 2552G India 235 33,366 129 214 33,179 981G Pakistan and Bangladesh 519 43,401 475 600 80,219 4472G Pakistan and Bangladesh 271 26,581 132 212 24,882 911G Caribbean 140 33,834 46 89 22,364 322G Caribbean 290 72,323 66 197 46,018 51All 2,715 408,265 1,597 2,479 403,605 1,342
France1G Maghreb 1,005 121,084 848 909 151,139 7212G Maghreb 1,262 163,654 607 987 145,535 3171G Sub-Saharan Africa 352 54,324 277 372 72,175 2632G Sub-Saharan Africa 257 28,256 49 263 29,747 331G Turkey 359 27,694 324 427 46,896 3662G Turkey 207 17,089 104 188 18,622 661G Southern Europe 610 75,707 514 572 89,289 4612G Southern Europe 1,269 192,070 634 1,228 209,671 506All 5,321 679,877 3,357 4,946 763,073 2,733
Belgium1G Italy 1,402 157,549 1,1592G Italy 1,915 202,815 5471G Morocco 1,446 135,425 1,2892G Morocco 871 63,539 2601G Turkey 1,061 70,651 9922G Turkey 465 26,354 208All 7,160 656,333 4,455
Switzerland1G Southern Europe 305 41,004 262 328 54,876 2702G Southern Europe 354 59,244 266 351 67,404 2321G For. Yugoslavia and Turkey 139 17,400 122 180 23,952 1672G For. Yugoslavia and Turkey 98 12,672 70 113 16,080 531G Western Europe 339 63,660 218 271 57,228 1792G Western Europe 150 29,688 99 98 18,780 70All 1,385 223,668 1,037 1,341 238,320 971
Estonia1G Russian speaker 812 70,609 720 384 42,603 3322G Russian speaker 967 80,287 711 642 72,345 403All 1,779 150,896 1,431 1,026 114,948 735
RomaniaEthnic Hungarian 1,272 144,763 836 1,172 176,370 623
Spain1G Morocco 575 65,604 427 825 130,896 4981G Romania 601 65,460 365 548 70,872 3041G Ecuador 509 73,560 223 481 71,796 1981G Colombia 505 92,664 219 270 46,176 1021G EU25 1,515 224,844 780 1,302 218,616 602All 3,705 522,132 2,014 3,426 538,356 1,704
Source: Authors’ own calculation based on data from surveys and censuses from seven countries; for more details see data section.Note: 1G (1st generation) refers to immigrants, whereas 2G (2nd generation) refers to their descendants

Hannemann et al.: Co-ethnic marriage versus intermarriage among immigrants and their descendants
498 http://www.demographic-research.org
3.2 Country-specific and harmonisation limitations
Despite our efforts to assure the highest level of comparability across the countries inthis study, several exceptions regarding availability of data and definitions have to betaken into account when interpreting the results. First, in Belgium, where the censusonly provides data on first marriage for women aged 14 years and older, no analysiscould be performed for men.
Second, due to the retrospective nature of the data from Belgium, the UnitedKingdom, and Spain, not all married individuals could be included in the sample. ForBelgium and the United Kingdom, information on the partner’s country of birth wasonly available for current marriages at the time of the survey or census. First marriageswhich had ended by the time of the interview were excluded from this analysis becausetheir type could not be determined. In Spain all married individuals are included in theanalysis; however, since the marriage order cannot be established from the survey, it isnot certain that all marriages are first marriages. Given the relatively young immigrantpopulation and the low divorce and remarriage rates in Spain, this should only introduceminor bias to the analysis.
Third, for Spain this study only analyses immigrants, because for most migrantgroups the second generation has not yet reached marriage age. The case of Romania isdifferent. The indigenous ethnic Hungarians in Transylvania are not immigrants: thisethnic minority group formed through territorial changes and political transformationsafter the First World War. Although these individuals did not undergo a migrationprocess they still are a distinct minority in Romania, which lives in geographicallyseparate areas (54% of them live in localities where they account for more than 50% ofthe population (Tamás and Ilka 2010)), is schooled in the Hungarian language, and usestheir native language at home and in the cultural community, comparable to migrantgroups. This is the reason why in this study this group is analysed together with migrantgroups from other countries. Furthermore, information on ethnic Hungarians inRomania was available only from birth cohort 1960 onwards. However, sensitivityanalysis, using only the cohort range of 1960–1989 for all countries, showed nosignificant differences in the results.
4. Methods
Comparing seven European countries, the count-data approach is used to investigate therelative risk of co-ethnic marriage and intermarriage (Hoem 1987, 1993; Hoem et al.1976). This approach aggregates data over a chosen set of individual characteristics andis the preferred option in circumstances where individual-level data cannot be shared

Demographic Research: Volume 39, Article 17
http://www.demographic-research.org 499
with another research group due to data protection. The count-data approach can beused to compare marriage rates across population subgroups and countries with andwithout standardising the rates to individual characteristics. An event-time (oroccurrence-exposure) table for each country is prepared, which is defined by a cross-classification over a set of time intervals (in this study, 5-year age groups) and covariatecategories (Preston 2005). The data for each cell in such a table includes the totalnumber of events and the total time at risk for each combination of covariate categories.For each cell, the ratio of the number of marriages to the number of person-monthsspent at risk is a crude hazard:
= ⁄ , (1)
where is the hazard for category k in time period j. Let denote the number offirst marriages and denote the number of person-months at risk for group k in agegroup j. Therefore, is treated as the realisation of a Poisson random variable withthe mean :
= × . (2)
Thus, the product of the hazard of first marriages and exposure time is theexpected number of marriages. The model can be presented in a log-linear format:
ln = ln + ln . (3)
The equation is then arranged to investigate the hazard of type of first marriage:
ln ⁄ = ln . (4)
Finally, Equation 5 presents a log-linear model for the hazard of first marriagewhile including additional covariates:
ln = + , (5)
where reflects the log baseline hazard function of first marriage in terms of age, isa covariate matrix, and β represents a vector of the parameters measuring their effects.Both types of marriage (endogamous and exogamous) are treated as competing risks,with an individual being censored for one type of marriage in the case that thealternative event occurs. Those two competing risks lead to the following model:
Hannemann et al.: Co-ethnic marriage versus intermarriage among immigrants and their descendants
500 http://www.demographic-research.org
ln = +ln = + . (6)
Data from each country was aggregated using the different combinations of age,birth cohort, education, and ethnic group, and subsequently pooled into one commondatabase. Marriage risk was analysed using a Poisson regression model (6)distinguishing between the competing outcomes of endogamy (A) and exogamy (B),while considering the impact of the sociodemographic confounders. In a second step thedegree of exogamy and endogamy among the various migrant groups was analysedsimultaneously. For this step an interaction term of migrant group and marriage typewas used with only one overall reference group (second-generation Indians in theUnited Kingdom). This method provides the opportunity to compare the risk ofendogamy and exogamy directly across the large number of migrant groups andcountries, instead of running separate analyses for both types of marriage.
5. Results
5.1 Descriptive statistics
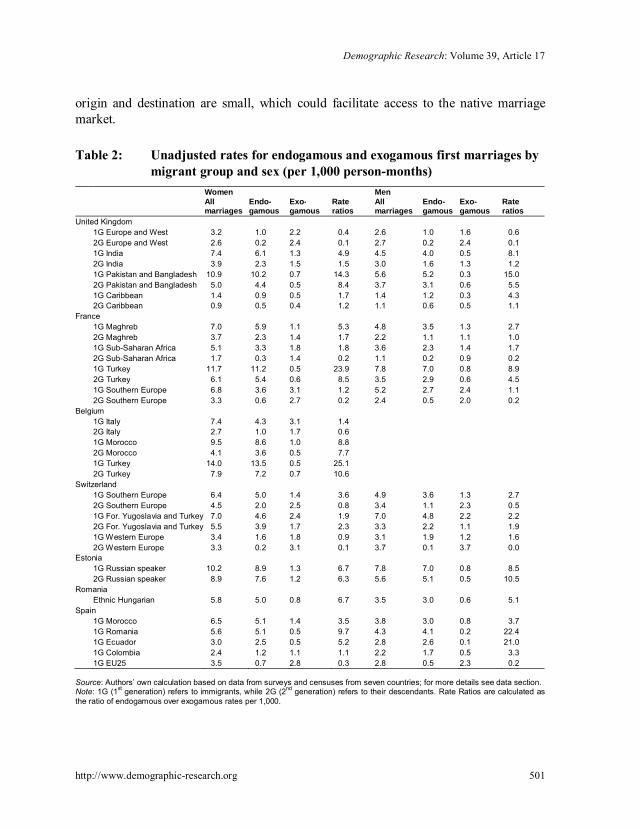
Table 2 presents unadjusted rates per 1,000 person-months for all marriages,disaggregated for co-ethnic marriages and intermarriage. The rate ratios, calculated asthe ratio of co-ethnic marriages to intermarriages, suggest that the dominant pattern isethnic endogamy. Among 36 migrant groups of women, 27 demonstrate rate ratios thatexceed one, implying higher endogamous marriage rates. For men, the higherpropensity for endogamous marriages is even more pronounced. Furthermore, thepatterns observed for immigrants are often reproduced by their descendants, whichcould suggest either a strong impact of the minority subculture or a lack ofsocioeconomic mobility. However, we also observe certain changes between themigrant generations, including a lower prevalence of endogamy in the secondgeneration.
The rate ratios show large variation depending on migrant group and country ofdestination. The highest ratio of endogamous to exogamous marriages is observedamong women from Turkey in Belgium and France and those from Pakistan andBangladesh in the United Kingdom, groups with large geographical and culturaldistance between country of origin and destination. The lowest rate ratio is observed formost European women and their descendants across all countries and descendants ofsub-Saharan African migrants in France. It can be assumed that at least for theEuropean immigrants and their descendants, cultural differences between country of
Demographic Research: Volume 39, Article 17
http://www.demographic-research.org 501
origin and destination are small, which could facilitate access to the native marriagemarket.
Table 2: Unadjusted rates for endogamous and exogamous first marriages bymigrant group and sex (per 1,000 person-months)
Women MenAllmarriages
Endo-gamous
Exo-gamous
Rateratios
Allmarriages
Endo-gamous
Exo-gamous
Rateratios
United Kingdom1G Europe and West 3.2 1.0 2.2 0.4 2.6 1.0 1.6 0.62G Europe and West 2.6 0.2 2.4 0.1 2.7 0.2 2.4 0.11G India 7.4 6.1 1.3 4.9 4.5 4.0 0.5 8.12G India 3.9 2.3 1.5 1.5 3.0 1.6 1.3 1.21G Pakistan and Bangladesh 10.9 10.2 0.7 14.3 5.6 5.2 0.3 15.02G Pakistan and Bangladesh 5.0 4.4 0.5 8.4 3.7 3.1 0.6 5.51G Caribbean 1.4 0.9 0.5 1.7 1.4 1.2 0.3 4.32G Caribbean 0.9 0.5 0.4 1.2 1.1 0.6 0.5 1.1
France1G Maghreb 7.0 5.9 1.1 5.3 4.8 3.5 1.3 2.72G Maghreb 3.7 2.3 1.4 1.7 2.2 1.1 1.1 1.01G Sub-Saharan Africa 5.1 3.3 1.8 1.8 3.6 2.3 1.4 1.72G Sub-Saharan Africa 1.7 0.3 1.4 0.2 1.1 0.2 0.9 0.21G Turkey 11.7 11.2 0.5 23.9 7.8 7.0 0.8 8.92G Turkey 6.1 5.4 0.6 8.5 3.5 2.9 0.6 4.51G Southern Europe 6.8 3.6 3.1 1.2 5.2 2.7 2.4 1.12G Southern Europe 3.3 0.6 2.7 0.2 2.4 0.5 2.0 0.2
Belgium1G Italy 7.4 4.3 3.1 1.42G Italy 2.7 1.0 1.7 0.61G Morocco 9.5 8.6 1.0 8.82G Morocco 4.1 3.6 0.5 7.71G Turkey 14.0 13.5 0.5 25.12G Turkey 7.9 7.2 0.7 10.6
Switzerland1G Southern Europe 6.4 5.0 1.4 3.6 4.9 3.6 1.3 2.72G Southern Europe 4.5 2.0 2.5 0.8 3.4 1.1 2.3 0.51G For. Yugoslavia and Turkey 7.0 4.6 2.4 1.9 7.0 4.8 2.2 2.22G For. Yugoslavia and Turkey 5.5 3.9 1.7 2.3 3.3 2.2 1.1 1.91G Western Europe 3.4 1.6 1.8 0.9 3.1 1.9 1.2 1.62G Western Europe 3.3 0.2 3.1 0.1 3.7 0.1 3.7 0.0
Estonia1G Russian speaker 10.2 8.9 1.3 6.7 7.8 7.0 0.8 8.52G Russian speaker 8.9 7.6 1.2 6.3 5.6 5.1 0.5 10.5
RomaniaEthnic Hungarian 5.8 5.0 0.8 6.7 3.5 3.0 0.6 5.1
Spain1G Morocco 6.5 5.1 1.4 3.5 3.8 3.0 0.8 3.71G Romania 5.6 5.1 0.5 9.7 4.3 4.1 0.2 22.41G Ecuador 3.0 2.5 0.5 5.2 2.8 2.6 0.1 21.01G Colombia 2.4 1.2 1.1 1.1 2.2 1.7 0.5 3.31G EU25 3.5 0.7 2.8 0.3 2.8 0.5 2.3 0.2
Source: Authors’ own calculation based on data from surveys and censuses from seven countries; for more details see data section.Note: 1G (1st generation) refers to immigrants, while 2G (2nd generation) refers to their descendants. Rate Ratios are calculated asthe ratio of endogamous over exogamous rates per 1,000.
Hannemann et al.: Co-ethnic marriage versus intermarriage among immigrants and their descendants
502 http://www.demographic-research.org
For men, the analysis shows a similar pattern with similar or more moderatevariations of rate ratios across the migrant groups. Compared to women, high rate ratiosare additionally found for the migrant groups in Estonia and immigrants from Romaniaand Ecuador in Spain. Men from other European countries and their descendants show avery low propensity for co-ethnic marriages. Overall, marriage rates are lower for menthan for women, which can be explained by the age difference between husbands andwives at time of marriage, which is common to most countries and culturalbackgrounds.
The Russian-speaking migrants in Estonia show elevated marriage rates, whichcan be explained by the relatively early ages of first marriage in Eastern Europeancountries. On the contrary, both generations of Caribbeans in the United Kingdom andsecond-generation sub-Saharan Africans in France show the lowest overall marriagerates in this seven-country comparison, a trend shared by both sexes. These can beexplained by cultural differences in the meaning and importance of marriage for familyformation processes (Hannemann and Kulu 2015; Miner 2003). Other forms ofpartnership, as well as separations and re-partnering, are more common among thoseethnic groups.
5.2 Separate analysis of co-ethnic marriage and intermarriage
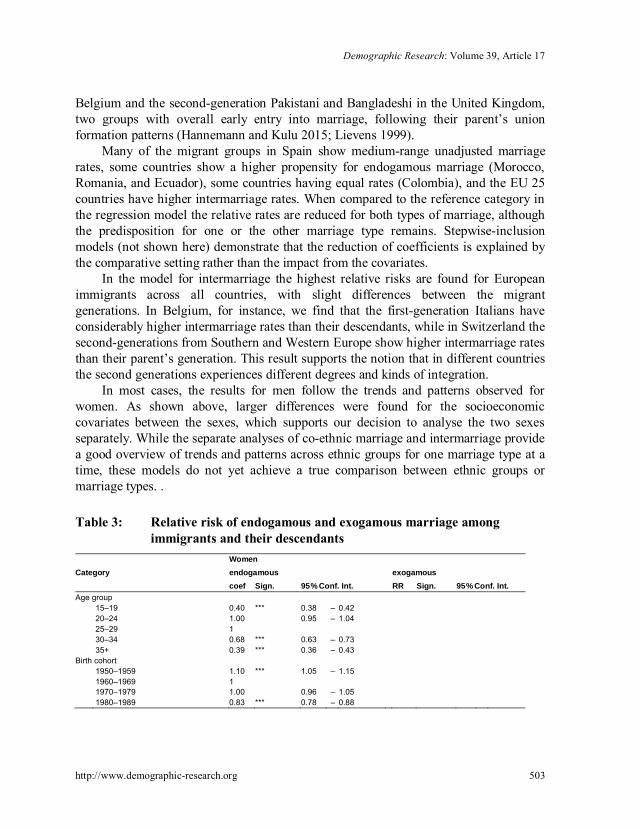
Table 3 shows the results of the competing risk models of endogamous and exogamousfirst marriages for men and women. The models control for age, birth cohort, education,and migrant group across the seven countries. Because of their moderate position in therange of rate ratios in Table 2, the descendants of Indian immigrants in the UnitedKingdom serve as the reference category for these models.
Looking at the various migrant groups, large differences can be found in thecompeting risks of co-ethnic marriage and intermarriage. These differences persist evenafter controlling for socioeconomic characteristics, which themselves have strongeffects, as shown above. The highest endogamous marriage risks are still observed forfirst-generation Pakistani and Bangladeshi in the United Kingdom, first-generationMoroccans and first- and second-generation Turks in France, Russian-speakers inEstonia, and first- and second-generation Turks and Moroccans in Belgium. Thesecond-generation Turks in France show an early entry into their first union, which inthe majority of cases is a marriage (Milewski and Hamel 2010; Pailhé 2015). Theseparate analysis by marriage type shows that the early marriage pattern is present forendogamous marriage, whereas lower relative marriage risks among those marryingoutside their ethnic group hint at a later entry into marriage. Similar tempo differencesbetween the marriage types can be observed for the second-generation Turkish in
Demographic Research: Volume 39, Article 17
http://www.demographic-research.org 503
Belgium and the second-generation Pakistani and Bangladeshi in the United Kingdom,two groups with overall early entry into marriage, following their parent’s unionformation patterns (Hannemann and Kulu 2015; Lievens 1999).
Many of the migrant groups in Spain show medium-range unadjusted marriagerates, some countries show a higher propensity for endogamous marriage (Morocco,Romania, and Ecuador), some countries having equal rates (Colombia), and the EU 25countries have higher intermarriage rates. When compared to the reference category inthe regression model the relative rates are reduced for both types of marriage, althoughthe predisposition for one or the other marriage type remains. Stepwise-inclusionmodels (not shown here) demonstrate that the reduction of coefficients is explained bythe comparative setting rather than the impact from the covariates.
In the model for intermarriage the highest relative risks are found for Europeanimmigrants across all countries, with slight differences between the migrantgenerations. In Belgium, for instance, we find that the first-generation Italians haveconsiderably higher intermarriage rates than their descendants, while in Switzerland thesecond-generations from Southern and Western Europe show higher intermarriage ratesthan their parent’s generation. This result supports the notion that in different countriesthe second generations experiences different degrees and kinds of integration.
In most cases, the results for men follow the trends and patterns observed forwomen. As shown above, larger differences were found for the socioeconomiccovariates between the sexes, which supports our decision to analyse the two sexesseparately. While the separate analyses of co-ethnic marriage and intermarriage providea good overview of trends and patterns across ethnic groups for one marriage type at atime, these models do not yet achieve a true comparison between ethnic groups ormarriage types. .
Table 3: Relative risk of endogamous and exogamous marriage amongimmigrants and their descendants
CategoryWomenendogamous exogamouscoef Sign. 95% Conf. Int. RR Sign. 95% Conf. Int.
Age group 15–19 0.40 *** 0.38 – 0.42 20–24 1.00 0.95 – 1.04 25–29 1 30–34 0.68 *** 0.63 – 0.73 35+ 0.39 *** 0.36 – 0.43
Birth cohort 1950–1959 1.10 *** 1.05 – 1.15 1960–1969 1 1970–1979 1.00 0.96 – 1.05 1980–1989 0.83 *** 0.78 – 0.88

Hannemann et al.: Co-ethnic marriage versus intermarriage among immigrants and their descendants
504 http://www.demographic-research.org
Table 3: (Continued)
CategoryWomenendogamous exogamouscoef Sign. 95% Conf. Int. RR Sign. 95% Conf. Int.
Country and migrant groupUnited Kingdom
1G Europe and West 0.41 *** 0.30 – 0.56 0.95 0.73 – 1.242G Europe and West 0.08 *** 0.05 – 0.13 0.94 0.73 – 1.231G India 2.70 *** 2.09 – 3.49 0.56 *** 0.39 – 0.802G India 1.00 0.65 * 0.46 – 0.931G Pakistan and Bangladesh 4.40 *** 3.46 – 5.60 0.31 *** 0.20 – 0.472G Pakistan and Bangladesh 2.07 *** 1.55 – 2.75 0.25 *** 0.14 – 0.431G Caribbean 0.31 *** 0.20 – 0.47 0.18 *** 0.11 – 0.312G Caribbean 0.19 *** 0.12 – 0.28 0.15 *** 0.10 – 0.24
France1G Maghreb 2.16 *** 1.71 – 2.73 0.41 *** 0.31 – 0.542G Maghreb 0.94 0.74 – 1.20 0.57 *** 0.44 – 0.741G Sub-Saharan Africa 1.21 0.93 – 1.58 0.66 ** 0.49 – 0.892G Sub-Saharan Africa 0.16 *** 0.08 – 0.32 0.72 0.49 – 1.051G Turkey 4.52 *** 3.52 – 5.79 0.19 *** 0.10 – 0.342G Turkey 2.66 *** 1.97 – 3.60 0.31 *** 0.17 – 0.591G Southern Europe 1.30 * 1.01 – 1.67 1.12 0.87 – 1.452G Southern Europe 0.23 *** 0.17 – 0.31 1.07 0.84 – 1.36
Belgium1G Italy 1.69 *** 1.34 – 2.14 1.21 0.95 – 1.542G Italy 0.46 *** 0.35 – 0.59 0.76 * 0.59 – 0.971G Morocco 3.24 *** 2.57 – 4.08 0.37 *** 0.28 – 0.492G Morocco 1.75 *** 1.35 – 2.26 0.23 *** 0.15 – 0.351G Turkey 5.54 *** 4.40 – 6.99 0.22 *** 0.15 – 0.332G Turkey 3.88 *** 2.98 – 5.06 0.37 *** 0.22 – 0.61
Switzerland1G Southern Europe 1.91 *** 1.47 – 2.48 0.53 *** 0.38 – 0.752G Southern Europe 0.81 0.61 – 1.08 0.99 0.75 – 1.301G For. Yugoslavia and Turkey 1.98 *** 1.45 – 2.70 1.04 0.71 – 1.512G For. Yugoslavia and Turkey 1.75 ** 1.23 – 2.51 0.75 0.46 – 1.221G Western Europe 0.70 * 0.52 – 0.94 0.81 0.61 – 1.082G Western Europe 0.09 *** 0.04 – 0.20 1.35 * 1.00 – 1.83
Estonia1G Russian speaker 4.34 *** 3.42 – 5.50 0.65 ** 0.48 – 0.882G Russian speaker 3.79 *** 2.99 – 4.79 0.60 *** 0.44 – 0.81
Romania Ethnic Hungarian 1.96 *** 1.55 – 2.48 0.29 *** 0.22 – 0.39
Spain1G Morocco 1.83 *** 1.43 – 2.34 0.52 *** 0.38 – 0.701G Romania 2.10 *** 1.64 – 2.69 0.22 *** 0.14 – 0.321G Ecuador 0.99 0.76 – 1.30 0.19 *** 0.13 – 0.281G Colombia 0.47 *** 0.35 – 0.62 0.44 *** 0.33 – 0.591G EU25 0.28 *** 0.21 – 0.36 1.11 0.88 – 1.40
Education levelUnknown 0.89 0.78 – 1.01Low 1Medium 0.82 *** 0.79 – 0.86High 0.55 *** 0.52 – 0.57
Constant 0.005 *** 0.004 – 0.006
Source: Authors’ own calculation based on data from surveys and censuses from seven countries; for more details see data section.Note: Significance level: *** = p-value < 0.001, ** = p-value < 0.01, * = p-value < 0.05. 1G (1st generation) refers to immigrants, while2G (2nd generation) refers to their descendants.
Demographic Research: Volume 39, Article 17
http://www.demographic-research.org 505
Regarding the effects from the socioeconomic covariates, women have the highestrisk of marrying a co-ethnic partner in their early 20s, while intermarriage levels arehighest in their late 20s. For men, both marriage types experience their highest levelwhen they are in their late 20s. For both men and women there is a cohort effect, withhigher marriage risks for older cohorts and lower risks for the youngest birth cohort.This reflects the ongoing trend of marriage losing its status as the only form ofpartnership. The postponement of marriage to later ages might also result in not allindividuals from the youngest cohorts having entered marriage at the time of datacollection, although they may plan to do so eventually.
The education variable shows a strong gradient for co-ethnic marriage, with muchlower risks among women with higher educational degrees. For intermarriage the effectis different: women with a medium education level show higher risks, while those withhigh education cannot be distinguished statistically from women with low education.The effect of education exhibits a different pattern for men. For them, education ispositively correlated with the propensity to form an endogamous marriage, leavinglower-educated men with the lowest risk of co-ethnic marriage. Men with a mediumlevel of education not only have the highest risk of endogamous marriage, but also thelowest risk of exogamous marriage. Lower-educated men, on the other hand, show thelowest propensity for co-ethnic marriage and the highest risk of intermarriage, leavingthe highly educated men in a medium position for both types of marriage. These resultshint that different mechanisms are at work for low- and high-educated men, related tochances in the marriage market (status exchange theory) or socialisation througheducation and employment. The different impact of education for men and women alsosuggests that education has a different value and bargaining power for the two sexes.
5.3 Simultaneous analysis of co-ethnic marriage and intermarriage
A direct comparison between the two types of marriage requires simultaneousmodelling with a common reference category for all migrant groups and both marriagetypes. The effects of the covariates remain (largely) the same as in the previousanalysis. Therefore, Figure 1 and Figure 2 display only the relative risks of the migrantgroups for the simultaneous models for men and women. Figure 1 shows relative risksfor immigrant women and their descendants, using the endogamous marriages ofdescendants of Indian immigrants in the United Kingdom as the overall referencecategory (exact coefficients of all variables are displayed in Table A-1 in theAppendix), and Figure 2 shows the equivalent for men. Both figures confirm our initialobservation that across all migrant groups and both sexes the majority of individuals optfor a co-ethnic first marriage. A stronger propensity for mixed-ethnic marriage can only

Hannemann et al.: Co-ethnic marriage versus intermarriage among immigrants and their descendants
506 http://www.demographic-research.org
be observed in a few cases and only among migrant groups with a Europeanbackground.
Figure 1: Simultaneous model of endogamous and exogamous marriagesamong immigrants and their descendants, women
Source: Authors’ own calculation based on data from surveys and censuses from seven countries; for more details see data section.Note: Model controls for birth cohort, age group, and education. Reference is second-generation Indian immigrants in the UnitedKingdom with endogamous marriage. 1G (1st generation) refers to immigrants, 2G (2nd generation) refers to their descendants. Fordetailed results see Table A-1 in the Appendix.
Across the seven countries, many ethnic groups show a prevalence of co-ethnicfirst marriages that is many times higher than for intermarriages. Once again, the largestdifference between the two types of marriage is observed for the non-EU migrantgroups.
Some groups that show overall low marriage rates also show low rates for bothmarriage types in the simultaneous analysis. Additionally, these groups (Caribbeans inthe United Kingdom, sub-Saharan Africans in France, and Colombians in Spain) showvery small differences in the prevalence of both marriage types, which in some casescannot be statistically distinguished from each other. This is true for both generations ofthe affected migrant groups and is mainly due to late marriage entry and a preferencefor alternative union types such as cohabitation (Hannemann and Kulu 2015; Miner2003).

Demographic Research: Volume 39, Article 17
http://www.demographic-research.org 507
Figure 2: Simultaneous model of endogamous and exogamous marriagesamong immigrants and their descendants, men
Source: Authors’ own calculation based on data from surveys and censuses from seven countries; for more details see data section..Note: Model controls for birth cohort, age group, and education. Reference is second-generation Indian immigrants in the UnitedKingdom with endogamous marriage. 1G (1st generation) refers to immigrants, 2G (2nd generation) refers to their descendants. Fordetailed results see Table A-1 in the Appendix.
To highlight generational patterns, Figure 3 displays the ratio of the relative risksof first and second generations for each migrant group from the simultaneous analysisof women (dark colour) and men (light colour). Values above 1 indicate higher relativerisk for the first generation, whereas values below 1 signify higher relative risk for thesecond generation. All migrant groups display higher relative risks of endogamousmarriage in the first generation than among their descendants, which is true for bothsexes. The highest relative risk ratios, and therefore the largest relative differencesbetween the generations, is observed for European and Western migrants in the UnitedKingdom, sub-Saharan African and Southern European migrants in France, andWestern European migrants in Switzerland. In all four migrant groups the lowendogamous risk of first marriage in the first generation is trumped by an extremely lowrisk of endogamous marriage among their descendants. This could be the result of theeconomic and demographic composition of those migrant groups or their lack ofprioritising a co-ethnic partner. Relative risk ratios closer to 1 are observed for severalmigrant groups with more traditional family values, meaning a more similarendogamous marriage risk across the two generations (e.g., Pakistani and Bangladeshi

Hannemann et al.: Co-ethnic marriage versus intermarriage among immigrants and their descendants
508 http://www.demographic-research.org
in the United Kingdom, Turkish in France, Moroccan and Turkish in Belgium, formerYugoslav and Turkish in Switzerland, and Russian-speakers in Estonia).
The picture is more heterogeneous for exogamous first marriage. Mostgenerational relative risk ratios are below 1, indicating higher exogamous marriage riskamong the second generation than among their parents’ generation. The smallestrelative ratios are produced on the one hand by a rather small increase of exogamousmarriage risk among the second generation compared to already very low risks amongtheir parents’ generation (e.g., Indian, Pakistani, and Bangladeshi in the UnitedKingdom), and on the other hand by sizeable increased risks among the secondgeneration (e.g., Southern and Western Europeans in Switzerland). These two patternscan have different origins.
Figure 3: Ratios of relative risks of 1st generation by 2nd generation of the samemigrant group in the simultaneous model, endogamous andexogamous marriages for women and men
Source: Authors’ own calculation based on data from surveys and censuses from seven countries; for more details see data section.Note: Model controls for birth cohort, age group and education. 1G (1st generation) refers to immigrants, 2G (2nd generation) refers totheir descendants. For detailed results see Table A-1 in the Appendix.

Demographic Research: Volume 39, Article 17
http://www.demographic-research.org 509
While differences between trends among women and men are in general smallerthan those between ethnic groups and migrant generations, several examples show thatfor certain migrant groups the choice of a co-ethnic or a mixed-ethnic marriage variesbetween the sexes. As already mentioned, the generational difference in the Pakistaniand Bangladeshi group is strong and significant for women but does not showsignificant changes for men. Columbian women in Spain show an equal prevalence ofco-ethnic marriage and intermarriage, whereas men from the same ethnic backgroundshow a much higher prevalence for co-ethnic marriage. However, for both sexes of thisethnic group the overall marriage risk is low.
6. Conclusions
This study analysed the formation of co-ethnic and mixed-ethnic first marriages amongimmigrants and their descendants in seven European countries. After presentingunadjusted marriage rates, event history methods were used to produce relative risks forthe two competing events, separately for men and women. Additionally, simultaneousmodels were estimated to compare marriage risks not only across the migrant groupsbut also across the two marriage types. For five out of the seven countries, both first-and second-generation migrant groups were observed to change marital behaviouracross generations.
This article addressed the following research questions: (1) How do the risks of co-ethnic marriage and intermarriage vary across migrant groups within and between thecountries? (2) To what extent does the risk of intermarriage change between immigrantsand their descendants? (3) Does the risk of co-ethnic marriage and intermarriage varybetween men and women across the migrant groups?
Regarding the first research question, the analysis showed large variation in firstmarriage risks across migrant groups, both within and between countries. In manycases, migrants from non-EU countries with distant cultural backgrounds showed highendogamous marriage risks; for example, Pakistanis and Bangladeshis in the UnitedKingdom, Turks and Maghrebian immigrants in France, Turks in Belgium, Russian-speakers in Estonia, and ethnic Hungarians in Romania. For these groups the resultsshowed high overall marriage risks, which can be linked to more conservative marriagepatterns, including early and almost universal marriage behaviour (Hannemann andKulu 2015; Kulu and González-Ferrer 2014; Pailhé 2015). At the same time, thesegroups showed low intermarriage rates.
At the other end of the spectrum there are migrant groups that show very lowoverall marriage risks, with very few differences in the prevalence for one or the othermarriage type, such as Caribbeans in the United Kingdom and sub-Saharan Africans in
Hannemann et al.: Co-ethnic marriage versus intermarriage among immigrants and their descendants
510 http://www.demographic-research.org
France. These immigrant groups place less importance on the institution of marriageand have family formation traditions different from those common in most Europeancountries (Miner 2003). Overall, the results support the theory of socialisation, showingthe importance of cultural heritage in family formation decisions regarding the ethnicbackground of the first marriage partner. This can also explain why European migrantsshowed relatively high intermarriage rates across countries, assuming that the marriagepattern and partner choice criteria are similar in their country of origin and destination.
With respect to the second research question, changes in the risk of co-ethnicmarriage and intermarriage could be observed between the two migrant generations, butthe magnitude of the difference depended strongly on the migrant group. The largestdecrease in co-ethnic marriage rates was observed for groups where immigrants showedhigh endogamous marriages rates. This could result from a combination of sub-culturaland native mainstream influences on the life decisions of the descendants ofimmigrants. Often it is a blend of being raised with the more conservative values oftheir ethnic background and the influence of the more liberal partner-search behaviourof native peers. Opportunities for prolonged education might further postpone firstmarriage for the second-generation. In many, though not all, of these migrant groups, asimultaneous rise in intermarriage risk can be observed between first and secondgenerations.
Higher risks of exogamous marriage can also be related to the level of adaptationtheir parents underwent after arrival in the host country. If parents engage in the hostculture more intensely there is an increased likelihood that their children will developmarriage norms and expectations that are more similar to those of the native population.In that case, higher rates of inter-ethnic marriage could be interpreted as an increasinglevel of mutual acceptance in the host and immigrant populations (Goldscheider 2007).Research has also shown that the descendants of mixed-ethnicity parents (one parent isforeign-born while the other is native) have a higher propensity to choose a nativepartner themselves (Logan and Shin 2012; Monden and Smits 2005).
In addition to adaptation effects, structural opportunity theory could also explainthe higher intermarriage rates among descendants of immigrants (Blau 1977). In orderto test if the observed generational differences are predominantly due to increasedexposure to natives in the host country and less a result of the fact that many first-generation immigrants already arrived with a marriage partner, an additional analysis ofunadjusted marriage rates and rate ratios was performed, excluding all individuals whoarrived married in the host country. As shown in Table A-2 (Appendix), the exogamousmarriage rates are lower than before for most migrant groups, but overall patternsremain. Smaller variation in the exogamous marriage rate also suggests that not allimmigrants arrive in the destination country with a co-ethnic partner. Furthermore, inBelgium all three analysed migrant groups show even higher co-ethnic marriage rates

Demographic Research: Volume 39, Article 17
http://www.demographic-research.org 511
when the sample is reduced to post-migration marriages. This can partly be explainedby the phenomenon of importing a partner from the country of origin (González-Ferrer2006b; Lievens 1999). The import of marriage partners from the country of origin andmarriages across immigrant generations are common among certain migrant groups(Huschek, de Valk, and Liefbroer 2012; Milewski 2010), including Turkish men andwomen in many Western European countries, and this involves individuals from boththe first and second generation.
The role of imported spouses is too complex to be analysed in depth in this seven-country comparative study; however, these mechanisms and a general ‘globalisation’ ofthe marriage market (Niedomysl, Osth, and van Ham 2010) have to be taken intoaccount when interpreting co-ethnic and intermarriage rates across ethnic groups.
Regarding the third and final research question – the investigation of intermarriagevariation between the sexes – a younger marriage age for women is clear in thecoefficients for age groups. Comparing migrant group-specific marriage risks, in mostcases the results for men and women do not vary substantially. Among co-ethnicmarriages the largest differences are observed for Pakistanis and Bangladeshis in theUnited Kingdom and immigrants from (former) Yugoslavia and Turkey in Switzerland.Interestingly, for the first group, women show a higher risk of exogamy among theimmigrants, whereas men display a higher risk among the descendants of immigrants.For mixed-ethnic marriage the largest differences between men and women are foundfor the descendants of Indian immigrants in the United Kingdom (women have higherrisks), for Western Europeans in the United Kingdom and Switzerland (men havehigher risks), and for descendants of Russian-speaking migrants in Estonia (men showlower rates than women). Strong gender differences in the effect of education were alsoobserved in the various models. However, the mechanisms behind those appeared to berather complex. The lack of clear support for the status exchange theory could partly bedue to cross-country restrictions on the transferability of skills and qualifications. Animmigrant’s higher educational degree is not always tradable or even a desirable tradeoption in the destination country (Maffioli, Paterno, and Gabrielli 2014). While thisstudy used education as one of the basic explanatory factors for marriage type, in-depthresearch is needed to understand the complex impact of education on marriage choicesacross the sexes, in combination with the cultural aspect of different ethnic backgroundsand structural constraints in the destination country. Given the variety in the magnitudeand direction of the differences between men and women, it is hard to find overallpatterns. The results suggest that gender differences are dependent on the ethnicbackground of migrants as well as the country of destination. Further, structural aspectslike sex distribution in the migration groups could play an important role, especially forsmaller migrant groups. For example, research in Belgium (Lievens 1999) shows thatco-ethnic marriage (and especially marriage to an imported partner) is most common

Hannemann et al.: Co-ethnic marriage versus intermarriage among immigrants and their descendants
512 http://www.demographic-research.org
for Turkish and Moroccan women who are expected to be more integrated (e.g., highesteducational level). These findings could indicate that endogamous marriage can also bean option for more integrated second-generation women, combining traditionalmarriage choices with aspirations towards independence and a more modern life style,since highly educated women will have a strong negotiation position in theirrelationship.
Finally, the country comparison also revealed certain country-specific patterns. InEstonia, for example, we observe relatively high first-marriage risks for bothgenerations of Russian-speaking migrants. Structural and historic circumstances haveshaped family formation patterns since the middle of the 20th century, which are alsofound among Estonian natives (Puur et al. 2012; Rahnu et al. 2015). Switzerlanddisplays high overall marriage rates together with relatively high risks of intermarriageamong several of its migrant groups, particularly those originating from neighbouringWestern European countries. This supports previous studies showing a comparativelywide acceptance of mixed marriages in these groups in the Swiss context (Carol 2013;Potârcă and Bernardi 2018). These country-specific marriage patterns, shaped byhistoric and social developments, have to be carefully taken into account wheninterpreting the variation in marriage patterns across national borders (Hannemann et al.2014).
Each country’s own migration history shaped the size and composition of itsmigrant population, leading to the specific combinations of country of origin anddestination, such as Caribbeans in the United Kingdom or Latin Americans in Spain.However, there are certain groups of immigrants which settled in several Europeancountries due to large migration waves (e.g., post-war labour migration). This cross-country comparison allows the analysis of intermarriage among certain migrant groupsregarding the impact of the host society. The Turkish immigrants in France, Belgium,and Switzerland (in the latter case in a combined group with individuals from formerYugoslavia) show very similar patterns. In all three countries, this migrant groupdisplays the highest risks of endogamy and the lowest risk of exogamy. This consistentpattern across host countries leads to the assumption that partner choice is stronglyinfluenced by socialisation and minority subculture. Country context and adaptationplay a less important role for this migrant group.
A similar conclusion (albeit in the opposite direction) holds for Western Europeanimmigrants, who in all countries show low risks of endogamy and high risks ofexogamy. In these cases, smaller cultural and socioeconomic distances to the hostsociety enhance adaptation and integration processes as well as acceptance in the hostsociety. This could be influenced by legal requirements for residence and work permits,which often vary between European and non-European immigrants, often includingstricter demands for the latter group. However, these results should be interpreted
Demographic Research: Volume 39, Article 17
http://www.demographic-research.org 513
carefully, since the aggregated groups of Western Europeans are different incomposition and size for each country in this analysis, masking aspects ofheterogeneity.
Despite all efforts to make the data from the different countries comparable, theharmonization process across seven different countries and data sources is incomplete.First, data for the United Kingdom and Belgium includes only first marriages thatpersisted until the interview or census date, which may introduce a bias for those twocountries by giving greater weight to the marriage patterns of more recent birth cohortsand younger age groups, since they are more likely to still be in their first marriage.This may entail an overestimation of endogamous marriage rates. For the same reason,we might also overestimate the rate of intra-group marriages in migrant groups withstrong endogamous preference because higher divorce risks were found for inter-ethnicmarriages (Jones 1996; Kalmijn, de Graaf, and Janssen 2005; Milewski and Kulu2014), resulting in a lower chance of being included in this study. The limitationsintroduced by the incomplete data harmonization are described in more detail in thedata section.
Second, the study had to limit the number of covariates to the three most important(age, birth cohort, and education). Unfortunately, this means that our study could nottake into account the effects of other important characteristics such as language skills,occupation, income, religion, and religiosity, which all presumably play a significantrole in partners’ choices.
Overall, this study offers a valuable insight into the prevalence of co-ethnic andmixed-ethnic first marriages across migrant groups from seven different Europeancountries, including the most important immigrant groups and their descendants in eachrespective country.
7. Acknowledgements
The research leading to these results has received funding from the European Union’sSeventh Framework Programme (FP7/2007−2013) under grant agreement no. 320116for the research project FamiliesAndSocieties.
The authors also acknowledge support from the Estonian Research Council (grantPRG71).
This publication further benefitted from the support of the Swiss National Centreof Competence in Research LIVES – Overcoming vulnerability: Life courseperspectives (NCCR LIVES), which is financed by the Swiss National ScienceFoundation (grant number: 51NF40-160590). The authors are grateful to the SwissNational Science Foundation for its financial assistance.

Hannemann et al.: Co-ethnic marriage versus intermarriage among immigrants and their descendants
514 http://www.demographic-research.org
References
Adserà, A. and Ferrer, A. (2014). Immigrants and demography: Marriage, divorce, andfertility. In: Chiswick, B.R. and Miller, P.W. (eds.). Handbook on the economicsof international migration. Amsterdam: Elsevier.
Alba, R. and Nee, V. (2003). Remaking the American mainstream: Assimilation andcontemporary immigration. Cambridge: Harvard University Press. doi:10.4159/9780674020115.
Andersson, G., Obućina, O., and Scott, K. (2015). Marriage and divorce of immigrantsand descendants of immigrants in Sweden. Demographic Research 33(2): 31–64. doi:10.4054/DemRes.2015.33.2.
Bail, C.A. (2008). The configuration of symbolic boundaries against immigrants inEurope. American Sociological Review 73: 37–59. doi:10.1177/000312240807300103.
Becker, G.S. (1973). A theory of marriage: Part I. The Journal of Political Economy81(4): 813–843. doi:10.1086/260084.
Becker, G.S. (1974). A theory of marriage: Part II. The Journal of Political Economy82(2): 11–26. doi:10.1086/260287.
Behtoui, A. (2010). Marriage pattern of immigrants in Sweden. Journal of ComparativeFamily Studies 41(3): 415–435.
Blau, P.M. (1977). A macrosociological theory of social structure. American Journal ofSociology 83(1): 26–54. doi:10.1086/226505.
Carol, S. (2013). Intermarriage attitudes among minority and majority groups inWestern Europe: The role of attachment to the religious in-group. InternationalMigration 51(3): 67–83. doi:10.1111/imig.12090.
Chiswick, B.R. and Houseworth, C. (2011). Ethnic intermarriage among immigrants:Human capital and assortative mating. Review of Economics of the Household9(2): 149–180. doi:10.1007/s11150-010-9099-9.
Clark-Ibáñez, M. and Felmlee, D. (2004). Interethnic relationships: The role of socialnetwork diversity. Journal of Marriage and Family 66(2): 293–305.doi:10.1111/j.1741-3737.2004.00021.x.
Coleman, D.A. (1994). Trends in fertility and intermarriage among immigrantpopulations in Western-Europe as measure of integration. Journal of BiosocialScience 26(1): 107–136. doi:10.1017/S0021932000021106.
Demographic Research: Volume 39, Article 17
http://www.demographic-research.org 515
Coleman, D.A. and Dubuc, S. (2010). The fertility of ethnic minorities in the UK,1960s–2006. Population Studies 64(1): 19–41. doi:10.1080/00324720903391201.
Cretser, G.A. (1999). Cross-national marriage in Sweden: Immigration and assimilation1971–1993. Journal of Comparative Family Studies 30(3): 363–380.
Dribe, M. and Lundh, C. (2008). Intermarriage and immigrant integration in Sweden:An exploratory analysis. Acta Sociologica 51(4): 329–354. doi:10.1177/0001699308097377.
Dribe, M. and Lundh, C. (2011). Cultural dissimilarity and intermarriage: Alongitudinal study of immigrants in Sweden 1990–2005. International MigrationReview 45(2): 297–324. doi:10.1111/j.1747-7379.2011.00849.x.
Dribe, M. and Lundh, C. (2012). Intermarriage, value context and union dissolution:Sweden 1990–2005. European Journal of Population 28(2): 139–158.doi:10.1007/s10680-011-9253-y.
Feng, Z., Boyle, P., van Ham, M., and Raab, G.M. (2012). Are mixed-ethnic unionsmore likely to dissolve than co-ethnic unions? New evidence from Britain.European Journal of Population 28(2): 159–176. doi:10.1007/s10680-012-9259-0.
Freeman, G.P. (2004). Immigrant incorporation in Western democracies. InternationalMigration Review 38(3): 945–969. doi:10.1111/j.1747-7379.2004.tb00225.x.
Furtado, D. (2012). Human capital and interethnic marriage decisions. EconomicInquiry 50(1): 82–93. doi:10.1111/j.1465-7295.2010.00345.x.
Goldscheider, C. (2007). Out-partnering and integration: Attitudes and behavior ofyoung adults in Sweden. In: Bernhardt, E., Goldscheider, F., Goldscheider, C.,and Bjerén, G. (eds.). Immigration, gender and family transitions to adulthoodin Sweden. Lanham: University Press of America: 73–94.
Goldscheider, F.K., Goldscheider, C., and Bernhardt, E.M. (2011). Creating egalitarianfamilies among the adult children of Turkish- and Polish-origin immigrants inSweden. International Migration Review 45(1): 68–88. doi:10.1111/j.1747-7379.2010.00839.x.
González-Ferrer, A. (2006a). Family and labor strategies in migration: Familyreunification, partner choice and female labor participation in the host country[PhD thesis]. Madrid: Autonomous University of Madrid, Juan March Institute.

Hannemann et al.: Co-ethnic marriage versus intermarriage among immigrants and their descendants
516 http://www.demographic-research.org
González-Ferrer, A. (2006b). Who do immigrants marry? Partner choice among singleimmigrants in Germany. European Sociological Review 22(2): 171–185.doi:10.1093/esr/jci050.
González-Ferrer, A., Obućina, O., Cortina Trilla, C., and Castro-Martín, T. (2016).Mixed marriages among immigrants and natives in Spain. In: Country-specificcase studies on mixed marriages. Stockholm: Stockholm University(FamiliesAndSocieties working paper 57).
Gordon, M. (1964). Assimilation in American life: The role of race, religion, andnational origins. New York: Oxford University Press.
Gullickson, A. (2006). Education and black-white interracial marriage. Demography43(4): 673–689. doi:10.1353/dem.2006.0033.
Hamel, C. and Moisy, M. (2013). Immigrés et descendants d’immigrés face à la santé.Paris: INED (Documents de Travail 190).
Hannemann, T. and Kulu, H. (2015). Union formation and dissolution amongimmigrants and their descendants in the United Kingdom. DemographicResearch 33(1): 273–312. doi:10.4054/DemRes.2015.33.10.
Hannemann, T., Kulu, H., González-Ferrer, A., Pailhé, A., Rahnu, L., and Puur, A.(2014). A comparative study on partnership dynamics among immigrants andtheir descendants. Stockholm: Stockholm University (FamiliesAndSocietiesworking paper 14).
Hărăguș, M. (2016). Dynamics of mixed unions in Transylvania, Romania. In: Country-specific case studies on mixed marriages. Stockholm: Stockholm University(FamiliesAndSocieties working paper 57).
Hervitz, H.M. (1985). Selectivity, adaptation, or disruption? A comparison ofalternative hypotheses on the effects of migration on fertility: The case of Brazil.International Migration Review 19(2): 293–317. doi:10.2307/2545774.
Hiekel, N., Liefbroer, A.C., and Poortman, A.-R. (2014). Understanding diversity in themeaning of cohabitation across Europe. European Journal of Population 30(4):391–410. doi:10.1007/s10680-014-9321-1.
Hoem, J.M. (1987). Statistical analysis of a multiplicative model and its application tothe standardization of vital rates: a review. International Statistical Review55(2): 119–152. doi:10.2307/1403190.

Demographic Research: Volume 39, Article 17
http://www.demographic-research.org 517
Hoem, J.M. (1993). Event-history analysis in demography: Classical demographicmethods of analysis and modern event-history techniques. In: IUSSP (ed.). 22nd
International Population Conference: 281–291.
Hoem, J.M., Keiding, N., Hannu, K., Natvig, B., Barndorff-Nielsen, O., and Hilden, J.(1976). The statistical theory of demographic rates: A review of currentdevelopments. Scandinavian Journal of Statistics 3(4): 169–185.
Huschek, D., de Valk, H.A.G., and Liefbroer, A.C. (2012). Partner choice patternsamong the descendants of Turkish immigrants in Europe. European Journal ofPopulation 28(3): 241–268. doi:10.1007/s10680-012-9265-2.
Jones, F.L. (1996). Convergence and divergence in ethnic divorce patterns: A researchnote. Journal of Marriage and the Family 58(1): 213–218. doi:10.2307/353389.
Kalmijn, M. (1998). Intermarriage and homogamy: Causes, patterns, trends. AnnualReview of Sociology 24: 395–421. doi:10.1146/annurev.soc.24.1.395.
Kalmijn, M., de Graaf, P.M., and Janssen, J.P.G. (2005). Intermarriage and the risk ofdivorce in the Netherlands: The effects of differences in religion and innationality, 1974–94. Population Studies 59(1): 71–85. doi:10.1080/0032472052000332719.
Kalmijn, M. and Van Tubergen, F. (2006). Ethnic intermarriage in the Netherlands:Confirmations and refutations of accepted insights. European Journal ofPopulation 22(4): 371–397. doi:10.1007/s10680-006-9105-3.
Kulu, H. and González-Ferrer, A. (2014). Family dynamics among immigrants and theirdescendants in Europe: Current research and opportunities. European Journal ofPopulation 30(4): 411–435. doi:10.1007/s10680-014-9322-0.
Kulu, H. and Hannemann, T. (2016). Why does fertility remain high among certain UK-born ethnic minority women? Demographic Research 35(49): 1441–1488.doi:10.4054/DemRes.2016.35.49.
Kulu, H. and Hannemann, T. (2018). Mixed marriages among immigrants and theirdescendants in the United Kingdom: Analysis of longitudinal data with missinginformation. Population Studies (forthcoming).
Kulu, H., Hannemann, T., Pailhé, A., Neels, K., Krapf, S., González-Ferrer, A., andAndersson, G. (2017). Fertility by birth order among the descendants ofimmigrants in selected European countries. Population and Development Review43(1): 31–60. doi:10.1111/padr.12037.

Hannemann et al.: Co-ethnic marriage versus intermarriage among immigrants and their descendants
518 http://www.demographic-research.org
Kulu, H. and Milewski, N. (2007). Family change and migration in the life course: Anintroduction. Demographic Research 17(19): 567–590. doi:10.4054/DemRes.2007.17.19.
Lanzieri, G. (2012). Mixed marriages in Europe 1990–2010. In: Kim, D.S. (ed.). Cross-border marriage: Global trends and diversity. Seoul: Korea Institute for Healthand Social Affairs: 81–122.
Lesthaeghe, R. (2010). The unfolding story of the second demographic transition.Population and Development Review 36(2): 211–251. doi:10.1111/j.1728-4457.2010.00328.x.
Lievens, J. (1999). Family-forming migration from Turkey and Morocco to Belgium:The demand for marriage partners from the countries of origin. InternationalMigration Review 33(3): 717–744. doi:10.2307/2547532.
Logan, J.R. and Shin, H.-J. (2012). Assimilation by the third generation? Maritalchoices of white ethnics at the dawn of the twentieth century. Social ScienceResearch 41(5): 1116–1125. doi:10.1016/j.ssresearch.2012.01.010.
Lucassen, L. and Laarman, C. (2009). Immigration, intermarriage and the changing faceof Europe in the post war period. History of the Family 14(1): 52–68.doi:10.1016/j.hisfam.2008.12.001.
Maffioli, D., Paterno, A., and Gabrielli, G. (2014). International married and unmarriedunions in Italy: Criteria of mate selection. International Migration 52(3): 160–176. doi:10.1111/imig.12049.
Meng, X. and Gregory, R.G. (2005). Intermarriage and the economic assimilation ofimmigrants. Journal of Labor Economics 23(1): 135–175. doi:10.1086/425436.
Merton, R.K. (1941). Intermarriage and the social structure: Fact and theory. Psychiatry4(3): 371–374. doi:10.1080/00332747.1941.11022354.
Milewski, N. (2010). Immigrant fertility in West Germany: Is there a socializationeffect in transitions to second and third births? European Journal of Population26(3): 297–323. doi:10.1007/s10680-010-9211-0.
Milewski, N. and Hamel, C. (2010). Union formation and partner choice in atransnational context: The case of descendants of Turkish immigrants in France.International Migration Review 44(3): 615–658. doi:10.1111/j.1747-7379.2010.00820.x.

Demographic Research: Volume 39, Article 17
http://www.demographic-research.org 519
Milewski, N. and Kulu, H. (2014). Mixed marriages in Germany: A high risk of divorcefor immigrant-native couples. European Journal of Population 30(1): 89–113.doi:10.1007/s10680-013-9298-1.
Miner, D.C. (2003). Jamaican families. Holistic Nursing Practice 17(1): 27–35.doi:10.1097/00004650-200301000-00007.
Monden, C. and Smits, J. (2005). Ethnic intermarriage in times of social change: Thecase of Latvia. Demography 42(2): 323–345. doi:10.1353/dem.2005.0015.
Niedomysl, T., Osth, J., and van Ham, M. (2010). The globalisation of marriage fields:The Swedish case. Journal of Ethnic and Migration Studies 36(7): 1119–1138.doi:10.1080/13691830903488184.
Nikiforov, S.V. and Mamaev, V.B. (1998). The development of sex differences incardiovascular disease mortality: A historical perspective. American Journal ofPublic Health 88(9): 1348–1353. doi:10.2105/AJPH.88.9.1348.
Pailhé, A. (2015). Partnership dynamics across generations of immigration in France:Structural vs. cultural factors. Demographic Research 33(16): 451–498.doi:10.4054/DemRes.2015.33.16.
Potârcă, G. and Bernardi, L. (2018). Mixed marriages in Switzerland: A test of thesegmented assimilation hypothesis. Demographic Research 38(48): 1457–1494.doi:10.4054/DemRes.2018.38.48.
Preston, D.L. (2005). Poisson regression in epidemiology. In: Armitage, P. and Colton,T. (eds.). Encyclopedia of biostatistics. New York: Wiley: 4124–4127.doi:10.1002/0470011815.b2a03094.
Puur, A., Rahnu, L., Maslauskaite, A., Stankuniene, V., and Zakharov, S. (2012).Transformation of partnership formation in Eastern Europe: The legacy of thepast demographic divide. Journal of Comparative Family Studies 43(3): 389–418.
Puur, A., Rahnu, L., Sakkeus, L., Klesment, M., and Abuladze, L. (2018). Theformation of ethnically mixed partnerships in estonia: A stalling trend from atwo-sides perspective. Demographic Research 38(38): 1111–1154. doi:10.4054/DemRes.2018.38.38.
Qian, Z. and Lichter, D.T. (2007). Social boundaries and marital assimilation:Interpreting trends in racial and ethnic intermarriage. American SociologicalReview 72(1): 68–94. doi:10.1177/000312240707200104.

Hannemann et al.: Co-ethnic marriage versus intermarriage among immigrants and their descendants
520 http://www.demographic-research.org
Rahnu, L., Puur, A., Sakkeus, L., and Klesment, M. (2015). Partnership dynamicsamong migrants and their descendants in Estonia. Demographic Research32(56): 1519–1566. doi:10.4054/DemRes.2015.32.56.
Rosenfeld, M.J. (2010). Still weak support for status exchange theory. AmericanJournal of Sociology 115(4): 1264–1276. doi:10.1086/649051.
Safi, M. (2010). Patterns of immigrant intermarriage in France: Intergenerationalmarital assimilation? Zeitschrift für Familienforschung 22(1): 89–108.
Song, M. (2009). Is intermarriage a good indicator of integration? Journal of Ethnicand Migration Studies 35(2): 331–348. doi:10.1080/13691830802586476.
Tamás, K. and Ilka, V. (2010). Minorităţi din România: dinamici demografice şiidentitare [Romanian minorities: Demographic and identity dilemmas]. Cluj-Napoca: Institutul pentru Studierea Problemelor Minorităților Naționale(Working Papers in Romanian Minority Studies 30).
Toulemon, L. (2004). Fertility among immigrant women: New data, new approach.Population and Societies 400: 1–4.
University of Essex, Institute for Social and Economic Research, and NatCen SocialResearch (2014). Understanding society: Waves 1–4, 2009–2013 [datacollection]. Colchester: UK Data Service. doi:10.5255/UKDA-SN-6614-6.
Van Niekerk, M. (2007). Second-generation Caribbeans in the Netherlands: Differentmigration histories, diverging trajectories. Journal of Ethnic and MigrationStudies 33(7): 1063–1081. doi:10.1080/13691830701541580.
Van Tubergen, F. and Maas, I. (2007). Ethnic intermarriage among immigrants in theNetherlands: An analysis of population data. Social Science Research 36(3):1065–1086. doi:10.1016/j.ssresearch.2006.09.003.
Zimmermann, K.F. (2005). European migration: What do we know? Oxford: OxfordUniversity Press.

Demographic Research: Volume 39, Article 17
http://www.demographic-research.org 521
Appendix
Table A-1: Simultaneous modelling of endogamous and exogamous firstmarriage risks among immigrants and their descendants, stratifiedby sex
x
Cat
egor
y
Wom
enM
en
endo
gam
ous
exog
amou
sen
doga
mou
sex
ogam
ous
RR
Sign
.95
%C
onf.
Int.
RR
Sign
.95
%C
onf.
Int.
RR
Sign
.95
%C
onf.
Int.
RR
Sign
.95
%C
onf.
Int.
Age
grou
p15
–19
0.40
***
0.38
–0.
420.
08**
*0.
07–
0.09
20–2
41.
000.
95–
1.04
0.62
***
0.59
–0.
6525
–29
11
30–3
40.
68**
*0.
63–
0.73
0.88
***
0.82
–0.
9435
+0.
39**
*0.
36–
0.43
0.55
***
0.50
–0.
61B
irth
coho
rt19
50–1
959
1.10
***
1.05
–1.
151.
19**
*1.
12–
1.26
1960
–196
91
119
70–1
979
1.00
0.96
–1.
050.
88**
*0.
83–
0.93
1980
–198
90.
83**
*0.
78–
0.88
0.59
***
0.54
–0.
65C
ount
ryan
dm
igra
ntgr
oup
Uni
ted
King
dom
1GE
urop
ean
dW
est
0.41
***
0.30
–0.
560.
950.
73–
1.24
0.58
**0.
41–
0.84
0.91
0.65
–1.
272G
Eur
ope
and
Wes
t0.
08**
*0.
05–
0.13
0.94
0.73
–1.
230.
10**
*0.
06–
0.18
1.16
0.86
–1.
571G
Indi
a2.
70**
*2.
09–
3.49
0.56
***
0.39
–0.
802.
68**
*1.
99–
3.61
0.33
***
0.21
–0.
522G
Indi
a1
0.65
*0.
46–
0.93
10.
810.
55–
1.21
1GP
akis
tan
and
Ban
glad
esh
4.40
***
3.46
–5.
600.
31**
*0.
20–
0.47
3.33
***
2.51
–4.
420.
22**
*0.
14–
0.35
2GP
akis
tan
and
Ban
glad
esh
2.07
***
1.55
–2.
750.
25**
*0.
14–
0.43
2.55
***
1.80
–3.
620.
46*
0.26
–0.
84
1GC
arib
bean
0.31
***
0.20
–0.
470.
18**
*0.
11–
0.31
0.47
**0.
29–
0.75
0.11
***
0.05
–0.
252G
Car
ibbe
an0.
19**
*0.
12–
0.28
0.15
***
0.10
–0.
240.
27**
*0.
17–
0.43
0.24
***
0.15
–0.
39Fr
ance 1G
Mag
hreb
2.16
***
1.71
–2.
730.
41**
*0.
31–
0.54
1.74
***
1.31
–2.
300.
65**
0.48
–0.
882G
Mag
hreb
0.94
0.74
–1.
200.
57**
*0.
44–
0.74
0.66
**0.
49–
0.91
0.66
**0.
48–
0.90
1GS
ub-S
ahar
anA
frica
1.21
0.93
–1.
580.
66**
0.49
–0.
891.
030.
76–
1.40
0.61
**0.
44–
0.85
2GS
ub-S
ahar
anA
frica
0.16
***
0.08
–0.
320.
720.
49–
1.05
0.19
***
0.08
–0.
440.
850.
53–
1.34
1GTu
rkey
4.52
***
3.52
–5.
790.
19**
*0.
10–
0.34
4.94
***
3.70
–6.
590.
56**
0.37
–0.
842G
Turk
ey2.
66**
*1.
97–
3.60
0.31
***
0.17
–0.
592.
95**
*2.
02–
4.30
0.65
0.35
–1.
221G
Sou
ther
nE
urop
e1.
30*
1.01
–1.
671.
120.
87–
1.45
1.32
0.98
–1.
771.
160.
86–
1.57
2GS
outh
ern
Eur
ope
0.23
***
0.17
–0.
311.
070.
84–
1.36
0.25
***
0.18
–0.
351.
060.
79–
1.40
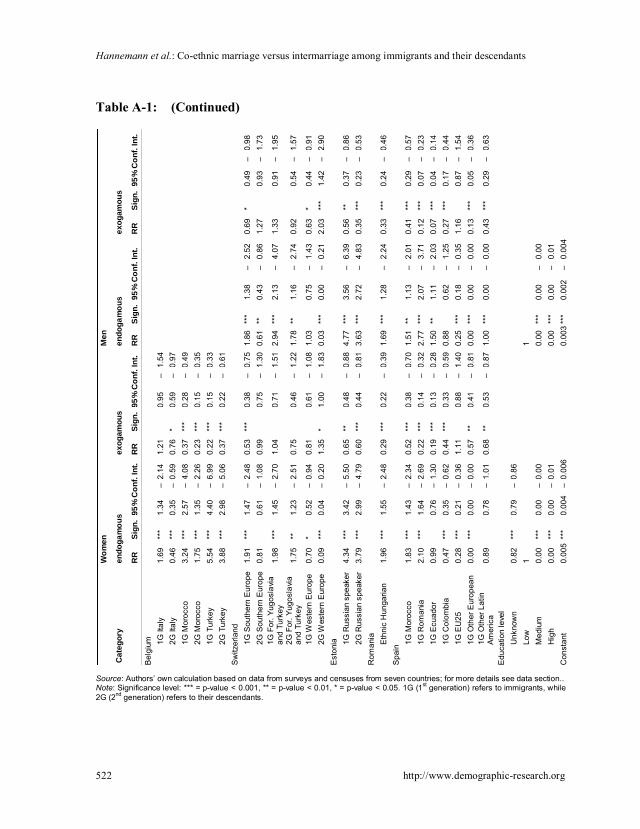
Hannemann et al.: Co-ethnic marriage versus intermarriage among immigrants and their descendants
522 http://www.demographic-research.org
Table A-1: (Continued)
Source: Authors’ own calculation based on data from surveys and censuses from seven countries; for more details see data section..Note: Significance level: *** = p-value < 0.001, ** = p-value < 0.01, * = p-value < 0.05. 1G (1st generation) refers to immigrants, while2G (2nd generation) refers to their descendants.
Cat
egor
y
Wom
enM
en
endo
gam
ous
exog
amou
sen
doga
mou
sex
ogam
ous
RR
Sign
.95
%C
onf.
Int.
RR
Sign
.95
%C
onf.
Int.
RR
Sign
.95
%C
onf.
Int.
RR
Sign
.95
%C
onf.
Int.
Bel
gium 1G
Italy
1.69
***
1.34
–2.
141.
210.
95–
1.54
2GIta
ly0.
46**
*0.
35–
0.59
0.76
*0.
59–
0.97
1GM
oroc
co3.
24**
*2.
57–
4.08
0.37
***
0.28
–0.
492G
Mor
occo
1.75
***
1.35
–2.
260.
23**
*0.
15–
0.35
1GTu
rkey
5.54
***
4.40
–6.
990.
22**
*0.
15–
0.33
2GTu
rkey
3.88
***
2.98
–5.
060.
37**
*0.
22–
0.61
Sw
itzer
land
1GS
outh
ern
Eur
ope
1.91
***
1.47
–2.
480.
53**
*0.
38–
0.75
1.86
***
1.38
–2.
520.
69*
0.49
–0.
982G
Sou
ther
nE
urop
e0.
810.
61–
1.08
0.99
0.75
–1.
300.
61**
0.43
–0.
861.
270.
93–
1.73
1GFo
r.Yu
gosl
avia
and
Turk
ey1.
98**
*1.
45–
2.70
1.04
0.71
–1.
512.
94**
*2.
13–
4.07
1.33
0.91
–1.
95
2GFo
r.Yu
gosl
avia
and
Turk
ey1.
75**
1.23
–2.
510.
750.
46–
1.22
1.78
**1.
16–
2.74
0.92
0.54
–1.
57
1GW
este
rnE
urop
e0.
70*
0.52
–0.
940.
810.
61–
1.08
1.03
0.75
–1.
430.
63*
0.44
–0.
912G
Wes
tern
Eur
ope
0.09
***
0.04
–0.
201.
35*
1.00
–1.
830.
03**
*0.
00–
0.21
2.03
***
1.42
–2.
90E
ston
ia 1GR
ussi
ansp
eake
r4.
34**
*3.
42–
5.50
0.65
**0.
48–
0.88
4.77
***
3.56
–6.
390.
56**
0.37
–0.
862G
Rus
sian
spea
ker
3.79
***
2.99
–4.
790.
60**
*0.
44–
0.81
3.63
***
2.72
–4.
830.
35**
*0.
23–
0.53
Rom
ania
Eth
nic
Hun
garia
n1.
96**
*1.
55–
2.48
0.29
***
0.22
–0.
391.
69**
*1.
28–
2.24
0.33
***
0.24
–0.
46S
pain
1GM
oroc
co1.
83**
*1.
43–
2.34
0.52
***
0.38
–0.
701.
51**
1.13
–2.
010.
41**
*0.
29–
0.57
1GR
oman
ia2.
10**
*1.
64–
2.69
0.22
***
0.14
–0.
322.
77**
*2.
07–
3.71
0.12
***
0.07
–0.
231G
Ecu
ador
0.99
0.76
–1.
300.
19**
*0.
13–
0.28
1.50
**1.
11–
2.03
0.07
***
0.04
–0.
141G
Col
ombi
a0.
47**
*0.
35–
0.62
0.44
***
0.33
–0.
590.
880.
62–
1.25
0.27
***
0.17
–0.
441G
EU
250.
28**
*0.
21–
0.36
1.11
0.88
–1.
400.
25**
*0.
18–
0.35
1.16
0.87
–1.
541G
Oth
erE
urop
ean
0.00
***
0.00
–0.
000.
57**
0.41
–0.
810.
00**
*0.
00–
0.00
0.13
***
0.05
–0.
361G
Oth
erLa
tinAm
eric
a0.
890.
78–
1.01
0.68
**0.
53–
0.87
1.00
***
0.00
–0.
000.
43**
*0.
29–
0.63
Edu
catio
nle
vel
Unk
now
n0.
82**
*0.
79–
0.86
Low
11
Med
ium
0.00
***
0.00
–0.
000.
00**
*0.
00–
0.00
Hig
h0.
00**
*0.
00–
0.01
0.00
***
0.00
–0.
01C
onst
ant
0.00
5**
*0.
004
–0.
006
0.00
3**
*0.
002
–0.
004

Demographic Research: Volume 39, Article 17
http://www.demographic-research.org 523
Table A-2: Sensitivity analysis. Unadjusted marriage rates for all and only post-migration marriages among immigrants and their descendants,stratified by sex
Women Men
Unadjusted rates All marriages Post-migrationmarriages All marriages Post-migration
marriagesEndo-gamous
Exo-gamous
Relativerates
Endo-gamous
Exo-gamous
Relativerates
Endo-gamous
Exo-gamous
Relativerates
Endo-gamous
Exo-gamous
Relativerates
United Kingdom1G Europe and West 1.0 2.2 0.4 0.4 2.0 0.2 1.0 1.6 0.6 0.3 1.5 0.22G Europe and West 0.2 2.4 0.1 0.2 2.4 0.1 0.2 2.4 0.1 0.2 2.4 0.11G India 6.1 1.3 4.9 3.7 1.3 2.9 4.0 0.5 8.1 2.7 0.6 4.92G India 2.3 1.5 1.5 2.3 1.5 1.5 1.6 1.3 1.2 1.6 1.3 1.21G Pakistan andBangladesh 10.2 0.7 14.3 7.2 0.5 15.1 5.2 0.3 15.0 4.1 0.3 14.5
2G Pakistan andBangladesh 4.4 0.5 8.4 4.4 0.5 8.4 3.1 0.6 5.5 3.1 0.6 5.5
1G Caribbean 0.9 0.5 1.7 0.7 0.4 1.6 1.2 0.3 4.3 0.9 0.2 3.62G Caribbean 0.5 0.4 1.2 0.5 0.4 1.2 0.6 0.5 1.1 0.6 0.5 1.1
France1G Maghreb 5.9 1.1 5.3 3.9 1.2 3.2 3.5 1.3 2.7 2.9 1.4 2.12G Maghreb 2.3 1.4 1.7 2.3 1.4 1.7 1.1 1.1 1.0 1.1 1.1 1.01G Sub-SaharanAfrica 3.3 1.8 1.8 2.2 1.9 1.2 2.3 1.4 1.7 2.0 1.4 1.4
2G Sub-SaharanAfrica 0.3 1.4 0.2 0.3 1.4 0.2 0.2 0.9 0.2 0.2 0.9 0.2
1G Turkey 11.2 0.5 23.9 8.7 0.5 18.1 7.0 0.8 8.9 5.9 0.9 6.62G Turkey 5.4 0.6 8.5 5.4 0.6 8.5 2.9 0.6 4.5 2.9 0.6 4.51G Southern Europe 3.6 3.1 1.2 2.8 3.3 0.9 2.7 2.4 1.1 2.4 2.5 1.02G Southern Europe 0.6 2.7 0.2 0.6 2.7 0.2 0.5 2.0 0.2 0.5 2.0 0.2
Belgium1G Italy 4.3 3.1 1.4 5.4 4.5 1.22G Italy 1.0 1.7 0.6 1.0 1.7 0.61G Morocco 8.6 1.0 8.8 8.7 1.3 6.72G Morocco 3.6 0.5 7.7 3.6 0.5 7.71G Turkey 13.5 0.5 25.1 14.5 0.7 22.32G Turkey 7.2 0.7 10.6 7.2 0.7 10.6
Switzerland1G Southern Europe 5.0 1.4 3.6 3.6 1.6 2.3 3.7 1.2 3.0 2.8 1.4 2.12G Southern Europe 2.0 2.5 0.8 2.0 2.5 0.8 1.2 2.2 0.5 1.1 2.3 0.51G For. Yugoslaviaand Turkey 4.6 2.4 1.9 3.1 2.4 1.3 5.4 1.5 3.5 4.0 2.1 1.9
2G For. Yugoslaviaand Turkey 3.9 1.7 2.3 3.9 1.7 2.3 2.6 0.7 3.8 2.2 1.1 1.9
1G Western Europe 1.6 1.8 0.9 0.6 1.9 0.3 2.0 1.1 1.8 0.8 1.2 0.62G Western Europe 0.2 3.1 0.1 0.2 3.1 0.1 0.2 3.5 0.1 0.1 3.7 0.0
Estonia1G Russian speaker 8.9 1.3 6.7 9.9 1.8 5.4 7.0 0.8 8.5 8.2 1.2 6.82G Russian speaker 7.6 1.2 6.3 7.6 1.2 6.3 5.1 0.5 10.5 5.1 0.5 10.5
RomaniaEthnic Hungarian 5.0 0.8 6.7 3.0 0.6 5.1
Spain1G Morocco 5.1 1.4 3.5 2.2 1.9 1.2 3.0 0.8 3.7 2.3 0.9 2.51G Romania 5.1 0.5 9.7 1.7 0.8 2.2 4.1 0.2 22.4 1.4 0.3 5.31G Ecuador 2.5 0.5 5.2 0.7 0.5 1.4 2.6 0.1 21.0 0.8 0.1 7.71G Colombia 1.2 1.1 1.1 0.5 1.2 0.4 1.7 0.5 3.3 0.7 0.5 1.41G EU25 0.7 2.8 0.3 0.3 2.8 0.1 0.5 2.3 0.2 0.2 2.3 0.1
Source: Authors’ own calculation based on data from surveys and censuses from seven countries; for more details see data section.Note: 1G (1st generation) refers to immigrants, while 2G (2nd generation) refers to their descendants.

Hannemann et al.: Co-ethnic marriage versus intermarriage among immigrants and their descendants
524 http://www.demographic-research.org