Embed Size (px)
Citation preview

Draft 2019 TIP June 18, 2018
APPENDIX A – 4
2 0 1 9 T I P P e r f o r m a n c e A n a l y s i s

Federal Performance Report
Assessment of Draft 2019 TIP Investments In Addressing Federally-Mandated Performance Measures

Draft 2019 TIP Federal Performance Report Page 1 June 18, 2018
INTRODUCTION Performance-Based Planning and Programming The Moving Ahead for Progress in the 21st Century Act (2012), also known as MAP-21, established several performance management requirements for state departments of transportation (DOTs), metropolitan planning organizations (MPOs), and transit agencies. A performance-based approach to transportation planning and programming intends to ensure the most efficient investment of transportation funds, support improved investment decision-making, and increase accountability and transparency. MAP-21 and subsequent federal legislation require DOTs, MPOs, and transit agencies to establish performance targets for each of the following national goal areas:
• Safety • Infrastructure Condition • System Reliability
• Freight Movement and Economic Vitality
• Congestion Reduction
• Environmental Sustainability
MTC’s Role Under the federal performance management rules, MTC is responsible for setting short-range targets and incorporating the targets into its planning processes – most notably, the Transportation Improvement Program (TIP) and the Regional Transportation Plan (RTP). Additional information on the timelines and cycles for target-setting is provided in Appendix 1.
• TIP Requirements There are two primary requirements for incorporating performance management into the TIP. For all federally-required targets, MTC must show that the TIP “makes progress towards achieving the performance targets” and that the TIP includes, “to the maximum extent practicable, a description of the anticipated effect of the TIP towards achieving the performance targets” (23 CFR§ 450.326). MTC must show that it is moving in the right direction based on the package of investments included in the TIP, and must also describe how much of an effect the TIP investments are expected to have on the targets.
Federal Performance Report: This report reflects all of the federally-required performance
targets and seeks to quantify impacts to the greatest extent practicable, while at the same time focusing on consistency and accuracy across projects.
2019 TIP: The Bay Area’s 2019 TIP covers the four-year period of FY 2018-19 through FY 2021-22 and includes more than 500 transportation projects with $13 billion in committed funding during the four-year period. For the 2019 TIP, MTC collected self-reported data from project sponsors to complete the performance analysis.
Draft 2019 TIP Federal Performance Report Page 2 June 18, 2018
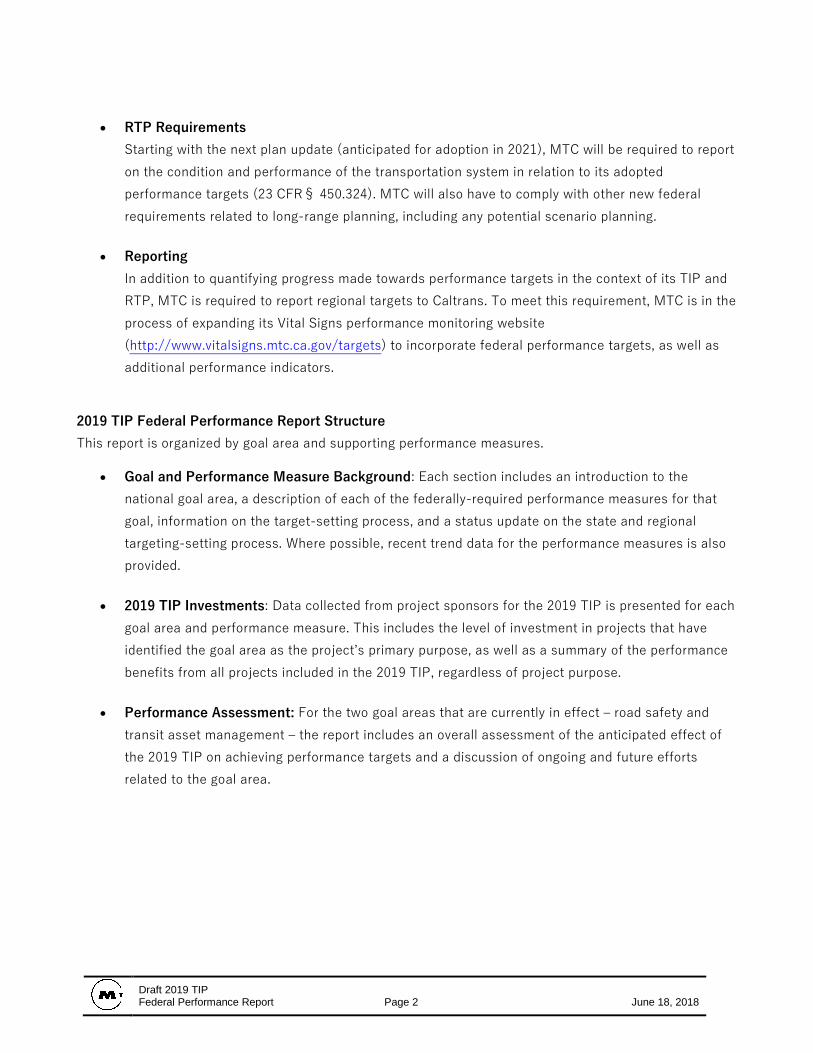
• RTP Requirements Starting with the next plan update (anticipated for adoption in 2021), MTC will be required to report on the condition and performance of the transportation system in relation to its adopted performance targets (23 CFR§ 450.324). MTC will also have to comply with other new federal requirements related to long-range planning, including any potential scenario planning.
• Reporting In addition to quantifying progress made towards performance targets in the context of its TIP and RTP, MTC is required to report regional targets to Caltrans. To meet this requirement, MTC is in the process of expanding its Vital Signs performance monitoring website (http://www.vitalsigns.mtc.ca.gov/targets) to incorporate federal performance targets, as well as additional performance indicators.
2019 TIP Federal Performance Report Structure This report is organized by goal area and supporting performance measures.
• Goal and Performance Measure Background: Each section includes an introduction to the national goal area, a description of each of the federally-required performance measures for that goal, information on the target-setting process, and a status update on the state and regional targeting-setting process. Where possible, recent trend data for the performance measures is also provided.
• 2019 TIP Investments: Data collected from project sponsors for the 2019 TIP is presented for each goal area and performance measure. This includes the level of investment in projects that have identified the goal area as the project’s primary purpose, as well as a summary of the performance benefits from all projects included in the 2019 TIP, regardless of project purpose.
• Performance Assessment: For the two goal areas that are currently in effect – road safety and transit asset management – the report includes an overall assessment of the anticipated effect of the 2019 TIP on achieving performance targets and a discussion of ongoing and future efforts related to the goal area.

Draft 2019 TIP Federal Performance Report Page 3 June 18, 2018
SAFETY Federal performance management regulations identify two distinct areas of transportation safety – road safety from traffic collisions (including collisions involving bicyclists and pedestrians), and transit safety resulting from collisions, other safety events, or major mechanical failures. The overall goal of the transportation safety performance area is to make the nation’s transportation systems safer for all users.
Road Safety Goal: Significantly reduce traffic fatalities and serious injuries on all public roads.
Performance Measures Five performance measures were established to identify trends and assess progress towards reducing traffic-related fatalities and serious injuries on public roads.
Goal Area Road Safety
Performance Measures
• Number of fatalities • Rate of fatalities per 100 million vehicle miles traveled • Number of serious injuries • Rate of serious injuries per 100 million vehicle miles traveled • Number of non-motorized fatalities and non-motorized serious injuries
For all measures: 5-year rolling average; all public roads
Performance Targets State DOTs are required to set numerical targets each year for each safety measure to comply with the regulation. MPOs have the option of supporting State targets or setting their own region-specific numerical targets on a target-by-target basis.
Caltrans established ambitious statewide targets for 2018 to align with the State’s Towards Zero Deaths goal for zero traffic fatalities by 2030 and the State Highway Safety Plan. For the region’s 2018 targets, MTC chose to support the State’s Towards Zero Deaths by 2030 safety targets through ongoing planning and programming. The targets for each measure are detailed in the table below, followed by Bay Area regional trend charts for each performance measure.
Caltrans will set the 2019 statewide safety targets in July and August of 2018, with MTC’s regional safety targets set to be adopted by early 2019.
Performance Measure 2018 Targets
Caltrans MTC Fatalities – total 3,590.8 -7.69% reduction Support State Target Fatalities – per 100 million VMT 1.029 -7.69% reduction Support State Target Serious Injuries – total 12,823.4 -1.5% reduction Support State Target Serious Injuries – per 100 million VMT 3.831 -1.5% reduction Support State Target Non-motorized fatalities + serious injuries – total 4,271.1 -10% reduction Support State Target

Draft 2019 TIP Federal Performance Report Page 4 June 18, 2018
Bay Area Road Safety Trends Number of Fatalities
Fatalities per 100 million VMT
Number of Serious Injuries
Serious Injuries per 100 million VMT
Number of Non-Motorized Fatalities and Serious Injuries
Source: http://www.vitalsigns.mtc.ca.gov/targets

Draft 2019 TIP Federal Performance Report Page 5 June 18, 2018
2019 TIP Investments In the 2019 TIP, $1.1 billion in federal, state, regional and local funds are directed to projects that have a primary purpose of improving roadway safety for all users (Table 1). Funding for safety-focused projects account for 8% of the 2019 TIP, and nearly a quarter of all projects in 2019 TIP have a primary purpose of improving road safety.
Table 1 2019 TIP Projects with Primary Purpose to Improve Road Safety $ in millions
Safety
Investments % of 2019 TIP Investments
Safety Projects
% of 2019 TIP Projects
Alameda $75 1% 22 4% Contra Costa $153 1% 25 4% Marin $16 <1% 9 2% Napa $9 <1% 6 1% San Francisco $53 <1% 7 1% San Mateo $19 <1% 21 4% Santa Clara $69 1% 18 3% Solano $18 <1% 10 2% Sonoma $10 <1% 4 1% Multiple Counties $696 5% 3 1% $1,118 8% 125 22% Note: Project purpose data provided by project sponsors through the draft 2019 TIP.
This significant investment in road safety projects includes $470 million from three key state-funded safety programs: State Highway Operation and Protection Program (SHOPP) – Collision Reduction Program, Safety Improvements (SHOPP) – Mandates, and State Highway Safety Improvement Program (HSIP). In addition to the state safety investments directed to projects throughout the region, a sampling of other significant road safety investments in the 2019 TIP include:
• $142 million for US 101/Zanker Rd and Skyport Dr/N Fourth St Interchange Improvements in Santa Clara County
• $120 million for US 101 Marin Sonoma Narrows – HOV Lanes in Marin County • $56 million for I-880/Whipple Rd, Industrial Pkwy SW Interchange Improvements in Alameda
County • $32 million to Reconfigure the I-80/Gilman Interchange in Alameda County • $22 million for Safety Improvements on McKee Rd and Tully Rd in Santa Clara County • $20 million to Reconstruct I-80/San Pablo Dam Rd Interchange in Contra Costa County • $19 million for San Francisco’s Better Market Street • $12 million for the California Boulevard Roundabouts in Napa County
Transportation projects that are primarily focused on other non-safety objectives, such as congestion reduction or operational improvements, can often contribute to a safer roadway environment. Table 2
$1.1 billion
Draft 2019 TIP Federal Performance Report Page 6 June 18, 2018
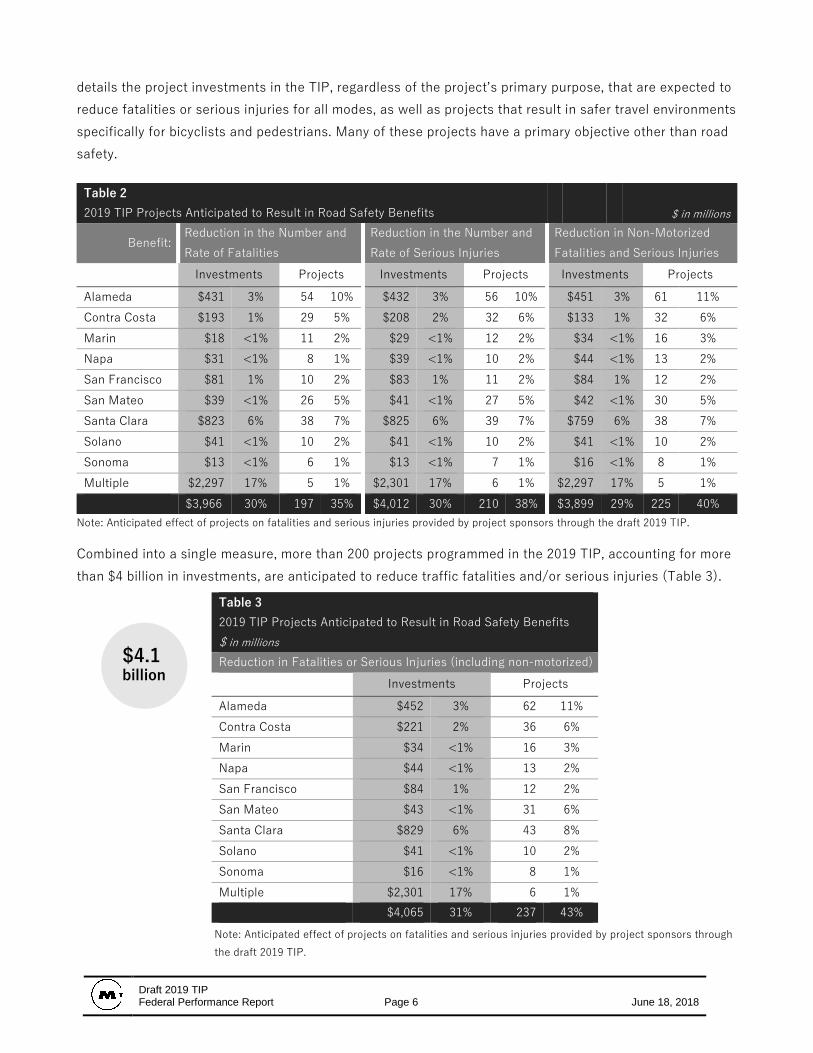
details the project investments in the TIP, regardless of the project’s primary purpose, that are expected to reduce fatalities or serious injuries for all modes, as well as projects that result in safer travel environments specifically for bicyclists and pedestrians. Many of these projects have a primary objective other than road safety.
Table 2 2019 TIP Projects Anticipated to Result in Road Safety Benefits
$ in millions
Benefit: Reduction in the Number and Rate of Fatalities
Reduction in the Number and Rate of Serious Injuries
Reduction in Non-Motorized Fatalities and Serious Injuries
Investments Projects Investments Projects Investments Projects Alameda $431 3% 54 10% $432 3% 56 10% $451 3% 61 11% Contra Costa $193 1% 29 5% $208 2% 32 6% $133 1% 32 6% Marin $18 <1% 11 2% $29 <1% 12 2% $34 <1% 16 3% Napa $31 <1% 8 1% $39 <1% 10 2% $44 <1% 13 2% San Francisco $81 1% 10 2% $83 1% 11 2% $84 1% 12 2% San Mateo $39 <1% 26 5% $41 <1% 27 5% $42 <1% 30 5% Santa Clara $823 6% 38 7% $825 6% 39 7% $759 6% 38 7% Solano $41 <1% 10 2% $41 <1% 10 2% $41 <1% 10 2% Sonoma $13 <1% 6 1% $13 <1% 7 1% $16 <1% 8 1% Multiple $2,297 17% 5 1% $2,301 17% 6 1% $2,297 17% 5 1% $3,966 30% 197 35% $4,012 30% 210 38% $3,899 29% 225 40%
Note: Anticipated effect of projects on fatalities and serious injuries provided by project sponsors through the draft 2019 TIP.
Combined into a single measure, more than 200 projects programmed in the 2019 TIP, accounting for more than $4 billion in investments, are anticipated to reduce traffic fatalities and/or serious injuries (Table 3).
Note: Anticipated effect of projects on fatalities and serious injuries provided by project sponsors through the draft 2019 TIP.
Table 3 2019 TIP Projects Anticipated to Result in Road Safety Benefits $ in millions Reduction in Fatalities or Serious Injuries (including non-motorized) Investments Projects Alameda $452 3% 62 11% Contra Costa $221 2% 36 6% Marin $34 <1% 16 3% Napa $44 <1% 13 2% San Francisco $84 1% 12 2% San Mateo $43 <1% 31 6% Santa Clara $829 6% 43 8% Solano $41 <1% 10 2% Sonoma $16 <1% 8 1% Multiple $2,301 17% 6 1% $4,065 31% 237 43%
$4.1 billion
Draft 2019 TIP Federal Performance Report Page 7 June 18, 2018
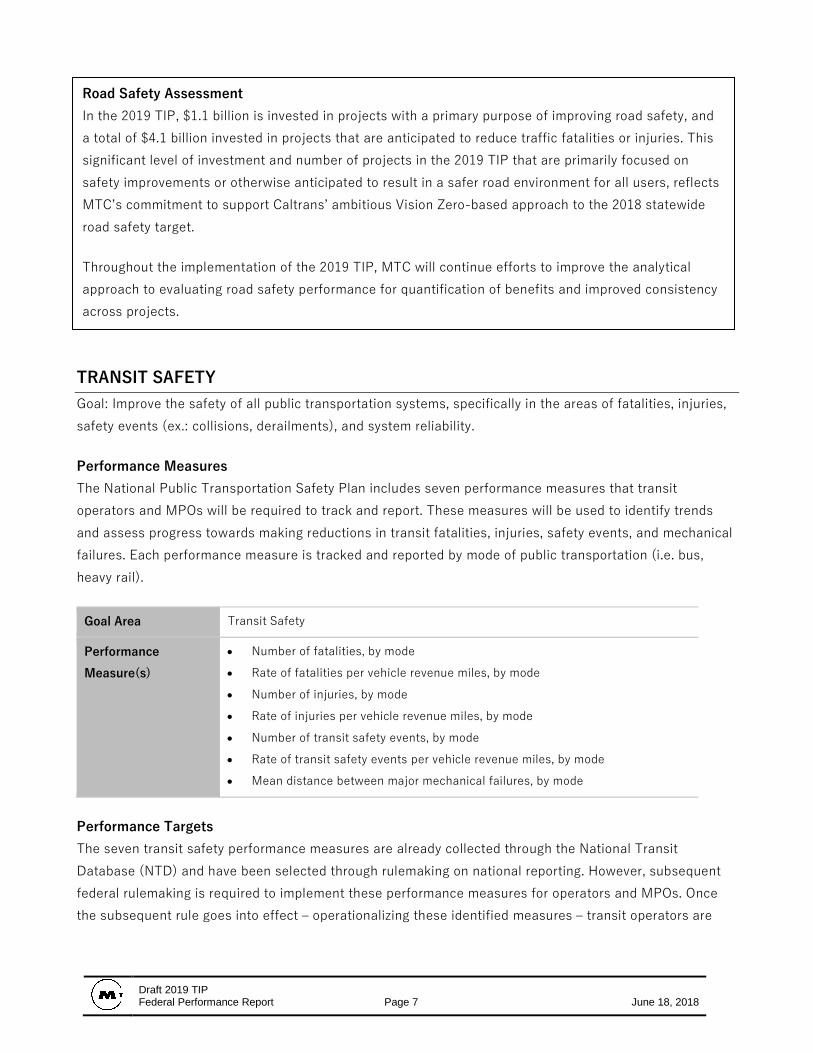
TRANSIT SAFETY Goal: Improve the safety of all public transportation systems, specifically in the areas of fatalities, injuries, safety events (ex.: collisions, derailments), and system reliability.
Performance Measures The National Public Transportation Safety Plan includes seven performance measures that transit operators and MPOs will be required to track and report. These measures will be used to identify trends and assess progress towards making reductions in transit fatalities, injuries, safety events, and mechanical failures. Each performance measure is tracked and reported by mode of public transportation (i.e. bus, heavy rail).
Goal Area Transit Safety
Performance Measure(s)
• Number of fatalities, by mode • Rate of fatalities per vehicle revenue miles, by mode • Number of injuries, by mode • Rate of injuries per vehicle revenue miles, by mode • Number of transit safety events, by mode • Rate of transit safety events per vehicle revenue miles, by mode • Mean distance between major mechanical failures, by mode
Performance Targets The seven transit safety performance measures are already collected through the National Transit Database (NTD) and have been selected through rulemaking on national reporting. However, subsequent federal rulemaking is required to implement these performance measures for operators and MPOs. Once the subsequent rule goes into effect – operationalizing these identified measures – transit operators are
Road Safety Assessment In the 2019 TIP, $1.1 billion is invested in projects with a primary purpose of improving road safety, and a total of $4.1 billion invested in projects that are anticipated to reduce traffic fatalities or injuries. This significant level of investment and number of projects in the 2019 TIP that are primarily focused on safety improvements or otherwise anticipated to result in a safer road environment for all users, reflects MTC’s commitment to support Caltrans’ ambitious Vision Zero-based approach to the 2018 statewide road safety target.
Throughout the implementation of the 2019 TIP, MTC will continue efforts to improve the analytical approach to evaluating road safety performance for quantification of benefits and improved consistency across projects.
Draft 2019 TIP Federal Performance Report Page 8 June 18, 2018
expected to have three months to set targets, and MPOs are expected to have six more months to set regional targets.
Performance Measures MTC Regional Targets Fatalities – total, by mode
Pending
Fatalities – rate per vehicle revenue miles, by mode Injuries – total, by mode Injuries – rate per vehicle revenue miles, by mode Transit safety events – total, by mode Transit safety events – rate per vehicle revenue miles, by mode Major mechanical failures – mean distance between, by mode
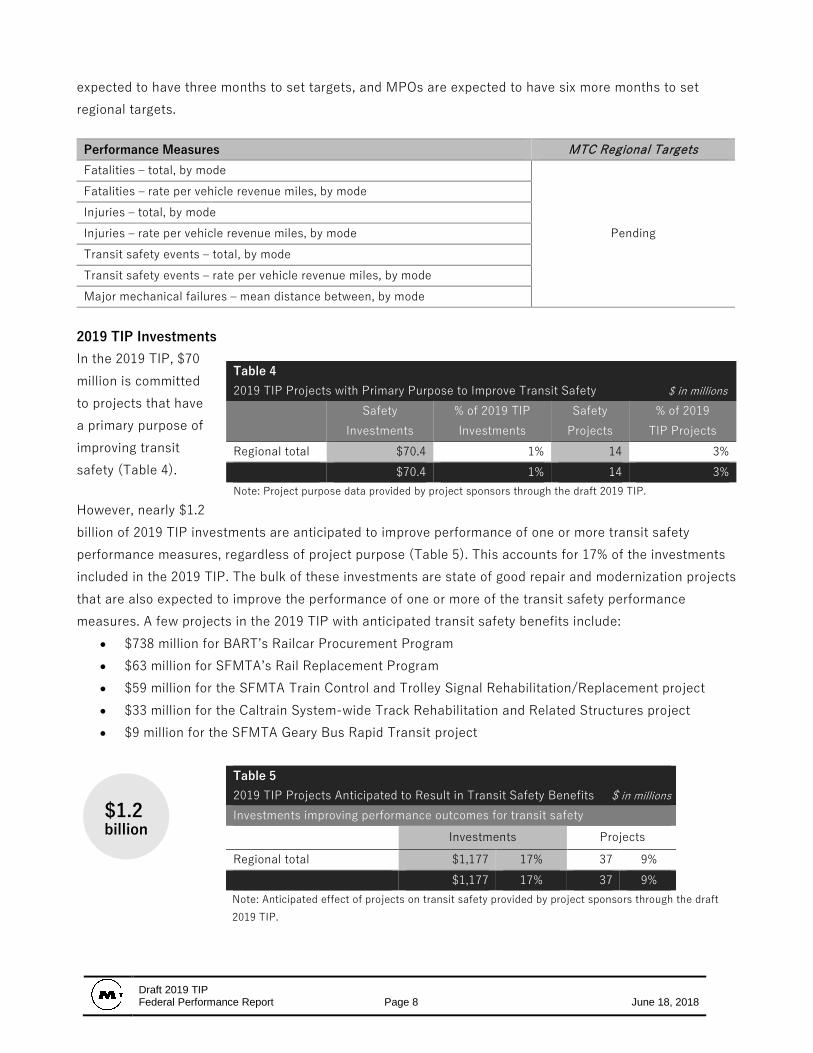
2019 TIP Investments In the 2019 TIP, $70 million is committed to projects that have a primary purpose of improving transit safety (Table 4).
However, nearly $1.2 billion of 2019 TIP investments are anticipated to improve performance of one or more transit safety performance measures, regardless of project purpose (Table 5). This accounts for 17% of the investments included in the 2019 TIP. The bulk of these investments are state of good repair and modernization projects that are also expected to improve the performance of one or more of the transit safety performance measures. A few projects in the 2019 TIP with anticipated transit safety benefits include:
• $738 million for BART’s Railcar Procurement Program • $63 million for SFMTA’s Rail Replacement Program • $59 million for the SFMTA Train Control and Trolley Signal Rehabilitation/Replacement project • $33 million for the Caltrain System-wide Track Rehabilitation and Related Structures project • $9 million for the SFMTA Geary Bus Rapid Transit project
Note: Anticipated effect of projects on transit safety provided by project sponsors through the draft 2019 TIP.
Table 4 2019 TIP Projects with Primary Purpose to Improve Transit Safety $ in millions
Safety
Investments % of 2019 TIP Investments
Safety Projects
% of 2019 TIP Projects
Regional total $70.4 1% 14 3% $70.4 1% 14 3% Note: Project purpose data provided by project sponsors through the draft 2019 TIP.
Table 5 2019 TIP Projects Anticipated to Result in Transit Safety Benefits $ in millions Investments improving performance outcomes for transit safety Investments Projects Regional total $1,177 17% 37 9% $1,177 17% 37 9%
$1.2 billion
Draft 2019 TIP Federal Performance Report Page 9 June 18, 2018
Transit Safety Assessment Information on the transit safety performance measures and related investments in the 2019 TIP are included in this report for information purposes. Pending final federal rulemaking on transit safety, MTC will report on regional and operator-specific data and monitor progress for the transit safety performance measures on Vital Signs, and fully implement transit safety performance requirements

Draft 2019 TIP Federal Performance Report Page 10 June 18, 2018
INFRASTRUCTURE CONDITION The maintenance and preservation of our existing transportation infrastructure are critical for supporting a safe and efficient transportation system. The overall goal of the infrastructure condition performance area is to improve the condition of existing pavements, bridges, and transit assets.
Pavement Condition Goal: Maintain the condition of highway infrastructure assets in a state of good repair
Performance Measures Four performance measures were established to identify trends and assess progress towards maintaining a state of good repair on the Interstate and Non-Interstate National Highway System (NHS).
Goal Area Pavement Condition
Performance Measures
• Percentage of pavements on the Interstate in good condition (lane miles) • Percentage of pavements on the Interstate in poor condition (lane miles) • Percentage of pavements on the non-Interstate NHS in good condition (lane miles) • Percentage of pavements on the non-Interstate NHS in poor condition (lane miles)
Performance Targets State DOTs are required to develop a Transportation Asset Management Plan to develop long-range investment strategies for assets on the National Highway System, including pavement condition. The plan establishes 10-year performance goals and interim two- and four-year performance targets to monitor progress. MPOs are required to set four-year targets, and may choose to adopt the statewide target or adopt quantifiable performance targets for the region.
Caltrans finalized the statewide targets for pavement condition in May 2018. MTC adoption of regional targets is anticipated by November 2018.
2019 TIP Investments In the 2019 TIP, $1.1 billion is directed to projects with a primary purpose of improving pavement condition on the NHS. Of this total amount, $1.0 billion is programmed to various projects in the SHOPP-Roadway Preservation program (Table 6).
Performance Measure 2 Year Targets 4 Year Targets
Caltrans MTC Caltrans MTC Interstate in good condition – percent 45.1%
Pending
44.5%
Pending Interstate in poor condition – percent 3.5% 3.8% Non-Interstate NHS in good condition – percent 28.2% 29.9% Non-Interstate NHS in poor condition – percent 7.3% 7.2%

Draft 2019 TIP Federal Performance Report Page 11 June 18, 2018
Table 6 2019 TIP Projects with Primary Purpose to Improve Pavement Condition on the NHS $ in millions
Investments % of 2019 TIP Investments
Projects % of 2019 TIP
Projects
Alameda $13 <1% 6 1% Contra Costa $13 <1% 11 2% Marin $4 <1% 1 <1% Napa $0 0% 0 0% San Francisco $0 0% 0 0% San Mateo $3 <1% 4 1% Santa Clara $31 <1% 5 1% Solano $6 <1% 2 <1% Sonoma $1 <1% 1 <1% Multiple Counties $1,018 8% 1 <1% $1,087 8% 31 6%
Note: Project purpose data provided by project sponsors through the draft 2019 TIP.
A total of $2.5 billion is programmed to projects in the 2019 TIP that will improve pavement condition on the Interstate or non-Interstate NHS, regardless of the projects primary purposes. These investments are anticipated to bring 432.3 lane miles of the Interstate and 498.2 miles of the non-Interstate NHS from fair or poor condition into good condition (Table 7). Additional data on state-owned facilities is required to calculate the percentage improvement these investments are expected to have on regional performance. Additionally, the precise impact of these investments on reaching regional performance targets will be affected by ongoing deterioration of pavement conditions throughout the TIP period as well as locally-funded pavement preservation and rehabilitation projects that are not reflected in the TIP.
Note: Pavement condition data provided by project sponsors through the draft 2019 TIP. ** = final performance report will reflect benefits as a percentage of overall lane-miles to align with federal performance requirements
Table 7 2019 TIP Anticipated Improvements in Pavement Condition on NHS
Interstate lane-miles Non-Interstate NHS lane-miles Fair to Good Poor to Good Total Fair to Good Poor to Good Total
377.8** 54.5** 432.3** 406.3** 91.9** 498.2**
Pavement Condition Assessment Information on the pavement condition performance measures and related investments in the 2019 TIP are included in this report for information purposes. Pending completion of the target-setting process, MTC will report regional data and monitor progress for the pavement condition performance measures on Vital Signs and fully implement the pavement condition performance management requirements into its planning and programming process.
$2.5 billion

Draft 2019 TIP Federal Performance Report Page 12 June 18, 2018
Bridge Condition Goal: Maintain the condition of bridge assets in a state of good repair
Performance Measures Two performance measures were established to identify trends and assess progress towards maintaining a state of good repair of bridges on the National Highway System (NHS).
Goal Area Bridge Condition
Performance Measures
• Percentage of NHS bridges classified in good condition (deck area square miles) • Percentage of NHS bridges classified in poor condition (deck area square miles)
Performance Targets State DOTs are required to develop a Transportation Asset Management Plan to develop long-range investment strategies for assets on the National Highway System, including bridge condition. The plan establishes 10-year performance targets as well as targets for years 2 and 4 to monitor progress. MPOs are required to set four-year targets, and may choose to adopt the statewide target or adopt quantifiable performance targets for the region.
Caltrans finalized the statewide bridge condition targets in May 2018. MTC adoption of regional targets is anticipated by November 2018.
Performance Measure 2 Year Targets 4 Year Targets
Caltrans MTC Caltrans MTC NHS bridges in good condition – percent 69.1%
Pending 70.5%
Pending NHS bridges in poor condition – percent 4.6% 4.4%
2019 TIP Investments The 2019 TIP includes project investments totaling $658 million on projects with a primary purpose of improving bridge conditions on the NHS. Of this amount, $583 million is programmed to various projects through the SHOPP-Bridge Rehabilitation and Reconstruction program.
Table 8 2019 TIP Projects with Primary Purpose to Improve Bridge Condition on the NHS $ in millions
Investments % of 2019 TIP Investments
Projects % of 2019 TIP
Projects
Regional Total $658 5% 6 1% $658 5% 6 1%
Note: Project purpose data provided by project sponsors through the draft 2019 TIP.
Nearly $1.5 billion is directed to all projects, regardless of project purpose, that will improve conditions of bridges on the NHS. These investments are anticipated to bring 443,478 square miles of bridge deck area

Draft 2019 TIP Federal Performance Report Page 13 June 18, 2018
from fair or poor condition into good condition. Additional data on state-owned bridges is required to calculate the percentage improvement these investments are expected to have on regional performance. The precise impact of these investments on performance will be affected by ongoing deterioration of bridge conditions throughout the TIP period. In addition, another $207 million is invested in various local bridges through the Local Highway Bridge Program. Bridges funded through the program that are on the NHS have not been incorporated into the performance analysis due to unavailability of project-level data from project sponsors.
Note: Bridge deck condition data provided by project sponsors through the draft 2019 TIP. ** = final performance report will reflect benefits as a percentage of overall lane-miles to align with federal performance requirements
Transit Asset Management Goal: Maintain the condition of public transit assets in a state of good repair
Performance Measures Four performance measures were established to identify trends and assess progress towards maintaining a state of good repair (SGR) for public transit assets, including rolling stock, equipment, infrastructure, and facilities.
Goal Area Transit Asset Condition
Performance Measures
• Percentage of revenue vehicles that have met or exceeded their useful life benchmark (by asset class)
• Percentage of facilities within a condition rating below fair (by asset class) • Percentage of rail fixed-guideway with performance restrictions (directional route-miles) • Percentage of non-revenue vehicles that have met or exceeded their useful life benchmark
Table 9 2019 TIP Investments in Bridge Condition on NHS, in deck area square miles
Fair to Good Poor to Good Total 349,218** 94,260** 443,478**
Bridge Condition Assessment Information on the bridge condition performance measures and related investments in the 2019 TIP are included in this report for information purposes. Pending completion of the target-setting process, MTC will report regional data and monitor progress for the bridge condition performance measures on Vital Signs and fully implement bridge condition performance management requirements into its planning and programming process.
$1.5 billion

Draft 2019 TIP Federal Performance Report Page 14 June 18, 2018
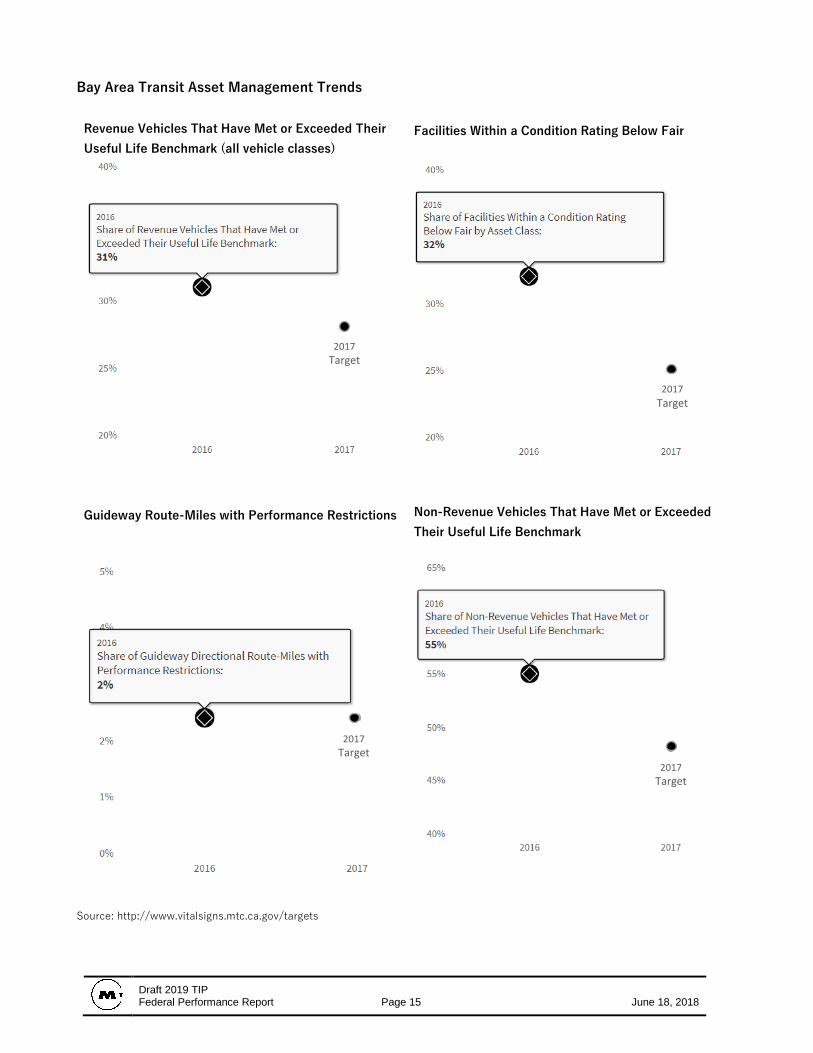
Performance Targets Transit operators and MPOs are required to set annual targets for each transit asset performance measure. For the 2017 regional targets, MTC consolidated the targets set by individual operators for each asset class within the performance measures for revenue vehicles, facilities and non-revenue vehicles. For the rail fixed-guideway measure, MTC set a target for preserving current conditions. This target is slightly more ambitious than the consolidated target of regional operators, which forecast a slight decline in conditions in 2017. The targets for each measure are detailed in the table below, followed by Bay Area regional trend charts for each performance measure.
MTC is expected to adopt regional transit asset performance targets for 2018 in July 2018. At that time, performance achievements for the 2017 reporting period will also be available.
Performance Measures Current Performance
(2016) MTC Target
(2017) Revenue Vehicles – percent exceeding ULB 31% 28%
Articulated bus 24% 13% Automated guideway vehicle 0% 0% Bus 22% 18% Bus rapid transit 0% 0% Cable car 0% 0% Commuter rail – locomotive 57% 58% Commuter rail – passenger coach 40% 42% Commuter rail – self-propelled passenger car 42% 44% Ferryboat 28% 29% Heavy rail 88% 85% Light rail 0% 0% Over-the-road bus 3% 12% Trolley bus 0% 0% Van 39% 37% Vintage trolley 46% 25%
Facilities – percent exceeding ULB * 32% 25% Rail fixed-guideway – percent with condition rating below fair 2.4% 2.4% Non-Revenue Vehicles – percent exceeding ULB 55% 48%
*For the 2017 target-setting effort, a single target was set for all facilities combined, due to insufficient information required to classify facilities and components of facilities into the specific classes defined by FTA.
Draft 2019 TIP Federal Performance Report Page 15 June 18, 2018
Bay Area Transit Asset Management Trends Revenue Vehicles That Have Met or Exceeded Their Useful Life Benchmark (all vehicle classes)
Facilities Within a Condition Rating Below Fair
Guideway Route-Miles with Performance Restrictions
Non-Revenue Vehicles That Have Met or Exceeded Their Useful Life Benchmark
Source: http://www.vitalsigns.mtc.ca.gov/targets
2017 Target
2017 Target
2017 Target
2017 Target

Draft 2019 TIP Federal Performance Report Page 16 June 18, 2018
2019 TIP Investments More than $2.2 billion is invested in the 2019 TIP on projects with a primary purpose of transit asset management (Table 10). A total of $6.8 billion is invested in transit maintenance, rehabilitation, or expansion projects in the 2019 TIP. Transit rehabilitation or replacement projects directly affect regional transit asset conditions by increasing the share of assets in a state of good repair. Adding new assets as part of a transit service expansion also have an impact on the share of transit assets in a state of good repair by increasing the total number of assets in a particular class. Some of the largest investments in transit assets, including expansion projects, in the 2019 TIP include:
• $2.6 billion - BART Berryessa to San Jose Extension • $1.1 billion - BART Transbay Core Capacity Improvements • $737 million - BART Railcar Procurement Program • $598 million - Transbay Terminal/Caltrain Downtown Extension, Phase 2 • $332 million - Caltrain Electrification & Expansion projects
Rail transit accounts for the majority of the transit asset investments in the 2019 TIP, with the five projects identified above programmed to receive 82% of transit asset funding in the 2019 TIP.
The final performance report will incorporate the anticipated effect of the transit asset investments in the 2019 TIP on regional transit asset performance.
Table 10 2019 TIP Projects with Primary Purpose of Transit Asset Management
Investments % of 2019 TIP Investments
Projects % of 2019 TIP
Projects AC Transit $52 <1% 4 1% BART $1,888 14% 6 1% Caltrain $36 <1% 2 <1% GGBHTD $111 1% 10 2% MCTD $13 <1% 5 1% NVTA $2 <1% 2 <1% SamTrans $19 <1% 3 1% Santa Rosa CityBus $2 <1% 1 <1% SFMTA $20 <1% 1 <1% Sonoma County Transit $5 <1% 2 <1% VTA $42 <1% 6 1% WETA $41 <1% 3 1% $2,230 17% 45 8% Note: Project purpose data provided by provided by project sponsors through the draft 2019 TIP.
$6.8 billion

Draft 2019 TIP Federal Performance Report Page 18 June 18, 2018
Transit Asset Management Assessment In the 2019 TIP, $6.8 billion is directed to projects that will improve the performance of regional transit assets. The program of projects in the 2019 TIP supports continued regional progress towards reaching transit state of good repair targets. However, the specific impact of these investments on annual performance will be heavily influenced by the rate of continued wear and tear on existing transit assets during the TIP period as well as additional investments made by transit operators that are not captured in the 2019 TIP.
Throughout the implementation of the 2019 TIP, MTC will continue reporting on regional data and monitor progress for the transit asset condition performance measures (see Vital Signs website) and will further develop the analytical approach for evaluating transit asset condition performance.
Draft 2019 TIP Federal Performance Report Page 19 June 18, 2018
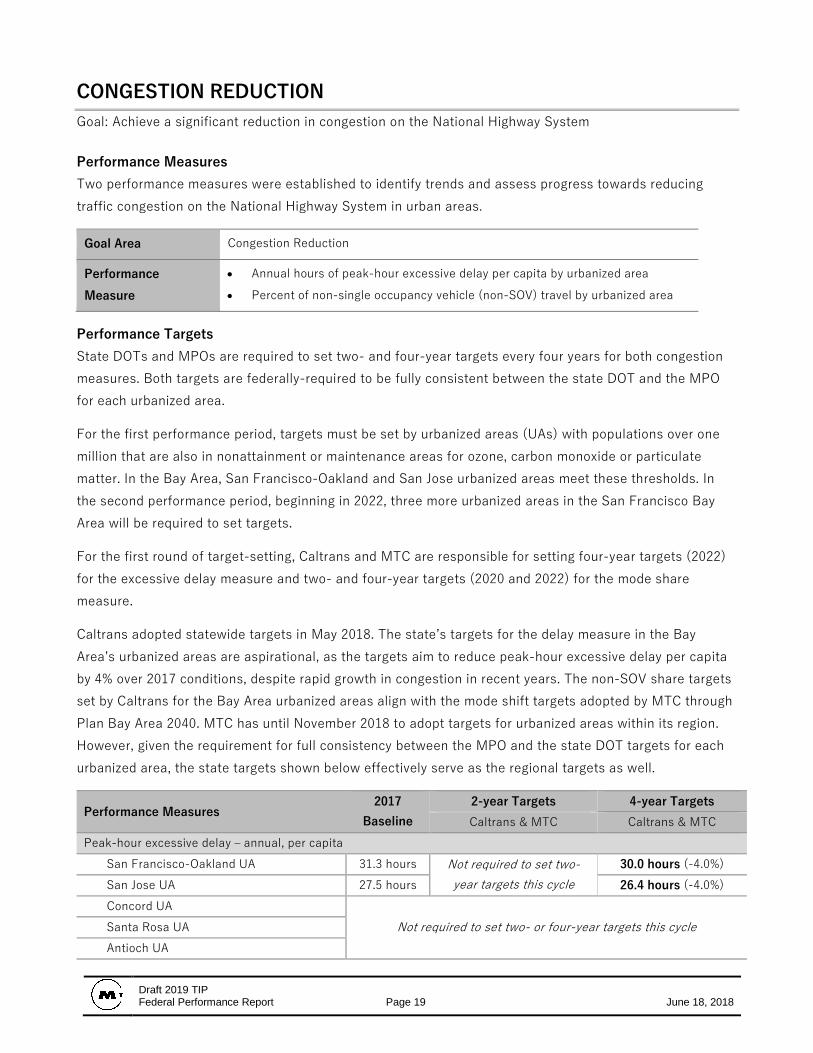
CONGESTION REDUCTION Goal: Achieve a significant reduction in congestion on the National Highway System
Performance Measures Two performance measures were established to identify trends and assess progress towards reducing traffic congestion on the National Highway System in urban areas.
Goal Area Congestion Reduction
Performance Measure
• Annual hours of peak-hour excessive delay per capita by urbanized area • Percent of non-single occupancy vehicle (non-SOV) travel by urbanized area
Performance Targets State DOTs and MPOs are required to set two- and four-year targets every four years for both congestion measures. Both targets are federally-required to be fully consistent between the state DOT and the MPO for each urbanized area.
For the first performance period, targets must be set by urbanized areas (UAs) with populations over one million that are also in nonattainment or maintenance areas for ozone, carbon monoxide or particulate matter. In the Bay Area, San Francisco-Oakland and San Jose urbanized areas meet these thresholds. In the second performance period, beginning in 2022, three more urbanized areas in the San Francisco Bay Area will be required to set targets.
For the first round of target-setting, Caltrans and MTC are responsible for setting four-year targets (2022) for the excessive delay measure and two- and four-year targets (2020 and 2022) for the mode share measure.
Caltrans adopted statewide targets in May 2018. The state’s targets for the delay measure in the Bay Area’s urbanized areas are aspirational, as the targets aim to reduce peak-hour excessive delay per capita by 4% over 2017 conditions, despite rapid growth in congestion in recent years. The non-SOV share targets set by Caltrans for the Bay Area urbanized areas align with the mode shift targets adopted by MTC through Plan Bay Area 2040. MTC has until November 2018 to adopt targets for urbanized areas within its region. However, given the requirement for full consistency between the MPO and the state DOT targets for each urbanized area, the state targets shown below effectively serve as the regional targets as well.
Performance Measures 2017
Baseline 2-year Targets 4-year Targets Caltrans & MTC Caltrans & MTC
Peak-hour excessive delay – annual, per capita San Francisco-Oakland UA 31.3 hours Not required to set two-
year targets this cycle 30.0 hours (-4.0%)
San Jose UA 27.5 hours 26.4 hours (-4.0%) Concord UA
Not required to set two- or four-year targets this cycle Santa Rosa UA Antioch UA
Draft 2019 TIP Federal Performance Report Page 20 June 18, 2018
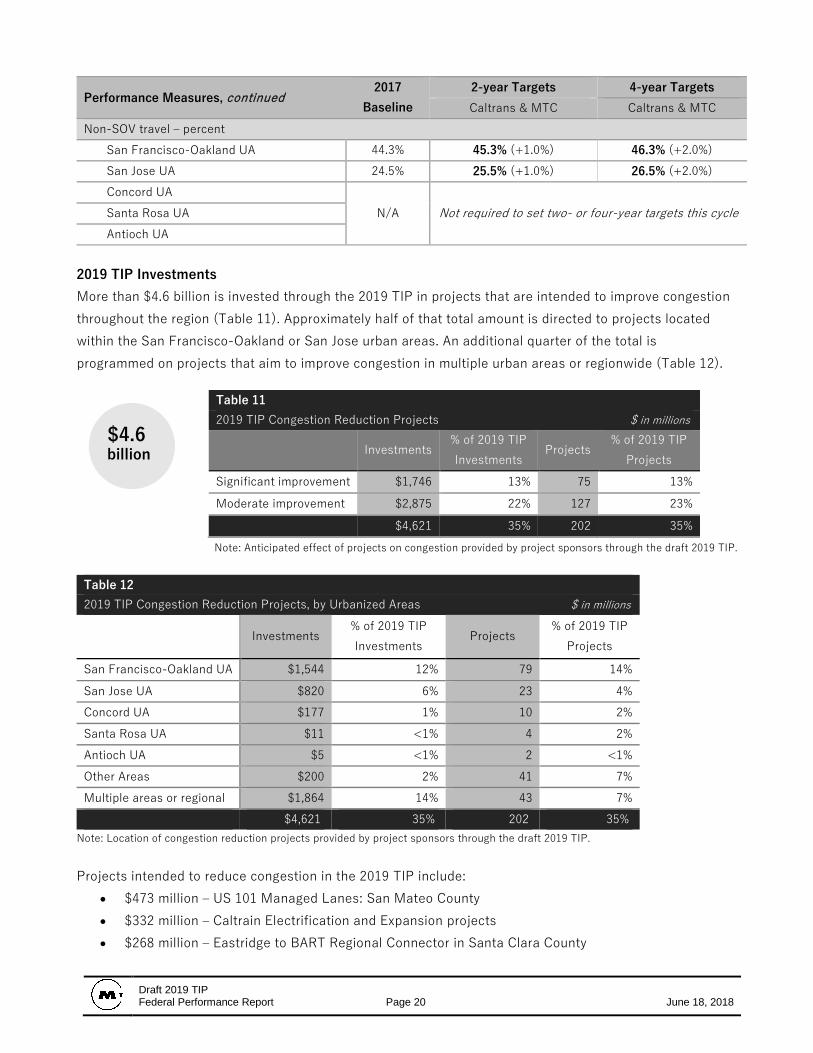
Performance Measures, continued 2017
Baseline 2-year Targets 4-year Targets Caltrans & MTC Caltrans & MTC
Non-SOV travel – percent San Francisco-Oakland UA 44.3% 45.3% (+1.0%) 46.3% (+2.0%) San Jose UA 24.5% 25.5% (+1.0%) 26.5% (+2.0%) Concord UA
N/A Not required to set two- or four-year targets this cycle Santa Rosa UA Antioch UA
2019 TIP Investments More than $4.6 billion is invested through the 2019 TIP in projects that are intended to improve congestion throughout the region (Table 11). Approximately half of that total amount is directed to projects located within the San Francisco-Oakland or San Jose urban areas. An additional quarter of the total is programmed on projects that aim to improve congestion in multiple urban areas or regionwide (Table 12).
Note: Anticipated effect of projects on congestion provided by project sponsors through the draft 2019 TIP.
Note: Location of congestion reduction projects provided by project sponsors through the draft 2019 TIP.
Projects intended to reduce congestion in the 2019 TIP include: • $473 million – US 101 Managed Lanes: San Mateo County • $332 million – Caltrain Electrification and Expansion projects • $268 million – Eastridge to BART Regional Connector in Santa Clara County
Table 11 2019 TIP Congestion Reduction Projects $ in millions
Investments % of 2019 TIP Investments
Projects % of 2019 TIP
Projects Significant improvement $1,746 13% 75 13% Moderate improvement $2,875 22% 127 23% $4,621 35% 202 35%
Table 12 2019 TIP Congestion Reduction Projects, by Urbanized Areas $ in millions
Investments % of 2019 TIP Investments
Projects % of 2019 TIP
Projects
San Francisco-Oakland UA $1,544 12% 79 14% San Jose UA $820 6% 23 4% Concord UA $177 1% 10 2% Santa Rosa UA $11 <1% 4 2% Antioch UA $5 <1% 2 <1% Other Areas $200 2% 41 7% Multiple areas or regional $1,864 14% 43 7% $4,621 35% 202 35%
$4.6 billion
Draft 2019 TIP Federal Performance Report Page 21 June 18, 2018
• $66 million – I-680 SB HOV Lane Completion in Contra Costa County • $56 million – I-880/Industrial Parkway West Interchange Improvements in Alameda County
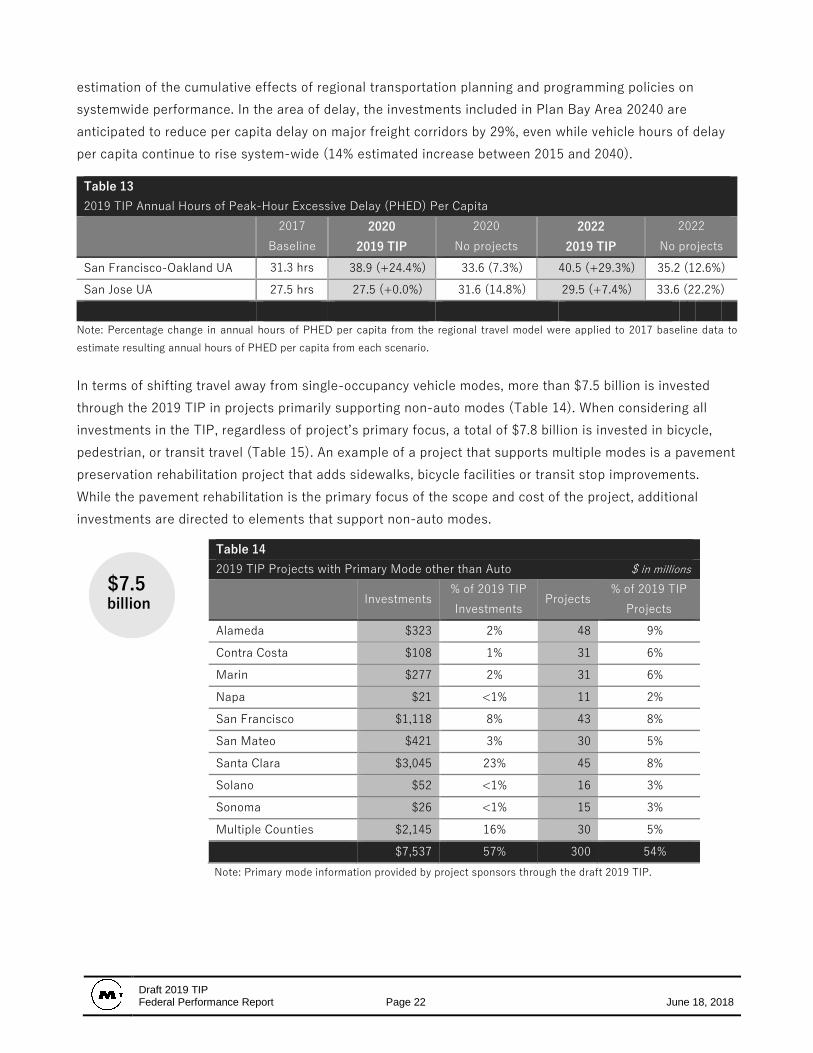
Congestion is known to degrade when population and economic activity outpace operational and capacity improvements to the transportation system. Even with the investments in the 2019 TIP, the annual peak-hours of delay per capita is expected to continue to increase in both the San Francisco-Oakland and San Jose urbanized areas (Table 13). In San Jose, the 2019 TIP investments appear to slow the increase in peak-hours of delay per capita in 2022 from a 22.2% increase over 2017 conditions to only a 7.4% increase. In the San Francisco-Oakland urbanized area, the investments in the 2019 TIP appear to have the opposite effect on growth in peak-hour excessive delay per capita. With the 2019 TIP investments, the measure increases 29.3% between 2022 over 2017, compared to a 12.6% increase in a scenario in which the 2019 TIP projects are not built.
One reason for this sizeable difference between the metro areas may be due to the impact of specific projects included during the TIP period. In particular, a major investment in connecting BART from Warm Springs to Berryessa is anticipated to be completed, and can be expected to have significant effect on travel throughout the San Jose urbanized area, increasing transit ridership and reducing excessive delay in the area. In the San Francisco-Oakland urbanized area, there are significant investments in transit capacity expansion, but not of the scale or magnitude of the BART extension in the South Bay. Absent the addition of a major transit capacity project going into operation within the San Francisco-Oakland urbanized area, roadway capacity expansion projects in the area have an effect of inducing roadway travel. Although the capacity expansion projects increase person-throughput and improve speeds, they result in more people traveling in the peak-hour delayed condition, thereby increasing the annual peak hours of excessive delay per capita.
Several aspects of the regional travel model are also worth noting in relation to the calculation of congestion delay. First, the model is designed primarily to forecast travel behavior – trip making and mode choice decisions. As such, the model is limited in its representation of delay, because it models volumes over fairly long time periods (multiple-hour peaks) and it does not represent the delay caused by traffic bottlenecks or traffic queuing. Second, due to the regional focus of the model, many projects in the 2019 TIP have not been modeled. Collectively, these projects will undoubtedly impact travel throughout the region, but on an individual basis, the effects of these projects were not captured in the analysis and resulting delay measure.
An additional consideration in interpreting these results centers on the narrow focus of the TIP. Compared to Plan Bay Area 2040, which includes the universe of revenues reasonably expected to be available over a 24-year period, the TIP represents only a four-year period (with a particular focus on federally-funded projects). Performance results from each TIP cycle are expected to be somewhat lumpy, with a set of major transit investments playing a dominant role in the performance result in one TIP cycle, potentially followed by a group of highway capacity expansion projects producing significant but varied results in the subsequent TIP cycle. The performance analysis of Plan Bay Area 2040 presents a more comprehensive
Draft 2019 TIP Federal Performance Report Page 22 June 18, 2018
estimation of the cumulative effects of regional transportation planning and programming policies on systemwide performance. In the area of delay, the investments included in Plan Bay Area 20240 are anticipated to reduce per capita delay on major freight corridors by 29%, even while vehicle hours of delay per capita continue to rise system-wide (14% estimated increase between 2015 and 2040).
Table 13 2019 TIP Annual Hours of Peak-Hour Excessive Delay (PHED) Per Capita
2017
Baseline 2020
2019 TIP 2020
No projects 2022
2019 TIP 2022
No projects San Francisco-Oakland UA 31.3 hrs 38.9 (+24.4%) 33.6 (7.3%) 40.5 (+29.3%) 35.2 (12.6%) San Jose UA 27.5 hrs 27.5 (+0.0%) 31.6 (14.8%) 29.5 (+7.4%) 33.6 (22.2%)
Note: Percentage change in annual hours of PHED per capita from the regional travel model were applied to 2017 baseline data to estimate resulting annual hours of PHED per capita from each scenario.
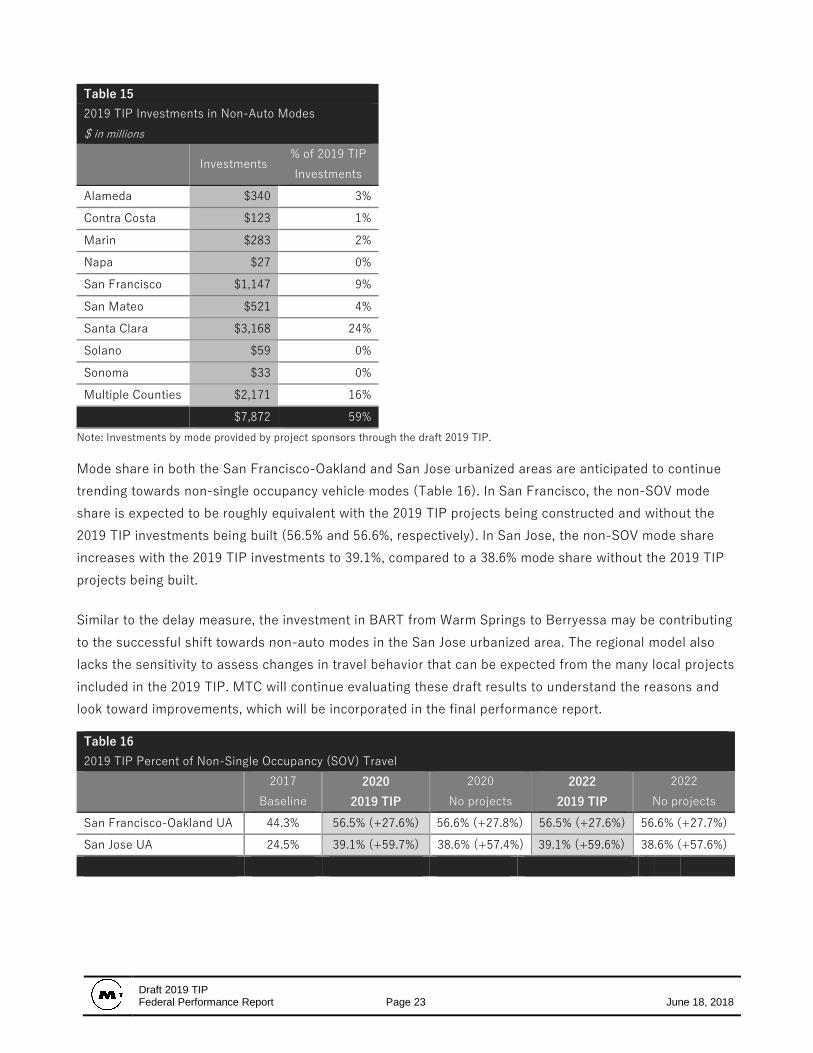
In terms of shifting travel away from single-occupancy vehicle modes, more than $7.5 billion is invested through the 2019 TIP in projects primarily supporting non-auto modes (Table 14). When considering all investments in the TIP, regardless of project’s primary focus, a total of $7.8 billion is invested in bicycle, pedestrian, or transit travel (Table 15). An example of a project that supports multiple modes is a pavement preservation rehabilitation project that adds sidewalks, bicycle facilities or transit stop improvements. While the pavement rehabilitation is the primary focus of the scope and cost of the project, additional investments are directed to elements that support non-auto modes.
Note: Primary mode information provided by project sponsors through the draft 2019 TIP.
Table 14 2019 TIP Projects with Primary Mode other than Auto $ in millions
Investments % of 2019 TIP Investments
Projects % of 2019 TIP
Projects Alameda $323 2% 48 9% Contra Costa $108 1% 31 6% Marin $277 2% 31 6% Napa $21 <1% 11 2% San Francisco $1,118 8% 43 8% San Mateo $421 3% 30 5% Santa Clara $3,045 23% 45 8% Solano $52 <1% 16 3% Sonoma $26 <1% 15 3% Multiple Counties $2,145 16% 30 5% $7,537 57% 300 54%
$7.5 billion
Draft 2019 TIP Federal Performance Report Page 23 June 18, 2018
Table 15 2019 TIP Investments in Non-Auto Modes $ in millions
Investments % of 2019 TIP Investments
Alameda $340 3% Contra Costa $123 1% Marin $283 2% Napa $27 0% San Francisco $1,147 9% San Mateo $521 4% Santa Clara $3,168 24% Solano $59 0% Sonoma $33 0% Multiple Counties $2,171 16% $7,872 59%
Note: Investments by mode provided by project sponsors through the draft 2019 TIP.
Mode share in both the San Francisco-Oakland and San Jose urbanized areas are anticipated to continue trending towards non-single occupancy vehicle modes (Table 16). In San Francisco, the non-SOV mode share is expected to be roughly equivalent with the 2019 TIP projects being constructed and without the 2019 TIP investments being built (56.5% and 56.6%, respectively). In San Jose, the non-SOV mode share increases with the 2019 TIP investments to 39.1%, compared to a 38.6% mode share without the 2019 TIP projects being built.
Similar to the delay measure, the investment in BART from Warm Springs to Berryessa may be contributing to the successful shift towards non-auto modes in the San Jose urbanized area. The regional model also lacks the sensitivity to assess changes in travel behavior that can be expected from the many local projects included in the 2019 TIP. MTC will continue evaluating these draft results to understand the reasons and look toward improvements, which will be incorporated in the final performance report.
Table 16 2019 TIP Percent of Non-Single Occupancy (SOV) Travel
2017
Baseline 2020
2019 TIP 2020
No projects 2022
2019 TIP 2022
No projects San Francisco-Oakland UA 44.3% 56.5% (+27.6%) 56.6% (+27.8%) 56.5% (+27.6%) 56.6% (+27.7%) San Jose UA 24.5% 39.1% (+59.7%) 38.6% (+57.4%) 39.1% (+59.6%) 38.6% (+57.6%)
Draft 2019 TIP Federal Performance Report Page 24 June 18, 2018
Congestion Reduction Assessment Information on the congestion performance measures and related investments in the 2019 TIP are included in this report for information purposes. Pending completion of the target-setting process, MTC will report regional data and monitor progress for the congestion performance measures on Vital Signs and fully implement applicable performance management requirements into its planning and programming process.
Draft 2019 TIP Federal Performance Report Page 25 June 18, 2018
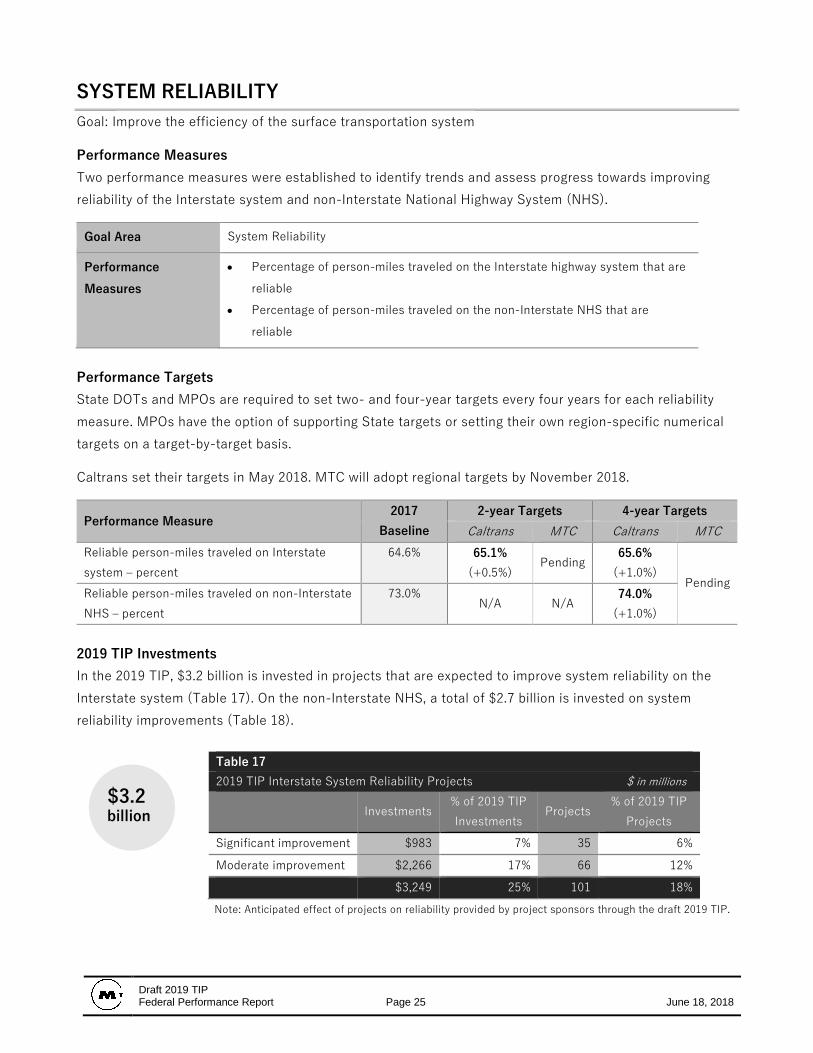
SYSTEM RELIABILITY Goal: Improve the efficiency of the surface transportation system
Performance Measures Two performance measures were established to identify trends and assess progress towards improving reliability of the Interstate system and non-Interstate National Highway System (NHS).
Goal Area System Reliability
Performance Measures
• Percentage of person-miles traveled on the Interstate highway system that are reliable
• Percentage of person-miles traveled on the non-Interstate NHS that are reliable
Performance Targets State DOTs and MPOs are required to set two- and four-year targets every four years for each reliability measure. MPOs have the option of supporting State targets or setting their own region-specific numerical targets on a target-by-target basis.
Caltrans set their targets in May 2018. MTC will adopt regional targets by November 2018.
Performance Measure 2017
Baseline 2-year Targets 4-year Targets
Caltrans MTC Caltrans MTC Reliable person-miles traveled on Interstate system – percent
64.6% 65.1% (+0.5%)
Pending 65.6%
(+1.0%) Pending
Reliable person-miles traveled on non-Interstate NHS – percent
73.0% N/A N/A
74.0% (+1.0%)
2019 TIP Investments In the 2019 TIP, $3.2 billion is invested in projects that are expected to improve system reliability on the Interstate system (Table 17). On the non-Interstate NHS, a total of $2.7 billion is invested on system reliability improvements (Table 18).
Note: Anticipated effect of projects on reliability provided by project sponsors through the draft 2019 TIP.
Table 17 2019 TIP Interstate System Reliability Projects $ in millions
Investments % of 2019 TIP Investments
Projects % of 2019 TIP
Projects Significant improvement $983 7% 35 6% Moderate improvement $2,266 17% 66 12% $3,249 25% 101 18%
$3.2 billion
Draft 2019 TIP Federal Performance Report Page 26 June 18, 2018
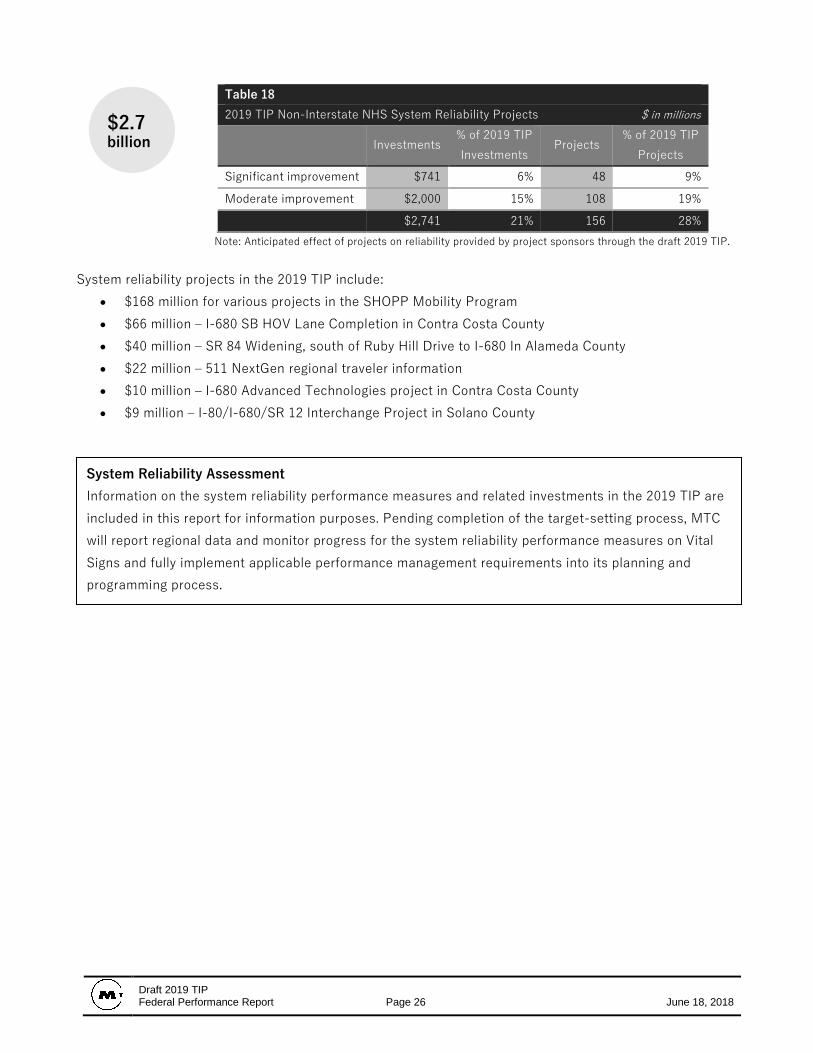
Note: Anticipated effect of projects on reliability provided by project sponsors through the draft 2019 TIP.
System reliability projects in the 2019 TIP include: • $168 million for various projects in the SHOPP Mobility Program • $66 million – I-680 SB HOV Lane Completion in Contra Costa County • $40 million – SR 84 Widening, south of Ruby Hill Drive to I-680 In Alameda County • $22 million – 511 NextGen regional traveler information • $10 million – I-680 Advanced Technologies project in Contra Costa County • $9 million – I-80/I-680/SR 12 Interchange Project in Solano County
Table 18 2019 TIP Non-Interstate NHS System Reliability Projects $ in millions
Investments % of 2019 TIP Investments
Projects % of 2019 TIP
Projects Significant improvement $741 6% 48 9% Moderate improvement $2,000 15% 108 19% $2,741 21% 156 28%
System Reliability Assessment Information on the system reliability performance measures and related investments in the 2019 TIP are included in this report for information purposes. Pending completion of the target-setting process, MTC will report regional data and monitor progress for the system reliability performance measures on Vital Signs and fully implement applicable performance management requirements into its planning and programming process.
billion $2.7

Draft 2019 TIP Federal Performance Report Page 27 June 18, 2018
FREIGHT MOVEMENT AND ECONOMIC VITALITY Goal: Improve the national freight network, strengthen the ability of rural communities to access national and international trade markets, and support regional economic development
Performance Measures One performance measure was created to identify trends and assess progress towards improving reliability of the Interstate system specifically for freight trucks.
Goal Area Freight Movement and Economic Vitality
Performance Measure
• Percentage of Interstate highway system mileage providing reliable truck travel times (Truck Travel Time Reliability Index)
Performance Targets State DOTs and MPOs are required to set 2- and 4-year numerical targets for the freight movement target. MPOs have the option of supporting State targets or setting their own region-specific numerical targets on a target-by-target basis.
Caltrans set statewide targets in May 2018. These targets reflect a slight degradation of truck travel time reliability, with the percent of reliable Interstate miles decreasing by one tenth of a percentage point in both 2020 and 2022. MTC will adopt regional targets by November 2018.
Performance Measure 2017
Baseline 2-year Targets 4-year Targets
Caltrans MTC Caltrans MTC Reliable Interstate miles of truck travel – Truck Travel Reliability Index
1.69 1.68
(-0.01) Pending
1.67 (-0.02)
Pending
2019 TIP Investments Reliability improvement projects for Interstate truck travel account for $2.1 billion of investments in the 2019 TIP (Table 19).
Note: Anticipated effect of projects on reliability provided by project sponsors through the draft 2019 TIP.
Many of the investments that improve reliability on the Interstate overall also improve reliability specifically for truck travel. A few additional reliability projects that target freight travel specifically include:
• $24 million – Port of Oakland’s 7th Street Grade Separation (East and West)
Table 19 2019 TIP Interstate System Truck Travel Reliability Projects $ in millions
Investments % of 2019 TIP Investments
Projects % of 2019
TIP Projects
Significant improvement $1,060 8% 26 5% Moderate improvement $1,053 8% 44 8% $2,112 16% 70 13%
$2.1 billion

Draft 2019 TIP Federal Performance Report Page 28 June 18, 2018
• $14 million – Freight Intelligent Transportation Systems in Alameda County • $6 million – US 101/Produce Ave Interchange in San Mateo County • $5 million – US 101/Old Oakland Rd Interchange in Santa Clara County
Freight Movement and Economic Vitality Assessment Information on freight movement performance measures and related investments in the 2019 TIP are included in this report for information purposes. Pending completion of the target-setting process, MTC will report regional data and monitor progress for the system reliability performance measures on Vital Signs and fully implement applicable performance management requirements into its planning and programming process.
Draft 2019 TIP Federal Performance Report Page 29 June 18, 2018
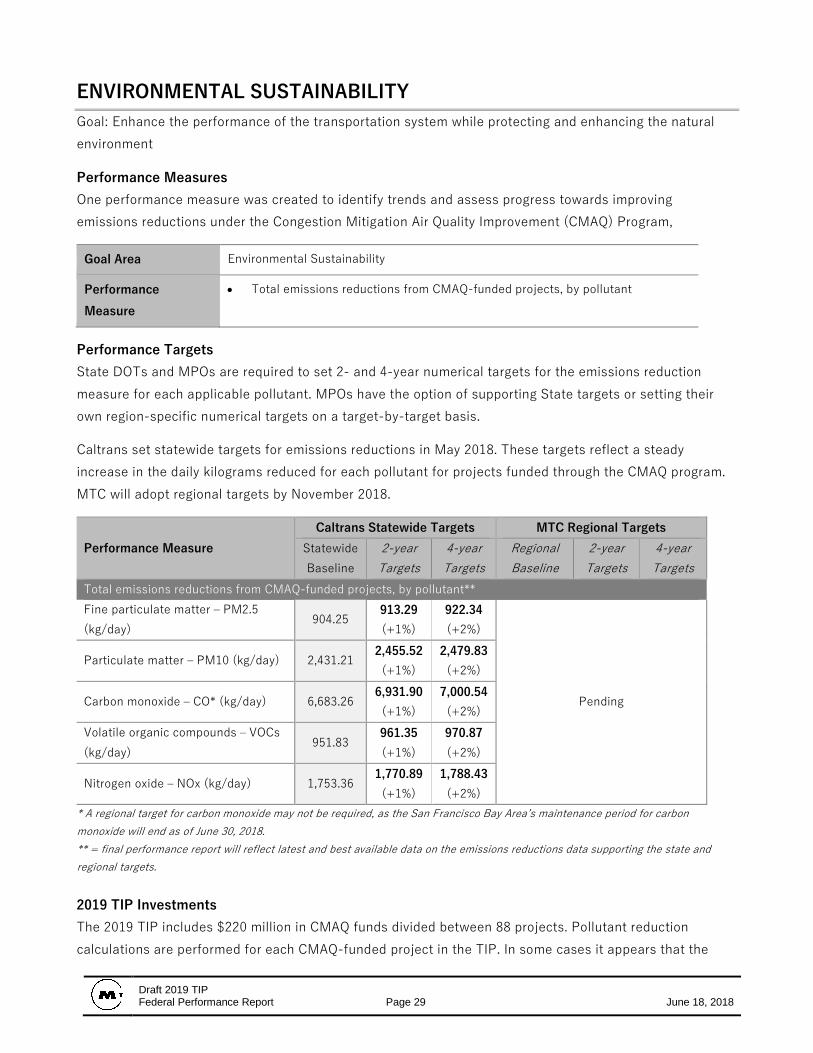
ENVIRONMENTAL SUSTAINABILITY Goal: Enhance the performance of the transportation system while protecting and enhancing the natural environment
Performance Measures One performance measure was created to identify trends and assess progress towards improving emissions reductions under the Congestion Mitigation Air Quality Improvement (CMAQ) Program,
Goal Area Environmental Sustainability
Performance Measure
• Total emissions reductions from CMAQ-funded projects, by pollutant
Performance Targets State DOTs and MPOs are required to set 2- and 4-year numerical targets for the emissions reduction measure for each applicable pollutant. MPOs have the option of supporting State targets or setting their own region-specific numerical targets on a target-by-target basis.
Caltrans set statewide targets for emissions reductions in May 2018. These targets reflect a steady increase in the daily kilograms reduced for each pollutant for projects funded through the CMAQ program. MTC will adopt regional targets by November 2018.
Performance Measure Caltrans Statewide Targets MTC Regional Targets
Statewide Baseline
2-year Targets
4-year Targets
Regional Baseline
2-year Targets
4-year Targets
Total emissions reductions from CMAQ-funded projects, by pollutant** Fine particulate matter – PM2.5 (kg/day)
904.25 913.29 (+1%)
922.34 (+2%)
Pending
Particulate matter – PM10 (kg/day) 2,431.21 2,455.52
(+1%) 2,479.83
(+2%)
Carbon monoxide – CO* (kg/day) 6,683.26 6,931.90
(+1%) 7,000.54
(+2%) Volatile organic compounds – VOCs (kg/day)
951.83 961.35 (+1%)
970.87 (+2%)
Nitrogen oxide – NOx (kg/day) 1,753.36 1,770.89
(+1%) 1,788.43
(+2%) * A regional target for carbon monoxide may not be required, as the San Francisco Bay Area’s maintenance period for carbon monoxide will end as of June 30, 2018. ** = final performance report will reflect latest and best available data on the emissions reductions data supporting the state and regional targets. 2019 TIP Investments The 2019 TIP includes $220 million in CMAQ funds divided between 88 projects. Pollutant reduction calculations are performed for each CMAQ-funded project in the TIP. In some cases it appears that the
Draft 2019 TIP Federal Performance Report Page 30 June 18, 2018
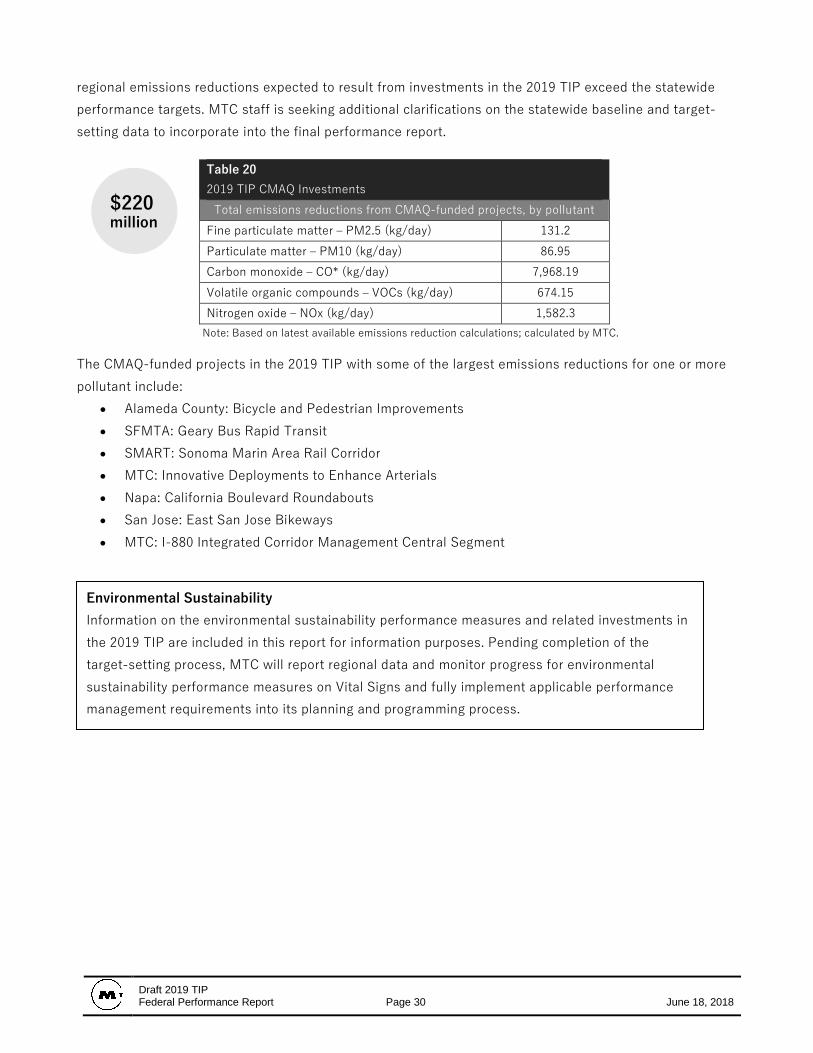
regional emissions reductions expected to result from investments in the 2019 TIP exceed the statewide performance targets. MTC staff is seeking additional clarifications on the statewide baseline and target-setting data to incorporate into the final performance report.
Note: Based on latest available emissions reduction calculations; calculated by MTC.
The CMAQ-funded projects in the 2019 TIP with some of the largest emissions reductions for one or more pollutant include:
• Alameda County: Bicycle and Pedestrian Improvements • SFMTA: Geary Bus Rapid Transit • SMART: Sonoma Marin Area Rail Corridor • MTC: Innovative Deployments to Enhance Arterials • Napa: California Boulevard Roundabouts • San Jose: East San Jose Bikeways • MTC: I-880 Integrated Corridor Management Central Segment
Table 20 2019 TIP CMAQ Investments
Total emissions reductions from CMAQ-funded projects, by pollutant Fine particulate matter – PM2.5 (kg/day) 131.2 Particulate matter – PM10 (kg/day) 86.95 Carbon monoxide – CO* (kg/day) 7,968.19 Volatile organic compounds – VOCs (kg/day) 674.15 Nitrogen oxide – NOx (kg/day) 1,582.3
$220 million
Environmental Sustainability Information on the environmental sustainability performance measures and related investments in the 2019 TIP are included in this report for information purposes. Pending completion of the target-setting process, MTC will report regional data and monitor progress for environmental sustainability performance measures on Vital Signs and fully implement applicable performance management requirements into its planning and programming process.

Draft 2019 TIP Federal Performance Report Page 31 June 18, 2018
LIMITATIONS
• Limitations of self-reported data: For the first iteration of federal performance reporting, MTC relied on self-reported data from project sponsors to compile program level effects of investments on regional targets. This approach provided a great deal of new project-level data on a range of topics and in relatively short period of time. Significant review is required to ensure that this new information accurately and consistently represents the anticipated performance benefits of the program of projects in the 2019 TIP. The final 2019 TIP, planned for MTC adoption in September 2018 will be updated to reflect the latest and best information for all projects in the 2019 TIP.
• External forces at play: Performance in each goal area is influenced by a variety of factors that are not captured in the assessment of the effect of 2019 TIP investments on regional performance. For road safety and traffic congestion, growth or decline in economic activity is directly related to the total number of traffic fatalities and serious injuries as well as levels of congestion. In the case of asset management, ongoing deterioration rates, and unanticipated events (earthquakes, wildfires, or flooding) can also affect the resulting state of good repair for regional assets.
• Limitations of Current Tools: The regional travel demand model is used to calculate performance
for several measures. The focus of the model on regional travel behavior, combined with the relatively small number of “modelable” projects in the 2019 TIP (projects that are large enough in scope to be captured in the regional model), make it difficult to draw clear conclusions about the effect of the 2019 TIP program of projects on measures for congestion, reliability, and mode share. Additionally, new tools may be needed to better analyze the effects of different project and program types on reducing the severity of traffic collisions and transit safety events.
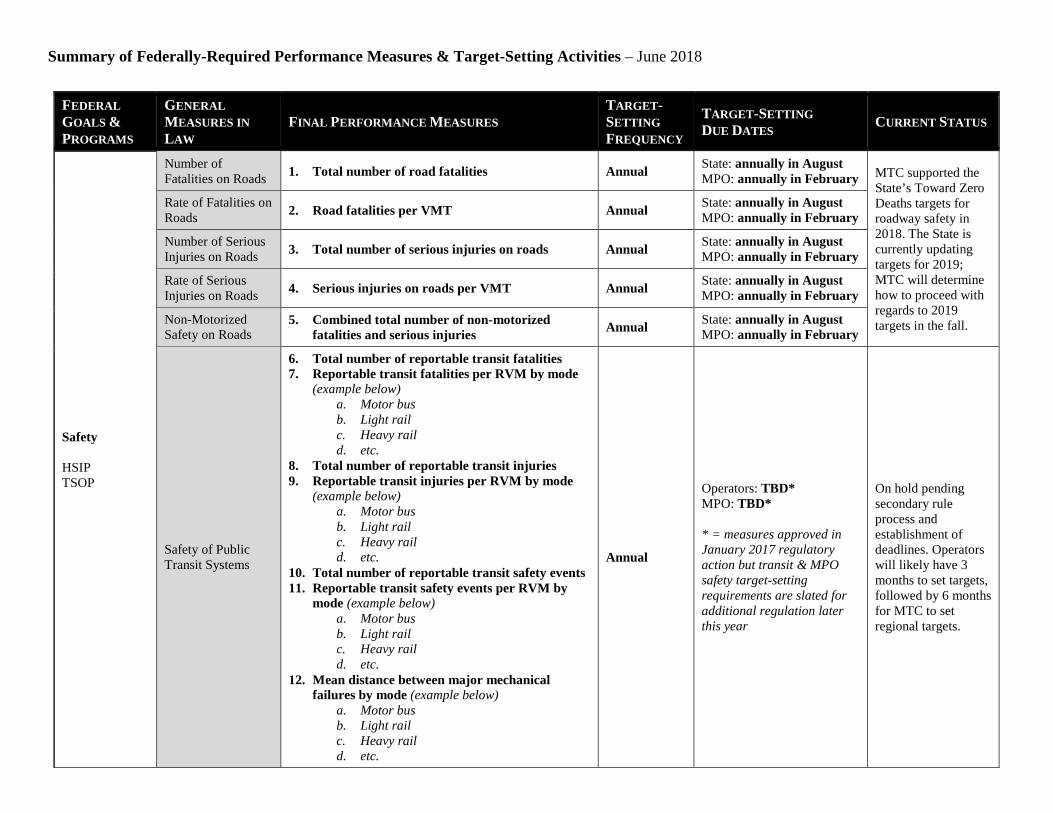
Summary of Federally-Required Performance Measures & Target-Setting Activities – June 2018
FEDERAL GOALS & PROGRAMS
GENERAL MEASURES IN LAW
FINAL PERFORMANCE MEASURES TARGET-SETTING FREQUENCY
TARGET-SETTING DUE DATES CURRENT STATUS
Safety HSIP TSOP
Number of Fatalities on Roads 1. Total number of road fatalities Annual State: annually in August
MPO: annually in February MTC supported the State’s Toward Zero Deaths targets for roadway safety in 2018. The State is currently updating targets for 2019; MTC will determine how to proceed with regards to 2019 targets in the fall.
Rate of Fatalities on Roads 2. Road fatalities per VMT Annual State: annually in August
MPO: annually in February
Number of Serious Injuries on Roads 3. Total number of serious injuries on roads Annual State: annually in August
MPO: annually in February
Rate of Serious Injuries on Roads 4. Serious injuries on roads per VMT Annual State: annually in August
MPO: annually in February
Non-Motorized Safety on Roads
5. Combined total number of non-motorized fatalities and serious injuries Annual State: annually in August
MPO: annually in February
Safety of Public Transit Systems
6. Total number of reportable transit fatalities 7. Reportable transit fatalities per RVM by mode
(example below) a. Motor bus b. Light rail c. Heavy rail d. etc.
8. Total number of reportable transit injuries 9. Reportable transit injuries per RVM by mode
(example below) a. Motor bus b. Light rail c. Heavy rail d. etc.
10. Total number of reportable transit safety events 11. Reportable transit safety events per RVM by
mode (example below) a. Motor bus b. Light rail c. Heavy rail d. etc.
12. Mean distance between major mechanical failures by mode (example below)
a. Motor bus b. Light rail c. Heavy rail d. etc.
Annual
Operators: TBD* MPO: TBD* * = measures approved in January 2017 regulatory action but transit & MPO safety target-setting requirements are slated for additional regulation later this year
On hold pending secondary rule process and establishment of deadlines. Operators will likely have 3 months to set targets, followed by 6 months for MTC to set regional targets.
FEDERAL GOALS & PROGRAMS
GENERAL MEASURES IN LAW
FINAL PERFORMANCE MEASURES TARGET-SETTING FREQUENCY
TARGET-SETTING DUE DATES CURRENT STATUS
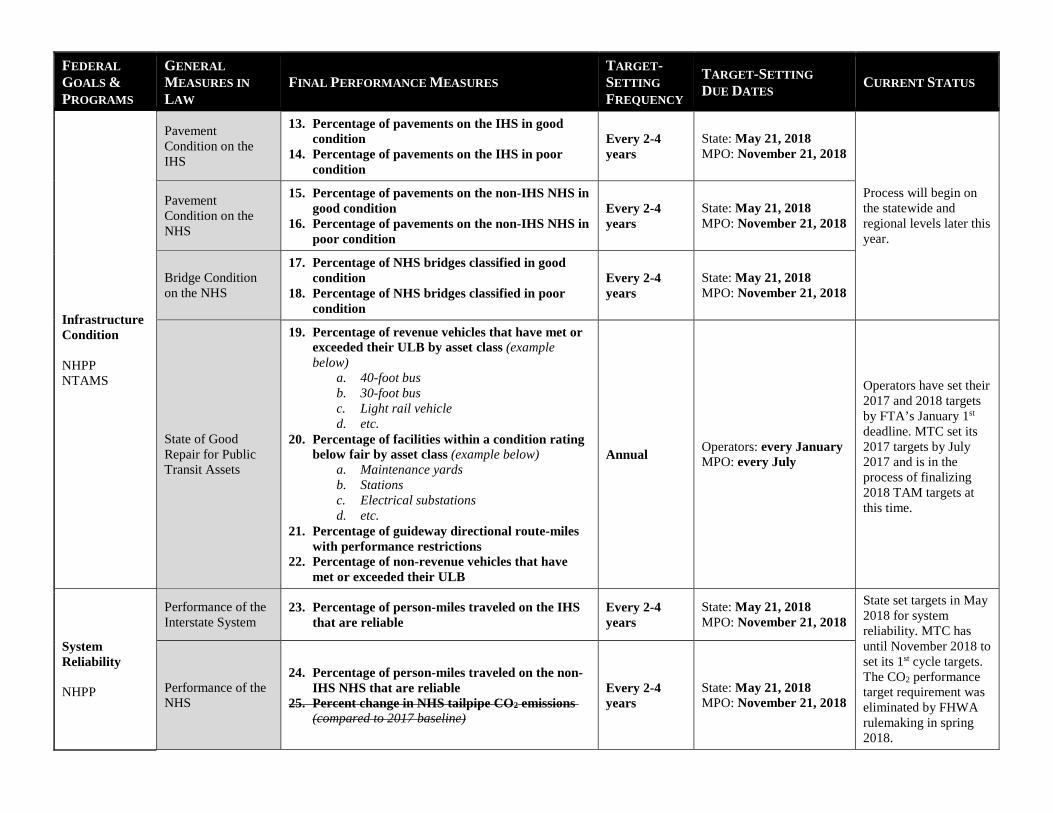
Infrastructure Condition NHPP NTAMS
Pavement Condition on the IHS
13. Percentage of pavements on the IHS in good condition
14. Percentage of pavements on the IHS in poor condition
Every 2-4 years
State: May 21, 2018 MPO: November 21, 2018
Process will begin on the statewide and regional levels later this year.
Pavement Condition on the NHS
15. Percentage of pavements on the non-IHS NHS in good condition
16. Percentage of pavements on the non-IHS NHS in poor condition
Every 2-4 years
State: May 21, 2018 MPO: November 21, 2018
Bridge Condition on the NHS
17. Percentage of NHS bridges classified in good condition
18. Percentage of NHS bridges classified in poor condition
Every 2-4 years
State: May 21, 2018 MPO: November 21, 2018
State of Good Repair for Public Transit Assets
19. Percentage of revenue vehicles that have met or exceeded their ULB by asset class (example below)
a. 40-foot bus b. 30-foot bus c. Light rail vehicle d. etc.
20. Percentage of facilities within a condition rating below fair by asset class (example below)
a. Maintenance yards b. Stations c. Electrical substations d. etc.
21. Percentage of guideway directional route-miles with performance restrictions
22. Percentage of non-revenue vehicles that have met or exceeded their ULB
Annual Operators: every January MPO: every July
Operators have set their 2017 and 2018 targets by FTA’s January 1st deadline. MTC set its 2017 targets by July 2017 and is in the process of finalizing 2018 TAM targets at this time.
System Reliability NHPP
Performance of the Interstate System
23. Percentage of person-miles traveled on the IHS that are reliable
Every 2-4 years
State: May 21, 2018 MPO: November 21, 2018
State set targets in May 2018 for system reliability. MTC has until November 2018 to set its 1st cycle targets. The CO2 performance target requirement was eliminated by FHWA rulemaking in spring 2018.
Performance of the NHS
24. Percentage of person-miles traveled on the non-IHS NHS that are reliable
25. Percent change in NHS tailpipe CO2 emissions (compared to 2017 baseline)
Every 2-4 years
State: May 21, 2018 MPO: November 21, 2018

Summary of Key Acronyms:
VMT: vehicle miles traveled RVM: revenue vehicle miles IHS: Interstate Highway System NHS: National Highway System
ULB: useful life benchmark CO2: carbon dioxide
SOV: single-occupant vehicle UA: urbanized area
PM: particulate matter CO: carbon monoxide VOC: volatile organic compounds NOx: nitrogen oxides
FEDERAL GOALS & PROGRAMS
GENERAL MEASURES IN LAW
FINAL PERFORMANCE MEASURES TARGET-SETTING FREQUENCY
TARGET-SETTING DUE DATES CURRENT STATUS
Freight Movement and Economic Vitality NHFP
Freight Movement on the Interstate System
26. Percentage of IHS mileage providing reliable truck travel times
Every 2-4 years
State: May 21, 2018 MPO: November 21, 2018
State set targets in May 2018 for freight movement. MTC has until November 2018 to set its 1st cycle targets.
Congestion Reduction CMAQ
Traffic Congestion
27. Annual hours of peak-hour excessive delay per capita by urbanized area
a. San Francisco-Oakland UA b. San Jose UA c. Concord UA** d. Santa Rosa UA** e. Antioch UA**
28. Percent of non-SOV travel by urbanized area a. San Francisco-Oakland UA b. San Jose UA c. Concord UA** d. Santa Rosa UA** e. Antioch UA**
** = not required during 1st target-setting cycle
Every 2 years State: May 21, 2018 MPO: May 21, 2018
State & MTC set targets in May 2018 for PHED and non-SOV travel.
Environmental Sustainability CMAQ
On-Road Mobile Source Emissions
29. Total emissions reductions from CMAQ-funded projects by pollutant
a. PM2.5 b. PM10 c. CO d. VOC e. NOx
Every 2 years State: May 21, 2018 MPO: November 21, 2018
State set targets in May 2018 for CMAQ emissions reductions. MTC has until November 2018 to set its 1st cycle targets.
Reduced Project Delivery Delays
none none (neither MAP-21 nor FAST included performance measures for this goal)
n/a n/a n/a