Embed Size (px)
Citation preview
IMPORTANT DISCLOSURES APPEAR AT THE BACK OF THIS REPORT� 1
Tip ITALY / Investment company
Company update
BUY (Unchanged) Target: € 2.40 (Prev. € 2.25) Risk: High
STOCK DATA
Price € 2.27
Bloomberg code TIP IM
Market Cap. (€ mn) 293
Free Float 100%
Shares Out. (mn) 129.2
52-week range 1.47 - 2.6
Daily Volumes ('000) 278
PERFORMANCE 1M 3M 12M
Absolute -1.7% 3.7% 51.8%
Rel. to FTSE all shares -9.2% -0.2% 38.2%
MAIN METRICS 2012 2013E 2014E
EPS - € cents 6.9 23.6 3.0
DPS ord - € cents 4.1 8.1 4.1
NAV 2012 2013E 2014E
Nav ps Adj - € 1.9 2.3 2.4
MULTIPLES 2012 2013E 2014E
PNAV Adj. 0.8 1.0 0.9
PBV 0.9 1.2 1.1
INDEBTEDNESS 2012 2013E 2014E
NFP 1.9 -18.5 -32.7
D/E n.m. 0.1 0.1
Debt to assets n.m. 0.1 0.1
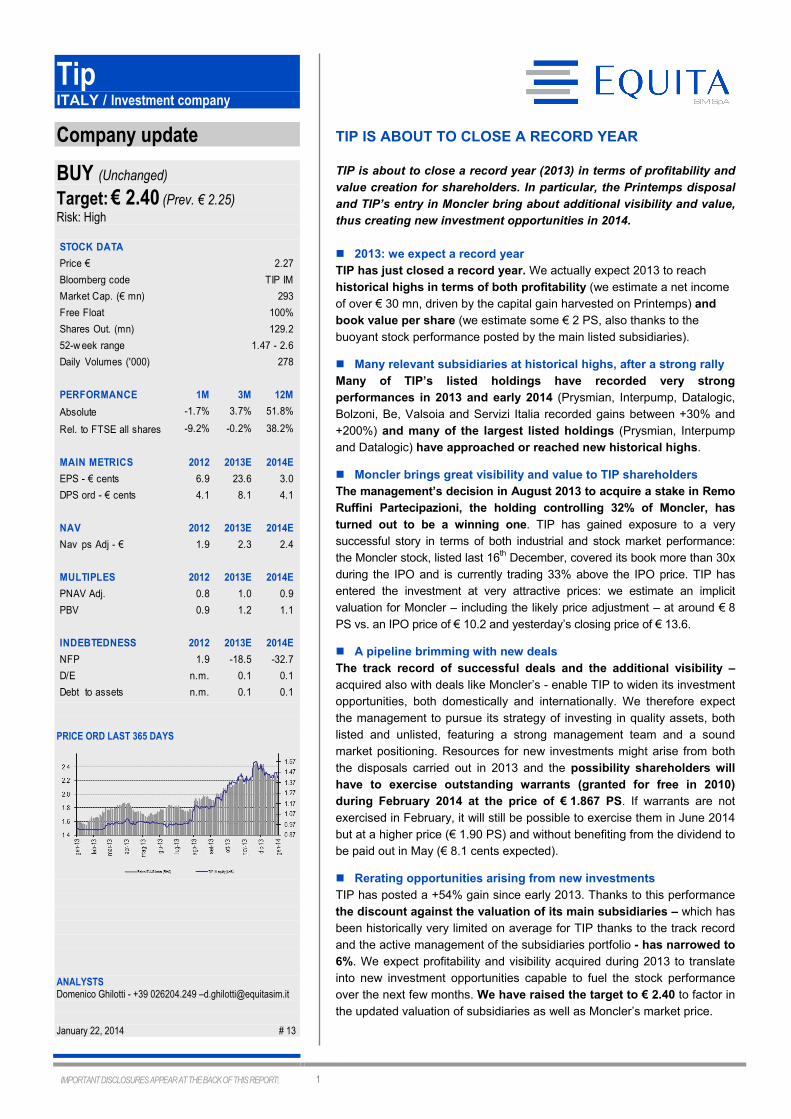
PRICE ORD LAST 365 DAYS
ANALYSTS Domenico Ghilotti - +39 026204.249 –[email protected] January 22, 2014 # 13
TIP IS ABOUT TO CLOSE A RECORD YEAR
TIP is about to close a record year (2013) in terms of profitability and
value creation for shareholders. In particular, the Printemps disposal
and TIP’s entry in Moncler bring about additional visibility and value,
thus creating new investment opportunities in 2014.
� 2013: we expect a record year
TIP has just closed a record year. We actually expect 2013 to reach
historical highs in terms of both profitability (we estimate a net income
of over € 30 mn, driven by the capital gain harvested on Printemps) and
book value per share (we estimate some € 2 PS, also thanks to the
buoyant stock performance posted by the main listed subsidiaries).
� Many relevant subsidiaries at historical highs, after a strong rally
Many of TIP’s listed holdings have recorded very strong
performances in 2013 and early 2014 (Prysmian, Interpump, Datalogic,
Bolzoni, Be, Valsoia and Servizi Italia recorded gains between +30% and
+200%) and many of the largest listed holdings (Prysmian, Interpump
and Datalogic) have approached or reached new historical highs.
� Moncler brings great visibility and value to TIP shareholders
The management’s decision in August 2013 to acquire a stake in Remo
Ruffini Partecipazioni, the holding controlling 32% of Moncler, has
turned out to be a winning one. TIP has gained exposure to a very
successful story in terms of both industrial and stock market performance:
the Moncler stock, listed last 16th December, covered its book more than 30x
during the IPO and is currently trading 33% above the IPO price. TIP has
entered the investment at very attractive prices: we estimate an implicit
valuation for Moncler – including the likely price adjustment – at around € 8
PS vs. an IPO price of € 10.2 and yesterday’s closing price of € 13.6.
� A pipeline brimming with new deals
The track record of successful deals and the additional visibility –
acquired also with deals like Moncler’s - enable TIP to widen its investment
opportunities, both domestically and internationally. We therefore expect
the management to pursue its strategy of investing in quality assets, both
listed and unlisted, featuring a strong management team and a sound
market positioning. Resources for new investments might arise from both
the disposals carried out in 2013 and the possibility shareholders will
have to exercise outstanding warrants (granted for free in 2010)
during February 2014 at the price of € 1.867 PS. If warrants are not
exercised in February, it will still be possible to exercise them in June 2014
but at a higher price (€ 1.90 PS) and without benefiting from the dividend to
be paid out in May (€ 8.1 cents expected).
� Rerating opportunities arising from new investments
TIP has posted a +54% gain since early 2013. Thanks to this performance
the discount against the valuation of its main subsidiaries – which has
been historically very limited on average for TIP thanks to the track record
and the active management of the subsidiaries portfolio - has narrowed to
6%. We expect profitability and visibility acquired during 2013 to translate
into new investment opportunities capable to fuel the stock performance
over the next few months. We have raised the target to € 2.40 to factor in
the updated valuation of subsidiaries as well as Moncler’s market price.
Tip – January 22, 2014
IMPORTANT DISCLOSURES APPEAR AT THE BACK OF THIS REPORT� 2
BUSINESS DESCRIPTION
TIP is an independent investment - merchant bank focused on
medium-sized companies that:
- makes minority investments - but as an active
shareholder - in listed and unlisted companies
expressing “excellence”;
- provides advisory in corporate finance operations via
Tamburi & Associati division;
- makes investments in the secondary private equity
(SPE).
TIP business model is unique in Italy because of:
- the specialisation in "excellent" small - mid caps
- the distinctive skills, experience and network
- the relevant financial resources internally available
- the capacity to leverage the financial resources via co-
investments (Club Deals)
- the professional, confidential, flexible and rapid
approach.
TIP is a public company. The top management owns an 8%
stake in the company.
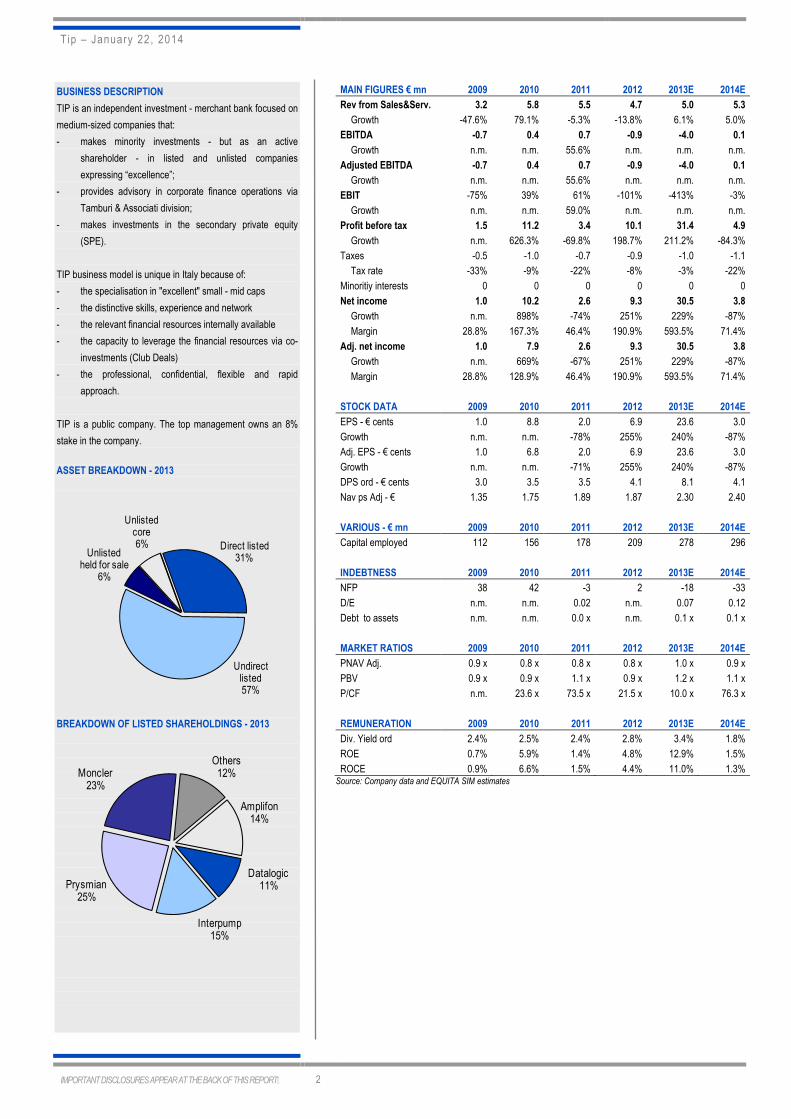
ASSET BREAKDOWN - 2013
Direct listed31%
Undirect listed57%
Unlisted held for sale
6%
Unlisted core6%
BREAKDOWN OF LISTED SHAREHOLDINGS - 2013
MAIN FIGURES € mn 2009 2010 2011 2012 2013E 2014E
Rev from Sales&Serv. 3.2 5.8 5.5 4.7 5.0 5.3
Growth -47.6% 79.1% -5.3% -13.8% 6.1% 5.0%
EBITDA -0.7 0.4 0.7 -0.9 -4.0 0.1
Growth n.m. n.m. 55.6% n.m. n.m. n.m.
Adjusted EBITDA -0.7 0.4 0.7 -0.9 -4.0 0.1
Growth n.m. n.m. 55.6% n.m. n.m. n.m.
EBIT -75% 39% 61% -101% -413% -3%
Growth n.m. n.m. 59.0% n.m. n.m. n.m.
Profit before tax 1.5 11.2 3.4 10.1 31.4 4.9
Growth n.m. 626.3% -69.8% 198.7% 211.2% -84.3%
Taxes -0.5 -1.0 -0.7 -0.9 -1.0 -1.1
Tax rate -33% -9% -22% -8% -3% -22%
Minoritiy interests 0 0 0 0 0 0
Net income 1.0 10.2 2.6 9.3 30.5 3.8
Growth n.m. 898% -74% 251% 229% -87%
Margin 28.8% 167.3% 46.4% 190.9% 593.5% 71.4%
Adj. net income 1.0 7.9 2.6 9.3 30.5 3.8
Growth n.m. 669% -67% 251% 229% -87%
Margin 28.8% 128.9% 46.4% 190.9% 593.5% 71.4%
STOCK DATA 2009 2010 2011 2012 2013E 2014E
EPS - € cents 1.0 8.8 2.0 6.9 23.6 3.0
Growth n.m. n.m. -78% 255% 240% -87%
Adj. EPS - € cents 1.0 6.8 2.0 6.9 23.6 3.0
Growth n.m. n.m. -71% 255% 240% -87%
DPS ord - € cents 3.0 3.5 3.5 4.1 8.1 4.1
Nav ps Adj - € 1.35 1.75 1.89 1.87 2.30 2.40
VARIOUS - € mn 2009 2010 2011 2012 2013E 2014E
Capital employed 112 156 178 209 278 296
INDEBTNESS 2009 2010 2011 2012 2013E 2014E
NFP 38 42 -3 2 -18 -33
D/E n.m. n.m. 0.02 n.m. 0.07 0.12
Debt to assets n.m. n.m. 0.0 x n.m. 0.1 x 0.1 x
MARKET RATIOS 2009 2010 2011 2012 2013E 2014E
PNAV Adj. 0.9 x 0.8 x 0.8 x 0.8 x 1.0 x 0.9 x
PBV 0.9 x 0.9 x 1.1 x 0.9 x 1.2 x 1.1 x
P/CF n.m. 23.6 x 73.5 x 21.5 x 10.0 x 76.3 x
REMUNERATION 2009 2010 2011 2012 2013E 2014E
Div. Yield ord 2.4% 2.5% 2.4% 2.8% 3.4% 1.8%
ROE 0.7% 5.9% 1.4% 4.8% 12.9% 1.5%
ROCE 0.9% 6.6% 1.5% 4.4% 11.0% 1.3% Source: Company data and EQUITA SIM estimates
Amplifon14%
Datalogic11%
Interpump15%
Prysmian25%
Moncler23%
Others12%
TIP – January 22, 2014
IMPORTANT DISCLOSURES APPEAR AT THE BACK OF THIS REPORT� 3
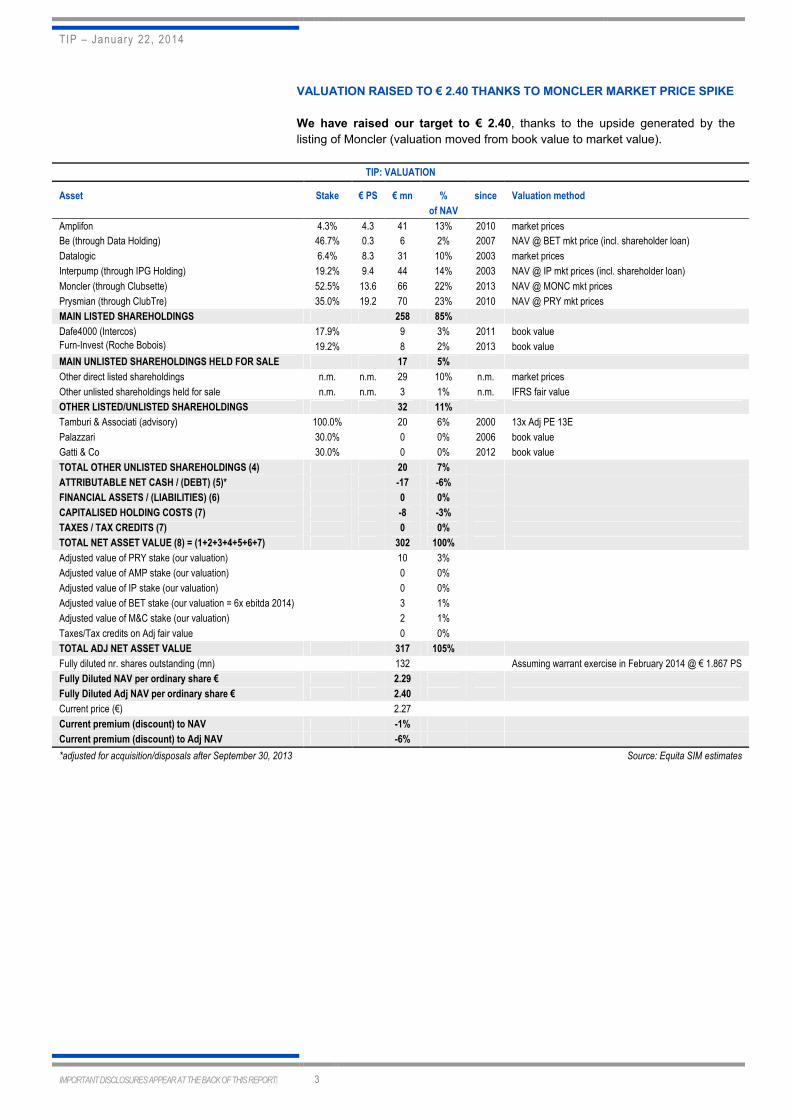
VALUATION RAISED TO € 2.40 THANKS TO MONCLER MARKET PRICE SPIKE
We have raised our target to € 2.40, thanks to the upside generated by the
listing of Moncler (valuation moved from book value to market value).
TIP: VALUATION
Asset Stake € PS € mn % since Valuation method
of NAV
Amplifon 4.3% 4.3 41 13% 2010 market prices
Be (through Data Holding) 46.7% 0.3 6 2% 2007 NAV @ BET mkt price (incl. shareholder loan)
Datalogic 6.4% 8.3 31 10% 2003 market prices
Interpump (through IPG Holding) 19.2% 9.4 44 14% 2003 NAV @ IP mkt prices (incl. shareholder loan)
Moncler (through Clubsette) 52.5% 13.6 66 22% 2013 NAV @ MONC mkt prices
Prysmian (through ClubTre) 35.0% 19.2 70 23% 2010 NAV @ PRY mkt prices
MAIN LISTED SHAREHOLDINGS 258 85%
Dafe4000 (Intercos) 17.9%
9 3% 2011 book value
Furn-Invest (Roche Bobois)
19.2% 8 2% 2013 book value
MAIN UNLISTED SHAREHOLDINGS HELD FOR SALE 17 5%
Other direct listed shareholdings n.m. n.m. 29 10% n.m. market prices
Other unlisted shareholdings held for sale n.m. n.m. 3 1% n.m. IFRS fair value
OTHER LISTED/UNLISTED SHAREHOLDINGS 32 11%
Tamburi & Associati (advisory) 100.0%
20 6% 2000 13x Adj PE 13E
Palazzari 30.0%
0 0% 2006 book value
Gatti & Co 30.0%
0 0% 2012 book value
TOTAL OTHER UNLISTED SHAREHOLDINGS (4) 20 7%
ATTRIBUTABLE NET CASH / (DEBT) (5)* -17 -6%
FINANCIAL ASSETS / (LIABILITIES) (6) 0 0%
CAPITALISED HOLDING COSTS (7) -8 -3%
TAXES / TAX CREDITS (7) 0 0%
TOTAL NET ASSET VALUE (8) = (1+2+3+4+5+6+7) 302 100%
Adjusted value of PRY stake (our valuation)
10 3%
Adjusted value of AMP stake (our valuation)
0 0%
Adjusted value of IP stake (our valuation)
0 0%
Adjusted value of BET stake (our valuation = 6x ebitda 2014)
3 1%
Adjusted value of M&C stake (our valuation)
2 1%
Taxes/Tax credits on Adj fair value
0 0%
TOTAL ADJ NET ASSET VALUE 317 105%
Fully diluted nr. shares outstanding (mn)
132
Assuming warrant exercise in February 2014 @ € 1.867 PS
Fully Diluted NAV per ordinary share € 2.29
Fully Diluted Adj NAV per ordinary share € 2.40
Current price (€)
2.27
Current premium (discount) to NAV -1%
Current premium (discount) to Adj NAV -6%
*adjusted for acquisition/disposals after September 30, 2013
Source: Equita SIM estimates
TIP – January 22, 2014
IMPORTANT DISCLOSURES APPEAR AT THE BACK OF THIS REPORT� 4
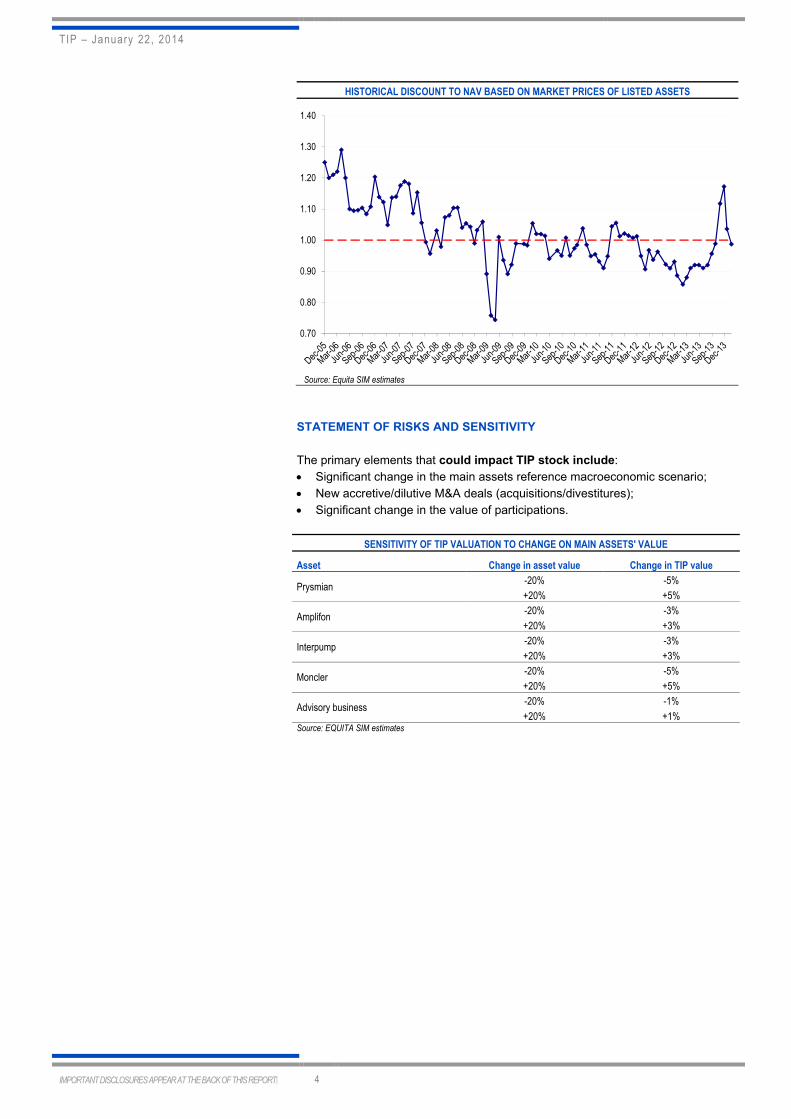
HISTORICAL DISCOUNT TO NAV BASED ON MARKET PRICES OF LISTED ASSETS
Source: Equita SIM estimates
STATEMENT OF RISKS AND SENSITIVITY
The primary elements that could impact TIP stock include:
• Significant change in the main assets reference macroeconomic scenario;
• New accretive/dilutive M&A deals (acquisitions/divestitures);
• Significant change in the value of participations.
SENSITIVITY OF TIP VALUATION TO CHANGE ON MAIN ASSETS' VALUE
Asset Change in asset value Change in TIP value
Prysmian -20% -5%
+20% +5%
Amplifon -20% -3%
+20% +3%
Interpump -20% -3%
+20% +3%
Moncler -20% -5%
+20% +5%
Advisory business -20% -1%
+20% +1% Source: EQUITA SIM estimates
0.70
0.80
0.90
1.00
1.10
1.20
1.30
1.40
TIP – January 22, 2014
IMPORTANT DISCLOSURES APPEAR AT THE BACK OF THIS REPORT� 5
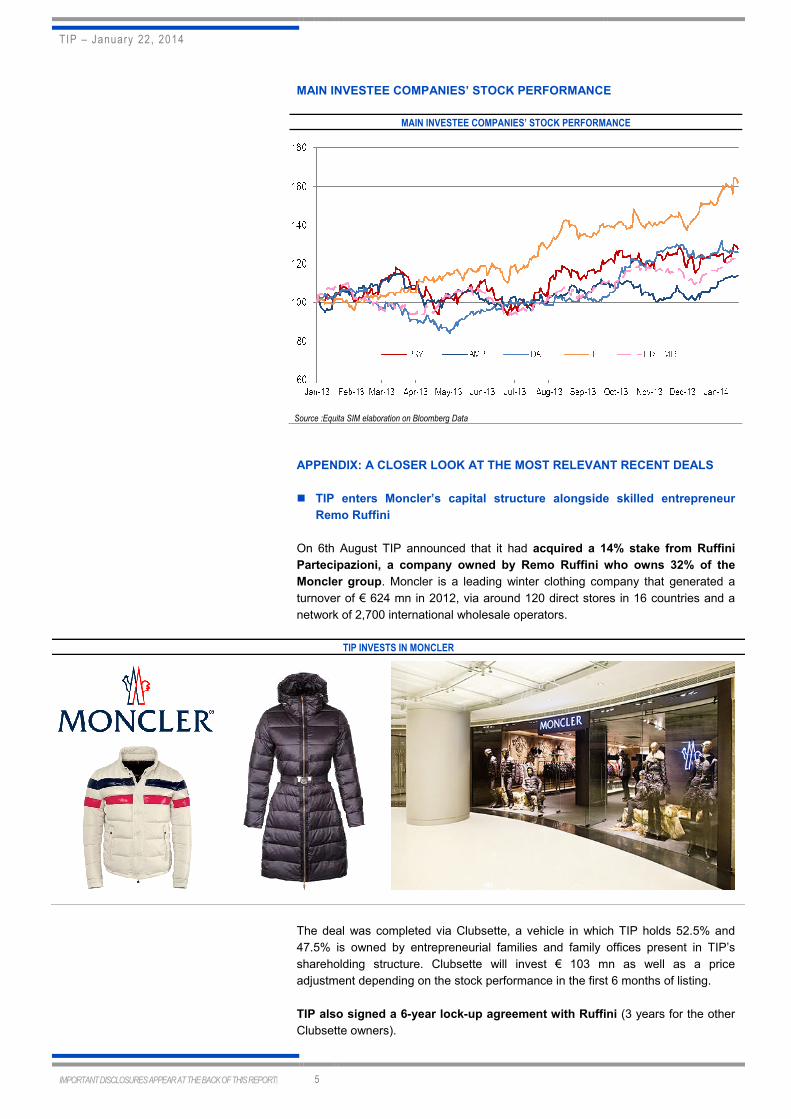
MAIN INVESTEE COMPANIES’ STOCK PERFORMANCE
MAIN INVESTEE COMPANIES’ STOCK PERFORMANCE
Source :Equita SIM elaboration on Bloomberg Data
APPENDIX: A CLOSER LOOK AT THE MOST RELEVANT RECENT DEALS
� TIP enters Moncler’s capital structure alongside skilled entrepreneur
Remo Ruffini
On 6th August TIP announced that it had acquired a 14% stake from Ruffini
Partecipazioni, a company owned by Remo Ruffini who owns 32% of the
Moncler group. Moncler is a leading winter clothing company that generated a
turnover of € 624 mn in 2012, via around 120 direct stores in 16 countries and a
network of 2,700 international wholesale operators.
TIP INVESTS IN MONCLER
The deal was completed via Clubsette, a vehicle in which TIP holds 52.5% and
47.5% is owned by entrepreneurial families and family offices present in TIP’s
shareholding structure. Clubsette will invest € 103 mn as well as a price
adjustment depending on the stock performance in the first 6 months of listing.
TIP also signed a 6-year lock-up agreement with Ruffini (3 years for the other
Clubsette owners).
TIP – January 22, 2014
IMPORTANT DISCLOSURES APPEAR AT THE BACK OF THIS REPORT� 6
Under the helm of Remo Ruffini, who bought the brand in 2003, Moncler has
become known for the rapid growth of its turnover (3-year sales cagr above +20%)
and profitability (3-year EBITDA cagr close to +30%) and its position amongst the
world’s most prestigious brands.
We think Moncler is a very attractive investment. TIP has made a long term
commitment of considerable proportions (€ 54 mn for TIP) alongside a
talented businessman in order to support him in the next stage of the
group’s expansion.
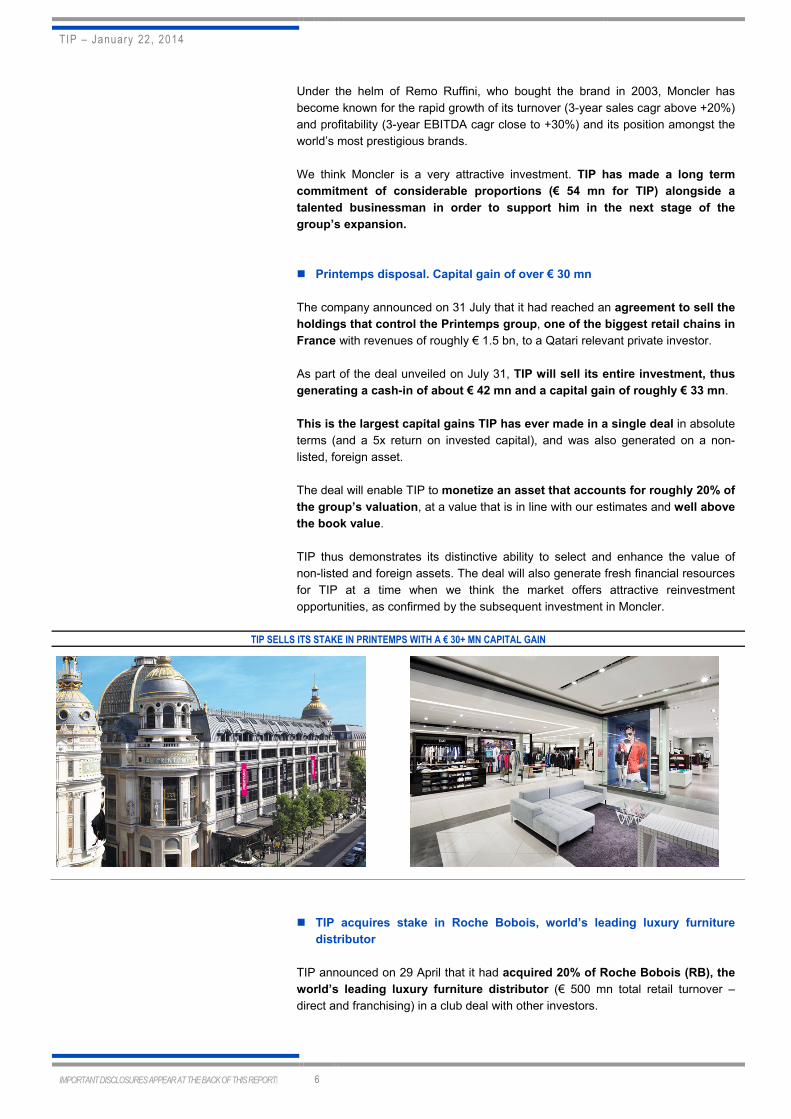
� Printemps disposal. Capital gain of over € 30 mn
The company announced on 31 July that it had reached an agreement to sell the
holdings that control the Printemps group, one of the biggest retail chains in
France with revenues of roughly € 1.5 bn, to a Qatari relevant private investor.
As part of the deal unveiled on July 31, TIP will sell its entire investment, thus
generating a cash-in of about € 42 mn and a capital gain of roughly € 33 mn.
This is the largest capital gains TIP has ever made in a single deal in absolute
terms (and a 5x return on invested capital), and was also generated on a non-
listed, foreign asset.
The deal will enable TIP to monetize an asset that accounts for roughly 20% of
the group’s valuation, at a value that is in line with our estimates and well above
the book value.
TIP thus demonstrates its distinctive ability to select and enhance the value of
non-listed and foreign assets. The deal will also generate fresh financial resources
for TIP at a time when we think the market offers attractive reinvestment
opportunities, as confirmed by the subsequent investment in Moncler.
TIP SELLS ITS STAKE IN PRINTEMPS WITH A € 30+ MN CAPITAL GAIN
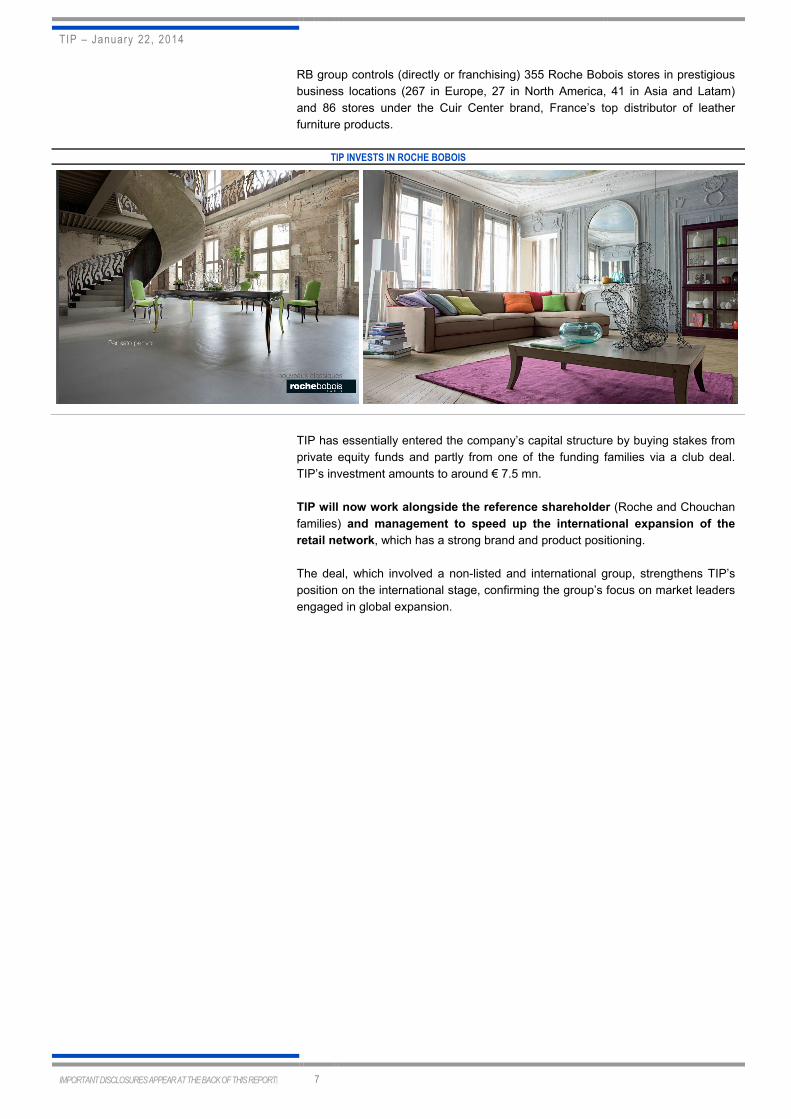
� TIP acquires stake in Roche Bobois, world’s leading luxury furniture
distributor
TIP announced on 29 April that it had acquired 20% of Roche Bobois (RB), the
world’s leading luxury furniture distributor (€ 500 mn total retail turnover –
direct and franchising) in a club deal with other investors.
TIP – January 22, 2014
IMPORTANT DISCLOSURES APPEAR AT THE BACK OF THIS REPORT� 7
RB group controls (directly or franchising) 355 Roche Bobois stores in prestigious
business locations (267 in Europe, 27 in North America, 41 in Asia and Latam)
and 86 stores under the Cuir Center brand, France’s top distributor of leather
furniture products.
TIP INVESTS IN ROCHE BOBOIS
TIP has essentially entered the company’s capital structure by buying stakes from
private equity funds and partly from one of the funding families via a club deal.
TIP’s investment amounts to around € 7.5 mn.
TIP will now work alongside the reference shareholder (Roche and Chouchan
families) and management to speed up the international expansion of the
retail network, which has a strong brand and product positioning.
The deal, which involved a non-listed and international group, strengthens TIP’s
position on the international stage, confirming the group’s focus on market leaders
engaged in global expansion.
TIP – January 22, 2014
IMPORTANT DISCLOSURES APPEAR AT THE BACK OF THIS REPORT� 8
INFORMATION PURSUANT TO ARTICLE 69 ET SEQ. OF CONSOB (Italian securities & exchange commission) REGULATION no. 11971/1999 This publication has been prepared by Domenico Ghilotti on behalf of EQUITA SIM SpA (licensed to practice by CONSOB resolution no. 11761 of December 22nd 1998 and registered as no. 67 in the Italian central register of investment service companies and financial intermediaries)
In the past EQUITA SIM has published studies on TIP.
EQUITA SIM is distributing this publication to more than 700 qualified operators from January 23, 2014
The prices of the financial instruments shown in the report are the reference prices posted on the day before publication of the same. EQUITA SIM intends to provide continuous coverage of the financial instrument forming the subject of the present publication, with a semi-annual frequency and, in any case, with a frequency consistent with the timing of the issuer’s periodical financial reporting and of any exceptional event occurring in the issuer’s sphere of activity. The information contained in this publication is based on sources believed to be reliable. Although EQUITA SIM makes every reasonable endeavour to obtain information from sources that it deems to be reliable, it accepts no responsibility or liability as to the completeness, accuracy or exactitude of such information. If there are doubts in this respect, EQUITA SIM clearly highlights this circumstance. The most important sources of information used are the issuer’s public corporate documentation (such as, for example, annual and interim reports, press releases, and presentations) besides information made available by financial service companies (such as, for example, Bloomberg and Reuters) and domestic and international business publications. It is EQUITA SIM’s practice to submit a pre-publication draft of its reports for review to the Investor Relations Department of the issuer forming the subject of the report, solely for the purpose of correcting any inadvertent material inaccuracies. This note has been submitted to the issuer. EQUITA SIM has adopted internal procedures able to assure the independence of its financial analysts and that establish appropriate rules of conduct for them.
Furthermore, it is pointed out that EQUITA SIM SpA is an intermediary licensed to provide all investment services as per Italian Legislative Decree no. 58/1998. Given this, EQUITA SIM might hold positions in and execute transactions concerning the financial instruments covered by the present publication, or could provide, or wish to provide, investment and/or related services to the issuers of the financial instruments covered by this publication. Consequently, it might have a potential conflict of interest concerning the issuers, financial issuers and transactions forming the subject of the present publication.
Equita SIM S.p.A. performs, or has performed in the last 12 months, the role of intermediary in charge of the execution of the buy back plan approved by the shareholders' meeting of Tamburi Investment Partners Equita SIM S.p.A. performs, or has performed in the last 12 months, the role of specialist for financial instruments issued by Tamburi Investment Partners
In addition, it is also pointed out that, within the constraints of current internal procedures, EQUITA SIM’s directors, employees and/or outside professionals might hold long or short positions in the financial instruments covered by this publication and buy or sell them at any time, both on their own account and that of third parties.
The remuneration of the financial analysts who have produced the publication is not directly linked to corporate finance transactions undertaken by EQUITA SIM.
The recommendations to BUY, HOLD and REDUCE are based on Expected Total Return (ETR – expected absolute performance in the next 12 months inclusive of the dividend paid out by the stock’s issuer) and on the degree of risk associated with the stock, as per the matrix shown in the table. The level of risk is based on the stock’s liquidity and volatility and on the analyst’s opinion of the business model of the company being analysed. Due to fluctuations of the stock, the ETR might temporarily fall outside the ranges shown in the table.
EXPECTED TOTAL RETURN FOR THE VARIOUS CATEGORIES OF RECOMMENDATION AND RISK PROFILE
RECOMMENDATION/RATING Low Risk Medium Risk High Risk
BUY ETR >= 10% ETR >= 15% ETR >= 20%
HOLD -5% <ETR< 10% -5% <ETR< 15% 0% <ETR< 20%
REDUCE ETR <= -5% ETR <= -5% ETR <= 0%
The methods preferred by EQUITA SIM to evaluate and set a value on the stocks forming the subject of the publication, and therefore the Expected Total Return in 12 months, are those most commonly used in market practice, i.e. multiples comparison (comparison with market ratios, e.g. P/E, EV/EBITDA, and others, expressed by stocks belonging to the same or similar sectors), or classical financial methods such as discounted cash flow (DCF) models, or others based on similar concepts. For financial stocks, EQUITA SIM also uses valuation methods based on comparison of ROE (ROEV – return on embedded value – in the case of insurance companies), cost of capital and P/BV (P/EV – ratio of price to embedded value – in the case of insurance companies).
MOST RECENT CHANGES IN RECOMMENDATION AND/OR IN TARGET PRICE (OLD ONES IN BRACKETS):
Date Rec. Target Price (€) Risk Comment
nil
DISCLAIMER The purpose of this publication is merely to provide information that is up to date and as accurate as possible. The publication does not represent to be, nor can it be construed as being, an offer or solicitation to buy, subscribe or sell financial products or instruments, or to execute any operation whatsoever concerning such products or instruments. EQUITA SIM does not guarantee any specific result as regards the information contained in the present publication, and accepts no responsibility or liability for the outcome of the transactions recommended therein or for the results produced by such transactions. Each and every investment/divestiture decision is the sole responsibility of the party receiving the advice and recommendations, who is free to decide whether or not to implement them. Therefore, EQUITA SIM and/or the author of the present publication cannot in any way be held liable for any losses, damage or lower earnings that the party using the publication might suffer following execution of transactions on the basis of the information and/or recommendations contained therein. The estimates and opinions expressed in the publication may be subject to change without notice.
EQUITY RATING DISPERSION AS OF DECEMBER 31, 2013 (art. 69-quinquies c. 2 lett. B e c. 3 reg. Consob 11971/99)
COMPANIES COVERED COMPANIES COVERED WITH BANKING RELATIONSHIP
BUY 41.3% 52.1%
HOLD 48.8% 41.7%
REDUCE 9.3% 6.3%
NOT RATED 0.6% 0.0%