Embed Size (px)
Citation preview
T. Taylor and D. N. Ford: Tipping Point Failure and Robustness 51
Published online in Wiley InterScience(www.interscience.wiley.com) DOI: 10.1002/sdr
Tipping point failure and robustness in singledevelopment projects
Tim Taylora and David N. Forda*
Abstract
Tipping point feedback structures can push a series of product development projects into fire-
fighting mode in which rework overwhelms progress. Similar dynamics also threaten the perform-
ance of individual development projects. The current work extends previous tipping point dynamicsresearch to single projects and demonstrates how a simple, common feedback structure can cause
complex tipping point dynamics, trap projects in deteriorating modes of behavior, and cause
projects to fail. Basic tipping point dynamics in single projects are described, demonstrated, andanalyzed with a model. The concept of applying robustness to project design is preliminarily
tested and system robustness to tipping point-induced failure is quantified for a simple project and
analyzed with sensitivity analysis. Impacts of tipping points on project performance and futureresearch opportunities concerning tipping point and robustness in project management are
discussed. Copyright © 2006 John Wiley & Sons, Ltd.
Syst. Dyn. Rev. 22, 51–71, (2006)
Introduction
Although development projects are pursued to create value for their developersor users, many projects fail (Evans 2005; Matta and Ashkenas 2003; Wells1999). Project failure can take many forms, including schedule and cost overrunsand unacceptable quality. Project failure is relatively easy to identify if thefinal product grossly fails to meet performance targets (e.g., some of NASA’sMars probes) or if development stops before a product is completed (e.g., theUS Department of Energy’s Supercollider project). But some projects that arecompleted should also be considered failures. An example is the ChannelTunnel (the “Chunnel”) that connects England and France. While the Chunnelis arguably one of the great engineering achievements of the last century, itsfinal cost of $17.5 billion was more than double the original estimate of $7.2billion (Kharbanda and Pinto 1996). Chunnel usage is below the level estim-ated in the project’s feasibility study and even the most optimistic estimatespredict that the Chunnel will not be profitable in the next 10–20 years(Kharbanda and Pinto 1996). Although a technical marvel, the Chunnel failed
Tim Taylor is a PhD
Candidate in
ConstructionEngineering and
Management in the
Zachary Department ofCivil Engineering at
Texas A&M
University. He holds aBS and MS in Civil
Engineering from the
University ofKentucky. His
research interests
include strategicproject management,
real options, loop
dominance analysis,and project
robustness.
David N. Ford is a
Professor in the
ConstructionEngineering and
Management Program
in the ZacharyDepartment of Civil
Engineering at Texas
A&M University. Heteaches and researches
project dynamics and
the strategic planningand management of
development projects.
As an engineer inpractice, Dr Ford
designed and managed
government,commercial, and
residential
development projects.He received Bachelor’s
and Master’s degrees
in Civil Engineeringfrom Tulane
University and a PhD
from MIT in DynamicEngineering Systems.
System Dynamics Review Vol. 22, No. 1, (Spring 2006): 51–71Published online in Wiley InterScience(www.interscience.wiley.com) DOI: 10.1002/sdr.330Copyright © 2006 John Wiley & Sons, Ltd.
51
a Construction Engineering and Management Program, Zachary Department of Civil Engineering, Texas A&MUniversity, College Station, TX 77843-3136, U.S.A.
* Correspondence to: David N. Ford. E-mail: [email protected]
Received July 2005; Accepted January 2006
52 System Dynamics Review Volume 22 Number 1 Spring 2006
Published online in Wiley InterScience(www.interscience.wiley.com) DOI: 10.1002/sdr
to meet two of its fundamental goals: finish within budgeted funds and producea financially viable product. Failure of these large projects can have direconsequences for all parties associated with the project.
Project management research has identified many factors that can lead toproject failure, including overestimation of benefits (Evans 2005), poorstakeholder analysis (Paul 2005), and errors (Busby and Hughes 2004). Despiteconsiderable research into these factors, clearly identifying project failure isdifficult. Comparing differences between project performance and targets is astandard means of measuring project success or failure. But variations of finalproject performance from targets can be poor measures if targets are flexible.For example, U.S. Department of Energy projects are not allowed to exceedCongressionally approved cost targets. So targets are revised based on finalperformance, even in cases of gross cost overruns. If performance relative tooriginal targets is a measure of project success or failure, some Department ofEnergy projects that meet final targets should be considered failures (USGAO1996, 1997). Some organizations explicitly label such projects as failures. Forexample, as part of development improvement efforts one organization knownto the authors labeled a set of completed projects that exceeded their cost orschedule targets by 20 percent or more as “wrecks” (as in “train wrecks”). Aclear, inclusive definition of project failure is needed to study the performanceof projects. Changes over time in the work remaining to be completed canprovide an improved metric. Although these project backlogs are intendedgenerally to decrease over time, they can stagnate or grow. Projects withbacklogs that increase continuously over significant periods of time ultimatelylead to failures to meet original project targets and may be terminated. Thecurrent work defines a project as a failure when its backlog grows continuouslyover an extended period of time.1
The continuous growth of project backlogs over time can be attributed tomany different dynamic factors. Dynamic causes identified through systemdynamics include a lack of knowledge transfer between projects (Cooper et al.2002), rework (Cooper 1993a, 1993b, 1993c) and concealing rework (Ford andSterman 2003b), schedule pressure (Cooper 1994, Ford and Sterman 2003a),and “fire-fighting” (Repenning 2001). A complete dynamic hypothesis ofdevelopment project failure would include unrealistic performance targets andhow negative feedback loops that describe responses to schedule, budget, andother pressures can trigger fatal reinforcing loops through productivity losses,overstaffing, inadequate training, and other project behaviors. Other exogenouschanges that slow progress, degrade performance, and can lead to failure (e.g.,increased regulation, scope changes, temporary work stoppage) would providethe bases for additional hypotheses. The dynamic structure would alsoinclude the amplification of impacts due to delays in discovering rework thatallow problems to be passed among development phases. These and othercauses of project failure have been used in system dynamics practice andseveral have been addressed in the literature.
T. Taylor and D. N. Ford: Tipping Point Failure and Robustness 53
Published online in Wiley InterScience(www.interscience.wiley.com) DOI: 10.1002/sdr
The current work focuses on how a particular dynamic structure, tippingpoints, can cause a common project feature, ripple effects, to generate reworkand project failure. A development project’s ripple effects are the secondary ortertiary impacts of a change. Thomas and Napolitan (1994) identify indirectchanges due to ripple effects in construction projects as an important cause ofproject failure. They estimate the impacts on labor efficiency in some projectsto be seven times larger than the impacts of direct changes (p. 26). Rippleeffects can be triggered by many unplanned events or conditions, includingthe exogenous factors described above. Likewise, ripple effects can have multi-ple types of impacts, including creating more work, requiring rework in pre-viously correct work, and reducing productivity. We focus on the work effortcreated by ripple effects and disaggregate that effort into two forms: contamin-ation and adding new tasks. Contamination is work required in part of theexisting project scope2 that is created due to rework being discovered in adifferent portion of the project. For example, if, after a reinforced concretecolumn was poured the inspectors discovered that the reinforcing steel usedwas too small, part of the beams above and below the column might have tobe demolished in order to replace the column. Replacing the column (rework)requires reworking the beams even though the beams were not otherwisedefective. The column rework contaminated the adjacent beams, but did notadd any new activities to the project. In contrast to contamination, adding newtasks, as used here, creates development activities beyond the project scopedue to rework required on portions of the existing project scope. In the columnexample temporary shoring required to support the upper beams while thecolumn is replaced would be new tasks. Rework on previously created newtasks can also contaminate and add more new tasks. For example, inadequatetemporary shoring of the beams in the column example could damage adjacentfloors (contamination) and require more shoring for floor repairs (more newtasks). The critical difference between contamination and adding new tasks isthat contamination creates more rework within the existing project scope orpreviously added tasks, while adding new tasks creates development activitiesthat were not previously a part of the project. The current research focuses onadding new tasks because it can be difficult to identify during the course of aproject when created by rework and, as will be shown, can cause challengingproject behavior and failure.
Tipping points are one explanation of bifurcated system behavior such asproject backlogs that diminish and lead to success or grow and lead to failure.A tipping point is a threshold condition that, when crossed, shifts the domin-ance of the feedback loops that control a process (Sterman 2000). Systems tendto remain stable as long as conditions remain “below” the tipping point andcontrolling feedback is dominant (Sterman 2000, p. 306). But when condi-tions cross the tipping point behavior can become (temporarily) unstableand, in the case of projects, lead to failure. Social physiologists have usedtipping points to describe an unexpected spread of disease, a dramatic change

54 System Dynamics Review Volume 22 Number 1 Spring 2006
Published online in Wiley InterScience(www.interscience.wiley.com) DOI: 10.1002/sdr
in the crime rate in a city, and an increase in the number of teenage smokersdespite a campaign of increased awareness (Gladwell 2000). System dyn-amics can be used to elucidate tipping points and their impacts on systemsin several ways: (1) by specifying, formalizing, and explaining structuresthat create tipping points; (2) by describing behaviors resulting from tippingpoints; and (3) by developing policies for managing systems with tippingpoints. Here we investigate whether a combination of a tipping point structureand ripple effects can explain the failure of some large complex developmentprojects.
The current work addresses this question by examining the generation oftipping point dynamics due to adding new tasks in single development projects.More specifically, we use a tipping point structure to model projects thatinitially make progress but unexpectedly change their behavior for the worseand eventually fail. In doing so, we present tipping point dynamics as a new,potentially important factor in explaining the failure of some large develop-ment projects. The model provides a means of describing a project’s robust-ness to failure by measuring the distance of project conditions from the tippingpoint. Challenges posed by tipping points in single projects are discussed next.Then a model of a single product development project is described and used togenerate complex tipping point failure modes, followed by model analysis anda measure of project robustness. The conclusions discuss implications andresearch opportunities.
Project management challenges near tipping points
Complex development projects are difficult to manage partially because of thedynamic nature of project systems (Lyneis et al. 2001). Iterative processes,resources, and management interact to generate puzzling behaviors. For ex-ample progress can slow, stop, and even turn negative for no apparent reason.The behavior modes of increasing and then decreasing percent of work completeand increasing project backlog may be characteristic of projects that add manynew tasks in a tipping point structure. As will be shown, managers can losecontrol of the addition of new tasks and their projects if projects move beyondtipping point conditions.
Multi-project system behavior and management has been described usingtipping points. Repenning (2001) and Black and Repenning (2001) invest-igated fire-fighting in an overlapping series of product development projects.Repenning defined fire-fighting as “the unplanned allocation of engineers andother resources to fix problems discovered late in a project’s developmentcycle.” Tipping point conditions were an unstable equilibrium where smallshocks pushed the system toward one of two stable equilibriums. Similarstructures and conditions may drive some individual development projects.Many development projects are managed largely in isolation from other projects

T. Taylor and D. N. Ford: Tipping Point Failure and Robustness 55
Published online in Wiley InterScience(www.interscience.wiley.com) DOI: 10.1002/sdr
and can fail due to dynamics solely within or near the project. Therefore, theexplanation of tipping point impacts on project performance needs to beexpanded to single project design and management.
The current work expands an existing generic project model to includetipping point structures. In this way the work extends the multi-project workby Repenning (2001) and Black and Repenning (2001) to single developmentprojects. After calibration the model is used to test whether tipping pointstructures can cause project failure modes like those experienced by the nu-clear power plant construction industry. The model is then used to initiallytest the potential of robustness as a measure of project vulnerability to tippingpoint failure.
A model of project tipping point dynamics
Most traditional project management models, such as the critical path method,are linear and cannot adequately predict the effects that increased rework, con-tamination, and the addition of new tasks have on projects. In contrast,system dynamics is well suited to modeling development dynamics. Systemdynamics has a strong and established history of modeling development projectsand has been successfully applied to a variety of project management issues,including failures in fast track implementation (Ford and Sterman 1998), poorschedule performance (Abdel-Hamid 1984), and the impacts on project per-formance of changes (Rodrigues and Williams 1997; Cooper 1980, 1993a,1993b, 1993c) and concealing rework requirements (Ford and Sterman 2003a).
The model is purposefully simple relative to actual practice to expose therelationships between tipping point structures, project behavior modes, andmanagement. Therefore, although many development processes and the fea-tures of project participants and resources interact to determine project per-formance, only those features that describe a particular tipping point structure,project management policies, and the fundamental processes they impact areincluded. Simulated performances using different policies are, therefore, con-sidered relative and useful for improving understanding and developinginsights, but not sufficient for final policy design. Complete model equationsand documentation are available from the authors or at http://ceprofs.tamu.edu/dford/.
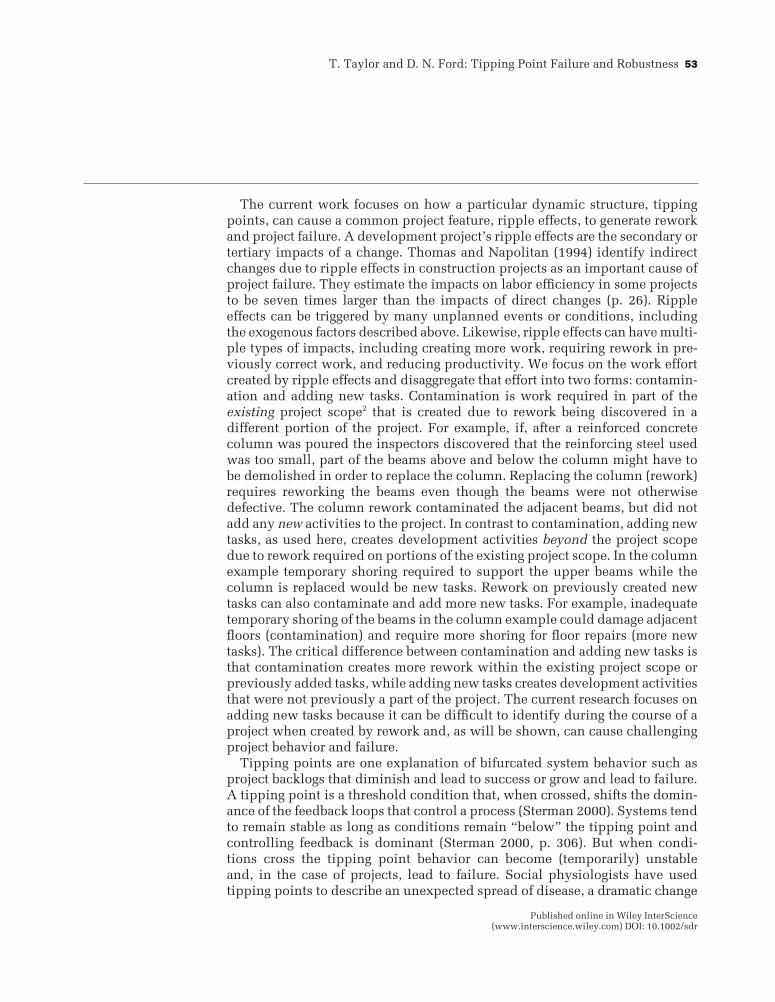
The model consists of three sectors: a workflow sector (Figure 1), a resourceallocation sector, and a schedule sector. The workflow sector is based on Fordand Sterman’s (1998) structure of a development value chain with a reworkcycle. Work is initially completed and moves from the initial completionbacklog3 (IC backlog) to the backlog of work requiring quality assurance (QAbacklog). A fraction of the work checked by quality assurance is discoveredto require change and moves into the rework backlog. Completed reworkis returned to the QA backlog for checking again because rework can reveal
56 System Dynamics Review Volume 22 Number 1 Spring 2006
Published online in Wiley InterScience(www.interscience.wiley.com) DOI: 10.1002/sdr
Fig. 1. Work flows for a single project system (based on Ford and Sterman 1998)
previously hidden rework or create new change requirements.4 The comple-ment of the checked work found to require rework passes quality assurance, isapproved, released, and adds to the stock of work approved and released(Work Released). Flows between the stocks of IC backlog, QA backlog, RWbacklog, and Work Released can be constrained by either process rates orresources. Process rates assume infinite resources and are the amounts of workavailable divided by the minimum times required to perform a work package.Resource rates are the products of the quantities of resources allocated to eachactivity and resource productivity. See Ford and Sterman (1998) for a moredetailed work flow model description and model equations.
A unique expansion of this model in the current work is the explicit modelingof adding new tasks in a tipping point structure. Adding new tasks createswork that is added to the IC backlog during a project. We assume that theamount of work created is proportional to the work discovered to requirerework:
Rnt = (Drw)(snt) (1)
where
Rnt = rate of adding new tasks due to ripple effects {work packages/week}Drw = discover rework rate {work packages/week}snt = add new tasks strength {work packages created/work packages discov-
ered, or dimensionless}

T. Taylor and D. N. Ford: Tipping Point Failure and Robustness 57
Published online in Wiley InterScience(www.interscience.wiley.com) DOI: 10.1002/sdr
The add new task strength is a project characteristic that describes the strengthof ripple effects, the amount of impact that reworked portions of the projecthave on the total work required to complete the project. This variable can beused to describe different project types. It is related to the amount of inter-dependence between project subsystems. For example, the strength betweenthe foundation and superstructure components of a building would be highcompared to the strength between the foundation and the heating system.
Resources are allocated among the initial completion, quality assurance,and rework activities proportionally based on the current demand for eachof these activities. The desired fraction of resources for each activity is thesize of the backlog compared to the project backlog (ICbacklog + QAbacklog+ RWbacklog). For example, if resource productivities are equal and thecurrent RW backlog is 40 percent of the current project backlog the desiredportion of the available resources to be allocated to the rework activity is40 percent. Applied resource fractions are delayed with a first-order exponen-tial adjustment toward the desired fractions to reflect reallocation delays.
Schedule pressure is common in development projects. Increased rework isa side effect of schedule pressure that can degrade project performance (Cooper1994; Graham 2000; Ford and Sterman 2003b).5 As a project approaches a fixeddeadline schedule pressure increases and developers increase the pace ofwork to meet the deadline. This increases the risk of work being completedincorrectly. In the schedule sector pressure increases with the time required tocomplete the project backlog (tr) and decreases with the time available tocomplete the project backlog (ta). To explicitly model the impacts of schedulepressure on tipping point dynamics we disaggregate the rework fraction (frw)into the sum of a reference rework fraction (frw-r) and the schedule-inducedrework fraction (frw-s). The reference rework fraction reflects basic projectcomplexity. The schedule-induced rework fraction is the additional fractionof work requiring change due to schedule pressure. The schedule-inducedrework fraction reflects mistakes made by developers due to pressures tomeet the project deadline. This portion of the rework fraction is modeledas the product of schedule pressure and the sensitivity of the rework frac-tion to schedule pressure (srw-s). Forgoing the functions to limit values to0–100 percent, the rework fraction becomes
frw = frw-r + frw-s = frw-r + [((tr / ta) − 1) (srw-s)] (2)
where
frw = rework fraction {dimensionless}frw-r = reference rework fraction {dimensionless}frw-s = rework fraction due to schedule pressure {dimensionless}tr = time required to complete project backlog {weeks}ta = time available to complete project backlog {weeks}srw-s = sensitivity of rework fraction to schedule pressure {dimensionless}
58 System Dynamics Review Volume 22 Number 1 Spring 2006
Published online in Wiley InterScience(www.interscience.wiley.com) DOI: 10.1002/sdr
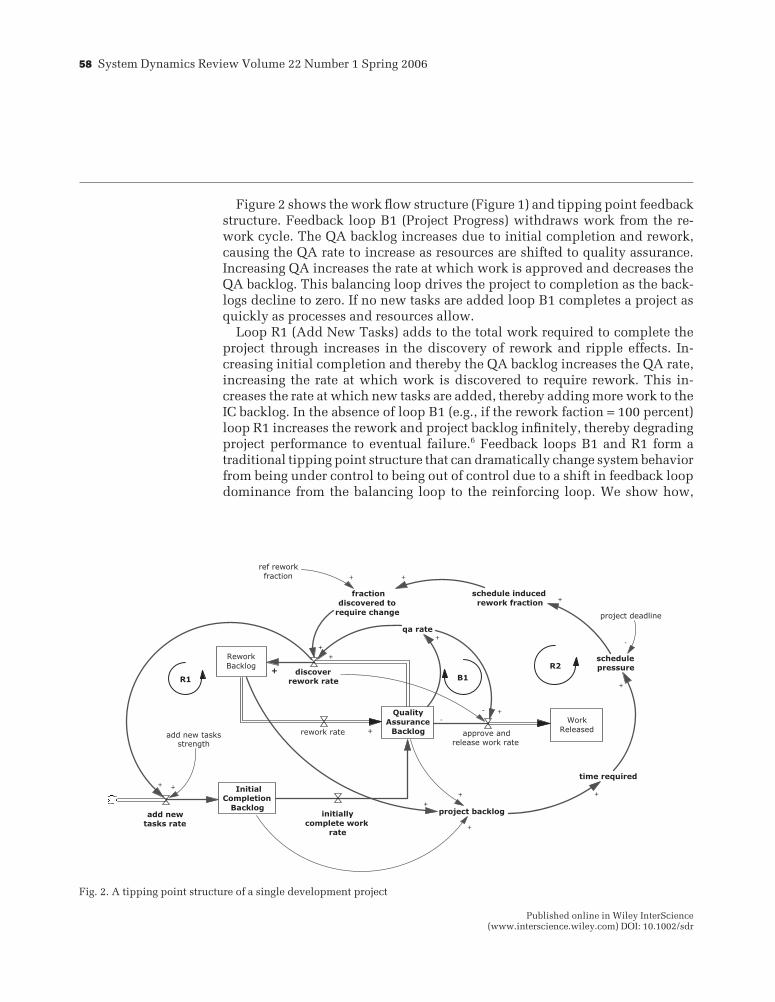
Figure 2 shows the work flow structure (Figure 1) and tipping point feedbackstructure. Feedback loop B1 (Project Progress) withdraws work from the re-work cycle. The QA backlog increases due to initial completion and rework,causing the QA rate to increase as resources are shifted to quality assurance.Increasing QA increases the rate at which work is approved and decreases theQA backlog. This balancing loop drives the project to completion as the back-logs decline to zero. If no new tasks are added loop B1 completes a project asquickly as processes and resources allow.
Loop R1 (Add New Tasks) adds to the total work required to complete theproject through increases in the discovery of rework and ripple effects. In-creasing initial completion and thereby the QA backlog increases the QA rate,increasing the rate at which work is discovered to require rework. This in-creases the rate at which new tasks are added, thereby adding more work to theIC backlog. In the absence of loop B1 (e.g., if the rework faction = 100 percent)loop R1 increases the rework and project backlog infinitely, thereby degradingproject performance to eventual failure.6 Feedback loops B1 and R1 form atraditional tipping point structure that can dramatically change system behaviorfrom being under control to being out of control due to a shift in feedback loopdominance from the balancing loop to the reinforcing loop. We show how,
Fig. 2. A tipping point structure of a single development project

T. Taylor and D. N. Ford: Tipping Point Failure and Robustness 59
Published online in Wiley InterScience(www.interscience.wiley.com) DOI: 10.1002/sdr
through exogenous manipulation of loop dominance, managers can regaincontrol of projects with tipping point structures. Loop R2 (Schedule Pressure)can increase the strength of the Add New Tasks loop (R1) by increasing therework fraction as described above. The resulting increase in a project’s back-log increases the time required to complete the project, increasing schedulepressure. This increases the schedule-induced rework fraction and thereby thefraction discovered to require rework.7
Model testing and typical behavior
The model was tested using standard methods for system dynamics models(Sterman 2000). Basing the model on previously tested project models and theliterature improves the model’s structural similarity to development processesand practices, as do unit consistency tests. Extreme condition tests were per-formed by setting model inputs, such as initial scope or total project staff, toextreme values and simulating project behavior. Model behavior remainedreasonable. The model’s behavior for typical conditions is consistent withprevious project models and practice (e.g., the common “S”-shaped increase inwork released over time). As a successful project progresses, the backlog ini-tially decreases slowly as the value chain and rework structures fill with work,the progress rate increases during stable production, and decreases to zeroslowly as backlogs empty, indicating that the project is complete. Model behaviorwas also compared to actual project behavior as described by Ford and Sterman(1998, 2003b) and Lyneis et al. (2001) and found to closely match the behaviormodes of actual projects.
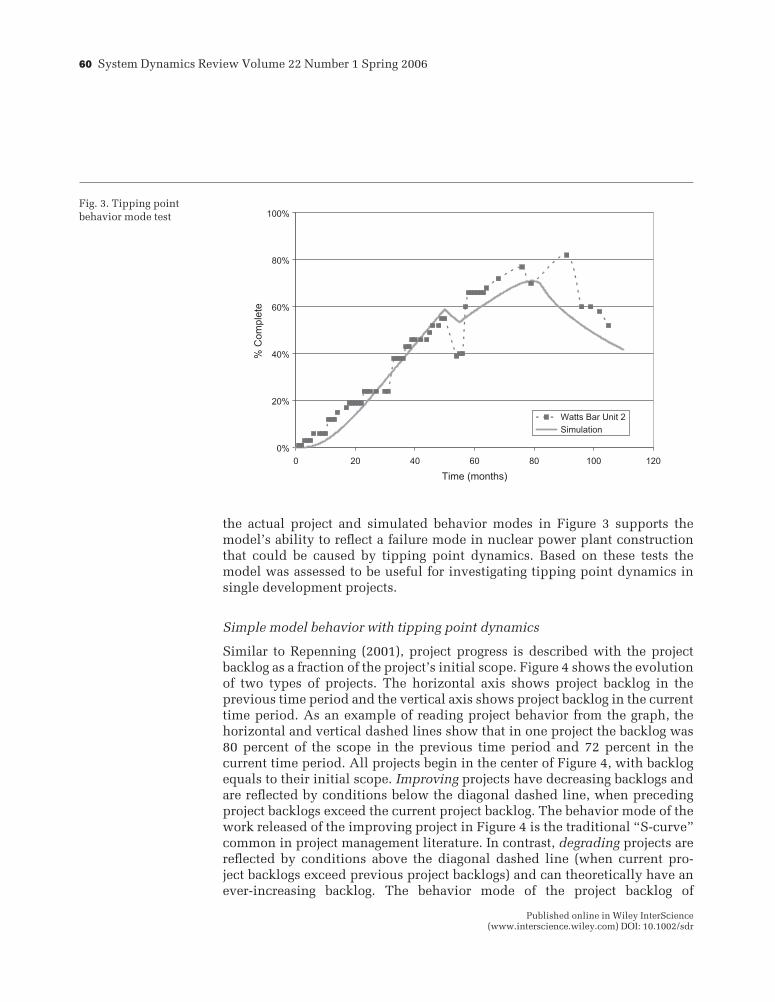
Limited project data prevented calibration to a specific project that experi-enced tipping point dynamics. Therefore, to test the ability of the model toreplicate tipping point behavior modes the model was calibrated with reason-able values to reflect a hypothetical project in which the Add New Tasks andSchedule Pressure loops are active. The simulated behavior was compared tothe behavior of the Tennessee Valley Authority (TVA) Watts Bar unit 2 project.Watts Bar unit 2 was a nuclear power plant whose construction was marred bydesign changes (rework) and the addition of work outside the original scope(addition of new tasks) (NRC 1982). See Taylor et al. (2005) for a more detaileddescription. Figure 3 shows the percent complete for the simulated project andthe Watts Bar unit 2 project, as reported to the Nuclear Regulatory Commis-sion. Degrading project performance is represented by the decreasing projectpercent complete after month 80. Construction progress reports from the WattsBar unit 2 project identify the “redesign of containment to accommodatehigher transient pressures” as the reason for a six-month increase in the ex-pected completion date (NRC 1982). Progress reports on the Limerick nuclearpower plant project, where a one-year completion delay was attributed to an“increase of scope due to design changes and new regulatory requirements”(NRC 1982), also support the tipping point hypothesis. The similarity between
60 System Dynamics Review Volume 22 Number 1 Spring 2006
Published online in Wiley InterScience(www.interscience.wiley.com) DOI: 10.1002/sdr
Fig. 3. Tipping point
behavior mode test
the actual project and simulated behavior modes in Figure 3 supports themodel’s ability to reflect a failure mode in nuclear power plant constructionthat could be caused by tipping point dynamics. Based on these tests themodel was assessed to be useful for investigating tipping point dynamics insingle development projects.
Simple model behavior with tipping point dynamics
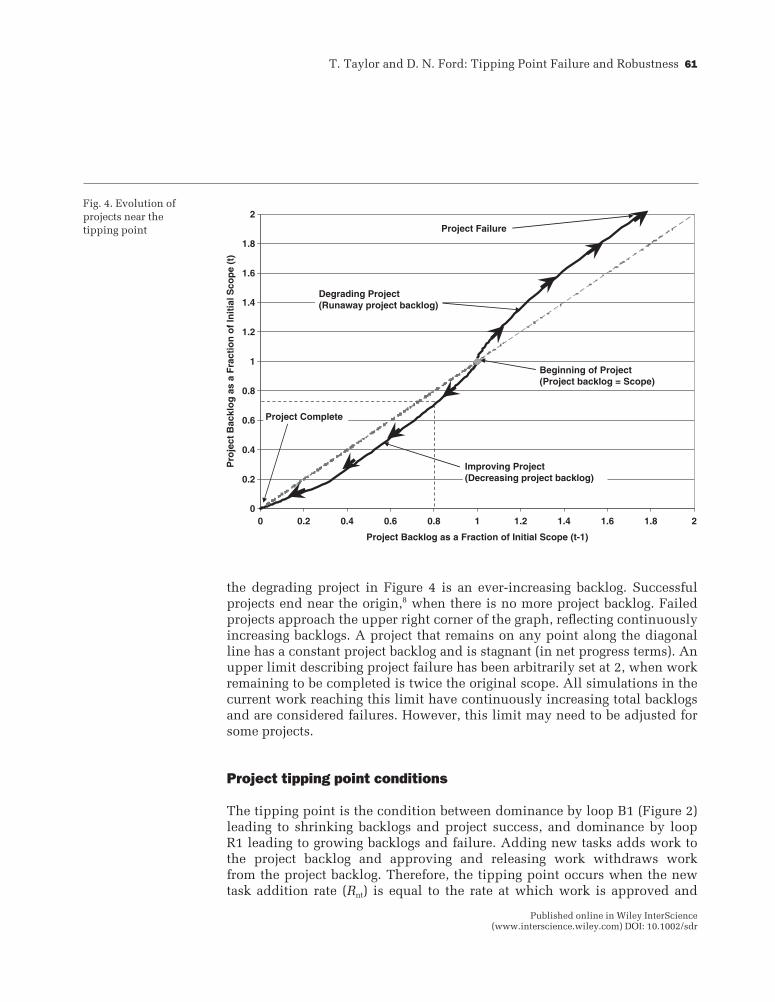
Similar to Repenning (2001), project progress is described with the projectbacklog as a fraction of the project’s initial scope. Figure 4 shows the evolutionof two types of projects. The horizontal axis shows project backlog in theprevious time period and the vertical axis shows project backlog in the currenttime period. As an example of reading project behavior from the graph, thehorizontal and vertical dashed lines show that in one project the backlog was80 percent of the scope in the previous time period and 72 percent in thecurrent time period. All projects begin in the center of Figure 4, with backlogequals to their initial scope. Improving projects have decreasing backlogs andare reflected by conditions below the diagonal dashed line, when precedingproject backlogs exceed the current project backlog. The behavior mode of thework released of the improving project in Figure 4 is the traditional “S-curve”common in project management literature. In contrast, degrading projects arereflected by conditions above the diagonal dashed line (when current pro-ject backlogs exceed previous project backlogs) and can theoretically have anever-increasing backlog. The behavior mode of the project backlog of
T. Taylor and D. N. Ford: Tipping Point Failure and Robustness 61
Published online in Wiley InterScience(www.interscience.wiley.com) DOI: 10.1002/sdr
Fig. 4. Evolution of
projects near the
tipping point
the degrading project in Figure 4 is an ever-increasing backlog. Successfulprojects end near the origin,8 when there is no more project backlog. Failedprojects approach the upper right corner of the graph, reflecting continuouslyincreasing backlogs. A project that remains on any point along the diagonalline has a constant project backlog and is stagnant (in net progress terms). Anupper limit describing project failure has been arbitrarily set at 2, when workremaining to be completed is twice the original scope. All simulations in thecurrent work reaching this limit have continuously increasing total backlogsand are considered failures. However, this limit may need to be adjusted forsome projects.
Project tipping point conditions
The tipping point is the condition between dominance by loop B1 (Figure 2)leading to shrinking backlogs and project success, and dominance by loopR1 leading to growing backlogs and failure. Adding new tasks adds work tothe project backlog and approving and releasing work withdraws workfrom the project backlog. Therefore, the tipping point occurs when the newtask addition rate (Rnt) is equal to the rate at which work is approved and
62 System Dynamics Review Volume 22 Number 1 Spring 2006
Published online in Wiley InterScience(www.interscience.wiley.com) DOI: 10.1002/sdr
released. The rate at which work is approved and released is the complementof the QA rate that is discovered to require rework (DRW).9 Therefore, at thetipping point:
Rnt = RQA − DRW (3)
where
Rnt = rate of adding new tasks due to ripple effects {work packages/week}RQA = quality assurance rate {work packages/week}DRW = discover rework rate {work packages/week}
Temporarily using the aggregate rework fraction (frw), the rework discoveryrate (DRW) is the product the QA rate (RQA) and the rework fraction. By substitu-tion using Eq. (1), Eq. (3) becomes
(snt)(RQA)(frw) = RQA − (RQA)(frw) (4)
Simplification yields a description of the conditions that define the tippingpoint.
frw (snt + 1) = 1 (5)
When the left-hand side of Eq. (5) exceeds 1 the project is degrading, when lessthan 1 the project is improving, and when equal to 1 the project is stagnant. Aproject can only remain at a tipping point (i.e., frw(snt + 1) = 1) if loop B1completes work at exactly the rate that loop R1 adds work to the projectbacklog. The project behavior will bifurcate to failure if loop R1 dominates orto success if loop B1 dominates. Therefore the tipping point is an unstableequilibrium.
Project trajectory reversal
When a project moves across the tipping point it experiences a changein project behavior from increasing to decreasing backlogs or vice versa. Werefer to this fundamental change in project behavior as a trajectory reversal.A particular form of trajectory reversal of interest to managers is when aproject initially improves but later degrades and eventually fails. Projectsin which loop B1 or R1 dominates throughout the project experience monotonictrajectories that only improve or degrade (e.g., Figure 4). These projectscannot experience trajectory reversal because there is no shift in feedback loopdominance.
Permanent exogenous increases in the rework fraction, new tasks strength,or both can cause projects to fail (Taylor et al. 2005). But, barring structuresthat prevent a full and immediate recovery of those factors, when the exogenouschange is removed the project crosses the tipping point again and can improveand be completed. In contrast, some projects may reverse trajectories and fail
T. Taylor and D. N. Ford: Tipping Point Failure and Robustness 63
Published online in Wiley InterScience(www.interscience.wiley.com) DOI: 10.1002/sdr
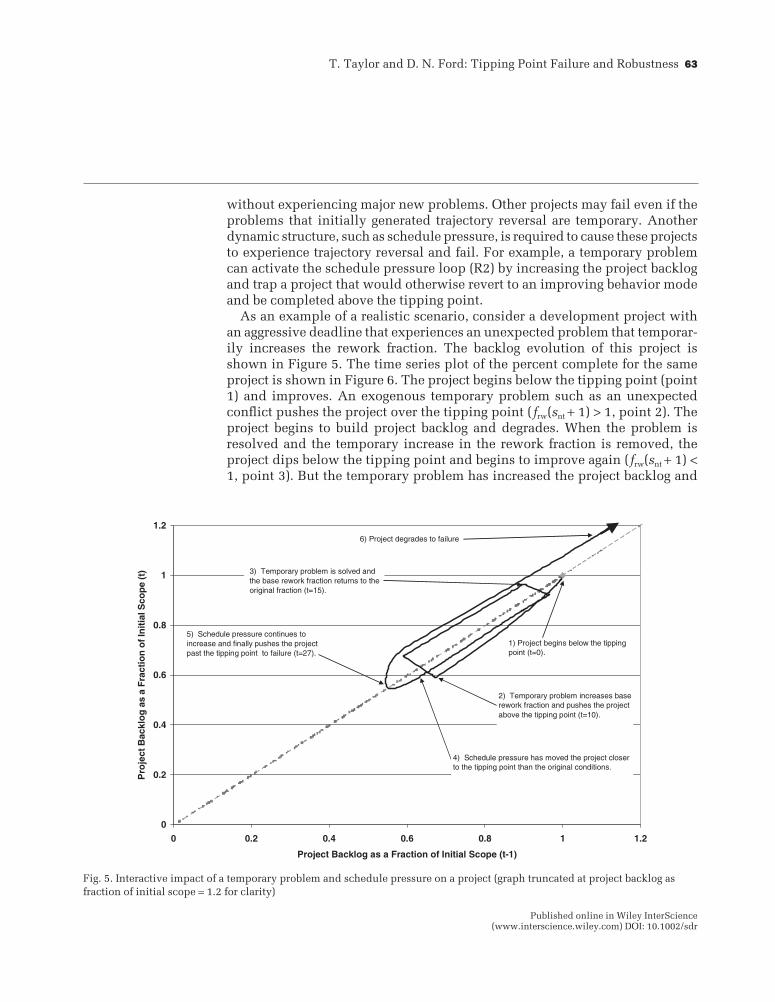
without experiencing major new problems. Other projects may fail even if theproblems that initially generated trajectory reversal are temporary. Anotherdynamic structure, such as schedule pressure, is required to cause these projectsto experience trajectory reversal and fail. For example, a temporary problemcan activate the schedule pressure loop (R2) by increasing the project backlogand trap a project that would otherwise revert to an improving behavior modeand be completed above the tipping point.
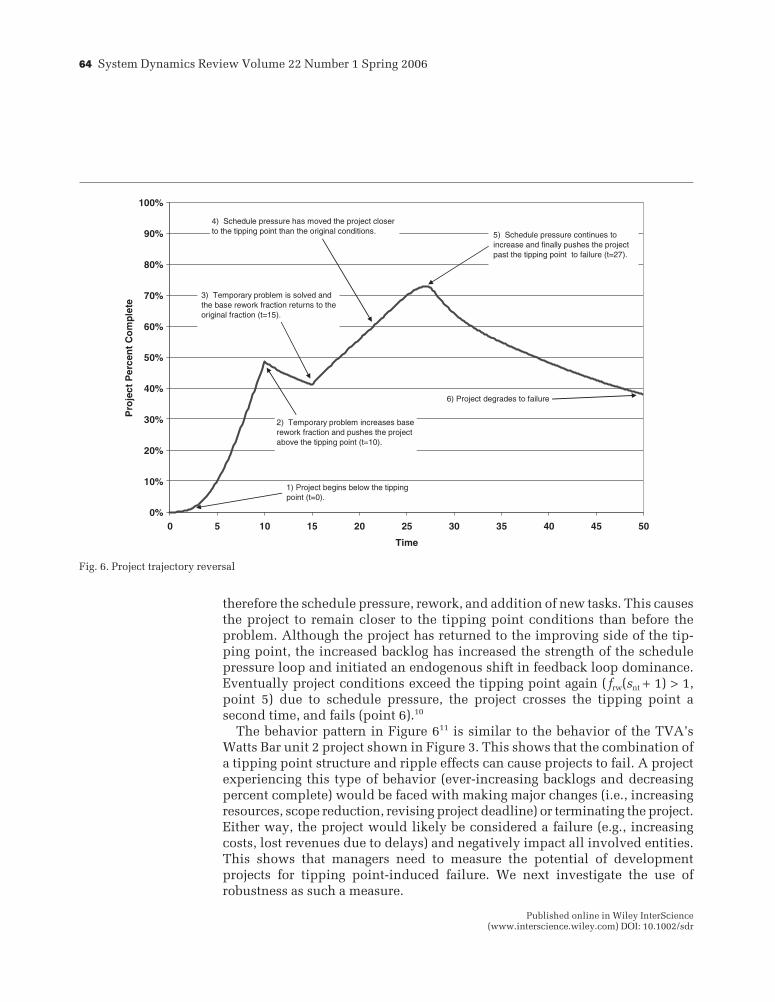
As an example of a realistic scenario, consider a development project withan aggressive deadline that experiences an unexpected problem that temporar-ily increases the rework fraction. The backlog evolution of this project isshown in Figure 5. The time series plot of the percent complete for the sameproject is shown in Figure 6. The project begins below the tipping point (point1) and improves. An exogenous temporary problem such as an unexpectedconflict pushes the project over the tipping point (frw(snt + 1) > 1, point 2). Theproject begins to build project backlog and degrades. When the problem isresolved and the temporary increase in the rework fraction is removed, theproject dips below the tipping point and begins to improve again (frw(snt + 1) <1, point 3). But the temporary problem has increased the project backlog and
Fig. 5. Interactive impact of a temporary problem and schedule pressure on a project (graph truncated at project backlog as
fraction of initial scope = 1.2 for clarity)
64 System Dynamics Review Volume 22 Number 1 Spring 2006
Published online in Wiley InterScience(www.interscience.wiley.com) DOI: 10.1002/sdr
Fig. 6. Project trajectory reversal
therefore the schedule pressure, rework, and addition of new tasks. This causesthe project to remain closer to the tipping point conditions than before theproblem. Although the project has returned to the improving side of the tip-ping point, the increased backlog has increased the strength of the schedulepressure loop and initiated an endogenous shift in feedback loop dominance.Eventually project conditions exceed the tipping point again ( frw(snt + 1) > 1,point 5) due to schedule pressure, the project crosses the tipping point asecond time, and fails (point 6).10
The behavior pattern in Figure 611 is similar to the behavior of the TVA’sWatts Bar unit 2 project shown in Figure 3. This shows that the combination ofa tipping point structure and ripple effects can cause projects to fail. A projectexperiencing this type of behavior (ever-increasing backlogs and decreasingpercent complete) would be faced with making major changes (i.e., increasingresources, scope reduction, revising project deadline) or terminating the project.Either way, the project would likely be considered a failure (e.g., increasingcosts, lost revenues due to delays) and negatively impact all involved entities.This shows that managers need to measure the potential of developmentprojects for tipping point-induced failure. We next investigate the use ofrobustness as such a measure.

T. Taylor and D. N. Ford: Tipping Point Failure and Robustness 65
Published online in Wiley InterScience(www.interscience.wiley.com) DOI: 10.1002/sdr
Robustness in project design
Taguchi et al. (2000) defines robustness as “the state where the product/process design is minimally sensitive to factors causing variability.” The re-search of robustness in new product development has been largely limited tothe robustness of the final product (Luo et al. 2005; Swan et al. 2005). Thecurrent work expands the concept of robustness to project design and meas-ures the protection that the robustness of a project provides from tipping pointfailure. An inspection of Eq. (5) suggests that, if a project starts far enough awayfrom its tipping point (i.e., frw(snt + 1) << 1) and increases in the rework fractionand addition of new tasks strength are small, the project will not cross thetipping point and will monotonically improve. However, if the magnitude ofthe changes is large enough the project could be pushed past the tipping point.By modeling robustness (rtp) as the distance between project conditions andthe tipping point Eq. (5) can be rearranged to provide an intuitive meaning ofrobustness against tipping point-induced failure:
frw + (frw * snt) + rtp = 1 (6)
where
rtp = robustness to tipping point-induced failure {dimensionless}.
The right side of Eq. (6) represents 100 percent of the project’s capacity totolerate ripple effects. This capacity has been disaggregated into the three partson the left side of Eq. (6): (1) capacity fraction absorbed by rework (frw); (2)capacity fraction absorbed by addition of new tasks (frw * snt); and (3) theunutilized capacity fraction that provides robustness (rtp). When rtp is positivethe project is below the tipping point (improving), when it is zero the project isat the tipping point (stagnant), and when it is negative the project is above thetipping point (degrading). For example, suppose a project has a fixed 20 per-cent reference rework fraction (frw-r = 0.2), no schedule pressure-induced rework(frw-s = 0), and a fixed addition of new tasks strength (snt) of 1. Applying Eq. (6),this project begins 0.6 from the tipping point (has an initial robustness of60 percent). Given these conditions the project could tolerate schedule pressure-driven increases in the rework fraction of up to 30 percent (making frw =50 percent) without crossing the tipping point.
Eq. (6) also provides a means of analyzing the effects of different variables onrobustness. Robustness can vary significantly from initial conditions during aproject. For example, schedule pressure can increase the fraction of workrequiring change ( frw) and thereby reduce robustness (Eq. 6). The minimumdistance that project conditions come to the tipping point during the projectrepresents a project’s most vulnerable conditions. Therefore, a project’s mini-mum distance from a tipping point is a better measure of a project’s robustnessthan the initial distance. Therefore we define project robustness as the minimumdistance, as a percent of the project’s capacity to avoid failure, that a project
66 System Dynamics Review Volume 22 Number 1 Spring 2006
Published online in Wiley InterScience(www.interscience.wiley.com) DOI: 10.1002/sdr
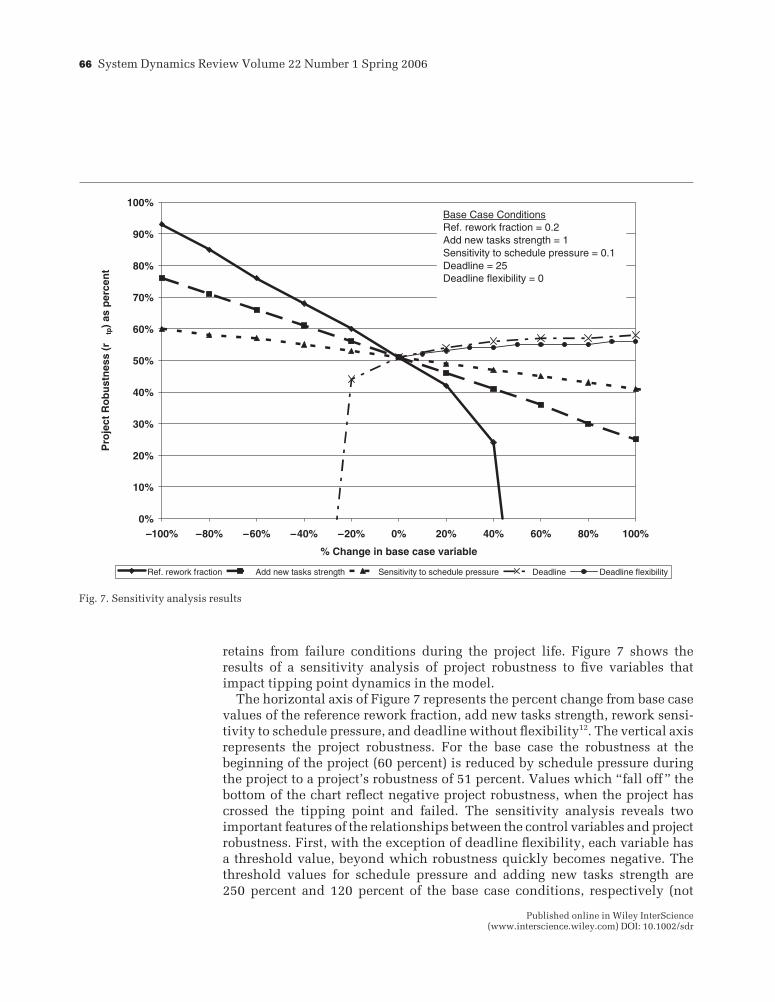
Fig. 7. Sensitivity analysis results
retains from failure conditions during the project life. Figure 7 shows theresults of a sensitivity analysis of project robustness to five variables thatimpact tipping point dynamics in the model.
The horizontal axis of Figure 7 represents the percent change from base casevalues of the reference rework fraction, add new tasks strength, rework sensi-tivity to schedule pressure, and deadline without flexibility12. The vertical axisrepresents the project robustness. For the base case the robustness at thebeginning of the project (60 percent) is reduced by schedule pressure duringthe project to a project’s robustness of 51 percent. Values which “fall off” thebottom of the chart reflect negative project robustness, when the project hascrossed the tipping point and failed. The sensitivity analysis reveals twoimportant features of the relationships between the control variables and projectrobustness. First, with the exception of deadline flexibility, each variable hasa threshold value, beyond which robustness quickly becomes negative. Thethreshold values for schedule pressure and adding new tasks strength are250 percent and 120 percent of the base case conditions, respectively (not
T. Taylor and D. N. Ford: Tipping Point Failure and Robustness 67
Published online in Wiley InterScience(www.interscience.wiley.com) DOI: 10.1002/sdr
shown for clarity). In this analysis deadline flexibility does not have a thresh-old value because the base case project succeeds with no deadline flexibility.Therefore adding flexibility cannot degrade performance. Second, withinthe robust ranges, the control levers vary in their impacts on robustness. Byinspection of Figure 7, project robustness is most sensitive to the referencerework fraction, then add new tasks strength, then rework sensitivity toschedule pressure, then deadline (inflexible), and is least sensitive to deadlineflexibility.
In practice, avoiding tipping point conditions requires manipulating highleverage points in projects to keep the project away from a tipping point. Somecurrent project management practices have this effect. For example, construc-tion project managers often use relatively simple technologies, processes, andtraining programs to constrain underlying rework fractions. They also attemptto plan projects to keep operations separate and thereby constrain the additionof new tasks. Projects to develop tightly linked products with high reworkfractions and ripple effects can potentially be designed to apply this strategythrough methods such as modular design (Baldwin and Clark 2000).
Conclusions
The role of tipping points in project failure have been described with acharacteristic behavior mode. Rework and ripple effects are used to model acommon tipping point structure in single development projects. Robustness isdefined as a project’s unused capacity to avoid tipping point-induced failure.
Results of the current work indicate that tipping point-induced project failurecan be caused by delayed side effects of temporary problems as well as reworkand strong ripple effects. Therefore the recognition and management of projecttipping point structures may be important to successful project management.Shifts in feedback loop dominance can explain tipping point dynamics, sup-porting the importance of understanding feedback and loop dominance tosuccessful project management. The underlying rework fraction was found tobe a high leverage parameter for avoiding tipping point conditions.
This work has made contributions to the application of system dynamicsto project management. The work proposed and initially tested a simple butcommon tipping point structure that can explain success and failure in singledevelopment projects. The use of shifts in feedback loop dominance to explainimportant project behavior illustrates and supports this unique system dynam-ics concept as a tool for understanding development projects as dynamicsystems. We specified and quantified robustness for a specific system andchallenge, and used it to measure the relative leverage of some project manage-ment tools. The work also advances the field of project management by furtherdeveloping the concepts of tipping point dynamics, shifts in feedback loopdominance, and robustness as they relate to development projects. The results
68 System Dynamics Review Volume 22 Number 1 Spring 2006
Published online in Wiley InterScience(www.interscience.wiley.com) DOI: 10.1002/sdr
suggest that practicing project managers should focus their efforts on featuresthat control loop dominance (e.g., rework fractions and adding new tasksstrength). By demonstrating the potential value added by adopting this appro-ach, the work can help managers appreciate how perceiving and modelingfeedback loops that drive behavior can improve project management. Theresults suggest that system dynamics researchers can improve project modelsand recommendations for improvement by developing other simple, generic,important project, structures, features and characteristics that both drivebehavior and relate to practice.
The work also contributes a preliminary test of robustness as a measure ofproject performance. Our results show that robustness may be a good measureof a project’s protection from tipping point failure. Future research in this areashould focus on operationalizing robustness for use across a wide range ofproject types. This future work could provide project managers with a methodof evaluating the failure potential of projects.
The model used in this work can be improved in several ways. Explicitly,modeling work quality would allow the investigation of policies similar toBlack and Repenning’s (2001), which releases lower-quality work. The modelcan be expanded to explicitly reflect contamination as well as the additionof new tasks and identify other tipping point structures. The model wouldalso benefit from the investigation of the impacts of undiscovered rework ontipping point dynamics. Future research can improve model structure consist-ency with actual projects and calibrate the model to practice. Multi-variantsensitivity analysis can improve the task of the linking of structure and behaviorand expand recommendations for practice. Tipping point dynamics can stronglyinfluence the behavior and performance of individual development projects,and sometimes determine success or failure. Continued improvement in theunderstanding of tipping point dynamics can lead to better development projectmanagement and performance.
Notes
1. Active projects that stagnate, with no change in project backlog over time,are also considered failures but are less common. As will be shown, theseconditions can be unstable and stagnant projects are likely to shift behaviormodes into a mode with an increasing or decreasing project backlog.
2. As used here, scope refers to the tasks, measured in work packages, that,when approved and released, provide a specified performance, and workis an amount of development effort, also measured in work packages.Rework and adding new tasks cause the work required to complete theproject to exceed its initial scope.
3. Development activity flows represent the completion of a developmenttask. Therefore backlogs, as used here, include work in progress.
T. Taylor and D. N. Ford: Tipping Point Failure and Robustness 69
Published online in Wiley InterScience(www.interscience.wiley.com) DOI: 10.1002/sdr
4. This creation of additional rework is not contamination because it repres-ents additional rework required in the same piece of work, not additionalrework required in a different piece of work.
5. Schedule pressure can have multiple beneficial and detrimental impacts onproject performance which can be modeled with additional feedback loops(see Ford 1995 for examples). The current work models only the net effectsof schedule pressure on rework and assumes the net effect is negative.
6. The loop dominance analysis discussed here is consistent with the resultsof a more rigorous analysis performed using behavioral analysis presentedin Ford (1999). See Taylor et al. (2005) for details.
7. Third and fourth reinforcing loops exist in which the IC backlog and ICrate increase the QA Backlog and thereby the QA rate and Rework Backlog.These backlogs also increase the project backlog. These loops perform likeloop R2, but instead of increasing the project backlog through the ICbacklog, it is increased through the QA and Rework Backlogs.
8. The project simulation can reach the origin, when (PBt−1, PBt) = (0,0), butactual projects stop when the backlog first reaches zero, when (PBt−1, PBt) =(x,0) and x > 0. This is represented in Figure 6 by a point on the horizontalaxis close to the origin.
9. See Rahmandad (2005) for a similar project structure with constant addi-tion of work and constrained work approval and release.
10. The simulation shown here does not account for a change in the projectcompletion date. Therefore schedule pressure keeps the project above thetipping point indefinitely. If a new completion deadline was set whenthe project failed to meet the original deadline the project might fall belowthe tipping point and improve.
11. As defined for Figure 6 the Project Percent Complete is the work releasedas a fraction of the sum of the scope and added work. The Project PercentComplete can increase if projects are just slightly beyond the tipping pointand if a large fraction of the new tasks added to the project backlog aresimultaneously being approved and released. This can be shown bydisaggregating the project backlog into the scope, total backlog added, andadded backlog that is completed.
12. Deadline Flexibility is the fraction of the deadline gap corrected each timeunit. Therefore, a completely inflexible project has Deadline Flexibility = 0and a project with an infinitely flexible deadline has Deadline Flexibility= 1. For this variable the horizontal axis reflects the value of DeadlineFlexibility.
Acknowledgement
The authors thank Prof. Kenneth Reinschmidt for assisting in the nuclear power plantinvestigation, Marsha Ward, NRC Research Librarian, for assisting in the acquisition of
70 System Dynamics Review Volume 22 Number 1 Spring 2006
Published online in Wiley InterScience(www.interscience.wiley.com) DOI: 10.1002/sdr
NRC nuclear power plant construction data and the anonymous reviewers of a draft ofthis paper.
References
Abdel-Hamid TK. 1984. The dynamics of software development project management:an integrative system dynamics perspective. Doctoral thesis, Massachusetts Instituteof Technology, Cambridge, MA.
Baldwin C, Clark C. 2000. Design Rules: The Power of Modularity. MIT Press:Cambridge, MA.
Black L, Repenning N. 2001. Why firefighting is never enough: preserving high-qualityproduct development. System Dynamics Review 17(1): 33– 62.
Busby S, Hughes E. 2004. Projects, pathogens, and incubation periods. InternationalJournal of Project Management 22(2): 425–434.
Cooper K. 1980. Naval ship production: a claim settled and a framework built. Inter-faces 10(6): 20–36.
Cooper K. 1993a. The rework cycle: why projects are mismanaged. PM NetworkFebruary: 5–7.
Cooper K. 1993b. The rework cycle: how it really works . . . and reworks. PM NetworkFebruary: 25–28.
Cooper K. 1993c. The rework cycle: benchmarks for the project managers. ProjectManagement Journal 14(1): 17–21.
Cooper K. 1994. The $2,000 hour: how managers influence project performance throughthe rework cycle. Project Management Journal 15(1): 11–24.
Cooper K, Lyneis J, Bryant B. 2002. Learning to learn, from past to future. InternationalJournal of Project Management 20(3): 213–219.
Evans M. 2005. Overdue and over budget, over and over again; project management.The Economist 375(8430): 66.
Ford D. 1995. The dynamics of project management: an investigation of the impacts ofproject process and coordination on performance. Doctoral thesis, MassachusettsInstitute of Technology, Cambridge, MA.
Ford D. 1999. A behavioral approach to feedback loop dominance analysis. SystemDynamics Review 15(1): 3–36.
Ford D, Sterman J. 1998. Modeling dynamic development processes. System DynamicsReview 14(1): 31–68.
Ford D, Sterman J. 2003a. The liar’s club: impacts of concealment in concurrent devel-opment projects. Concurrent Engineering Research and Applications 111(3): 211–219.
Ford D, Sterman J. 2003b. Overcoming the 90% syndrome: iteration management inconcurrent development projects. Concurrent Engineering Research and Applica-tions 111(3): 177–186.
Gladwell M. 2000. The Tipping Point: How Little Things Make a Big Difference. Little,Brown: Boston, MA.
Graham A. 2000. Beyond PM 101: lessons for managing large development programs.Project Management Journal 31(4): 7–18.
Kharbanda O, Pinto J. 1996. What Made Gertie Gallop: Learning from Project Failures.Van Nostrand Reinhold: New York.
T. Taylor and D. N. Ford: Tipping Point Failure and Robustness 71
Published online in Wiley InterScience(www.interscience.wiley.com) DOI: 10.1002/sdr
Luo L, Kannan P, Besharati B, Azram S. 2005. Design of robust new products undervariability: marketing meets design. Journal of Product Innovation Management22(2005): 177–192.
Lyneis F, Cooper K, Els S. 2001. Strategic management of complex projects: a case studyusing system dynamics. System Dynamics Review 17(3): 237–260.
Matta F, Ashkenas R. 2003. Why good projects fail anyway. Harvard Business ReviewSeptember: 109–114.
NRC (Nuclear Regulatory Commission). 1973–1982. Nuclear Power Plant ConstructionStatus Reports (report periods from 1973–1982). NUREG-0030.
Paul L. 2005. It’s your move. PM Network 19(4): 34 – 38.Rahamandad H. 2005. Dynamics of platform-based product development. In Proceed-
ings of the 2004 International System Dynamics Conference, Boston, MA, 17–21 July.Repenning N. 2001. Understanding fire fighting in new product development. Journal
of Product Innovation Management 18: 265–300.Rodrigues A, Williams TM. 1997. System dynamics in project management: assessing
the impacts of client behavior on project performance. Journal of the OperationalResearch Society 49: 2–15.
Sterman J. 2000. Business Dynamics: Systems Thinking and Modeling for a ComplexWorld. Irwin McGraw-Hill: New York.
Swan K, Kotabe M, Allred B. 2005. Exploring robust design capabilities, their role increating global products, and their relationship to firm performance. The Journal ofProduct Innovation Management 22: 144–164.
Taguchi G, Chowdhury S, Taguchi S. 2000. Robust Engineering. McGraw-Hill: NewYork.
Taylor T, Ford D, Johnson S. 2005. When good projects go bad, tipping point dynamicsin development projects. In 2005 International System Dynamics Conference,Boston, MA, 17–21 July.
Thomas HR, Napolitan CL. 1994. The Effects of Changes on Labor Productivity: Whyand How Much. SD No. 99. Construction Industry Institute: Austin, TX.
USGAO (United States General Accounting Office). 1996. Department of Energy:Opportunity to improve management of major systems acquisitions. GAO/RCED-97-17. Washington, DC.
USGAO (United States General Accounting Office). 1997. Department of Energy:Improving Management of Major Systems Acquisitions. GAO/T-RCED-97-92.Washington, DC.
Wells W. 1999. From the editor. Project Management Journal 30(2): 4–5.


![Dynamics of Tipping Cascades on Complex Networkstipping element passes its tipping point, the probability of tipping of a second tipping element is often increased [7], yielding the](https://img.pdfslide.net/doc/110x75/5ecad73c67650774826e54b9/dynamics-of-tipping-cascades-on-complex-networks-tipping-element-passes-its-tipping.jpg)