Embed Size (px)
Citation preview

Tips on NeatWork and related Excel files
The tutorial gives some tips on how to use NeatWork. The companion three Excel files are to be found in the folders db and Documents/Macros that are part of the distribution.
1. The first section deals with the two databases that NeatWork use to select the relevant pieces of equipment: pipes and orifices. One must make sure that the databases contains data that are relevant to the project under study. The Excel file that stores examples of values for the pipes is to be found in the folder db of the software distribution.
2. The second section deals with NeatWork parameters. Several parameters influence the behavior. Some are technical characteristics of the equipment; other are values that trigger the behavior of the two modules, simulation and design.
3. The last section provides tips to improve an initial design. It offers two methods to improve flow stability under intermittent demands. One of the methods relies on an Excel macro named JP4.xls which is located in the Macros folder of the NeatWork distribution. The different steps are illustrated on an example named ToyProject, which is in the projects folder of the NeatWork distribution.
Select and edit NeatWork databases The databases diameters and orifices store the quantitative and qualitative information on pipes and orifices that is mandatory to describe a network and to compute project cost and flow performances.
Diameters and orifices Databases files are stored in the folder “db”
• diameters.db stores data on pipes specs. NeatWork opens it at start. Format: plain text. • orifices.db stores data on orifices specs. NeatWork opens it at start. Format: plain text. • Diameters databases.xls. This excel workbook has multiple sheets. Each sheet contains a
database. • Orifices databases.xls. This excel workbook has multiple sheets. Each sheet contains a
database.
Start NeatWork session When the user launches NeatWork by clicking twice on run.bat, the software automatically loads diameters.db and orifices.db. To view the data use the submenu Edit database.
The table below displays data on diameters that NeatWork automatically loads from the file diameters.db in folder db.

Diameters.
• Nominal: standard commercial identifier, in inches. • SDR: commercial denomination of pipe thickness. • Diameter: inner diameter. (Critical because used to compute friction losses). • Cost/m: Cost per meter. (Critical because used to compute total cost). • Max Pressure: Maximal static pressure held by the pipe. (Used in the design module to protect against high static pressures). • Type: 1 is standard PVC. 2 is iron. 3 ? • Roughness: Used for types other than 1.
Orifices
• Orifices are simple devices placed close to faucets, having the shape of a disk with a hole in their center. The size of the hole is given in meters.
Excel repository Both diameters and orifices data can be edited in NeatWork display window. A recommended alternative is resort to an Excel workbook for ease and safety. NeatWork makes it easy to cpy and paste data from its window display to Excel and back. In that way, one can save a newly database, retreive an old one, etc. This feature is very convenient if one has to work with different data, e.g., when costs must be given in different currencies. To this end, the folder includes two Excel files by the name Diameters databases.xls and Orifices databases.xls. Those template files contain several sheets ; each one stores a database corresponding to some local condition. In the example below, the first tab “Nica 2018” opens data in use in Rio Blanco since 2018, the second tab “Nica 2018 in USD” provides the same information, but the costs have been converted from Cordoba into USD, at the rate 0.03.

Updating the databases in NeatWork We discuss two methods, one entirely through NeatWork windows; the other by copy and paste between NeatWork and Excel. The first method has its advantage, but for safety reasons we strongly recommend the second one. This can be understood by reviewing the two methods.
• Method 1. Activate Database/Edit Database. Each element, cell or row, that appears in the display can be edited using the buttons at the
- The first two buttons permits adding and deleting an entire row, i.e., adding or deleting information relative to a commercial pipe. - The next two buttons permit copy and paste cell selections to and from clipboard in the Excel format. Once in clipboard, the information can be used by third party applications. - Buttons in 5th and 6th position pertain to saving the current display in the file diameters.db. - The last button generates a html report. The caveat about Method 1 concerns the save operation. Once performed, the previous values in diameters.db are replaced by the new ones, and the old ones cannot be retrieved1 anymore.
• Method 2. Select the entire information in the NeatWork display. Copy it and paste it in an Excel file. Edit in Excel, copy and paste it back to NeatWork.
We strongly suggest to use method 2 in connection with the Excel repository file in order to store successive databases. Keep in mind that saving the current NeatWork display thru the innocent button is a no-return operation on the file diameters.db that NeatWork automatically will load in a new session. All comments equally apply to managing the orifice database and the file orifices.db.
About pipe attributes in diameter.db In data currently used there is a one-to-on correspondence between the combination nominal–SDR of the two attributes and the attribute diameter. In other words, if two commercial pipes have the same attributes nominal–SDR, .they are identical. The two attributes are indicated mainly for convenience at implementation time. Back to top.
1 Actually, the save operation is not mandatory within a NeatWork session. NeatWork loads diameters.db at session start, but does not open diameters.db anymore during the session. The edited values displayed in the NeatWork window are the ones that will be used to generate a design. Moreover, the design is stored in a in diameters.db.

Select NeatWork parameters Several parameters influence the behavior. Some are technical characteristics of the equipment; other are values that trigger the behavior of the two modules, simulation and design. Some technical parameters are included in the database files, diameters.db and orifices.db. We do not discuss them in the present document. The parameters can be accessed and modified thru NeatWork windows. The parameters in use are recorded in the files associated with a project, say myproject.tpo and myproject.dsg. Those two files are simple text files that can be open and edited on a texteditor such as wordpad. When you create a topography, NeatWork automatically loads default values for some parameters. To see it, create (or open the file 1_pipe.tpo) the simple one pipe network displayed below.
The Text tab reveals the full description of the network prior to be equipped with specific pipes and orifices.
The parameters are collected after the heading !Default properties.
Technical parameters
Technical parameters for flow computation (Simulation and Design modules) Three technical parameters enter the formulae that determine flows in the gravity driven networks considered in NeatWork. They can be modified by the user.
• faucetcoef : The pressure loss in the faucet is equal to the square of the flow2 divided by this coefficient. One may want to change the default value 2.0E-8 by the one corresponding to the commercial faucets locally in use. For instance, the value 1.87E-08 is used in Rio Blanco.
2 The flow unit used in computation is the cubic meter.
• watertemp : the default value is 20 C°. Express the appropriate temperature in this unit.
• orifcoef : The pressure loss in the orifice is proportional to the fourth power of the orifice coefficient times the square of the flow divided by the fourth power of the diameter of the hole at the center of the orifice. Extensive experiments showed that the value 0.62 is more accurate. We invite users to use this value rather than the default one.
Technical parameters for network design (Design module) Two technical parameters trigger pipe selection in the design module.
• limitbudget : the parameter sets a bound on the allowable total cost of the project. The very large default value 1.0E9 is equivalent to no restriction. Reducing this value will induce the design module to find a second-best solution. Too small a value may lead to infeasibility.
• pipelength : commercial pipes have a common commercial length. The default value is 6 meters. This value will plays a role when NeatWork finds appropriate3 to use two types of pipes on a given segment. In that case, NeatWork seeks a split that will minimize the number of pipes to be cut to fit the needs
Norm parameters
Norm parameters (Simulation and Design modules) Contrary to the preceding parameters, the norm parameters have no universal value. They are to be adjusted to fit the norms and objective of the user.
• targetflow : The default value is 0.2 liter/second. • opentaps : The open tap coefficient stipulates the fraction of open taps during the peak
hours. The value 0.4 says that in average 40% of the taps are open at a time. This is taken to be equivalent to saying that the probability that an individual opens its tap equal at any observed time is opentaps.
• servicequal : This parameter is used in the design module exclusively. It provides a guidance to NeatWork as to the impact of the upstream pipe diameters on the overall stability of flows when demand for water at any faucet is randomly intermittent. A large value will improve flow stability but increase total material cost.
Norm parameter (Simulation module only)
• seuil : (threshold in English). In a simulation, faucet flows vary according to the configuration of open and closed faucets. The simulation module perform simple statistical analysis to provide information on the flow distribution at any faucet. The seuil coefficient permits to measure the lower tail of the flow distribution. It gives the proportion of times the flow was below that threshold. The lower the threshold seuil, the lower will be the number of occurrences below the threshold, but the less satisfactory are the underflows.
3 Because no commercial pipe may be endowed the ideal inner dimaeter for a given segment, NeatWork may micmick the ideal choice by splitting the segment length in two sub-segments and recommend using two different pipe types. Note that if one wishes to use a single type per segment, it suffices to put a very large length, say 60000 meters.

There is no absolute rule as to the values to be assigned to the norm parameters. As an indication, we display below the values we recommend in Rio Blanco, but we insist on urging each user to give careful consideration to the impact of their choice, with special focus on the statistical analysis at each simulation.
APLV recommended values
• Target flow: 0.12 l/s • Fraction of open faucets (opentaps): 0.28 (or less). • Threshold (seuil): It is felt at Rio Blanco that a faucet that underflows below a threshold
TargetFlow/2 = 0.06 l/s less than 5% of the time achieves the desired limitation of variability.
• Quality of service: A higher quality of service improves flow stability, but it also favors larger average flow. The value 0.95 permits excellent control of variability, but the average flow is most of the time 15% to 20% higher than the target flow. However, a design with a target flow 0.105 l/s and quality of service 0.95 will eventually achieve an average flow near 0.12, while preserving stability. It is recommended to produce and test several designs using different parameter configurations.
More about the target flow and the fraction of open faucets The recommended values may not suit all users. We present some arguments to help users to choose values that agree to their needs. The critical factors are
• r: The ratio between the water withdrawal rate during peak hours compared to the average rate of the day. The withdrawal rate is measured at the reservoir outlet.
• t: The relative duration of the peak hour. • T: The number of active water withdrawal during the day • q: The daily water consumption at each faucet. • f: The target flow at each individual faucet.
Under the assumption that each faucet serves the same number of inhabitants, and that all users have similar consumption patterns, we claim that knowing the values of factors suffices to assign a plausible value to the fraction of open faucets. For clarity, let us define Q as the daily water consumption and Qp the peak period consumption. By definition r = (Qp/t) / (Q/T). The proportion of water withdrawal at peak period is Qp / Q = r t / T. Assume the same proportion at each faucet : qp / q = Qp / Q, where qp is the total water consumption at a single faucet during the peak period. Hence qp = q r (t / T). The daily consumption at a faucet is deduced from the allowance by inhabitants, say 60 liters per person, according to international norms. If one assumes 6 persons per house, the daily consumption is q = 360. Taking r = 3, t = 2 hours and T = 18, we find qp = (3 / 9) x 360 = 120 liters. The necessary time to withdraw 120 liters is 120 / f. The faucet occupation time is thus 120 / (f x t). This quantity is also identified as the μμμfraction of open faucets. To end up with a figure, we need an estimate of f. A reasonable value is based on the time to fill a 5 liter can. At APLV the filling time is deemed to be 40 s, i.e., 0.125 l/s. Actually, the value 0.12 is commonly
OF = 120 / (f x t) = 120 / (0.12 x 7200) ≈ 0.14. The World Bank example4
4 Example from the World Bank manual. Rural water supply: Design manual. http://documents.worldbank.org/curated/en/808651468144565996/Design-manual. Discussed at length in the file NeatWork vs EPANET.
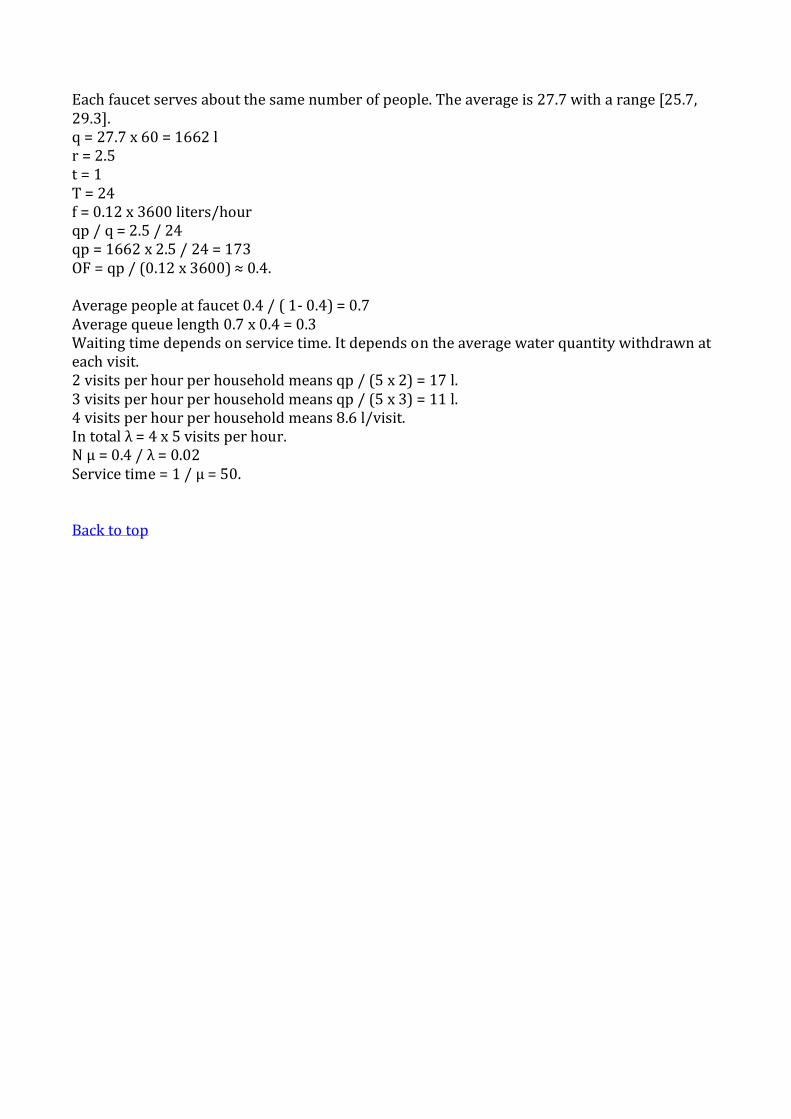
Each faucet serves about the same number of people. The average is 27.7 with a range [25.7, 29.3]. q = 27.7 x 60 = 1662 l r = 2.5 t = 1 T = 24 f = 0.12 x 3600 liters/hour qp / q = 2.5 / 24 qp = 1662 x 2.5 / 24 = 173 OF = qp / (0.12 x 3600) ≈ 0.4. Average people at faucet 0.4 / ( 1- 0.4) = 0.7 Average queue length 0.7 x 0.4 = 0.3 Waiting time depends on service time. It depends on the average water quantity withdrawn at each visit. 2 visits per hour per household means qp / (5 x 2) = 17 l. 3 visits per hour per household means qp / (5 x 3) = 11 l. 4 visits per hour per household means 8.6 l/visit. In total λ = 4 x 5 visits per hour. Ν μ = 0.4 / λ = 0.02 Service time = 1 / μ = 50. Back to top

Improving an initial design Context NeatWork adresses situations characterized by the following elements and requirements.
• The primary goal is to bring from a reservoir safe drinking water to dwellers in sufficient quantity by means of pipes.
• A secondary goal is to ensure relatively stable flows at each faucet despite intermittent water withdrawal at individual faucets.
• A third goal is to minimize the total material cost of pipes acquisition. • The design must comply with the compelling constraint to resort to gravity and friction
alone to ensure self-regulation. Mechanical devices, such as pumps and valves, triggered by external means are banned.
Ensuring stable faucet flows in front of intermittent faucet usage, in the special context described above is tricky. In loose terms, it is possible to design stable systems, but a the expense of increased material costs. The user has to decide on the acceptable amount of flow variability, and balance her or his acceptability criterion with the total material cost. The user should keep in mind that cost is univocal, the same for everybody, while each user is entitled to have his or her view on the measurement of flow variability and its level of acceptability. NeatWork offers a unique tool to simulate flows under intermittent demand, enabling users to analyze and compare behavior of proposed or existing designs. NeatWork tools, simulation and design, are meant to help designers to come up with resilient water distribution systems that meet the specific local needs and local conditions of use.
What NeatWork is not suited for NeatWork is aimed to generate least cost systems whose topography is known and is represented by an arborescence. Locazing nodes, branching and faucet, is not part of the issues addressed by NeatWork. Similarly, network with loops, whose main feature is to ensure safety against failures on branches and branching nodes, are not considered in the design phase. However in the simulation phase the user can enforce loops by introducing by hand additional branches between existing nodes and test the impact on flow variability. This extension is likely to have little relevance in most applications.
About this tutorial Provide two examples. Step-by-step implementation of a toy project. A large project, to test your understanding. Companion papers
Create NeatWork data files for ToyProject: topo and design
Main steps
1. Open NeatWork and edit the databases. (See tutorial Manage databases in NeatWork.) 2. Create NeatWork topography file
a. Create an empty topo file for ToyProject in the folder of your choice. b. Use Excel to create the node and pipe tables. c. Use copy and paste buttons in NeatWork window to transfer information from Excel
to NeatWork. Validate!

d. In the NeatWork window, activate the tab Text to edit the parameters. (See tutorial Select Parameters in NeatWork.) Your choice must correspond to the local conditions. Validate!
e. Save the topo as ToyProject.tpo 3. Use the design module to create the design file
a. Review databases to make sure you are using proper data. b. Activate the submenu Topography/make design. c. Admissible pipes and orifices d. From tab “parameters” make sure that the parameters are the correct ones. e. Activate Make design. NeatWork has no opportunity to use other pipes than those
specified by the user, there is no optimization. However, NeatWork does an extra work turns to be useful, if not crucial. It estimates possible excess pressures at faucet nodes, prone to induce overflows. To cope with the risk of faucet overflow the design module suggests ideal orifices with appropriate inner hole diameter.
Step by step operations on an illustrative example.
ToyProject: preliminaries
Basic data: topography
1- ToyProject: Open NeatWork and select Database
Step 1a- Databases As you open a NeatWork session, the software reads the default tables for pipes and orifices. The default files are located in the foder db. Make sure that the databases fit the local conditions. See companion tutorial Manage databases in Neatwork.docx on databases.
In the example we use the data Nica 2018 in USD to be found in the Excel files Diameters database.xlsx.
Tank 0 m A -10 m
C -20 m
B -15 m
P3 -18 m
P4 -50 m
P2 -9 m
P1 -12 m
200500 180
12070
110
90

Step 1b- Parameters At this stage, it is possible to edit the parameters values Click on the tab Text. It opens the window on the left with default settings. Edit parameters by selecting the default values and replace them by the correct values. It yields the table on the right.
We distinguish several classes of parameters
• Hardware parameters (pipelength, orifices, faucetcoef) and local parameters (watertemp).
• Design parameters (goals) targetflow TF and opentaps OT. • Tuning parameter Servicequal. Making its value tend to 1, permits to achieve higher
faucet flow stability in simulation, possibly at the expense of higher material cost and global excess on the desired target flow. (Lowering its value has the opposite effect.)
• Simulation parameter seuil5 in l/s (only used in statistical reports).
Parameters TF and OF determine
- i) the average number of open faucets = OF * NbF, where NbF is the total number of faucets, and
- ii) the average reservoir outflow: TF * OF * NbF.
See the tutorial Manage parameters in NeatWork for further considerations on parameter choice.
5 Seuil is the French name for Threshold

2- ToyProject: Create and fill ToyProject.tpo
Step 2a : Create a topo file Submenu: File/new topography. The first window enables you to locate and/or create the
folder where to store the files associated with your project. Three icons permit navigation in the folder and file arborescence of the computer. The icon in the left opens the parent folder, the middle one leads to the user root and the last one creates a new floder in the current folder. The next picture shows that we created the folder named Test. To open Test select it and click on Browse.
This action reveals the folder content. There is no subfolder and no file xxxx.tpo.
Type the name of your project. Here ToyProject. Click on New. This creates an empty topo file though with the Source node, which must always exists in any topo file.
Step 2b. Create node and pipe Excel tables Two tables display the data for the topo file. Data can be entered one after the other, directtly in NeatWork. However it is recommended to create tables in a spreadsheet to avoid errors. The format must be exactly the one on display to allow copy and paste from the spreadsheet to NeatWork and vice-versa. The headline Nature indicates whether the node is the source (= 0), a branching node (= 1) or a faucet (= 2)

Step 2c. Paste Excel tables Select the Excel node table (without the first row) ; copy it and paste it into NeatWork by clicking on the Past button in the Node list section of NeatWork window. Proceed with pipe data in the same fashion. Don’t forget to validate.
Step 2d. Edit the default parameters.
The parameters will be used by NeatWork to produce a design that is design module to predict possible excess pressures at faucet nodes and suggest appropriate orifices to cope for them. When completed, click on Apply. Note that the orifices strongly influence the flows. You may want to play on Service Quality.
• High Service Quality Overestimates upstream pressure losses overestimates excess pressure at faucets larger faucet flows in practice.
• Low Service Quality Underestimates upstream pressure losses Underestimates excess pressure at faucets smaller faucet flows in practice.
Note that the Target Flow value is 0.12 l/s. At first try, we’ve selected a Service Quality 0.85. Don’t forget to click on the apply button to save the modifications. See the companion paper Manage parameters in Neatwork.docx for an extensive discussion.
Step 2e. Save the topo file with submenu File/Save.
3- ToyProject: Create ToyProject.dsg design file Step 3a. Check databases. In the example we use the diameters in the database Nica 2018 in USD. Step 3b. Activate the submenu Topography/Start Design. Step 3c. Select available pipes and available orifices.

In the example, we select all pipes and all orifices Step 3c. Confirm parameters. For safety open the section Parameters to review the parameters that were specified in step 2d. It is possible to edit parametes in this window, if some value does not fit your goals,
Step 3d. Click on Design This operation terminates creation of the design file.
Step 3e. Save the design. Here is the ToyProject with the prescribed commercial pipes.
• NeatWork may decide on splitting some branches in two parts, with different commercial pipes. This is not the case at present, but this case uncommon.
• NeatWork assigns ideal orifices which compensate for the estimated excess pressure at each faucet. Commercial orifices are the substitutes for practical operations. They are selected among those available in the database so as to approximate the ideal orifices.
• The total project cost is 481. • The column “commercial orifices” can be further edited. In particular, it might be worth
analyzing the impact of NeatWork recommendation by assigning no orifices (or, equivalently, orifices with large enough diameters so as to induce no pressure loss for flows close to the target flow: a value like 0.1 m or larger does the job).
Save the design using save (creates ToyProject.dsg) or save as. The latter may be useful if the design module is used to generate alternative designs from the same topo file.
Simulate performance of ToyProject.dsg The simulation module simulates network flow performance when users open or close their faucet at random. The module generates scenarios, each one corresponding to a configuration of open and closed faucets, e.g.,
- P1, P2 and P4 are open and P3 is closed. - P2 and P3 are open and P1 and P4 are closed.

The module compute flows at each faucets and extract statistics. The user gets an estimate of the average faucet flows, and thus the average outflow at the reservoir (average faucet flow times the average number of open faucets) and more detailed information on each faucet (min, max and average flow; quantiles; proportion of times flows are below or above the the low and high critical flows).
Average outflow at the reservoir = 0.1295 * 4 * 0.28 = 0.145 l/s Variability = (standard deviation)/(mean value)
Improving on the first design ToyProject.dsg Suppose the user wishes a design in which the average outflow achieves the target flow 0.12 l/s. We mention here 2 simple stategies; i) generate a design with a lesser Service Quality; ii) generate a design with a fake target flow smaller than the true desired target. For instance one may try the fake target flow 0.113 l/s.
Notice that the cost is slightly less than for the initial design (472 instead of 481). Notice also that NeatWork recommends using two different pipes for branch B P2. Display of simulation statistics.

Global average is closer to target flow 0.1207 instead of 0.1295.
FAQ
- Q: Is it possible to impose only one type of pipe per branch? R: Yes, assign a very large value to pipelength (hundreds of meters).
- Q: The design table display gives the inner diameter of the recommended pipes, not their ID. Can we get the ID’s? R: Yes, the information can be found in the section Text. In addition, the submenu Report in HTML provides a complete summary on the project, including a table on pipe orders to complete the project
- Q: What is the recommended sample size? R: The larger the size, the more reliable are
the results; the longer the computing time. On large projects, 2 to 5000 might suit. - Q: Is it worth performing simulation with alternative open faucet fractions? R: - Q: Should we use ideal or commercial orifices in simulations? R: Simulations with ideal
orifices yield results intrinsic to the pipe design. Commercial orifices give results more closely related to practical implementation.
Back to top