Embed Size (px)
Citation preview
Lazaro-Capones, A.R.
1
For Presentation in the Special Session: Workshop for Prospective Scholars, International Industrial Relations Association (IIRA), 5th Asian Regional Congress to be held on June 23-26, 2004, Seoul, Korea.
Title: ADVERSITY QUOTIENT AND THE PERFORMANCE LEVEL OF SELECTED MIDDLE MANAGERS OF THE DIFFERENT DEPARTMENTS OF THE CITY OF MANILA AS REVEALED BY THE 360-DEGREE FEEDBACK SYSTEM Researcher: ANTONETTE R. LAZARO-CAPONES
Background of the Study
In the past few decades, researchers have devoted much of their attention to IQ –
Intelligence Quotient and EQ—Emotional Quotient, which are believed to be determinants of
success and excellent performance. Now, Paul Stoltz (2000) has introduced a new and
fascinating concept—Adversity Quotient (AQ), which tells how well one withstands adversity
and his ability to surmount it. For employees and managers, AQ seems to be the missing factor
to success.
Today, AQ becomes more and more important as the daily dose of adversity rises. Most
people, especially in the Philippines describe ever-greater challenges - a relentless barrage of
adversity, not only personal challenges but also challenges in the society and in the workplace.
The basis of organizational capacity lies with the capacity of each employee, of each
manager that handles the smallest unit in an organization. How they respond to adversity is the
basis of consistently creating outstanding results. In this fast growing world where they are
exposed to, each day demands greater speed, capacity and capabilities. And because managers
assume multifaceted tasks, it is inevitable for them to encounter hard times along with exposure
to different people of different organizational levels in the company. Their performance can be
affected by many factors that surround them including people. In turn they also affect several
employees above or below the organizational structure or even those in the same level with them.
So, it is important to use a multi-source assessment or 360-degree feedback process to determine
the level of performance of a middle manager. The 360-degree feedback is intended to provide
Lazaro-Capones, A.R.
2
employees with as accurate a view of their performance as possible by getting input from all
angles. It is said to be useful because it allows managers to identify and compare their strengths
and weakness as identified by key constituents from different organizational levels which
include supervisors, peers or colleagues, subordinates or direct reports and internal and/or
external customers. The premise is that in order to get a complete picture of the performance of
an individual, one must gather information from all those having a relevant view of the
employee’s performance. With this, practitioners and organizational consultants, based on their
experiences with clients, firmly believe that multi-rater or 360-degree feedback systems enhance
self-knowledge and consequently improve managerial behavior.
With earlier findings on adversity quotient regarding its importance in the workplace
especially for managers, and the growing emergence of the 360-degree feedback process in the
assessment of job performance level, the researcher realized that it is essential to study these
variables. Indeed, a manager with his launching into a new high technology and challenging
world requires a high level of conviction in his ability to overcome unyielding challenges while
undertaking uncertain and complex innovation projects. This then can be successfully
transformed into attractive opportunities.
Statement of the Problem
This study attempted to determine the relationship of adversity quotient and performance
level of middle managers in the different departments of Manila as revealed by the 360-degree
feedback system. Specifically, the present study answered the following questions:
1. What is the demographic profile of the respondents as to age, gender, civil status, and
length of service?
2. What is the adversity quotient of the middle managers as to the following dimensions:
Control, Ownership, Reach, and Endurance?
3. What is the performance level of middle managers as revealed by the following: Supervisor,
Peers, Subordinate, Self, and the 360-degree feedback system as a whole?
Lazaro-Capones, A.R.
3
4. Are there significant mean differences among the performance level of the middle
managers?
5. Is there a significant relationship between the respondents’ demographic profile variables
and each of the following: adversity quotient and performance level as revealed by the 360-
degree feedback system?
6. Is there a significant correlation between the respondents’ adversity quotient and
performance level as revealed by the 360-degree feedback system?
Hypotheses
The following null hypotheses were tested at 0.05 level of significance:
1. There are no significant mean differences among the performance level of the middle
managers.
2. There is no significant relationship between the respondents’ profile variables and each of
the following: adversity quotient and performance level measured by the 360-degree
feedback system
3. There is no significant correlation between the respondents’ adversity quotient and
performance level as revealed by the 360-degree feedback system.
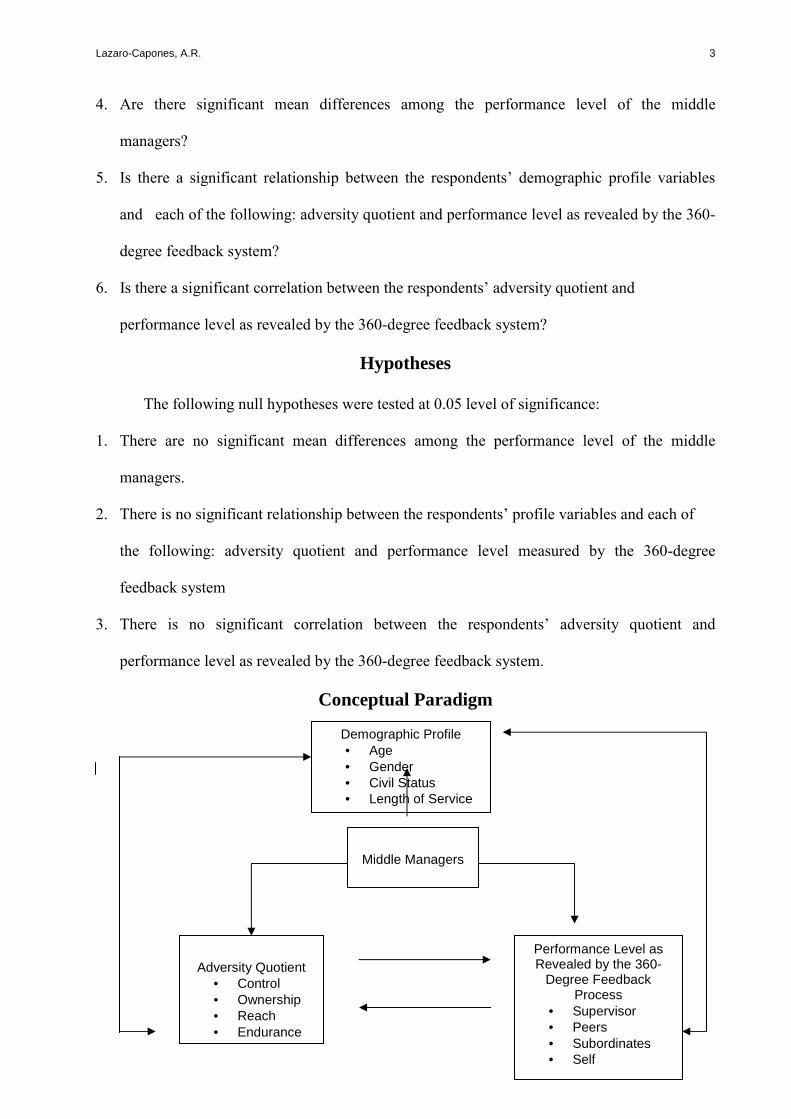
Conceptual Paradigm
Demographic Profile • Age • Gender • Civil Status • Length of Service
Middle Managers
Adversity Quotient
• Control • Ownership • Reach • Endurance
Performance Level as Revealed by the 360-
Degree Feedback Process
• Supervisor • Peers • Subordinates • Self
Lazaro-Capones, A.R.
4
Figure 1. Conceptual Paradigm Showing the Relationship Between the Adversity Quotient And Performance Level of Middle Managers as Reveled by the
360-Degree Feedback Process
The main concern of this study was to explore the relationship of adversity quotient and
performance level of middle managers employed in government agencies. It can be gleaned
from the conceptual paradigm on the next page that adversity quotient is related to the
performance level among middle managers. The Adversity Quotient includes four (4)
dimensions namely, Control, Ownership, Reach, and Endurance. While the level of performance
of the middle managers was measured using the process known as the 360-degree feedback
system. This is represented by the feedback given by people from all angles in the evaluation of
the middle manager’s performance—superior/s, peers, subordinate/s and the self.
The demographic profile of the respondents such as age, gender, and civil status and
length of service served as intervening variables.
Significance of the Study
This study presented a pioneering effort in explaining relationship between adversity
quotient and performance level of middle managers in the Philippines. Moreover, the results of
the study will be useful to the following:
Managers. Results of the study provided insights into how they handle adversity and
consequently improve management of self and people around them. Thereby, increasing their
capacity to pursue highest aspirations by responding effectively to any adversity.
Administrators. Ideas gained from this study will give them additional information in
understanding an individual's AQ, which will help organizations to hire and retain highly
motivated and talented employees. Further it will provide ideas in helping employees develop to
their full potential, and thus, create a leadership culture. This can in turn encourage employees to
put forth their best efforts and maximize their performance capabilities leading to better overall
organizational performance.
Lazaro-Capones, A.R.
5
Employees. Findings of the study may bring awareness of their AQ levels that can help
them organize their working efficiency.
Human Resource Practitioners. In some ways, the findings from this study can be
utilized as baseline materials in planning and setting up new programs for employee
development especially in dealing with adversities in the workplace. This will provide them
additional information for human resource planning. The realization that personal and
organizational capacity to handle change and adversity should be increased so that both the
employee and the organization will embrace learning and challenge stretching optimal success.
Researchers. The result will be helpful in understanding other issues regarding the
relationship of adversity quotient and performance level revealed by 360-degree feedback which
can possibly be further studied.
Definition of Terms The following terms were defined operationally to further clarify the important elements
in the conduct of the study.
360-Degree Feedback System. A powerful new assessment tool intended to provide an accurate
view of employees’ performance by getting input from the following:
• Peer – person on the same organizational level with the middle manager, one who
possesses a similar level of status or authority as that of the respondents
• Self - The middle manager himself who also provides feedback.
• Subordinate - Person in the organization under the middle manager’s supervision;
his work being observed by him.
• Supervisor - One who is one-level higher to the middle manager; he/she oversees
his/her works.
Adversity. Any difficulty or hardship that an individual encounters; this may arise from any
aspect of one’s life—society, individual and workplace.
Lazaro-Capones, A.R.
6
Adversity Quotient. In this study, it refers to the total score obtained on the Adversity Response
Profile; it is how one responds/handles adversity
Adversity Response Profile. A self-rating questionnaire designed to measure an individual’s
style of responding to adverse situations; it is composed of the following dimensions:
Control Score. A measure of the degree of control a person perceives that he or she
has over adverse events; a scale on the Adversity Response Profile and component of
the Adversity Quotient.
Endurance Score. A measure of the perception of time over which good and bad
events and their consequences will last or endure.
Ownership Score. A measure of the extent to which the person owns, or takes
responsibility for, the outcomes of adversity or the extent to which the person holds
himself or herself accountable for improving the situation.
Reach Score. A measure of the degree to which the person perceives good and bad
events reaching into other areas of life
Middle Manager. The person in charge of an organization or one of its subunits. He is
responsible for the work of the people of that unit.
Performance Level. This refers to the recent work appraisal evaluation done in the organization,
which may be low, moderate, or high.
Rater. A source person in the 360-degree feedback system who has useful information on how
the employee behaves. He/She can be the manager’s superior, peer, subordinate, or himself.
METHODOLOGY
This section describes the general methods of research, the research locale, subjects of
the study, the research instrument/s employed, procedures, and the different statistical
techniques for the interpretation of data.
Lazaro-Capones, A.R.
7
Research Design
This study employed the descriptive, correlational method of research to determine the
relationship of adversity quotient and performance level of middle managers using the 360-
degree feedback system.
Further, the design was used to determine whether a relationship exists between the
demographic profile variables and adversity quotient and performance level among the selected
middle managers of the City of Manila.
Research Locale
The respondents were gathered from the selected departments of the City of Manila on
October 2002.
The offices of these departments are situated inside the Manila City Hall – the actual
venue for the research.
Samples and Sampling Technique
The researcher employed the convenience sampling to select 7 from the 39 departments
of the City of Manila. A total of 102 middle managers from the different departments served as
the respondents of this study.
Majority of the respondents are 36 years old and above, female, married, have
been in the service to the City of Manila for 10 years and above. These middle managers are
assigned into different sections within the department handling five (5) to 10 employees. Figure
2 on the next page illustrates the distribution of respondents in the selected departments of the
City of Manila. It is evident that majority of the respondents (42%) is from the City Treasurer’s
Office and the least number (4%) of respondents come from the Manila Tourism & Cultural
Affairs Bureau.
The Distribution of Respondents in the Selected Departments of the City of Manila Departments Number of Respondents
City Budget Office 10 City Treasurer’s Office 44
Lazaro-Capones, A.R.
8
Department of Assessment 14 City Personnel Office 5 Manila Health Department 13 City Administrator’s Office 12 Manila Tourism & Cultural Affairs Bureau 4
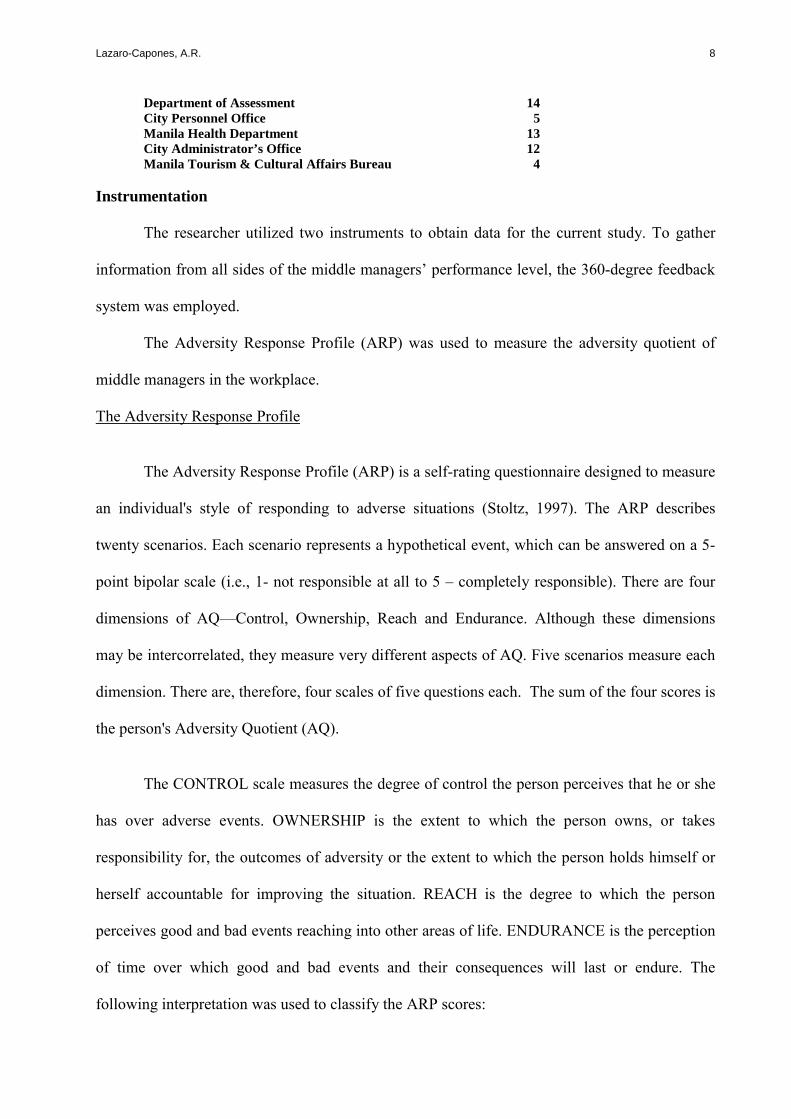
Instrumentation
The researcher utilized two instruments to obtain data for the current study. To gather
information from all sides of the middle managers’ performance level, the 360-degree feedback
system was employed.
The Adversity Response Profile (ARP) was used to measure the adversity quotient of
middle managers in the workplace.
The Adversity Response Profile
The Adversity Response Profile (ARP) is a self-rating questionnaire designed to measure
an individual's style of responding to adverse situations (Stoltz, 1997). The ARP describes
twenty scenarios. Each scenario represents a hypothetical event, which can be answered on a 5-
point bipolar scale (i.e., 1- not responsible at all to 5 – completely responsible). There are four
dimensions of AQ—Control, Ownership, Reach and Endurance. Although these dimensions
may be intercorrelated, they measure very different aspects of AQ. Five scenarios measure each
dimension. There are, therefore, four scales of five questions each. The sum of the four scores is
the person's Adversity Quotient (AQ).
The CONTROL scale measures the degree of control the person perceives that he or she
has over adverse events. OWNERSHIP is the extent to which the person owns, or takes
responsibility for, the outcomes of adversity or the extent to which the person holds himself or
herself accountable for improving the situation. REACH is the degree to which the person
perceives good and bad events reaching into other areas of life. ENDURANCE is the perception
of time over which good and bad events and their consequences will last or endure. The
following interpretation was used to classify the ARP scores:
Lazaro-Capones, A.R.
9
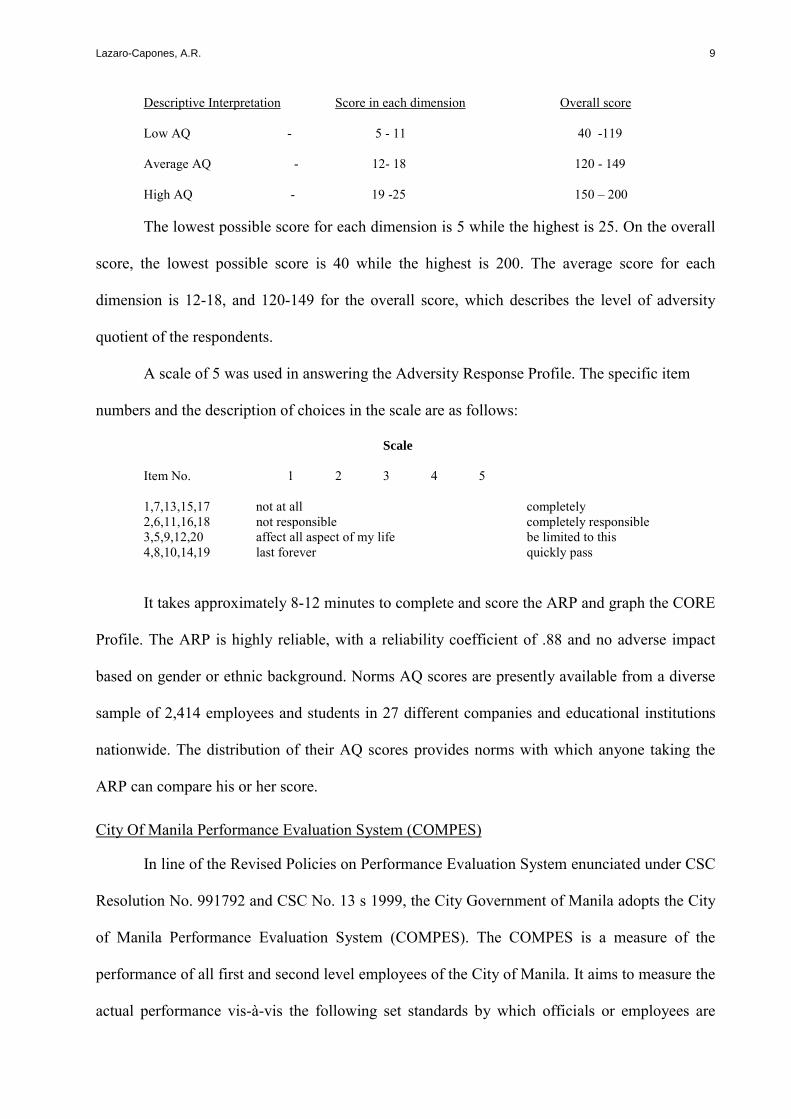
Descriptive Interpretation Score in each dimension Overall score
Low AQ - 5 - 11 40 -119
Average AQ - 12- 18 120 - 149
High AQ - 19 -25 150 – 200
The lowest possible score for each dimension is 5 while the highest is 25. On the overall
score, the lowest possible score is 40 while the highest is 200. The average score for each
dimension is 12-18, and 120-149 for the overall score, which describes the level of adversity
quotient of the respondents.
A scale of 5 was used in answering the Adversity Response Profile. The specific item
numbers and the description of choices in the scale are as follows:
Scale
Item No. 1 2 3 4 5
1,7,13,15,17 not at all completely 2,6,11,16,18 not responsible completely responsible 3,5,9,12,20 affect all aspect of my life be limited to this 4,8,10,14,19 last forever quickly pass
It takes approximately 8-12 minutes to complete and score the ARP and graph the CORE
Profile. The ARP is highly reliable, with a reliability coefficient of .88 and no adverse impact
based on gender or ethnic background. Norms AQ scores are presently available from a diverse
sample of 2,414 employees and students in 27 different companies and educational institutions
nationwide. The distribution of their AQ scores provides norms with which anyone taking the
ARP can compare his or her score.
City Of Manila Performance Evaluation System (COMPES)
In line of the Revised Policies on Performance Evaluation System enunciated under CSC
Resolution No. 991792 and CSC No. 13 s 1999, the City Government of Manila adopts the City
of Manila Performance Evaluation System (COMPES). The COMPES is a measure of the
performance of all first and second level employees of the City of Manila. It aims to measure the
actual performance vis-à-vis the following set standards by which officials or employees are
Lazaro-Capones, A.R.
10
evaluated against to determine individual and organizational productivity.
In order to closely monitor the accomplishments of employee, performance evaluation is
done every after six (6) months ending on June 30 and December 30 of every year, with a
minimum evaluation period of ninety days or three months.
The overall rating of employees for a given period consists of two (2) parts namely,
Work Performance and Behaviorally Anchored Performance (refer to Appendix F)
Part I – Work Performance
Part I is given a weight of 70% of the overall rating of the employees. This part is
concerned with the evaluation of the actual accomplishment vis-à-vis the planned level of
performance in terms of quantity, quality and timeliness of work, which is further based on set
standards by management.
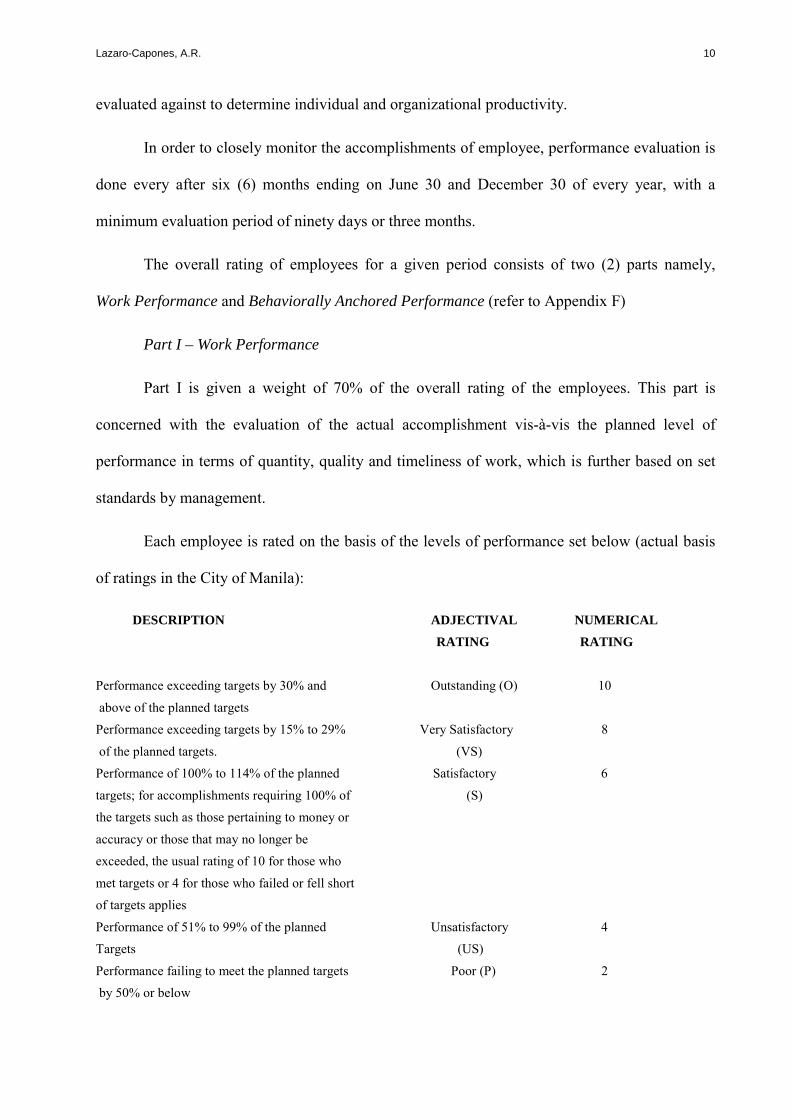
Each employee is rated on the basis of the levels of performance set below (actual basis
of ratings in the City of Manila):
DESCRIPTION ADJECTIVAL NUMERICAL
RATING RATING
Performance exceeding targets by 30% and Outstanding (O) 10
above of the planned targets
Performance exceeding targets by 15% to 29% Very Satisfactory 8
of the planned targets. (VS)
Performance of 100% to 114% of the planned Satisfactory 6
targets; for accomplishments requiring 100% of (S)
the targets such as those pertaining to money or
accuracy or those that may no longer be
exceeded, the usual rating of 10 for those who
met targets or 4 for those who failed or fell short
of targets applies
Performance of 51% to 99% of the planned Unsatisfactory 4
Targets (US)
Performance failing to meet the planned targets Poor (P) 2
by 50% or below
Lazaro-Capones, A.R.
11
Part II - Behaviorally Anchored Performance
This part, which is further divided to II-A (punctuality & attendance and uniform) and II-B
(personality factors), is given a weight of 30% of the overall rating of the employees.
Behaviorally Anchored performance factors reflect the behavioral dimensions that affect the job
performance of the employee.
Activities that reflect the critical attitudes of the employees towards his duties and
responsibilities are also included in this part such as the day to day decorum and compliance to
certain civil service rules and regulations (daily observance of the employees, such as,
attendance & punctuality, as measured by the following: absences, tardiness, non-wearing of
uniform, non-wearing of ID’s, attendance in flag raising & flag retreat and other official
mandatory activities).
Each employee is rated on at least five (5) behaviorally anchored factors applicable to the job
requirements. Factors like courtesy, honesty, cooperativeness, human relations and
communications skills may be used for those rendering frontline services. Factors like job
knowledge, organizational ability, judgment/decision making and other management skills may
be used for those performing technical and supervisory positions.
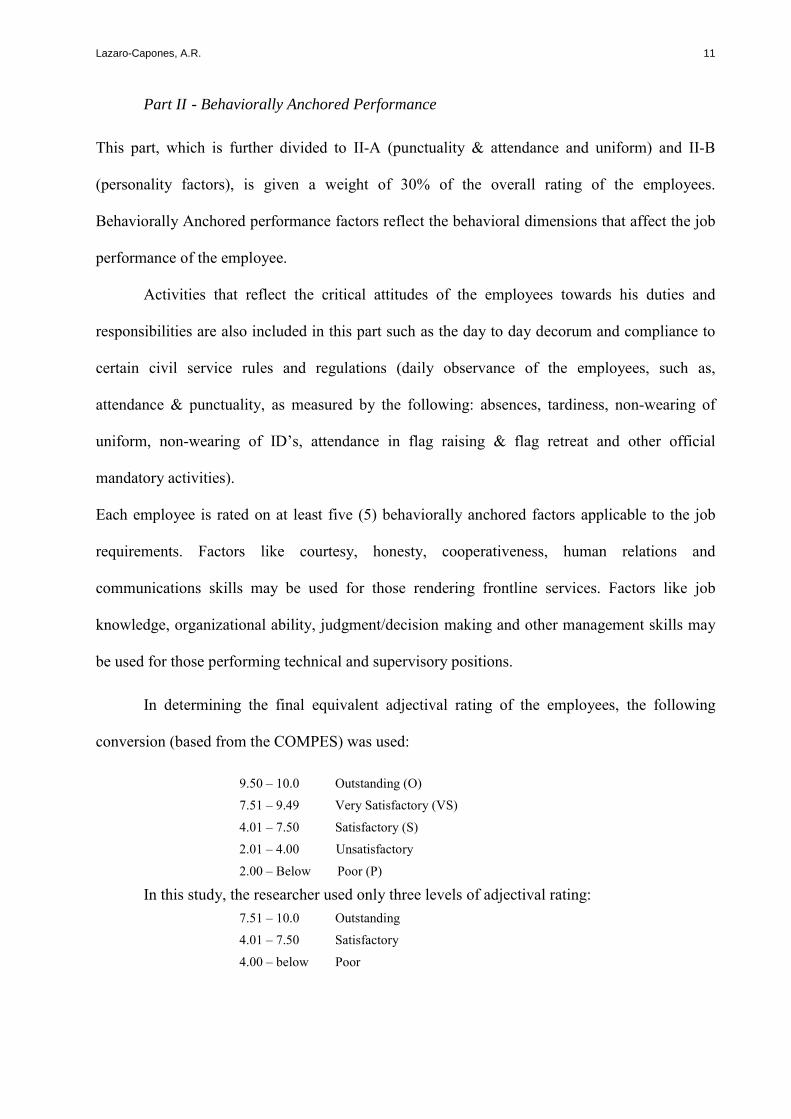
In determining the final equivalent adjectival rating of the employees, the following
conversion (based from the COMPES) was used:
9.50 – 10.0 Outstanding (O)
7.51 – 9.49 Very Satisfactory (VS)
4.01 – 7.50 Satisfactory (S)
2.01 – 4.00 Unsatisfactory
2.00 – Below Poor (P)
In this study, the researcher used only three levels of adjectival rating: 7.51 – 10.0 Outstanding
4.01 – 7.50 Satisfactory
4.00 – below Poor
Lazaro-Capones, A.R.
12
The 360-degree Feedback System
The 360-degree feedback system is a form of multi-rater and multi-level feedback. In this
feedback system, employees are provided feedback from a number of different sources (also
from different levels within the organization; supervisors, peers, and subordinates). It is used
whenever an organization wants to measure employee performance or provide employees with a
professional development opportunity. In this study, this system was used to determine the
performance level of middle managers in order to get a complete picture of his performance.
The feedback was collected from a group of raters, which included the respondent’s
supervisors, peer, subordinate and the subject himself. The evaluation of these raters was simply
averaged to determine the 360-degree performance feedback.
Data Gathering Procedure
The researcher secured permission from the City Personnel Office to conduct the
research to different departments of the City of Manila. The City Personnel Chief issued a
memorandum to the department heads. Then, the researcher met with contact persons of each
department to explain the purpose of the research questionnaire. The schedule of testing was
prepared with the assistance of the contact persons designated by the department head.
The researcher kept in mind some key tasks that must be completed in order to generate
valid responses and administered them accordingly. All of the selected respondents, that is,
middle managers were given a letter of introduction, the ARP instruction and response sheets to
complete. They were assured that the results be kept confidential in order to encourage openness
in answering the ARP. Objective and specific performance information for each of the
participating respondents were gathered in one month. The researcher prepared a master data
collection list containing scores of each respondent and the Performance Rating.
Lazaro-Capones, A.R.
13
Statistical Treatment
The statistical treatment employed in this study was based on the statements of the
problem, and hypotheses that generated results.
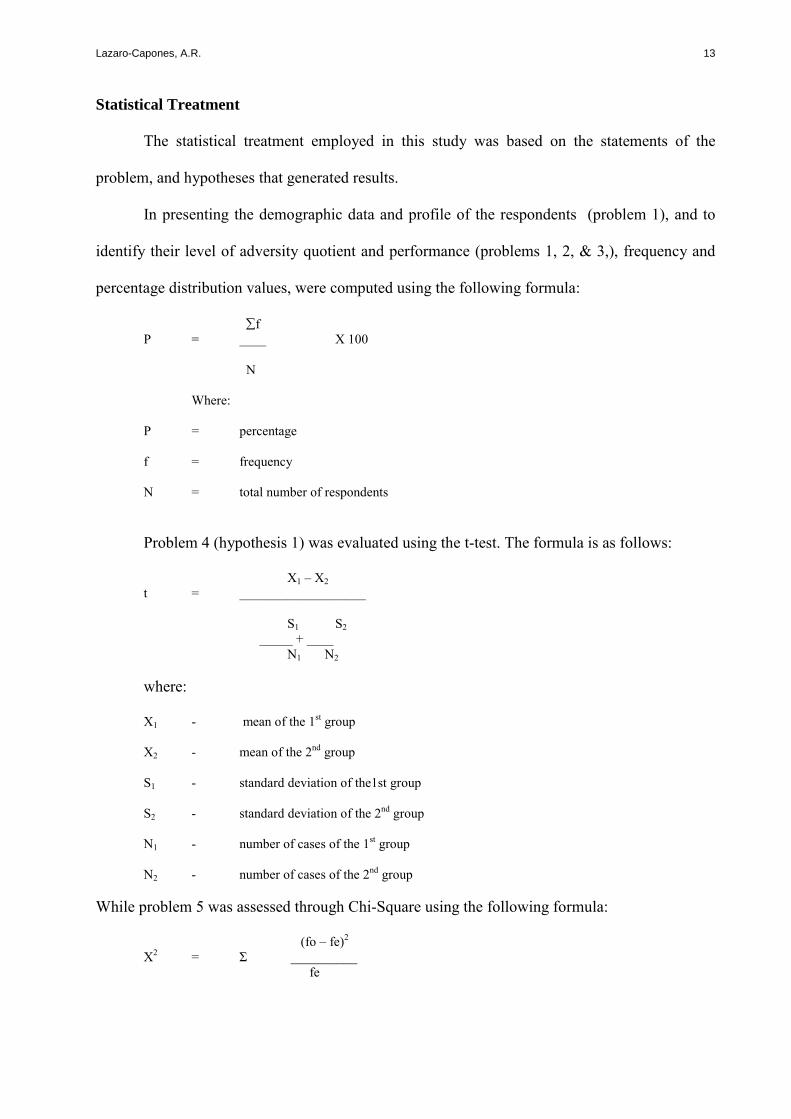
In presenting the demographic data and profile of the respondents (problem 1), and to
identify their level of adversity quotient and performance (problems 1, 2, & 3,), frequency and
percentage distribution values, were computed using the following formula:
∑f P = ____ X 100 N Where:
P = percentage
f = frequency
N = total number of respondents
Problem 4 (hypothesis 1) was evaluated using the t-test. The formula is as follows:
X1 – X2 t = ___________________ S1 S2 _____ + ____ N1 N2
where:
X1 - mean of the 1st group
X2 - mean of the 2nd group
S1 - standard deviation of the1st group
S2 - standard deviation of the 2nd group
N1 - number of cases of the 1st group
N2 - number of cases of the 2nd group
While problem 5 was assessed through Chi-Square using the following formula:
(fo – fe)2 X2 = Σ __________ fe
Lazaro-Capones, A.R.
14
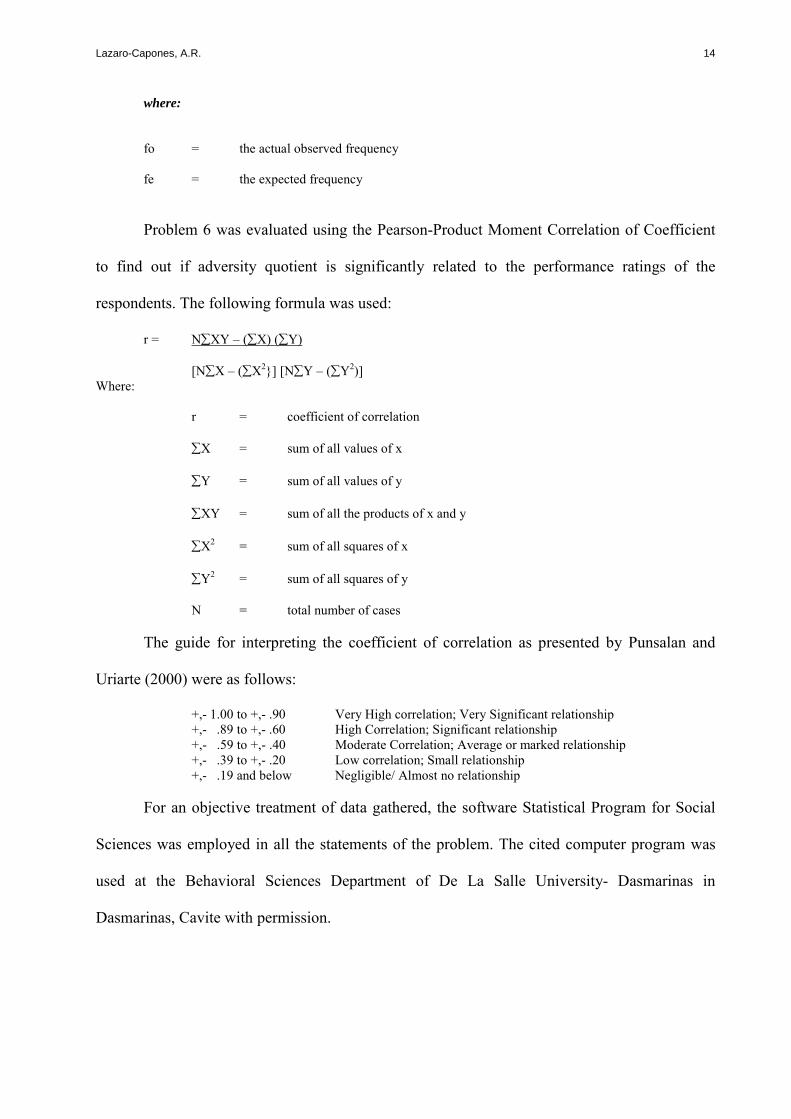
where:
fo = the actual observed frequency
fe = the expected frequency
Problem 6 was evaluated using the Pearson-Product Moment Correlation of Coefficient
to find out if adversity quotient is significantly related to the performance ratings of the
respondents. The following formula was used:
r = N∑XY – (∑X) (∑Y) [N∑X – (∑X2}] [N∑Y – (∑Y2)] Where:
r = coefficient of correlation
∑X = sum of all values of x
∑Y = sum of all values of y
∑XY = sum of all the products of x and y
∑X2 = sum of all squares of x
∑Y2 = sum of all squares of y
N = total number of cases
The guide for interpreting the coefficient of correlation as presented by Punsalan and
Uriarte (2000) were as follows:
+,- 1.00 to +,- .90 Very High correlation; Very Significant relationship +,- .89 to +,- .60 High Correlation; Significant relationship +,- .59 to +,- .40 Moderate Correlation; Average or marked relationship +,- .39 to +,- .20 Low correlation; Small relationship +,- .19 and below Negligible/ Almost no relationship
For an objective treatment of data gathered, the software Statistical Program for Social
Sciences was employed in all the statements of the problem. The cited computer program was
used at the Behavioral Sciences Department of De La Salle University- Dasmarinas in
Dasmarinas, Cavite with permission.
Lazaro-Capones, A.R.
15
RESULTS AND DISCUSSIONS
This chapter presents the gathered data in tabular presentation, analysis and interpretation
of findings based on the results of the statistical treatment applied. The tables are presented with
textual explanation and graphical illustrations for better understanding.
1. What is the demographic profile of the respondents as to age, gender, civil status,
and length of service?
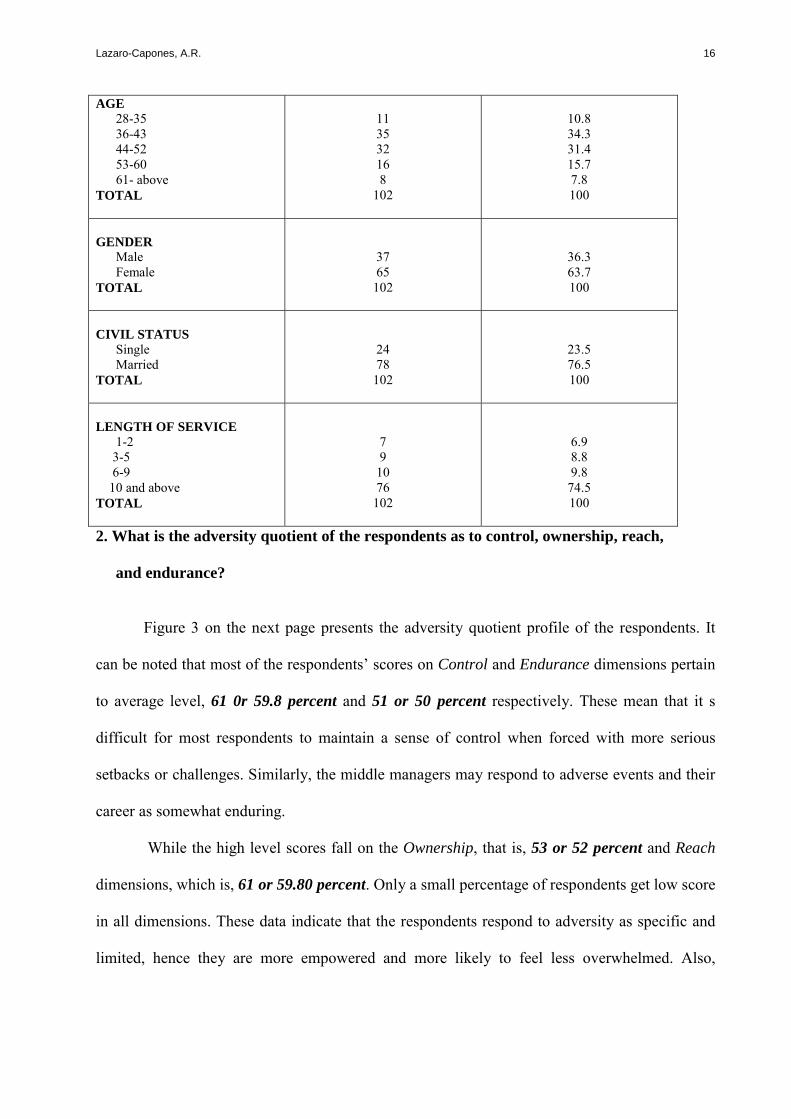
Table 2 shows the demographic profile frequency distribution of middle managers in
terms of age, gender, civil status, and length of service. It is evident that the highest number of
respondents is within the age bracket 36-43 with a frequency of 35 or 34.31 percent followed by
a frequency of 32 or 31.4 percent within the age bracket 44-52. While the lowest number of
respondents belong to age 61 and above with a number of 8 or 7.8 percent. This means that
most of the respondents are in their early adulthood stage.
There are 65 (or 63.7 percent) females and 35 (36.3 percent) male respondents. This
figure shows that there is almost a 2 to 1 ratio of female versus male middle managers of the
City of Manila.
It could also be gleaned from the table that there is a greater number of married
respondents (78 or 76.5 percent) than single (24 or 23.5 percent). This means that the
respondents assume other roles other than being supervisors.
There are 76 (74.5 percent) middle managers who have been in the service for 10 years
and above in the City of Manila. The least frequency is allotted to 1-2 years bracket with a
number of 7 or 6.9 percent. This proves that most of the middle managers are already adjusted
in their place of work as they have stayed considerably long years in the City of Manila.
Table 2. Demographic Profile Frequency Table Distribution of the Respondents
Demographic Variables Frequency Percentage
Lazaro-Capones, A.R.
16
AGE 28-35 36-43 44-52 53-60 61- above TOTAL
11 35 32 16 8
102
10.8 34.3 31.4 15.7 7.8 100
GENDER Male Female TOTAL
37 65
102
36.3 63.7 100
CIVIL STATUS Single Married TOTAL
24 78
102
23.5 76.5 100
LENGTH OF SERVICE 1-2 3-5 6-9 10 and above TOTAL
7 9
10 76
102
6.9 8.8 9.8
74.5 100
2. What is the adversity quotient of the respondents as to control, ownership, reach,
and endurance?
Figure 3 on the next page presents the adversity quotient profile of the respondents. It
can be noted that most of the respondents’ scores on Control and Endurance dimensions pertain
to average level, 61 0r 59.8 percent and 51 or 50 percent respectively. These mean that it s
difficult for most respondents to maintain a sense of control when forced with more serious
setbacks or challenges. Similarly, the middle managers may respond to adverse events and their
career as somewhat enduring.
While the high level scores fall on the Ownership, that is, 53 or 52 percent and Reach
dimensions, which is, 61 or 59.80 percent. Only a small percentage of respondents get low score
in all dimensions. These data indicate that the respondents respond to adversity as specific and
limited, hence they are more empowered and more likely to feel less overwhelmed. Also,
Lazaro-Capones, A.R.
17
respondents sense greater ownership regarding the outcome of adversity and they do not allow
such adversity to influence other areas of their lives.
3. What is the performance level of middle managers as revealed by the 360-degree
feedback system?
The performance ratings of the respondents as revealed by the 360-degree feedback
system are shown in Figure 4. It is evident that no respondent received a low rating from any of
the raters. Majority of the respondents score high on performance rating given by the raters. A
frequency of 72 or 70.6 percent obtains outstanding performance rating from supervisors and 30
or 29.4 percent gets a satisfactory rating. Peer raters approve 58 respondents or 56.9 percent
satisfactory performance rating while 44 or 43.1 percent outstanding performers. On
subordinate ratings, 81 respondents or 79.4 percent gain outstanding level of performance rating
and only 21 or 20.6 percent receives satisfactory performance rating. Self-assessment reveals
that 70 (68.6 percent) respondents obtain outstanding performance rating and 32 (31.4 percent)
have satisfactory performance. These findings reveal that most of the respondents’ performance
exceeded 15-30% of the planned targets.
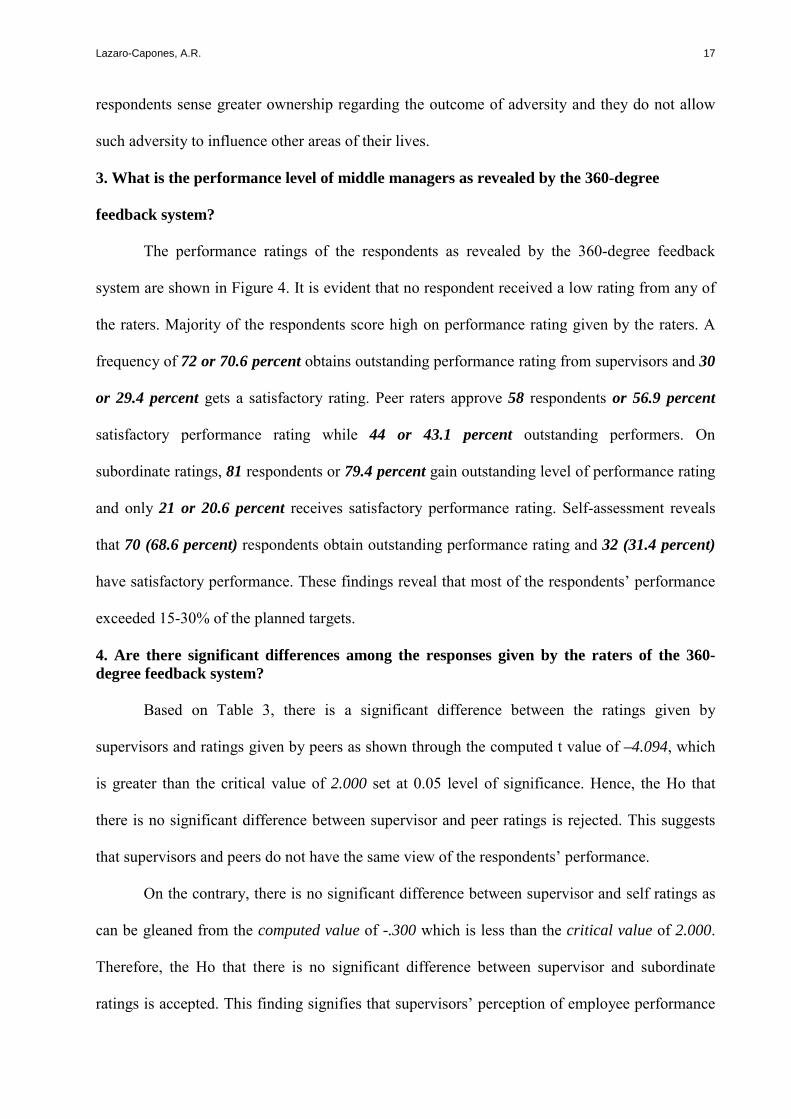
4. Are there significant differences among the responses given by the raters of the 360- degree feedback system?
Based on Table 3, there is a significant difference between the ratings given by
supervisors and ratings given by peers as shown through the computed t value of –4.094, which
is greater than the critical value of 2.000 set at 0.05 level of significance. Hence, the Ho that
there is no significant difference between supervisor and peer ratings is rejected. This suggests
that supervisors and peers do not have the same view of the respondents’ performance.
On the contrary, there is no significant difference between supervisor and self ratings as
can be gleaned from the computed value of -.300 which is less than the critical value of 2.000.
Therefore, the Ho that there is no significant difference between supervisor and subordinate
ratings is accepted. This finding signifies that supervisors’ perception of employee performance
Lazaro-Capones, A.R.
18
does not differ from that of the self. This result is supported by the study of Williams & Levy
(1992) who found that employees gave ratings to themselves similar to that given by their
supervisors. However, this finding is contradicted by Mount (1984). He found that supervisors’
assessment was different from the managers’ self-assessments.
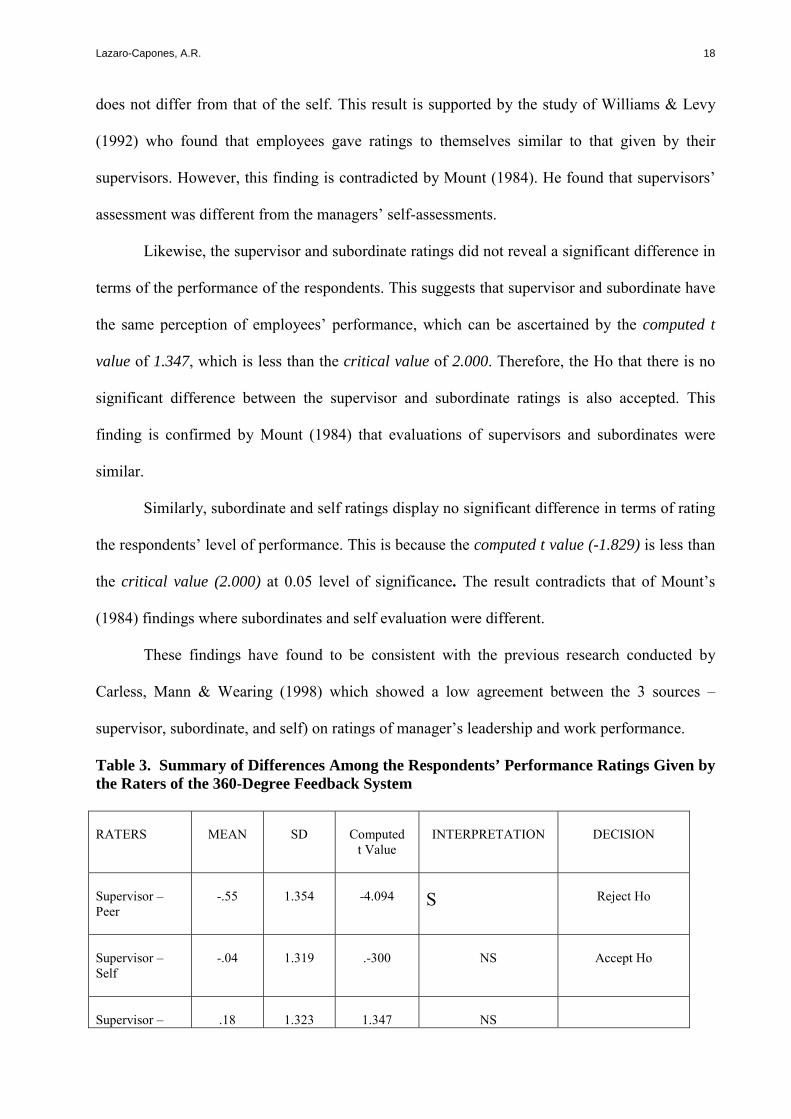
Likewise, the supervisor and subordinate ratings did not reveal a significant difference in
terms of the performance of the respondents. This suggests that supervisor and subordinate have
the same perception of employees’ performance, which can be ascertained by the computed t
value of 1.347, which is less than the critical value of 2.000. Therefore, the Ho that there is no
significant difference between the supervisor and subordinate ratings is also accepted. This
finding is confirmed by Mount (1984) that evaluations of supervisors and subordinates were
similar.
Similarly, subordinate and self ratings display no significant difference in terms of rating
the respondents’ level of performance. This is because the computed t value (-1.829) is less than
the critical value (2.000) at 0.05 level of significance. The result contradicts that of Mount’s
(1984) findings where subordinates and self evaluation were different.
These findings have found to be consistent with the previous research conducted by
Carless, Mann & Wearing (1998) which showed a low agreement between the 3 sources –
supervisor, subordinate, and self) on ratings of manager’s leadership and work performance.
Table 3. Summary of Differences Among the Respondents’ Performance Ratings Given by the Raters of the 360-Degree Feedback System
RATERS
MEAN
SD
Computed
t Value
INTERPRETATION
DECISION
Supervisor – Peer
-.55
1.354
-4.094
S
Reject Ho
Supervisor – Self
-.04
1.319
.-300
NS
Accept Ho
Supervisor –
.18
1.323
1.347
NS
Lazaro-Capones, A.R.
19
Subordinate
Accept Ho
Peer – Subordinate
.73
1.153
6.354
S
Reject Ho
Peer – Self
.51
1.370
3.759
S
Reject Ho
Subordinate – Self
-.22
1.191
-1.829
NS
Accept Ho
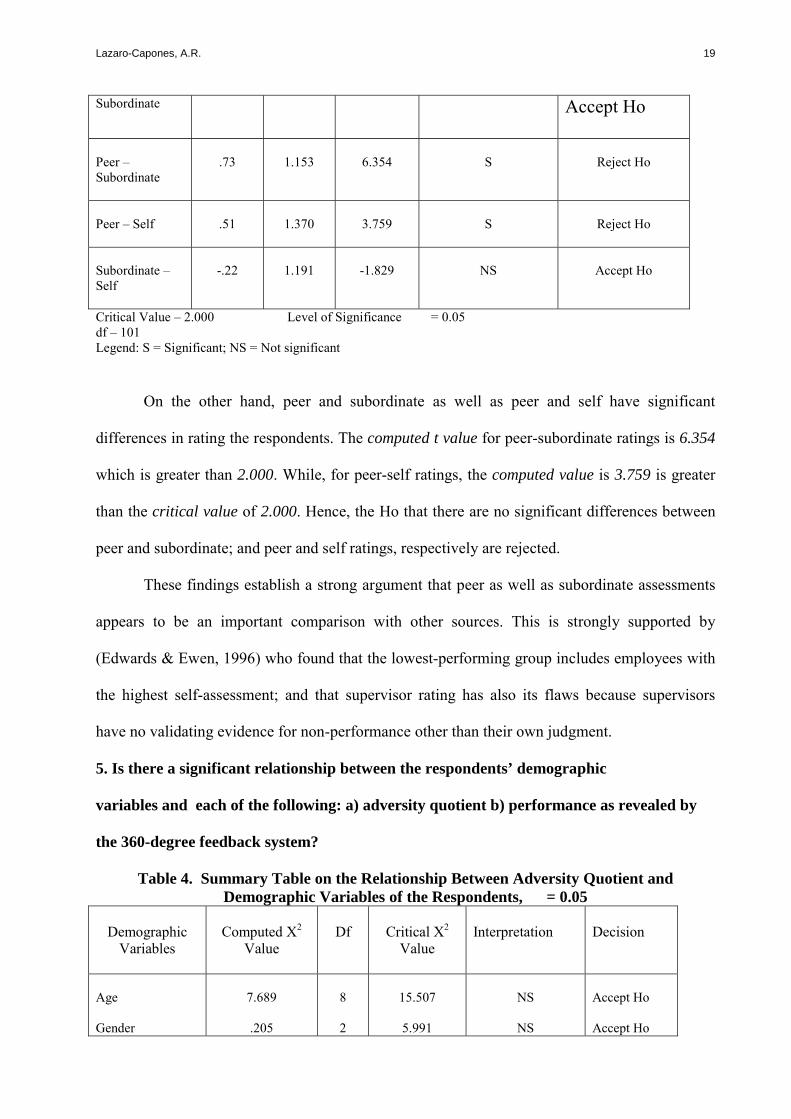
Critical Value – 2.000 Level of Significance = 0.05 df – 101 Legend: S = Significant; NS = Not significant
On the other hand, peer and subordinate as well as peer and self have significant
differences in rating the respondents. The computed t value for peer-subordinate ratings is 6.354
which is greater than 2.000. While, for peer-self ratings, the computed value is 3.759 is greater
than the critical value of 2.000. Hence, the Ho that there are no significant differences between
peer and subordinate; and peer and self ratings, respectively are rejected.
These findings establish a strong argument that peer as well as subordinate assessments
appears to be an important comparison with other sources. This is strongly supported by
(Edwards & Ewen, 1996) who found that the lowest-performing group includes employees with
the highest self-assessment; and that supervisor rating has also its flaws because supervisors
have no validating evidence for non-performance other than their own judgment.
5. Is there a significant relationship between the respondents’ demographic
variables and each of the following: a) adversity quotient b) performance as revealed by
the 360-degree feedback system?
Table 4. Summary Table on the Relationship Between Adversity Quotient and Demographic Variables of the Respondents, = 0.05
Demographic
Variables
Computed X2
Value
Df
Critical X2
Value
Interpretation
Decision
Age Gender
7.689
.205
8
2
15.507
5.991
NS
NS
Accept Ho Accept Ho
Lazaro-Capones, A.R.
20
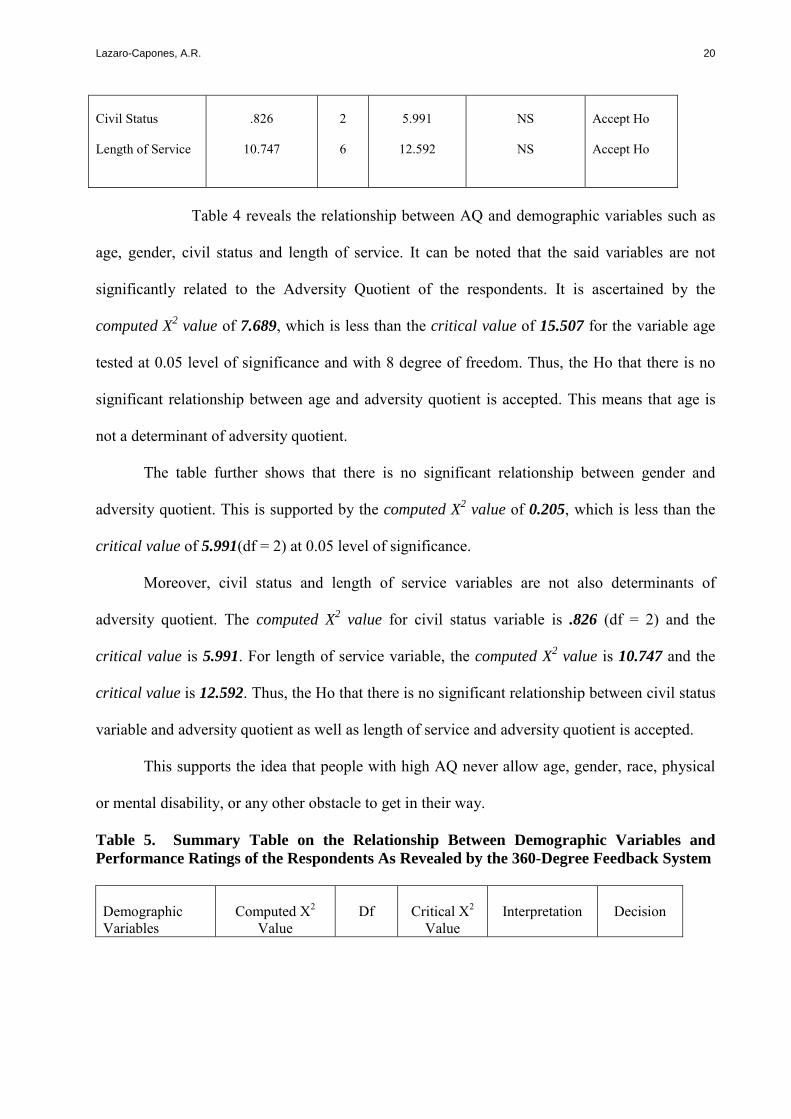
Civil Status Length of Service
.826
10.747
2
6
5.991
12.592
NS
NS
Accept Ho Accept Ho
Table 4 reveals the relationship between AQ and demographic variables such as
age, gender, civil status and length of service. It can be noted that the said variables are not
significantly related to the Adversity Quotient of the respondents. It is ascertained by the
computed X2 value of 7.689, which is less than the critical value of 15.507 for the variable age
tested at 0.05 level of significance and with 8 degree of freedom. Thus, the Ho that there is no
significant relationship between age and adversity quotient is accepted. This means that age is
not a determinant of adversity quotient.
The table further shows that there is no significant relationship between gender and
adversity quotient. This is supported by the computed X2 value of 0.205, which is less than the
critical value of 5.991(df = 2) at 0.05 level of significance.
Moreover, civil status and length of service variables are not also determinants of
adversity quotient. The computed X2 value for civil status variable is .826 (df = 2) and the
critical value is 5.991. For length of service variable, the computed X2 value is 10.747 and the
critical value is 12.592. Thus, the Ho that there is no significant relationship between civil status
variable and adversity quotient as well as length of service and adversity quotient is accepted.
This supports the idea that people with high AQ never allow age, gender, race, physical
or mental disability, or any other obstacle to get in their way.
Table 5. Summary Table on the Relationship Between Demographic Variables and Performance Ratings of the Respondents As Revealed by the 360-Degree Feedback System Demographic Variables
Computed X2
Value
Df
Critical X2
Value
Interpretation
Decision
Lazaro-Capones, A.R.
21
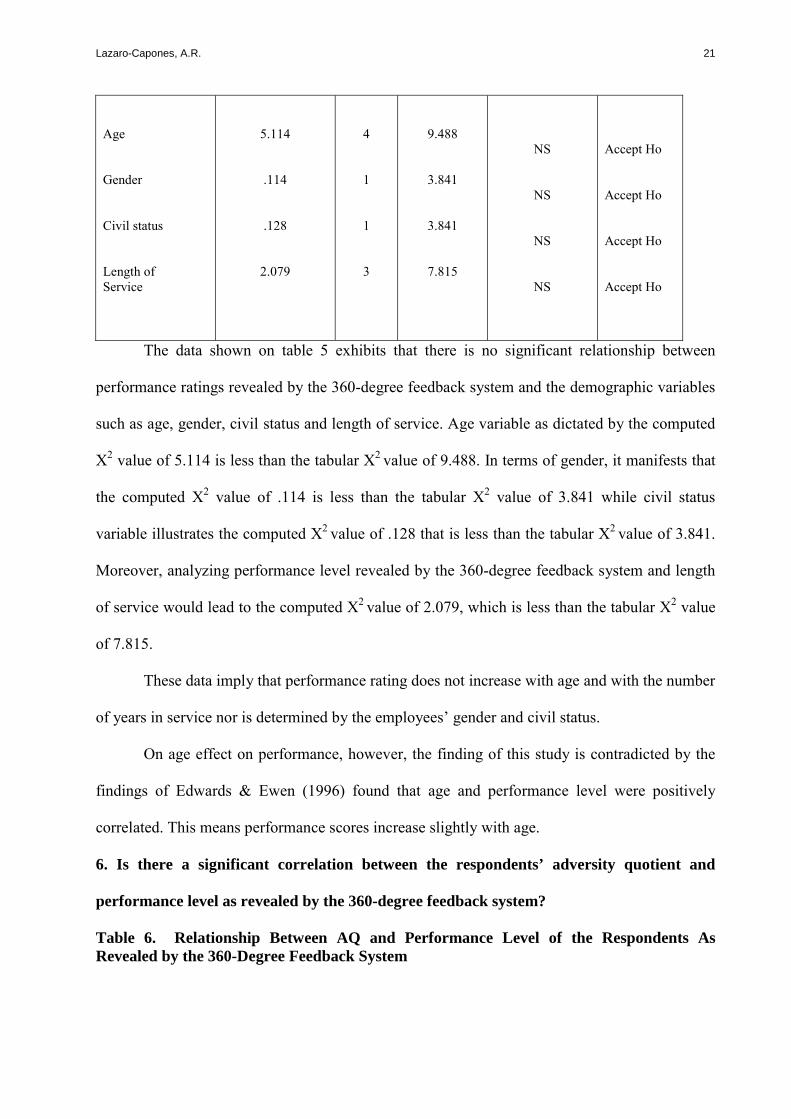
Age Gender Civil status Length of Service
5.114
.114
.128
2.079
4
1
1
3
9.488
3.841
3.841
7.815
NS
NS
NS
NS
Accept Ho Accept Ho Accept Ho Accept Ho
The data shown on table 5 exhibits that there is no significant relationship between
performance ratings revealed by the 360-degree feedback system and the demographic variables
such as age, gender, civil status and length of service. Age variable as dictated by the computed
X2 value of 5.114 is less than the tabular X2 value of 9.488. In terms of gender, it manifests that
the computed X2 value of .114 is less than the tabular X2 value of 3.841 while civil status
variable illustrates the computed X2 value of .128 that is less than the tabular X2 value of 3.841.
Moreover, analyzing performance level revealed by the 360-degree feedback system and length
of service would lead to the computed X2 value of 2.079, which is less than the tabular X2 value
of 7.815.
These data imply that performance rating does not increase with age and with the number
of years in service nor is determined by the employees’ gender and civil status.
On age effect on performance, however, the finding of this study is contradicted by the
findings of Edwards & Ewen (1996) found that age and performance level were positively
correlated. This means performance scores increase slightly with age.
6. Is there a significant correlation between the respondents’ adversity quotient and
performance level as revealed by the 360-degree feedback system?
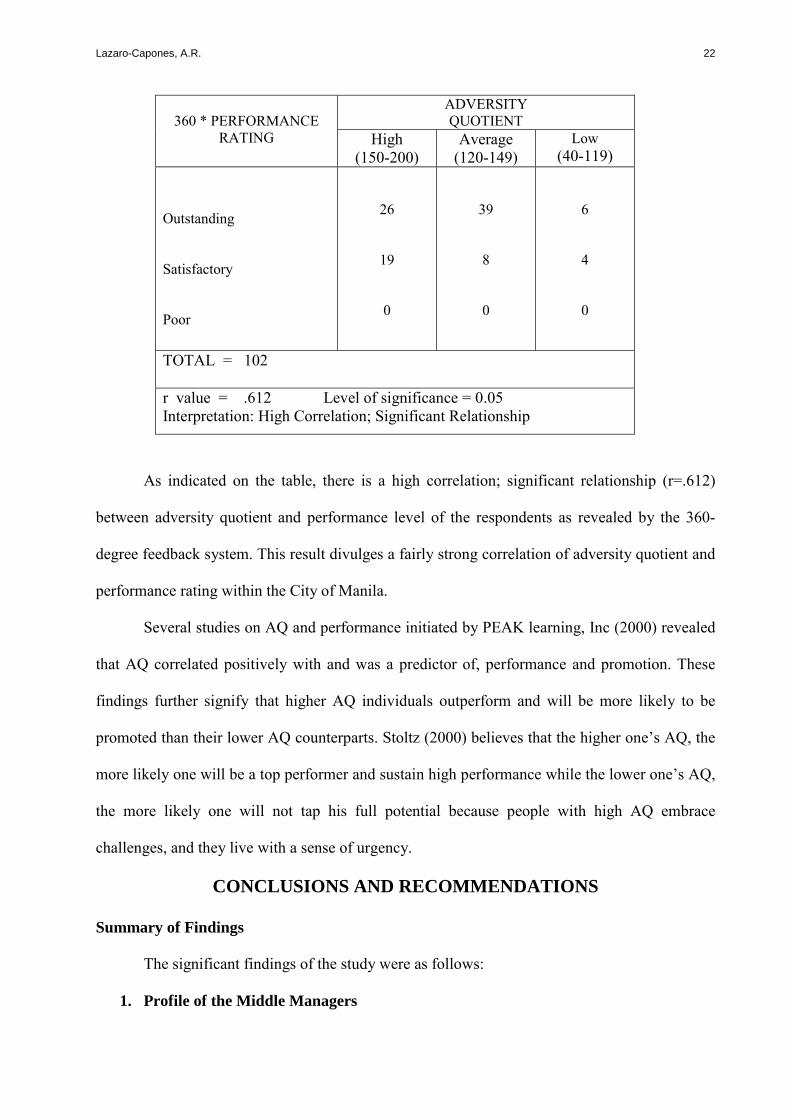
Table 6. Relationship Between AQ and Performance Level of the Respondents As Revealed by the 360-Degree Feedback System
Lazaro-Capones, A.R.
22
ADVERSITY QUOTIENT
360 * PERFORMANCE
RATING High (150-200)
Average (120-149)
Low (40-119)
Outstanding Satisfactory Poor
26
19
0
39
8
0
6
4
0
TOTAL = 102
r value = .612 Level of significance = 0.05 Interpretation: High Correlation; Significant Relationship
As indicated on the table, there is a high correlation; significant relationship (r=.612)
between adversity quotient and performance level of the respondents as revealed by the 360-
degree feedback system. This result divulges a fairly strong correlation of adversity quotient and
performance rating within the City of Manila.
Several studies on AQ and performance initiated by PEAK learning, Inc (2000) revealed
that AQ correlated positively with and was a predictor of, performance and promotion. These
findings further signify that higher AQ individuals outperform and will be more likely to be
promoted than their lower AQ counterparts. Stoltz (2000) believes that the higher one’s AQ, the
more likely one will be a top performer and sustain high performance while the lower one’s AQ,
the more likely one will not tap his full potential because people with high AQ embrace
challenges, and they live with a sense of urgency.
CONCLUSIONS AND RECOMMENDATIONS
Summary of Findings
The significant findings of the study were as follows:
1. Profile of the Middle Managers
Lazaro-Capones, A.R.
23
Majority of the respondents are within the age bracket 36-43 (34.31%). There is a
greater number of female (63.7%) than male respondents; mostly married (76.5%) with the
highest frequency of length of service of 10 years and above (74.5%) in the City of Manila.
2. Adversity Quotient of the Middle Managers
Most of the respondents have average level (46.1%) and high level (44.1%) of
adversity quotient, which proves that they have the potential to be top performers. Further, most
of the respondents obtain average level (59.8%) on Control dimension, which suggests that
respondents have average control over events that affect their life circumstances.
While most of the middle managers achieve high score on Ownership dimension
(52%), which means that they sense greater ownership regarding the outcome of adversity.
On the other hand, a greater number of respondents (59.8%) have high score on
Reach dimension. This result indicates that respondents do not allow any adversity to influence
other areas of their lives.
On Endurance dimension, the highest frequency (50%) of respondents falls into
average level. This suggests that respondents more likely see adversities as temporary—rather
than enduring—set backs.
3. Performance Ratings of the Middle Managers As Revealed by the 360-Degree
Feedback System.
No respondent received a low rating from any of the raters. Majority of the
respondents scored high on performance rating given by all raters. Based on the 360-degree
feedback system, a great number of middle managers obtain high (69.6%) performance rating
that helps them perform as assets of the departments of the City of Manila. Supervisor (70.6%),
subordinate (79.4%) and Self (68.6%) ratings reveal high performance level of the respondents.
On the other hand, majority of peer raters evaluation of the respondents’ performance fall on the
average level. These findings support the idea that supervisor, as well as subordinate ratings
Lazaro-Capones, A.R.
24
tends to be inflated; and that many people tend to have a higher opinion of themselves than do
others.
4. Mean Differences of the Performance Level of the Middle Managers.
Among the raters—peer- subordinate (computed t value = 6.354) and peer-self
(computed t value = 3.759) and peer-supervisor (computed t value = -4.094) have found to
have significant differences in rating the middle managers’ level of performance. These findings
establish a strong argument that peer as well as subordinate assessments appears to be an
important comparison with other sources.
5. Relationship of the demographic profile variables and each of the following:
adversity quotient and performance ratings of the middle managers.
The demographic variables such as age, gender, civil status, and length of service
have been found to have no significant relationship with adversity quotient and performance
rating of middle managers. These results prove that age, gender, civil status, and length of
service do not affect one’s level of adversity quotient and performance.
6. Correlation Between Adversity Quotient and Performance Ratings
Adversity quotient registered a high correlation (r =.612), significant relationship
with performance rating as revealed by the 360-degree feedback system, which means that
adversity quotient affects performance among middle managers of the City of Manila.
Conclusions
Based from the findings of the study presented, the following conclusions were drawn:
1. Among the raters of the 360-degree feedback system only between peer and supervisor,
peer and subordinate, and peer and self have been found to have significant differences
in rating the middle managers’ level of performance.
2. There is no significant relationship between the demographic variables such as age,
gender, civil status, and length of service and adversity quotient similarly with
performance ratings as revealed by the 360-degree feedback system.
Lazaro-Capones, A.R.
25
3. There is a significant relationship between adversity quotient and performance ratings as
revealed by the 360-degree feedback system.
Recommendations
In the light of the foregoing conclusions, the following recommendations are hereby
forwarded:
1. The present administration of the City of Manila may look into the possibility of
integrating adversity quotient in their existing job specifications or hiring qualifications
in recruiting or promoting middle managers to improve organizational performance.
2. There is a need to sustain and possibly enhance the present level of adversity quotient of
the middle managers of the City of Manila since this significantly relate to their
performance at work.
3. The Human Resources practitioners may include the theory and practice of adversity
quotient in employees’ training and development to instill individual adversity awareness,
thereby, making them conscious to deal with adversity inherent in their jobs.
4. Peer assessment has been found to be significant. A teambuilding or a seminar-workshop
must be designed to enhance harmonious working relationship among people of the same
level in the organizational structure thereby, avoiding professional jealousy.
5. Government agencies as well as other organizations may design a 360-degree
performance appraisal system appropriate to their culture to provide quality of evaluation
results.
6. The results of the study may be shared with organizations, particularly to government
agencies for possible further or follow-up studies.