Embed Size (px)
Citation preview
1
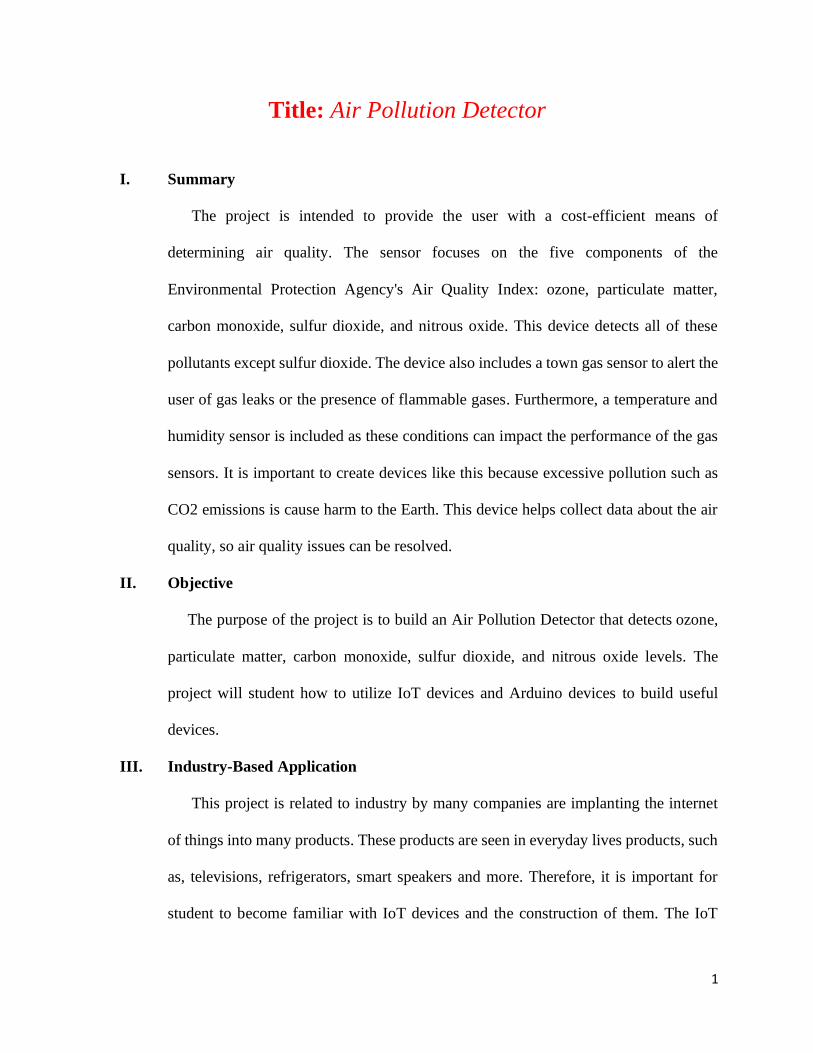
Title: Air Pollution Detector
I. Summary
The project is intended to provide the user with a cost-efficient means of
determining air quality. The sensor focuses on the five components of the
Environmental Protection Agency's Air Quality Index: ozone, particulate matter,
carbon monoxide, sulfur dioxide, and nitrous oxide. This device detects all of these
pollutants except sulfur dioxide. The device also includes a town gas sensor to alert the
user of gas leaks or the presence of flammable gases. Furthermore, a temperature and
humidity sensor is included as these conditions can impact the performance of the gas
sensors. It is important to create devices like this because excessive pollution such as
CO2 emissions is cause harm to the Earth. This device helps collect data about the air
quality, so air quality issues can be resolved.
II. Objective
The purpose of the project is to build an Air Pollution Detector that detects ozone,
particulate matter, carbon monoxide, sulfur dioxide, and nitrous oxide levels. The
project will student how to utilize IoT devices and Arduino devices to build useful
devices.
III. Industry-Based Application
This project is related to industry by many companies are implanting the internet
of things into many products. These products are seen in everyday lives products, such
as, televisions, refrigerators, smart speakers and more. Therefore, it is important for
student to become familiar with IoT devices and the construction of them. The IoT

2
devices will be the future of many engineering design projects. This project will
develop the students programming skills and circuit design for real world application
of a product. Also, the project will teach students the importance of monitoring quality
and helping the environment. Furthermore, it shows students that engineering can be
used to design a wide-range of products.
IV. Methodology
a. Components
Control and Power
i. Arduino Uno
ii. 5V power supply
iii. RGB 16x2 LCD shield
Sensors
i. Shinyei PPD42 Particulate Matter Detector
ii. MQ-2 Gas Sensor
iii. MQ-9 Gas Sensor
iv. MiCS-2714 Gas Sensor (NO2)
v. MiSC-2614 Gas Sensor (Ozone)
vi. Keyes DHT11 Temperature and Humidity Sensor
Box and Assembly
i. Access to 3D printer
ii. Solder Board
iii. 5V fan
iv. 10 to 15 wires of gauge 24

3
b. Procedures
Figure 1- The figure above is the circuit diagram for the air pollution detector
i. Figure 1 contains the circuit diagram for the air pollution detector to be
constructed. Most of the digital ports and analog ports can be changed on
the Arduino can be changed but the code will have to be modified as well.
Particulate Matter Sensor

4
Figure 2- The picture display the Shinyei PPD42 Dust Sensors
ii. The two Shinyei PPD42 Dust Sensors are used to collect data about
particulate matter.
iii. Each Shinyei Detector has two signal outputs: one for small particulate
matter (left yellow wire shown in Figure 2) and one for larger particulate
matter. The larger particulate line in figure 2 in empty, but another wire is
connected to complete this functionality. These output signals are connected
to digital inputs on the Arduino. The detector needs to be powered by
supplying +5V and ground to the ports on the detector. See the overall
circuit diagram for further connectors.
iv. Each detector uses an infrared LED and a photodetector to measure
scattering off of small airborne particulates. Internal circuitry turns the
photodetector output into digital output signals. Generally, the sensor
outputs a +5V signal, when it detects particles is sends out a low-voltage
pulse. The fraction of the time that the output signal is low or the "low-pulse

5
occupancy percentage" is proportional to the concentration of particulate
matter in the air.
Gas Sensor Circuit Board
Figure 3- The circuit diagram shows the connections for a gas sensor
circuit board.
Figure 4- The picture above shows the circuit diagram in figure 3 connected
on the circuit board

6
v. Above is the circuit diagram for the circuit board hosting the gas sensors
and temperature/humidity sensor. Details about mounting each of the
separate devices are in the following steps. Note that the circuit board can
look different from the picture physically. It should work just as well as
long as you follow the circuit diagram.
Figure 5- The figure above shows the surface-mount sensors connections.
vi. The surface-mount sensors MiCS-2614 and MiCS-2714 are used to detect
Ozone and Nitrogen Dioxide respectively.
vii. Both of these devises use an internal resistor sensing element. The sensing
resistor is connected between the pins (G) and (K) in the diagram above.
Use an ohmmeter to check that you have found the right pins. The resistance
should be on the order of 10-20 kΩ.
viii. Both devices also have a heating element between pins (A) and (H). This
heating element keeps the sensing element at the appropriate temperature.
The resistance of the heating element is 50-60Ω.

7
ix. Ideally these devices should be surface mounted onto a circuit board.
However, in the absence of a circuit board printer it is still possible to
carefully solder to the back of these devices using very low temperature
solder.
x. As shown in the solder board circuit diagram, place the 82Ω resistor and the
131Ω resistor in series with the heating elements of the MiCS-2614 and
MiCS-2714 units. This ensure that the heating elements receive the proper
level of power. If you don't have access to a 131Ω resistor (it is not a
standard value) use a 120Ω resistor and a 12Ω resistor in series.
xi. Place the sensing resistors in both devises in series with 22kΩ resistors to
create a voltage divider. From the voltage at the output of the voltage divider
the students can calculate the sensing resistance.
RSensing = 22kΩ x (5 𝑉𝑜𝑙𝑡𝑠
𝑉𝑂𝑈𝑇−1)
MQ Toxic Gas Sensors

8
Figure 6- The figure above shoes the MQ toxic gas sensors pins.
xii. MQ-2 and MQ-9 gas sensors are used to measure toxic gasses including
Propane, Butane, LPG and Carbon Monoxide.
xiii. The MQ-2 and MQ-9 are very similar to the MiCS detectors. The sensors
use a gas-sensitive resistor (SnO2) to detect concentrations of toxic gases
and have an internal heating element to keep the sensor at the right
temperature. The circuits are used for these devises are practically the same
as the circuits for the MiCS sensors, except that we use a transistor rather
than a resistor to regulate heater power in the MQ-9.
xiv. Refer to the solder board circuit diagram for mounting details. For the MQ-
2 sensor, connect the pins marked A to the 5V power, connect the pin
marked G to ground, and connect the pin marked S is connected to ground
in series with a 47 kΩ resistor. For the MQ-9 gas sensor, connect the pin
marked A to the transistor, the pin marked B to the 5 V power, the pin
marked G to ground, and the pin marked S to ground in series with a 10 kΩ
resistor.
Temperature and Humidity Sensors

9
Figure 7- The picture above shows a temperature and humidity sensors
xv. This sensor is implemented because temperature and humidity play a role
in the gas concentrations that the sensors detect.
xvi. High humidity and temperature as well as dramatic changes in either would
have detrimental effects on the accuracy of readings It is therefore helpful
to be able to monitor these variables. Both temperature and humidity can be
read from this single sensor. Oriented as it is in the photo above, the left pin
is to be attached to power, the middle pin is the output signal, and the right
pin is grounded. The output signal for this component goes to a digital port
on the Arduino. The code is set up such expecting the temperature signal in
digital port 2. This can be changed to another digital port should you need
to; simply alter the code in accordance to what port you have chosen. Refer
to the solder board diagram to use this component.
Power and Fan
Figure 8- The figure above shows the fan and power for the design

10
xvii. The circuit diagram for the entire project, you will see that the students need
only one input voltage of 5 V. A common adaptor like the one shown above
can be used to power the project. Furthermore, the students will need a fan
to ensure airflow through the box and prevent overheating. The fan used
above but any fan that uses 5 V and is of the appropriate size can be used.
Container
xviii. While there are many ways to make an effective box, the group chose to use
an UP 3D printer for our box. We have attached the STL that we used for
the final printing. The students can build a box out of any materials instead
of 3D printing.
Coding
xix. The code for extracting raw data from the device is attached. This code will
print the sensor resistance values, Shinyei PPD42 low-pulse occupancy
percentages, and temperature and humidity readings to the computer via the
serial monitor. It will cycle through the raw data on LCD screen as well.
xx. In order to make the code work you will first need to download the libraries
for the LCD shield and temperature and humidity sensors. You will find the
libraries at the following websites
xxi. LCD shield code: https://learn.adafruit.com/rgb-lcd-shield/using-th...
xxii. Temperature and humidity sensor code: https://github.com/adafruit/DHT-
sensor-library
Interpreting the Data

11
xxiii. In the process of determining how to transform raw sensor values into
meaningful outputs. Calibration against known pollution sources will
eventually be necessary to ensure accuracy. In meantime we have used
sensor data sheets and prior research to make approximations.
xxiv. To estimate particulate matter concentrations, we use information from a
research paper by David Holstius. The paper correlates the Shinyei PPD42
dust sensor outputs with EPA measurements. The graphs in the appendix
show best fit lines for the data. We used the graphs to approximate PM2.5
concentrations in micrograms per cubic meter as:
PM2.5 = 5 + 5 * (small PM low-pulse occupancy percentage)
xxv. To estimate gas concentrations from MiCS gas sensors, we use the graphs
in the datasheets (NO2 and O3) to extract functions relating sensor
resistance to gas concentration.
xxvi. For MQ sensors we use the graphs on the device datasheets to qualitatively
assess the data. When the resistance value drops to less than half of the
resistance in air, it is likely that the devise is detecting the target gasses.
When resistance drops by a factor of 10, the levels of target gas are likely
around 1000 ppm, close to the legal safety limit.
xxvii. Once the students obtain approximate concentrations of the target gasses,
we defer to US government standards to interpret the data. We primarily
use the EPA Technical Assistance Document for the Reporting of Daily Air
Quality and a CDC information sheet on the hazards of propane.

12
xxviii. Unfortunately, the code that interprets the raw data is not yet fully
functional. We hope to be able upload it at a later date.
V. Reference
[1] Instructables. “Air Pollution Detector.” Instructables, Instructables, 8 Oct. 2017,
www.instructables.com/id/Air-Pollution-Detector/.
Website: https://www.instructables.com/id/Air-Pollution-Detector/
VI. Appendix
Code:
// include the library code for LCD shield:
#include <Wire.h>
#include <Adafruit_MCP23017.h>
#include <Adafruit_RGBLCDShield.h>
// include code for temperature and humidity
#include <dht.h>
//Setup Temperature and humidity
#define dht_dpin 2 //chanel for temperature sensor
dht DHT;
//Setup LCD
Adafruit_RGBLCDShield lcd = Adafruit_RGBLCDShield();
// These #defines make it easy to set the backlight color
#define OFF 0x0
#define RED 0x1
#define YELLOW 0x3
#define GREEN 0x2
#define TEAL 0x6
#define BLUE 0x4
#define VIOLET 0x5
#define WHITE 0x7
//ports for input devices
int const smallPM1 = 13;
int const largePM1 = 12;
int const smallPM2 = 5;

13
int const largePM2 = 4;
int const mq2port = A0;
int const NO2port = A2;
int const mq9port = A1;
int const O3port = A3;
int const mq9powerPort = 3;
// constants for use with gas sensors
float const mq2seriesResistor = 47000;
float const NO2seriesResistor = 22000;
float const mq9seriesResistor = 10000;
float const O3seriesResistor = 22000;
// variables for use in running particulate matter calculations
long const sampleRate = 20;
long measurementCount = 0;
long smallPM1Count = 0;
long largePM1Count = 0;
long smallPM2Count = 0;
long largePM2Count = 0;
long priorSampleTime = 0;
double smallPM1percentRunning;
double largePM1percentRunning;
double smallPM2percentRunning;
double largePM2percentRunning;
//variables for gas sensor calcuations
float mq2resistance;
float NO2resistance;
float mq9resistance;
float O3resistance;
//variables for temperature and humidity
int temperature;
int humidity;
//miscellaneous variables
int mq9power = 300;
int displayNumber = 0;
void setup() {
Serial.begin(9600);
lcd.begin(16, 2);
pinMode (smallPM1, INPUT);
pinMode (largePM1, INPUT);
pinMode (smallPM2, INPUT);
14
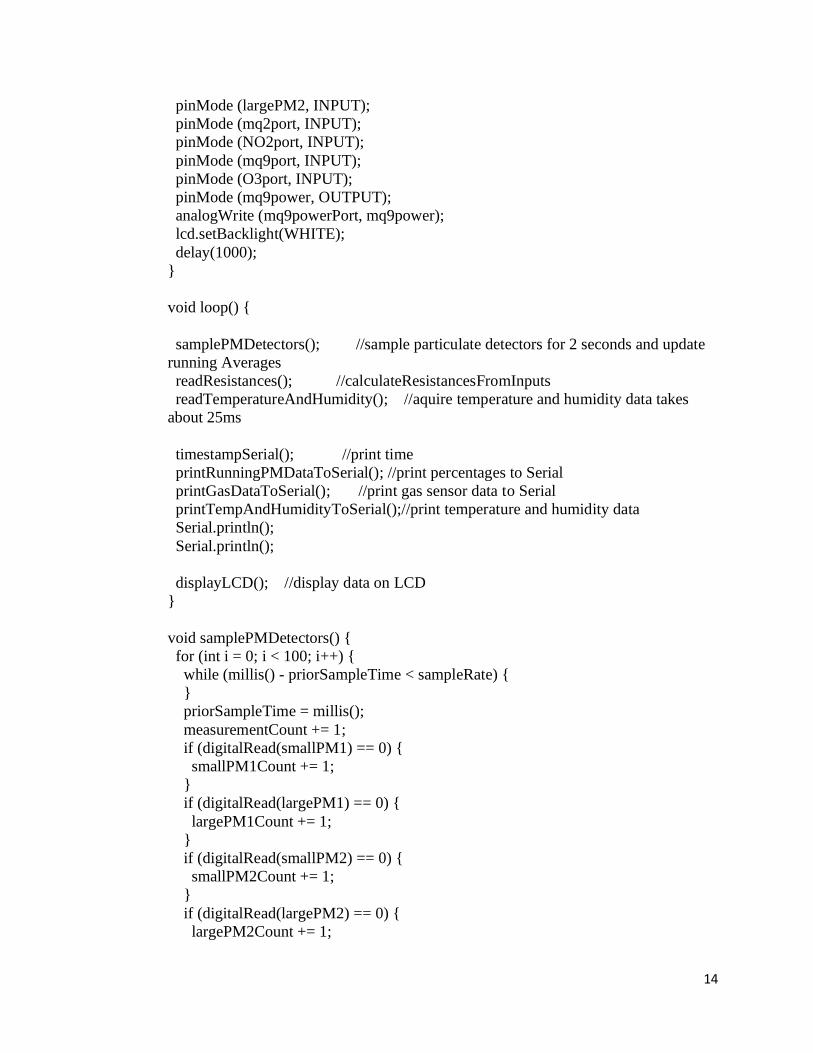
pinMode (largePM2, INPUT);
pinMode (mq2port, INPUT);
pinMode (NO2port, INPUT);
pinMode (mq9port, INPUT);
pinMode (O3port, INPUT);
pinMode (mq9power, OUTPUT);
analogWrite (mq9powerPort, mq9power);
lcd.setBacklight(WHITE);
delay(1000);
}
void loop() {
samplePMDetectors(); //sample particulate detectors for 2 seconds and update
running Averages
readResistances(); //calculateResistancesFromInputs
readTemperatureAndHumidity(); //aquire temperature and humidity data takes
about 25ms
timestampSerial(); //print time
printRunningPMDataToSerial(); //print percentages to Serial
printGasDataToSerial(); //print gas sensor data to Serial
printTempAndHumidityToSerial();//print temperature and humidity data
Serial.println();
Serial.println();
displayLCD(); //display data on LCD
}
void samplePMDetectors() {
for (int i = 0; i < 100; i++) {
while (millis() - priorSampleTime < sampleRate) {
}
priorSampleTime = millis();
measurementCount += 1;
if (digitalRead(smallPM1) == 0) {
smallPM1Count += 1;
}
if (digitalRead(largePM1) == 0) {
largePM1Count += 1;
}
if (digitalRead(smallPM2) == 0) {
smallPM2Count += 1;
}
if (digitalRead(largePM2) == 0) {
largePM2Count += 1;

15
}
}
//calculate running PM percentages
smallPM1percentRunning = 100.0 * smallPM1Count / measurementCount;
largePM1percentRunning = 100.0 * largePM1Count / measurementCount;
smallPM2percentRunning = 100.0 * smallPM2Count / measurementCount;
largePM2percentRunning = 100.0 * largePM2Count / measurementCount;
}
void readResistances() {
//read gas sensor data
int mq2rawInput = analogRead(mq2port);
int NO2rawInput = analogRead(NO2port);
int mq9rawInput = analogRead(mq9port);
int O3rawInput = analogRead(O3port);
//calculate resistances
mq2resistance = mq2seriesResistor * ((1023.0 / mq2rawInput) - 1.0);
NO2resistance = NO2seriesResistor * ((1023.0 / NO2rawInput) - 1.0);
mq9resistance = mq9seriesResistor * ((1023.0 / mq9rawInput) - 1.0);
O3resistance = NO2seriesResistor * ((1023.0 / O3rawInput) - 1.0);
}
void readTemperatureAndHumidity() {
DHT.read11(dht_dpin);
humidity = (int) DHT.humidity;
temperature = (int) DHT.temperature;
}
void timestampSerial() {
Serial.print("Milliseconds since the program started: ");
Serial.println(millis());
}
void printRunningPMDataToSerial() {
Serial.println("Particulate Matter Data");
Serial.print("Measurement Count: ");
Serial.println(measurementCount);
Serial.print("Small PM detector 1: ");
Serial.println(smallPM1percentRunning);
Serial.print("Large PM detector 1: ");
Serial.println(largePM1percentRunning);
Serial.print("Small PM detector 2: ");
Serial.println(smallPM2percentRunning);
Serial.print("Large PM detector 2: ");
Serial.println(largePM2percentRunning);

16
Serial.println();
}
void printGasDataToSerial() {
Serial.println("Gas Sensor Data");
Serial.print("MQ-2 Resistance: ");
Serial.println(mq2resistance);
Serial.print("NO2 Resistance: ");
Serial.println(NO2resistance);
Serial.print("MQ-9 (CO2) Resistance: ");
Serial.println(mq9resistance);
Serial.print("Ozone Resistance: ");
Serial.println(O3resistance);
Serial.println();
}
void printTempAndHumidityToSerial() {
Serial.println("Temperature and Humidity Data");
Serial.print("temperature = ");
Serial.print(temperature);
Serial.print("C ");
Serial.print("Current humidity = ");
Serial.print(humidity);
Serial.println("% ");
Serial.println();
}
void displayLCD() {
lcd.clear();
lcd.setCursor(0, 0);
switch (displayNumber) {
case 0:
lcd.print("MeasurementTime");
lcd.setCursor(0, 1);
lcd.print(millis() / 1000);
break;
case 1:
lcd.print("SmallPM#1:");
lcd.setCursor(0, 1);
lcd.print(smallPM1percentRunning);
lcd.print(" %");
break;
case 3:
lcd.print("LargePM#1:");

17
lcd.setCursor(0, 1);
lcd.print(largePM1percentRunning);
lcd.print(" %");
break;
case 2:
lcd.print("SmallPM#2:");
lcd.setCursor(0, 1);
lcd.print(smallPM2percentRunning);
lcd.print(" %");
break;
case 4:
lcd.print("LargePM#2:");
lcd.setCursor(0, 1);
lcd.print(largePM2percentRunning);
lcd.print(" %");
break;
case 5:
lcd.print("MQ2 Resistance:");
lcd.setCursor(0, 1);
lcd.print((long) mq2resistance);
lcd.print(" Ohm");
break;
case 6:
lcd.print("MQ9 Resistance:");
lcd.setCursor(0, 1);
lcd.print((long) mq9resistance);
lcd.print(" Ohm");
break;
case 7:
lcd.print("NO2 Resistance:");
lcd.setCursor(0, 1);
lcd.print((long) NO2resistance);
lcd.print(" Ohm");
break;
case 8:
lcd.print("O3 Resistance:");
lcd.setCursor(0, 1);
lcd.print((long) O3resistance);
lcd.print(" Ohm");
break;
case 9:
lcd.print("Temperature");
lcd.setCursor(0, 1);
lcd.print(temperature);
lcd.print("C");
break;

18
case 10:
lcd.print("Humidity");
lcd.setCursor(0, 1);
lcd.print(temperature);
lcd.print("%");
break;
default:
displayNumber = -1;
lcd.clear();
}
displayNumber += 1;
}
Box:
https://cdn.instructables.com/ORIG/FJD/OBVB/I9Q9ERLP/FJDOBVBI9Q9ERLP.stl