Embed Size (px)
Citation preview

Title An Analysis of the Typhoon Eye Formation
Author(s) HETA, Yurie
Citation Bulletin of the Disaster Prevention Research Institute (1993),43(4): 91-110
Issue Date 1993-12
URL http://hdl.handle.net/2433/124996
Right
Type Departmental Bulletin Paper
Textversion publisher
Kyoto University

Bull. Disas. Prey. Res. Inst., Kyoto Univ., Vol. 43, Part 4, No. 377, December, 1993 91
An Analysis of the Typhoon Eye Formation
Yurie HETA
(Manuscript received on July 4, 1993; revised on Nov. 12, 1993)
Abstract
The process of the eye formation was analyzed using the hourly infrared radiometer measurement from the Geostationary Meteorological Satellite (GMS) for two typhoons in September, 1990. Typhoon Flo
(T9019) showed typical development with the formation of a clear eye. While Typhoon Ed (T9018) did not have a clear eye but finally had a banding-type eye.
For both typhoons, the eye first appeared not at the central part but at the edge of a convective cloud, as the deep convective cloud cyclonically circumscribed the warm region. This eye did not continue to be observed from the infrared (IR) data, alternatively appeared and disappeared. Disappearance of the eye is thought to be caused by the cirrus cloud. The rapid developing of T9019 was recognized after the completion of a clear eye with subsiding.
The typhoons had the axis-asymmetric structures in the intensifying stage. And the hourly change of the cloud features were unexpectedly conspicuous for the both typhoons.
1. Introduction
The typhoon eye is an important part of the structure of the tropical cyclone relating to the development of the typhoon. Based on aircraft reconnaissance in the Western Pacific, Weatherford and Gray) reported that the percentage of typhoons with an eye increases with the decrease of the central pressure. Especially in the intensifying stage, about 60% of the typhoons with a central pressure of 980 mb have eyes and 100% of those with less than 950 mb. Mitsuta et a12) explained that among the weather systems the tornado and the tropical cyclone are the only vortices which develop into two-cell vortex types or which have an eye.
In spite of many studies having been done, there is no accepted theory to explain the formation and the maintenance of the typhoon eye (Markus3), Smith4) and Kurihara and
Benders) etc.). These have been reviewed clearly by Anthes6). He presented a concep-tual model of the eye formation, in which a positive perturbed pressure at high levels,
produced by horizontally spreading air provided by clouds rising vigorously, and this is considered to accelerate a downward motion next to the convection.
Eye formation is considered to be the development of vortices from one-cell into a two-cell structure. It is suggested that the evolution of a vortex from one-cell to two-cell and then to a multiple vortex is a common feature of a natural vortex (Mitsuta et al2)). For typhoons, eye formation is the indication of the evolution from the one-cell cloud cluster into two-cell vortices with eye, while elliptic and polygonal eyes (Mitsuta and Yoshizumi7) and Muramatsu8)) are considered of multiple vortices which are more evolv-

92 Y. Heta
ed form of vortices. Kakimoto and Mitsuta9),1°) analyzed the process of the eye formation using three-
hourly GMS IR data for two cases. As to the rapidly developed Typhoon Abby
(T8305), a small circular dip appeared in the cold and flat cloud system, Central Dense Overcast (CDO), when the central pressure became less than 970 mb. This dip deepen-ed, widened its horizontal scale and resulted in a clear eye as the storm intensified. At the mature stage of T8305, the cloud system was the "Banding type eye". There was a band-like cloud area surrounding the eye. While for Typhoon Orchid (T8013), though a dip was also analyzed, the cloud feature was not clear compared with T8305. The satellite-observed equivalent black body temperature (TBB) is thought to be linearly related with the altitude of cloud top for cumulonimbus which overshot into the stratosphere (Adler et al 11)). These results suggest that the eye formation is the result of a cloud subsidence at the center of the CDO. However, for the case of T8305, an eye with a diameter of 48.0 km was already reported about 15 hours before the appearance of the dip by U.S. Air Force aircraft reconnaissance at the 700 mb level. Eye formation is thought to have a more complicated process than previously considered.
In the present study, the process of the eye formation is analyzed in detail using the GMS hourly infrared data for T9019 Flo and T9018 Ed in September, 1990. In this
period, Special Experiment Concerning Typhoon Recurvature and Unusual Movement (SPECTRUM) was being carried out so that we could obtain six-hourly central pressure data measured by drop sonde for these typhoons.
In addition to IR data, the three-dimensional wind fields surrounding the typhoons were calculated using the three dimensional MASCON (Mass Consistent Atmospheric Flux) model based on the satellite wind and rawinsonde data (Heta12)). Data density was so poor that we could not obtain the wind fields which would have indicated the eye structure. However, the change in synoptic scale wind features in a period of six hours was usable in this case.
The process of typhoon development including the eye formation is analyzed main-ly for T9019, which developed rapidly. Its minimum pressure was 890 mb. Typhoon
9018 is also analyzed to show the complex process of development under the influence of the Philippine Islands.
2. Data
The equivalent black body temperature (TBB) data as observed by Visible and Infrared Spin Scan Radiometer (VISSR) of the GMS in September, 1990 were mainly used for the analysis. TBB data were obtained every hour, excluding 14 and 15Z because of an eclipse. The resolution is about 5 km at the subpoint of the satellite. With the increase of distance from the subpoint, one pixel covers a larger area. However, for typhoons in the tropics, this change is considered to be less than 10%. To make the best use of high resolution, each pixel data is directly used with no interpola-tion. TBB distribution maps are drawn for some constant pixels and lines.
In order to see the change of cloud features, four kinds of rectangular areas of
An Analysis of the Typhoon Eye Formation 93
different size (720 x 240, 540 x 180, 360 x 120 and 180 x 60 in pixels and lines) were selected for each hour. The central point of rectangles is fixed on the warmest TBB
point which is considered to be the center of the eye. However, in some cases, we made the central point the center of circulation obtained from the cloud patterns.
The wind fields are calculated for six levels every six hours (0, 6, 12 and 18Z) using the three-dimensional MASCON model (Heta12)), which provides us three-dimensional wind components (u, v, CO) at grids (1° X 1 0) from satellite cloud wind and rawinsonde data.
3. The life cycles of T9019 (Flo) and T9018 (Ed)
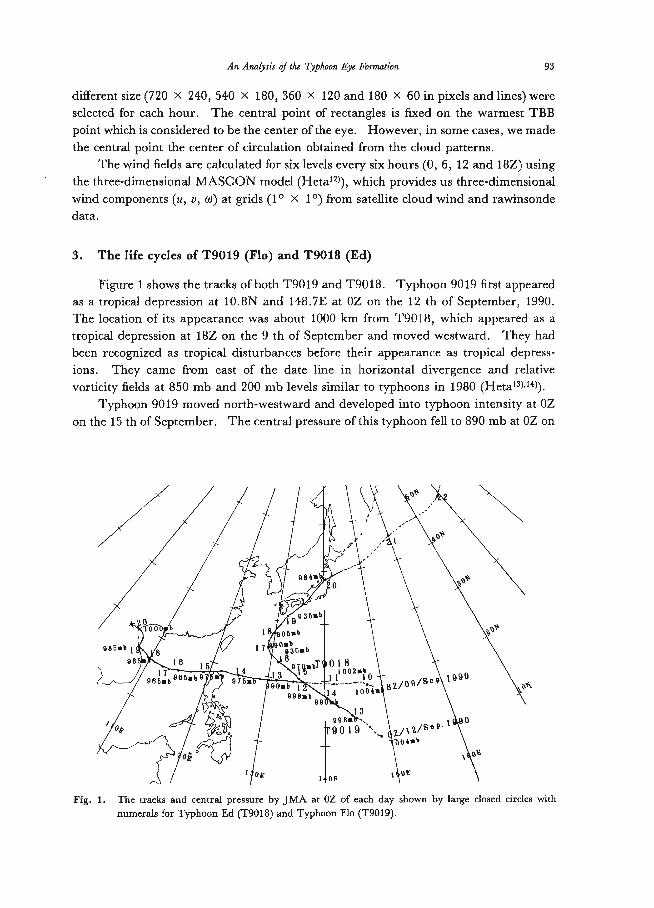
Figure 1 shows the tracks of both T9019 and T9018. Typhoon 9019 first appeared as a tropical depression at 10.8N and 148.7E at OZ on the 12 th of September, 1990. The location of its appearance was about 1000 km from T9018, which appeared as a tropical depression at 18Z on the 9 th of September and moved westward. They had been recognized as tropical disturbances before their appearance as tropical depress-ions. They came from east of the date line in horizontal divergence and relative vorticity fields at 850 mb and 200 mb levels similar to typhoons in 1980 (Heta13),14)).
Typhoon 9019 moved north-westward and developed into typhoon intensity at OZ on the 15 th of September. The central pressure of this typhoon fell to 890 mb at OZ on
1111 '
.o*
0 -- 984a;)
l' 0
iiib
986a6880051::36ab
1 7 0935a6
98 113 1 5
9,5.1,985ab9C1 4 9a,,,,bT!0!01302.1,
1 11 0sec.9 976ab 90abBZ/0 9/
998.6 14 1004a 99'1 a
2>k' 998u0 108Ail9 019 ti/12/8". 004ub
0E , OE 1 OE
Fig. 1. The tracks and central pressure by JMA at OZ of each day shown by large closed circles with numerals for Typhoon Ed (T9018) and Typhoon Flo (T9019).

94 Y. Heta
the 17 th, turning northeastward and landing on Japan on the 19 th of September, while T9018 moved westward developing slowly and weakening a little near the Philippine Islands. After moving into the South-China Sea, it developed again. Typhoon 9018 showed a minimum pressure of 965 mb at OZ on the 16 th. Typhoon 9018 landed on the Indo-China peninsula and disappeared there.
IR analysis of the cloud features of T9019 and T9018 was mainly done from 01Z on the 13 th to 18Z on the 15 th of September. During this period, T9019 developed from a tropical storm to a typhoon, with the central pressure decreasing from 998 mb to 950 mb
(Fig. 9). At 18Z on the 15 th, the cloud system first displayed a clear eye region in the IR picture. After that time, it continued to have a clear eye. On the other hand, T9018
showed a more complicated cloud feature. A small warm region sometimes appeared similar to T9019, which, however, disappeared in a short time. Instead of a
M 1990/9/13/00i 650MB
. . . . . .
20N . so ; ,, .. , .. ^ k . . : :;,.__.—^„‘^:„•
• •.,....s I, *IVY Or 'II AY , • . .
10N...... —'5:::::— --- - '
.______........
P.7., . . • • , - . . " ' . : : : :: .3 „ .. 109 . .. '.'
. . . : : : ; ' „ - .. % 4 • - _ , . „ ......... : , ,
/
........^.,•.„--, 1 / rli • 305.^.•,....,44.f. r\ ..
90E 140E100
LONG1TUOE
. M, 1990/9/13/001 200MB. .... .
30N . . • ... .
._........_....;;...:.;4„,,,,,74.....3 AP, •., .....•... •• . . . .
209 . .../e ,.. ,.. .. -
... . ... . .. , OOP, .....
.4,1 .......
10N. .••••,•••• —..........
. . . . . •• .....
IN ::::
... • 105 • • - • ..... • • • .. . • • • .
. . . . . .
. . 1. . 205 .-------..--- .........,•..,..
........,Ns. 1,,,,........
300•=:..
-
‘ilt t. ..4.7 .... 72 ..- ............•. .. ... ... - • •.........,—--——
.,
9091400 100—
LoNorruoE
Fig. 2. a) Horizontal wind field at the 850 mb level adjusted by the three-dimensional MASCON model at 0Z on the 13 th of September, 1990. b) As in a), but at the 200 mb level. Large dots indicate
positions of T9018 and T9019 at that time.

An Analysis of the Typhoon Eye Formation 95
M 1990/9/15/16Z 650MB
3" - ',/, ', ,t.,_::)/;',' - -_-.:--11.‘ ^ ,‘::,. .‘1,..__________.,_____-' 1,; ,„,--------'''s
"N-' ,'•-'--.,...ii\---- ; '. : , 1 I 1 , . ____. - :: '35 - -...'-1.7::,''''7- ...'''''''''' ''' ..l: ..''' ‘
_-.11......:,^''s' ' .
205 its/...-.'...1,>41 i ; 17.1____7_. -
':II1^:
/
30,,.•. ,,./ / /.. I /----- ,,. , w I ,..!--.= -P_
, •, 90Ef140E1180
LONGITUDE
a
M 1990/9/15/18Z 200MB
30N .
200 _ '''''''' ., • , '''''''' „„ _.,„ .. . ____--,
ION
............i.jej,,, 103.......,,,.......,.,....,111
ns,-- ---:---;:7-1.':,:=2" ---- -----Z-Z---1-...-2.1_ --.------._ - - -- ------ - --....,..--. ----------- -,-... --...,,,,..- * ----- -----.,,,-, =7"-.7-:==z;.— ' - . ., . . . - - - --- - - -- - - -- - ''-".---''-'.------ -- - - -___. -- - - : . _ ._ _ . - - - -, - - - • - . . ---, ... - . . . . . - - - - - - = - - . - - - -- - —....,-... -....^^^ ------_- ns.-- — ----4.-fr--___=71.-----_,-..„„.._ .......„._ „--
900 I 1 HOE I DO LONGITUDE
b to (1990/9/15/16ZI 200MB
30N .. ' ^ . ' ' . ^ , 0.. o 2
pi?'16t.,.„-4,1-6..:.k';,131', 20N ) ''''''''''''''‘.....-Cl. ; 107:47'.;..::4: '':-,: ..• ':::",..:,.,..„I' - •'''' - 0 -4 -','-fi, 4.-N:A ;69: ,C*>>.:.:::.!-- - 87 :: ..... ' . . :::.:' .:. ̂.Y. t : 1 . ° -
• 4r$4,11-1:. -.••,,, ,Z., ,:,-,:„.''.:,`,-,-,::.••::i5,,_, :A.::: 4 ,, ., . •• ::,:••••••,e•:: • ,,-,0,::-D.4 _,_, •• ••••• - - . , ''''',-:-..111,-4
,
.7] • - ;:..,._-.., .„,... . _ .::. c.: : . : .:-..: .a,., ,,, „. ,.::, :;: ,,, ,_,..,.. -.:- - in _ -.-i-..-... '.,..--.., ,_ ----,3,..-,,,:, • ''',,',';'=_;_-=S-X;-,: " ' . A--16 , : ' ' :-':•.=,,Lrlw,-,, i ,.
• -
.__
p_
or---::•,,n,. ,, 02 ,;,..,A :1011.1).... zos _--74e,:-:,;. --,‘.,•'_...,-._';;::::::,.,..,..: ./y7‘.(-'r,,,.:,''.:Al.47::..:','-'''.9•,,;,;i:,r,-.,..:,'ii:.;:A', ,/N),,-4.1.::...,::,.i,..,i 333...-...., ,-,:,-,: :'.,`•,/,_.-;r;;;,;;..4:;,::::::..,..,,, P
a/s-
.
90E 140E 180
LONGITUDE
C
Fig. 3. a) As in Fig, 2, but for at 18Z on the 15 th of September, 1990. b) As in a), but at the 200 mb level. c) The distribution of w values at the 200 mb level at 18Z on the 15 th of September. Solid
lines show the negative values (upward motion) and broken lines show the positive values (subsiding motion).

9 6 V. Heta
clear round eye, a banded type of clear sky region surrounding the small convective cloud cluster was recognized at 18Z on the 15 th of September (Fig. 7). These are analyzed in the next sections.
Figure 2 shows the 850 mb and 200 mb horizontal wind field analyzed using the MASCON model12) at OZ on the 13 th of September, when both T9018 and T9019 reach-ed tropical storm intensity. Typhoon 9018 was then located to the west of T9019. At the 850 mb level an elliptical cyclonic flow circulated round both T9018 and T9019. Before 18Z on the 12 th, a cyclonic flow centered at T9018 was clearer and T9019 was located at the point where southerly winds converged with easterly winds to the east of cyclonic flow. With further development of the vortices, two separate circulations could be analyzed from 18Z on the 14 th of September. At the 200 mb level, both typhoons were located around the shear line with weak diverging flow (Fig. 2b).
Figure 3 shows the wind fields at 18Z on the 15 th of September, when T9019 displayed a clear eye. Cyclonic circulations centering in the two respective typhoons were recognized at the 850 mb level. The distance between T9018 and T9019 increased as they developed separately. At the 200 mb level, an outflow from a little east of T9019 was clearly seen, while T9018 was located at the northerly wind region. To the east of T9019, there was a small cyclonic circulation, which was thought to be an upper cold low. Figure 3 (c) shows the vertical P velocity, w at the 200 mb level. Upward velocity areas of —0.14 Pals were recognized around the two typhoons. The subsiding region was seen at the upper cold low to the east of T9019. The upward motion areas around the typhoons were recognized from their tropical disturbance stages, and the values of w at the 200 mb level under — 0.1 Pa/s with some variations for both T9018 and T9019. The resolution of the wind fields was too low to describe the eye structure with a sub-sidence inside the deep convective clouds of the eye wall. Typhoon 9018 closely approached the Philippine archipelago at about 17Z on the 14 th of September. Before and after this approach, the value of the upward motion was almost a constant value of
—0.1 Pa/s at the 200 mb level. However, T9018 weakened a little and its central
pressure increased to 975 mb from 970 mb on the 14 th of September. It was thought that the water vapor supply from the ocean was prevented near the islands because of the southerly wind flows at lower levels from the islands.
4. Eye formation as observed from the IR imagery
4.1 The process of the eye formation of T9019
Figure 4 shows a series of cloud features for T9019 from 01Z on the 13 th to 18Z on the 15 th of September 1990. The deep convective regions whose TBB values were less than —60°C, are colored black, and the contour of —30°C is drawn. At 01Z on the 13 th of September, a small deep convective region as shown by a black spot in Fig. 4 was recognized at the center of two broader banding clouds. It enlarged and split into small clumps at 08Z on the 13 th. Then at 10Z on the 13 th, a small round cluster reappeared at the central part and enlarged rapidly. At 16Z a so-called "comma shape" cloud was recognized. The head of the comma shape was thought to be a CDO as observed in

An Analysis of the Typhoon Eye Formation 97
t .A. .
-130•C _um (145E. 15N) ,, r.
a
4A''.7..._4,, '' ''-;,..14.-... . r,....-4.--, 7 .,7.7,,.._ 07Z
01Z/13/Sep. — 02Z 03Z 04Z 05Z 06Z :7—MI14
k -ii,it:'-', , a-, -...r'..":'' -''?)1IP./' e iti.7?...--4,1It-..,? • .rips,A ,r-,:3 ...„,z-1,,.*4:-....,,41014
- ' 19Z.,.•4
1 oz
I I Z..._.1 08Z12Z 13Z
- ,+ •-.„.. ir...wi+ ...+ 4'444:2 , 1''4 --..--4-- 't . ..,....1.„
,,,,_ +!‘‹ - ! - ' i ....+1111 4,-.0.11(
r---- .-i, 5-1114r n -ice ,, —.c"---*- ..---.....,
1 6 Z;161'--7, ,, -P'-. ,,--,i 1 8 Z -19Z20Z 17Z
+ ' s, + + ,CP + •
. . •,, ° ..." ....... ... .., ,--- ,
...- ".. , •It"
.4„ '0,4 , , le • . 4 4 t s____4,-----ij-i'n411
't N—o.'. 23Z 00Zi/I4 OIZ
21Z 22Z
0. .
441:.1,i011r. -/�1),S7,.,, ° '14/i2)"' 4 1 IT /,gA
02Z 03Z 04Z //I' iti 05Z ,ift 06
, P
.® i o.,,e1±ollor , 1d.;•iG,'1-ctl/r4+ ,\,L,Pliti.0,y,i',.-c-A!0-1. •-•...._--s.1 _-i- 'I? •114 3,
+ 09Z + alOZ+ 0 8ZII 7Z
a

98 Y. Heta
e
r:cair;qt..,±4v%4k
,
r.„, oC..)._, 414.,- 4r--L-11111?„,:,+.• •,
'',-. A.:,,,400)', 113Z , I 17Z - ° 1 8 Z 19Z '
.:-',hiii::„ci+ jAH.IL:ezl' 12Zi” 13Z .,:,
i
c 4111C)*
0.1 '3
,
talw#:---/13-3Z OVZ/15I\ma 'Y01Z -." 02Z .2
20Z 21Z 22Z
(3 Olt - -Pr' .., f ° a •=)-' 1 :- Z;.,-- ( ,,.- - kpoy ...
. .,
4r4:;1?
03Z."NW- -al'.1,/"'
i_,1'''-#1:N°'
..., 057).,-06Zt,N'
,
04Z 08Z __... 0 T Z .4 ,c)
-, .
,,,..,t, --...--....c-A'i.,.z4,......."s",-41":42,1,:„oreZ.Fi-f<:17"+-•."i'll:T4:71C-N CteIt'-•-40,' ..(3,.,D.., 09Z 10Z -41.,.......,1 1 z 12Zz`2.7bc,_ne- el( 13Z°
5,10iiik +al + e+
q; iiiiih0 +\ + '' 'N.,___0^00% P.7----::.
,A0 ° <;Z:, Nob1 01o.:A
''''-IIIP:"."11COU'\114'` .N.,\ 16 Z17Z- en-°I 18Z -."
"li 4Ik4‘
b Fig. 4. a),b) The time sequence of cloud features of T9019 between 01Z on the 13 th and 18Z on the 15 th of
September, 1990. The isotherms of —30°C are drawn and the regions cooler than —60°C are colored black. Plus signs indicate points at every 5° in latitude and every 5° in longitude.
many typhoon systems (Dvorak15)). The low TBB regions (TBB < —60°C) of both the head and the tail part of the comma cloud continued to enlarge and formed a large circle around 23Z on the 13 th. The deep convective regions decreased gradually and the head was clearly seen at 01Z on the 14 th. The head clouds appeared to be angular or oval in shape during 02Z and 07Z on the 14th of September. This is often observed during the early stage of cyclones as shown by Dvorak15).
At 08Z on the 14 th the head cloud was surrounded by a low TBB cloud counterclockwisely. Figure 5 shows magnified maps of the cloud systems (200 pixels X

An Analysis jq fthe Typhoon EyeFo:ati:ilmsy,99 07Z/14SeP.1f1f10 08Z • S e.. ,, . -., . 10Z/14/SeP. _
-71-j ,..-C ' ( 216(1, V;T:iir-7,/11,! H ', -ailL;79t 1,,,) ,,, ,:,._ F . :' 0,- L. \\1,-^N-,.:4,, •--cn \ # ° \-, \ ,_-_
______,L,__-___~._-___:-::: i ',:, ',:,,,, ____ st;:: ) ;tC27•^•11151.- 1:1,A'.H1::;11 iff' .-**7-1.1-'„ , ' '.. ' -----'1---,2-.-"i ;',....---_-__-,=-:,f'tal .Z S e -
1• II Z/ 14/Se'..e- ,.=-_-,A, - , -.--_LI*-,;=';-7)1 --:''(72,.,7'-a: ......,.
k
it itr tvadir_t_.i7...,.__,....,,,..„:....i „,.... .0 _„..
1 a iiiiiia. stio! , if
1 7,-,_51)11 -'' 7 T5 C'. , to,. •-(1-,.7_,, j-- ,"; . AN,IPr,lij
:, 6 ok- - ,,4,2
.----,.Af ,A.,a _
Fig. 5. Magnified maps of clouds of the central part (200 pixels X 80 lines) during the period of eye appearance of T9019. Black areas and shaded areas demarcate the infrared pixels whose cloud tops are colder than —80°C and warmer than30°2
7C ,7spectively. Isotherms of —40,50, —60 and — 70°Cdrawn by solid linesand those of75°C by dotted lines.
80 lines) from 07Z to 16Z on the 14th of September. The region of TBB <—70°C rotated cyclonicallyand a closedeye,w
.hose TBB indicated —39°C, was recognizedat This16Z on the 14 th of September.process of eye formation is different from the
deepening of a smalldip at thecenterperof the CDO as reported by Kakimoto and Mitsutam) for T8305.
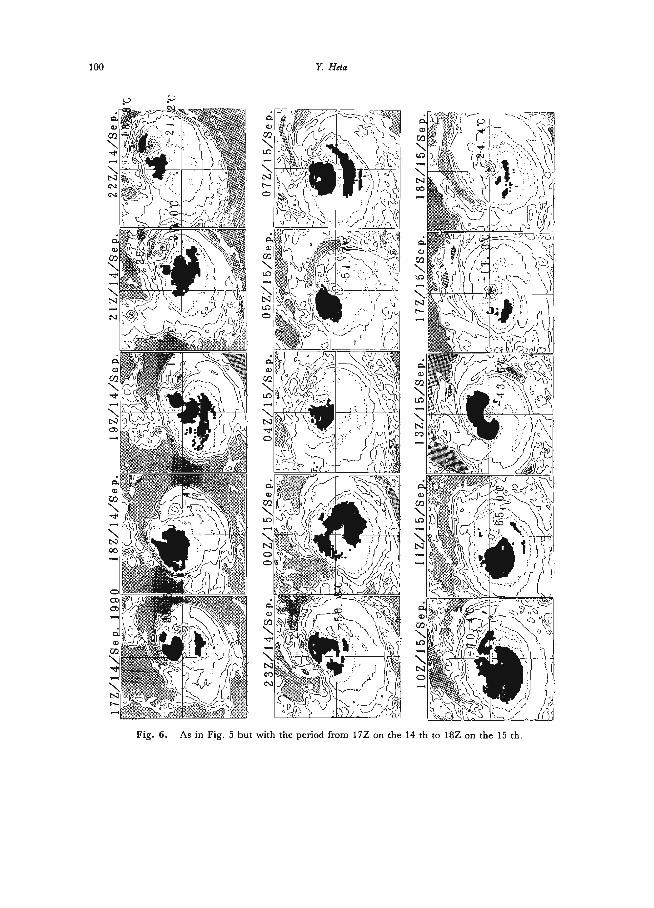
Figure 6 shows the change of cloudw udfeatures after the appearance of the eye from 17Z on the 14 th to 18Z on the 15 th.Thewarm region, considered to be an eye, was located
not at the center but at the edge of the CDO. At 21Z on the 14th, the CDO looked like an oval but lacking its northeastern edge, where a "mushroom"-shape warm area was located. After one hour, thewarmi area was separatedinto two parts by a low TBB cloud, and resulted in aneyeinsidethe CDO and the warm area outside. At 23Z on the 14th, the eye disappearedbysp— reading of a deep convective cloud less than80°C.
It is interesting thattheh ecloud top was quite uneven. Closed warmer regions spiral-shape warmer regionappearedred within the CDO near the edge. The CDO cloud consisted of not one roundand cluster, but several cloud clusters, while the warmer
regions were recognized at the edge of the deep convective cluster or the opening spaceof several cloud clusters. There often appeared a spiral patterned groove between the
higher cloud tops. The warmer region at the center of the round convective cloud appeared clearly and
deepened from 10Z on the 15 th to 17Zon the 15 th. The warmest value of —11.3°C was observed inside the eye at 17Z, whichsuggests that aclear eye was completed by this time withalmost no cloud inside theeye.From the IRimages, this eye continued to be
I1ds present clearly until a little before landing on the Japanesesan.
100 Y Heta
P P '''.74;V"'1 ci, r# vg... -1 -'----"--S'-`'4if a , O ::11 , — Iktii., -Itor , 6----,, —1 ?II .' •.(K
.,:-.„.4 ...„ , ,. ,,,44:, ,__,L° 2\ g 'q.',. - () LO '.7111, , 7 . . 1 N,;.
,
:414,N";.•t,(:-.,,,\N '''''F'‘ ,-,,..,_'i,0_0, ....-;,., k•iA\L__ '"`'N1
AAR* q ' , ,-,..• 7°X1-.4rigriFq° IT ,7, , )\--Q-,,, , : 6
\-, ° ' ° 1 ' . • ! ' ' : , ir n
—.:,.
000145::\J
, .„ ,, ,,, 0 0 t • ?MT! - '. -Akt‘i c:,Uit ' (fj -------5:- ( ,-- ,',, ' :,6::.t y —,--/-)\-vi, ci. l'AIVA 1-:. '... - . , - %,..* co ..: a :?:.Pi _,-_-^3'-i, c']''',',' , ci0op, G. . - a) ,'''iLt1ir 1 1 ' . , \
\Ni:,'...'a):.1 :'-:\,'':.;aiiNo'i-'1.1"1.?/...... .----H,t,-----Nci2s;(,):„,...:--, N::‘''•,.0 :.i.),(q,..',.6.--''(.-t;t .--,,, LPA....A ,...,.,_',._, 1.,.:, EIX.'41......._. .,,,,.(_:,._..,.,.______,..,, fik W•.-)\r(7(''--j.-.•K' ---.' ' N'.i 0Th'IIS) A 0#.I;-N-,-\\ .J):
_--, c,1' —
)0,-q-1?,,,)'-:. i\-.,-/ ..?,,,:141\'--)-t)....,02-^ 4$0.A .,...,, ,e; q
( ;11'..ZA alb --../..5..5.---,•ieP'JO` 12:'It41g.7w-r!r.',, ,,L.;.-'17'-/,4'',..\.1'-'
!(.1., •.,4::.
1/, ••11,: .\ NTtrFrAt....,,.')IA'' ramq.0,
c,2,,„c„,• Np;yj •r,1, ..N.,&il. 1)i',.. 'atMk
t
b 01, ;,::, 0i.p.,.i\LI,,,,-•...or,....,.,,. 1-... N‘. ;`..14L,,,)
_ k;•'cnw .7-,\,„1.z, ii'8' .1.'\___i,jINC:' tr; ,.,,;3P*
.Lbis,:10.,,vm.:A.‘,.' #1i,44:4; ."-' eav..- , , ei).„..,A.t,, isecranigua:...•;:itez?',,,.'i_IN-")VA,P 1:::, Tr**, a _sat ':,,, 44.T ' -
r:'-qozift'+.?o14'.\\14.•.iro:c$,—'`I.• ..altkr4.,...41cn14,,,.;‘.,:,,,.4f.V.,,,,..':',i;A4r7('''''''f-r-c'4 s.,..,.,0 N4:::,,ra-,.:,..:ii, i4,',J cr)Ad virri\-\.04'•, "I'Alfiloti .7
,
,
:0'.'Lc)',..5\IQi ..0..., A0adi:jV_,,,:,ez^
,,:t_ .4t,, .Ni NI%cs4 ,,,,.,'4;•;•;:' N e,,,4t,', ,-. ,4-4., rIi9 CO;,..,,,•1c:,4,
, - ,y,:a..,,.A :' [ 'iik, N,„.;'( kr:1;..4.1IVIA7'.A c{?,.i_.,,... 4t, -..,:tilis.,„,,4y/xt,
C A::: .." • -':A:lIfRark, 1 • ̀ 7:::*.":7-:' ''''•-s,•`,.,111.; 1 ..: ,° ,- - .7ff-, ------- ',,('-'..2 ,,,..\_,,,-- -,„[r) ,,,its: . „.,,-----0,„„:„„: - ::.:.:•:...., : —,,,.„_,,, (4. ,„ ,,,,,, 0,„ ,,' „, . 4 , c , (.. I Lf::,cf)'..,:gAl _.!7, , if._.,,.!.N..1,.. ,,.......0440
0
01 ." IP',: ,.:\ t:k.:14t'3'k Cn gagit ,,:s , , ': N , . I, -AI , Ike, '" 04„Nls. , N:'''Tk', L'''.Ill( NI,N
,....:,,0,,,.A.,;.co:',*..):::•,:,.IN.'•:-) :::;:;::..61,=..:4,:t_ c)Wsg4 qt1N7.-''\-;,-.',\ ,MF:V';:,,,,,\1, .''' ';,.1*",• #.,-.Ati
0 , —' 'N ,, t*::,,eilLV-43: t ::, 14 _ , .,. 0 . _ i '
Fig. 6. As in Fig. 5 but with the period from 17Z on the 14 th to 18Z on the 15 th.
An Analysis of the Typhoon Eye Formation 101
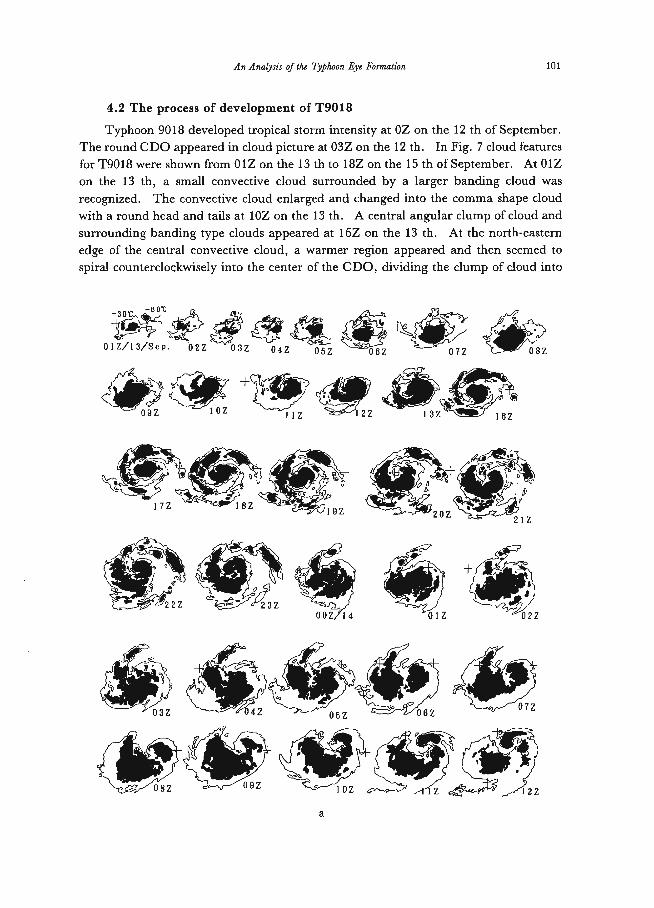
4.2 The process of development of T9018
Typhoon 9018 developed tropical storm intensity at OZ on the 12 th of September.
The round CDO appeared in cloud picture at 03Z on the 12 th. In Fig. 7 cloud features
for T9018 were shown from 01Z on the 13 th to 18Z on the 15 th of September. At 01Z
on the 13 th, a small convective cloud surrounded by a larger banding cloud was
recognized. The convective cloud enlarged and changed into the comma shape cloud
with a round head and tails at 10Z on the 13 th. A central angular clump of cloud and
surrounding banding type clouds appeared at 16Z on the 13 th. At the north-eastern
edge of the central convective cloud, a warmer region appeared and then seemed to
spiral counterclockwisely into the center of the CDO, dividing the clump of cloud into
-30-80'C _,.T- .sat
:4 ,_.,,e, 'I'Ddf'1,•-4r4N.Si;.--9,...,:...,b ..... . 01Z/13/S ep. 02Z 03Z 04Z 052 06Z 07Z 08Z
-IPA
it '18̀±-'51:-'' .:,e,LTIV' *1.ss‘:..,'* "7---417--.., 12Z 1321111115 IBZ 09Z 10Z 11Z
l'itii--.9 fC ei -,, . -11. . *AP. 4' reAc\,, ,-,ip-,,,% )i.er0..---* sic__,i,,,VL'VP.f-Itf1.,,,,t
\It' '
I7Z 18Z,-;j41,14.2.3kry
k
19Z- 20Z - 21Z
-1141.Ø. 11 ..%-zNir\, (4%1 . ;-'' ''"iz_j-,17--PL‘).0lZk ,.,,,15''
- 0,0c3 cAr..„, .-::,- 4/22Z 23Z .1'1411...,*;j4,411' ,,,m-
fillFt-Cw- + viot ^-• '''' iiP ill
00Z 14 01Z 02Z
taw P' A#1
2'
ii?^1.,c;:,...i,,..,....,,.r -N...,:i.. ,
03Z0 03Z-I4Z 05Z 06Z7Z
1 - a
Aio-x--("1 - $ - - 9 eCiit 'V .'.4..,
•
- c7 08Z-09Z 10Z 1Z12Z
a

102 Y. Heta
°
471-"'" %. It —1
i
17 Z4--1 9 Z.-20 Z /1 1 6 Z 8 Z,,,,
1 3 Z
-. -•.. ' 41._ - .1F-1 of'
, .. .
..cr.." '4....
]-.°+ '--7
2IZe22Z 3Z 00Z/15,01ZH-02Z
3 In
.,... " c . 0 . , -1313T411111p#,,". s.10',rtfl.-- 7 '''.'1" •41 _....,
f...-ex,,,?.1,
,
''f .+'' ._,,..Iv,4
13Z ,,,1\*04Zf,. 0 5 Z 0 6 Z 07Z 0 8 Z
,... i
a
..40r... 00Z- 1 0 Z:'s-1i 1 1 Zd.illo
...„...., ± 1 2 Z A / 1 3 Z
, -
ei= + 7,„, ^ 4e, e.'":- ±
.'.
lt4,,FAII6,4,
.r7•Op.IS t!t.,-- s ' ,.. a t,
• .°. • . ± ' + '1: . . ±
I 6 Z I 7 Z,v- a 1 8 Z
1
b
Fig. 7. a),b) As in Fig. 4, but for T9018.
two parts. In other words, low TBB regions cyclonically extended surrounding the warm area. At 08Z on the 14th of September, a small elliptic warm region of —30.5°C was recognized surrounded by high convective clouds less than —80°C especially in the north-western part. A clear warm area which showed an eye disappeared after 12Z on the 14 th. However, a warm region in spiral shape appeared inside the low TBB cloud mass. The area of deep convective clouds (TBB < —60°C) decreased from 12Z on the 14 th to 01Z on the 15 th. This decrease was thought to be related to the weakening of the typhoon because of the approach to the Philippine Islands.
However, at 01Z on the 15 th, a small eye of —28.3°C appeared again surrounded by a "C"-shaped low TBB cloud as shown in Fig. 8. This eye disappeared and a cloud clump with about a one degree diameter continued to stay at the center changing its

.
,-
An Analysisofthe Typhoon Eye Formation103
^ 1==-, , rd r 000,-,0-,, -; , ,
• '-' / :41#?(_.* ° — cl. , : ,.1,771-,:,, - --)4,:,,:.:'4'. •^_ °,,[
n. --' I 1.0:4)./ CD 1,
c --.-I i '-g(e6„ • CI) -1,-44t • ... CI , 0, Ns ;;* 1 _ ig.4:141, \ t-cDf--, .,tifv.,,, 1 ---.. –
ci] 'it4, • r .k.. ' •.„. '4, % ,,L:- -``:-..2-;: ..441,,_ ,----i r-- . L,11,0•:-.NH rot. L-: s,:33M,.'k•;' ..) 1 /(.__.!NI1'.-" ,_-;::1!1\1• '--('':-..-..[ ,,`Ni1:gliKi'Vl'.7%,u":--,,
( NI'''sitik.\\,' 1? ' '') c•] ::.:::t:-::!%-,,,..,-:_-___j011',?,`' :. ... ' ̀ 1'1:-`-23.10- .(L') - ‘: -I. r
()\\____, .7(:.;.„---_4_:.....c.',.•m' , ,..; \--74 .. \'1' ,1,:,....- . 1 L_ .1_,,,,,,,f2 .:.,1.-:-,- ---,-,7,,- ,, •.---___.,._fl °,%-,, c..44 . 4 WI y : .— N ̀,.',' lit:',,,,'ANWN '3,- '0.
,6,80/7 w,„ Cj'ffir,CY•Ijk':41144:41,..',,.\;-.,,,,,,,nr-,,,,f,N-17,--,--,,'yL--
,z41 -me\ .i \lit.' . 4
. \
''''.--- '''-`.1PrL • . . ,c° ( ttl:',7::: :., . .:..—f " ' - 7-- ,,--: ,,„----
, ,---
. v ,:4,:orrl.: .qtvictio i'l. :::4:t. . 0 cp! ' b C .4s / .
,-' '''''' '') Y-7:40 * 7 ,, N ':teaL°1-'11.p'''':(f
cn,,-.).4.7 ,11:17,,A °N .„,'!N4.9:4:'.r
)c:i'.
„„iti . ._ ,,,,,,,,,„.,_ n?,-pipp fi,c;:,
- . c cr'15-1-)yrkik:. ,-L., le N 4:4
c.,„ 14; 61i..,.,::.% 41/i.), ,' - ''' c:' ,#.4;,,:: \ ..::::4•',14.1.ts-0.,..a. TN.. k,,,,,-, .4 7 . . - .....„„„o,Y- , ta„,
,,,,:m:,,t,. --1 -,v,:„:.,0,:::":or4 —6,•
•,,0,
wia...p.,_,05:110:0, c,.,4•0
CKjerr •In- .4i2.3..P-""'" coKA:„..11'C2•,'..„10EA:':i ''—')LüAg
gilia'- NTo% gi.:'• -1.....-,AT
, 1i.,t.,.111,...1,111,,,-1::,.,:ainc1,.,, A. N1,,,,,yt _,•^- Onaig:';::Wg:;Me:e. ,,,,,/j_,-,/7",-.^itiC,44,'::::::'.:6..d
t..,5_.....,- (..111.a,,- —t. , NtiNStitgilt,-7,,,'.;;' .:':,iiiA.:4,,,.-::::..ik.I.v,:::::,!,:i•
. -
c,•'2). cn+-/,-_,f-
,
..-ciiiki,,Iliciii 0-c.>''-\'`41 . „..„NIt
rH
—
-,..hte- TL:) ,,-.1r j_si'jpoN10':1-44,7'r‘;,c7 o o ,,,°"":;,---,c,\%::::::^_,,0 ,o 'p,A,-,:-.'
,__,,Ci, e.../-:\yrf\0;•:
-' -1-°i0.,,,,v N0)04.
3,dip .:.4 -1 :, ; '. ;:.Ctgat?4,4(Sr--'?r\---'' Jj1-'!""P—'`D ='''-' ,-:'''•
.N,„r-\ .,,,, _.,,,,\__L,,,=,, Fig. 8. As in Fig. 5 but for T9018 from 16Z on the 13 th to 18Z onth eLl'ill:lfi------Th'aof4C—j'Se7.'September. el'
104 Y Heta
shape. Surrounding the cloud, the cloud-free banding area spread spirally and at 18Z on the 15 th of September, a spiral cloud and a clear sky spread alternately. This cres-cent-shaped or ring-shaped clear area was observed until 03Z on the 16 th, and at 03Z on the 17 th, a banding type eye appeared in the IR pictures. Comparing the cloud features of T9018 (Fig. 7) with T9019 (Fig. 4), T9018 underwent a small change in this
period, though the process of eye formation was not clear. The process of the eye formation was not simple but complicated for both T9018
and T9019 their figures changing from hour to hour. However, for both cases, an eye
first appeared in the edge of the head region of the CDO, where the warm region spiral-ed into and was cyclonically surrounded by deep convective clouds. The eye was not thought to be formed as a dip of the CDO. After an eye was recognized first, the warm TBB area indicating an eye often disappeared and sometimes changed its location toward the edge of the cloud in the deep convective cloud mass. In the next section, these complicated processes of eye formation will be discussed in relation to the central
pressure change, which is the measure of typhoon intensity.
5. Development of the typhoon and its eye
Figure 9 (a) and (b) show the time change of the central pressure and its time change rate for T9019 in the developing period from OZ on the 13th to 18Z on 15 th September. Typhoon 9019 continued to develop in this period gradually with an increasing rate of
central pressure falling. Figure 9 (c) shows the wannest TBB value in or near the center of deep convective cloud, which suggested the temperature of the eye region. Until 07Z on the 14 th we could not detect warmer TBB region at the center of the CDO. The TBB value inside the eye was very warm at 12Z on the 14 th when an eye appeared at the northeastern edge of the CDO. The value of TBB then increased and was —37°C when a closed eye was recognized. The spiral warm region showed a colder TBB, and after
10Z on the 15 th, the TBB increased and a clear eye appeared at 17Z on the 15 th. The time change rate of the central pressure rapidly decreased after 09Z on the 15 th when formation of a clear eye began. Before then in the period when an eye appeared and disappeared alternately from the infrared images, the rate showed a constant value of about 5 mb/hour. This period was thought to be the evolution of a two-cell type vortex cloud with an eye from a one-cell type cloud cluster. It was interesting that a rapid intensifying occurred not at the first appearance of an eye about 12Z on the 14 th but after the completion of a clear eye on the 15 th of September.
Figure 9 (d) shows the time change of the percentage coverage of the area colder than —30°C isotherm within four rectangular areas of different sizes. For the largest rectangle (720 pixels X 240 lines, that is about 1150 km x 1300 km), there was a tenden-cy for the areas of convective cloud to decrease constantly with development. This was thought to be the result of organization of the clouds. At 01Z on the 13 th, there were many cloud clusters which were not clearly systematized as the clouds of T9019. However, at 18Z on the 15 th, there was left only the clear eye wall cloud and the rain-bands of T9019. The percentage coverage within the narrowest rectangle, started to

An Analysis of the Typhoon Eye Formation 105
MSLP a)
1(01110b4)3_
980 _
960 _
940 :5— T S >I<STS >i<Typhoon
13I5/September b) 00to 91 41,2 1,8 9ii2118 Z
-5-
- I 0 - - I 5 -
(Mb/h)
TIME
C) TBB 13 14 I 5/September ('C) : 12 : o 8 12 18 o 18 Z
-8 7. 6
-46 . 2
-30 .5
-17 .7
-8 . 6
3. 3
12. 2
TBB<-300 720x240 d) 10096_ 540x180
360x120 80 _ . 180x 60
60_ 1
40 _
20 _
0/13 0/14 0/15 SEPTEMBER 1990
Fig. 9. Temporal changes of (a) central pressure, (b) the rate of central pressure change, (c) the maximum TBB values in the deep convective cloud, which indicate the temperatures of the eye and (d) percen-
tage coverage of the regions of the cloud (TBB G — 30°C), within the four kind of rectangles centered at the typhoon center for T9019 from OZ on the 13 th to 18Z on the 15 th of
September,1990.
106 Y. Heta
MSt.P
IM -a)
980
980 -
-TS 46--STS +Typhoon+--STS + Typhoon ->
5 -13 b) 14 I5/September 0 0 11 tri t1 1 8 Z-
-5 -
(mb/b)
(km) e)
5"
oo 12 18 0 8 12 18 0 8 12 I8Z 1314 15/September
T BB 13 14 15/September d) (C) 1 12 ;1 8 12 18 0 ; 18Z
-87 . 8
-48 . 2
-30 . 5
-1 7. 7
TBB<-300 __ 7200(240
e) 10096_ _540)(180 3600(120
I
80 _° 1800( 60 - i
60
40
20
0 0/13 0/14 0/15 SEPTEMBER 1990
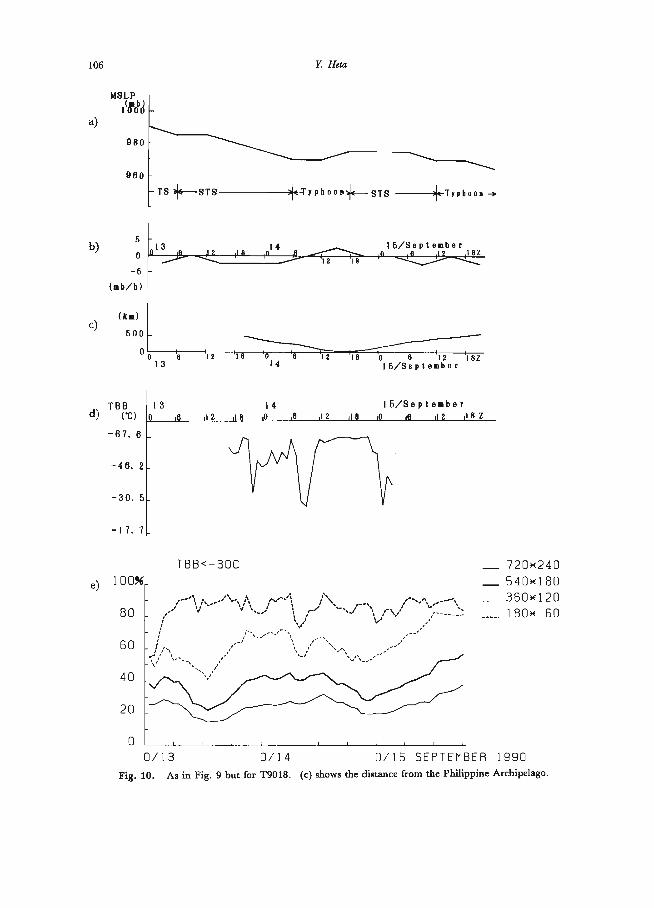
Fig. 10. As in Fig. 9 but for T9018. (c) shows the distance from the Philippine Archipelago.

An Analysis of the Typhoon Eye Formation 107
decrease around 07Z on the 14 th, when an eye first appeared. For T9018, similar figures are shown in Fig. 10. The central pressure decreased
gradually till 06Z on the 14 th. However, after that time the pressure fluctuated,increas-ing a little and decreasing again. Figure 10 (c) shows the distance from the Philippine Islands. The typhoon closely approached the archipelago around 17Z on the 14 th. With this approach, the percentage coverage of the cloud for the —30°C TBB threshold decreased to the minimum values at around 21 Z on the 14 th at the time of veering away from the islands (Fig. 10 (e)). The areal decrement was also reported by Muramatsu8) when the mature typhoon passed across or over a rather large island, though a time lag such as this, was not shown. The value of the upward motion around the typhoon was almost constant during this approaching period as stated before. However, the water supply from the ocean was thought to be decreased because of the large island. The time lag of the minimum area was considered to have occurred because southerly inflow to the east of the typhoon center passing over the island had less water vapor after the
passage of the nearest point. Subtracting the effect of the islands, there was no clear tendency for T9018 (Fig. 10
(e)) decreasing the percentage coverage within the largest rectangle with the develop-ment. The percentage coverage was already less than 30 % at 01Z on the 13 th and decreased further to 13Z on the 13 th but then increased gradually to 13Z on the 14 th within the rectangle of 720 pixels x 240 lines. Comparing the cloud features between T9018 and T9019, T9018 had a more constructed cluster from the beginning. The clouds of T9018 displayed a rather constant structure in size and shape during the period of analysis.
Figure 10 (d) shows the time change of the warmest TBB value within the CDO, which is thought to be an eye inside the deep convective cloud. A value of almost
— 30°C were recognized inside the deep convective cloud around the periods at about
22Z on the 13th, 09Z on the 14 th and OZ on the 15 th of September. These warm regions were thought to be an unclear eye with cloud in some layers between the tropopause and the ocean. Approaching the archipelago, the comma-shape CDO cloud became smaller and smaller until 00Z or 01Z on the 15 th. At 01Z on the 15 th, a small eye, less than 5 km in diameter, appeared surrounded by a C-shaped deep convective cloud of — 70°C. Comparing Fig. 10 (d) and (e), an eye appeared when the area of low TBB areas less than — 30°C showed a smaller value. This feature was also recognized for T9019. The eye often appeared when the deep convective cloud was tightly reduced rather than in the period when the cloud was roundly enlarging. After 04Z on the 15 th we could not recognize a warmer dip in the CDO, but instead a very warm area is sur-rounding the central deep convective cloud, which was thought to be a banding type eye.
6. Discussion
The process of the eye formation of T9018 and T9019 was analyzed from satellite infrared data. For T9019, the eye first appeared not at a center of the CDO but the edge of a deep convective cloud which was cyclonically spiraling into a high cloud. The deep
108 Y. Heta
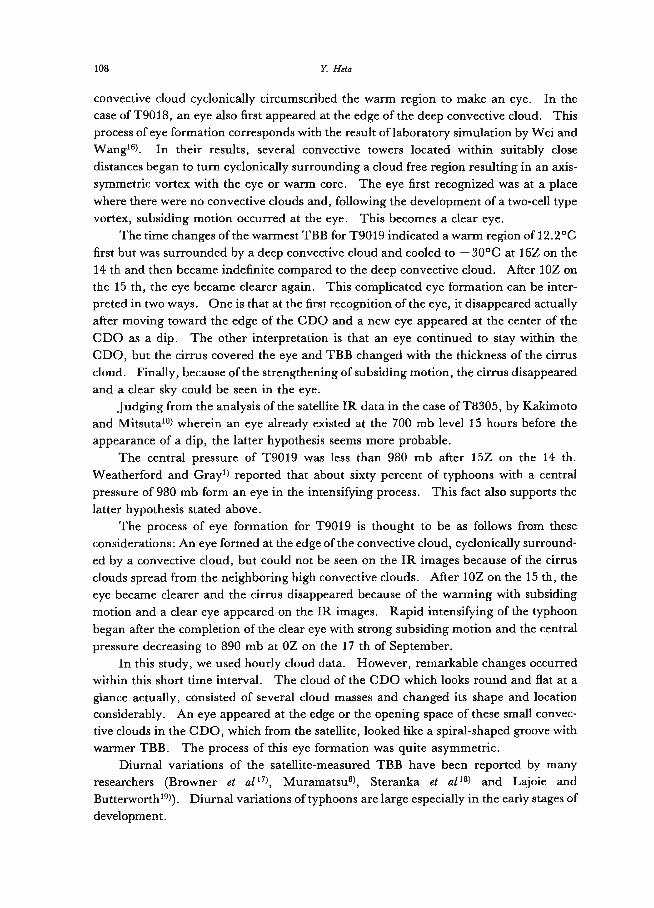
convective cloud cyclonically circumscribed the warm region to make an eye. In the case of T9018, an eye also first appeared at the edge of the deep convective cloud. This
process of eye formation corresponds with the result of laboratory simulation by Wei and Wang16). In their results, several convective towers located within suitably close distances began to turn cyclonically surrounding a cloud free region resulting in an axis-symmetric vortex with the eye or warm core. The eye first recognized was at a place where there were no convective clouds and, following the development of a two-cell type vortex, subsiding motion occurred at the eye. This becomes a clear eye.
The time changes of the warmest TBB for T9019 indicated a warm region of 12.2°C first but was surrounded by a deep convective cloud and cooled to — 30°C at 16Z on the 14 th and then became indefinite compared to the deep convective cloud. After 10Z on the 15 th, the eye became clearer again. This complicated eye formation can be inter-
preted in two ways. One is that at the first recognition of the eye, it disappeared actually after moving toward the edge of the CDO and a new eye appeared at the center of the CDO as a dip. The other interpretation is that an eye continued to stay within the CDO, but the cirrus covered the eye and TBB changed with the thickness of the cirrus cloud. Finally, because of the strengthening of subsiding motion, the cirrus disappeared and a clear sky could be seen in the eye.
Judging from the analysis of the satellite IR data in the case of T8305, by Kakimoto and Mitsutal°) wherein an eye already existed at the 700 mb level 15 hours before the appearance of a dip, the latter hypothesis seems more probable.
The central pressure of T9019 was less than 980 mb after 15Z on the 14 th. Weatherford and Gray1) reported that about sixty percent of typhoons with a central
pressure of 980 mb form an eye in the intensifying process. This fact also supports the latter hypothesis stated above.
The process of eye formation for T9019 is thought to be as follows from these considerations: An eye formed at the edge of the convective cloud, cyclonically surround-ed by a convective cloud, but could not be seen on the IR images because of the cirrus clouds spread from the neighboring high convective clouds. After 10Z on the 15 th, the eye became clearer and the cirrus disappeared because of the warming with subsiding
motion and a clear eye appeared on the IR images. Rapid intensifying of the typhoon began after the completion of the clear eye with strong subsiding motion and the central
pressure decreasing to 890 mb at OZ on the 17 th of September. In this study, we used hourly cloud data. However, remarkable changes occurred
within this short time interval. The cloud of the CDO which looks round and fiat at a
glance actually, consisted of several cloud masses and changed its shape and location considerably. An eye appeared at the edge or the opening space of these small convec-tive clouds in the CDO, which from the satellite, looked like a spiral-shaped groove with warmer TBB. The process of this eye formation was quite asymmetric.
Diurnal variations of the satellite-measured TBB have been reported by many researchers (Browner et al17), Muramatsu8), Steranka et al18) and Lajoie and Butterworth19)). Diurnal variations of typhoons are large especially in the early stages of development.

An Analysis of the Typhoon Eye Formation 109
However, the diurnal oscillation of cloud features such as the area of the mean temperature was less clear in both T9018 and T9019 (Fig. 9 and Fig. 10). This is because they were in the intensifying stage at which diurnal change of cloud height becomes negligible, as suggested by Lajoie and Butterworth19) and Hobgood24).
7. Conclusions
The process of the eye formation of the two typhoons has been analyzed using satellite infrared data. Typhoon 9019 finally displayed a clear eye in the center of the deep convective region of the CDO. While T9018 indicated the feature of a banding type eye after all, although in the middle of its development a small warmer region in the CDO, which indicates an eye, appeared several times. The process of eye formation of T9018 was not simple because of the effect of the Philippine archipelago. For both typhoons, the eye first appeared at the edge of a convective cloud as the warmer region cyclonically spiraled by the deep convective cloud. In these intensifying stages, diurnal oscillation of the cloud height was small but the change in hourly cloud features was unex-
pectedly conspicuous. Axis-asymmetry was also marked. The eye observed from the satellite was often out of sight caused by overcast cirrus.
Typhoon 9019 developed rapidly after its complete formation of a clear eye with subsidence. Although a completed eye and an eye at its first appearance have similar features from the IR data, they are considered to be differentiable based on the strong subsidence of the completed eye.
Although we can gain much information from hourly infrared data, the process of the eye formation seems quite complicated from the present analysis. Many more analyses with other kinds of data clarifying the structure at lower levels is desirable.
Acknowledgments
The author expresses her sincere thanks to Prof. Y. Mitsuta of Kyoto University for his continuous guidance and encouragement. Thanks are due as well to Mr. S. Yamada of the Numerical Prediction Section of the Japan Meteorological Agency for
providing copies of the station data.
References
1) Weatherford, C. and W. M. Gray: Typhoon structure as revealed by aircraft reconnaissance. Mon. Wea. Rev., Vol. 116, 1988, pp. 1032-1056.
2) Mitsuta, Y., N. Monji and H. Ishikawa: On the multiple structure of atmospheric vortices. J. Geophys. Research, Vol. 92, 1987, pp. 14827-14831.
3) Malkus, J. S.: On the structure and maintenance of the mature hurricane eye. J. Meteor., Vol. 15, 1958, pp. 337- 349.
4) Smith, R. K.: Tropical cyclone eye dynamics. J. Atmos. Sci., Vol. 37, 1980, pp. 1227-1232. 5) Kurihara, Y. and M. A. Bender: Structure and analysis of the eye of a numerically simulated tropical
cyclone. J. Meteor. Soc. Japan, Vol. 60, 1982, pp. 381-395.
110 Y. Heta
6) Anthes, R. A.: Tropical cyclones, their evolution, structure and effects. Meteor. Monograph , Vol. 19, No. 41, 1982, pp. 208.
7) Mitsuta, Y. and S. Yoshizumi: Periodic variations of pressure, wind and rainfall observed at Miyakojima during the second Miyakojima typhoon. J. Meteor. Soc. Japan, Vol. 51, 1973, pp. 475-485.
8) Muramatsu, T.: Diurnal variation of satellite-measured TBB areal distribution and eye diameter of mature typhoons. J. Meteor. Soc. Japan, Vol. 61, 1983, pp. 77-90.
9) Kakimoto, H. and Y. Mitsuta: Life cycle of Typhoon 8013 (ORCHID) as observed by the IR brightness data of GMS. Annu. Disaster Prey. Res. Inst. Kyoto Univ. No. 21, 1984, pp. 273-284 (in Japanese).
10) Kakimoto, H. and Y. Mitsuta: Analysis of IR images of developed Typhoon 8305, Abby. Annu. Disaster Prey. Res. Inst. Kyoto Univ. No. 28, 1985, pp. 449-461 (in Japanese).
11) Adler, R. F., J. Markus, D. D. Fenn, G. Szejwach and W. E. Shenk: Thunderstorm top structure observed by aircraft overflights with an infrared radiometer. J. Climate Appl. Meteor., Vol. 22, 1983, pp.
579-593, 12) Heta, Y.: An analysis scheme for tropical wind fields by the three-dimensional MASCON model. J.
Meteor. Soc. Japan, Vol. 70, 1992, pp. 783-788. 13) Heta, Y.: An analysis of tropical wind fields in relation to typhoon formation over the western Pacific. J.
Meteor. Soc. Japan, Vol. 68, 1990, pp. 65-77. 14) Heta, Y.: The origin of tropical disturbances in the equatorial Pacific. J. Meteor. Soc. Japan, Vol. 69,
1991, pp. 337-351. 15) Dvorak, V. F.: Tropical cyclone intensity analysis and forecasting from satellite imagery. Mon. Wea.
Rev., Vol. 103, 1975, pp. 420-430. 16) Wei, D. and Y. Wang: Some basic problems in the formation of the tropical cyclone-a research with
hydrodynamic model. Collected Ocean Works, Vol. 5, 1982, pp. 23-40. 17) Browner, S. P., W. L. Woodly and C. G. Griffith: Diurnal oscillation of the area of cloudiness
associated with tropical storms. Mon. Wea. Rev., Vol. 105, 1977, pp. 856-864. 18) Steranka, J., E. B. Rodgers and R. C. Gentry: The diurnal variation of Atlantic ocean tropical cyclone
cloud distribution inferred from geostationary satellite infrared measurements. Mon. Wea. Rev., Vol. 112, 1984, pp. 2338-2344.
19) Lajoie, F. A. and I. J. Butterwirth: Oscillation of high-level cirrus and heavy precipitation around Australian region tropical cyclones. Mon. Wea. Rev., Vol. 112, 1984, pp. 535-544.
20) Hobgood, J. S.: A possible mechanism for the diurnal oscillations of tropical cyclones. J. Atmos. Sci., Vol. 43, 1986, pp. 2901-2922.
![Formation of a tropical cyclone eye is often associated with intensification [1]. Currently, determination of eye formation from satellite imagery is generally](https://img.pdfslide.net/doc/110x75/56649dd45503460f94acb4f6/formation-of-a-tropical-cyclone-eye-is-often-associated-with-intensification.jpg)