Embed Size (px)
Citation preview
AP-42 Section Number: 9.1 1.1
Reference Number: 4
Title: Corn Annual 1992
Corn Refiners Association Inc.
Corn Refiners Association Inc.
1992
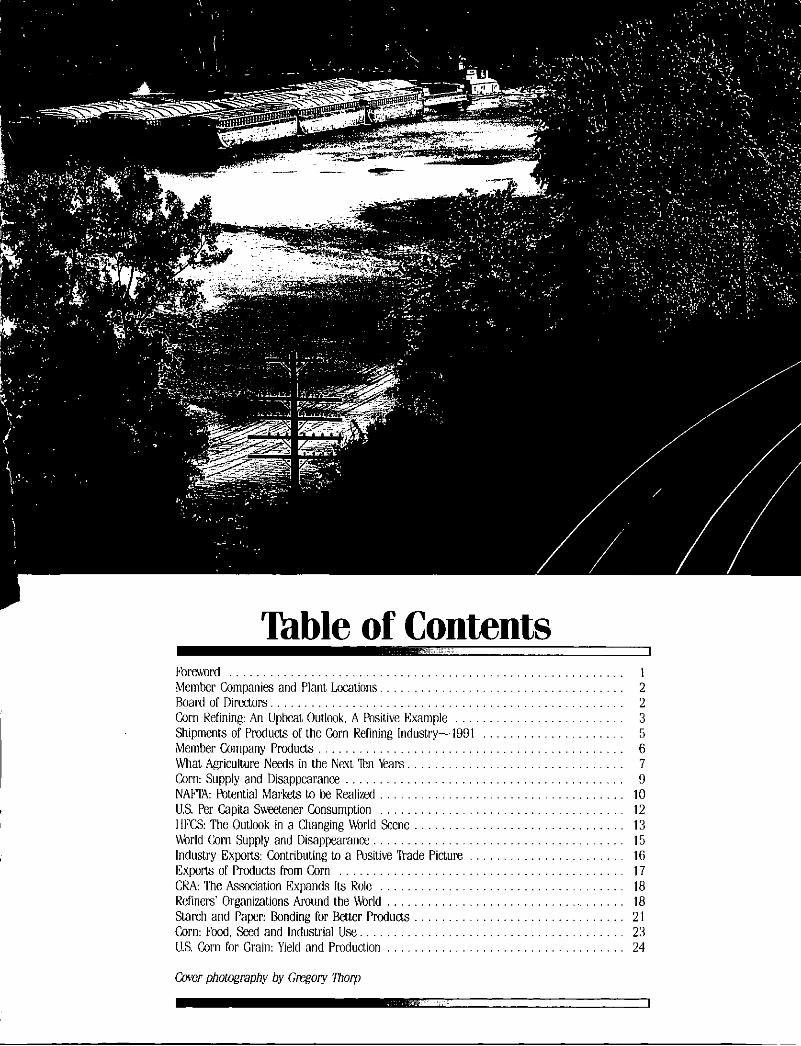
Table of Contents Foreword . . . . . . . . . . . . . . . . . . . . . . Member Companies and Plant Lowtions.. . . . . . . . . . . . . . Board of Dircctors.. . . . . . . . . . . . . . . . . . . . . . . . . . . . . . Corn Refining: An Upbeat Outlook. A Posilive Example Shipments of f'roducts of the Corn Kefining Induslry-I Mcmber Company Produds . . . . . . . . . . . . . . . . . . . . . . . . What Agriculture Needs in the N a t kn Years Corn: Supply and Disappearance . . . . . . . . . . . . . . . . . . . . NAFTA Potential Markets to be Realized . . . . . . . . . . . . . . . U.S. Per Capita Sweetener Consumption . . . . . . . . . . . . . . . I1KS The Outlook in a Changing Mrld Scene . . . . . . . . . . World Corn Supply and Disappearancc: Industry Exports: Contributing to a Pusitive Trade Picture . . Expms of Products from Corn . . . . . . . . . . . . . . . . . . . . . C K A The Association I.:xpands I t s Kolc Kcfinem' Organizations Around the World . . . . . . . . . . . . . . Starch and Paper: Bonding for Better Products . . . . . . . . . . Corn: Food. seed and Industrial Use U.S. Corn for Grain: Yield and Produnion . . . . . . . . . . . . . .
Cuwr phomraphy by Gregory Thorp
. . . . . . . . . . . . . . . . . . . . 1
. . . . . . . . . . . . . . . . . . . . 2
. . . . . . . . . . . . . . . . . . . . 5
. . . . . . . . . . . . . . . . . . . . 6 7
. . . . . . . . . . . . . . . . . . . . 9
. . . . . . . . . . . . . . . . . . . . I O
. . . . . . . . . . . . . . . . . . . . 13
. . . . . . . . . . . . . . . . . . . . 16
. . . . . . . . . . . . . . . . . . . . 17 . . . 18
. . . . . . . . . . . .... . . . . . . 18
. . . . . . . . . . . . . . . . . . . . 21 23
. . . . . . . . . . . . . . . . . . . . 24
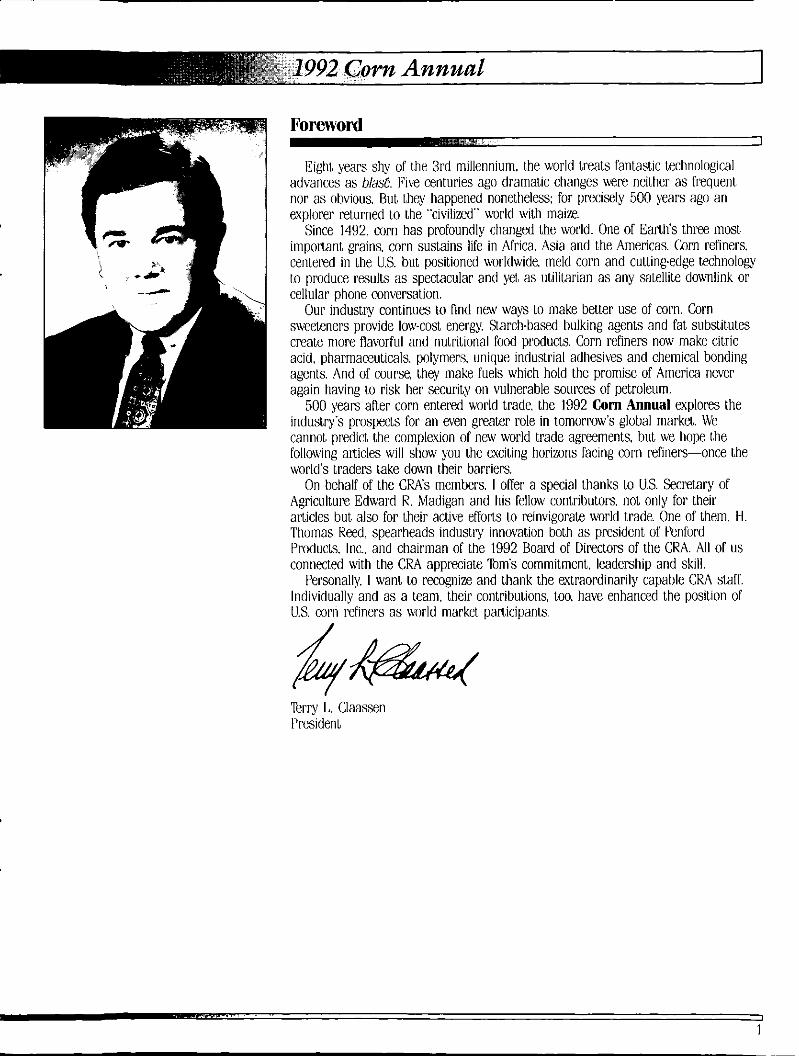
Foreword
E:ight years shy of the 3rd millennium. the world treats fantastic technological advances as b/asE. Five centuries ago dramatic changcs were neilhcr as frequent nor as obvious. But they happened nonetheless: for precisely 500 years ago an explorer returned to the "civilized" world with maize
Since 1492, corn has profoundly changed the world. One of Earth's three most important grains. corn sustains life in Africa, Asia and the Americas. Corn refiners. centered in the U.S. but positioned worldwide. meld corn and coking-edge technology to produce results as spectacular and yet as utilitarian a s any satellite downlink or cellular phone conversation.
sweeteners provide lo\\i-cost energy. Starch-based bulking agents and fat substitutes create more flavorful and nutritional food products. Corn refiners now make citric acid. pharmaceuticals. polymers. unique industrial adhesives and chemical bonding agents. And of course they make fuels which hold the promise of America never again having to risk her security on vulnerable sources of petroleum.
500 years after corn entered world trade, the 1992 Corn Annual explores the industry's prospects for an even greater role in tomorrow's global market. We cannot predict the complexion of new world trade agreements. but we hope the following afiicles will show )'oo the exciting horizons facing corn refiners-once the world's traders take down their barriers.
On behalf of the CRXs members. I offer a special thanks to U.S. Secretary of Agriculture Edward K. Madigan and his fellow contributors, not only for their articles but also for their active efforts to reinvigorate world trade. One of them, H. lhomas Reed, spearheads industry innovation both as president of Penford Products, Inc.. and chairman of the 1992 Board of Directors of the CKA. All of us connected Mth the CRA appreciate Tom's commitment. leadership and skill.
Personally. I want to recognize and thank the extraordinarily capable CRA skiff. Individually and a s a team. their contributions. too. have enhanced the position of U.S. corn refiners as world market participants.
Our industry continues to find new ways to make better use of corn. Corn
Rrry I,, Claassen President
I
1

Member Companies and Plant Locations
ADM Corn Processlng (A division of Arclrcr Daniels Midland
CPC International In(! lntcriiational .Plaza
Company) PO. Box 1470
1’0 box 8000 Enelmood Cliffs, New Jersey 07632
Decatur. Illinois 62525 Plants: Cedar Rapids. Iowa 5240.1
Clinton. Iowa 52732
PIG& Argo. Illinois ~ 0 5 0 1 - Stochon. Calif[irnia 95206 WinstonSalcni. North Carolina 27107
Decatur, I l l inm 62525 Mnntczuma. Nmv York 131 17 Minnesota Corn Processors ~ ~.~~~~ ~ ~~. ~ ~
400 \\Bt Main Street. Suite 201 ~larshall. h,linnesota 56258 Plant: Marshall. hlinnesota 56258
Natlonal Starch and Chemlcal Company
Britlgwater. New JersLy 08807 Plants: Indianapolis. Indiana 46221
American Xlal7x-Pmducts CompanJ 250 Harbor Plaz Drive Box 10128 Slamford. Conner:ti~:iit 06904 Plants: Decatur. Alabama 35601 I O Finderne Ai’enue
Dimmitt. ltms 70027 Hammond. Indiana 46320
North Kansas City, Missouri 641 I 6 Carglll, lncolporated i’n Rnu mnc I . . .. . . . . . Minneapolis. hlinncsota 55440 I’lants: Cedar Rapids. Iowa 5240t
Dayton. Ohio 45413 Eddyville. l o w 52553 Memphis. ‘lknnessee 381 13
Hoard of Directors
11. Thomas Reed, Chairman Penford Producl,~ Company
Douglas A. Laplns. \’Ice Chairman A. E. Staley hlanufactnring Company hlartln L. Andreas ADhl Corn P~iccssing
John G. Reed. Jr. Al)hl Corn Processing
Patric J. hlcLaughllo American hlaiz-Products Company
ked M. Ash American hlai&l’rotlucts Company
Honorary Directors
Penford Products Company (a tlivisioii of PENWEST) PO. Box 428 Cedar Rapids. lowa 52.106 Plant Cedar Rapids. l o w 52406
Roquette America, Inc. 1417 Exchange Street Keokuk. Iowa 52632 Plant Keokuk. Iowa 52632
,\. E. Staley Xlanufacluring Company (a subsidiary of Tate & Lyle. PLQ
Decatur. Illiiiiiis 62525 Plants: Dccatiir, Illinois 62525
PO I~OX I 5 I
Izifayette. Indiana 47005 (2) I1out1on. Rnnesscc 37774
CRA staff Rrry L. Claassen /’&dent Kyd D. Brenner Edith M. hlunm
~~ Karcn S. Petmsino Assismant Wasow Lea Ann Elliott Office Manager Marion Frayman Secretary Tracy Nylund Clerk
Dimtor of t‘utilic Affairs Director of Communications
E. S. Mlcek Cargill. lncorporalcd
Xllchael A. Urhanlc Cargill. Incorporated
Samuel C. Scott CI’C Inlcrnational Inc.
Bernard H. KasIory CPC lnlernational Inc.
Rlchard M. Jurgenson hliiinesota Corn Processors
Robert Nerhus hlinnesota Corn Processors
C. G . Caldwell National Starch and Chemical Cum[iang
G. M. Mitchell Cargill. Incorporated
William H . Powell National Sl,arcti and Chcniical Company
James A. Kennedy National Starch and Chemical Company
Phillp 13. Wade Pcnford Products Compaiiy
Robert J. Ireland RoquctCe America. Inc.
Bruce \\! Bmwn Hubingcr (Rurjoette America. Inc.)
J. P. Mohan A. II. Staky hlanufacturing (kinipany
Paul E. Kamstad American hlakPmducu: Cmipany
Paul E. Grunder CPC International Inc.
llarold Hellmao CI’C InLern;itimal Inc
Donald E. Xordlund A. E. Staley hlanufactnring Company HoherC M. Powers A. 1:. Staley li.lsnuf~icturitig Company
A. M. Roblnson liubingcr
2
Refiners expanded product lines and added plant capacity in 1991.
Corn Refining: An Upbeat Outlook, a Positive Example
by 1-1. Thomas Reed Chairman. Corn Refiners Association, Inc.
Set against the backdrop of 1991's sagging economy, the corn refining industry's performance in 1981 demonstrates a record of achievement which is the envy of many industries. Refiners increased shipments and corn usage. expanded into new products and launched new plant construction.
New Products from Corn
new product lines.
Products Company, National Starch and Chemical Company and A.E. Staley Manufacturing Company.
ADM Corn Processing's fermentation plant came on-stream. making feed additives from refined corn feedstocks. and Cargill Incorporated took its first step into ethanol production.
Penford Products Company broadened its line of starch-latex copolymers for paper coatings and has expanded that technology into textiles. paper size presses. and other paper applications, Minnesota Corn Processors entered the carbon dioxide market.
This list only suggests the potential still to be explored. New projects which will help realize even more of the potential in corn are on the drawing board. For example, Cargill. Incorporated is exploring the production of lactic acid polymers as a new product in the degradable polymer market. American MaizeProducts Company is coming to market with new lines of hybridized specialty corn starches.
New Plant Capacity While corn refiners fxpanded their product lines, they have also added to plant
capacity during 1891. A number of significant additions for products like crystalline fructose, high fructose corn syrup, dextrose and starches were undertaken during the year, such as Penford's 30 percent expansion of its starch facility. Other expansions are still in the works, including, at Penford. a furlher 33 percent increase in spxialty industrial starch capacity by 1993.
Every corn wet miller showed growth by introducing new products or entering
Starch-based fat replacers made the news. with entries by American Maize-
However, the big n e w in plant expansion this year has been ethanol. Corn refiners are responding to the increased need for ethanol as part of the
Clean Air Act strategy to improve air quality. In 1891. Cargill came into the ethanol economy, CPC International initiated a major expansion at its Pekin Energy joint venture project. Minnesota Corn Processors, a farmer-owned cooperative, began construction of Nebraska's first corn wet milling facility, primarily for ethanol production, and other ethanol refineries are on the drawing boards throughout the corn refining industry. While just a few years ago only a few corn wet millers were in the ethanol business, today most CKA member companies are in the alcohol fuel market, including our newest member, Roquette America.
Rising Corn Demand and Product Shipmenls These advances produced another year of growing corn demand and growing
shipments by CRA members. Corn usage in 1991 was up over three percent. and
member company shipments increased 3.3 percent, despite the recession's effects on important consumer industries.
which began in the United States and has reached its most extensive level of development here, is more and more an international industry.
for corn products. In other nations, corn refining technology is increasingly being put to work, often with joint ventures or other links to US. companies. Most of CFXs member firms are major factors in world agricultural markets, and all of the US. industry has a deep interest in developing new international roles for corn products.
Trade Challenges
Wet milling industry exports grew by over 15 percent in 1991. Corn Efining,
U.S. companies have expanded into world markets, winning increased acceptance Member company shipments increased 3.3%.
Corn refiners faced other challenges besides the recession in 1991. As corn refining has been internationalized, trade issues have become more
critical to the industry's success. For example, the long struggle over agricultural trade policy in the Uruguay round of GATT negotiations presents Jekyll-and-Hyde
A pact that compromises too much and allows too many nations to continue
The European Community's "rebalancing" proposal represents the kind of worst-
~ ~~~~~ ~ ~ ~ ~ ~~ ~ ~~ ~~ ~ re trade restrictions to~limit imports of~prcducts like corn~gluten feed in exchange for^-^^^^-^ ~~ ~
trade abuses could seriously damage the U.S. corn industry.
case scenario that we oppose. Rebalancing would allow the EC. Lo rearrange its
liberalization in other areas. Corn refiners reject such a z t resum proposal. especially one which would have such a dramatic effect on U.S. corn processing and production. Rebalancing would arbitrarily raise production ethanol and IiFCS while adding nothing to the export poss of US. agriculture.
the world economy could open the door for corn refiners to expand into major markets.
of GATT and the U.N. Codex Alimentarius Commission as vehicles for harmonizing international food standards and resolving technical barriers to trade. Such negotiations could produce widely accepted specifications that would cut commercial red tape and transaction expenses and assure safer, more consistent products to consumers around the world.
problem that could be prevented. European customs officials, applying a novel technology to the testing of feed ingredients. suddenly ruled that U S corn gluten feed did not meet E.C. specifications and began placing prohibitive customs duties on the product.
understanding of the nature of corn refining and refined feed products. US. and EC. officials recognized that U.S:produced corn g l u m feed was acceptable under their import classifications. However. the cost of the misunderstanding in time and money was significant not only for corn refiners, but also for the industry's European customers.
Corn refining would also benefit from higher profile GATT reforms-such a s opening restricted markets like the European Community to corn sweeteners or Asian markets to modified starches. Whilc any GATT agrccment will require many adjustments, some positive and some negative, the U.S. corn refining industry is
~ ~ ~ ~~~ ~~ ~
for products like s of other segments
Conversely, a successful negotiation that strips market-distorting policies out of
Among the benefits that could flow from such a pact would be the increased use
Last year's corn gluten feed dispute represents a classic example of the kind of
After months of meetings and a major effort to improve E.C. officials'
positioned to he one of the winners in a truly fair global trading environment. The same is true of the pros and cons of a North American Free Trade
Agreement. If political leaders can achieve the necessary reforms, corn refiners. with their efficiency as sweetener producers and expertise in staxh technology. can look forward to even more growth potential in the decades ahead.
Domestic Concerns
refining
current U.S. tendency to balkanize regulations represents a threat to industry. In areas such as food labeling, food safety and right-to-know regulations. State legislation may force the food industry to cater to 50 separate sets of rules. As on the international level. both U.S. consumers and industries are better off Mth a single. well-enforced regulatory system that provides the Same protection for all Americans.
Looking Forward
important is that we look forward to even better growth. as we realize some of the gains initiated last year.
Since 1980. the corn wet milling industry has achieved an average compound growth rate of about 6.5 percent annually. Maintaining that rate would mean that our industry will use nearly two billion bushels of corn each year by 2001. That is
Domestic policies can also encourage or thwart the growth of industries like corn
While harmonizing international food standards would benefit corn refiners. the
While corn refiners are proud of their achievements in 1991. what's most
our goal
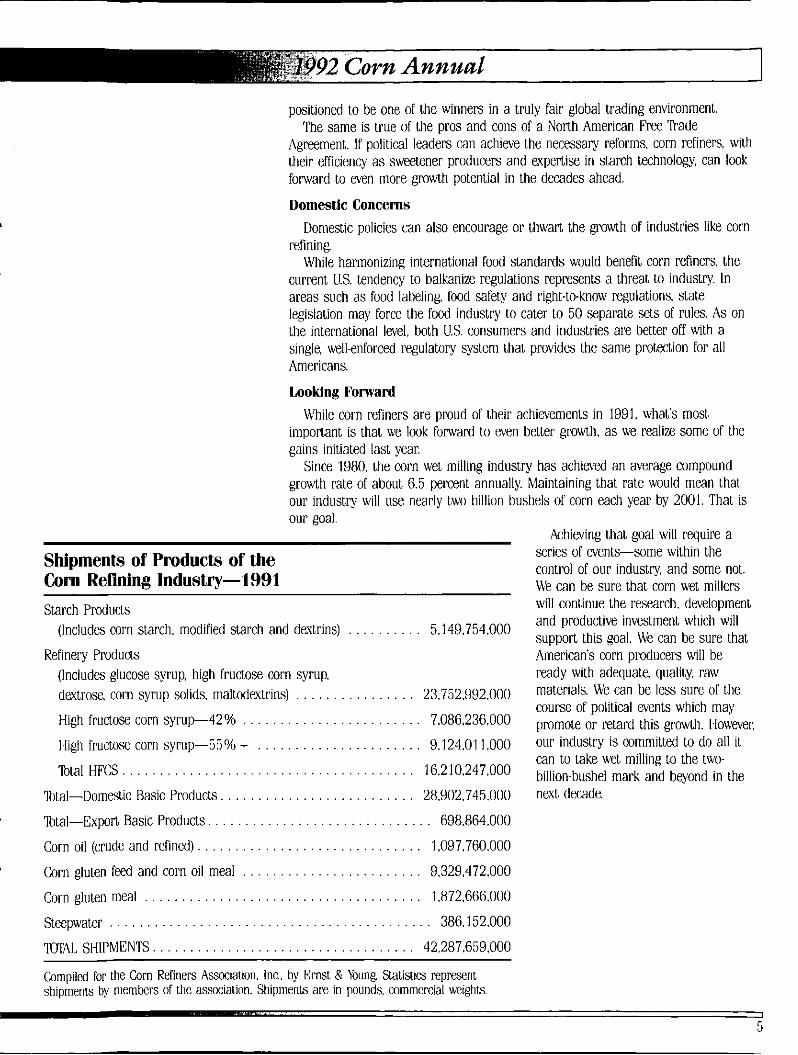
Shipments of Products of the Corn Refining Industry-1991 Starch Products
Refinery Products
(Includes corn starch. modified starch and dextrins) . . . . . . . . . . 5.149.754.000
(Includes glucose syrup. high fructose corn syrup. dextrose. corn syrup solids. maltodextrins) . . . . . . . . . . . . . . . . 23.752.992.000 High fructose corn syrup-42% . . . . . . . . . . . . . . . . . . . . . . . . 7.086.236.000
High fructose corn syrup--55% + . . . . . . . . . . . . . . . . . . . . . . 9.124.01 1.000
Total HFCS . . . . . . . . . . . . . . . . . . . . . . . . . . . . . . . . . . . . . . . 16.210.247.000 Total-Domestic Basic Products . . . . . . . . . . . . . . . . . . . . . . . . . . 28,902,745,000
Total-Export Basic Products. . . . . . . . . . . . . . . . . . . . . . . . . . . . . . 698.864.000
Corn oil (crude and refined). . . . . . . . . . . . . . . . . . . . . . . . . . . . . . 1.097.760.000 Corn gluten fed and corn oil meal . . . . . . . . . . . . . . . . . . . . . . . . 9.329.472.000
Corn gluten meal . . . . . . . . . . . . . . . . . . . . . . . . . . . . . . . . . . . . . 1.872.666.000 Steepwater . . . . . . . . . . . . . . . . . . . . . . . . . . . . . . . . . . . . . . . . . . . 386.1 52.000
TOTAI, SHIPMENTS. . . . . . . . . . . . . . . . . . . . . . . . . . . . . . . . . . . 42,287.659.000
Compiled for the Corn Refiners Association. Inc. by Ernst &. Young Statistics represent shipments by nlembers of tllc aS%JCialiOn. Shipments arc in pounds. commercial wights.
Achieving that goal will require a series of events-some within the control of our industry and some not. M'e can be sure that corn wet millers will continue the research, development and productive investment which will support this goal. We can be sure that American's corn producers will be ready with adequate. quality. raw materials. We can be less sure of the course of political events which may promote or retard this growth. tlowever. our industry is committed to do all it can to take wet milling t,o the two- billion-hushel mark and beyond in the next decade.
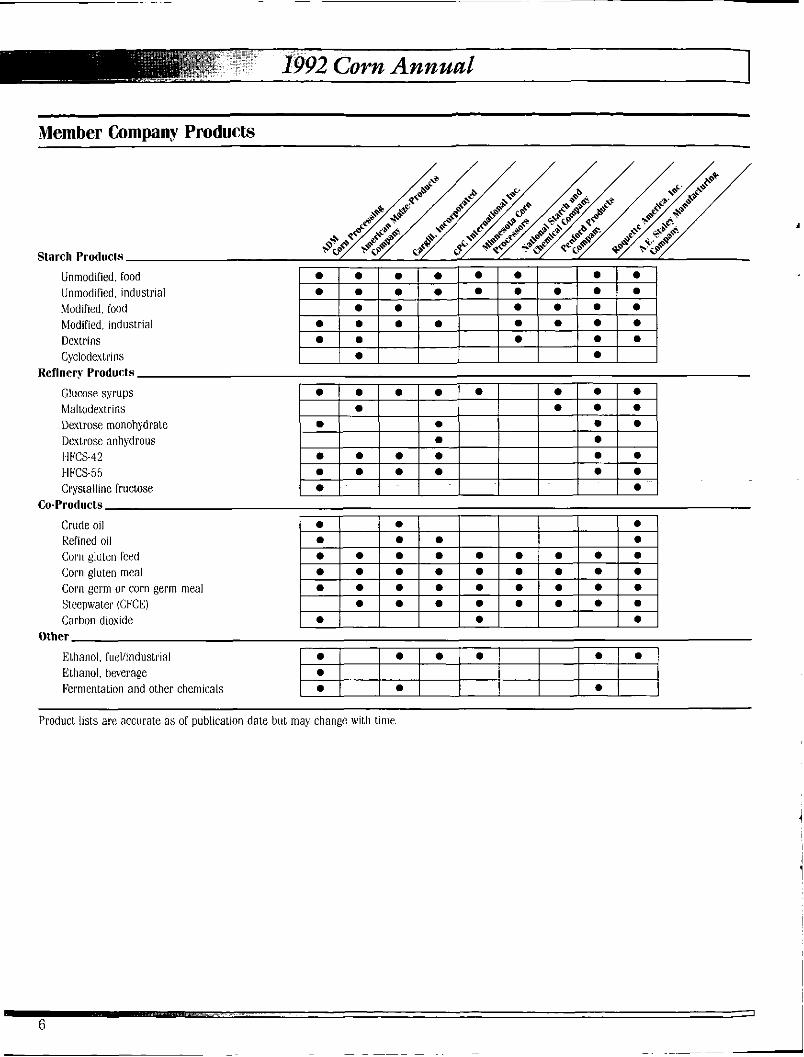
Member Company Products
Starch Producls
Unmodified. food Unmodified. industrial Modified, foud Modified. industrial Destrins Cyclodestrins
Refinery Products
Glucose syru[is hlaltodestrins Dexlrose monohydrate Dextrose anhpdrous l.lFCS-42 tiFCS.55 Crystalline fructose
Co-Products
Crude oil Refined oil
Corn gluten meal Corn germ or corn germ meal Steepwater (CFCE) Carbon dioxide
~~
CUSll glutell Iced
Olher
Ethanol. fuallinduslrial Ethanol. beverage I;ermentalion and other chemicals
Product iists are accurate as of publication date but may change With tinie
1
The first priority for farmers is a sound. . . US economy with a low rate of inflation.
What Agriculture Needs In the Next Rn Years
by Edward R. Madigan Secretary of Agriculture
I
C\'hat farmers need in the nmt ten years can be summed up fairly easily They
Getting that done is not so easy. But we can do it. The first priority for farmers is to operate in a sound. txpanding US. economy
with a low rate of inflation. That's better than any government program. A bustling econoniy that creates paychecks builds demand for farm products.
Paychecks that steadily gain buying power over time arc thc underpinning of the kind of strong economy with low inflation that farmers need.
pay off t.heir debts with cheaper dollars. But I didn't find farmers in my former congressional district in Illinois talking that way about inflation in the late 1970s and early 1980s.
lnflat.ion forced farmers' costs sky high. Farmers couldn't keep up. Their debts mounted rapidly in 1975-80. and their interest charges soared out of sight! And farm net income sagged.
Farmers sell three-fourths of tticir farm products into thc domcslic market. Muck of that demand is built in. People arc going to continue eating Each baby adds a growing healthy appetite to the demand for farm products. However. our population isn't growing as fast as it oncc did.
Population experts think that in the next 30 years we might add about 44 million people to the U.S. population, more than a third fewer than in the last 30 years.
It surprises most people to learn that farmers have fed the 71 million larger population in the last 30 years by tiarvcsting less land. In 1960 farmers harvested 255 million acres for the U.S. doinestic market. In 1990 it took only 216 million acres-1 5 percent fewer.
How do farmers do it? By increasing productivity and better efficiency mainly. Yields are higher and farm output per hour increased more than three times faster than in US. businesses. Ib maintain a strong domestic farm market in the US. in the n a t decade and
beyond. we need to develop higher-value industrial uses for farm and forest products. We need that to help offset the decline in the rate of population growth and to absorb increased agricultural productivity.
Ilk are using more corn per capita domestically. But we need to do better for corn and other farm products. Corn growers have benefitted from a steady increase in t.he use of corn for cereals and starches-and the big increase in the use of high fructose corn syrup and corn for producing ethanol.
industrial uses for farm products. hk will be pushing ethanol research, particularly methods of reducing ethanol production costs to make it an economically competitive fuel. Already the ethanol industry is using close to 400 million bushels of corn per year in ethanol production. The potential is much greater.
The implementation of the Clean Air Act will make ethanol and ethanol-based fuels an increasingly important renewahle resource fuel. We have an opportunity to increase the domestic outlet for corn. help the country meet its environmental goals, reduce our petroleum imports. improvc our nal.ional sccurity. strengthen our balance of trade. and crcale important n w markets for corn and other farm products.
need stronger domestic markets and a better shot at export markets.
Some people say that farmers like inflation. 1,and prices go up. And farmers can
We have put new funds in ncxt ycar's USDA budget to increase research in
.. . .. . .. . . ..
7
New uses for traditional farm crops. . . can stimulate the vitality of our rural communities.
NLW uxs aren't limited to ethanol. One company has plans underway to convert biodegradable plastics from agricultural crops. A plant in McAllen. 'Ikxas. plans to make newsprint from kenaf, an agricultural crop. Mohil Oil is making a refrigcrant and lubricant from rapseed oil and is marketing it commercially Austria. trying to combat pollution. has plans to manufacture diesel fuel made from soybwn oil.
N e w uses for traditional farm crops not only mean added iiicoiiie for agricullurc: but can stimulate the vitality of our rural communities. Nav uses will put idle land to work and will strengthen farm prices. This will increase demand for farm production items supplied through rural businesses. N e w uses will alsn create more jobs in rural marketing and processing industries. That increases the lax base in rural areas and strengthens rural institutions.
Concern for the environment will become more important as farmers contribute lo good living conditions while staying economically competitivc We arc increasing our USDA budget in important areas to help with that. We are boosting research on biotechnology that \vi11 build greater disease and pest resistance into our plants and animals. It will lead to plants that will be more resistant to drought. summer heat. and frosts. and plants that will be more receptive to saline soils. It will give us the ability to fight insects with hormones and fight livestock diseases with bioengincuretl vaccines. instead of harsh chemicals.
I
Overall. these advancements will cut farm costs per unit of production. Advancements in biotechnology will also help food proccssing as we create new
foods, more nutrkious foods, foods with longer shelf life, higher quality foods. and higher value foods.
Other countries around the world will be doing the same. We must lead the way or lose markcts. 1Vc cad1 dcfcnd our markas or prosper by standing still and hanging onto higher cost. less efficient methods of farm production and processing Others will pass 11s by.
American farmers sell one-fourth of their products into competitive export markets. This has been a growing market, but wc have lost ground. In 1960 we exported t,he production from 64 million US. acres. By 1980 t,hat had reached 137 million acres-a remarkable 114 percent incmse. Unfortunately that had declined to 81 million acres by 1985.
LVe know what it means to lose export markets. \Ve learned a very costly lesson in 1981-85. Our farm export t,onnage and dollar value shrank more than onefourth.
Our domestic demand held up-in fact, actually set records throughout 1980-85. But our loss of farm cuport markets plunged American agriculture into a step recession. It was very painful. Could there be any clearer evidence lhat the severe 1980-85 farm recession was a farm-euport recession.
During that time. t.he European Community decreased its wheat and feed grain impoils by nearly 18 million tons and boosted its exports. U.S. cxyoits of whcat and feed grains suffered losses of comparable size.
How did the EC. do it? By boosting production, keeping out grain imports with restrictive border barriers. and spending large amounts of money to subsidize its farin exports in markets wvhere we and other expofleers were competing
That's what the present GATT Uruguay Round negotiations arc all about. It's why the U.S. is adamant t.hat we get world-wide changes in trade rules that will prevent harm to U.S. farmers and US. agriculture-and to other countries as well.
GAIT has been a hard fight for more than five years. We have "hung tough'' because so much is at stake for American farmer?, But not just that. So much is at stakc for Our entire economy, for other countries. and for economic growth in the world. 'The iiegotialioiis go beyoiid agriculturt:
~ ~~~
I
The GATT agreement will affect the vigor and growth of American businesses and the creation of jobs for the American workforce. That affects U.S. farmers in their primary market where they sell three-fourths of their farm products.
That is the agenda: Aggressive action U, broaden and increase the demand for US. farm products here at home and abroad: better research to hone he competitive ability of US. agriculture and the quality of its products; increased profitability for American farmers: and cooperation among federal, state and local governments and local businesses and private groups and leaders to bring new life to rural communities.
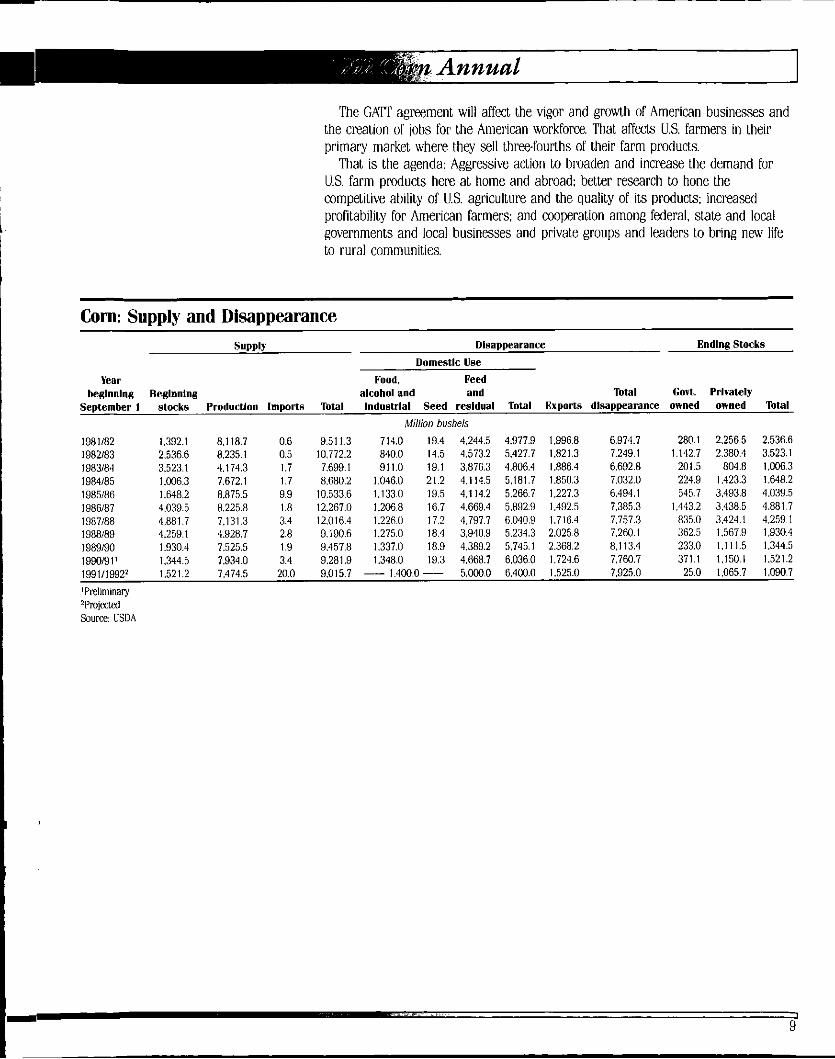
Corn: Suppis and Disamarance SUPPlY Dlsappearance Ending Stocks
Domestlc Use Year Food, Feed
beglnnlng Beglnnlng alcohol and and Total Govt. Privately September 1 stocks Productlon lmpons Total lndnslrlal Seed resldual Total Expons dlsappearance owned owned Total
Million bushels
198 1/82 1.392.1 8,118.7 0.6 9.511.3 714.0 19.4 4.244.5 4.977.9 1.996.8 6.974.7 280.1 2.256.5 2.536.6 1982/83 2.536.6 8.235.1 0.5 10,772.2 840.0 14.5 4.573.2 5.427.7 1.821.3 7.249.1 1,142.7 2.380.4 3.523.1 1983/84 1984185 1985186 1986187 1987188 1988189 1989190 199019 1 ' 1991/19922 'PreIimina!y 'Pmjeckd Source: USDA
3.523.1 4.174.3 1.7 7.699.1 911.0 19.1 3.876.3 4.806.4 1.886.4 6.692.8 201.5 804.8 1.006.3 1.7 8.680.2 1.046.0 21.2 4.114.5 5,181.7 1.850.3 7.032.0 224.9 1.423.3 1.648.2 1.006.3 7.672.1
1.648.2 8.875.5 9.9 10.533.6 1.1330 19.5 4.114.2 5.266.7 1,227.3 6.494.1 545.7 3,493.8 4.039.5 4.039.5 8.225.8 1.8 12.267.0 1.206.8 16.7 4.669.4 5,892.9 1.492.5 7.385.3 1,443.2 3.438.5 4.881.7 4.881.7 7.131.3 3.4 12.016.4 1.226.0 17.2 4.797.7 6.040.8 1.716.4 7.757.3 835.0 3,424.1 4.259,l
362.5 1.567.9 1.930.4 4,259.1 4.928.7 2.8 9.190.6 1.275.0 18.4 3,940.8 5.234.3 2.025.8 7.280.1 233.0 1.111.5 1,344.5 1.930.4 7.525.5 1.9 9.457.8 1.337.0 18.9 4.389.2 5.745.1 2.368.2 8.113.4
1.344.5 7.934.0 3.4 9.281.9 1.348.0 19.3 4.668.7 6.036.0 1.724.6 7.760.7 371.1 1,150.1 1.521.2 1.521.2 7.474.5 20.0 9.015.7 -1.4CQ.O- 5.000.0 6.4W.0 1.525.0 7.925.0 25.0 1.065.7 1.090.7
9
While it has the potential to be a relatively Iowcost producer, the nation's land resources are limited, and the rapid rate of population growth will make it very difficult for production to catch up with demand.
to sugar, Mexico should be encouraging development of a domestic corn refining industry. even if it will be necessary to import the corn. The diverse products that corn refiners manufacture will all be needed as Mexico's industries twelve. And the technology is one that any developing economy would benefit from.
NARA coverage. But the outcome is clearly one in which U.S. corn refiners have a stake, whether through creation of an exporl market, or through participation in development of Mexico's own corn refining industry.
Because HFCS and other corn sweeteners can be produced a t low cost compared
It is, of course, possible that agriculture and food will somehow be excluded from
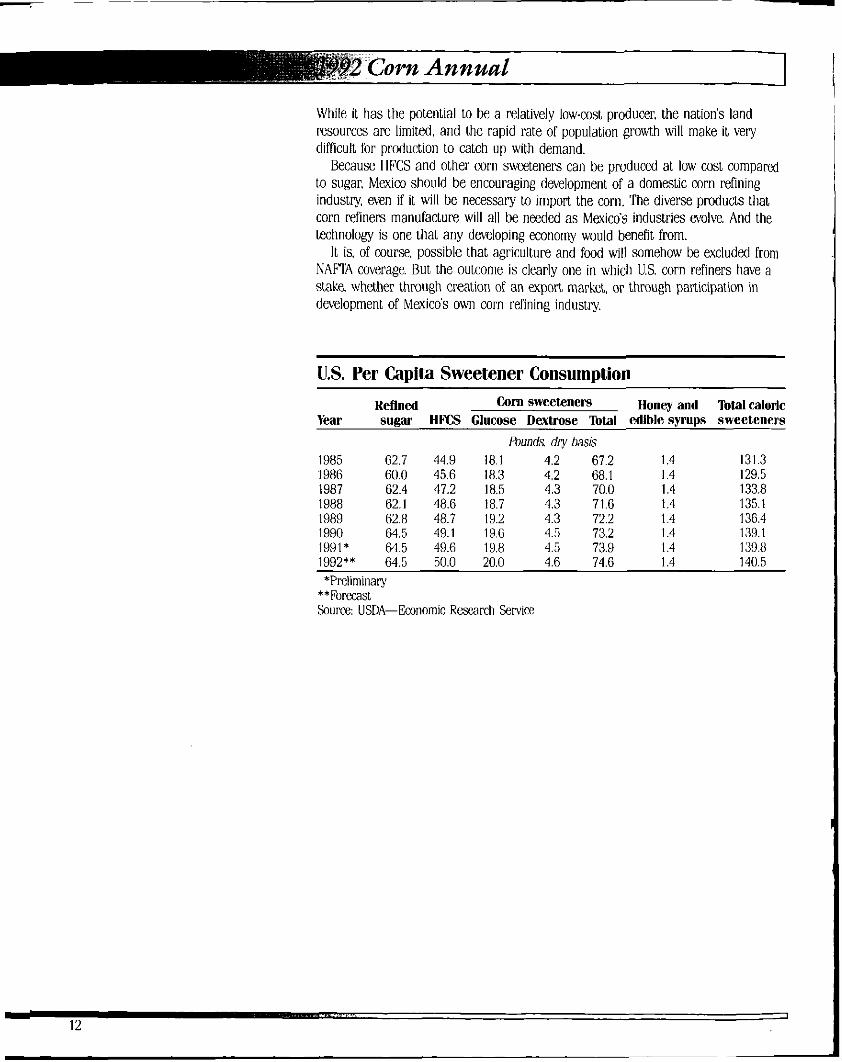
US. Per Capita Sweetener Consumption Refined Corn sweetenen, Honey and Total caloric
Year sugar HFCS Glucose Dextrose Total edlble syrups sweeteners Pounds dry basis
1985 62.7 44.9 18.1 4.2 67.2 1.4 131.3 1986 60.0 45.6 18.3 4.2 68.1 1.4 129.5 1987 62.4 47.2 18.5 4.3 70.0 1.4 133.8 1988 62.1 48.6 18.7 4.3 71.6 1.4 135.1 1989 62.8 48.7 19.2 4.3 72.2 1.4 136.4 1990 64.5 49.1 19.6 4.5 73.2 1.4 139.1 1991* 64.5 49.8 18.8 4.5 73.9 1.4 139.8 1992** 64.5 50.0 20.0 4.6 74.6 1.4 140.5 *Preliminary
**Forecast Source: USDA-Economic Research Senlice
HFCS: The Outlook In A Changing World Scene
by Landell Mills Commodities Studies
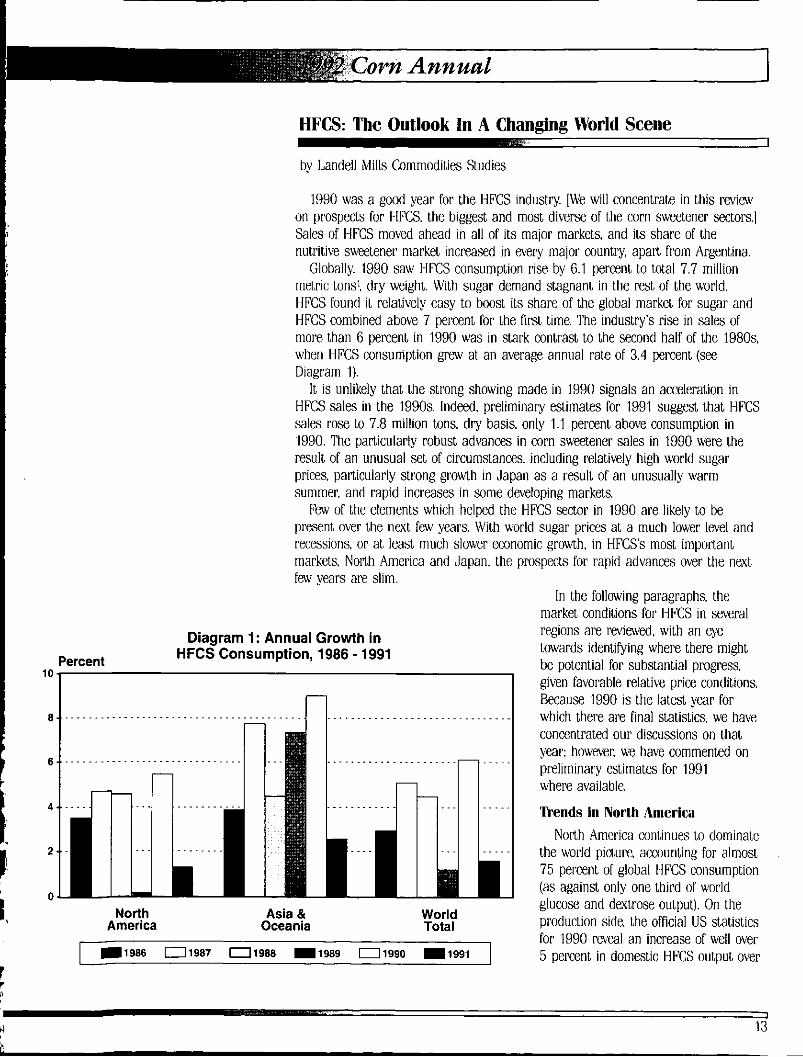
1990 was a good year for the HFCS industry. [We will concentrate in this review on prospects for IHFCS. the biggest and most diverse of the corn sweetener sectors.] Sales of HFCS moved ahead in all of its major markets. and its share of the nutritive sweetener market increased in every major country, apart from Argentina.
Globally, 1990 saw I-IFCS consumption rise by 6.1 percent to total 7.7 million metric tons', dry weight. With sugar demand stagnant in the rest of the world, HFCS found it relatively easy to boost its share of the global market for sugar and HFCS combined above 7 percent for t.he first time. The industry's rise in sales of more than 6 percent in 1990 was in stark contrast to the second half of the 1980s. when HFCS consumption grew at an average annual rate of 3.4 percent (see Diagram 1).
It is unlikely that the strong showing made in 1990 signals an acceleration in HFCS sales in the 1990s. Indeed. preliminary estimates for 1991 suggest that I-IFCS Sales rose lo 7.8 million tons, dry basis. only 1.1 percent above consumption in 1990. The particularly robust advances in corn swetener sales in 1990 &'ere the result of an unusual set of circumstances, including relatively high world sugar prices, particularly strong growth in Japan as a result of an unusually warm summer. and rapid increases in some developing markets. Few of the elements which helped the HFCS sector in 1990 are likely to be
present over the next few years. With world sugar prices at a much lower level and recessions. or a t least niuch slower economic growth, in HFCS's most important markets. North America and Japan, the prospects for rapid advances over the nut few years are slim
Diagram 1: Annual Growth in HFCS Consumption, 1986 - 1991 Percent
10 I
...............................
......................
............
North Asia & World America Oceania Total
-1986 0 1 9 8 7 0 1 9 8 8 1 1 9 8 9 0 1 9 9 0 1 1 9 9 1
In the following paragraphs. the market conditions for HFCS in several regions are wiewed. with an eye towards identifying where there might be potential for substantial progress. given favorable relative price conditions. Because 1990 is the latest year for which there are final sLatistics. we have concentrated our discussions on that year: however. we have commented on preliminary estimates for 1991 where available.
Trends in North America North America continues to dominate
the world picturc accounting for almost 75 percent of global I-IFCS consumption (as against only one third of world glucose and dwtrose output). On the production side. the official US statistics for 1990 reveal an increase of well over 5 percent in domestic HFCS output over
The two other growing regions for HFCS sales are Latin America and Africa.
14
its level in 1989. belying the pessimism engendered by the growth in the share of diet soh drinks in the US market.
they were drawn down in 1989, while another import,ant factor was a sharp reduction in net imports from Canada. In contrast to 1990. preliminary estimates for 1991 suggest that output increased over 1990s level by less than 2 percent. to 5.7 million tons, dry basis.
The cross-border trade that occurs b e t w m the US and Canada is one of the major featrires of Itre broader North American picture. Until recently. the general trend has bten for flows to run from Canada to the US. with Canadian shipments to the US peaking a t roughly 200.000 tons. dry weight.
Canadian sugar prices are linked to world market values; therefore. the revival of world prices after 1985 helped to boost Canadian HFCS sales. By 1990. US shipments to Canada exceeded 80.000 tons and the export surplus of Canada Iiad fallen below 50.000 tons. a quarter of the level just four years earlier.
'Ihnds in Asia The Asian region made an important contribution to the global 1990 and 1991
HFCS performances. Sales in the Japanese HFCS industry although growing more slowly than its North American counterpart. strengthened in 1990. largely as a result of a very warm summer, which boosted sales of soh drinks.
Compared with growth of 3 percent in 1989. the increase in I-IFCS sales was wdl over 5 percent in 1990. With the resumption ofhnore typical summer temperatures in Japan in 1991 came a more normal rate of increase in consumption. with HFCS sales rising by 1 percent over the level in 1990.
producer High duiiiestic sugar prices. air apanding soh drink sector and government support for maize imports were the spurs to the rapid developnient of HFCS sectors. In 1990. HFCS production in 'biwan exceeded 67.000 tons, dry basis. a gain of over 30 percent on 1989. Preliminary figures suggest that output rose substantially in 1991. as well.
Trends in latin America and Africa
The two other growing regions for HFCS sales are Latin America and Africa. HFCS sales in the two regions combined increased by more than 17 percent between 1989 and 1990. The largest corn swetener industry in the two regions is found in Argentina. where HFCS production quotas were in place until 1991. but where the sector is now entirely unregulated.
However, when quotas were in place. it was not the supply side that was constraining demand, but the other way around. 1987 was the last year in which the economy was performing well enough to generate demand for the cntire production quota. which stood at 82.485 tons of fructose content (equivalent to roughly 170.000 tons. dry basis). The quot,a rose by approximately 10 percent in 1988. but total sales actually fell back. The recession which took hold in 1989 pushed sales down further, to a greater degree than the decrease that was imposed upon the 1989 quota.
The first half of 1990 saw a conlinuation of the recession. but the sitiiation started to improve in the second half of the year. For 1990 a s whole. outpot is estimated to have reco\:ered to the levels pwailing four years earlier. This w iva l has continued into 1991 with sales to lhe soft drink sector reported to have been very good.
However, some of t,his increase constituted a replenishment of users' stocks a k r
Elsewhere in Asia, Taiwan is likely to be the next 100.000 ton-plus I-IICS
Trends in Europe The only region which singularly failed to participate in the acceleration in HFCS
output was Europe EC production remains capped by quotas, which are set a t 291.115 tons. dry basis, within the framework of the Sugar Regime of the Common Agricultural Policy. Elsewhere, the disintegration of East European economies has taken its toll on HFCS producers. Rvo projects that were supposed to have been commissioncd by now, in Bulgaria and Kirghizia (in the old USSR), are still some way from start-up.
Prospect8 for the 1990s
much more modest increase in 1991 showed how unusual was 1990's rise in demand and highlighted the sensitivity of prospects for I-IFCS to world sugar prices. Relative costs of sugar and HFCS play a very important role in determining the location of wet milling plants.
It comes as little surprise to discover that the current rapid slowdown in HFCS production worldwide has coincided with a period of depressed world sugar prices. Many of the potential producers of HFCS are importers of sugar: therefore they make an mplicit trade-off between the costs of importing more sugar from the world market and the likely costs of production of HFCS. When world prices of sugar do eventually manage to sustain a recovery. the viability of new tIFCS plants will look much marc attractive, and a new wave of investment can be expected to materialize
The HFCS industry began the 1990s with relatively rapid growlh in sales. A
'All measures in this article are expressed in metric ton of 2.204.62 pounds
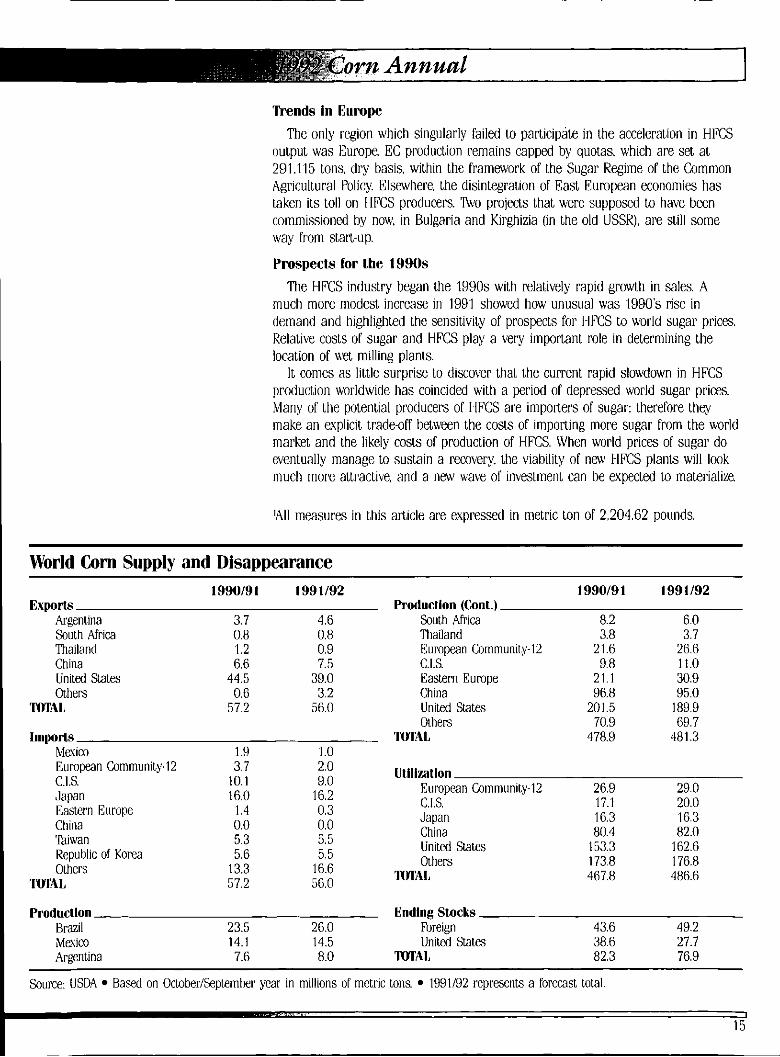
World Corn Supply and Disappearance 1990/91 1991192 1990191 1991192
Exports Production ( a n t . ) Argentina 3.7 4.6 South Africa 8.2 6.0 South Africa 0.8 0.8 Thailand 3.8 3.7 Thailand 1.2 0.9 European Community-12 21.6 26.6 China 6.6 7.5 C.I.S. 9.8 11.0 United States Others
I W A L
44.5 39.0 Eastern Europe 21.1 30.9 0.6 3.2
57.2 56.0 China United States Olliers
96.8 95.0 201.5 189.9 70.9 69.7
Imports " N A L 478.9 481.3 Mexico 1.9 1 .0 Eurormn Community-i2 C.I.S. Japan Eastcrn Europe China 'Taiwan Republic of Korea Others
I W A L
3.7 10.1 16.0
1.4 0.0 5.3 5.6
13.3 57.2
2.0 9.0
16.2 0.3 0.0 5.5 5.5
16.6 56.0
Utilization European Community-12 C.I.S. Japan China United States Others
IVrllI,
26.9 17.1 16.3 80.4
153.3 173.8 467.8
29.0 20.0 16.3 82.0
162.6 176.8 486.6
Productlon Endlng Stocks Brazil 23.5 26.0 Foreign 43.6 49.2 Mc-ico 14.1 14.5 Uniled Stam 38.6 27.7 Argentina 7.6 8.0 W I l I , 82.3 76.9
Source: USDA Based on 0ctoberiSeptemt)er year in millions o l metric mns. 1991192 represents a forecast Mtal.
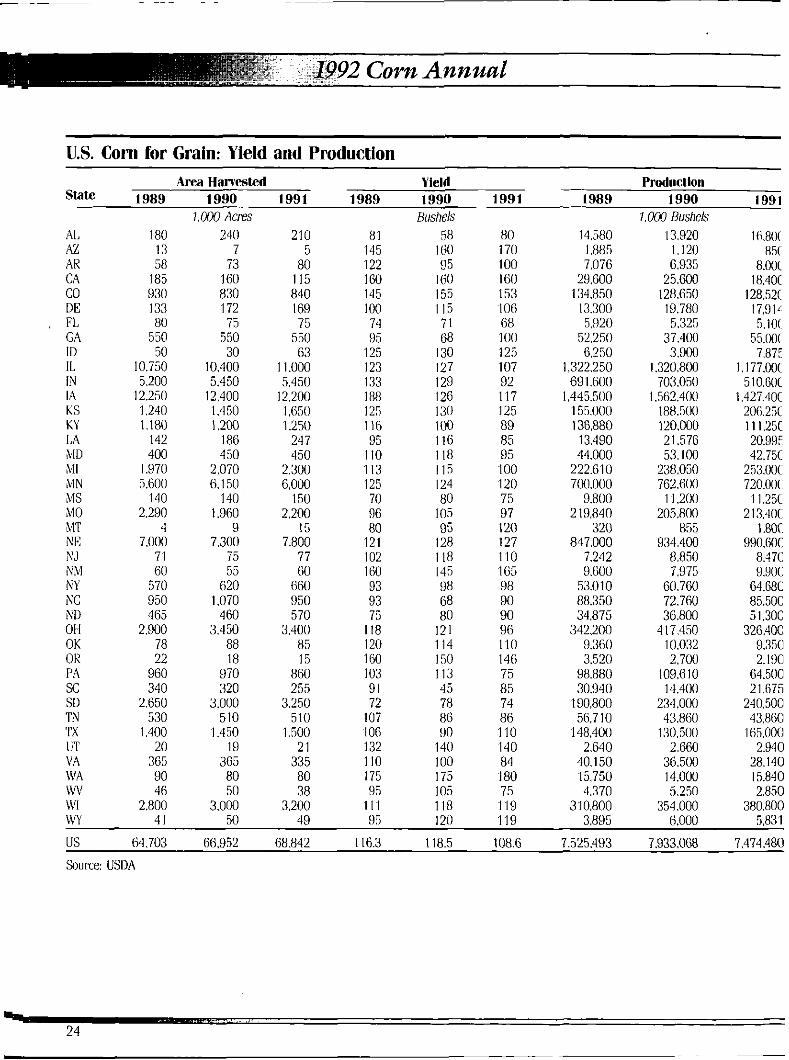
U.S. Corn for Grain: Yield and Production Area Harvested Yield Pruductlon
I989 1990 1991 1989 1990 1991 1989 1990 1991 State
AI, AZ AR CA co DE FL GA ID IL IN It1 KS KY LA MD MI M N MS M 0 MT NE NJ N M NY NC ND OH OK OK PA sc SD TN 'IX UT \'A \\'A \I'v 11'1 W Y
180 13 58
185 930 133 80
550 50
10.750 5.200
12.250 1.240 1.180
142 400
1.970 5.600
140 2.290
4 7.000
71 60
570 950 465
2.900 78 22
960 340
2.650 530
1.400 20
365 90 46
2.800 41
l.m /ICES
240 7
73 160 830 172 75
550 30
10.400 5,450
12.400 1.450 1.200
186 450
2.070 6. I50
140 1,960
9 7.300
75 55
620 1.070
460 3.450
88 18
970 320
3,000 510
1.450 19
365 80 50
3.000 5n
210 5
80 115 840 169 75
550 63
I I.OOO 5.450
12.200 1,650 1.250
247 450
2.300 6,000
150 2.200
15 7.800
77 60
660 950 570
3.400 85 15
860 255
3.250 510
1.500 21
335 80 38
3.200 4Q
81 145 I22 1 60 145 100 74 0 5
125 123 133 I88 I25 1 I6 95
I10 I13 125 70 06 80
121 102 160 03 83 75
I18 I20 160 1 03 91 72
107 I 06 132 1 I O I75 95
111
Biishds 58
I(i0 95
100 155 I I5 71 68
I30 127 129 126 130 100 116 I18 I15 I24 80
95 128 118 145 98 68 80
121 1 I 4 150 1 I3 45 78 86 00
140 100 I75
118
105
105
R 5 1711
80 170 100 160 153 106 68 100 125 107 92 117 125 89 85 95 100 120 75 97 120 127 110 165 98 90 90 96 110 146 75 85 74 86 110 140 84 180 75 119
14.580 1 885 7.076
29.600 134.850
13.300 5.920
52.250 6.250
1.322.250 69 1.600
155.000 136.880
13.490 44.000
222.6 I0 700.(3(3(3
9.800
320 847.000
7.242 9.600
53.010 88.350 34.875
342.200 9,360 3.520
98.880 30.940
190,800 56,710
148.400 2.640
40.150 15,750
310.800
1,445,500
219.840
4.370
7.000 Bushels 13.820 1.120 6.935
25.600 128.650 19.780 5.325
37.400 3.900
1.320.800 703.050
1.562.400 188.500 120.000 21.576 53.100
238.050 762.600
1 1.200
855 934.400
7.975 60.760 72.760 36.800
417.450 10.032 2.700
109,610 14.400
234.000 43.860
130.500 2.660
36.500 14.000
205.800
8,850
5.250 354.000
lfi.8Ol
8.00( 18.40(
128.52( 17.91' 5.111(
55.00( 7.87:
I. I77.00( 510.60(
1.427.40( 206.251 11 1.251 20.99: 42.751
253.00C
1 1.25C
mi
72o.noc
2 I 3 . m I .8oc
990.60C 8.47C YJOC
64.68C 85.50C 51.30c
326.40C 9.35(1 2.190
2 1.675 240.500 43.860
165.000 2.940
28.140 15.840 2.850
380.800
64.500
.. . .. I_ ." ., ., 119 3.895 6.000 5.H31
us 64,703 Mi.952 68.842 116.3 118.5 108.6 7.525.493 7.933.068 7.474.480 Source: USIIA