Embed Size (px)
Citation preview
Title Dielectric Constants of Emulsions
Author(s) Hanai, Tetsuya; Koizumi, Naokazu; Goto, Rempei
Citation Bulletin of the Institute for Chemical Research, KyotoUniversity (1962), 40(4): 240-271
Issue Date 1962-09-20
URL http://hdl.handle.net/2433/75898
Right
Type Departmental Bulletin Paper
Textversion publisher
Kyoto University
Dielectric Constants of Emulsions
Tetsuya HANAI, Naokazu KOIZUMI and Rempei GOTOH*
(Gotoh Laboratory) (Koizumi Laboratory)
Received July 3, 1962
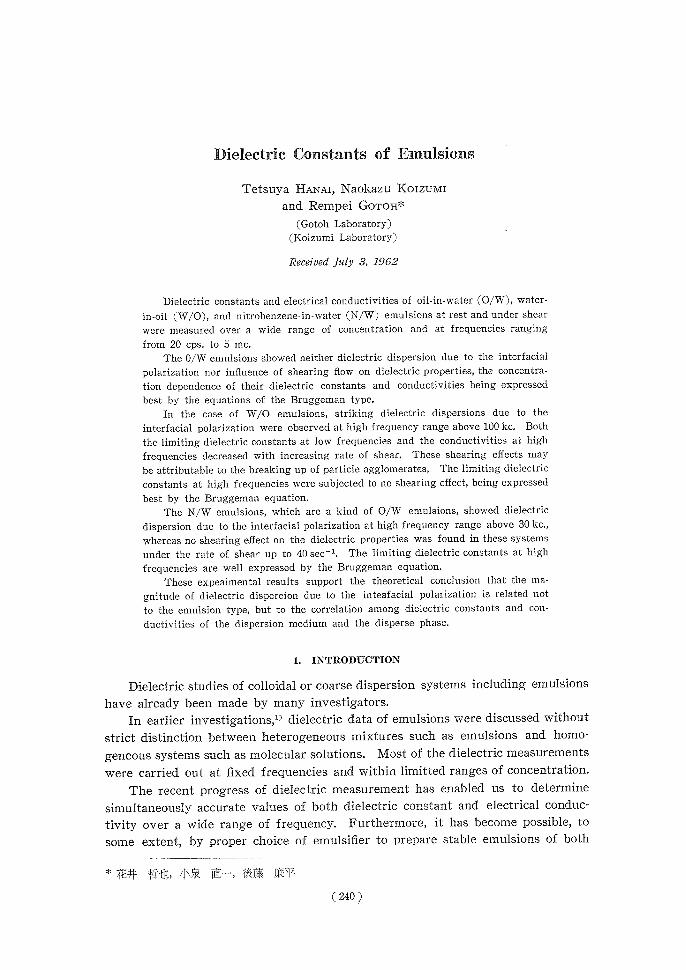
Dielectric constants and electrical conductivities of oil-in-water (0/W), water- in-oil (W/0), and nitrobenzene-in-water (N/W) emulsions at rest and under shear were measured over a wide range of concentration and at frequencies ranging
from 20 cps. to 5 mc. The 0/W emulsions showed neither dielectric dispersion due to the interfacial
polarization nor influence of shearing flow on dielectric properties, the concentra- tion dependence of their dielectric constants and conductivities being expressed best by the equations of the Bruggeman type.
In the case of W/0 emulsions, striking dielectric dispersions due to the interfacial polarization were observed at high frequency range above 100 kc. Both
the limiting dielectric constants at low frequencies and the conductivities at high frequencies decreased with increasing rate of shear. These shearing effects may
he attributable to the breaking up of particle agglomerates, The limiting dielectric constants at high frequencies were subjected to no shearing effect, being expressed best by the Bruggeman equation.
The N/W emulsions, which are a kind of 0/W emulsions, showed dielectric dispersion due to the interfacial polarization at high frequency range above 30 kc.,
whereas no shearing effect on the dielectric properties was found in these systems under the rate of shear up to 40 sec-1. The limiting dielectric constants at high
frequencies are well expressed by the Bruggeman equation. These expeaimental results support the theoretical conclusion that the ma-
gnitude of dielectric dispereion due to the inteafacial polarization is related not to the emulsion type, but to the correlation among dielectric constants and con-
ductivities of the dispersion medium and the disperse phase.
1. INTRODUCTION
Dielectric studies of colloidal or coarse dispersion systems including emulsions
have already been made by many investigators.
In earlier investigations,') dielectric data of emulsions were discussed without
strict distinction between heterogeneous mixtures such as emulsions and homo-
geneous systems such as molecular solutions. Most of the dielectric measurements were carried out at fixed frequencies and within limitted ranges of concentration.
The recent progress of dielectric measurement has enabled us to determine
simultaneously accurate values of both dielectric constant and electrical conduc-tivity over a wide range of frequency. Furthermore, it has become possible, to
some extent, by proper choice of emulsifier to prepare stable emulsions of both
* 11;41, 4r--lh, in. f—, v it U(~'
(240 )
Dielectric Constants of Emulsions
oil-in-water and water-in-oil type over a wide range of concentration, and to
choose constituent phases having dielectric constants and electrical conductivities
appropriate to the purpose.
In connection with the advanced study of rheology, the influence of shearing
flow on the dielectric properties of emulsions may also be a subject of some
interest.
It was first found by Parts') that heterogeneous dispersion systems show
marked changes in dielectric properties on agitation. He reported that the di-
electric constant of a printing ink, which is a dispersion system of carbon black in varnish, increased on ceasing the movement. Voet3) observed that the dielectric
constants of various suspensions dispersed in oils decreased on agitation. Bondi
and Penther") reported the frequency dependence of such an agitation effect for
various suspensions. This effect was ascribed to the change in the state of
agglomeration of dispersed particles. A similar agitation effect is also expected
in the case of emulsions.
From the theoretical point of view, the formulas for the dielectric constant
of spherical dispersion systems were proposed by several workers as shown in a
subsequent section. Recently Reynolds and Hough') discussed relationship between
these formulas. The validity of these formulas, however, has not been examined
yet for lack of experimental data obtained over a wide range of concentration and for each type of emulsions.
These theoretical formulas for dielectric constant are considered to hold for
spherical dispersions composed of non-conductive phases. Dispersion systems
composed of two phases having finite conductivities are expected to show a
dielectric dispersion, which is a so-called interfacial polarization.
In previous papers,m,^) the Maxwell and the Wagner theory of the interfacial
polarization were discussed in detail, and a new theory was proposed for con-centrated spherical dispersions.
The dielectric dispersion due to the interfacial polarization has so far been
observed in the W/O emulsions only,9,10,11,12) and none of its examples has been
found in usual emulsions of the O/W type yet. This fact was reasonably inter-
preted by the Wagner and the new theory. According to the new theory it was predicted that, when the dielectric constant of the oil phase is as high as
nitrobenzene, the dielectric dispersion due to the interfacial polarization may be
observed even in emulsions of the O/W type.
In order to examine the validity of these theoretical formulas and predictions,
it is necessary to obtain systematic data over wide ranges of concentration and
measuring frequency.
In the present study, the authors intended to observe the dielectric behavior
of oil-in-water (O/W), water-in-oil (W/O) and nitrobenzene-in-water (N/W)
emulsions over wide ranges of concentration and measuring frequency, and to
discuss the results in the light of dielectric theories already proposed.
For the purpose of the consideration on the dielectric constant of O/W
emulsions, a non-polar solvent was dispersed in distilled water with the aid of
(241)
Tetsuya HANAT, Naokazu KoizuMi and Rempei GoTOn
non-ionic emulsifier. Conductivities of this system were unstable, though its dielectric constants were very reproducible. Hence emulsions of oil dispersed in
aqueous potassium chloride solution were used for the consideration on the
conductivity. Conductivities of this emulsion were stable enough to be measured,
though this system is inadequate for the consideration on dielectric constant
owing to the remarkable electrode polarization. Dielectric properties of N/W emulsions, which is a kind of O/W emulsions, were observed in hopes of a
dielectric dispersion due to the interfacial polarization in accordance with the
prediction from the new theory. The influence of shearing flow on the dielectric properties was examined for
all of these emulsions by use of a rotational viscometer.
2. THEORETICAL
List of Symbols
Symbols used in subsequent sections are as follows. r,,,, Ep, E : dielectric constants of a continuous medium, a disperse phase and
a dispersion system respectively.
rp, r: electrical conductivities of a continuous medium, a disperse phase
and a dispersion system respectively. e1„ et: limiting dielectric constants at high and low frequencies respectively.
ch , !cr : limiting electrical conductivities at high and low frequencies respec-
tively.
0: valume fraction of a disperse phase.
A) Theoretical Formulas for the Dielectric Constant of Spherical Dispersion
Systems Composed of Non-Conductive Phases
Theoretical formulas for the dielectric constant of dispersion system of
spherical particles are the following.
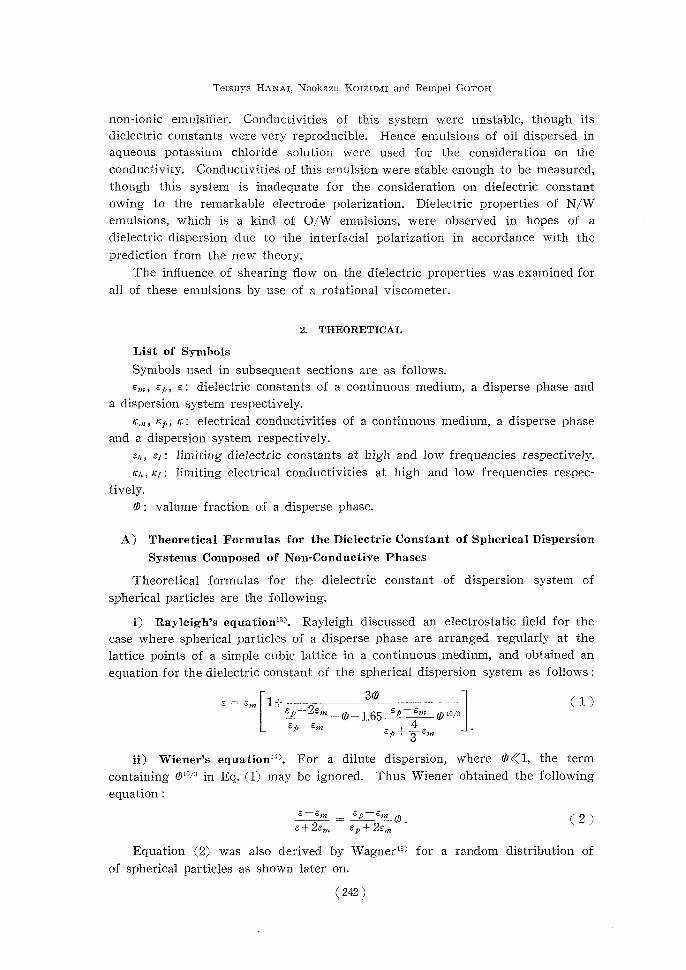
i) Rayleigh's equation"). Rayleigh discussed an electrostatic field for the
case where spherical particles of a disperse phase are arranged regularly at the
lattice points of a simple cubic lattice in a continuous medium, and obtained an
equation for the dielectric constant of the spherical dispersion system as follows :
30 e _- ern 1 --- -----(1 ) Ep-I-2em -0-1 .65 Ep E„a 010' Ep—E„,4 Ep8-em
ii) Wiener's equation"). For a dilute dispersion, where 0(<1, the term
containing (D10%3 in Eq. (1) may be ignored. Thus Wiener obtained the following
equation :
E—Em Sp Em ~.9.(2 ) E-I-2En, Ep+2E„,
Equation (2) was also derived by Wagner”) for a random distribution of
of spherical particles as shown later on.
(242)
Dielectric Constants of Emulsions
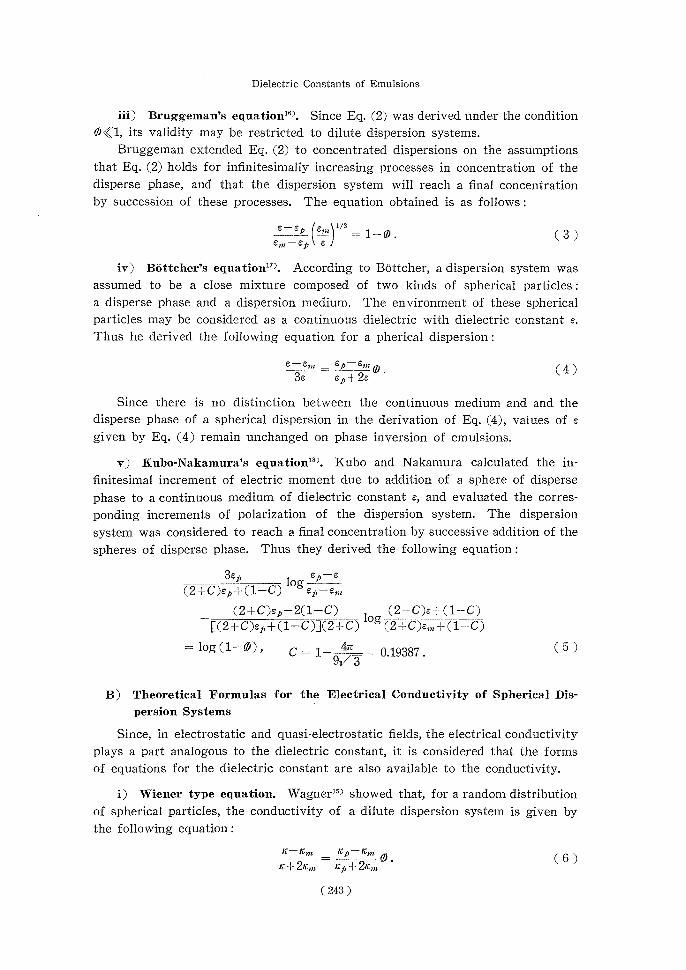
iii) Bruggeman's equation16'. Since Eq. (2) was derived under the condition
<1, its validity may be restricted to dilute dispersion systems. Bruggeman extended Eq. (2) to concentrated dispersions on the assumptions
that Eq. (2) holds for infinitesimally increasing processes in concentration of the
disperse phase, and that the dispersion system will reach a final concentration
by succession of these processes. The equation obtained is as follows :
e—epen1/3l = 1— (3 ) am—ap a
iv) Bottcher's equation17'. According to Bottcher, a dispersion system was assumed to be a close mixture composed of two kinds of spherical particles :
a disperse phase and a dispersion medium. The environment of these spherical
particles may be considered as a continuous dielectric with dielectric constant e. Thus he derived the following equation for a pherical dispersion :
e— ern Sp— em0(4) 3e ep+2e
Since there is no distinction between the continuous medium and and the
disperse phase of a spherical dispersion in the derivation of Eq. (4), values of e
given by Eq. (4) remain unchanged on phase inversion of emulsions.
v) Kubo-Nakamura's equation"'. Kubo and Nakamura calculated the in-
finitesimal increment of electric moment due to addition of a sphere of disperse
phase to a continuous medium of dielectric constant e, and evaluated the corres-
ponding increments of polarization of the dispersion system. The dispersion system was considered to reach a final concentration by successive addition of the
spheres of disperse phase. Thus they derived the following equation :
3ept oep—e (2+C)ep+(1—C)gep—e,„
(2-I-C)ep-2(1—C) log (2-I-C)e+(1—C) [(2+C)ep+(1—C)](2-I-C)(2+C)Enz+(1—C)
= log (1—D), C =1— 4"9,/ 3=0.19387.(5)
B) Theoretical Formulas for the Electrical Conductivity of Spherical Dis-
persion Systems
Since, in electrostatic and quasi-electrostatic fields, the electrical conductivity
plays a part analogous to the dielectric constant, it is considered that the forms of equations for the dielectric constant are also available to the conductivity.
i) Wiener type equation. Wagner") showed that, for a random distribution
of spherical particles, the conductivity of a dilute dispersion system is given by
the following equation :
K— Km _ gp—Km 61 .(6 ) r-I-2' „, Yp±21nz
(243)
Tetsuya HANAI, Naokazu KOIzuMI and Rempei GoTOH
Equation (6) has the form similar to Eq. (2) which was derived by Wiener14 for the dielectric constant of a dilute dispersion of spherical particles.
For O/W emulsions, the conductivity of the continuous medium is much
larger than that of the disperse phase, that is r,»>>rcp. Here Eq. (6) is reduced to
r 2(1—h)(7) 2 -1- 0 •
ii) Bruggeman type equation. Analogously to Eq. (3) for the dielectric
constant, Rue and Tobias1) used the following equation :
r—rp r»z 1/3 =1-0. (8) rm—rp
For O/W emulsions (r,»)(cp), Fq. (8) is reduced to
r = (1-0)31 . (9 ) r»:
C) Theoretical Formulas for the Dielectric Constant of Spherical Dispersion
Systems Composed of Conductive Phases (Theory of the Interfacial Polarization ).6,7,8)
It is known theoreticaIly that a sphericaI dispersion composed of two phases having finite electrical conductivities shows a dielectric dispersion due to a so-
called interfacial polarization.
Wagner") proposed a theory of the interfacial polarization for dilute dispersion
systems. Extending the Wagner theory, one of the present authors (Hanai6))
proposed a new theory applicable to concentrated dispersion systems. According to these theories, dielectric dispersions are expected to be found
in spherical dispersion systems, the details being described in the previous
papers.6'7'8' The relations necessary for the present considerations concerning limiting values of dielectric constant and conductivity at high and low frequencies
are shown below.
From the theoretical point of view of the interfacial polarization in which
the finite conductivity of each phase is taken into consideration, the dielectric
constant of dispersion system composed of non-conductive phases is considered to correspond to the limiting dielectric constant at high frequencies, and the con-
ductivity of dispersion system is to the limiting conductivity at low frequencies.
i) Limiting values of dielectric constant and conductivity at high and
low frequencies
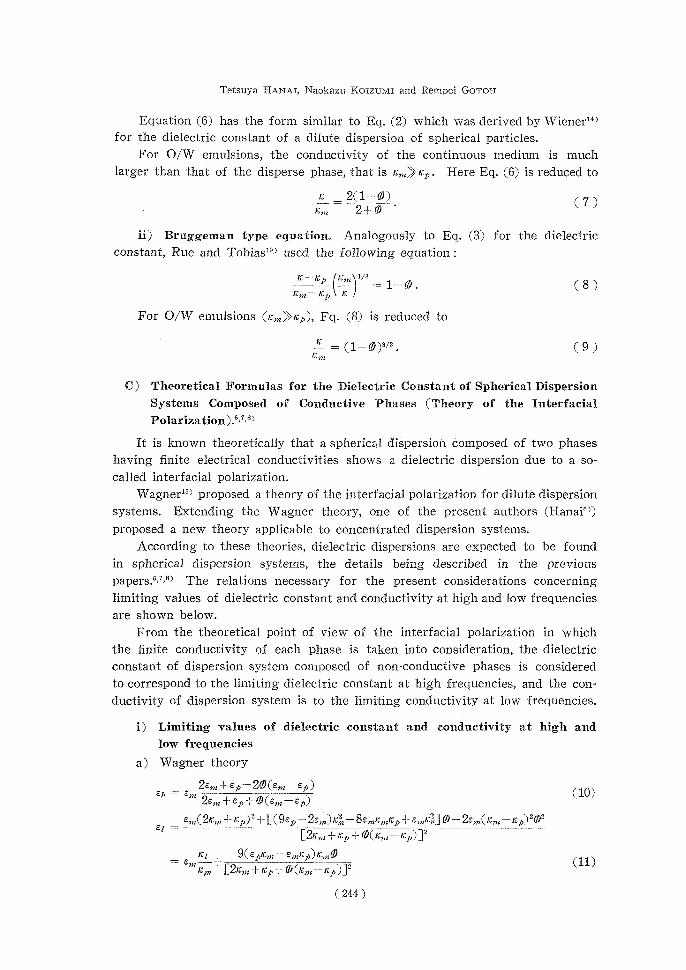
a) Wagner theory
2E»,+ep—Wen,–Ep)E -------------------------- E(10) !,m2E»,,..-Ep+((Em—E p)
Em(2r»,-~- rp)2 - [(9Ep-2Em)/hn-8Ennrmrp-- E,nrp] (p-2En,(rn:– rp)202 ei
Earn -I-rp+0(1cm gp)] r19(Eprn:E,nrp)1cn(D
+ E»t—f2(11) 1'a[2r,n+rp+0(cm—cp)j
(244)
Dielectric Constants of Emulsions
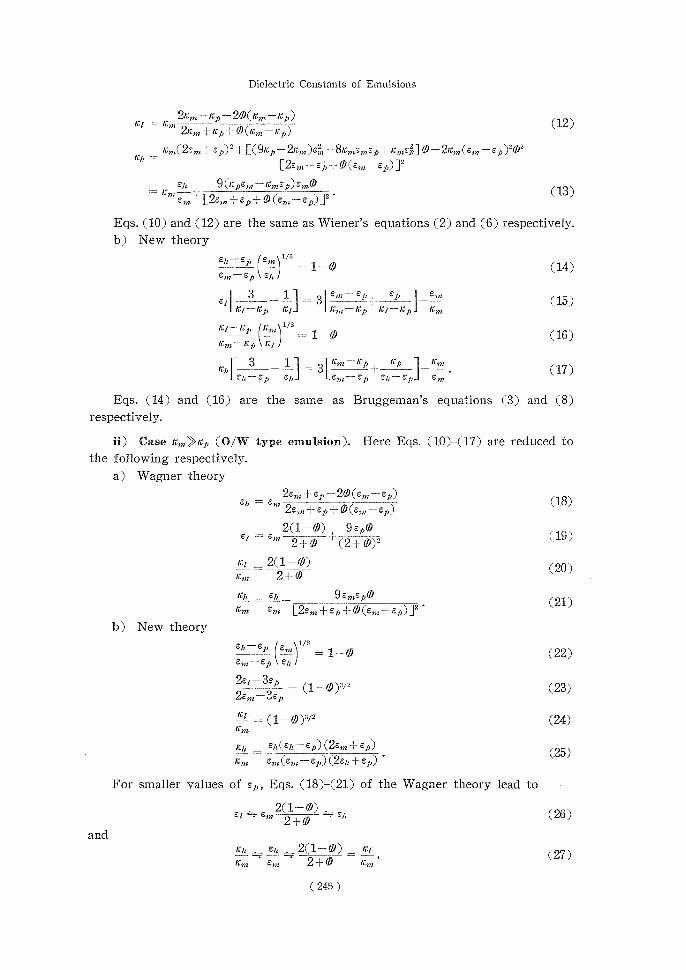
21i:m — 20( trin p) Fi r(12) an, -I- p 0 (h: n)
Km( 2sni + ep) 2 + [(9fr.p 8/4„e„,ep + x„,e3] 0 —2e,(em — ep)20z [2en, + ep + 0(em—ep)]2
eh , 9 (gpem —K2726 P)en169 = 11"M(13) Em [2en, + ep+ (en, ep)]2
Eqs. (10) and (12) are the same as Wiener's equations (2) and (6) respectively. b) New theory
Eh— ep (em)113 1_0 (14) em—ep\eh
Ei[ 3_1]3 rem—E1,+ ep (15) Lice—/r,pKK--pJ
lc1—p 1/31 -0 ( 16) r,,p— IC p\
tch [3 113igm —gphi)Km (17) epeh-Vem—Ep EJjEpi Em
Eqs. ( 14 ) and ( 16) are the same as Bruggeman's equations (3) and (8) respectively.
ii) Case Km>rcp (0/W type emulsion). Here Eqs. (10)—(17) are reduced to the following respectively.
a) Wagner theory
E1Zen, -I-ep 20 (e„,ep) (18) Ehm 2em+eP +(em — eP)
2(1 — 0) 9 sp0 ei = em(19) 2+0 +(2+ 0)2
if./ _ 2( 1 — 0) (20) 2 -1- 0
ChEh _9 e,nep0 ( 21) (Cm Em Pen, + ep + 0 (em — h) :13 •
b) New theory
s.p( 1/3 1-0 ( 22) em ep ui )
2e/ 3ep = (1 — 0)3/2( 23) 2e,n 3F,p
= ( 1— 0 )3/2(24) lCnt
eh(sh—e p) (2em +EP) (25) !Cm em (Enz— E p)(2eh ep) •
For smaller values of ei„ Eqs. ( 18 )—( 21) of the Wagner theory lead to
2(1-0) E1ern—E11(26) 2 +0
and •Eh 2( 1 — 0) re•(27)
Cm Em 2 +
( 245 )
Tetsuya HANAI, Naokazu KorzuMI and Rempei GOTOH
and Eqs. (22)-(25) of the new theory lead to
ei _ e„,(1-0)3/2 eh(28)
and
(1-w)3/2= KL.(29) 4;n, en,Yn,
Hence it is expected from both the Wagner and the new theory that the
dispersions of dielectric constants and conductivities are too small to be observed
in O/W emulsions having smaller values of ep.
The approximate equality between the expressions of et, eh, gr, and rz may not
hold in the case of an O/W emulsion in which the disperse phase has a dielectric
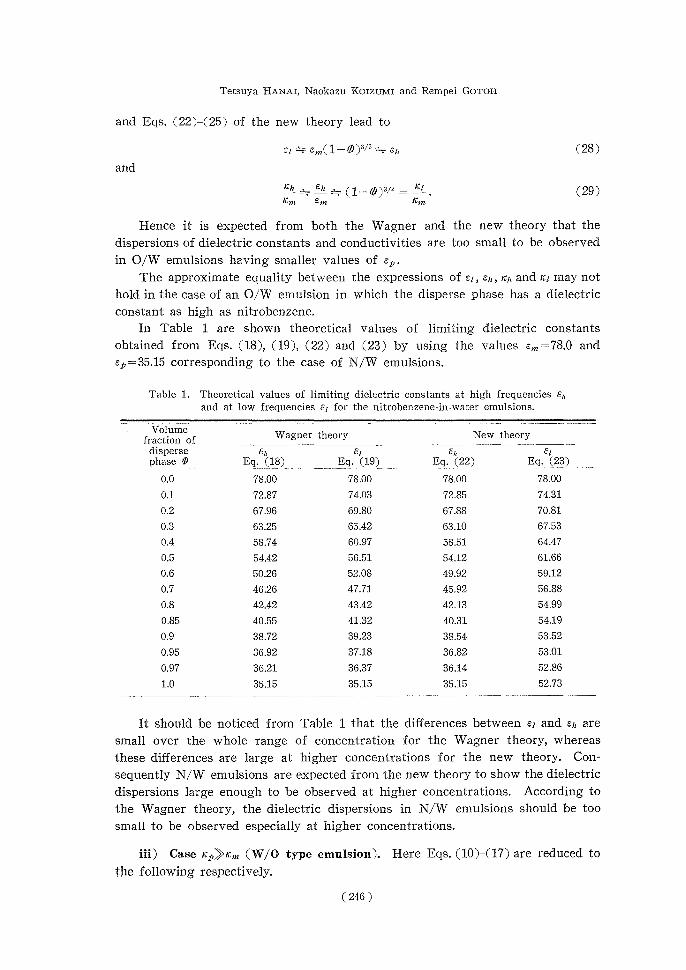
constant as high as nitrobenzene. In Table 1 are shown theoretical values of limiting dielectric constants
obtained from Eqs. (18), (19), (22) and (23) by using the values e,n=78.O and ep=35.15 corresponding to the case of N/W emulsions.
Table 1. Theoretical values of limiting dielectric constants at high frequencies E,, and at low frequencies el for the nitrobenzene-in-water emulsions.
Wagner theoryNew theory fraction of disperseE,,Et E,,E,
phase 0Eq. (18)Eq. (19) Eq. (22) Eq. (23) 0.078.0078.00 78.0078.00
0.172.8774.03 72.8574.31 0.267.9669.80 67.8870.81 0.363.2565.42 63.1067.53 0.458.7460.97 58.5164.47 0.554.4256.51 54.1261.66 0.650.2652.08 49.9259.12 0.746.2647.71 45.9256.88 0.842.4243.42 42.1354.99 0.8540.5541.32 40.3154.19 0.938.7239.23 38.5453.52 0.9536.9237.18 36.8253.01 0.9736.2136.37 36.1452.86 1.035.1535.15 35.1552.73
It should be noticed from Table 1 that the differences between et and eh are small over the whole range of concentration for the Wagner theory, whereas
these differences are large at higher concentrations for the new theory. Con-
sequently N/W emulsions are expected from the new theory to show the dielectric
dispersions large enough to be observed at higher concentrations. According to
the Wagner theory, the dielectric dispersions in N/W emulsions should be too
small to be observed especially at higher concentrations.
iii) Case Yp)k,,, (W/O type emulsion). Here Eqs. (10)-(17) are reduced to
the following respectively.
(246)
i ielectric Constants of Emulsions
a) Wagner theory
eh=e2em+ep-20I(e,n—ep)30 nt2e„n+ep+41(en,—ep)()
wz1+20(31) et=etnY=ent1 -0
tr,a __ 1+20(32) r10 1-0
gh _r 3ent 2 l~p—L2nt+ep+(D(e,n—ep)(33)
b) New theory ep—e/,(entl1/3 = 1-0(34)
ep—entehJ 1(35) el=emC1 -0)3
ri= \ 1(36) Y',n (1-0)3 rrt = 3eft (eh —em)(37) rp (2ek + ep)(Sp—e»t)
According to both the Wagner and the new theory, both differences between et and eh and between rjt and rr are very large at higher concentrations of W/O emulsions. Therefore remarkable dielectric dispersions due to the interfacial polarization are expected to be observed in W/O emulsions.
3. EXPERIMENTAL
A) Preparation of Emulsions
For almost all cases nujol was weighted with carbon tetrachloride to the same density as the water phase so that emulsions produced may be stable during measurement. Non-ionic surface active agents were selected as emulsifiers :20) Tween 20 (Polyoxyethylene sorbitan monolaurate, H.L.B. 16.7), Span 20 (Sorbitan monolau-rate, H.L.B. 8.6), Span 60 (Sarbitan mono stearate, H.L.B. 4.7), Arlacel 83 (Sorbitan sesquioleate, H.L.B. 3.7), and Polyoxyethylene glycol cetyl ether (DP of the poly-oxyethylene group =31.3).
For O/W stystems, stable emulsions were readily obtained by shaking of mixtures of the oil and the water phases.
In the cases of W/O and N/W emulsions, the water phase was gradually poured into the oil phase with vigorous agitation by use of a glass triturator.
For the purpose of conductivity measurements of O/W systems, two kinds of emulsion (I and II) were prepared : Emulsion I were obtained with Span 20 and Tween 20, and Emulsion II with polyoxyethylene glycol cetyl ether.
In Table 2 are tabulated the recipes of emulsions : composition of oil and water phases, emulsifier and its concentration in each phase, method of mixing, particle size of disperse phase and concentration of disperse phase in emulsion.
( 247 )
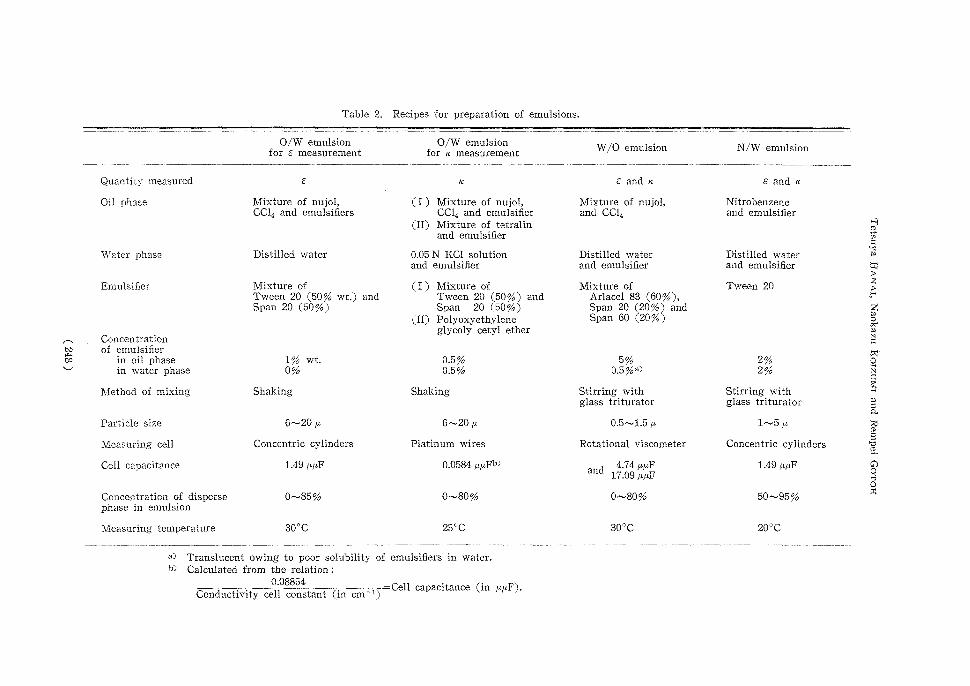
Table 2. Recipes for preparation of emulsions.
O/W emulsionO/W emulsionW/O emulsionN/W emulsion for a measurementfor is measurement
Quantity measuredaKa and Ka and rc
Oil phaseMixture of nujol,(I) Mixture of nujol,Mixture of nujol,Nitrobenzene CC14 and emulsifiersCC14 and emulsifier and CC14and emulsifier
(II) Mixture of tetralin-' and emulsifierm
Water phaseDistilled water0.05 N KC1 solutionDistilled waterDistilled waterP and emulsifierand emulsifierand emulsifier
EmulsifierMixture of(I) Mixture ofMixture ofTween 20j Tween 20 (50% wt.) andTween 20 (50%) and Arlacel 83 (60%),
Span 20 (50%)Span 20 (50%)Span 20 (20%) andZ (II) PolyoxyethyleneSpan 60 (20%)o
Concentrationglycoly cetyl etherG ts of emulsifier1%0.5%5%2%o' cc in oil phase1%wt.0.5%5%°
in water phase0%0.5%0.5%a)2%c
Method of mixingShakingShakingStirring withStirring with glass trituratorglass trituratora a a.
Particle size6^-20 µ6-20 µ0.5-1.5 µ1-5 µ
Measuring cellConcentric cylindersPlatinum wiresRotational viscometer Concentric cylindersc, Cell capacitance1.49/././F0.0584 ppFband 4.74 µµF1.49 µµFo
17.09 µµF 0
p°%'80%50- .95%x. Concentration of disperse0^85/°0 r800
°
phase in emulsion
Measuring temperature30°C25°C30°C20°C
a) Translucent owing to poor solubility of emulsifiers in water. b) Calculated from the relation
0.08854 =Cell capacitance (in µµF). Conductivity cell constant (in cm-1)
Dielectric Constants of Emulsions
8) Measuring Cell
The measuring cell of dielectric constant for quiescent state consisted of two concentric platinum cylinders whose empty cell capacitance was 1.49N/F. This
cell was used for O/W and N/W emulsions.
The electrodes of the conductivity cell consisted of platinum wires, and the cell constant was 1.515 cm-1, which corresponds to 0.0584Ee,uF in empty cell
capacitance.
Dielectric measurements of emulsions under shearing stress were carried out
with a double cylindrical rotational viscometer of the Green type,21> the bobs and
the cup being made of stainless steel. Two exchangeable bobs were used, being
1.5 and 2.5 cm in diameter respectively and 5.1 cm in length. The cup is 3 cm in
inner diameter and 6 cm in inside height. Capacitance and conductance between
the bob and the cup filled with a specimen were measured at varying r.p.m. of
the cup. The empty cell capacitance was 4.74,u,uF for the small bob, and 17.09piiF
for the large bob. The former was used for W/O emulsions of more than 30%,
the latter for less than 20%. The 100, 200 and 300 r.p.m. of the cup correspond to
12.9, 25.8 and 38.7 sec-1 in the mean rate of shear for the specimen respectively.
C) Dielectric Measurements
Both capacitance and conductance were measured over a frequency range of
20 cps. to 5 mc. by means of a conductance-capacitance bridge') which was used
in the previous study.23)
4. RESULTS
A) Dielectric Behavior of O/W Emulsions
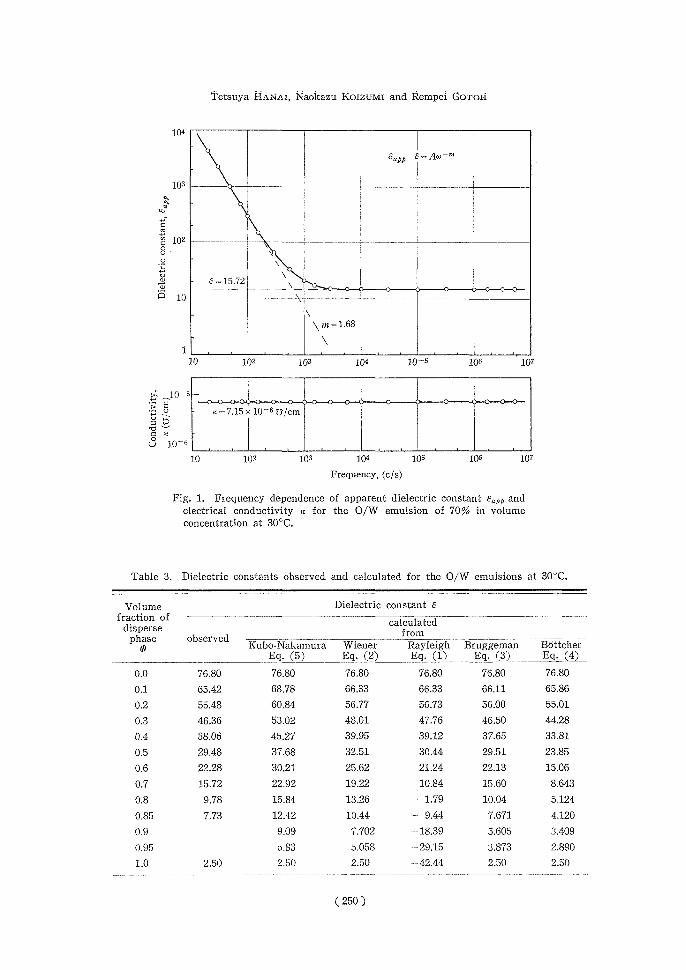
i) Dielectric constant of O/W emulsions23j. Dielectric constants and elec-
trical conductivities measured on the O/W emulsion of 70% in concentration at
30°C are plotted against the measuring frequency in Fig. 1. In the lower frequency
range the dielectric constant increased rapidly with decreasing frequency, where-
as the electrical conductivity remained constant irrespective of the frequency.
Above about 5 kc. the observed dielectric constant showed a constant value
independent of frequency. Such a frequency dependence of the apparent dielectric
constant ea,,,, is well expressed by the following empirical formula :
earn, —e = Aco "'(38)
where e is the limiting value of ea,,,, at high frequencies, A and in are the em-
pirical constants and co denotes the angular frequency. The value of m was about 1.7 irrespective of concentration of emulsion. The value of A increased with
increasing electrical conductivity of emulsions. Such frequency dependence of
dielectric constant was also reported for some other cases.2A,25 This effect may
be attributed to the electrode polarization which arises from the electrolytic
polarization of ions on electrode surfaces. The limiting value e is regarded as the true dielectric constant of emulsion without any contribution of the electrode
polarization.
(249 )
Tetsuya HANAI, Naokazu KOIZIEViI and Rempei GoToil
104^----------------------------------------------------------------------------------------------------------- •& -6= Aw -, aPP
•
103 ----- -. a a . tt, .....- ct. 102 0 0\ •
4.,\ • 13 2 - 15.72 \ •
.94.• • • • 10 \
-\
\ m = 1.68
1
. .
10 102 103 104 10+5 106 107
i. 10 i - -"'•••••••••••••••
t.0-x=7.15106TY/CM 4'-- 0 - 0 0 10-6
10103103104 105106107
Frequency, (c/s)
Fig. 1. Frequency dependence of apparent dielectric constant Eapp and electrical conductivity ic for the 0/W emulsion of 70% in volume
concentration at 30°C.
Table 3. Dielectric constants observed and calculated for the 0/W emulsions at 30°C.
VolumeDielectric constant E fraction of calculated
disperse from phase observed
0Kubo-Nakamura Wiener Rayleigh Bruggeman Bottcher Eq. (5) Eq. (2) Eq. (1) Eq. (3) Eq. (4)
0.076.8076.8076.8076.80 76.80 76.80
0.165.4268.7866.3366.33 66.11 65.86
0.255.4860.8456.7756.73 56.00 55.01 0.346.3653.0248.0147.76 46.50 44.28
0.438.0645.2739.9539.12 37.65 33.81
0.529.4837.6832.5130.44 29.51 23.85
0.622.2830.2125.6221.24 22.13 15.06
0.715.7222.9219.2210.84 15.60 8.643
0.89.7815.8413.26 - 1.79 10.04 5.124
0.857.7312.4210.44 - 9.44 7.671 4.120
0.99.097.702 -18.39 5.605 3.409
0.955.835.058 -29.15 3.873 2.890
1.02.502.502.50 -42.44 2.50 2.50
( 250 )
Dielectric Constants of Emulsions
The true dielectric constants of O/W emulsions at various concentrations
are listed in Table 3, and are plotted against the concentration of oil in Fig. 9.
No dielectric dispersion due to the interfacial polarization was found over the
present range of frequency. No appreciable change in dielectric constant and conductivity of emulsions was observed on shearing flow.
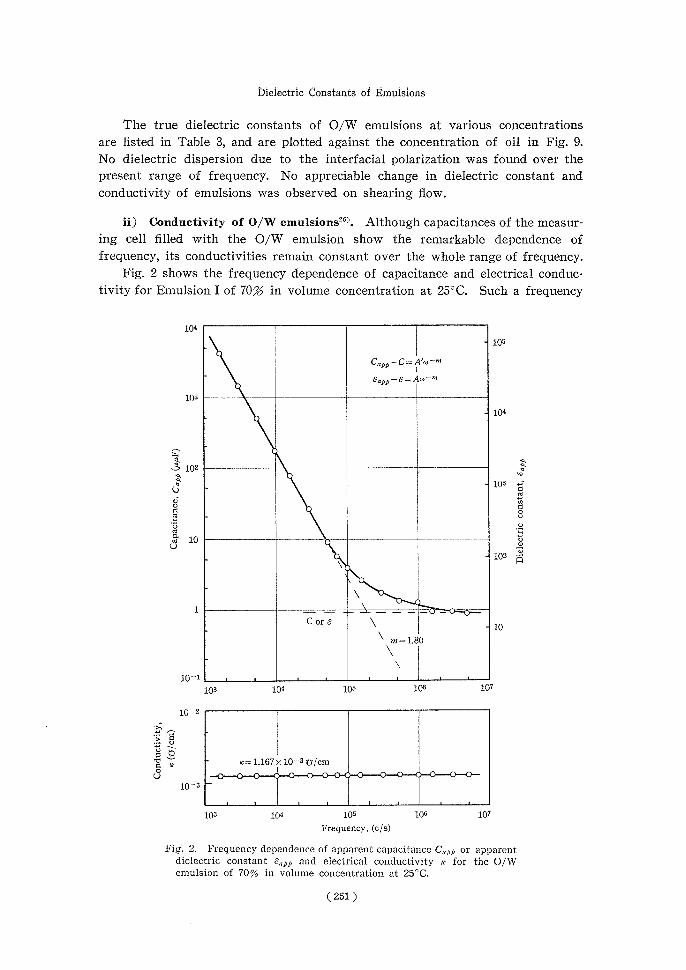
ii) Conductivity of 0/W emulsions26>. Although capacitances of the measur-
ing cell filled with the O/W emulsion show the remarkable dependence of
frequency, its conductivities remain constant over the whole range of frequency.
Fig. 2 shows the frequency dependence of capacitance and electrical conduc-
tivity for Emulsion I of 70,°6 in volume concentration at 25°C. Such a frequency
104- - 105
•C„pp-C=A'w—m
Sapp— E_Aa,_ro • 103 ---------------------------------------------------------------------------------
- 104
W• ~ 4 3 102w
•
Ci- 103 a U•
m _•io Uw a
c~ 10 ------------—----------------------------------- •- 102
\ • \ •
1— - - - - - -• - • Core\ - 10
m=1.80
10-1 , 103 104105106107
10_2 ---------------------------------------------------------------------------
7 ak=1.167xI10-30/cm
UO O OOO Q000 0 0 00 0 0 10-3 _
tt----------------------------- 103104105 106107
Frequency, (c/s)
Fig. 2. Frequency dependence of apparent capacitance C„/,/, or apparent dielectric constant E„pp and electrical conductivity x for the O/W
emulsion of 70% in volume concentration at 25°C.
(251)
Tetsuya HANAI, Naokazu I(otzuivit and Rempei G0T0H
dependence of the apparent capacitance Cai,,, or the apparent dielectric constant ru,,,, is expressed by the same empirical formula as Eq. (38). The constant m
took a value of about 1.8 irrespective of concentration of emulsions. The limiting
value of capacitance or dielectric constant at high frequencies was too small to
be subjected to quantitative considerations.
This frequency dependence of Ca,,,, may be attributed to the electrode polari-zation.
The similar behavior was also found in Emulsion II.
Neither dielectric dispersion due to the interfacial polarization nor appreciable change in the conductivity under shearing flow was observed for the present
emulsions.
When the measuring electrodes were coated with platinum black, the electrode
polarization was practically reduced and the frequency dependence of capacitance disappeared, whereas the value of conductance still remained unchanged.
The observed values of the relative conductivityrat various concentrations
z of Emulsion I and II are shown in Table 4, and are plotted against the concent-
ration of oil in Fig. 10.
Table 4. Electrical conductivities observed and calculated for the O/W emulsions at 25°C.
VolumeRelative conductivity r~ n fraction ofobserved forcalculated from
disperse phaseEq. (7)Eq. (9) E
mulsion IEmulsion II2(1-0)(1 _cD)3!2 2+N
0.01.0001.0001.00001.0000 0.10.8550.8490.85710.8538 0.20.7140.6940.72730.7155 0.30.5840.5840.60870.5857 0.40.4650.4600.50000.4648 0.50.3530.3540.40000.3536 0.60.2680.2620.30770.2530 0.70.1770.1810.22220.1643 0.80.09950.1080.14290.08944 0.85----0.10530.05809 0.90.068970.03162 0.95---0.033900.01118 1.00.0000.0000.000000.00000
The electrical conductivity observed for the water phase ir,,,=G.129 x 10-3 n/cm for Emulsion I.
=6.855x10⁻³t /cm for Emulsion II.
B) Dielectric Behavior of W/O Emulsions''
The W/O emulsions showed the dielectric behavior very different from that
of O/W emulsions in respect of interfacial and electrode polarizations.
Since it was found that dielectric properties of the present W/O emulsions
(252 )
Dielectric Constants of Emulsions
are influenced by agitation and shearing stress, dielectric measurements were
carried out at varying r.p.m. of the cup of the rotational viscometer.
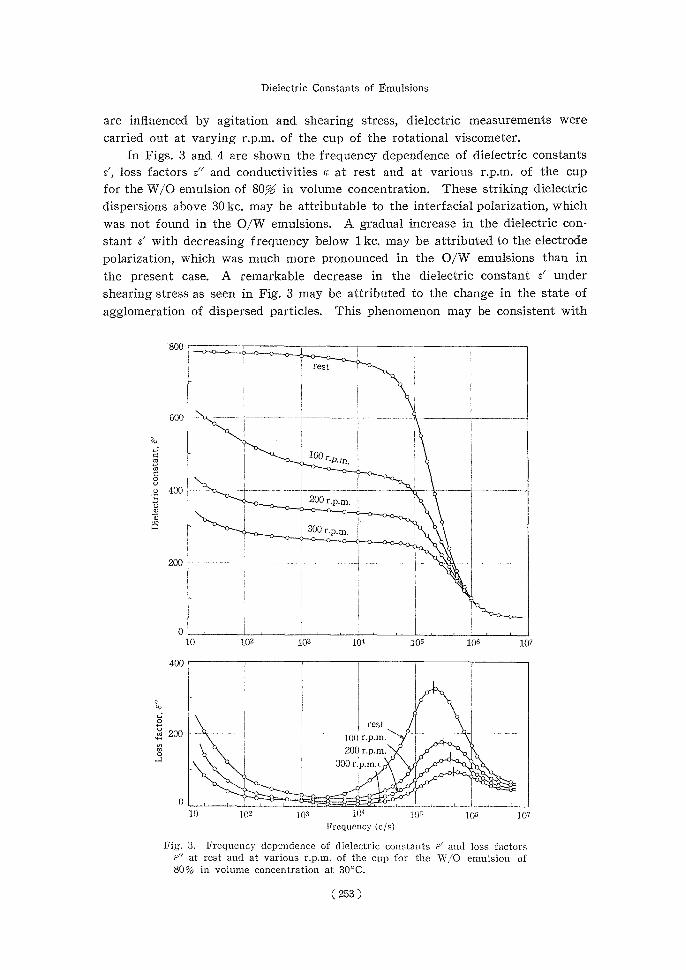
In Figs. 3 and 4 are shown the frequency dependence of dielectric constants
s', loss factors e" and conductivities r, at rest and at various r.p.m. of the cup
for the W/O emulsion of 80% in volume concentration. These striking dielectric
dispersions above 30 kc. may be attributable to the interfacial polarization, which
was not found in the O/W emulsions. A gradual increase in the dielectric con-
stant with decreasing frequency below 1 kc. may be attributed to the electrode
polarization, which was much more pronounced in the O/W emulsions than in the present case. A remarkable decrease in the dielectric constant e' under
shearing stress as seen in Fig. 3 may be attributed to the change in the state of
agglomeration of dispersed particles. This phenomenon may be consistent with
800 ------------ • • rest
• ;
600
•-----------
ro. /00 r,prn •.
U• •• —'—
•200 r.p,m,
•
• •• •1
•• •.300 rp,n..•
•
•
10 102103 104 105106107
400 ----------------------------------------------------------------------------
w
°rest
w 200 .._.•• 100 r.p.m. •200 r .p.m.
•
••300r.p.m.•••• •:ek •
10 102102 104 105105107 Frequency (c/s)
Fig. 3. Frequency dependence of dielectric constants E' and loss factors E" at rest and at various r.p.m. of the cup for the W/O emulsion of
80% in volume concentration at 30°C.
(253)
Tetsuya HANAI, Naokazu l otzuMt and Rempei OoToff.
10.._ 3 --------------------------------------------------------------------------------------------------------------------------------------------------------------------------------------------------------------------I
1
--- ii• 10-7 —----- ---- 4----
10(36) o s 'IbyEq(32) • fr
•• : 10---,—=— s --I
1 10--10 1 ,
10 102103 104 105 106 107 Frequency, (c/s)
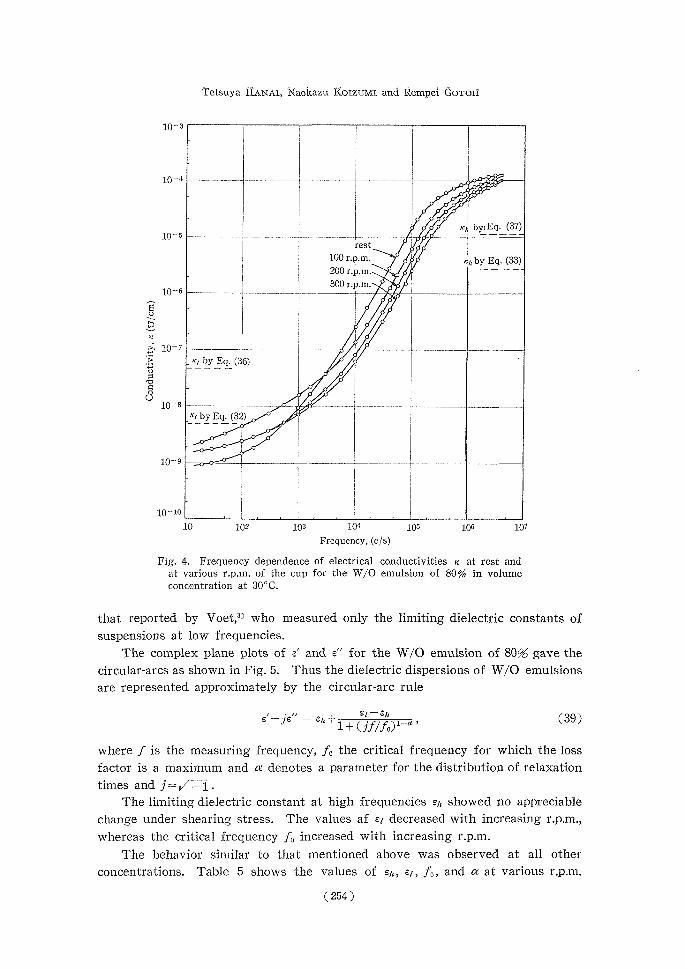
Fig. 4. Frequency dependence of electrical conductivities ,c at rest and at various r.p.m. of the cup for the W/O emulsion of 80% in volume
concentration at 30°C.
that reported by Voet,3) who measured only the limiting dielectric constants of
suspensions at low frequencies.
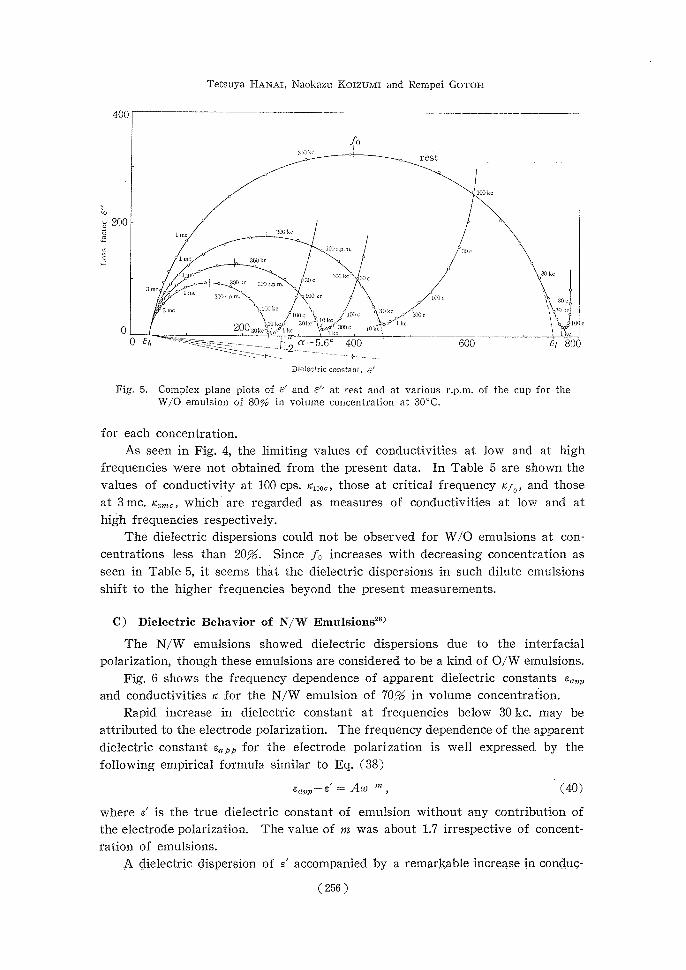
The complex plane plots of e' and e" for the W/O emulsion of 80% gave the
circular-arcs as shown in Fig. 5. Thus the dielectric dispersions of W/O emulsions
are represented approximately by the circular-arc rule
et— eh e'—je" = ej'+1+(9.f/.fo)i-a'~39)
where f is the measuring frequency, fo the critical frequency for which the loss
factor is a maximum and a denotes a parameter for the distribution of relaxation
times and j=/ —1.
The limiting dielectric constant at high frequencies ej, showed no appreciable
change under shearing stress. The values of ej decreased with increasing r.p.m.,
whereas the critical frequency fp increased with increasing r.p.m.
The behavior similar to that mentioned above was observed at all other
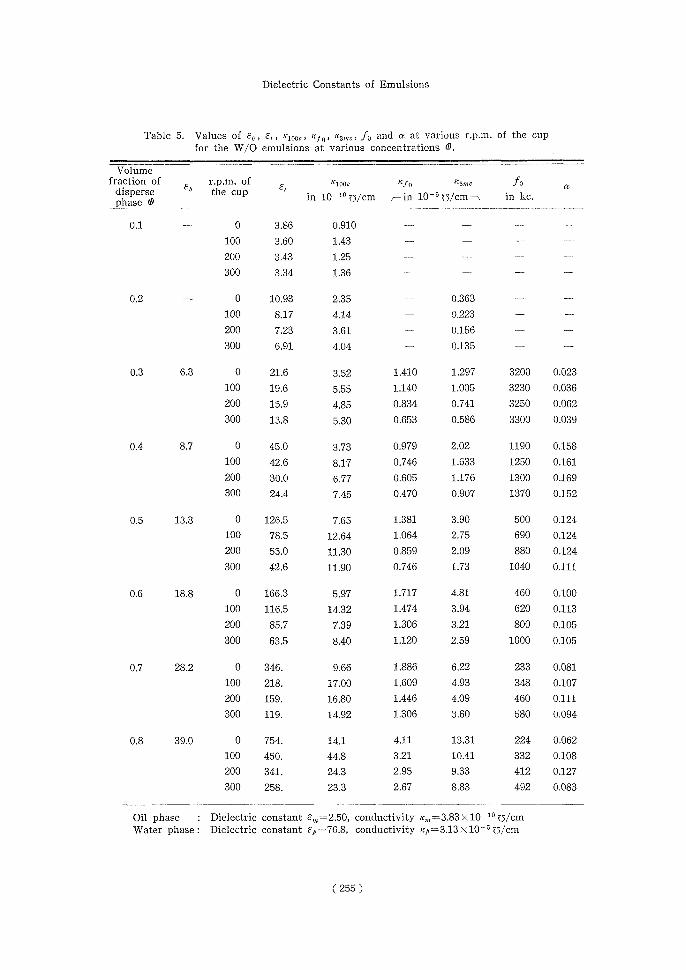
concentrations. Table 5 shows the values of en, ea, fo, and a at various r.p.m.
( 254 )
Dielectric Constants of Emulsions
Table 5. Values of a0, a1, mi00,, kfo, ic,, fo and a at various r.p.m. of the cup for the W/O emulsions at various concentrations 0.
Volume fraction of , r.p.m.of chEi"ioo,lefoic3"..Joa dispersethe cup
in 10-15 Ts/cm ,---- in 10 -5 is/cm --\ in kc. phase 0
0.1-03.860.910--
1003.601.43_--
2003.431.25-
3003.341.36
0.2-010.932.350.363- 1008.174.140.223
2007.233.61-0.156
3006.914.04-0.135- -
0.36.3021.63.521.4101.2973200 0.023
10019.65.551.1401.0053230 0.036 20015.94 .850.8340.7413250 0.062 30013.85 .300.6530.5863300 0.039
0.48.7045.03.730.9792.021190 0.158 10042.68.170.7461.6331250 0.161
20030.06.770.6051.1761300 0.169
30024.47450.4700.9071370 0.152
0.513.30 126.57.651.3813.90500 0.124 10078.512.641.0642.75690 0.124
20055.011.300.8592.09880 0.124
30042.611.900.7461.731040 0.111
0.618.80 166.35.971.7174.81460 0.100 100 116.514.321.4743.94620 0.113
20085.77.391.3063.21800 0.105
30063.58.401.1202.591000 0.105
0.7 28.20 346.9.661.8866.22233 0.081
100 218.17.001.6094.93348 0.107 200 159.16.801.4464.09460 0.111
300 119.14.921.3063.60580 0.094
0.839.00 754.14.14.1113.31224 0.062 100 450.44.83.2110.41332 0.108
200 341.24.32.959.33412 0.127
300 258.23.32.678.83492 0.083
Oil phase : Dielectric constant 8,„-2.50, conductivity 2,,,=3.83x10-100/cm Water phase : Dielectric constant Ep = 76.8, conductivity ici, =3.13 x 10 ' Ts/cm
( 255 )
Tetsuya HANAI, Naokazu Kozzumr and Rempei GoTOn
400
.fo 3r0) kr rest
100 Or
a 200•• 1mc:100
•100 r.p.m.30 c
0• 1 mc
cI300kc • •• • 1100 kc,3nc30 kc ••0kc 200r.p.m.c 3 mc.. imcV •300 r.p.m.100 kc 100 c 30c ~p/• .100 kclVV.10 kc 3mc,
100c•100cOkc-'„c. IDk
~3Ukc,lO kc1LcVV100s 090030,,c°Ik:.:300c loket
'.1frc'k
01e---- a —5 6° 400600Et 800
Dielectric constant, E'
Fig. 5. Complex plane plots of 8' and E" at rest and at various r.p.m. of the cup for the W/O emulsion of 80% in volume concentration at 30°C.
for each concentration.
As seen in Fig. 4, the limiting values of conductivities at low and at high
frequencies were not obtained from the present data. In Table 5 are shown the
values of conductivity at 100 cps. r100c, those at critical frequency rfo, and those
at 3 mc. r3 1 , which are regarded as measures of conductivities at low and at
high frequencies respectively.
The dielectric dispersions could not be observed for W/O emulsions at con-
centrations less than 20%. Since f0 increases with decreasing concentration as
seen in Table 5, it seems that the dielectric dispersions in such dilute emulsions
shift to the higher frequencies beyond the present measurements.
C) Dielectric Behavior of N/W Emulsions')
The N/W emulsions showed dielectric dispersions due to the interfacial
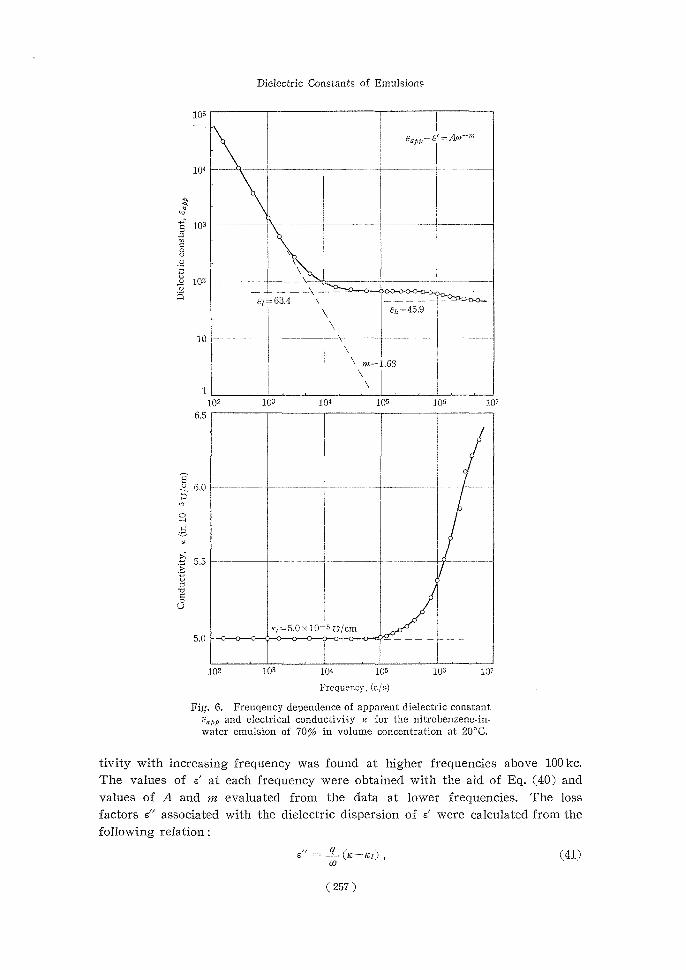
polarization, though these emulsions are considered to be a kind of O/W emulsions. Fig. 6 shows the frequency dependence of apparent dielectric constants e1L,,,,
and conductivities r for the N/W emulsion of 70% in volume concentration.
Rapid increase in dielectric constant at frequencies below 30 kc. may be
attributed to the electrode polarization. The frequency dependence of the apparent
dielectric constant Sapp for the electrode polarization is well expressed by the
following empirical formula similar to Eq. (38)
= Acti 'n ,(40)
where e' is the true dielectric constant of emulsion without any contribution of the electrode polarization. The value of m was about 1.7 irrespective of concent-
ration of emulsions.
A dielectric dispersion of s' accompanied by a remarkable increase in conduc-
( 256 )
Dielectric Constants of Emulsions
105
• Eopp—E—Ac„—rn
104 ---•— ———
V W
c 103 -----
•
ro %n C 0 V V _ \ ~
\
102
El— 63.4 \ — — -- — — -O0°0...- En-45.9
10
\ m=1 .68
1 ----------------------------------------
102 103 104 105 106 1.07
6.5
•
• •
6.0 7-----
•
o•
5.5•— ..._.____ 7 U~ 7 27 C Q•
• U 5.0x10 5 i3/Cm •
5.0 • • • • • • • • • • . • __------
102 103104 105 106 107 Frequency, (cis)
Fig. 6. Freugency dependence of apparent dielectric constant E„pp and electrical conductivity is for the nitrobenzene-in-
water emulsion of 70% in volume concentration at 20°C.
tivity with increasing frequency was found at higher frequencies above 100 kc.
The values of e' at each frequency were obtained with the aid of Eq. (40) and
values of A and m evaluated from the data at lower frequencies. The loss
factors e" associated with the dielectric dispersion of e' were calculated from the
following relation :
e" ̂ q(r—rci),(41)
(257)
Tetsuya HANAI, Naokazu KorzuMI and Rempei GOTOH
70
= 63.4
60 ------------------------------------------------------------
C ct
0 0 U• U
• N• a 50 ----------
• •
Eh=45.9
40 -------------------------------------------------------------------------------------------------
104105106107 10 f
o=1.56mc. • •
a• U
•
•• •
0 —------- 104105106107
Frequency, (c/s)
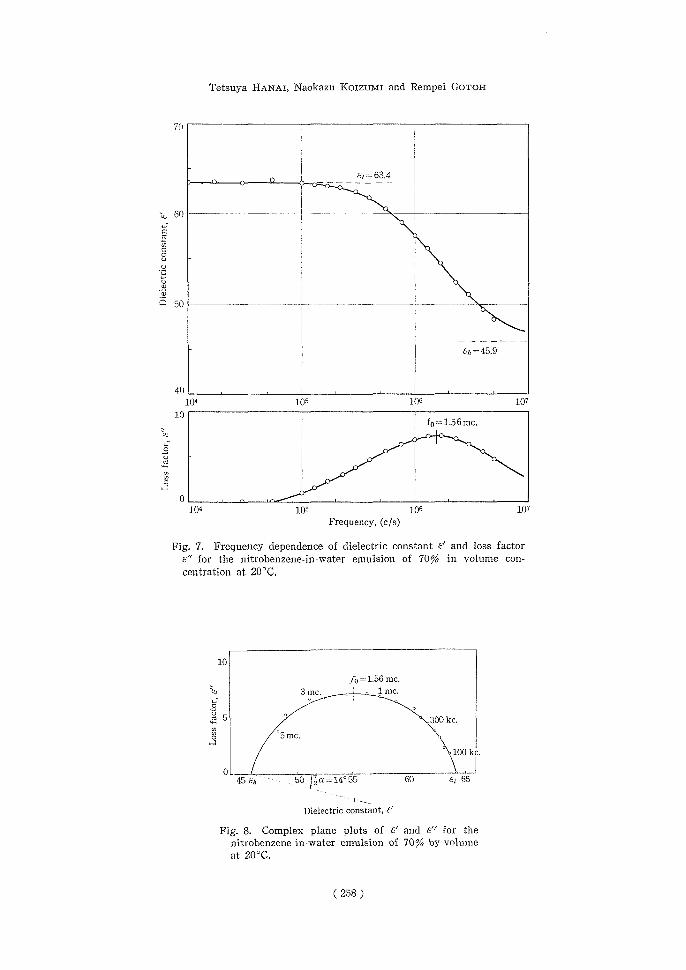
Fig. 7. Frequency dependence of dielectric constant E' and loss factor a" for the nitrobenzene-in-water emulsion of 70% in volume con-
centration at 20°C.
10-
fo =1.56 mc. 3 mc. j__~,1 mc.
o°
w 5.300 kc. °5
mc.•
.100 kc.
0_ 45 Et,50 'Z a = 14° 5560 Et 65
Dielectric constant, 6'
Fig. 8. Complex plane plots of E' and E" for the nitrobenzene-in-water emulsion of 70% by volume
at 20°C.
(258)
Dielectric Constants of Emulsions
where a numerical factor q-112.94 x 10", and the conductivities are expressed in
u/cm units. Fig. 7 shows the frequency dependence of e' and e" obtained through this procedure.
The complex plane plot of s' and e" for the N/W emulsion of 70% gave a circular-arc as shown in Fig. 8. Thus the dielectric dispersions of N/W emulsions
at high frequencies are represented approximately by the same expression as
Eq. (39).
No appreciable change in the dielectric constants and the conductivities of the present emulsions was observed under the mean rate of shear up to 40 sec-'.
The behavior similar to that mentioned above was observed at all other
concentrations. The observed values of el„ el, ej, fo and a at various concent-
rations of N/W emulsions are listed in Table 6. As seen in Fig. 6, the limiting
Table 6. Values of a~, , a, , u1 , is to, r3,,, , fo and a for the nitrobenzene-in-water emulsions at various concentrations V.
Volume fraction ofyis fo~c3,ucf0a disperse phase 0,--foa5iin 10I/cmin mc.
0.5 54.0 69.06.78 7.297.621.700.256 0.6 49.7 66.46.35 6.907.371.420.160 0.7 45.9 63.45.00 5.616.111.560.117 0.8 42.3 53.13.40 3.854.101.800.089 0.9 38.7 68.01.71 1.822.300.149 0.080
0.93 38.1 53.51.33 1.391.670.200 0.089 0.95 37.2 53.02.14 2.222.560.264 0.297
Water : Dielectric constant a,,,=78.0, conductivity ic,,,=7.286x10⁻⁵i5/cm Nitrobenzene: Dielectric constant Ep=35.15, conductivity rcp=0.6429x -5 z3/cm
values of conductivities at high frequencies were not obtained from the present
data. In Table 6 are shown the values of the conductivities at critical frequency
r,:fo and those at 3 mc. ~,:3,,,C, which are regarded as measures of the conductivities
at high frequencies.
5. DISCUSSION
A) Dielectric Behavior of O/W Emulsions
As shown in the preceding section, both dielectric constants and conductivities
of O/W emulsions are found to be independent of measuring frequency. Accord-
ingly it is considered that the values observed may be discussed in the light of theoretical equations (1)-(5).
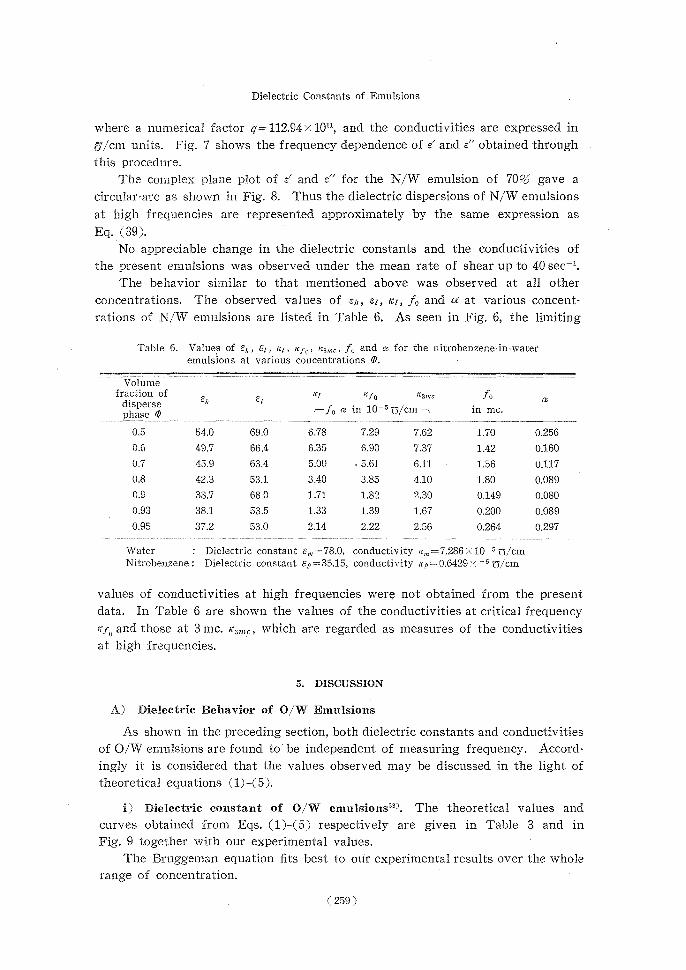
i) Dielectric constant of O/W emulsions23>. The theoretical values and
curves obtained from Eqs. (1)-(5) respectively are given in Table 3 and in
Fig. 9 together with our experimental values. The Bruggeman equation fits best to our experimental results over the whole
range of concentration.
( 259 )
Tetsuya HANAI, Naokazu KOIzumt and Rerapei GoTOn
80
60—
Kubo-Nakamura Eq. (5)
ri
i::-- —— BOttcher Eq. (4)
Rayleigh 0 Eq. (1) , 1.0 0.8 0.6 0.4 0.2 0
Volume fraction of disperse phase, (1) 0 : observed, —: theoretical,
Fig. 9. Concentration dependence of dielectric constants a for the 07W emulsions at 30°C.
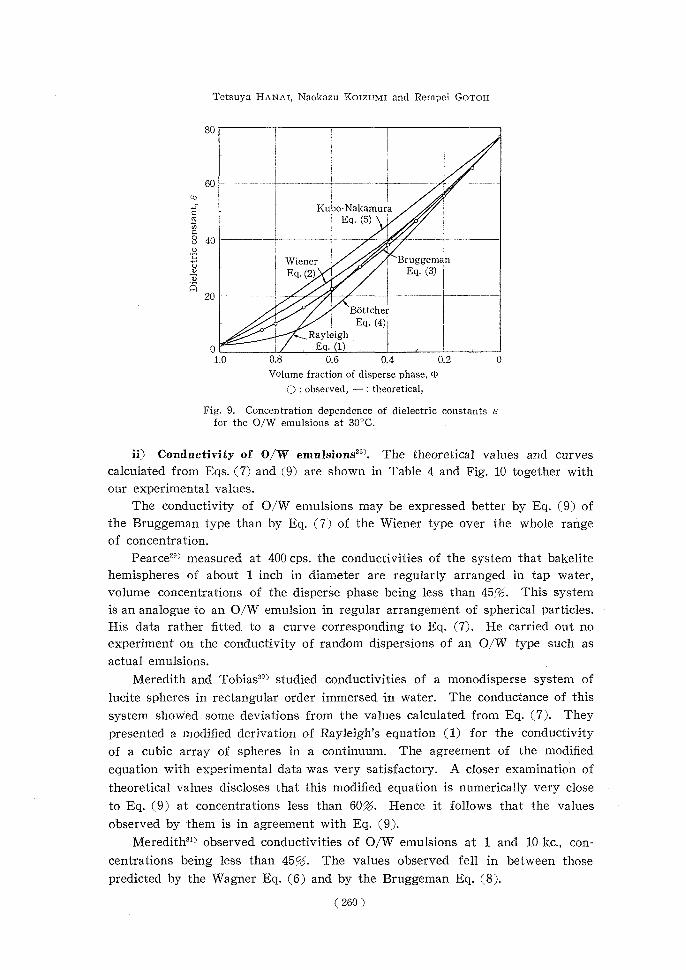
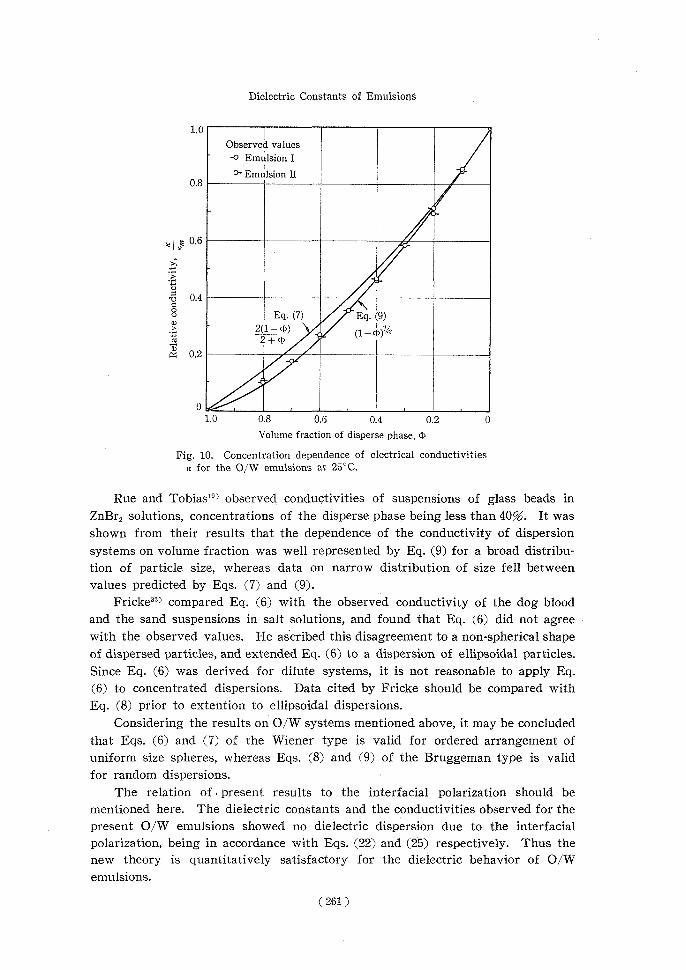
ii) Conductivity of 0/W emulsions26). The theoretical values and curves
calculated from Eqs. (7) and (9) are shown in Table 4 and Fig. 10 together with
our experimental values.
The conductivity of O/W emulsions may be expressed better by Eq. (9) of
the Bruggeman type than by Eq. (7) of the Wiener type over the whole range
of concentration.
Pearce26) measured at 400 cps. the conductivities of the system that bakelite
hemispheres of about 1 inch in diameter are regularly arranged in tap water,
volume concentrations of the disperse phase being less than 45%. This system
is an analogue to an O/W emulsion in regular arrangement of spherical particles.
His data rather fitted to a curve corresponding to Eq. (7). He carried out no experiment on the conductivity of random dispersions of an O/W type such as
actual emulsions.
Meredith and Tobias30) studied conductivities of a monodisperse system of
lucite spheres in rectangular order immersed in water. The conductance of this
system showed some deviations from the values calculated from Eq. (7). They
presented a modified derivation of Rayleigh's equation (1) for the conductivity of a cubic array of spheres in a continuum. The agreement of the modified
equation with experimental data was very satisfactory. A closer examination of
theoretical values discloses that this modified equation is numerically very close
to Eq. (9) at concentrations less than 60%. Hence it follows that the values
observed by them is in agreement with Eq. (9).
Meredith3') observed conductivities of O/W emulsions at 1 and 10 kc., con-
centrations being less than 45%. The values observed fell in between those
predicted by the Wagner Eq. (6) and by the Bruggeman Eq. (8).
(260 )
Dielectric Constants of Emulsions
1.0
Observed values -0 Emulsion I
° Emulsion II 0.8 -----------------------------------------------------------------------
0.6 --------------------------------------------------------------------------------------------------- IY
0.4 -----------— C °Eq_ (7)
?. 2(1— (l)) 52+~1
• 0.2 -----------------------------------------------
1.0 0.8 0.6 0.4 0.2 0 Volume fraction of disperse phase, 11
Fig. 10. Concentration dependence of electrical conductivities tc for the O/W emulsions at 25°C.
Rue and Tobias19) observed conductivities of suspensions of glass beads in
ZnBr2 solutions, concentrations of the disperse phase being less than 40%. It was
shown from their results that the dependence of the conductivity of dispersion
systems on volume fraction was well represented by Eq. (9) for a broad distribu-
tion of particle size, whereas data on narrow distribution of size fell between
values predicted by Eqs. (7) and (9).
Fricke32) compared Eq. (6) with the observed conductivity of the dog blood and the sand suspensions in salt solutions, and found that Eq. (6) did not agree
with the observed values. He ascribed this disagreement to a non-spherical shape
of dispersed particles, and extended Eq. (6) to a dispersion of ellipsoidal particles.
Since Eq. (6) was derived for dilute systems, it is not reasonable to apply Eq.
(6) to concentrated dispersions. Data cited by Fricke should be compared with Eq. (8) prior to extention to ellipsoidal dispersions.
Considering the results on O/W systems mentioned above, it may be concluded
that Eqs. (6) and (7) of the Wiener type is valid for ordered arrangement of uniform size spheres, whereas Eqs. (8) and (9) of the Bruggeman type is valid
for random dispersions.
The relation of • present results to the interfacial polarization should be mentioned here. The dielectric constants and the conductivities observed for the
present O/W emulsions showed no dielectric dispersion due to the interfacial
polarization, being in accordance with Eqs. (22) and (25) respectively. Thus the new theory is quantitatively satisfactory for the dielectric behavior of O/W
emulsions.
(261)
Tetsuya HANAI, Naokazu KOIzuMI and Rempei GoTOH
B) Dielectric Behavior of W/O Emulsions27
i) Limiting dielectric constant at high frequencies s;,. The limiting di-
electric constant at high frequencies eh is regarded as the dielectric constant of a
spherical dispersion system composed of two non-conductive phases. Accordingly
it is considered that the observed values of eh may be discussed in the light of
theoretical equations (1)-(5).
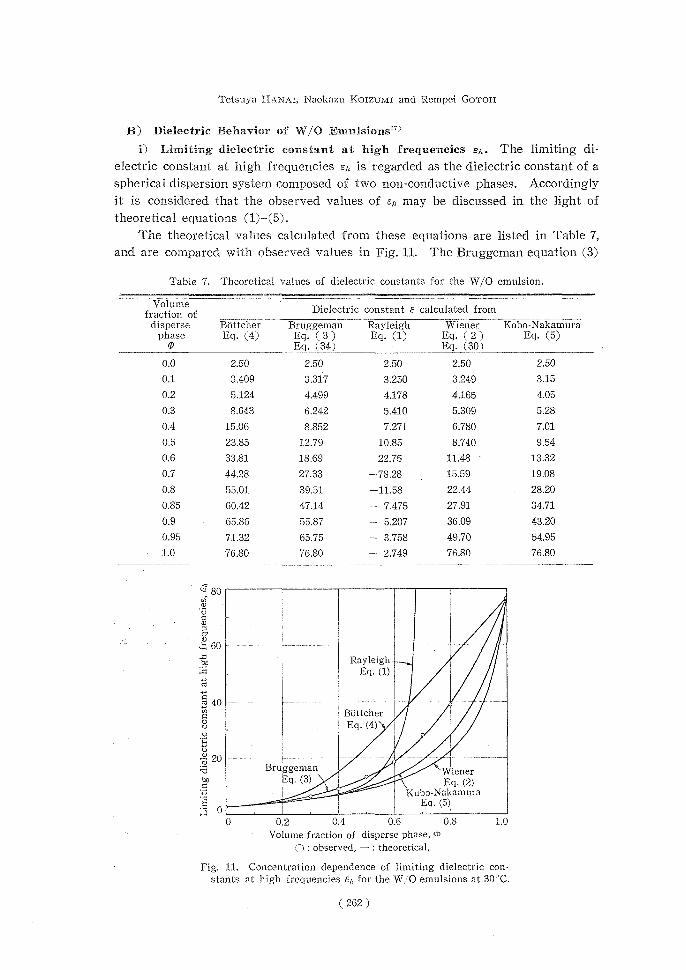
The theoretical values calculated from these equations are listed in Table 7,
and are compared with observed values in Fig. 11. The Bruggeman equation (3)
Table 7. Theoretical values of dielectric constants for the W/O emulsion.
VolumeDielectric constant & calculated from fraction of
disperse Bdttcher Bruggeman Rayleigh Wiener Kobo-Nakamura phase Eq. (4) Eq. (3)Eq. (1) Eq. (2) Eq. (5)
0Eq. (34)Eq. (30)
0.02.50 2.502.50 2.502.50 0.13.409 3.3173.250 3.2493.15 0.25.124 4.4994.178 4.1654.05 0.38.643 6.2425.410 5.3095.28 0.415.06 8.8527.271 6.7807.01 0.523.85 12.7910.85 8.7409.54
.0.633.81 18.6922.75 11.48 . 13.32 0.744.28 27.33-78.28 15.5919.08
0.855.01 39.51-11.58 22.4428.20 0.85 60.42 47.14- 7.475 27.9134.71 0.965.86 55.87- 5.207 36.0943.20 0.95 71.32 65.75- 3.758 49.7054.95 1.076.80 76.80- 2.749 76.8076.80
0C80, .0 c cr 60
.cac Rayleigh----- Eq(1)
_,
y
v,40 "' BOttcher °Eq. (4)
U 4c),20 i :o- BruggemanWiener
toEq. (3)Eq . (2) Kubo-Nakamma
E0 ------Eq(5) 0 0.2 0.40:60.8 1.0
Volume fraction of disperse phase, ib `) : observed, - : theoretical,
Fig. 11. Concentration dependence of limiting dielectric con- stants at high frequencies e,, for the W/O emulsions at 30°C.
( 262 )
Dielectric Constants of Emulsions
or (34) fits best to the observed values over the whole range of concentration.
Recently Naiki, Fujita and Matsumura33> measured at 2 mc. the dielectric
constants of emulsions of water dispersed in kerosene, in transformer oil and in
terpene over a concentration range of 0 to 85%. The data were in good agree-
ment with values calculated from the Bruggeman equation over the whole range
of concentration. Thus the results obtained by Naiki et al. are consistent with
the present conclusion.
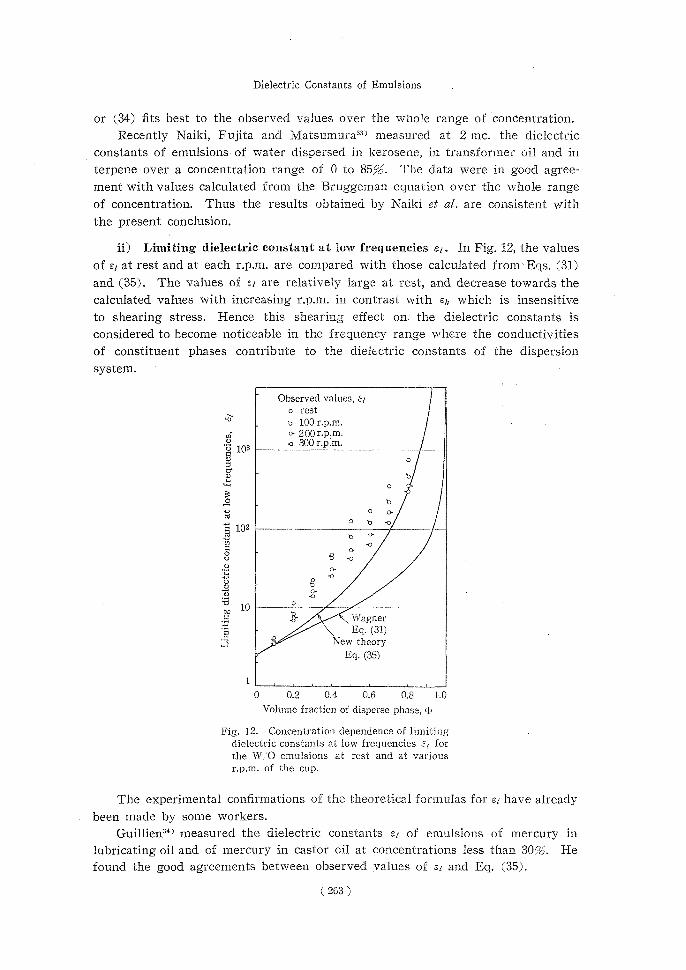
ii) Limiting dielectric constant at low frequencies sr. In Fig. 12, the values
of el at rest and at each r.p.m. are compared with those calculated from` Eqs. (31)
and (35). The values of et are relatively large at rest, and decrease towards the
calculated values with increasing r.p.m. in contrast with er, which is insensitive
to shearing stress. Hence this shearing effect on. the dielectric constants is
considered to become noticeable in the frequency range where the conductivities
of constituent phases contribute to the dielectric constants of the dispersion
system.
- Observed values, ,5/
o rest b 100 r.p.m. 0 200r.p.m.
103— 0300 r.p.m. ra3d 0 c Q'
0 ~ -b 3' -b roO 0.
C 102 -------------- ----------- bo- Nq [o-
o$ .o o-
e
61 vo-
10--..__°._—, __._._ ......_~.— --....... Wagner
) ///Eq. (31) New theory
Eq. (35)
1 , 0 0.2 0.4 0.6 0.8 1.0
Volume fraction of disperse phase, d)
Fig. 12. Concentration dependence of limiting dielectric constants at low frequencies E/ for
the W,0 emulsions at rest and at various r.p.m. of the cup.
The experimental confirmations of the theoretical formulas for er have already
been made by some workers.
Guillien3") measured the dielectric constants el of emulsions of mercury in
lubricating oil and of mercury in castor oil at concentrations less than 30%. He
found the good agreements between observed values of Er and Eq. (35).
( 263 )
Tetsuya FIANAI, Naokazu KOIZUMT and Rempei Gorou
Recently Pearce29) measured at 1 kc. the dielectric constants of emulsions of
sea water in fuel oil at concentrations up to 63%. Since the sea water used as
the disperse phase has a very high conductivity, the systems of sea water in fuel
oil would show the dielectric dispersions due to the interfacial polarization at
very high frequencies. The dielectric constants observed by Pearce correspond
to the Iimiting values at low frequencies ei. Pearce concluded that the measured
dielectric constants agree better with Eq. (35) than with Eq. (31).
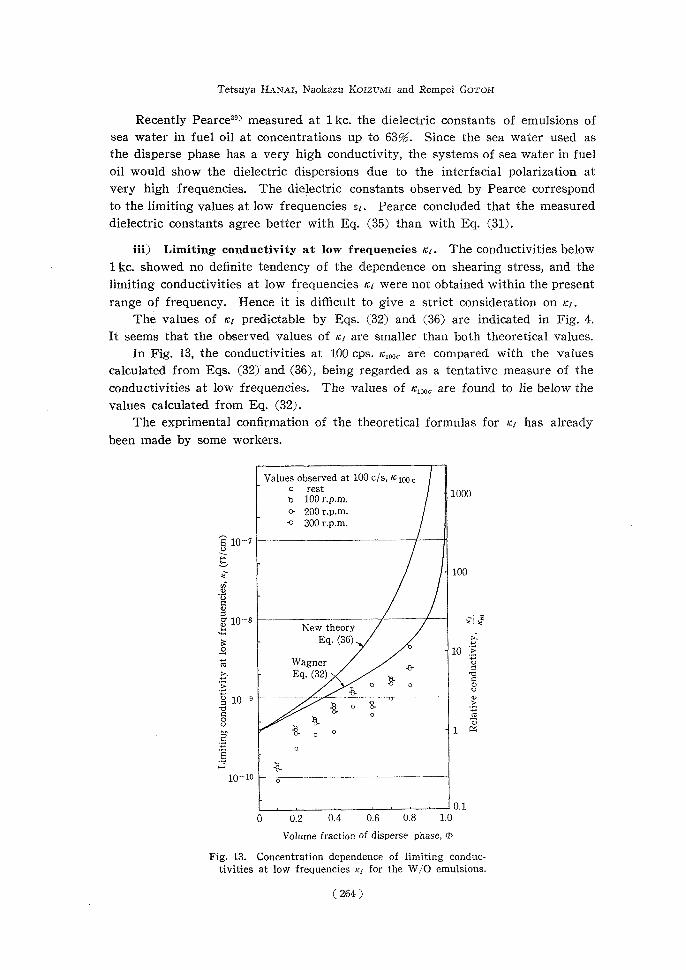
iii) Limiting conductivity at low frequencies ra. The conductivities below
1 kc. showed no definite tendency of the dependence on shearing stress, and the
limiting conductivities at low frequencies rr were not obtained within the present
range of frequency. Hence it is difficult to give a strict consideration on rl.
The values of r1 predictable by Eqs. (32) and (36) are indicated in Fig. 4. It seems that the observed values of rj are smaller than both theoretical values.
In Fig. 13, the conductivities at 100 cps. r,00, are compared with the values
calculated from Eqs. (32) and (36), being regarded as a tentative measure of the
conductivities at low frequencies. The values of /C100C are found to lie below the
values calculated from Eq. (32).
The exprimental confirmation of the theoretical formulas for rt has already
been made by some workers.
Values observed at 100. c/s, K 100 c o rest1000
b 100 r.p.m. o- 200 r.p.m. -0 300 r.p.m.
610 7 ----------------------------------------
U
100
of N
U - a N
g 10 8 ------------------YIY New theory
Eq. (36) •°10 'S
Wagner -e- Eq. (32)
4 oO '5'o o-
ooU co . b0 SOt- O O 1 Q'i
•C
10-10 o--- — — ------------
0.1 0 0.2 0.4 0.6 0.8 1.0
Volume fraction of disperse phase, 4
Fig. 13. Concentration dependence of limiting conduc- tivities at low frequencies s q for the W/O emulsions.
(264)
Dielectric Constants of Emulsions
Meredith3) observed conductivities of W/O emulsions at 1 and 10 kc., con-
centrations being less than 50%. The values observed by him may be considered
as the limiting conductivity at low frequencies rt, though the dielectric dispersion
due to the interfacial polarization was not mentioned in his discussions. The
conductivities measured showed the values between Eqs. (32) and (36).
Meredith and Tobias30) measured corductivities of dispersion systems of
brass spheres in a cubic array in tap water. The experimental data fell between
values predicted by Eqs. (32) and (36).
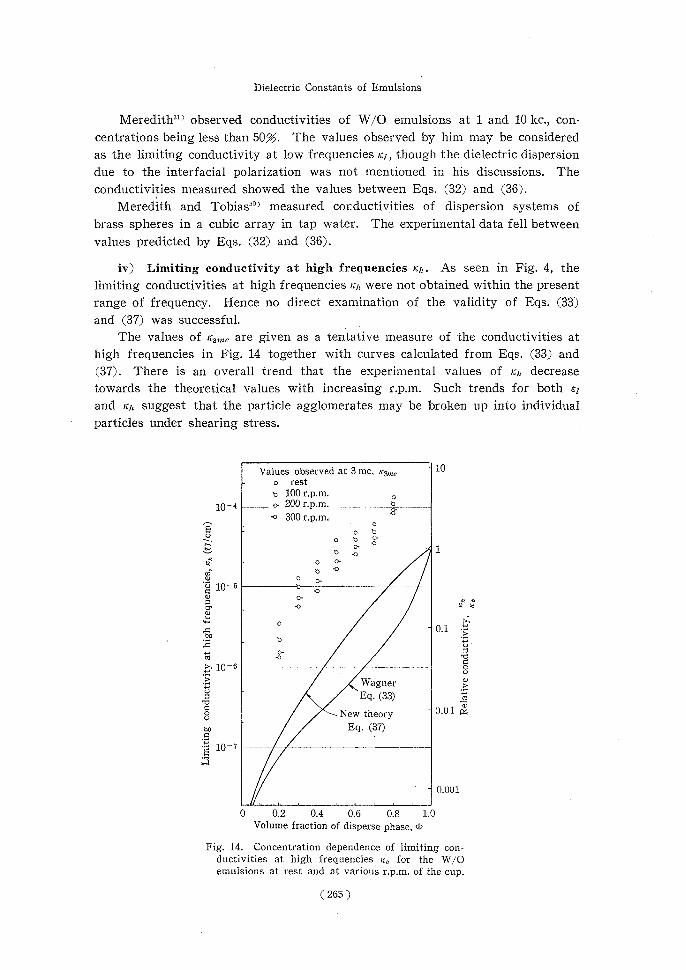
iv) Limiting conductivity at high frequencies eh. As seen in Fig. 4, the
limiting conductivities at high frequencies r1 were not obtained within the present
range of frequency. Hence no direct examination of the validity of Eqs. (33)
and (37) was successful.
The values of r3„2 are given as a tentative measure of the conductivities at
high frequencies in Fig. 14 together with curves calculated from Eqs. (33) and
(37). There is an overall trend that the experimental values of i decrease towards the theoretical values with increasing r.p.m. Such trends for both er
and ra suggest that the particle agglomerates may be broken up into individual
particles under shearing stress.
Values observed at 3 mc, K3,,,c - 10 o rest
b 100 r.p.m. 10-4 ----- o- 200 r.p.m.
o 300 r.p.m: o o o- 01 b
yb 'O o c 10-5----------b--0..-----__
o- -oY Y
Oat. 0.1 On
tdO~ >, 10-6 ---------------
Wagner Eq (33) -o7 13 ro
New theoryNew orEq. (37)
10-7 ----— ----- a
- 0.001
0 0.2 0.4 0.6 0.8 1.0 Volume fraction of disperse phase , (13
Fig. 14. Concentration dependence of limiting con- ductivities at high frequencies ic,, for the W/O
emulsions at rest and at various r.p.m. of the cup.
(265)
Tetsuya HANAL, Naokazu KotzuMt and Rempei Go-roil
•
v) Distribution parameter of relaxation times a. As seen in Table 5, observed values of a increased with decreasing concentration. Supposedly the
pressent emulsions would not show the single relaxation behavior even at infinite dilution.
According to the Wagner theory,8' a dilute emulsion composed of dispersed
particles of uniform conductivity should show the single relaxation behavior. Some distribution of relaxation times found in the present emulsions may be caused by the non-uniformity in the conductivity of each dispersed particle.
C) Dielectric Behavior of N/ W Emulsions"'
The frequency dependence of dielectric constant and conductivity observed
for the present N/W emulsions is considered to be attributable to the dielectric
dispersion expected from the new theory on the interfacial polarization. Since the condition em)rch is not always valid for the present N/W emulsions
as seen in Table 6, the experimental results should be discussed in the light of
Eqs. (10)-(17) without any restriction on the conductivity.
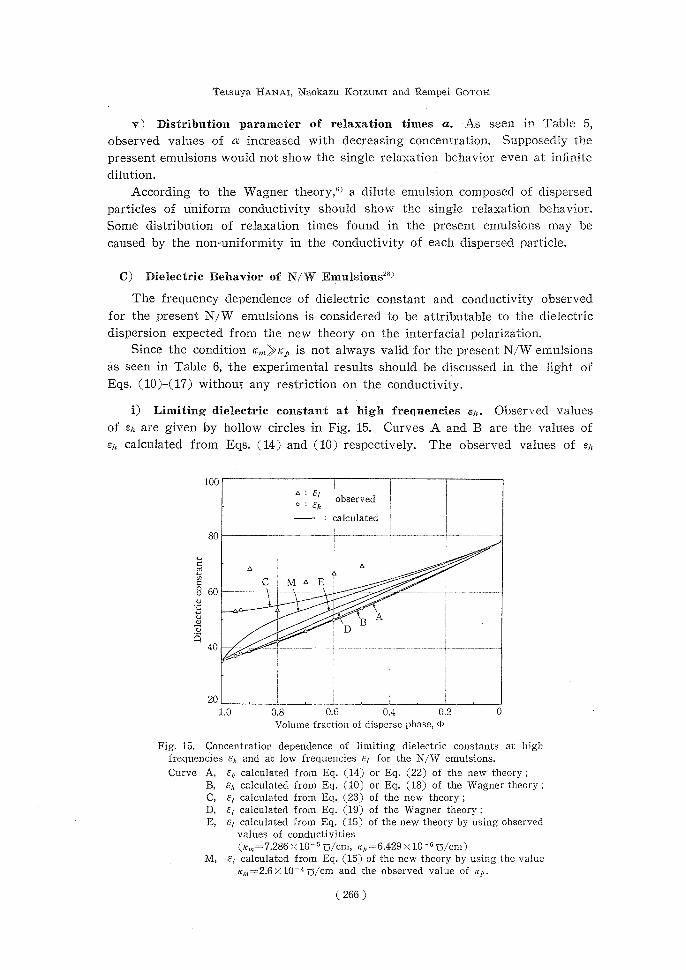
i) Limiting dielectric constant at high frequencies s,,. Observed values
of sh are given by hollow circles in Fig. 15.. Curves A and B are the values of en calculated from Eqs. (14) and (10) respectively. The observed values of eh
100 ~ ' 6/ observed o E
h — calculated
80--
co ~ o
cC MAE Q 8 60
rr.A
~DB 40,G
20 1.0 0.8 0.60.4 0.2 0
Volume fraction of disperse phase, 0'
Fig. 15. Concentration dependence of limiting dielectric constants at high frequencies c,, and at low frequencies s1 for the N/W emulsions.
Curve A, c,, calculated from Eq. (14) or Eq. (22) of the new theory ; B, Eh calculated from Eq. (10) or Eq. (18) of the Wagner theory ;
C, e, calculated from Eq. (23) of the new theory; D, e, calculated from Eq. (19) of the Wagner theory ;
E, et calculated from Eq. (15) of the new theory by using observed values of conductivities
(ic,,,=7.286x10 'iu/cm, ICI,=6.429x10⁻⁶G/cm) M, E, calculated from Eq. (15) of the new theory by using the value
,c,,,=2.6)<10-4u/cm and the observed value of "p.
( 266 )
Dielectric Constants of Emulsions
are in good agreement with the theoretical curves A and B within experimental
errors.
In the case of N/W emulsions, the curve B is very close to the curve A.
Therefore it is difficult to decide which curve fits better to the observed values.
ii) Limiting dielectric constant at low frequencies ei. Triangles in Fig. 15
show the observed values of e,. Curve C is calculated from Eq. (23), which is
the limiting relation of Eq. (15) in the new theory under the condition ti,,,>>rp,.
Curve E is drawn according to Eq. (15) by using measured values: r,,, = 7.286 x 10⁻⁵ u/cm, r p = 6.429 x 10' u/cm. Curve D is calculated from Eq. (19)
in the Wagner theory.
According to the Wagner theory, the differences between ei and se are very
small both at higher and at lower concentrations, though such differences are
rather appreciable at medium concentrations. Hence the Wagner theory is
qualitatively inadequate to interpret the striking dielectric dispersions observed for the N/W emulsions.
8 ------------ ---------------- 7 0 .K,
o Kb„,observed
,./77"<" — calculated o;I
gG
K vG/'d o
c!)FJ
0 --------------------------------------------------------------------------------
1.0 0.8 0.6 0.40.2 0 Volume fraction of disperse phase, 0)
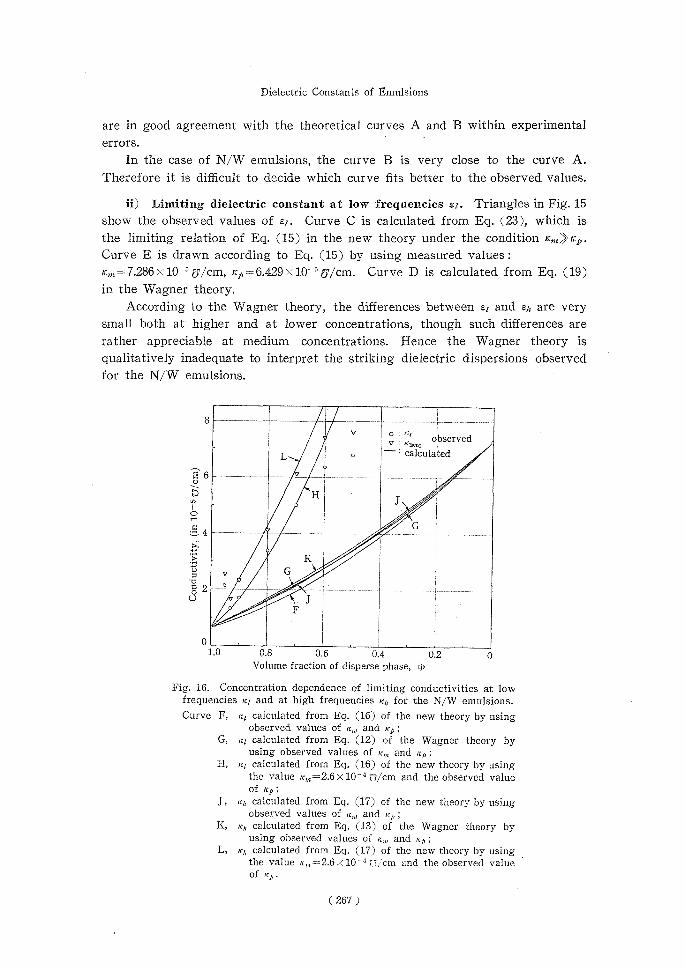
Fig. 16. Concentration dependence of limiting conductivities at low frequencies ,c, and at high frequencies ,q, for the N/W emulsions.
Curve F, ,cr calculated from Eq. (16) of the new theory by using observed values of rc,,, and ICp ;
G, ,cr calculated from Eq. (12) of the Wagner theory by using observed values of ,c,,, and ,cp ;
II, ICI calculated from Eq. (16) of the new theory by using the value rc,,,=2.6 x 10⁻⁴ n/cm and the observed value of ,cp ;
J, IC 1, calculated from Eq. (17) of the new theory by using observed values of ,c,,, and IC ;
K, rcr, calculated from Eq. (13) of the Wagner theory by using observed values of rc,,, and kp ;
L, rcr, calculated from Eq. (17) of the new theory by using the value ,c,,,--2.6x10 "" Ci/cm and the observed value of rcp.
(267 )
Tetsuya HANAJ, Naokazu Koizumi and Rempei Go-roH
On the contrary, the considerable differences between ai and er, at higher concentrations are expected from the new theory. The striking dielectric disper-
sions observed especially at higher concentrations may be interpreted qualitatively
in terms of the new theory. As seen in Fig. 15, the observed values of ar is
relatively larger than the theoretical ones shown by the curves C and E of the
new theory.
iii) Limiting conductivity at low frequencies rl. Fig. 16 shows the com-
parison of observed values of ri with those given by the theories. Hollow circles show the observed values of rt. Curves F and G are drawn according to Eqs.
(16) and (12) respectively by using obrerved values of r,n and /Cp. The observed values of r1 is generally larger than the theoretical ones shown
by the curves F and G. Observed values of rc,,, and rp used here were measured
prior to emulsification. It seems possible that the value of r,,, changes on emul-sification. A curve H is calculated from Eq. (16) by using the value r,,, ^2.6x
10_I5/cm, which is about 3.5 times as large as the observed value. Observed
values of rq fall fairly well on the curve H. It seems plausible that the value
of rm increases on emulsification.
In the conductivity measurement for O/W emulsions, the values of a,,, were
stabilized by addition of potassium chloride to the water phase. In the case of
N/W emulsions, such addition of potassium chloride would keep the values of r,,
unchanged on emulsification. The addition of potassium chloride to the water
phase, however, results in the remarkable increase in the d.c. conductivity. For systems having a high d.c. conductivity, the measurement of dielectric constants
is too inaccurate for the quantitative considerations owing to the electrode
polarization, and dielectric dispersions due to the interfacial polarization may shift to higher frequencies beyond the present experimental range.
iv) Limiting conductivity at high frequencies rr,. In Fig. 16, curves J and
K are calculated from Eqs. (17) and (13) respectively by using observed values
of r:,,, and rp. The differences between the curves J and F are larger than those
between the curves K and G. Namely the increase in conductivity associated
with the dielectric dispersion expected from the new theory is larger than that
from the Wagner theory. In fact, as shown in Fig. 6, the remarkable increase in
conductivity at higher frequencies was observed in qualitative accordance with
the prediction from the new theory.
The values of rr, were not obtained within the present range of frequency.
Thus it is difficult to discuss the validity of Eqs. (13) and (17) strictly.
In Fig. 16, a curve L is calculated from Eq. (17) by using the values r,,, ̂ 2.6 x 10-" a/cm, which is about 3.5 times as large as the observed value.
Triangles in Fig. 16 show the conductivities at 3 mc. which are regarded as
a tentative measure of limiting conductivity at high frequencies. The values of
r,,,,, fall fairly well on the curve L. The observed increase in conductivity
associated with the dielectric dispersion is the same order of magnitude as the
difference between the curves L and H predicted by the new theory.
( 268 )
Dielectric Constants of Emulsions
The values of ei calculated from Eq. (15) by using the values n:,,,=2.6x10-"
ei/cm are shown by a curve M in Fig. 15. Observed values of si is generally larger than those by the curve M.
6. CONCLUSIONS
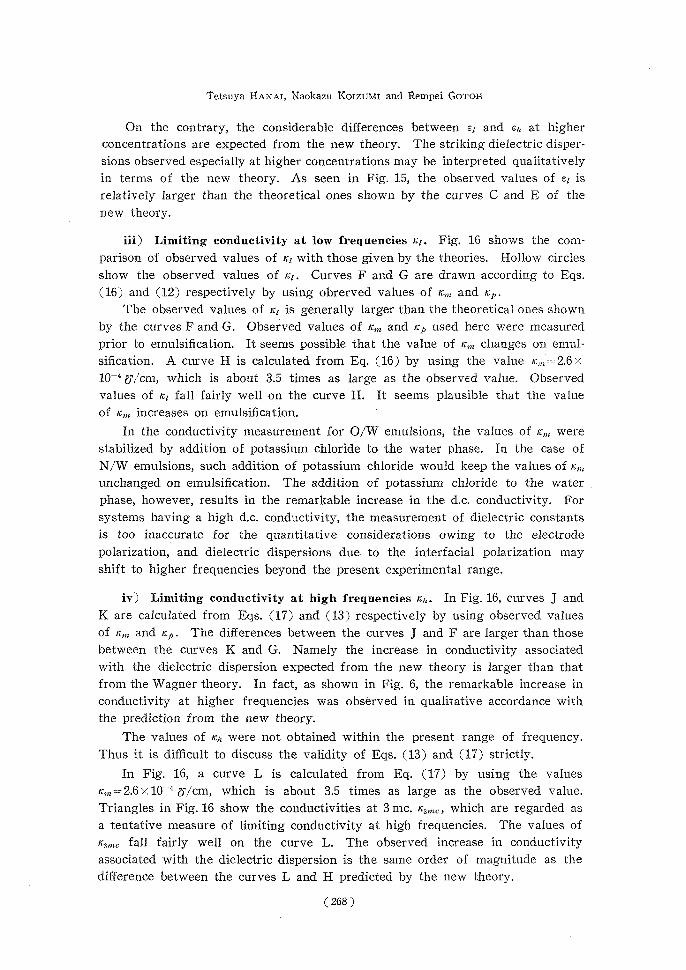
The experimental results and the considerations are summarized in Table 8.
The O/W emulsions showed no dielectric dispersion due to the interfacial
polarization, the concentration dependence of the dielectric constant and the conductivity being well represented by equations of the Bruggeman type.
Table 8. Comparision of the results on the dielectric properties of emulsions.
O/W emulsion O/W emulsion for forW/O emulsion N/W emulsion
E measurement K measurement
Electrode polarization frequency rangeBelow 10 kc. Below 1 mc. Below 1 kc. Below 30 kc.
value of exponent in1.71.8•••1.7
Interfacial polarization dielectric dispersionNoNo Remarkable Appreciable
frequency range—- Above 30 kc. Above 30 kc. complex plane plot
of complex dielectric—— Circular-arc Circular-arc constant
concentration dependenceDecrease with Decrease with of relaxation frequencyAincreasing increasing concentration concentration
concentration dependence Equation of Equation of Equation of Equation of of E1,Bruggeman type Bruggeman type Bruggeman type Bruggeman or
Wiener type
Shearing effectNoNoYesNo
The W/O emulsions showed striking dielectric dispersion due to the inter-
facial polarization, the limiting dielectric constant at high frequencies being
represented by Bruggeman's equation. The N/W emulsions, which are a kind of O/W emulsions, showed a dielectric
dispersion in accordance with the prediction from the new theory rather than
from the Wagner theory.
These experimental results support the theoretical conclusion that the magni-
tude of dielectric dispersion due to the interfacial polarization is related not to
the emulsion type, but to the correlation among dielectric constants and conduc-
tivities of the dispersion medium and the disperse phase.
The W/O emulsions showed marked changes in dielectric properties under
shearing flow, whereas O/W and N/W emulsions had no shearing effect under the rate of shear up to 40 sec-'. The shearing effect found in W/O emulsions
may be caused by breaking up particle agglomerates, an exact interpretation being
not given yet.
( 269 )
Tetsuya HANAr, Naokazu KorzuMi and Rempei GoTO}
The influence of particle size on dielectric properties were not found in the
present emulsions composed of dispersed particles larger than 0.5,u in diameter.
ACKNOWLEDGEMENTS
The authors wish to acknowledge their indebtedness to Mr. N. Hayama for
his advice in preparation of emulsions. This research was supported by the
Scientific Research Encouragement Grant from the Ministry of Education to which
authors' thanks are due. A part of numerical calculations was carried out with
the KDC-1 digital computer of Kyoto University.
REFERENCES
(1) e.g., E. Heyman, Kolloid Z., 66, 229, 358 (1934) ; R. H. Kruyt, "Colloid Science," Vol. I, Elsevier Publishing Co., Amsterdam, 1952; C. G. Sumner, "Clayton's The Theory of Emul-
sions and their TechnicaI Treatment," J. & A. ChurchiII Ltd. London, 1954.
(2) A. G. Parts, Nature, 155, 236 (1945). (3) A. Voet, J. Phys. & Colloid Chem., 51, 1037 (1947) ;
A. Voet and L. R. Suriani, J. Colloid Sci., 7, 1 (1952) ; A. Voet, J. Phys. Chem., 61, 301 (1957).
(4) A. Bondi and C. J. Penther, J. Phys. Chem., 57, 72 (1953). (5) J. A. Reynolds and J. M. Hough, Proc. Phys. Soc., 70B, 769 (1957).
(6) T. Hanai, Kolloid Z., 171, 23 (1960). (7) T. Hanai, Kolloid Z., 175, 61 (1961). (8) T. Hanai, This Bulletin, 39, 341 (1961).
(9) R. W. Sillars, J. Inst. Elec. Engrs. (London), 80, 378 (1937). (10) B. V. Hamon, Aust. J. Phys., 6, 304 (1953). (11) M. M. Z. Kharadly and W. Jackson, Proc. Inst. Elec. Engrs. (London), 100(III), 199
(1953). (12) J. S. Dryden and R. J. Meakins, Proc. Phys. Soc., 70B, 427 (1957). (13) Lord Rayleigh, Phil. Mag., 34, 481 (1892). (14) 0. Wiener, Abhandl. Kgl. Sachs. Ges. Wiss., Math. Phys. Kl., 32, 509 (1912). (15) K. W. Wagner, Arch. Elektrotech., 2, 371 (1914). (16) D. A. G. Bruggeman, Ann. Physik, 24, 636 (1935). (17) C. J. F. Bottcher, "Theory of Electric Polarization," p. 419, Elsevier Publishing Co.,
New York, 1952.
(18) K. Kubo and S. Nakamura, Bull. Chem. Soc. Japan, 26, 318 (1953). (19) R. E. D. L. Rue and C. W. Tobias, J. Electrochem. Soc., 106, 827 (1959). (20) P. Becher, " Emulsions : Theory and Practice," p. 191, Reinhold Publishing Corp., New
York, 1957. (21) H. Green, "Industrial Rheology and Rheological Structures," Chap. 8, John Wiley &
Sons, Inc., New York, 1949.
(22) R. H. Cole and P. M. Gross Jr., Rev. Sci. Instr., 20, 252 (1949). (23) T. Hanai, N. Koizumi and R. Gotoh, Kolloid Z., 167, 41 (1959). (24) N. Koizumi and T. Hanai, This Bulletin, 33, 14 (1955). (25) J. D. Ferry and J. L. Oncley, J. Am. Chem. Soc., 63, 272 (1941) ; J. F. Johnson and R. H.
Cole, J. Am. Chem. Soc., 73, 4536 (1951) ; W. Dannhauser and R. H. Cole, J. Am. Chem. Soc., 74., 6105 (1952) ; H. Fricke, Phil. Mag., 14, 310 (1933).
(26) T. Hanai, N. Koizumi, T. Sugano and R. Gotoh, Kolloid Z., 171, 20 (1960). (27) T. Hanai, Kolloid Z., 177, 57 (1961). (28) T. Hanai, N. Koizumi and R. Gotoh, Kolloid Z., in press. (29) C. A. R. Pearce, Brit. J. Appl. Phys., 6, 113 (1955).
( 270 )
Dielectric Constants of Emulsions
(30) R. E. Meredith and C. W. Tobias, J. Appl. Phys., 31, 1270 (1960). (31) R. E. Meredith, Thesis, University of California, Contract W-7405-eng-48, (1959).
(32) H. Fricke, Phys. Rev., 24, 575 (1924). (33) T. Naiki, K. Fujita and S. Matsumura, Menm. Fac. Ind. Arts Kyoto Tech. Univ., Sci. Tech-
nol., 8, 1 (1959).
(34) R. Gnillien, Ann. phys., 16, 205 (1941).
(271)