Embed Size (px)
Citation preview

22001100--22001111 TTiittllee II PPeerrffoorrmmaannccee RReeppoorrtt
ffoorr TTiittllee II,, PPaarrtt AA FFuunnddss
Instruction Manual
New Jersey Department of Education

2 2
2010-2011 Title I Performance Report
The No Child Left Behind Act (NCLB) requires the annual collection of data from school districts that received Title I funds. This information contributes to a larger comprehensive State Performance Report that the New Jersey Department of Education must submit to the U. S. Department of Education for a national perspective. The purpose of the Title I Performance Report is to provide a summative analysis of the impact of Title I, Part A funds on student performance and to report how these funds were used. All districts that received Title I, Part A funds in the 2010-2011 school year (project period September 1, 2010 to August 31, 2011) must submit data for this Performance Report, even districts that are not receiving funding for 2011-2012. The data for how Title I, Part A funds were spent in 2010-2011 must match your district’s approved FY 2011 NCLB Consolidated Application. For example, if your application indicated expenditures for teachers and paraprofessionals, the Performance Report should include corresponding numbers on the FTE table.
Please note: The Title I, Part A performance reporting system is incorporated into the EWEG system. Enter the system using the district’s ID and password and choose “Title I Performance Report.” In the drop-down box at the top of the screen that is labeled “Year,” select year 2011 and click on the button that says “Create Application.”
This instruction guide will walk you through each screen of the report. If you have questions relating to the Title I, Part A program, data, or technical performance of the collection system, you may e-mail them to [email protected] and include the following information:
name and code of the LEA, i.e., Absecon City (0010) the inquirer’s direct phone number.

3 3
Checklist of Data Required to Complete This Report You will need the following data about Title I, Part A services your district provided during the 2010-2011 school year. Table 1a – For All Title I Districts: The number of Title I students served with Part A funds,
disaggregated by race/ethnicity. These counts do not include nonpublic school students served or students served with Part A, Neglected funds. Part A data counts must identify students as attending targeted assistance schools (TAS) or schools operating approved Title I schoolwide programs (SWP).
Table 1b – For All Title I Districts: The number of Part A students who received Title I
services, disaggregated by grade level, and identified as either TAS, SWP, Part A Neglected, or Nonpublic (Private) School students.
Table 2 – For All Title I Districts: The number of Title I, Part A students, disaggregated by
instructional subject and support services, for TAS only. Nonpublic School students are also counted.
Table 3 – For All Title I Districts: The number of students within special service groups, i.e.,
students with disabilities (IDEA), limited English proficient (LEP), homeless, and migrant, and the number of students within selected categories who received SES.
Table 4 – For All Title I Districts: The number of full-time equivalent staff (administrators,
support staff, teachers) in Title I targeted assistance programs, paraprofessionals in targeted assistance and schoolwide programs, and the number of paraprofessionals, disaggregated by qualification criteria.
Table 5a – For Title I schools in need of improvement (SINIs) required to offer the school choice option: 1) The number of students who were eligible for transfer to another school within the district; 2) The number of students who applied for transfer; 3) The number of students who were given the opportunity to transfer; 4) The number of students who actually transferred; and 5) The number of students who previously transferred and are continuing at the choice school in the current year.
Table 5b – For Title I SINIs required to offer supplemental educational services (SES): 1)
The number of Title I students who were eligible for SES; 2) The number of students who applied for SES; 3) The number of students who were given the opportunity for SES; and 4) The number of students who actually received SES. Also requested are dollar amounts spent on school choice transportation and SES and how often SES was offered.
Table 6a – For Title I SINIs: The number of Title I students who transferred to each eligible
school within the district.
4 4
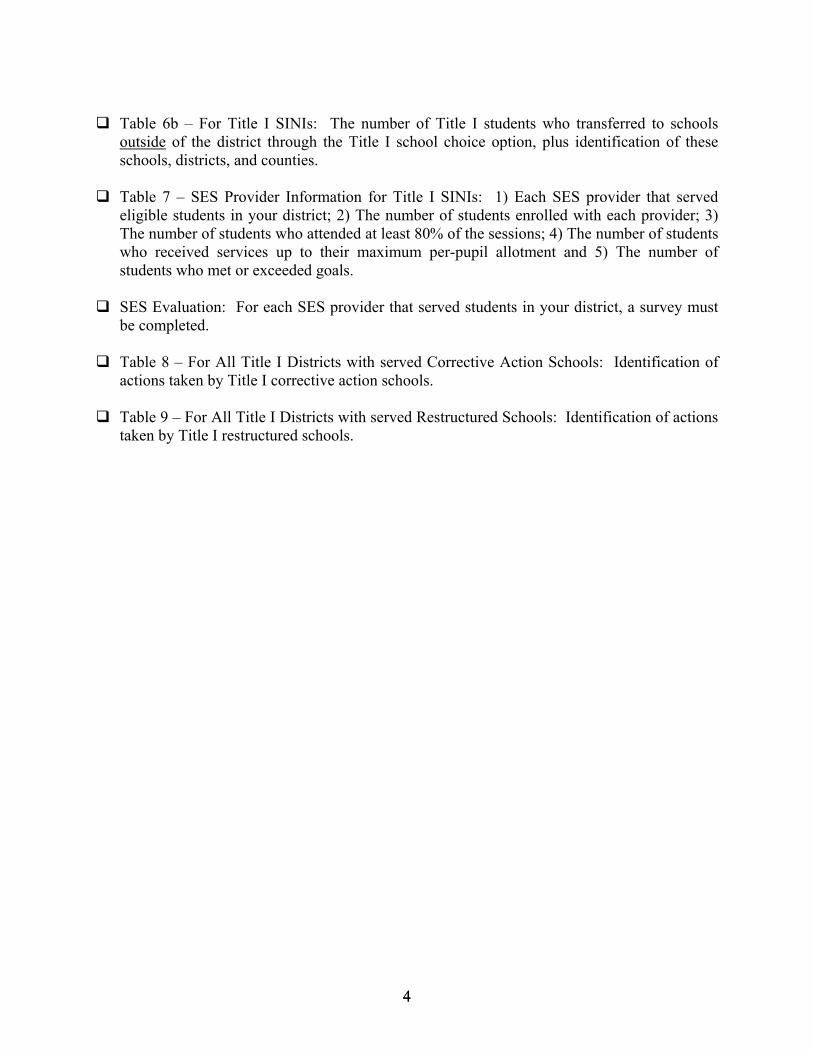
Table 6b – For Title I SINIs: The number of Title I students who transferred to schools
outside of the district through the Title I school choice option, plus identification of these schools, districts, and counties.
Table 7 – SES Provider Information for Title I SINIs: 1) Each SES provider that served
eligible students in your district; 2) The number of students enrolled with each provider; 3) The number of students who attended at least 80% of the sessions; 4) The number of students who received services up to their maximum per-pupil allotment and 5) The number of students who met or exceeded goals.
SES Evaluation: For each SES provider that served students in your district, a survey must
be completed. Table 8 – For All Title I Districts with served Corrective Action Schools: Identification of
actions taken by Title I corrective action schools. Table 9 – For All Title I Districts with served Restructured Schools: Identification of actions
taken by Title I restructured schools.

5 5
2010-2011 Title I Performance Report on EWEG The Title I, Part A performance data collection is part of the EWEG system. All districts that received Title I, Part A funds in the 2010-2011 school year must complete the performance survey. The instructions in this manual will guide you through the process. If you have any problems entering your data or submitting the report, contact the Office of Title I at [email protected]. Logging On Each district must use its individual EWEG ID and Password to log into the system. If you do not know your district’s ID and Password, contact your district technology support person.

6 6
Menu List
To access the performance report, click on the Title I Performance Report link. You will then see a screen similar to the one shown on the following page.
7 7
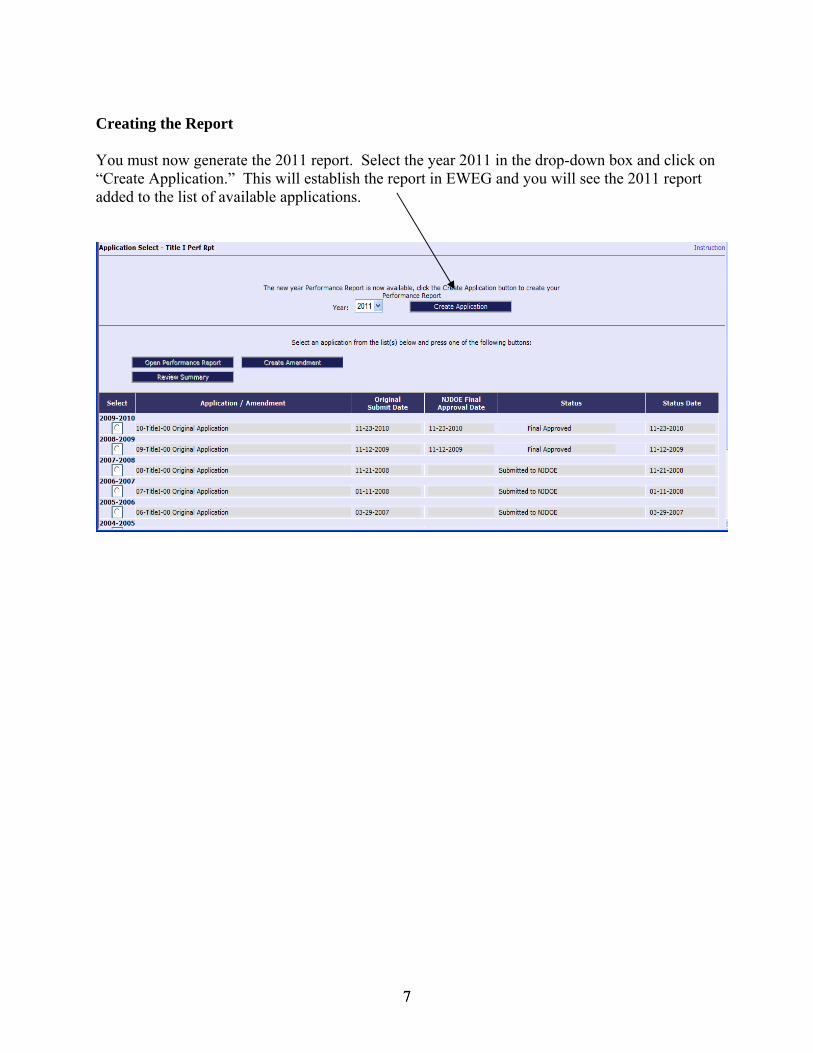
Creating the Report You must now generate the 2011 report. Select the year 2011 in the drop-down box and click on “Create Application.” This will establish the report in EWEG and you will see the 2011 report added to the list of available applications.
8 8
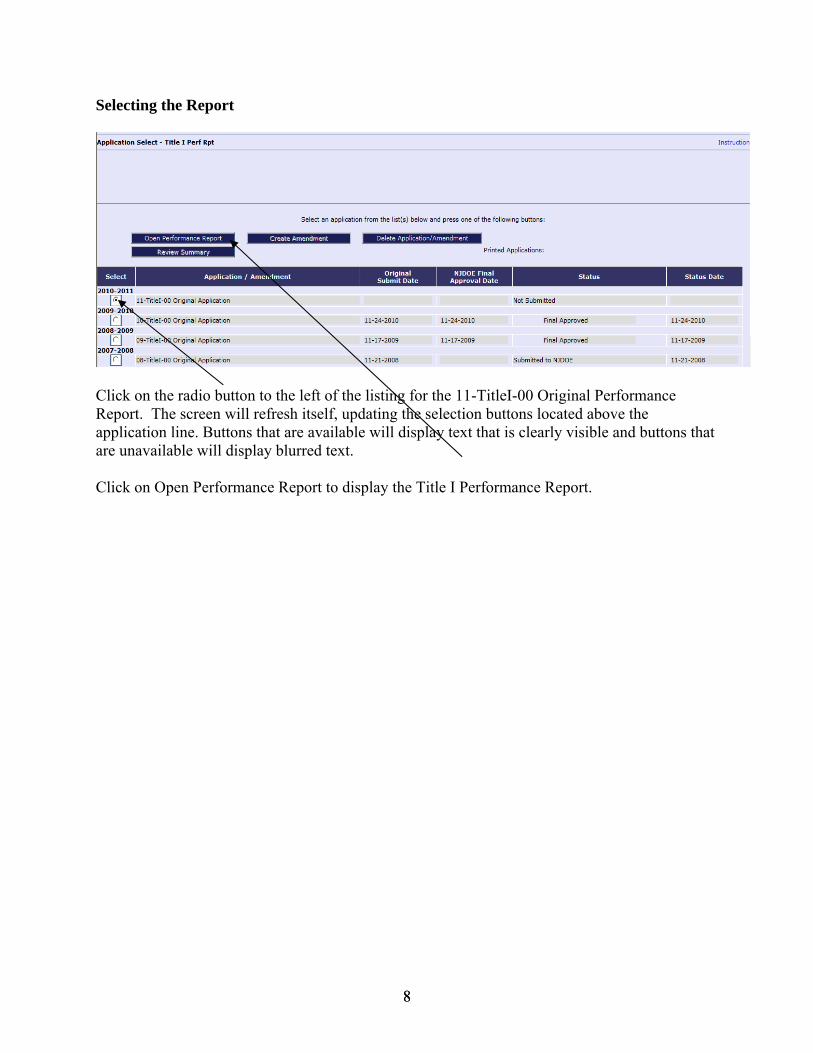
Selecting the Report
Click on the radio button to the left of the listing for the 11-TitleI-00 Original Performance Report. The screen will refresh itself, updating the selection buttons located above the application line. Buttons that are available will display text that is clearly visible and buttons that are unavailable will display blurred text. Click on Open Performance Report to display the Title I Performance Report.

9 9
Navigating Within the Report All sections of the report are accessible by clicking on tabs located across the top of the screen.

10 10
Some tabs may have subtabs that appear directly below the selected tab (see below). The first subtab will open up initially. You can access additional tabs by clicking on the labeled subtab.
All pages that require data to be entered will have a Save button located at the bottom of the page. Note: You must click the Save button before you leave each screen or you will lose the data you entered. Note: Do not use the Back button to access a previous screen. Save your work and use the tabs at the top of the screen. Using the Back button will create error pages preventing you from accessing screens and interfering with the system’s functionality.

11 11
Title I Performance Report Step-by-Step Tab 1: Overview This screen provides an introduction to the Title I Performance Report.

12 12
Tab 2: Contact Information The information on this screen is pulled automatically from the Central Contact system. Note: Be sure you have updated the Central Contact system to reflect district staff currently responsible for the various programs and functions.

13 13
Tab 3: Student Participation 1a. Student Participation by Racial/Ethnic Group (Unduplicated) *All Districts that received Title I, Part A funding in 2010-2011 must complete Tables 1a and 1b. Purpose: This table collects data on public school students by type of program―targeted assistance (TAS) or schoolwide (SWP). The student data must be disaggregated according to racial/ethnic group. Note: The EWEG system has built-in edits that interact to verify column totals and cross-reference tables, if appropriate. If totals do not correlate, you may receive an error message. For Table 1a, enter the unduplicated count, by ethnicity, for students who participated in a Title I program at anytime during this reporting period. Include students in targeted assistance programs (TAS) and schoolwide programs (SWP). Count a child only once in each category even if the child participated during more than one term or in more than one school during the reporting period. Include pre-K through Grade 12. Do not include Local Neglected Students (those served with Title I, Part A Neglected funds), nonpublic students, or adult participants in adult literacy programs funded by Title I in this table. Students may only be listed under SWP if the funded school is operating an approved Title I schoolwide program. Please do not confuse a school with a Title I schoolwide program with a single attendance area school. Please review the definitions of these terms. Note: All students attending a Title I school operating an approved schoolwide program are considered Title I students.

14 14
1b: Public, Nonpublic & Local Neglected Students by Grade Level Purpose: This table collects data by grade level for all students served with Title I, Part A funds. For Title I, Part A, enter the total unduplicated number of students who received Title I services during the 2010-2011 school year, by grade level. Enter the totals for your district’s TAS and SWP students in columns 1 and 2. Enter the total served with Title I, Part A Neglected funds in column 3. Enter the total nonpublic school students served with Title I, Part A funds in column 4. The numbers in column 5 are calculated automatically and represent the total for each row. Note: All students attending a Title I school operating an approved schoolwide program are considered Title I students. Note: The student totals for the TAS and SWP columns in Table 1b must be greater than zero and equal to the student totals for Table 1a. If totals do not correlate, you may receive an error message.
After all data are entered, click the Calculate Totals button, then click the Save Page
button.

15 15
Tab 4: Student Participation by Type of Service (TAS only) * All districts that received Title I, Part A funding in 2010-2011 and conducted a targeted assistance program must complete this table.*
Purpose: The purpose of this table is to determine the number of students in Title I targeted assistance programs who received Title I instructional services in content areas and support services during the 2010-2011 school year supported by Title I funds. This table collects data for TAS only; do not include schoolwide student counts. Include students funded with Title I, Part A Neglected funds in this count. Include the nonpublic students served in the “Nonpublic” column. The screen is shown above in two sections showing the instructional and supporting data collection fields.
Enter the student counts for public school TAS students in column 1 and the number of nonpublic school students in column 2.
Since students may have received services in multiple categories, students may be counted more than once. These may be duplicate counts, but count each student only once in each category.
Note: Each student participation count for Public TAS and Nonpublic for both Service Areas (Instructional and Supporting) cannot be greater than the table 1b. Public TAS and

16 16
Nonpublic column totals accordingly. If amounts are greater, you may receive an error message.
When all data are entered, click the Calculate Totals button, then click the Save Page button.
17 17
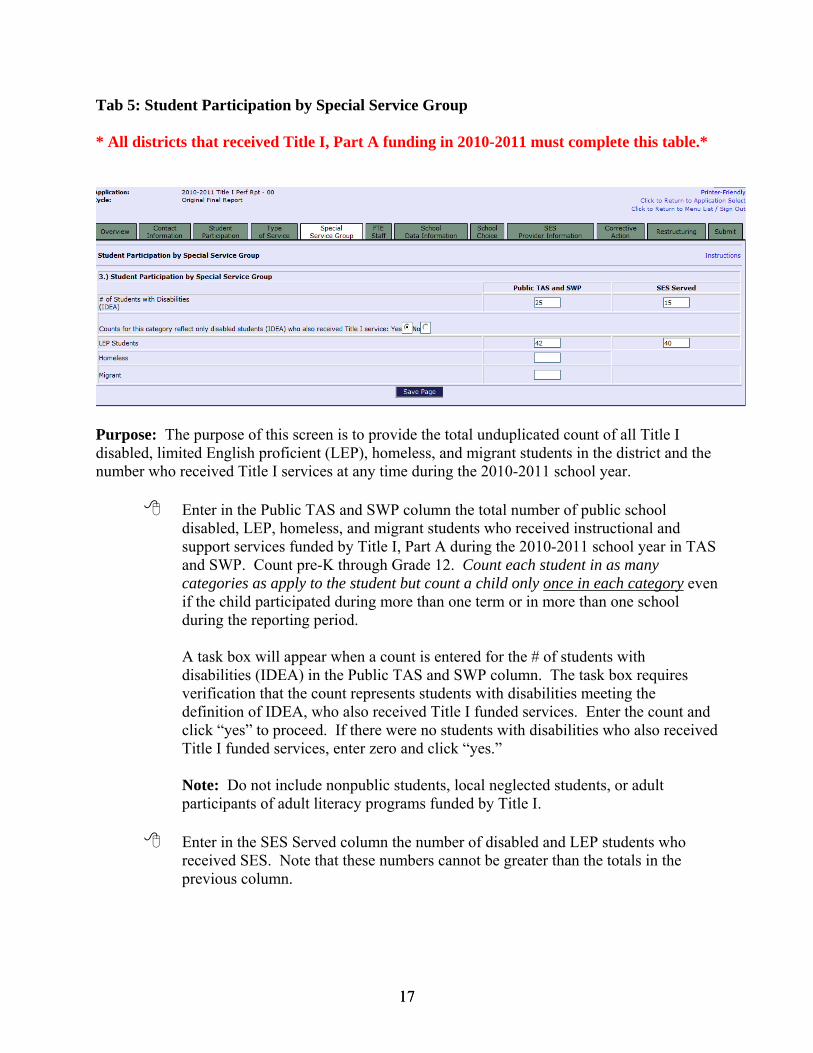
Tab 5: Student Participation by Special Service Group * All districts that received Title I, Part A funding in 2010-2011 must complete this table.*
Purpose: The purpose of this screen is to provide the total unduplicated count of all Title I disabled, limited English proficient (LEP), homeless, and migrant students in the district and the number who received Title I services at any time during the 2010-2011 school year.
Enter in the Public TAS and SWP column the total number of public school disabled, LEP, homeless, and migrant students who received instructional and support services funded by Title I, Part A during the 2010-2011 school year in TAS and SWP. Count pre-K through Grade 12. Count each student in as many categories as apply to the student but count a child only once in each category even if the child participated during more than one term or in more than one school during the reporting period.
A task box will appear when a count is entered for the # of students with disabilities (IDEA) in the Public TAS and SWP column. The task box requires verification that the count represents students with disabilities meeting the definition of IDEA, who also received Title I funded services. Enter the count and click “yes” to proceed. If there were no students with disabilities who also received Title I funded services, enter zero and click “yes.” Note: Do not include nonpublic students, local neglected students, or adult participants of adult literacy programs funded by Title I.
Enter in the SES Served column the number of disabled and LEP students who received SES. Note that these numbers cannot be greater than the totals in the previous column.
18 18
Note: Do not count students with disabilities who receive only IDEA funds. Count students with disabilities, that meet the definition of IDEA, who received any extra academic services funded with Title I.
After all data are entered, click the Save Page button.

19 19
Tab 6: FTE Staff * All districts that received Title I, Part A funding in 2010-2011 must complete this table.*
Purpose: The purpose of this table is to provide the number of full-time equivalent (FTE) staff funded through Title I, Part A programs during the 2010-2011 school year, by job category and breakdown of Title I, Part A Instructional Paraprofessionals.
Note: The system calculates the FTE counts in Table 4 after you have entered the number of staff for each category, the hours worked, and the number of hours in a full-time year.
FTEs for TAS STAFF and FTEs for SWP STAFF Enter the number of staff (unduplicated) paid with Title I funds for nonclerical
administrators, clerical support staff, teachers, instructional paraprofessionals, and other paraprofessionals in targeted assistance programs.
Enter the number of instructional paraprofessionals in schoolwide programs.
Note: Note that if funds were allocated for staff on the 2011 NCLB Consolidated Application under Title I, Part A, some counts should appear in this table. If no staff were paid with Title I funds in a category, leave the “# of People” for that category blank. If a value is entered for “# of People” in any category, the system requires an

20 20
input for “Total Title I Hours Worked Per Year (all staff)” and “Length of Full-Time Work Year (in hours).”
Enter the total number of Title I hours worked for all staff for school year 2010-2011 for
each category for which a count was entered for “# of People” in both the “FTEs for TAS Staff” and “FTEs for SWP Staff” sections.
Enter the length of the full-time work year in hours 2010-2011 for each category for which a count was entered for “# of People” in both the “FTEs for TAS Staff” and “FTEs for SWP Staff” sections.
Note: The length of the full-time work year in hours may be different for each category. It is calculated by multiplying the regular number of hours in a work week (e.g. 35 or 40 hours) by the actual number of weeks in a year required for that position. As an example, 12 month positions (i.e. clerical staff, administrators) could equate to 52 weeks, and 10 month positions (i.e. teachers, instructional paraprofessionals, other paraprofessionals) could equate to approximately 43 weeks.
PARAPROFESSIONALS What is an “Instructional Paraprofessional?” A district employee who provides
instructional support in a program supported with Title I, Part A funds. Instructional support includes the following activities:
1. One-on-one tutoring for eligible students, if the tutoring is scheduled at a time when a student would not otherwise receive instruction from a teacher.
2. Assistance with classroom management, such as organizing instructional and other materials.
3. Assistance in a computer laboratory. 4. Parental involvement activities. 5. Support in a library or media center. 6. Translators. 7. Instructional services to students.
Instructional paraprofessionals in a school operating a schoolwide program would
be those paid in the Title I budget or on the Title I schoolwide or Title I salary budget lines.
What is an “Other Paraprofessional?” Paraprofessionals who do not provide
instructional support, for example, paraprofessionals who are translators or who work with parental involvement or computer assistance.
In the Paraprofessionals section located at the bottom of Table 4, the total numbers of
instructional paraprofessionals entered in the FTEs for TAS Staff and FTEs for SWP Staff sections will be displayed in the first row. In rows 2-4, enter the number of instructional

21 21
paraprofessionals who qualified by the criteria listed. The system will calculate the number of unqualified Title I instructional paraprofessionals (last row) when the Calculate Totals button is clicked.
Click the Save Page button to save your entries.
Note: All input fields may require a value. If you have no data to report in a particular field, enter zero. Note: If an error message is received regarding FTEs, the error should read FTE requires “Total Title I Hours Worked Per Yr. (All Staff)” and “Length of Full-Time Work Year in Hours” for each row that “#of people” is entered.
22 22
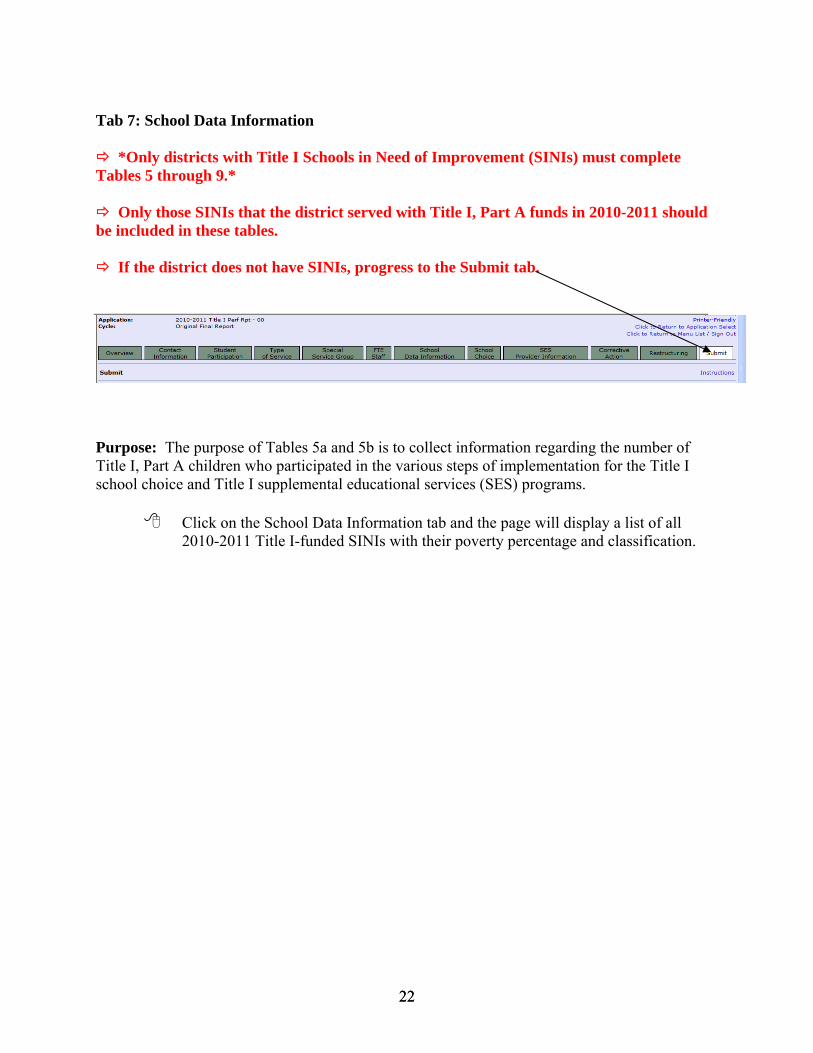
Tab 7: School Data Information *Only districts with Title I Schools in Need of Improvement (SINIs) must complete Tables 5 through 9.* Only those SINIs that the district served with Title I, Part A funds in 2010-2011 should be included in these tables. If the district does not have SINIs, progress to the Submit tab.
Purpose: The purpose of Tables 5a and 5b is to collect information regarding the number of Title I, Part A children who participated in the various steps of implementation for the Title I school choice and Title I supplemental educational services (SES) programs.
Click on the School Data Information tab and the page will display a list of all 2010-2011 Title I-funded SINIs with their poverty percentage and classification.
23 23
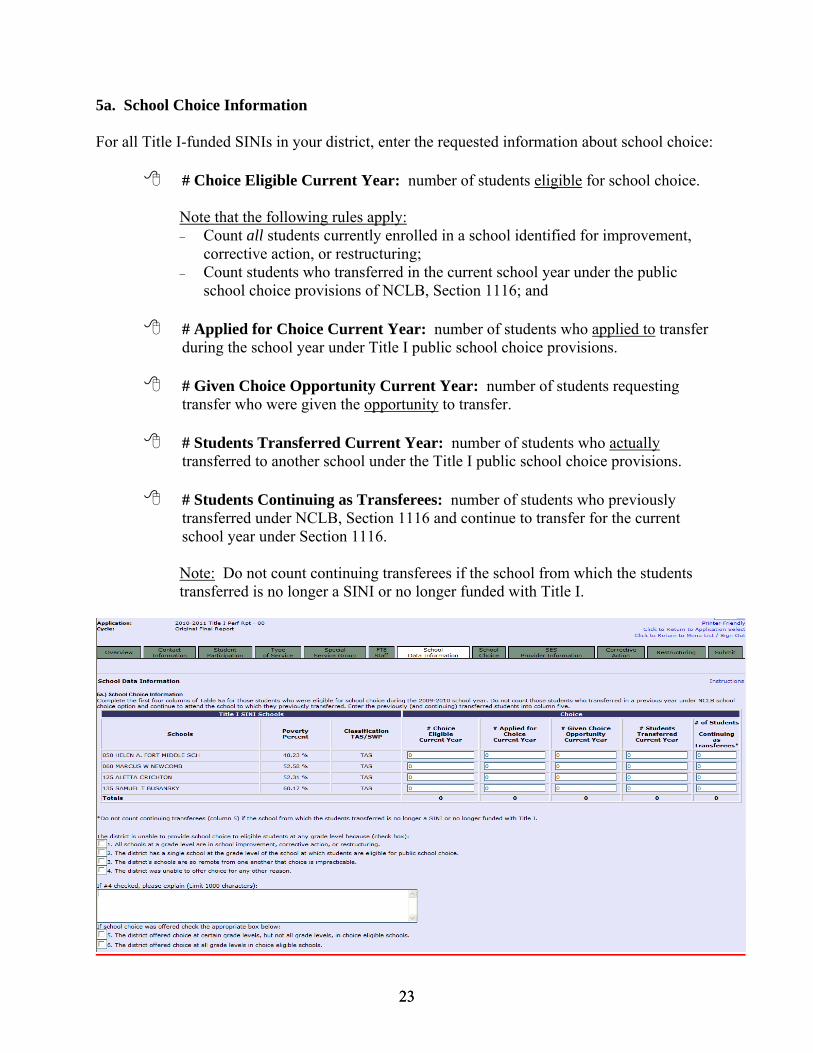
5a. School Choice Information For all Title I-funded SINIs in your district, enter the requested information about school choice:
# Choice Eligible Current Year: number of students eligible for school choice.
Note that the following rules apply: Count all students currently enrolled in a school identified for improvement,
corrective action, or restructuring; Count students who transferred in the current school year under the public
school choice provisions of NCLB, Section 1116; and
# Applied for Choice Current Year: number of students who applied to transfer during the school year under Title I public school choice provisions.
# Given Choice Opportunity Current Year: number of students requesting
transfer who were given the opportunity to transfer. # Students Transferred Current Year: number of students who actually
transferred to another school under the Title I public school choice provisions. # Students Continuing as Transferees: number of students who previously
transferred under NCLB, Section 1116 and continue to transfer for the current school year under Section 1116.
Note: Do not count continuing transferees if the school from which the students transferred is no longer a SINI or no longer funded with Title I.
24 24
Note: The numbers in the choice columns 2 through 4 must not be larger than the numbers in the preceding columns. There may not be more students applying for choice, given the opportunity, or actually transferring than are eligible for choice, etc. Edits built into the system will produce an error message if this happens. If school choice is not offered, check off one of the three items listed below the table. If
items 1-3 do not apply, check off #4 and provide an explanation in the text box. Note: If an explanation is required and not provided, an error message will appear.
If school choice was offered, complete items 5 and 6.

25 25
5b. SES Information Enter SES data for eligible Title I students from schools in need of improvement, corrective action, or restructuring:
# Eligible for SES: number of students who were eligible for supplemental educational services (SES).
# Applied for SES: number of students who applied for SES. # Given SES Opportunity: number of students who applied that were given the
opportunity to choose an SES provider. # Received SES: number of students who actually enrolled in and participated in at
least 80% of the scheduled SES sessions.
Note: The numbers in the first SES column must be larger than (or equal to) the numbers in the next three SES columns. There may not be more students applying for, given the opportunity, or receiving SES than are eligible for SES. Edits built into the system will produce an error message if this happens. Complete the list of items A – D following the table. Transportation costs apply only to
those students who transferred as a result of the School Choice option (# Students Transferred in Table 5a).

26 26
If applicable, items A-C may require zeros to be entered otherwise the system will generate an error message.
If SES was not offered, provide an explanation in the text box. Note: If an explanation is required and not provided, an error message will appear.
Click the Calculate button, then click the Save button.

27 27
Tab 8: School Choice *Only districts with Title I SINIs must complete these school choice tables.* Clicking on the School Choice tab will open up the first of two subtabs labeled Intradistrict School Choice and Interdistrict School Choice. Purpose: The purpose of these tables is to collect the number of students who transferred to another school within the district (intradistrict) and/or to a school in another district (interdistrict) as a result of participation in the Title I school choice option.
6a. Intradistrict School Choice Screen
On the Intradistrict School Choice table (see screen above), all non-SINIs in the district are listed. Provide the number of students who transferred into each of these non-SINIs during the 2010-2011 school year as a result of the school choice option. Count new transferees and those students who previously transferred and continue at the choice school, providing the school from which they transferred is still a SINI and funded with Title I.
After data are entered, click the Calculate button, then click the Save button.

28 28
6b. Interdistrict School Choice Screen Do not include students who transferred to another school district because of the following reasons:
― Were special education students in out-of-district placement. ― Were in another district as a result of a change in residence. ― Transferred as a result of being in a school identified as persistently dangerous. ― Participated in the non-Title I Interdistrict Public School Choice program.
The district must complete the Interdistrict School Choice table if any students transferred into schools in other districts during the 2010-2011 school year as a result of exercising the Title I school choice option in a SINI. Count new transferees and those students who previously transferred and continue at the choice school, providing the school from which they transferred is still a SINI and funded with Title I. The table is designed to allow the selection of the district and school from drop-down lists.
Receiving County Name: Select the county of the district that received the student. The page will refresh.
Receiving School District Code: Select the school district code of the district that received the student. The page will refresh.
Receiving School Codes and School Names: Select the receiving school. The page will refresh.
Number of Students: Enter the number of students who transferred to the receiving school as a result of the school choice option.
To add extra rows, click on the Add Line button. Click the Calculate button, then click the Save button. To delete a row, click on the radio button in the last column for that row after
you click on the Calculate button. When the data are saved, the checked row will be deleted.

29 29

30 30
Tab 9: SES Provider Information *Only districts with Title I SINIs must complete this table.*
Purpose: The purpose of the SES screens is to collect data about the SES providers that served students in your district. Provide information about each SES provider that served students in your district during the 2010-2011 school year.
Select the appropriate SES provider from the drop-down list in the second column.
Enter the requested student information in the next three columns. Note: The
last column should provide the number of students who met or exceeded their goals as reported by the SES providers.
Click the Save button. (If you have not saved the data, you may lose some
entries and you will not be able to proceed to the survey.) Additional rows may be added if necessary by clicking on the Add Lines
button. If new rows are added, complete all columns and click the Save button to preserve the entered data. After saving the data, proceed to the survey questions (see below).
Click on the radio button in the first column to select a provider row. (More
detail about completing the survey is provided in the next section of this guide.) Click on the View/Edit button and complete the survey for that selected
provider. You must complete all survey items or entries will be lost when the page is saved.

31 31
Click the Save button, then click the Close Detail button to return to the SES
provider list. Complete a row and survey for each provider. If a provider was entered by mistake, put a check in the Delete Row column,
then click the Save button. The row will delete. If you revise your counts after you have saved your entries, you may recalculate
by clicking the Calculate button. Then click the Save button again. Note: Values entered in the last two data columns must be equal to or less than “# of Students Served” or you will receive an error message when the Save button is clicked. Note: The total number of students served must equal the total number of students who received SES identified in Table 5b. Provider Surveys You must complete a provider survey for each SES provider on your list.
Select the radio button for the first provider and click on the View/Edit button at the bottom of the screen. (You must have calculated and saved the entered provider data to see this screen). If you do not click on a radio button to select a provider before you click the View/Edit button, you will receive an error message.
Answer the 14 questions about the provider in the first survey table by checking
either “Yes,” “No,” or “N/A.” You must complete all survey items, or entries will be lost when the page is saved.
Answer the six questions in the second survey table by checking either “Yes” or
“No.” Click the Save button, then click the Close Detail button to go back to your SES
provider list. (Note: If you do not complete all items, you will receive an error message.)
Repeat this process for each provider on your list by selecting the other radio
buttons, then clicking on the View/Edit button. Follow the steps listed above.

32 32
33 33
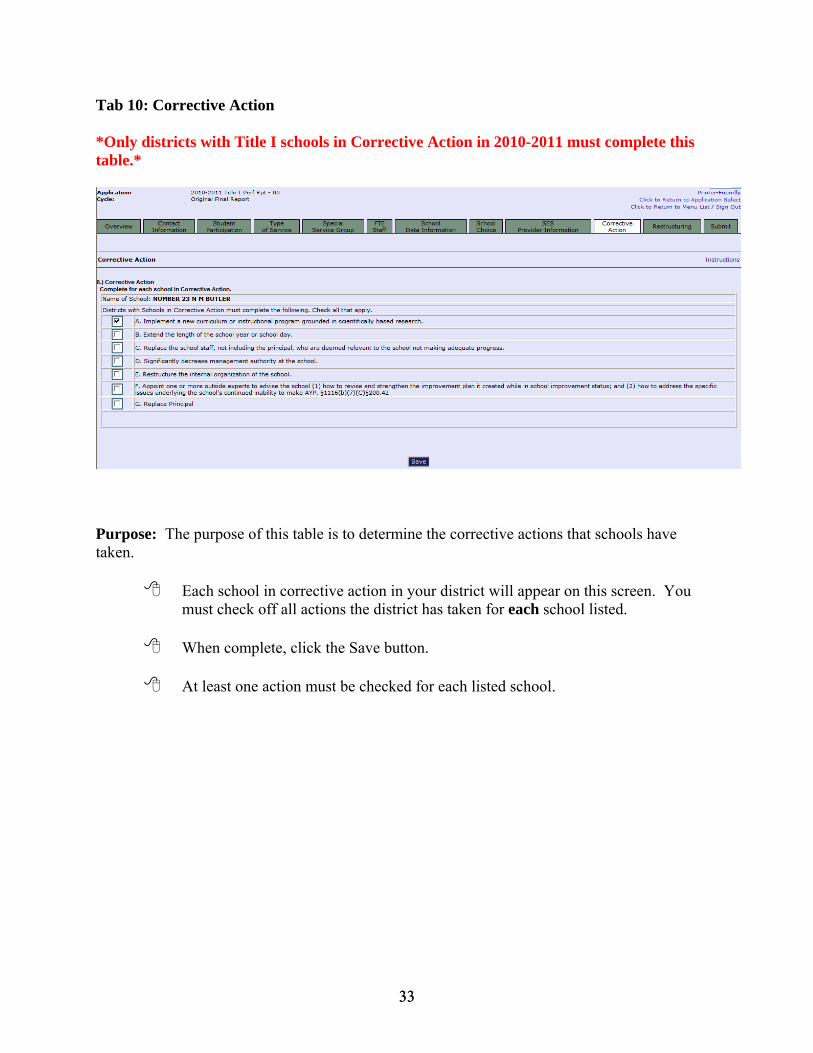
Tab 10: Corrective Action *Only districts with Title I schools in Corrective Action in 2010-2011 must complete this table.*
Purpose: The purpose of this table is to determine the corrective actions that schools have taken.
Each school in corrective action in your district will appear on this screen. You must check off all actions the district has taken for each school listed.
When complete, click the Save button.
At least one action must be checked for each listed school.

34 34
Tab 11: Restructuring *Only districts with Title I schools in Restructuring in 2010-2011 must complete this table.*
Purpose: The purpose of this table is to determine the restructuring actions that schools have taken.
Each school in restructuring in your district will appear on this screen. You must check off all actions the district has taken for each school listed.
When complete, click the Save button.
At least one action must be checked for each listed school.
If action A is checked, explain in the text box the nature of the school governance
restructuring. Note: If text is not entered, an error message will appear.

35 35
Tab 11: Submit When all screens are completed, click the Submit button to submit your Title I performance data for 2010-2011. The EWEG system will prompt you to initiate a consistency check to ensure that all required screens have been completed. The system will also cross check the values entered into various tables. If more information or revisions are required, you will receive an error message. Once the consistency check is successfully completed, click the Submit to NJDOE button.
S:\Title I Performance Report\Performance Report 2010-2011\Title I Perf Instruction Manual 2010-2011.doc