Embed Size (px)
Citation preview
AN ABSTRACT OF THE THESIS OF
Pierre Rolland Ngaba-Mbiakop for the degree of Doctor of Philosophy
in Food Science and Technology presented on
Title: INVESTIGATION OF METHODS FOR DETERMINATION AND PREVENTION OF
PROTEIN INSTABILITY IN WINES.
Abstract APPROVED: Dr. David A. Heatherbell
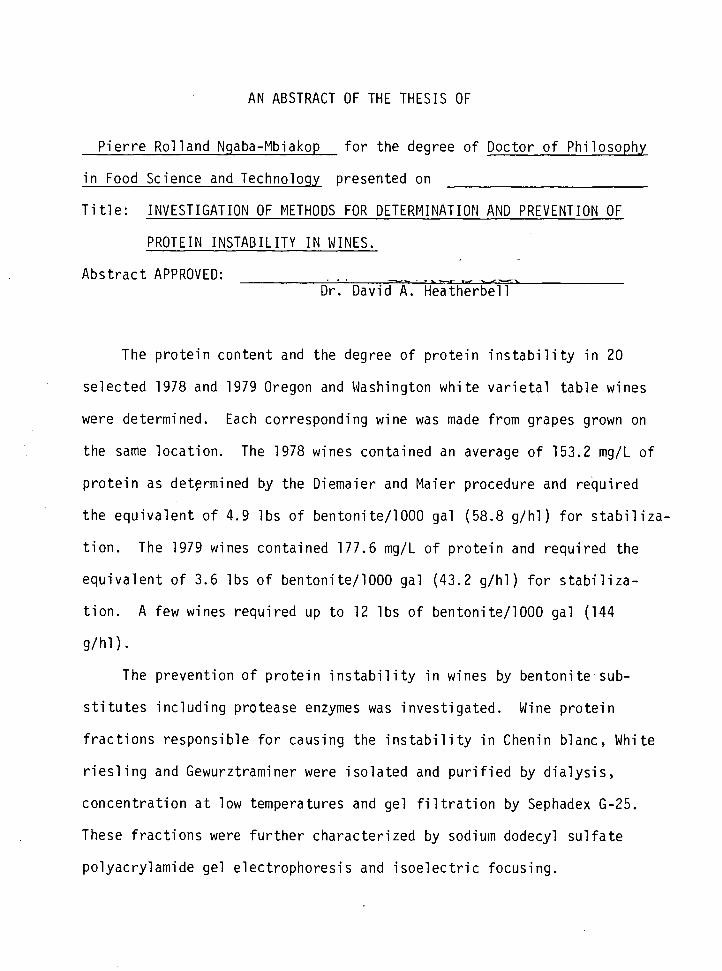
The protein content and the degree of protein instability in 20
selected 1978 and 1979 Oregon and Washington white varietal table wines
were determined. Each corresponding wine was made from grapes grown on
the same location. The 1978 wines contained an average of 153.2 mg/L of
protein as determined by the Diemaier and Maier procedure and required
the equivalent of 4.9 lbs of bentonite/1000 gal (58.8 g/hl) for stabiliza-
tion. The 1979 wines contained 177.6 mg/L of protein and required the
equivalent of 3.6 lbs of bentonite/1000 gal (43.2 g/hl) for stabiliza-
tion. A few wines required up to 12 lbs of bentonite/1000 gal (144
g/hl).
The prevention of protein instability in wines by bentonite sub-
stitutes including protease enzymes was investigated. Wine protein
fractions responsible for causing the instability in Chenin blanc, White
riesling and Gewurztraminer were isolated and purified by dialysis,
concentration at low temperatures and gel filtration by Sephadex G-25.
These fractions were further characterized by sodium dodecyl sulfate
polyacrylamide gel electrophoresis and isoelectric focusing.
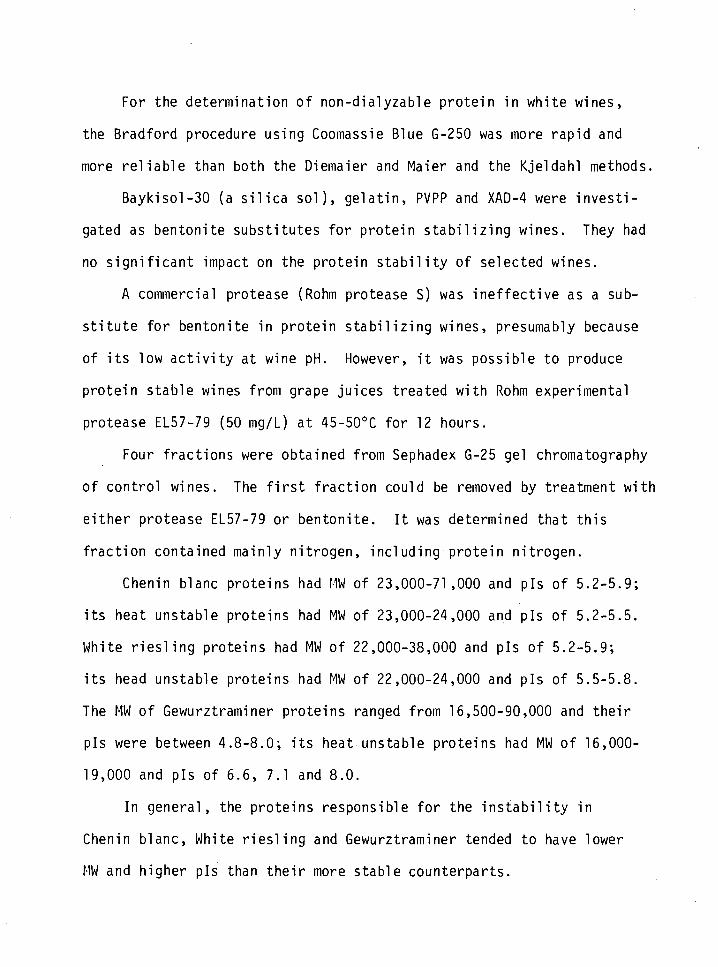
For the determination of non-dialyzable protein in white wines,
the Bradford procedure using Coomassie Blue G-250 was more rapid and
more reliable than both the Diemaier and Maier and the Kjeldahl methods.
Baykisol-30 (a silica sol), gelatin, PVPP and XAD-4 were investi-
gated as bentonite substitutes for protein stabilizing wines. They had
no significant impact on the protein stability of selected wines.
A commercial protease (Rohm protease S) was ineffective as a sub-
stitute for bentonite in protein stabilizing wines, presumably because
of its low activity at wine pH. However, it was possible to produce
protein stable wines from grape juices treated with Rohm experimental
protease EL57-79 (50 mg/L) at 45-50oC for 12 hours.
Four fractions were obtained from Sephadex G-25 gel chromatography
of control wines. The first fraction could be removed by treatment with
either protease EL57-79 or bentonite. It was determined that this
fraction contained mainly nitrogen, including protein nitrogen.
Chenin blanc proteins had MW of 23,000-71,000 and pis of 5.2-5.9;
its heat unstable proteins had MW of 23,000-24,000 and pis of 5.2-5.5.
White riesling proteins had MW of 22,000-38,000 and pis of 5.2-5.9;
its head unstable proteins had MW of 22,000-24,000 and pis of 5.5-5.8.
The MW of Gewurztraminer proteins ranged from 16,500-90,000 and their
pis were between 4.8-8.0; its heat unstable proteins had MW of 16,000-
19,000 and pis of 6.6, 7.1 and 8.0.
In general, the proteins responsible for the instability in
Chenin blanc. White riesling and Gewurztraminer tended to have lower
MW and higher pis than their more stable counterparts.
Investigation of Methods for Determination and Prevention of Protein Instability in Wines
by
Pierre Rolland Ngaba-Mbiakop
A THESIS
submitted to
Oregon State University
in partial fulfillment of the requirements for the
degree of
Doctor of Philosophy
Completed April 1981
Commencement June 1981
APPROVED:
Associate Professor of Food Science and Technology in charge of major
p Head of Department of Food Scfence and Technology
Dean of Graduate School t
Date thesis is presented April 8, 1981
Typed by Sue Hecht for Pierre Roiland Ngaba-Mbiakop
ACKNOWLEDGEMENTS
The author wishes to express his appreciation to Dr. D. A.
Heatherbell, without whom this project would not have materialized.
Special thanks are extended to Barney T. Watson for his sug-
gestions, Liz Dodd for her encouragement and help with some of the
routine analyses of wine, and to Richard Sandstrom for his help in run-
ning the isoelectric focusing.
The author is grateful to the faculty of the Department of Food
Science and Technology, especially Dr. P. E. Kifer, Dr. A. F. Anglemier
and Dr. M. W. Montgomery for their help during his time at Oregon State
University.
Special gratitude goes to the author's wife, Regine for her support
and understanding throughout this study.
Finally, the author wishes to thank the following organizations for
their partial financial support of this study: The Pacific Northwest
Regional Commission Grant (Tri-State Wine Grape Demonstration Project),
Vancouver, Washington; Rohm, Gmbh, Darmstadt, West Germany; and the
African-American Institute, New York, New York.
TABLE OF CONTENTS
INTRODUCTION
Pa^e
1
4 LITERATURE REVIEW
Introduction to Protein Instability in Wines ^
Why the Concern about Protein Instability? 4
Beverages Susceptible to Protein Instability ^
Description of Wine Proteins 5
Origin and Concentration of Proteins in Wines *>
Origin of Wine Proteins 6
Concentration of Proteins in Wines 6
Composition of Wine "Protein" Haze 7
Factors Affecting the Stability of Wine Proteins 7
Extrinsic Factors 7
Intrinsic Factors 8
Mechanism of Haze Formation 9
Protein Stability Tests 10
Heat and Cold Tests TO
Trichloroacetic Acid (TCA) Test 11
Bentotest H
Microkjeldahl Test 12
Methods of Haze Prevention in Wines 12
Heat Treatment 12
Tannin-Gelatin Fining 13
Bentonite Fining 14
Page
i R Enzyme Treatment '
Other Methods 16
Protein Determination Methods in Wines
Kjel da hi Method 18
Voit Method 18
1 g Diemaier and Maier Method
Gel Filtration Method 19
Other Methods 19
Purification of Wine Proteins
The Problem of Beer "Chill-Haze"
Description of Beer "Chill-Haze"
Use of Fining Agents in Beer
The Use of Proteases to Prevent Beer "Chill-Haze"
Dye Release Method for Protease Assay
MATERIALS AND METHODS 23
Grapes and Wines 23
Protease Enzymes co
Source of the Proteases 23
Protease Treatment of Juice ^
Protease Treatment of Wine
Fermentation 24
Effect of Protease on Fermentation "
Fermentation Rate "
Chemical Composition of Wines ^
20
20
20
21
21
Page
Wine Fining with Bentonite Substitutes 26
Baykisol-30 26
Gelatin 26
Proteases 26
PVPP and XAD-4 26
Protein Stability Tests 27
Heat and Cold Stability Tests 27
Bentotest 27
Use of Hunter Color/Difference Meter to Measure Wine "Protein" Haze - 27
Protein Determination Methods 28
Modified Diemaier and Maier Method 28
Bradford (Bio-Rad) Method 28
Modified Kjeldahl Method 29
Removal of Wine Phenolics with PVPP and XAD-4 29
Purification of Wine Proteins 30
Dialysis 30
Vacuum Concentration 30
Gel Filtration 30
Electrophoresis 31
Polyacrylamide Gel Electrophoresis 31
Sodium Dodecyl Sulfate Polyacrylamide Gel Electrophoresis 32
Isoelectric Focusing 33
Page
Characterization of Protease Enzymes 34
Preliminary Protease Assay 34
Effect of pH on the Activity of Proteases S and EL57-79 35
Effect of Temperature on the Activity of Protease EL57-79 35
Effect of Concentration on the Activity of Protease EL57-79 35
Heat Stability of Protease EL57-79 36
Effect of Sulfur Dioxide on the Activity of Protease EL57-79 36
Effect of Alcohol on the Activity of Protease EL57-79 36
RESULTS AND DISCUSSION 37
Survey of Selected 1978 and 1979 Oregon and Washington Wines 37
Comparison Between Bentotest, the 50oC and the 80oC Heat and Cold Tests 40
An Objective Method for the Measurement of Wine "Protein" Haze 42
A Comparison of Three Protein Determination Methods 42
White Varietal. Table Wines 45
Red Varietal Table Wines 48
Effect of Bentonite Substitutes on Wine Protein Stability 50
Baykisol-30, Gelatin, PVPP and XAD-4 50
Proteases S and EL57-79 51
Characterization of Proteases S and EL57-79 55
Effect of pH on the Activity of Proteases S and EL57-79 55
Heat Stability of Protease EL57-79 55
Page
Effect of Temperature on the Activity of Protease EL57-79 58
Effect of Enzyme Concentration on the Activity of Protease EL57-79 58
Effect of Sulfur Dioxide on the Activity of Protease EL57-79 62
Effect of Alcohol on the Activity of Protease EL57-79 62
Effect of Protease EL57-79 on Fermentation 65
Fermentation Rate 65
Chemical Composition of Wines 65
UV Profile of a Control and a Protease-Treated Wine 68
Electrophoretic Analysis of Juice and Wine Proteins 70
Chenin blanc (877) 70
White Riesling (946) 73
Gewurztraminer (80) 73
Effect of Bentonite Concentration on Wine Protein Fractions 79
Isoelectric Focusing of Wine Proteins 81
SUMMARY 85
BIBLIOGRAPHY 88
LIST OF FIGURES
FIGURE PAGE
1. Effect of bentonite concentration on wine Hunter haze value. 44
2. Effect of pH on the activity of Protease EL57-79. 56
3. Effect of pH on the activity of commercial protease S. 57
4. Heat stability of protease EL57-79 at pH 3.5. 59
5. Effect of temperature on the activity of protease EL57-79. 60
6. Effect of concentration on the activity of protease EL57-79. 61
7. Effect of sulfur dioxide on the activity of protease EL57-79. 63
8. Effect of Alcohol on the activity of protease EL57-79. 64
9. Effect of heat or protease treatment on the fermentation rate. 66
10. UV profiles of a control and a protease-treated wine. 69
11. Electrophoretic patterns of Chenin blanc (877). 71
12. Electrophoretic patterns of White riesling (946). 74
13. Electrophoretic patterns of Gewurztraminer (80). 76
LIST OF TABLES
TABLE PAGE
1. Survey of 1978 Oregon and Washington white varietal table wines. 38
2. Survey of 1979 Oregon and Washington white varietal table wines. 39
3. Comparison between Bentotest, 80oC, and 50oC heat tests. 41
4. Determination of the amount of wine "protein" haze by Hunter Color/Difference Meter. 43
5. Protein content of selected white varietal table wines determined by the Bradford, the Diemaier and Maier and the Kjeldahl procedures. 46
6. Protein content of dialysed white varietal table wines determined by the Bradford, the Diemaier and Maier and the Kjeldahl procedures. 47
7. Comparison of the Bradford, Diemaier and Maier and Kjeldahl procedures for the determination of protein in selected red varietal table wines. 49
8. Effect of protease EL57-79 concentration on the protein stability of 1980 Gewurztraminer juice. 53
9. Effect of Protease EL57-79 treatment of grape juice on the protein stability of corresponding wines. 54
10. Chemical composition of wines made from heat or protease- treated grape juice. 67
11. Effect of heat, protease or bentonite treatment on the protein fractions of Chenin blanc (877) juices and wines. 72
12. Effect of heat, protease or bentonite treatment on the protein fractions of White riesling (946) juices and wines. 75
13. Effect of heat, protease or bentonite treatment on the protein fractions of Gewurztraminer (80) juices and wines. 77
TABLE PAGE
14. Effect of increasing bentonite concentrations on the protein fractions of Chenin blanc. White riesling and Gewurztraminer. 80
15. Isoelectric points of the protein fractions in Chenin blanc, White riesling and Gewurztraminer. 83
INVESTIGATION OF METHODS FOR DETERMINATION AND PREVENTION OF PROTEIN INSTABILITY IN WINES
INTRODUCTION
Clarity is one of the major characteristics that influence consumer
acceptance of wine. Among the substances contained in white wines,
proteins are of special concern to the winemaker. Under favorable con-
ditions, wine proteins can associate with phenolics and metal ions to
fomi insoluble complexes which may come out of solution, When this oc-
curs and a visible haze or amorphous deposit appears, the wine is clas-
sified as protein unstable and is, therefore, unacceptable for sale
(Moretti and Berg, 1965). The occurence of haze suggests that the wine
requires additional treatment.
There are methods currently available to prevent protein instability
in wines. The most commonly used methods include: the application of
heat and bentonite fining. However, these methods do not always yield
the desired results (Datounachvilli, 1970). For instance, heat treatment
of wine is undesirable because it may cause damage to its aroma (Ferenczy,
1966; Singleton, 1974). Therefore, it is seldom applied to premium
quality wines. Bentonite fining is the international method of choice
for stabilizing wines. Unfortunately, it has disadvantages such as
extraction of color, the costly loss of wine in the lees (Singleton,
1974), its earthy flavor which can be imparted to wine, if used in
excessive amounts (Sheat and Discombe, 1976) and gross alterations in
wine constituents including reduction in volatiles which contribute
to the taste and aroma of wines (Hartmaier, 1979; Ough et^ al_., 1979).
2
In addition, bentonite is difficult to rehydrate and may sometimes be
used improperly. Consequently, there is international interest in the
discovery of suitable substitutes to bentonite fining (Singleton, 1974).
In a review on protein instability Singleton (1974) recommended
that further research be conducted on the problem of protein instability,
particularly that another look be given to the use of enzymes in wines.
The use of enzyme preparations to hydrolyze proteins would eliminate the
problem of overfining and some of the problems inherent with the use of
bentonite (Datounachvilli, 1970; Rankine and Pocock, 1971).
Furthermore, even though considerable research has been conducted
on wine proteins, current methods of protein determination in wines are
either time consuming or unreliable (Amerine and Ough, 1980). This led
to the recommendation that several methods be used on the same wine and
that results be compared (Cordonnier, 1966).
To date, little is known about why some proteins are stable in
wines, whereas others are not. Therefore, more information is needed on
which wine proteins fractions are troublesome.
Although there is an on-going program at Oregon State University
for screening Pacific Northwest (PNW) wines for their protein instability
(Watson et_ al_., 1980), there is no information in the literature on the
protein content, the use of bentonite substitutes, and the characteriza-
tion of protein fractions present in wines produced in the PNW (Idaho,
Oregon, Washington) region of the United States of America. Therefore,
it seemed desirable that an investigation should be carried out on these
wines to clarify the situation.
3
This investigation was carried out to:
1. Screen selected Oregon and Washington wines for their protein
concentration and the degree of their protein instability.
2. Compare three of the methods of detecting protein instability
(50oC and 80oC heat and cold tests and the Bentotest).
3. Find an objective method to measure wine "protein" haze.
4. Find an alternative method for protein determination in wine
that would be more rapid and reliable than current methods.
5. Test the feasibility of using two enzymes, one commercial,
protease S, and one experimental, protease EL57-79 from Rohm Gmbh,
Darmstadt, West Germany, to prevent protein instability in wines.
6. To characterize the activity of the above enzymes.
7. To isolate and characterize the individual protein fractions
which are responsible for the protein instability in wines.
LITERATURE REVIEW
Introduction to Protein Instability in Wines
Why the Concern About Protein Instability?
Clarity is one of the chief characteristics of wines that the con-
sumer appreciates. Therefore, it is imperative that wines remain
brilliant. Among the numerous substances contained in wine, nitrogenous
compounds, particularly proteins are of major concern to the winemaker
since they can become insoluble forming hazes and precipitates. The
appearance of a haze or deposit indicates that the wine is defective and,
therefore, unacceptable for sale. When this occurs during processing
it causes delays, but when it occurs at the market place it causes
economic losses.
Beverages Susceptible to Protein Instability
It is generally recognized that only beverages with low poly-
phenol content (i.e. white wines and non-alcoholic white and red grape
juices) or beverages over-fined with gelatin are subject to proteinaceous
haze formation (Rentschler, 1969; Singleton, 1974). Red wines contain
large amounts of phenolics which tend to insolubilize protein and elimi-
nate them in the lees during vinification (Ribereau-Gayon et aj_, 1976).
This review will limit itself to the problem of protein instability in
white table wines.
It has been noted that proteins act as deposition centers for many
cations. The proteins can bind to ferric phosphate leading to sediments
5
or suspensions. In addition to proteins and metals, peptides and
phenolics also play a role in the formation of haze.
Despite the vast amount of literature on protein instability in
wines, the actual protein level at which a wine may be considered stable
is not known (Anelli, 1977). The particular protein fractions which
tend to precipitate out are also not known. There are conflicting
reports in the literature on this subject (Moretti and Berg, 1965; Bayly
and Berg, 1967). It has been suggested that it is not the total amount
of protein in wines, but only a part of the protein mixture or the ratio
of various protein fractions that determines the stability of a wine.
According to Danilatos and Sotiropoulos (1968), wines which contain less
than 10 mg/L of protein may be considered stable. However, wines with
higher concentrations of protein have also been reported to be stable
(Singleton, 1974). Therefore, protein instability remains a potential
problem to the winemaker since there are no qualitative tests for the
detection of unstable proteins.
Description of Wine Proteins
Wine proteins are globular proteins, mainly albumins (Hennig,
1970). Many of the albumins are water soluble and form colloids; some
are soluble in salt solutions and others are completely insoluble. In
wine, the only albumins present are those which, in colloidal solution,
cannot be precipitated by a 10% (v/v) solution of alcohol
(Hennig, 1970).
There is a considerable variation in the MW of wine proteins; they
have been reported to range anywhere from MW of 8,000-150,000
6
(Moretti and Berg, 1965; Tarantolo, 1971; Feuillat and Bergeret, 1972;
Somers and Ziemelis, 1973a; Singleton, 1974).
Origin and Concentration of Proteins in Mines
Origin of Wine Proteins
Bayly and Berg (1967) carried out an extensive study of protein
fractions in varietal white grape juices and wines. They concluded that
the critical proteins originate in the grape and that the fermentation
process apparently does not contribute any protein to the medium. The
same conclusion was reached by Feuillat and Bergeret (1972) who found
the same protein fractions in corresponding musts and wines.
In contrast, Moretti and Berg (1965) reported that wines generally
have more protein than the juices from which they are made. They pro-
posed that the additional protein is released by the yeast during fermen-
tation. However, it has been-shown that it is only when wine spends a
long time on its fermentation lees that there is a significant contribu-
tion to wine proteins from the yeast (Poux et al_., 1964; Tercel j, 1965;
Sheat and Discombe, 1976).
Concentration of Proteins in Wines
The amount of protein in grape juices and wines is very variable
and depends on several factors. Some of these factors are grape variety,
nutritional status, conditions of maturation, time of harvest, season
and region (Tarantola, 1971). For example, more protein is found in
wines from warmer seasons (Tarantola, 1971; Thoukis, 1974; Sheat and
Discombe, 1976). Also, rotten grapes which have lost a great deal of
their sugar, yield a wine with an abnormally high nitrogen content
(Genevois and Ribereau-Gayon, 1936). But, in general, the level of
protein in wine is low; it has been estimated to be 3.0-14.7 mg/L
(Anelli, 1977), 7-23 mg/L (Hennig, 1970), and 180 mg/L (Rentchler,
1969). However, much higher values are not uncommon (Singleton, 1974).
Composition of Wine "Protein" Haze
The material that constitutes "protein" haze has been isolated and
analysed. The residue obtained after precipitation with acids and
drying is composed of nitrogen including protein nitrogen, phenolics,
polysaccharides and minerals. In general, the percentage of the above
components is variable. Ribereau-Gayon et aj_. (1976) reported that
"protein" haze contained 5-12% of nitrogen (of which 50-80% is protein),
1-15% of ash, the remainder being divided between adsorbed phenolics (2-
5%) and polysaccharides (12-14%) which, upon hydrolysis, yield reducing
sugars. Higher proportions of the protein component (40-50%) have been
reported by Moretti and Berg (1965) and Usseglio-Tomasset (1978).
Factors Affecting the Stability of Wine Proteins
The phenomenon of protein precipitation from wine is complex and is
affected by several factors, both extrinsic and intrinsic.
Extrinsic Factors
Among the extrinsic factors, temperature and added gelatin are the
most important. In handling wines, one must be careful in controlling
8
the temperature. If bottled wines are subjected to a sudden increase in
temperature, above 250C for example (as may happen during transpor-
tation) followed by cooling down to refrigeration temperature, the
proteins can floculate out as a haze or precipitate.
Gelatin is sometimes used as a fining agent in the wine industry.
However, it is possible to "overfine" wines with added gelatin, such
that the wine is less protein stable owing to residual gelatin in the
wine (Singleton, 1974).
Intrinsic Factors
The nature of wine proteins, pH and isoelectric point (pi), and the
type and concentration of phenolics are among the intrinsic factors that
affect the stability of proteins in wine. Excessive total concentration
of protein is not the usual source of protein instability in wine, as
unstable wines have been found to have low protein content; conversely
wines with fairly high protein content have been found to be stable
under practical conditions (Singleton, 1974; Ribereau-Gayon, 1976).
Wine phenolics contribute to "protein" haze, in that they may
oxidize and polymerize into tannins which are capable of addition reac-
tions with the amines and sulfhydric groups of proteins (Singleton,
1974).
The pH and pi of a wine can affect its stability. It has been
shown that wines with a pH close to 3.0 are more likely to be heat stable
than wines of higher pH value (Moretti and Berg, 1965; Bayly and Berg,
1967). However, it should be recognized that a high pH wine is not
necessarily protein unstable (i.e. some wines with pH values ranging from
9
3.33-3.75 have been found to be protein stable) (Moretti and Berg,
1965).
The pi of proteins from various wines have been reported to fall in
the range of 3.3-3.7 and are very close to the pH of the wines. In
general, the wine protein which precipitates first is likely to be the
largest, most denatured, and nearest to its pi. Its precipitation may
be induced by metals or oxidized phenolics (Singleton, 1974).
Mechanisms of Haze Formation in Wine
The various colloids of wine react to form "protein" haze. Two
mechanisms have been proposed to account for these reactions. The first
mechanism is based on electrical charge. In wine, proteins exist in
solution as positively charged particles of colloidal size whereas
tannins are negatively charged. It is proposed that the positive
charge of the proteins is neutralized by the negative charge of the
tannins, resulting in the formation of a complex which floculates and
forms a haze (Ferenczy, 1966; Somers and Ziemelis, 1973a; Thoukis,
1974). The second mechanism involves reactions between molecules such
as the interaction between phenolic hydroxyl groups and basic ami no
acids, and residues of proteins in salt linkages. It is proposed that
hydropholic interactions between the aromatic ring structures of
phenolics and hydrophobic regions of proteins are also involved (Loomis,
1974).
10
Protein Stability Tests
To prevent commercial rejection of wines, the winemaker used
empirical tests to determine the amount of fining agent or agents that
are required to protein stabilize each wine. The tests most often
employed include: the heat and cold tests, the trichloroacetic acid
(TCA) test, the bentotest or the Microkjeldahl test.
Heat and Cold Tests
The heat and cold tests are probably most comparable to the even-
tual effects of storage on bottled wine. The main disadvantage is that
they tend to be slow. A test for protein stability recommended by
Berg and Akiyoshi (1965) for Californian wines consists of holding
wines at elevated temperatures (usually 50oC) for 48 hrs; then examining
the wine for haze in a strong beam of parallel light. This is followed
by storage at room temperature for 24 hrs, then by storage at low temp-
erature for 48 hrs and another examination of the wine for up to
24 hours. The test takes six days to complete. The wine is classified
as unstable if a visible haze or amorphous deposit appears as a result
of the treatment. A nephelometer can also be used to measure the haze
in place of visual observation.
The heat test is based on the assumption that storage at elevated
temperatures for two days will correlate with behavior at ambiant
temperatures for a longer period. Past experience shows this assumption
to be generally true (Moretti and Berg, 1967).
11
Variations of the heat test are available, which require less time
to complete. For example, larger California wineries heat wine for 2
days at 490C followed by storage at room temperature for 24 hrs (Berg
and Akiyoshi, 1961), whereas Australian wineries use an 80oC test which
involves heating the wine for six hrs followed by cooling in a refrig-
erator at 4°C overnight (Pockock and Rankine, 1973). In a comparison
between the 50oC and the 80oC heat tests on Australian wines, the latter
was found to be less sensitive than the former (Pocock and Rankine,
1973). Other combinations of time and temperature have been reported,
but none has been found to be as satisfactory as the 50oC or the 80oC
(Pocock and Rankine, 1973).
Trichloroacetic Acid (TCA) Test
The TCA test consists of adding one ml of a 55% TCA solution to 10
ml of wine, followed by heating (2 min) in boiling water and a reaction
period of 15 min at room temperature. However, the amount of haze
formed does not always correlate with protein stability as measured by
the heat and cold tests. The presence of unstable substances other than
protein apparently does not affect the test (Berg and Akiyoshi, 1961).
Bentotest
The bentotest reagent consists of a solution of phosphomolybdic
acid in HC1. It precipitates the protein in the wine by neutralizing
the charge on the protein molecules and also aggregates them by cross-
linking with the heavy molybdenum ion. In general, the bentotest tends
to be more sensitive than the heat test and may lead to overfining
(Pocock and Rankine, 1973).
12
Microkjeldahl Test
This test consists of determining the protein content of a filtered
wine according to the procedure devised by Kean (1956). It involves
the. determination of total nitrogen by Microkjeldahl following vacuum
concentration of the wine and precipitation of the protein with 25%
TCA. Wines are considered stable if their protein content is below a
certain value. Although described as satisfactory, this test is seldom
used because it is time consuming and the amount of protein seldom
correlates with stability (Berg and Akiyoshi, 1961).
Methods of Haze Prevention in Wines
Theoretically, there are four main ways that wines can be rendered
protein stable. They include: heat treatment (e.g. bentonite) and
treatment by protease. The latter method is not commercial practice at
this time due to the lack of adequate proteases.
Heat Treatment
Heat treatment of a juice or wine can produce practical stability
to protein haze while some protein still remains in solution. This is
because unstable wine proteins are ordinarily rendered insoluble by
higher temperature; unstable wine proteins have been found to coagulate
between 60-75oC (Singleton, 1974). At this temperature the globular
protein molecule unfolds, becomes more extended, denatured until it
precipitates out. The temperature and the holding time of heat treat-
ment vary. Flash pasteurization of the juice is usually carried out at
13
870C for 2 minutes. It removes unstable wine proteins while also
achieving biological stabilization and is preferable to heating the
wine itself.
Other forms of thermal treatment of wines have been reported.
(Ferenczy, 1966). They include: (1) holding the wine at 30oC for
several months; (2) 40oC for 30 min; or (3) 70oC for 30 minutes.
They are aimed at modifying the proteins enough to cause their
precipitation prior to bottling the wine. Unfortunately, heating any
wine for a substantial length of time is not recommended since it
causes damage to its flavor, not to mention the potential problem of
microbial spoilage. In general, heat treatment is not a widely used
means of achieving protein stability in quality wines since it adversely
modifies wine flavor.
Tannin-Gelatin Fining
Tannin and gelatin (15-120 mg/L each) were the most common fining
agents in California in the pre-Prohibition era (Amerine et al_., 1979).
Gelatin micelles are positively charged while tannin particles are
usually negatively charged. When they are mixed, they neutralize each
other, causing their rapid precipitation and co-precipitation of wine
proteins. The reaction is affected by temperature, pH, aeration, metals
and previous treatment of the wine. The danger of overfining which
causes persistent cloudiness is the reason that wines are seldom fined
by this method now (Amerine et^ aK, 1979).
.14
Bentonite Fining
Bentonite fining is the international method of choice for fining
wines. Bentonite is a naturally occuring, hydrated aluminum silicate
clay consisting of montmorillonite and minerals (i.e. Mg, Fe, Ca, Na,
etc.). It is odorless, hygroscoric and has a slight earthy taste (Sheat
and Discombe, 1976). In solution, it exists as small negatively charged
plates approximately 1 nm thick by 500 nm wide. When bentonite is
soaked in water, the plates separate more or less completely to form a
homogenous colloidal suspension which presents an enormous surface area.
It is a selective absorbant for proteins which, according to Singleton
(1974), causes the progressive removal of both stable and unstable
proteins, but tends to remove the more heat unstable proteins first.
The mechanism of its action involves electrostatic precipitation by
neutralizing positively charged particles, either by proton transfer or
cation exchange (i.e. absorption of proteins by binding them through
their amino groups or absorption of uncharged molecules by hydrogen
bonding (Singleton, 1967a; Amerine et al_., 1979).
As normally used (1-12 lbs/1000 gal of wine), bentonite removes 20-
60% protein but sometimes removes all of it (Singleton, 1974). It can
be added to the wine after it is fermented, or to the grape juice prior
to fermentation. According to Jakob (1975), the advantages of bentonite
fining include:
(1) Low cost.
(2) The removal of certain toxic side products of microbial
proceedings (e.g. histamine) and biogenic amines.
15
(3) Elimination of soluble metabolites caused by the use of
systematic fungicides.
(4) Removal of protein, based on reliable test methods which can be
carried out on wine.
The negative effects of bentonite fining include:
(1) The possible release of calcium, sodium, aluminum and other
trace metals. For instance the release of calcium by calcium
bentonite can cause the formation of calcium tartrate
precipitates.
(2) Loss of color (i.e. excessive brightening of the wine) (Ough et
ai., 1969).
(3) Gross alterations in wine constituents, including reduction in
volatiles which contribute to the taste and aroma of the wine
(Ough et a]_., 1969).
(4) Loss of wine due to bentonite lees.
It is clear then that, although bentonite fining is convenient, it
is not the recommended method for all wines (Somers and Ziemelis, 1973b;
Jakob, 1975).
Enzyme Treatment
Although attempts to add proteases directly to wines and juices
were made almost 50 years ago, more serious studies were only undertaken
during the last two decades (Tzakov, 1970). The literature on the sub-
ject is scattered and findings are inconclusive (Boehringer and Jaeger,
1953; Rentschler, 1969; Datounachvili, 1970). There are several reasons
for this situation: (1) studies conducted were not precise; and (2)
16
many of the traditional proteases (papain, pepsin, trypsin) are not
suitable for use in wine; they require high temperatures that are
deleterious to wine quality, and they do not have their pH optimum in
the range of 3-4 which is ideal for wines.
Therefore, further studies using different and more highly purified
proteases are needed so that the specificity of their action is better
defined and exploited (Dravert, 1967; Rentschler, 1969; Singleton,
1974). If suitable proteases were discovered, it is probable that
their use in enology would become common practice. Several reasons
account for this optimism:
(1) proteases are naturally present in grapes, although in minute
quantities (Cordonnier and Dugal, 1968; Cordonnier, 1970;
Tzakov, 1970; Marteau, 1972; Feuillat et aK, 1980).
(2) Proteolytic enzymes capable of hydrolyzing protein at must pH
(3-4) have been reported, although they were not pure enough
to be characterized (Marteau, 1972).
(3) Proteases have been successfully used in the beer industry for
seven decades to prevent "chill haze", which is in many aspects
similar to "protein" haze.
Other Methods
Ultrafiltration, casein and silica sols have been assayed as haze
prevention tools. According to Wucherpfenning (1978) it should be pos-
sible to prevent protein haze formation in wines with the use of ultra-
filtration membranes that retain substances of a MW larger than 10,000.
17
Such membranes also remove condensed polyphenols which are believed to
complex with proteins to form haze (Wucherpfennig, 1978).
A water-soluble modified casein (Na or K caseinate has been added
to wines for fining purposes (Amerine et^ aK , 1979). The acidity of the
wine is believed to neutralize the alkali of the caseinate causing a
curd-like precipitate which physically removes protein as it settles.
However, casein does not compare well with bentonite as a fining agent
(O'Neal and Cruess, 1950).
Silicates have been used as fining agents in the wine and juice
industry in Europe. They work by decreasing protein and phenolics; they
have been found to be superior to tannin-gelatin in terms of lees,
clarity achieved and speed of sedimentation (Amerine et^ al_., 1979).
Protein Determination Methods
Although the nitrogenous constituents of wines and musts have been
the subject of many investigations over the years, current methods of
measuring proteins in wines are inadequate (Potty, 1969; Somers and
Ziemelis, 1973a). It is not uncommon to find variations of several
orders of magnitude in the protein content of the same wine determined
by different procedures. Several reasons account for this including:
(1) protein exists in wine in very small amounts.
(2) Many of the analytical methods are empirical and sometimes
arbitrary in nature.
(3) Approximately one-half of the protein is bound to a minor
quantity of phenolics, which interfere with colorimetric
protein determination (Potty, 1969; Loomis, 1974).
18
(4) Many of the methods are based upon precipitation of the protein
fraction by ethanol, TCA, ammonium sulfate, etc., followed by
testing with Kjeldahl or colorimetric protein determination by
the biuret reaction (Somers and Ziemelis, 1973a).
Thus the reliability of these analyses depends upon the complete
precipitation of the protein material which is difficult to achieve
(Koch and Sajak, 1959; Bayly and Berg, 1967; Somers and Ziemelis, 1973b).
The more important methods that are currently being used to determine
protein in wine include: the Kjeldahl, the Voit, the Diemaier and Maier
procedure and gel filtration.
Kjeldahl Method
Most early investigations on wine protein were carried out by
determining nitrogen by the Kjeldahl procedure on precipitated samples
and multiplying by 6.25. Unfortunately, values obtained this way are
probably too high and not representative of protein since grapes and
wines contain, in addition to proteins, a large amount of nitrogenous
compounds which are precipitated along with the proteins (Ferenczy,
1966; Bayly and Berg, 1967).
Voit Method
This method was developed in an attempt to overcome some of the
disadvantages of the Kjeldahl method (Koch and Sajak, 1959). It involves
using phosphomolybdic acid to precipitate the large nitrogenous com-
pounds followed by the use of 95% alcohol to wash the precipitate and
selectively remove the proteins, which are then measured by Kjeldahl.
19
However, there is concern that the designation of the nitrogen floccul-
able by alcohol as protein nitrogen is arbitrary (Cordonnier, 1966).
Diemaier and Maier Method
The modified Diemaier and Maier procedure as described by Bayly
and Berg (1967) utilizes both phosphomolybdic acid and 96% alcohol to
precipitate the proteins, followed by their determination by the Biuret
procedure according to Lowry. It is the method recommended by the
Office International de la Vigne et du Vin (OIV). Unfortunately, it has
been found that precipitated peptides also react with the Biuret reagent
resulting in artificially high protein values (Somers and Ziemelis, 1973a),
Gel FiItration Method
This method, proposed by Somers and Ziemelis (1973a) is based upon
the separation of the protein fractions by Sephadex G-25, followed by
analysis by UV absorption. It proved that a linear relationship exists
between peak height and protein content in a finished wine. One dis-
advantage of this method is its time consuming nature.
Other Methods
Many other methods have been reported, some of them related to
those discussed above. A good discussion of the various wine protein
methods is reported by Amerine and Ough (1980). It is concluded that
existing methods for determining proteins in wines all have deficiencies
and that accurate data is difficult to obtain (Cordonnier, 1966;
Ferenczy, 1966; Kichkovsky and Mekhouzla, 1967; Amerine and Ough, 1980).
20
Purification of Wine Proteins
It is difficult to obtain a good separation of wine proteins
because they tend to be associated with other macromolecules of a
polyphenolic or pectinic nature (Feuillat and Bergeret, 1972). Early
studies on wine proteins met with limited success due to the lack of
purification procedures that would separate proteins from association
molecules without denaturing them. A mere precipitation by such
reagents as TCA, ammonium sulfate and alcohol were not good enough
(Kichkovsky and Mekhouzla, 1967). Furthermore, dialysis alone was unable
to remove interfering molecules such as polyphenols and nucleic acids
(Bayly and Berg, 1967; Somers and Ziemelis, 1973a).
Satisfactory analysis of wine proteins requires that the initial
separation of proteins from lower MW substances be more efficient than
has proved to be possible with any denaturant or complexing agent. It
has been reported that only a combination of dialysis, gel filtration
and low temperature concentration can lead to protein fractions that are
sufficiently purified to be analyzed by electrophoresis (Feuillat and
Bergeret, 1972).
The Problem of Beer "Chi 11-Haze"
Description of Beer "Chill-Haze"
In the early 1900's, the U.S. beer industry had problems with
bottled beer; the beer would develop a haze, especially on chilling,
which greatly lessened its appeal (Wallerstein, 1961). It was sus-
21
pected and later confirmed that protein was causing the haze, along with
phenolics and metals.
There exists a strong analogy between wine "protein" haze and beer
"chill-haze".' "Chill-haze" like "protein" haze is composed of protein
(up to 60%), iron and copper (2-4%), carbohydrates (2-4%) and tannins
(20-30%) (Singleton, 1967). The MW of the proteins in "chill-haze" has
been estimated to range from 10,000-100,000. The MW of wine proteins is
in the same range (Singleton, 1974). In "chill-haze" as in "protein"
haze the protein serves only as a "support" on which tannins and phenolics
become attached causing co-precipitation.
Use of Fining Agents in Beer
Synthetic compounds such as polyvinyl pyrollidone (PVP) and nylon
have been used in beer to prevent "chill-haze". They work fine, but
their use is limited because of the artificial "label" associated with
such additives; particularly as some residues may remain in the beer
after treatment (McFarlane, 1961; Singleton, 1967).
The Use of Proteases to Prevent Beer "Chill-Haze"
The addition of proteases to beer was first proposed by Wallerstein
(1961) in 1910 and it led to the successful solution of the "chill-haze"
problem as soon as suitable enzymes were developed. The technique has
contributed more to the successful production of packaged beer than any
other technical development (Hebert et al_., 1978). The enzyme most
often used in beer is papain.
22
The enzyme (papain) is added to the beer during pasteurization
which follows bottling. The papain becomes active and the proteins
which cloud the beer when chilled are so modified by the proteolysis
that the resulting beer remains clear and brilliant, no longer being
sensitive to cold (Wallerstein, 1961).
The history of the successful application of proteases to the solu-
tion of the problem of "chill-haze" in beer, therefore, would serve as a
valuable blueprint in our effort to find and apply suitable proteases
for the clarification of white table wines.
Dye Release Method for Protease Assays
A simple colorimetric method to detect proteolytic enzymes in
fluids was developed by Rinderknecht et al_. (1968) and modified by
Little £t a]_. (1979). It is based on the release of Remazobrilliant
blue dye covalently bound to an insoluble protein substrate (hide
powder) by the action of protease on peptide bonds. This Hide Powder
Azure (HPA) test is similar to that used in the beer industry to measure
residual protease activity following pasteurization (Hebert et al.,
1978). The HPA method will be used to characterize the two proteases
used in this study.
23
MATERIALS AND METHODS
Grapes and Wines
Grapes used in this study were produced in 1978, 1979, and 1980
seasons in Oregon and Washington. Three varieties were studied in
detail. They were: from Oregon, Chenin blanc 877 (Hyland Vineyards,
Sheridan); White riesling 946 (a blend of grapes from Sokol Blosser
Winery and Vineyards, Dundee, Lewis Brown Horticulture Farm, Corvallis,
and the Southern Oregon Experiment Station in Medford); from Washington,
Gewurztraminer 80 (Sagemoore Farms).
Grapes were processed at the Oregon State University (OSU) Winery,
except Gewurztraminer 80 which was processed at the Sokol Blosser Winery.
After routine determination of their sugar content (% solids) pH and
titratable acidity, they were crushed with a Garolla stemmer-crusher,
with approximately 50 ppm sulfur dioxide (SO2) added to the juice which
was stored frozen at -40oF in glass jugs. When needed, the juice was
thawed at 530F, and the S02 of the settled juice was adjusted to 25-30
ppm. The wines that were screened for protein instability were produced
by the OSU Experimental Winery.
Protease Enzymes
Source of the Proteases
The two enzymes used in this study were supplied by Rohm Gmbh, Darm-
stadt, West Germany, via their U.S. subsidiary Fermco Biochemics, Inc.,
Elk Grove Village, Illinois. They were: (1) Fungal Protease S (com-
mercially available); and Fungal Proteinase EL57-79 (from Aspergillus sp.)
24
The latter was an experimental protease selected by Rohm for its potential
application in wines. Upon receipt, both proteases were stored in a
refrigerator (ca. 40C) until needed.
Protease Treatment of Juice
The required amount of enzyme was weighed and dispersed in a minimal
amount of distilled water in a beaker. A glass rod was used to stir and
dissolve the enzyme. When a given juice sample did not require the
application of heat, the dissolved enzyme was added to the juice, fol-
lowed by mixing and storage at 340F for up to 24 hrs before the addition
of yeast to commence fermentation. When heating was required, the juice
was heated in a water bath maintained at the desired temperature and the
enzyme was added with constant stirring. The mix was held for the
specified period of time before the addition of yeast.
Protease Treatment of Wine
The required amount of enzyme was added to the wine with constant
stirring and the wine was held at the desired temperature for the
specified length of time. The free SOp was adjusted to about 30 ppm and
the wine was bottled and stored at 530F until evaluated.
Fermentation
A yeast starter was prepared by rehydrating active dry wine yeast,
Champagne Strain (Universal Foods Corporation, Milwaukee, Wisconsin),
in 1:1 grape juice-water at 30-35oC. The rehydrated culture (2%) was
incubated at room temperature for up to three hours.
25
The settled juice or enzyme treated juice was racked into one gal
jugs and inoculated with 2% yeast starter. The containers were sealed
with fermentation locks or cotton plugs. All wines were fermented to
dryness at 710F, racked twice, their free SOo adjusted to 30 ppm and
they were bottled and stored at 530F until needed.
Effect of Protease on Fermentation
Fermentation Rate
Small scale fermentations were carried out to determine whether
heat treatment or protease treatment had any effect on the rate of
fermentation and the wine chemistry. One hundred ml. of each juice was
transferred into a 250 flask, two ml of yeast inoculum was added and a
fermentation lock was installed; the weight of each flask was determined
at time zero, and then every six hrs during the first four days, and
thereafter every 12 hrs until fermentation was complete. Each trial was
conducted in triplicate and the average mean mass loss was plotted
against time and the slope of the different curves compared.
Chemical Composition of Wines
The content of each of the flasks was analysed for chemical changes
and changes in color. Color was measured by determining the absorbance
at 420 nm. The recommended procedures of Amerine and Ough (1980) were
used for the determination of pH, titratable acidity (TA), alcohol,
soluble solids (refractive index), total and free S02 and total phenols.
26
Wine Fining with Bentonite Substitute Fining
Baykisol-30
A 10% solution of Baykisol-30 (a pure solution of colloidal silicic
acid) obtained from Erbslok and Co. (Geisenheim/Rhein, West Germany) was
prepared and 3.7-37 ml of this solution was added per gal of wine and
mixed in with agitation. The silicate was allowed to react for up to
two days at 530F. The clarified wine was then racked off its lees and
stored in bottles at 530F until needed.
Gelatin
A 1% solution of gelatin was prepared and added to wine separately
or with the Baykisol-30. The final concentration of gelatin was 12.5-
100 mg/L.
Baykisol-30 was added as above. The wine was allowed to clarify
and it was then processed as above.
Proteases
Twenty-five to 200 mg of proteases S and EL57-79 were added to the
juices and wines as described in the sections on enzyme treatment of
juice and wine.
PVPP and XAD-4
PVPP and XAD-4 were added as described below (page 29).
27
Protein Stability Tests
Heat and Cold Stability Tests
A Volclay bentonite solution (30 g/L) was heated to incipient
boiling three times, cooled down and stored in a 40C refrigerator until
needed. One ml of this solution, added to 250 ml of wine, was equivalent
to adding 1 lb of bentonite to 1000 gallons of wine. Each sample of
wine was fined with 0-5 lbs of bentonite and stored at room temperature
for at least 48 hours. The wine was then racked off the lees and
filtered through Whatman paper (No. 5) and Millipore membrane (0.45 y).
Filtered samples were transferred into 65 ml bottles leaving a 10%
headspace, and subjected to protein stability tests. The short (80oC)
heat test and the Bentotest were compared to the long 50oC test for 24
wines produced in 1978 and 1979 by the OSU Experimental Winery.
Bentotest
One ml of Bentotest solution (Dr. Jakob, Fritz Merkel, Geisenheim
Rheim, West Germany) was added to 10 ml of filtered wine in test tubes.
The test tubes were stoppered, and the contents mixed and observed for
haze which forms immediately if any unstable proteins are present. A
precipitate/flocculate, if any, appears within one hour. The intensity
of haze or precipitate was recorded.
Use of Hunter Color/Difference Meter to Measure Wine "Protein" Haze
After the heat and cold test was completed, the tested samples were
mixed for homogeneicity then poured into a plastic spectrophotometer
28
cell (one cm pathlength). The cell was placed in a Model D25P-2 Hunter
Color/Difference Meter (Hunter Associates Lab., Inc., Fairfax, Virginia)
and haze value measured according to manufacturer's instructions.
Protein Determination Methods
The protein content of wines and juices was determined by the
Diemaier and Maier, the Bradford and a modified Kjeldahl procedures as
follows.
Modified Diemaier and Maier Method
The Diemaier and Maier protein method as described by Bayly and Berg
(1967) was used with slight modifications: 20 ml of phosphomolybdic
acid solution were added to 20 ml of wine in 50 ml centrifuge tubes
and stored at room temperature for 24 hrs instead of 15 hours.
Bradford (Bio Rad) Method
The protein reagent described by Bradford (1976) was purchased from
Bio Rad Laboratories (Richmond, California) and five-fold dilutions
prepared. Five ml of the diluted reagent were added to test tubes con-
taining 100 ul of wine (100 ul of water in the control). The content
of the tube was mixed using a lab bench top mixer and the absorbance
was measured at 595 nm using a one cm glass cell and a Perkin-Elmer 550
Spectrophotometer (Perkin-Elmer Corporation, Coleman Instrument Division,
Oak Brook, 111inois).
29
Modified Kjeldahl Method
The Kjeldahl method used was a modification of that described by
Amerine (1980). Proteins were precipitated and washed as in the
Diemaier procedure above. The precipitate was transferred with water
into a 100 ml Kjeldahl digestion flask. Five ml of concentrated
sulfuric acid and two g of catalyst were added to the flask, along with
two boiling chips, and the digestion was conducted with moderate heat
for up to six hours. The digested sample was suspended in a minimum
amount of water and redistilled using saturated NaOH and the recovered
NFL was titrated with a standard 0.1 N HCL solution.
All three methods were performed on unmodified samples of white
wines, then on the same wines after dialysis and treatment with PVPP
and/or XAD-4. Selected red varietal wines were also analysed to deter-
mine the effect of their high phenol content on the procedures.
Removal of Wine Phenolics with PVPP and XAD-4
The polymer polyvinylnyrrolidone (insoluble PVP) and the hydro-
phobic synthetic resin Amberlite XAD-4 were used separately and as a
mixture to remove phenols. The PVPP was treated as described by Loomis
and Bataille (1966) and Loomis (1974), and XAD-4 was pretreated as des-
cribed by Loomis et aK (1979). The PVPP and/or XAD-4 (0-4.5 g of each)
were mixed with 50 ml of wine and stored in a covered beaker in a
refrigerator. The following day the wine was centrifuged at 16,000 rpm
for 15 min and the supernatant was decanted and analysed for protein and
total phenols. As optimum removal of phenols occurred when one part of
30
XAD-4 was added to 29 parts of wine (w/v), the same ratio was used in
subsequent trials.
Purification of Wine Proteins
To obtain protein extracts suitable for electrophoresis, juices and
wines were submitted to dialysis, low temperature concentration, gel
filtration and a second concentration as follows.
Dialysis
One hundred ml of wine or juice was filtered through Whatman paper
(No. 5) layered with diatomaceous earth and then through millipore
membrane. Up to 1% of sodium sorbate was added to juices to prevent
mold growth. The samples were then dialyzed against a Tris-glycine
buffer (pH 9.2) for 60 hours. The buffer was changed after 12 and 36
hours. The dialysis tubing was a 1%" cellulose membrane (Arthur H.
Thomas Company, Philadelphia, Pennsylvania) with a MW cut off of ca.
8,000.
Vacuum Concentration
Dialyzed juice or wine was placed in a 250 ml round-bottom flasks
and concentrated with a rotary evaporator (Buchi Laboratories, Flawil,
Switzerland) to about 1/20 of its original volume. The temperature of
the water bath was maintained at 32-350C and the temperature of the
concentrate was never allowed to exceed 20oC. Following gel filtration,
it was determined that the protein was in the first eight fractions (40
ml), which were pooled and concentrated to about 5 ml. Approximately
31
0.025% of sodium azide was added to the concentrated sample which was
stored at 40C if used within one week or freeze dried if longer storage
periods were required.
Gel Filtration
Gel filtration was performed using a 1.4 cm X 50 cm chromatography
column (Pharmacia Fine Chemicals, a Division of Pharmacia, Inc.,
Piscataway, New Jersey) packed with G-25 sephadex gel (Pharmacia). The
gel was pre-soaked in a 3% acetic acid buffer (pH 3.6). Approximately
five ml of the dialyzed and concentrated sample were applied on the gel
with a sample applicator. The flow rate of the buffer was maintained at
One ml per min with a peristatic pump (Fluid Metering, Inc., Oyster Bay,
New York) and the effluent was collected in test tubes with a fraction
collector (Model 272) and a volumeter (Model 400) both from Instrumentation
Specialties, Inc., Lincoln, Nebraska. The system was set to deliver
five ml per tube. The absorbance of each fraction was measured at 280
nm.
Electrophoresis
Various juices and wines (control, heat-treated, enzyme-treated,
fined with increasing concentrations of bentonite) were treated as
described above, and subjected to electrophoresis.
Polyacrylamide Gel Electrophoresis
The number of protein fractions in ea€h> juice and wine sample was
determined by polyacrylamide gel electrophoresis (PAGE). The procedure
was that of Davis (1964) with the modifications described by Halim and
32
Montgomery (1978) and Smith (1979), except that a 12.5% gel was used
instead of a 7% gel. The voltage power supply was an EC-Model 454
(EC Apparatus Corporation, Philadelphia, Pennsylvania).
Sodium Dodecyl Sulfate Polyacrylamide Gel Electrophoresis
The relative MW of the different protein fractions present in the
juices and wines was determined by sodium dodecyl sulfate polyacryl-
amide gel electrophoresis (SDS-PAGE). The method employed was a modi-
fication of that described by Laemmli (1970), discs being used instead
of slabs. A 12.5% running gel and a 4% stacking gel were found to
provide the best resolution. The staining solution and the destaining
solution were prepared as described by Smith (1979).
Low MW protein standards consisting of a mixture of proteins of MW
10,000-100,000 were obtained from Bio Rad Laboratories, Richmond,
California, and diluted 20 fold with the sample buffer prepared according
to Laemmli (1970). Gels were prepared in glass tubing 0.5 cm I.D. and
12 cm in length. Both the standard and the samples were mixed with
sample buffer (one to one) in test tubes and heated in a boiling water
bath for at least two min prior to their application on the gels.
Fifty ul of each sample containing up to 25 ug of protein was applied to
the gel, and electrophoresis was conducted at 150 volts (8 ma/tube) for
30 min, then the current was increased to 225 volts until the dye
reached one cm from the bottom of the discs.
Following electrophoresis the gels were put in test tubes filled
with staining solution and held for up to 10 hrs, then destained as in
PAGE. The MW of the fractions was determined from a standard curve
33
obtained by plotting log MW of protein standard against their relative
mobility.
Isoelectric Focusing
To further characterize the protein fractions in the various wines,
their pis were determined by isoelectric focusing. The latter was per-
formed in a Desaga/Brinkmann Double Chamber Thin Layer Isoelectric
Focusing (Brinkmann Instruments, Inc., Cantiague Road, Wesibury, New
York). The power was regulated by a No. 3-1155 voltage and Current Reg-
ulated Power Supply (Buchler Instruments, Division of Searle Analytical,
Inc., Fort Lee, New Jersey).
One percent agarose gel in water was prepared according to Anonymous
(1980) and while still warm (65-750C) between 2-3% of the following
ampholites were added to it: Pharmalyte pH 3-10 and pH 6.5-9
(Pharmacia) and Ampholine pH 4-6 (LKB Produkter, Bromma, Sweden). The
gel was poured on a 13 x 13 cm gel bond film (FMC Marine Colloids,
Division of Bio Products, Rockland, Maryland) set on a warm TLC plate.
A glass rod was used to spread the gel on the film. The gel was allowed
to harden at room temperature for 15 min then put in the chamber and
"cured" for one hr at 40C.
Fifty mg of the freeze-dried wines were mixed with 0.5 ml of water
in test tubes and stored on ice. The gel was prefocused at 150 volts
for 15 min, then the current was increased to 200 volts and 10 ul of
each sample was loaded (in 6-8 drops) one cm apart on the gel. The
voltage was increased every 5-10 min up to a maximum of 900 volts. The
run was completed in 1.5 hours.
34
The fixing, staining and destaining solutions were prepared ac-
cording to Winter et aj_. (1978). The fixing solution was poured on the
gel and held for 30 minutes. The gel was then washed with destaining
solution to wash off any remaining ampholites. Staining (with
Coumassie Blue) was performed for one hr, after which the gel was
washed with distilled water, covered with destaining solution and stored
overnight. After removing the gel from the destaining solution, it was
washed with water and dried with an air dryer. The isoelectric points
were determined by plotting the distance travelled by the protein
fractions against pH.
Characterization of Protease Enzymes
Preliminary Protease Assay
Studies concerning the properties of the proteases were based upon
the Hide Powder Azure (HPA) procedure described in the literature
review. HPA was obtained from Calbiochem, Bering Corporation, La Jolla,
California. One tenth molar citrate buffer solutions with pH ranging
from 3-6 in increments of 0.2 pH unit were prepared. A citrate buffer
(pH 3.5) was also prepared. Conditions under which the assay conditions
were linear (with respect to both time and enzyme concentration) were
determined by measuring absorbance against time as described below.
Initial velocity was determined from the linear portion of the curve
within 30 min of iniation of the reaction. One unit of enzyme activity
was determined as the amount of enzyme which caused a change in absorb-
ance of 0.01 per minute.
35
Effect of pH on the Activity of Proteases S and EL57-79
Nine ml of citrate buffer (pH 3-6) were added to 16 25 ml erlenmeyers.
One ml of one mg/ml enzyme solution and 10 mg of HPA were added to each
erlenmeyer before incubation at 450C for one hr in an environmental in-
cubator shaker (New Brunswick Scientific Company, New Brunswick, New
Jersey). The shaking speed was maintained at 180 rpm. The blue solu-
tion that resulted was filtered through Whatman paper No. 4 and read at
595 nm on a Bausch and Lomb Spectronic 20, (Bausch and Lomb, Inc.,
Rochester, New York). The reference was citrate buffer (pH 3.5).
Effect of Temperature on the Activity of Protease EL57-79
One-half ml of a one mg/ml enzyme solution was added to 49.5 ml of
citrate buffer contained in each of eight 300 ml sidearm flasks (Bellco,
Vineland, New Jersey). Fifty mg of HPA were sealed in Miracloth bags,
(Chicopee Mills, Inc., Millton, New Jersey), and prepared according to
the procedure described by Little et al_. (1979). The HPA bags were
placed in the flasks containing the enzyme and each was incubated at 10,
20, 30, 40, 50, 60, 70 or 80oC and the absorbance was measured at 595 nm
at time 0 and every 5 min for 60 minutes. An activity curve was
derived by plotting (AArnr/min).
Effect of Concentration on the Activity of Protease EL57-79
One-tenth to one ml of a 5 mg/ml enzyme solution was added to
citrate buffer (pH 3.5) in a sidearm flask to make a final volume of 50
ml. The enzyme concentration in these flasks was 10-100 mg/1. HPA was
36
added as above. Each flask was incubated at 50oC for up to 60 minutes.
The absorbance was measured as previously and the activity as a function
of enzyme concentration was determined.
Heat Stability of Protease EL57-79
Solutions of protease EL57-79 were prepared as above and stored
in beakers at 10, 20, 30, 40, 50, 60, 70 and 80oC. After two and 12 hrs,
aliquots of the incubated enzymes were removed and their activity was
determined as described previously. Stability curves were derived by
plotting residual activity against temperature.
Effect of Sulfur Dioxide on the Activity of Protease EL57-79
A 1% solution of SO- was prepared by dissolving 17.7 g of sodium
metabisulfite (Mallinckrodt Chemical Works, St. Louis, Missouri) in 1 L
of H20.
Ten, 25, 50, 100 and 200 ppm of SO2 was added to sidearm flasks
containing 0.5 ml of one mg/ml enzyme solution. Citrate buffer (pH 3.5)
was added to make a final volume of 50 ml. Each flask was incubated at
50oC and the protease activity as a function of SO2 concentration was
determined.
Effect of Alcohol on the Activity of Protease EL57-79
To study the effect of alcohol on the activity of protease EL57-79,
0, 5, 10, 15, 20 and 25% alcohol was added to sidearm flasks along with
0.5 ml enzyme solution (1 mg/ml) and citrate buffer (pH 3.5) to a final
volume of 50 ml. All flasks were incubated at 50oC and an activity
curve was derived as a function of alcohol content.
37
RESULTS AND DISCUSSION
In this report the term wine will refer to white varietal table
wine produced from grapes grown in Oregon and/or Washington, unless
otherwise indicated; the terms stable and unstable will be used to
designate wines containing proteins that are stable or unstable to heat;
heat test will refer to heat and cold stability test.
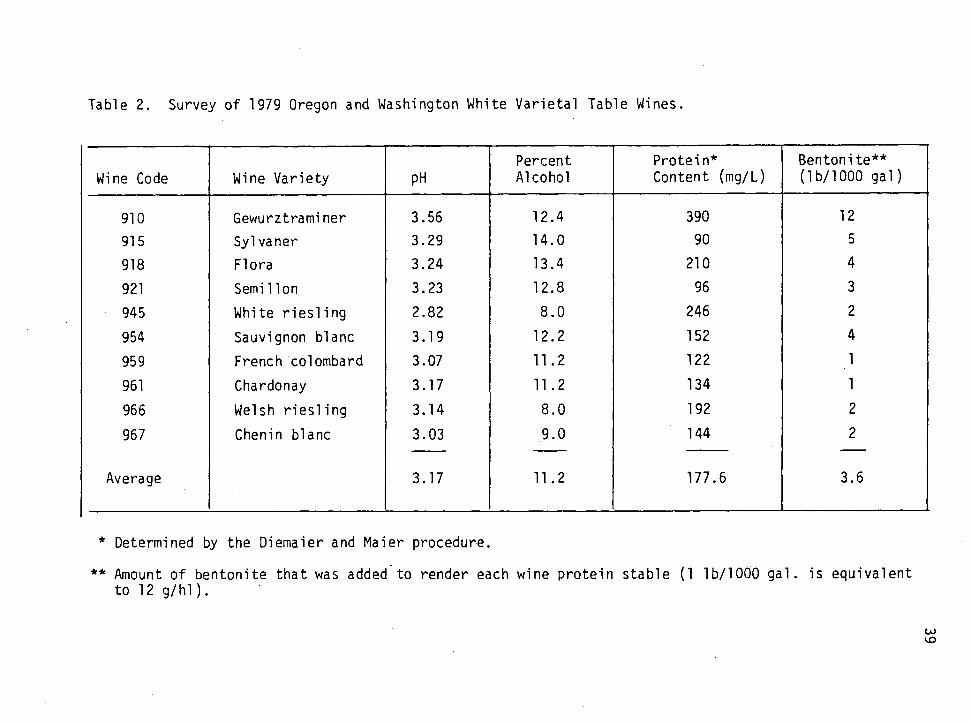
Survey of Selected 1978 and 1979 Oregon and Washington Wines
A total of 20 Oregon and Washington white varietal table wines
(10 varieties each from the 1978 and 1979 vintages) were screened for
protein stability. Their pH, alcohol and protein contents were also
determined. These wines were made from grapes grown on the same locations,
The data obtained is summarized in Tables 1 and 2. They indicate that
the 1978 and 1979 wines required an average of 4.9 and 3.6 lbs of
bentonite/1000 gal respectively to become protein stable. It is note-
worthy that some of the wines required up to 12 lbs of bentonite/1000
gallons. It is common knowledge that when such high amounts of bento-
nite are added to a wine, it adversely affects its appearance and its
sensory quality (Ough et^ a]_, 1969; Somers and Ziemelis, 1973; Jakob,
1975; Hartmier, 1979). Therefore, it is apparent that, in some cases,
protein instability is a concern in wines made from grapes harvested in
Oregon and Washington. Also, since a few of the wines were very highly
unstable, there J_s_ a need for a substitute for bentonite which would
have a less harsh effect on the very highly unstable wines.
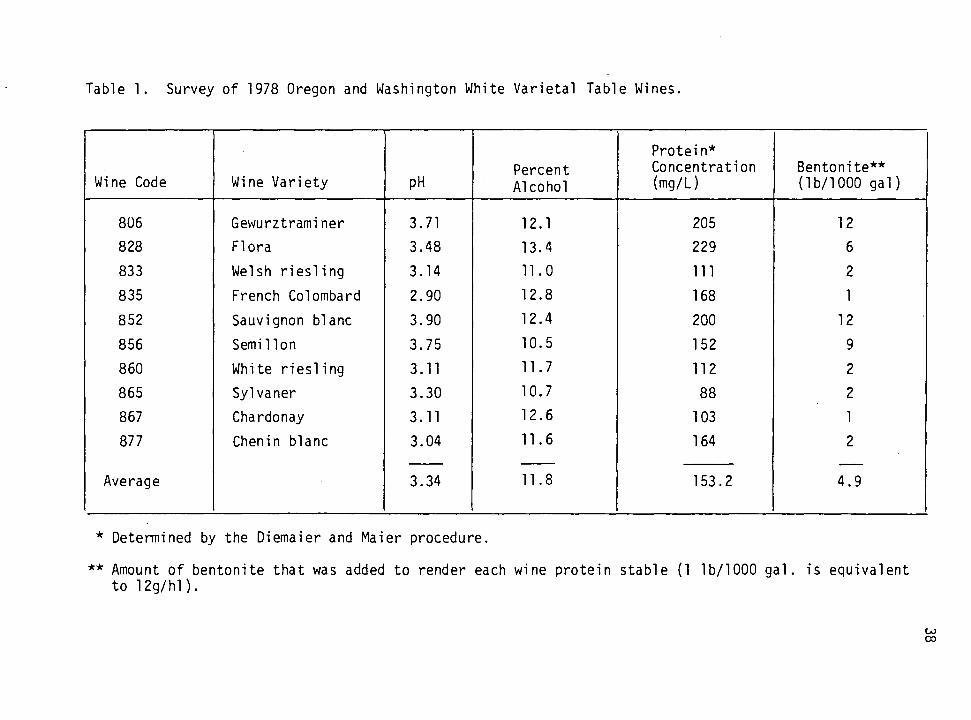
Table 1. Survey of 1978 Oregon and Washington White Varietal Table Wines.
Wine Code Wine Variety pH Percent Alcohol
Protein* Concentration (mg/L)
Bentonite** (lb/1000 gal)
806 Gewurztraminer 3.71 12.1 205 12
828 Flora 3.48 13.4 229 6
833 Welsh riesling 3.14 11.0 111 2
835 French Colombard 2.90 12.8 168 1
852 Sauvignon blanc 3.90 12.4 200 12
856 Semi 11 on 3.75 10.5 152 9
860 White riesling 3.11 11.7 112 2
865 Sylvaner 3.30 10.7 88 2
867 Chardonay 3.11 12.6 103 1
877
Average
Chenin blanc 3.04 11.6 164 2
4.9 3.34 11.8 153.2
* Determined by the Diemaier and Maier procedure.
** Amount of bentonite that was added to render each wine protein stable (1 lb/1000 gal. is equivalent to 12g/hl).
CO CO
CD c
+-> •I—
s~ n3
C
o
+J
en c
•r-
-o c
(t3
c
o
cr> O
J s- o
O
-i
CTv
>
IT)
CM
J3 (T3
^— * ro *
en O
) 4
J o
eo
•r- o
CM
in
^
3-
n
CM
«
3-
i—
r—
CM
C
M
• c o
r—
C
O
O
r—
+-> ^
C X
5
OJ r-
co
>-^
_J
en E
lO
*
• c
-»-> o
o
O
lO
vo
CM
C
M
^l- C
M
■<*
r-»
•i- C
CT
l en
CT>
^i-
IT)
CM
ro
C
Tl
^^ r^
0) 0
) C
O
CM
C
M
r—
r—
r—
r—
r—
^— 4-> -M
o c
s-
o
Q. <_)
4J
^-
c
o
"d- o
"d-
00
o
C
M
CM
C
M
o
o
CM
cu -c
•
• •
• •
• •
• •
o
o
CM
"d-
n
OO
O
O
CM
t—
r—
0
0
CT>
i—
s- o
f—
~
^— ^—
^— ^—
n-
r-
f--
OJ r—
a. <:
kO
en
«* C
O
CM
cn
r- 1^-.
Kt
CO
1-^
in
C
M
CM
O
O
00
r—
o
^—
f—
O
r—
^
• •
• •
• •
• •
• •
• Q
. n
0
0
CO
n
C
M
ro
ro
CO
co
CO
C
O
-o
u
s- S
- a
i c
ta
cn
(V
c: (O
J
3
c
>, c
•^-
r—
E
•r—
o
■£? •f—
^—
J3
o
n
—
c
OJ
E
10
lO
03
(0
OJ
C
"o
>, cu
r—
t.
s- s-
c
•r-
o
o
ra •r-
-O
(O
+-> <u
o
i. c
c
i.
>
N
c
en J
: o
c
s_
rO
(O
r—
OJ
•r- u
-a
J=
•r—
OJ
3
> s-
*(— 4->
>
c
s- 00
tz
c
3
o
E
•r—
3
0)
n3 ^—
0)
<U
">, cu
-C
ra s_
^Z
O
J -C
3
e? 0
0
u.
OO
3
oo
Li-
o
3
C_)
a> ■o
cu
o
cn C
_)
o
in
OO
^—
un •d
- en
^— in
r^
(O
r—
C
M
«* in
un
VO
U
3
lO
S-
O)
en en
a> cr>
en a>
cn C
Tl
cn C
Tl
cu c
>
•r—
<:
3
39
OJ
> =3
cr (U
(T3 cn
O
o
O
a;
0)
o
i. Q
.
OJ
c
.^- 2
-C
o
• ro
OJ
OJ
$- 3
S
- ■a
Q
J O
J T
D
o
C
o
OJ
$- S
- Q
. o
s-
+J
<u
, •r—
■a
ro
cu s:
■o
TO
■a
ro
c: lO
10
ro
s- 2
<u
•r-
+J
rO
ro 1-
J:
a> -(->
■r—
Q
0)
4->
<U
•r- ^
Z
c
-*-> o
4->
>-, c
ja
<u • -0
^-»
X
J
r—
cu >4- x
: c
o ^
• f—
cn
F
4->
S
- C C
M
ai 3 r
-
■M
O
(U
Q
^5
*
■K
*
40
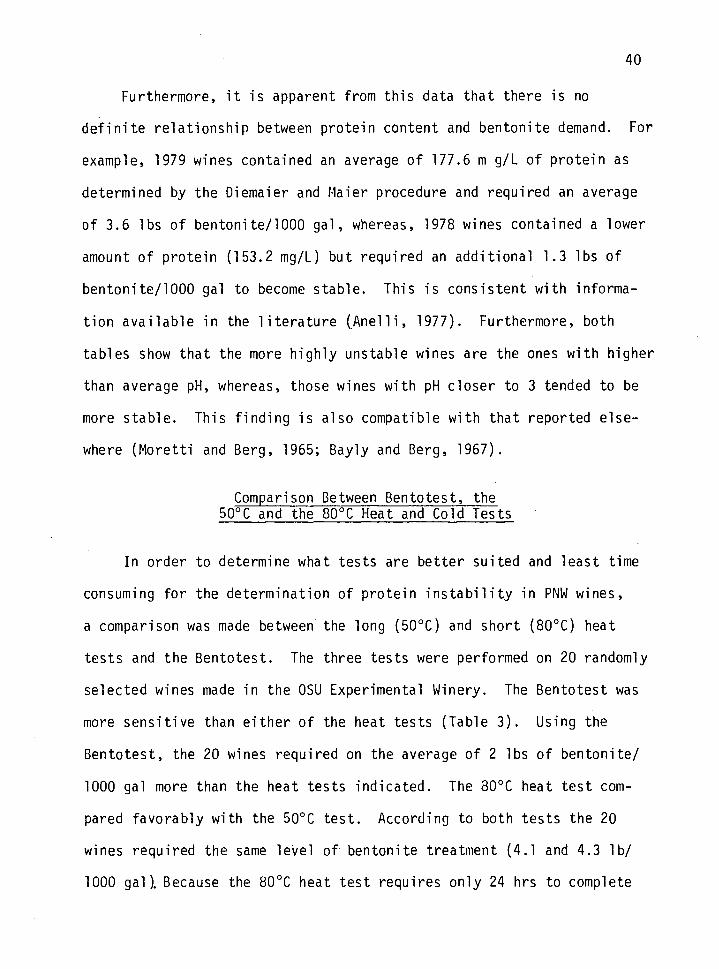
Furthermore, it is apparent from this data that there is no
definite relationship between protein content and bentonite demand. For
example, 1979 wines contained an average of 177.6 m g/L of protein as
determined by the Diemaier and Maier procedure and required an average
of 3.6 lbs of bentonite/1000 gal, whereas, 1978 wines contained a lower
amount of protein (153.2 mg/L) but required an additional 1.3 lbs of
bentonite/1000 gal to become stable. This is consistent with informa-
tion available in the literature (Anelli, 1977). Furthermore, both
tables show that the more highly unstable wines are the ones with higher
than average pH, whereas, those wines with pH closer to 3 tended to be
more stable. This finding is also compatible with that reported else-
where (Moretti and Berg, 1965; Bayly and Berg, 1967).
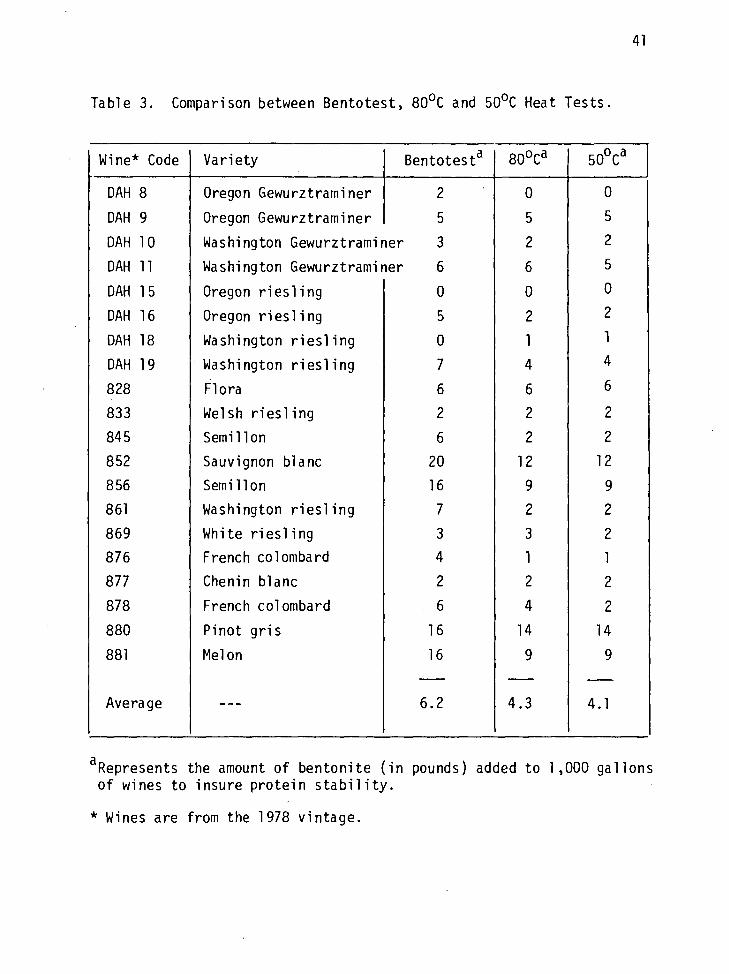
Comparison Between Bentotest, the 50oC and the 80oC Heat and Cold Tests
In order to determine what tests are better suited and least time
consuming for the determination of protein instability in PNW wines,
a comparison was made between the long (50oC) and short (80oC) heat
tests and the Bentotest. The three tests were performed on 20 randomly
selected wines made in the OSU Experimental Winery. The Bentotest was
more sensitive than either of the heat tests (Table 3). Using the
Bentotest, the 20 wines required on the average of 2 lbs of bentonite/
1000 gal more than the heat tests indicated. The 80oC heat test com-
pared favorably with the 50oC test. According to both tests the 20
wines required the same level of bentonite treatment (4.1 and 4.3 lb/
1000 gal). Because the 80oC heat test requires only 24 hrs to complete
41
Table 3. Comparison between Bentotest, 80oC and 50oC Heat Tests.
Wine* Code Variety Bentotest9 80oCa 50OCa
DAH 8 Oregon Gewurztraminer 2 0 0
DAH 9 Oregon Gewurztraminer 5 5 5
DAH 10 Washington Gewurztraminer 3 2 2
DAH 11 Washington Gewurztraminer 6 6 5
DAH 15 Oregon riesling 0 0 0
DAH 16 Oregon riesling 5 2 2
DAH 18 Washington riesling 0 1 1
DAH 19 Washington riesling 7 4 4
828 Flora 6 6 6
833 Welsh riesling 2 2 2
845 Semi 11 on 6 2 2
852 Sauvignon blanc 20 12 12
856 Semi 11 on 16 9 9
861 Washington riesling 7 2 2
869 White riesling 3 3 2
876 French colombard 4 1 1
877 Chenin blanc 2 2 2
878 French colombard 6 4 2
880 Pinot gris 16 14 14
881 Melon 16 9 9
Average — 6.2 4.3 4.1
Represents the amount of bentonite (in pounds) added to 1,000 gallons of wines to insure protein stability.
* Wines are from the 1978 vintage.
42
whereas the 50oC test requires up to six days, and because the Bentotest
is very sensitive and can lead to overfining of the wines (Rankine and
Pocock, 1971), it was concluded that the 80oC heat test provided a
dependable and accurate way to predict protein stability. Thus, all
succeeding protein stability tests were conducted at 80oC.
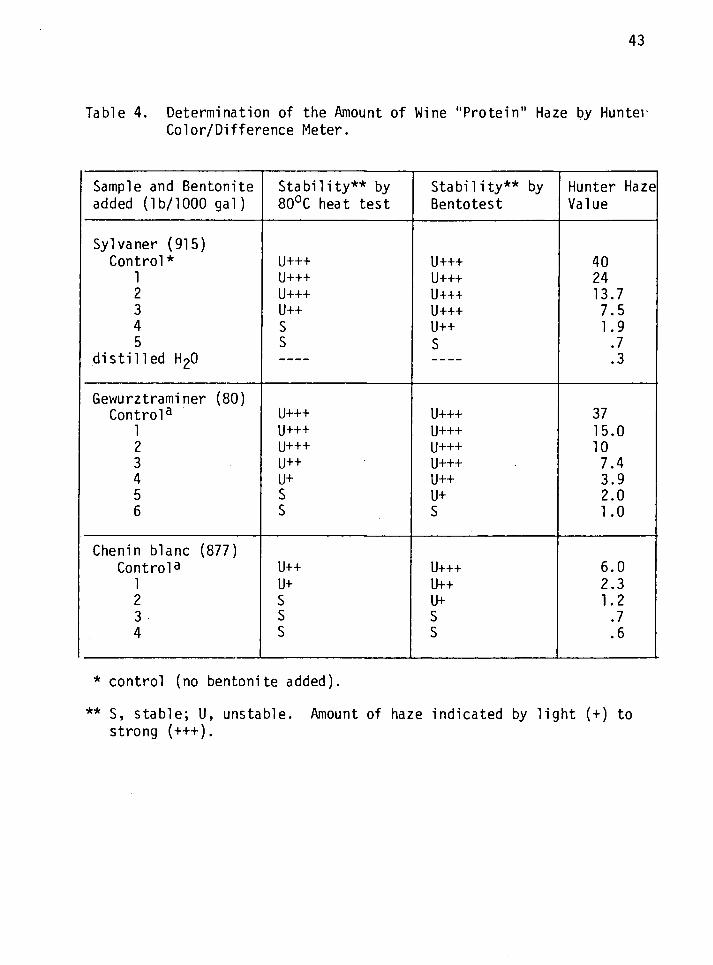
An Objective Method for the Measurement of Wine "Protein" Haze
Visual observation of the haze formed when unstable wines are sub-
jected to the heat/cold tests or Bentotest is routine in the industry.
This is very subjective methodology. Various instruments, among them
the Spectrophotometer and the Hunter Color/Difference Meter were assayed
for possible use in measuring "protein" haze. Only the Hunter meter was
found to be adequate. The results obtained when the Hunter Color/
Difference Meter was used to measure haze in three selected white
varietal wines (treated with 0-5 lbs of bentonite/1000 gal) are shown on
Table 4 and Figure 1. The latter is a graphical representation of the
former. It shows the effect of increasing bentonite concentration on
wine Hunter haze values. It is apparent that Hunter haze values
decreased with increasing bentonite concentration; however, the decrease
was not linear. Although these results were taken for three varietal
wines, similar results were obtained with other varieties. This led to
the conclusion that a Hunter haze value of 1.5 or less was indicative of
a stable wine.
A Comparison of Three Protein Determination Methods
The Bradford (Bio-Rad) method of protein determination (Bradford,
43
Table 4. Determination of the Amount of Wine "Protein1
Color/Difference Meter. Haze by Hunter
Sample and Bentonite Stability** by Stability** by Hunter Haze added (lb/1000 gal) 80oC heat test Bentotest Value
Sylvaner (915) Control* U+++ U+++ 40
1 U+++ U+++ 24 2 U+++ U+++ 13.7 3 U++ U+++ 7.5 4 S U++ 1.9 5 S S .7
distilled H2O .3
Gewurztraminer (80) Control9 U+++ U+++ 37
1 U+++ U+++ 15.0 2 U+++ U+++ 10 3 U++ U+++ 7.4 4 u+ U++ 3.9 5 s u+ 2.0 6 s s 1.0
Chenin blanc (877) Control9 U++ U+++ 6.0
1 u+ U++ 2.3 2 s u+ 1.2 3 s s .7 4 s s .6
* control (no bentonite added).
** S, stable; U, unstable. Amount of haze indicated by light (+) to strong (+++).
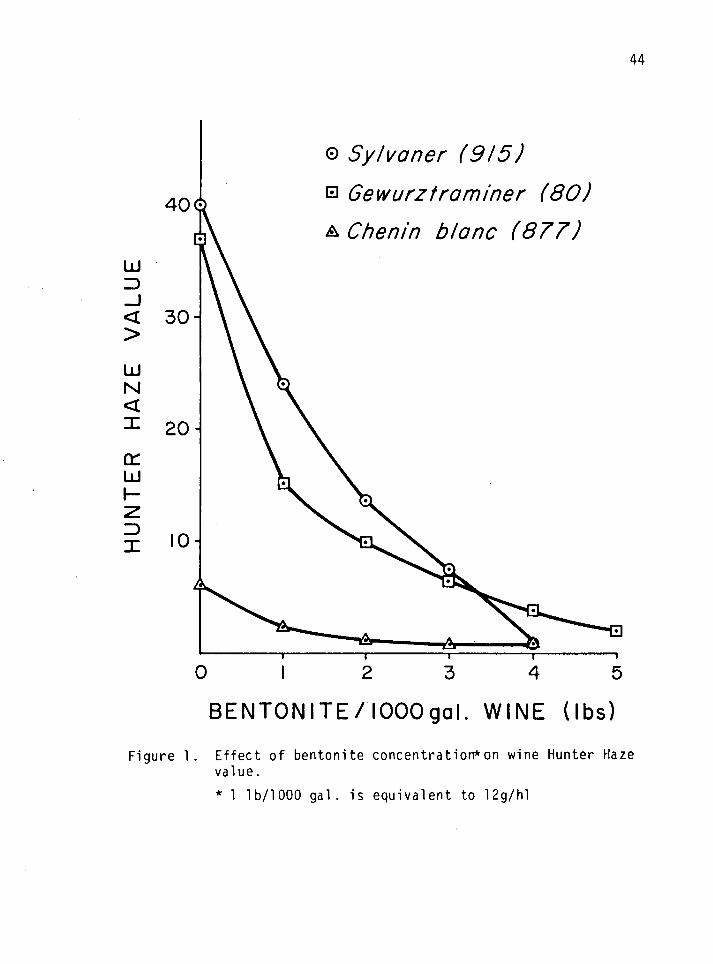
44
LU
< >
UJ N < X
(Z UJ h-
ID X
© Sylvoner (915)
0 Gewurztraminer (80)
^Chenin blonc (877)
0 1 2 3 4 5
BENTONITE/IOOOgal. WINE (lbs)
Figure 1. Effect of bentonite concentration*on wine Hunter Haze value.
* 1 lb/1000 gal. is equivalent to 12g/hl
45
1976) has been reported to be the best available method for protein
determination in media which contain a high level of phenolics (Robinson,
1979). Wine is such a medium. Although the Bradford method had not
been used to measure wine protein, it was used in this study. Wine
protein values obtained with the Bradford method were compared to those
obtained with two of the most commonly used methods, the Diemaier and
Maier (D and M) and the Kjeldahl.
White Varietal Table Wines
Table 5 shows the results obtained when the three methods were ap-
plied to selected white varietal wines. There are large differences
between the values obtained by the three methods. The D and M gave the
highest values. This was not unexpected since the method is not
selective for proteins. Amino acids and other non-dialyzable nitrogen
compounds (e.g. low MW polypeptides) are known to contribute to protein
values by this method (Somers and Ziemelis, 1973b). For example, using
this method, Bayly and Berg (1967) determined that a model wine con-
tained 500 mg/L of protein; it was later determined that the same wine
contained no non-dialyzable material (i.e. no protein). Therefore, the
D and M procedure is likely to give artifically high values. On the
average, values obtained with the Kjeldahl (46.4 mg/L) were closer to
those obtained with the Bradford method (38.4 mg/L) than with those
obtained with the D and M procedure (158.7 mg/L). To determine the
effect of non-proteinaceous materials on the values obtained by the
three methods, the tests were conducted on the same white wines after
they had been dialyzed for 60 hrs (Table 6). Dialysis caused a reduc-
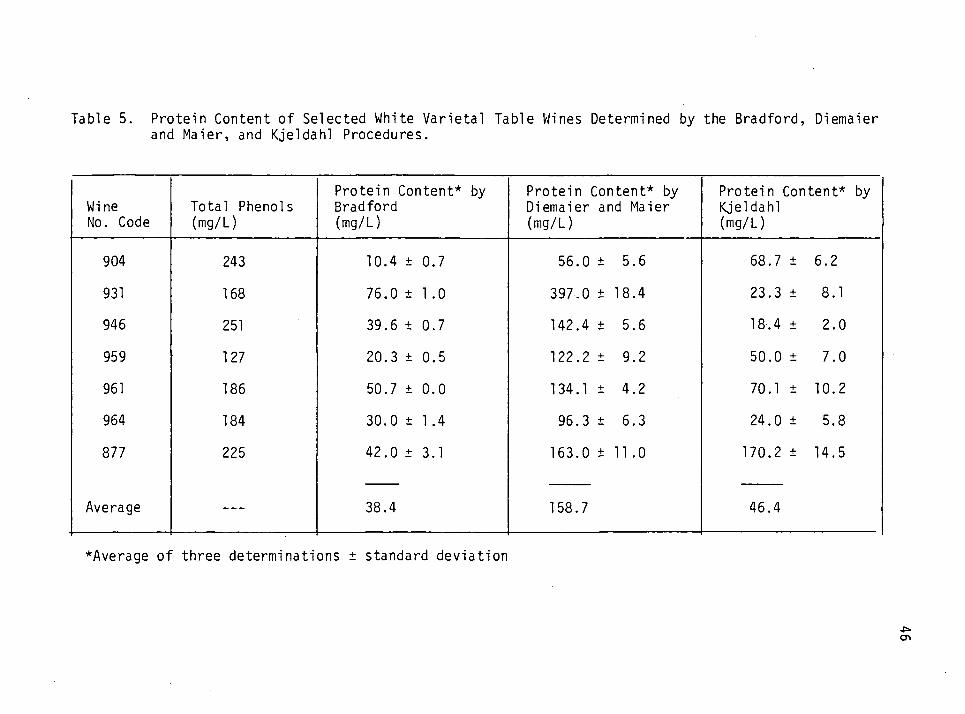
Table 5. Protein Content of Selected White Varietal Table Wines Determined by the Bradford, Diemaier and Maier, and Kjeldahl Procedures.
Wine No. Code
Total Phenols (mg/L)
Protein Content* by Bradford (mg/L)
Protein Content* by Diemaier and Maier (mg/L)
Protein Con Kjeldahl (mg/L)
tent* by
904 243 10.4 ± 0.7 56.0 ± 5.6 68.7 ± 6.2
931 168 76.0 ± 1.0 397.0 ± 18.4 23.3 ± 8.1
946 251 39.6 ± 0.7 142.4 ± 5.6 18.4 ± 2.0
959 127 20.3 ± 0.5 122.2 ± 9.2 50.0 ± 7.0
961 186 50.7 ± 0.0 134.1 ± 4.2 70.1 ± 10.2
964 184 30.0 ± 1.4 96.3 ± 6.3 24.0 ± 5.8
877 225 42.0 ± 3.1 163.0 ± 11.0 170.2 ± 14.5
Average — 38.4 158.7 46.4
♦Average of three determinations ± standard deviation
en
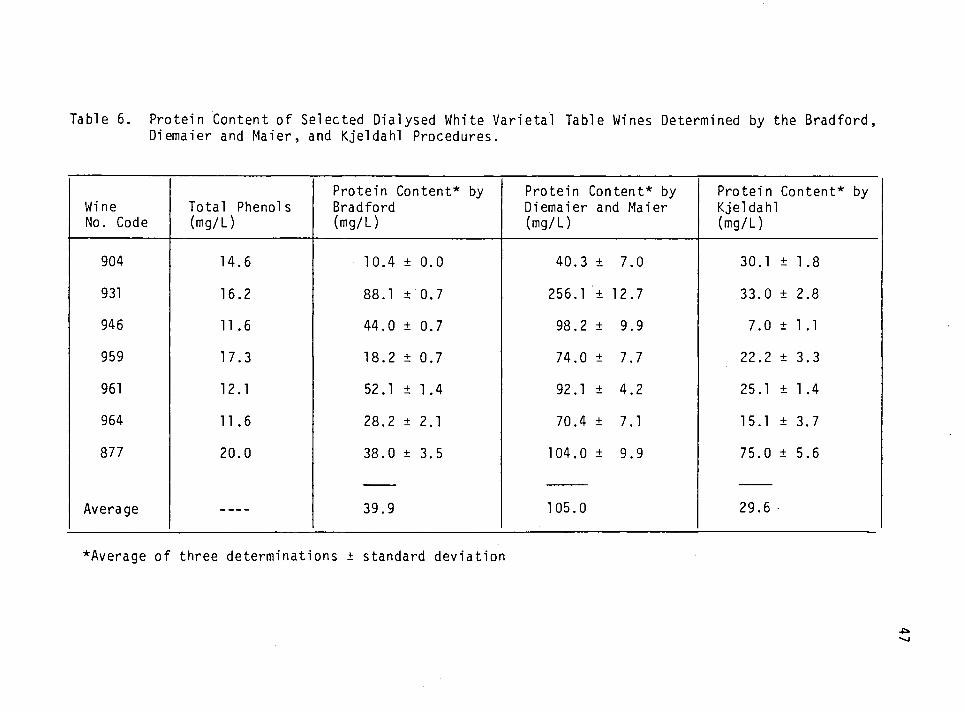
Table 6. Protein Content of Selected Dialysed White Varietal Table Wines Determined by the Bradford, Diemaier and Maier, and Kjeldahl Procedures.
Wine No. Code
Total Phenols (mg/L)
Protein Content* by Bradford (mg/L)
Protein Content* by Diemaier and Maier (mg/L)
Protein Content* Kjeldahl (mg/L)
by
904 14.6 10.4 ± 0.0 40.3 ± 7.0 30.1 ± 1.8
931 16.2 88.1 ±0.7 256.1 ± 12.7 33.0 ± 2.8
946 11.6 44.0 ± 0.7 98.2 ± 9.9 7.0 ± 1.1
959 17.3 18.2 ± 0.7 74.0 ± 7.7 22.2 ± 3.3
961 12.1 52.1 ± 1.4 92.1 ± 4.2 25.1 ± 1.4
964 11.6 28.2 ± 2.1 70.4 ± 7.1 15.1 ± 3.7
877 20.0 38.0 ± 3.5 104.0 ± 9.9 75.0 ± 5.6
Average 39.9 105.0 29.6 ■
♦Average of three determinations ± standard deviation
48
tion of about one-third in the values obtained by the Kjeldahl and the
D and M methods (29.6 and 104.9 mg/L respectively). The value obtained
with the Bradford method remained essentially the same (39.9 mg/L
and 38.4 mg/L). It is proposed that dialysis caused a loss in the amount
of peptides and small polypeptides that were contributing to the high
values obtained with the Diemaier and Maier method. Those polypeptides
could also have contributed to the Kjeldahl values. The Bradford proced-
ure has been reported to be specific for proteins (Bradford, 1976). Di-
alysis did not affect protein values obtained by the Bradford procedure.
Therefore, dialyzable wine compounds were not contributing to the pro-
tein content of wine as determined by the Bradford method. It was con-
cluded that for the determination of non-dialyzable protein in white
wines, the Bradford procedure is reliable and reproducible. Its use
is therefore recommended. Also, it has the advantage of simplicity
and quickness which are lacking in both the Kjeldahl and the D and M
methods.
Red Varietal Table Wines
The possible interference of high phenolics concentrations on
protein determination by the three methods discussed above was investi-
gated. The tests were performed on selected red varietal wines
(Table 7). It is apparent that the large amounts of phenolics contained
in most red wines do interfere with both the Bradford and the D and M
procedures. Protein values obtained by these two methods were mis-
leadingly high, resulting from the absorbance measurement of phenolics
rather than proteins. It is well established that high levels of
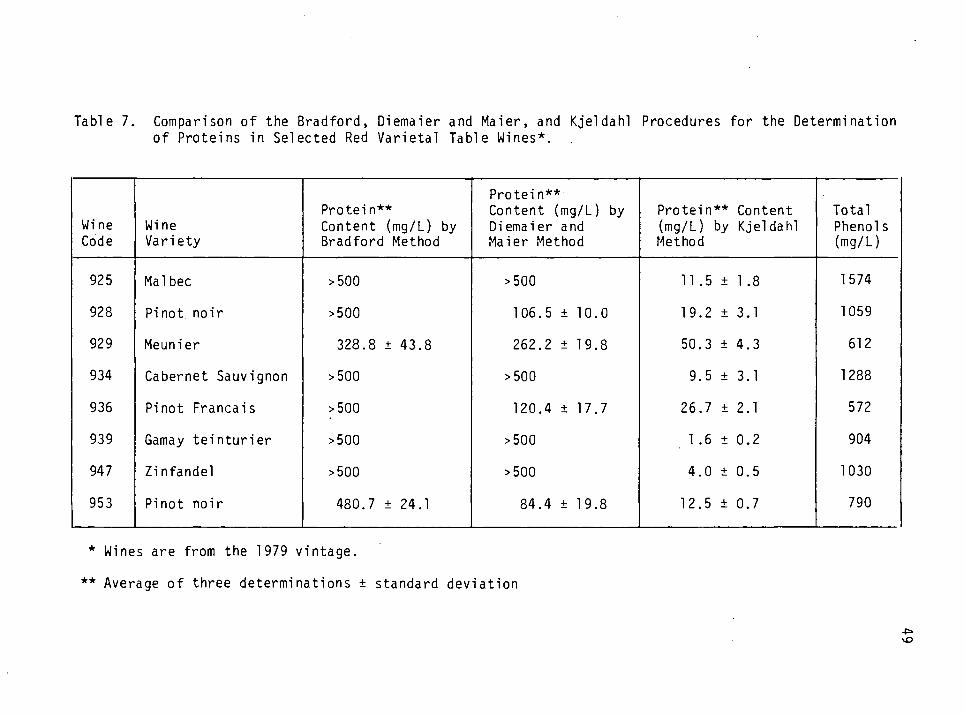
Table 7. Comparison of the Bradford, Diemaier and Maier, and Kjeldahl Procedures for the Determination of Proteins in Selected Red Varietal Table Wines*.
Wine Code
Wine Variety
Protein** Content (mg/L) by Bradford Method
Protein** Content (mg/L) by Diemaier and Maier Method
Protein** Content (mg/L) by Kjeldahl Method
Total Phenols (mg/L)
925 Mai bee >500 >500 11.5 ± 1.8 1574
928 Pi not noir >500 106.5 ± 10.0 19.2 ± 3.1 1059
929 Meum'er 328.8 ± 43.8 262.2 ± 19.8 50.3 ± 4.3 612
934 Cabernet Sauvignon >500 >500 9.5 ± 3.1 1288
936 Pinot Francais >500 120.4 ± 17.7 26.7 ± 2.1 572
939 Gamay teinturier >500 >500 1.6 ± 0.2 904
947 Zinfandel >500 >500 4.0 ± 0.5 1030
953 Pinot noir 480.7 ± 24.1 84.4 ± 19.8 12.5 ± 0.7 790
* Wines are from the 1979 vintage.
** Average of three determinations ± standard deviation
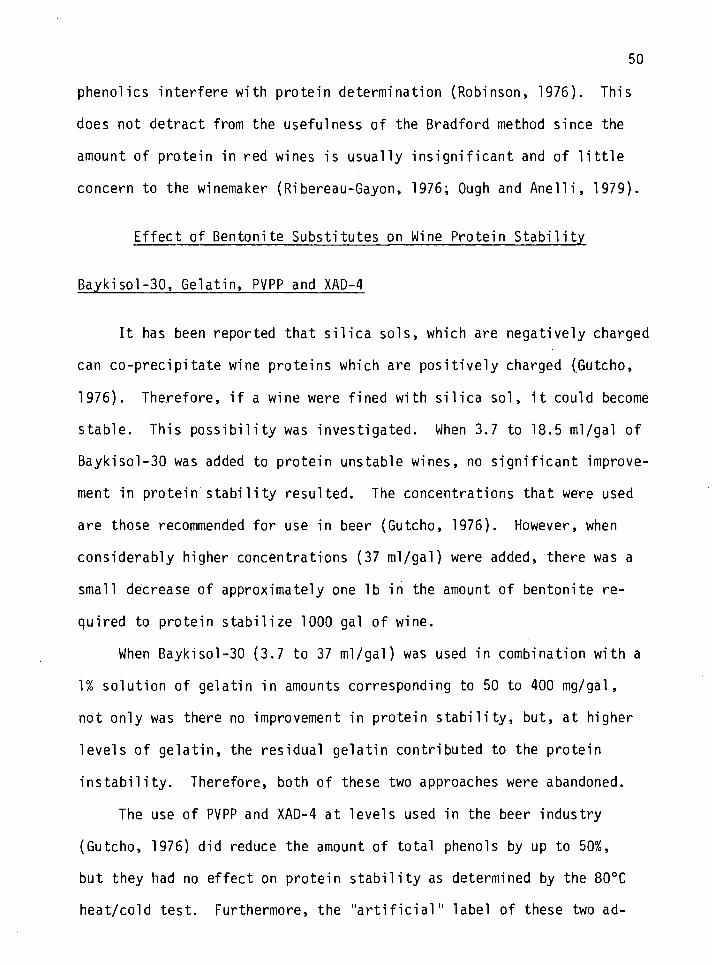
50
phenolics interfere with protein determination (Robinson, 1976). This
does not detract from the usefulness of the Bradford method since the
amount of protein in red wines is usually insignificant and of little
concern to the winemaker (Ribereau-Gayon, 1976; Ough and Anelli, 1979).
Effect of Bentonite Substitutes on Wine Protein Stability
Baykisol-30, Gelatin, PVPP and XAD-4
It has been reported that silica sols, which are negatively charged
can co-precipitate wine proteins which are positively charged (Gutcho,
1976). Therefore, if a wine were fined with silica sol, it could become
stable. This possibility was investigated. When 3.7 to 18.5 ml/gal of
Baykisol-30 was added to protein unstable wines, no significant improve-
ment in protein stability resulted. The concentrations that were used
are those recommended for use in beer (Gutcho, 1976). However, when
considerably higher concentrations (37 ml/gal) were added, there was a
small decrease of approximately one lb in the amount of bentonite re-
quired to protein stabilize 1000 gal of wine.
When Baykisol-30 (3.7 to 37 ml/gal) was used in combination with a
1% solution of gelatin in amounts corresponding to 50 to 400 mg/gal,
not only was there no improvement in protein stability, but, at higher
levels of gelatin, the residual gelatin contributed to the protein
instability. Therefore, both of these two approaches were abandoned.
The use of PVPP and XAD-4 at levels used in the beer industry
(Gutcho, 1976) did reduce the amount of total phenols by up to 50%,
but they had no effect on protein stability as determined by the 80oC
heat/cold test. Furthermore, the "artificial" label of these two ad-
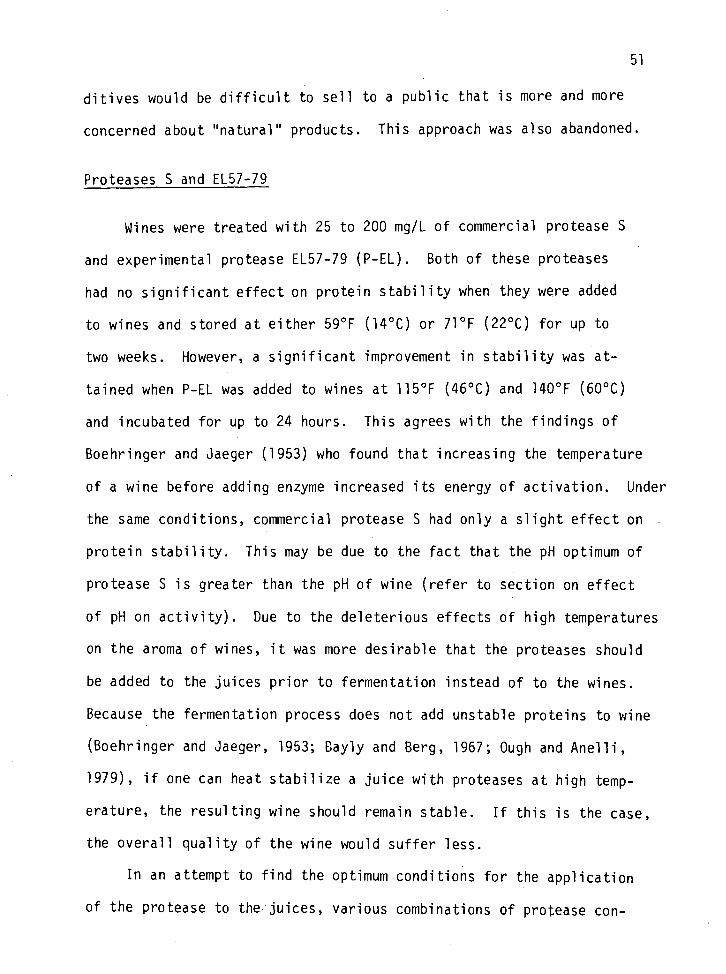
51
ditives would be difficult to sell to a public that is more and more
concerned about "natural" products. This approach was also abandoned.
Proteases S and EL57-79
Wines were treated with 25 to 200 mg/L of commercial protease S
and experimental protease EL57-79 (P-EL). Both of these proteases
had no significant effect on protein stability when they were added
to wines and stored at either 590F (140C) or 710F (220C) for up to
two weeks. However, a significant improvement in stability was at-
tained when P-EL was added to wines at 1150F (460C) and 140oF (60oC)
and incubated for up to 24 hours. This agrees with the findings of
Boehringer and Jaeger (1953) who found that increasing the temperature
of a wine before adding enzyme increased its energy of activation. Under
the same conditions, commercial protease S had only a slight effect on .
protein stability. This may be due to the fact that the pH optimum of
protease S is greater than the pH of wine (refer to section on effect
of pH on activity). Due to the deleterious effects of high temperatures
on the aroma of wines, it was more desirable that the proteases should
be added to the juices prior to fermentation instead of to the wines.
Because the fermentation process does not add unstable proteins to wine
(Boehringer and Jaeger, 1953; Bayly and Berg, 1957; Ough and Anelli,
1979), if one can heat stabilize a juice with proteases at high temp-
erature, the resulting wine should remain stable. If this is the case,
the overall quality of the wine would suffer less.
In an attempt to find the optimum conditions for the application
of the protease to the juices, various combinations of protease con-
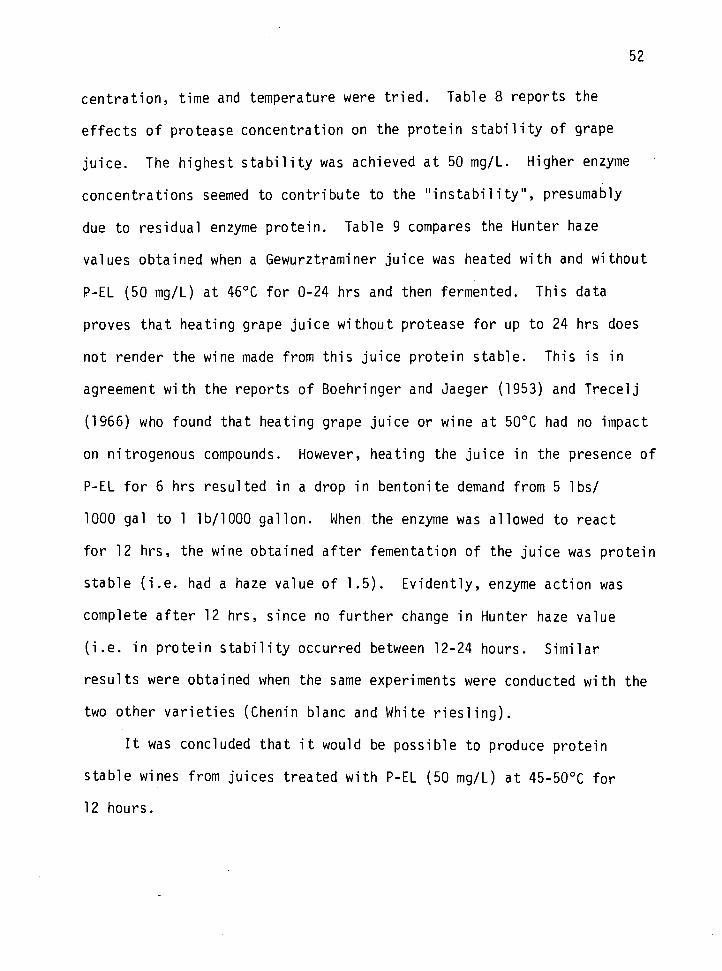
52
centration, time and temperature were tried. Table 8 reports the
effects of protease concentration on the protein stability of grape
juice. The highest stability was achieved at 50 mg/L. Higher enzyme
concentrations seemed to contribute to the "instability", presumably
due to residual enzyme protein. Table 9 compares the Hunter haze
values obtained when a Gewurztraminer juice was heated with and without
P-EL (50 mg/L) at 460C for 0-24 hrs and then fermented. This data
proves that heating grape juice without protease for up to 24 hrs does
not render the wine made from this juice protein stable. This is in
agreement with the reports of Boehringer and Jaeger (1953) and Trecelj
(1966) who found that heating grape juice or wine at 50oC had no impact
on nitrogenous compounds. However, heating the juice in the presence of
P-EL for 6 hrs resulted in a drop in bentonite demand from 5 lbs/
1000 gal to 1 lb/1000 gallon. When the enzyme was allowed to react
for 12 hrs, the wine obtained after fementation of the juice was protein
stable (i.e. had a haze value of 1.5). Evidently, enzyme action was
complete after 12 hrs, since no further change in Hunter haze value
(i.e. in protein stability occurred between 12-24 hours. Similar
results were obtained when the same experiments were conducted with the
two other varieties (Chenin blanc and White riesling).
It was concluded that it would be possible to produce protein
stable wines from juices treated with P-EL (50 mg/L) at 45-50oC for
12 hours.
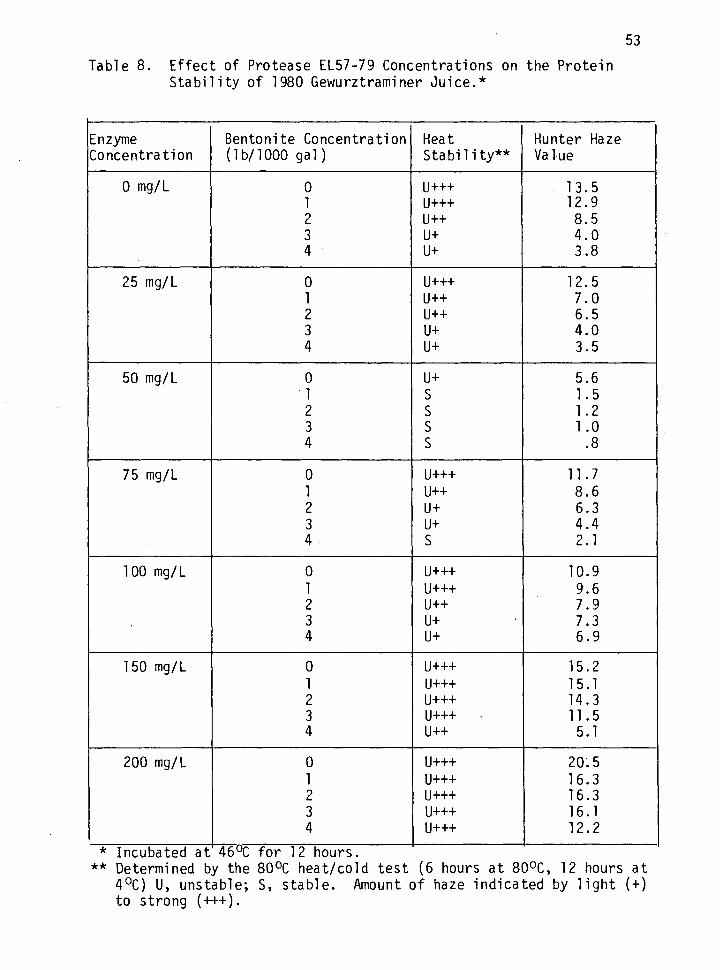
53
Table 8. Effect of Protease EL57-79 Concentrations on the Protein Stability of 1980 Gewurztraminer Juice.*
Enzyme Bentonite Concentration Heat Hunter Haze Concentration (lb/1000 gal) Stability** Value
0 mg/L 0 U+++ 13.5 1 U+++ 12.9 2 U++ 8.5 3 U+ 4.0 4 U+ 3.8
25 mg/L 0 U+++ 12.5 1 U++ 7.0 2 U++ 6.5 3 U+ 4.0 4 U+ 3.5
50 mg/L 0 U+ 5.6 1 S 1.5 2 S 1.2 3 s 1.0 4 s .8
75 mg/L 0 U+++ 11.7 1 U++ 8.6 2 u+ 6.3 3 u+ 4.4 4 s 2.1
100 mg/L 0 U+++ 10.9 1 U+++ 9.6 2 U++ 7.9 3 u+ 7.3 4 u+ 6.9
150 mg/L 0 U+++ 15.2 1 U+++ 15.1 2 U+++ 14.3 3 U+++ 11.5 4 U++ 5.1
200 mg/L 0 U+++ 20.5 1 U+++ 16.3 2 U+++ 16.3 3 U+++ 16.1 4 U+++ 12.2
* Incubated at 460C for 12 hours. ** Determined by the 80oC heat/cold test (6 hours at 80oC, 12 hours at
40C) U, unstable; S, stable. Amount of haze indicated by light (+) to strong (+++).
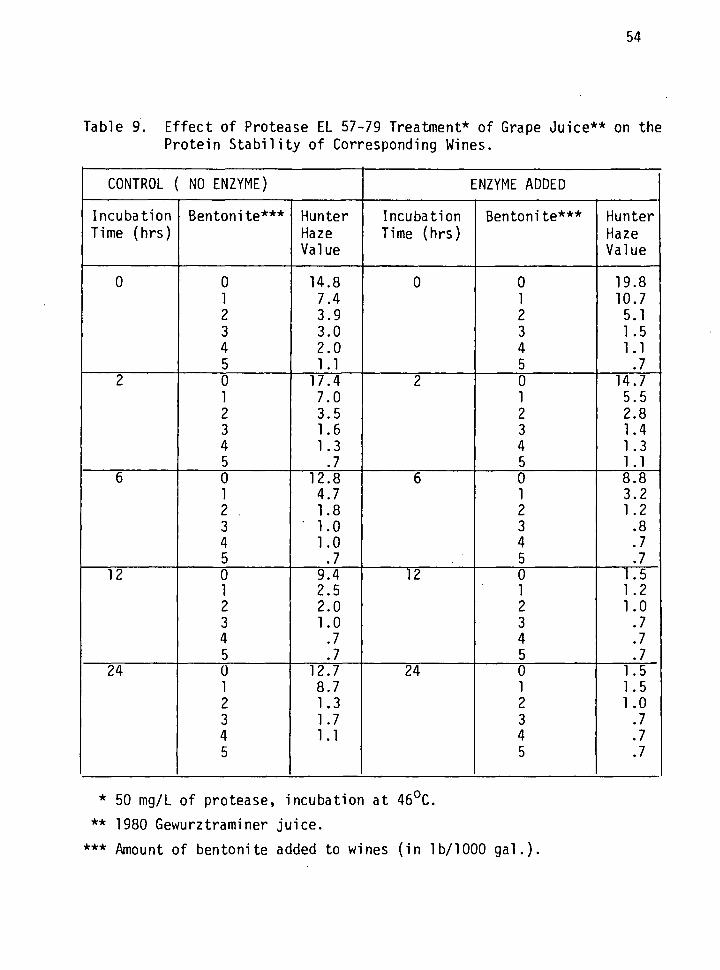
54
Table 9. Effect of Protease EL 57-79 Treatment* of Grape Juice** on the Protein Stability of Corresponding Wines.
CONTROL ( NO ENZYME) ENZYME ADDED
Incubation Bentonite*** Hunter Incubation Bentonite*** Hunter Time (hrs) Haze
Value Time (hrs) Haze
Value
0 0 14.8 0 0 19.8 1 7.4 1 10.7 2 3.9 2 5.1 3 3.0 3 1.5 4 2.0 4 1.1 5 1.1 5 .7
2 0 17.4 2 0 14.7 1 7.0 1 5.5 2 3.5 2 2.8 3 1.6 3 1.4 4 1.3 4 1.3 5 .7 5 1.1
6 0 12.8 6 0 8.8 1 4.7 1 3.2 2 1.8 2 1.2 3 ' 1.0 3 .8 4 1.0 4 .7 5 .7 5 .7
12 0 9.4 12 0 1.5 1 2.5 1 1.2 2 2.0 2 1.0 3 1.0 3 .7 4 .7 4 .7 5 .7 5 .7
24 0 12.7 24 0 1.5 1 8.7 1 1.5 2 1.3 2 1.0 3 1.7 3 .7 4 1.1 4 .7 5 5 .7
* 50 mg/L of protease, incubation at 46 C.
** 1980 Gewurztraminer juice.
*** Amount of bentonite added to wines (in lb/1000 gal.).
55
Characterization of Proteases S and EL57-79
Effect of pH on the Activity of Proteases S and EL57-79
P-EL was most active between pH 2 and 6, with its greatest activity
occurring between pH 3 and 5. The optimum activity occurred at pH 3.5
(Figure 2). Thus P-EL belongs to the class of acid proteases. Further-
more, pH 3.0-3.7 is of special interest since most wines have their pH
in that range (Singleton, 1974). This suggests that this enzyme is well
suited for use in juices and wines, notwithstanding interferences from
other wine components. The effect of pH on the activity of commercial
protease S was also determined (Figure 3). It appears that protease S
was most active between pH 5.5 and 8 with a pH optimum around pH 6.5,
with gelatin as substrate. Similar pH activity range and optimum were
obtained with hemoglobin and casein as substrates (Anonymous, 1978).
Figure 3 clearly shows that, at the normal pH of wine (3-3.5), protease
S was only 30-35% active. Furthermore, as mentioned earlier, when wines
were treated with protease S their stability was not affected signifi-
cantly. It was concluded that protease S was not effective for the
treatment of grape juices and wines to prevent protein instability.
Therefore, all further studies were conducted with P-EL only.
Heat Stability of Protease EL57-79
Since the treatment of juices and wines by enzymes requires an
incubation period, and since the possibility of autodigestion exists
with proteases, the influence of time and temperature on the retention
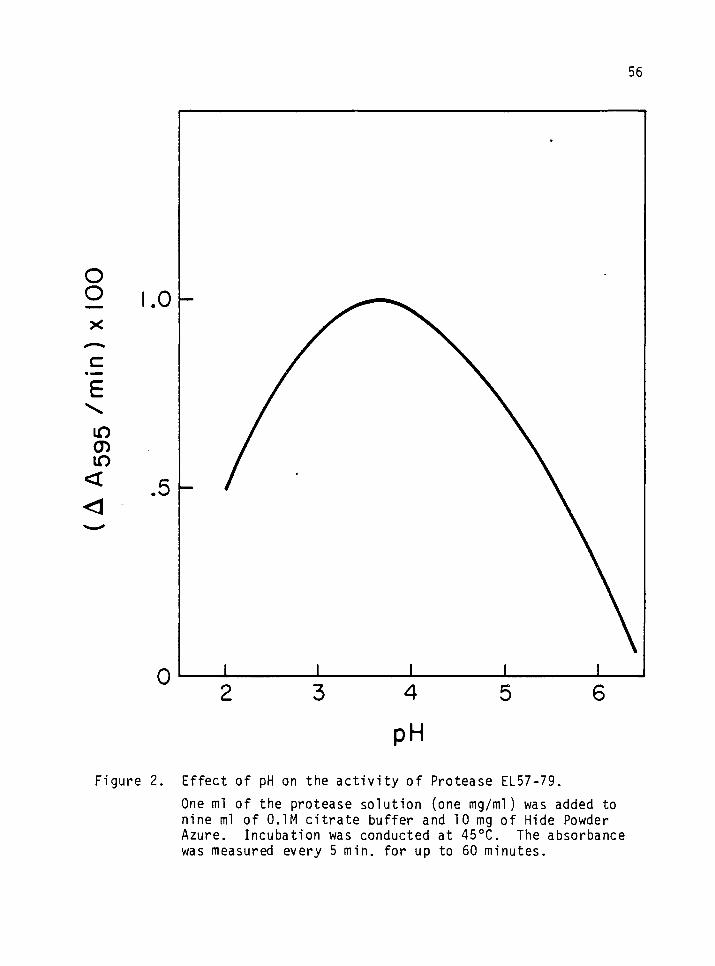
56
o o
c E \
m ID <
Figure 2. Effect of pH on the activity of Protease EL57-79.
One ml of the protease solution (one mg/ml) was added to nine ml of O.IM citrate buffer and 10 mg of Hide Powder Azure. Incubation was conducted at 450C. The absorbance was measured every 5 min. for up to 60 minutes.
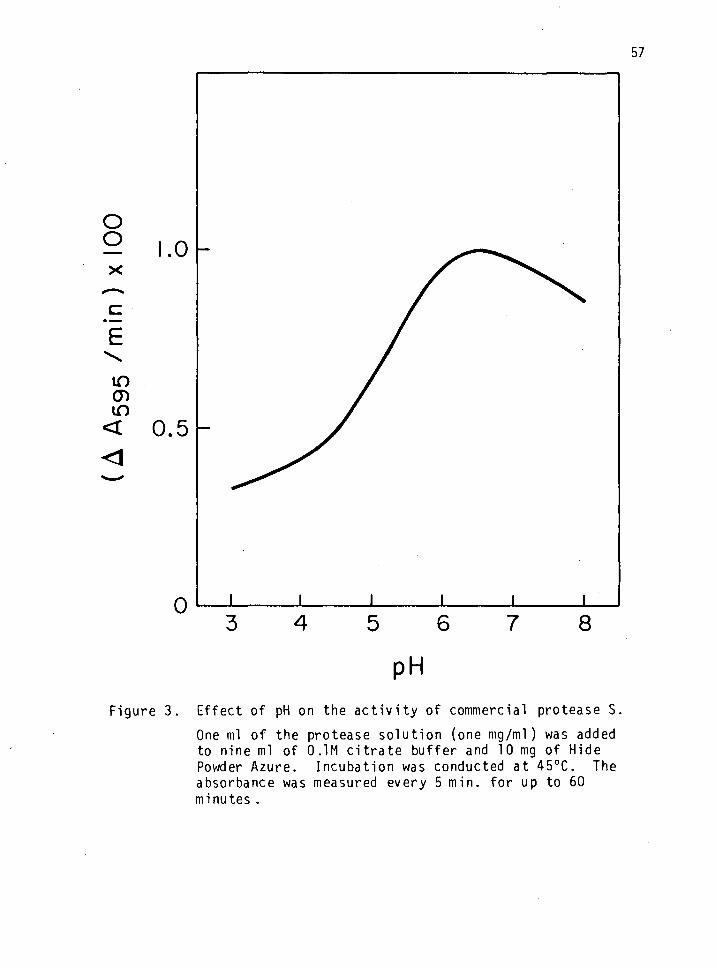
57
o o
"E
10 CD
<
Figure 3.
PH Effect of pH on the activity of commercial protease S.
One ml of the protease solution (one mg/ml) was added to nine ml of O.IM citrate buffer and 10 mg of Hide Powder Azure. Incubation was conducted at 450C. The absorbance was measured every 5 min. for up to 60 minutes .
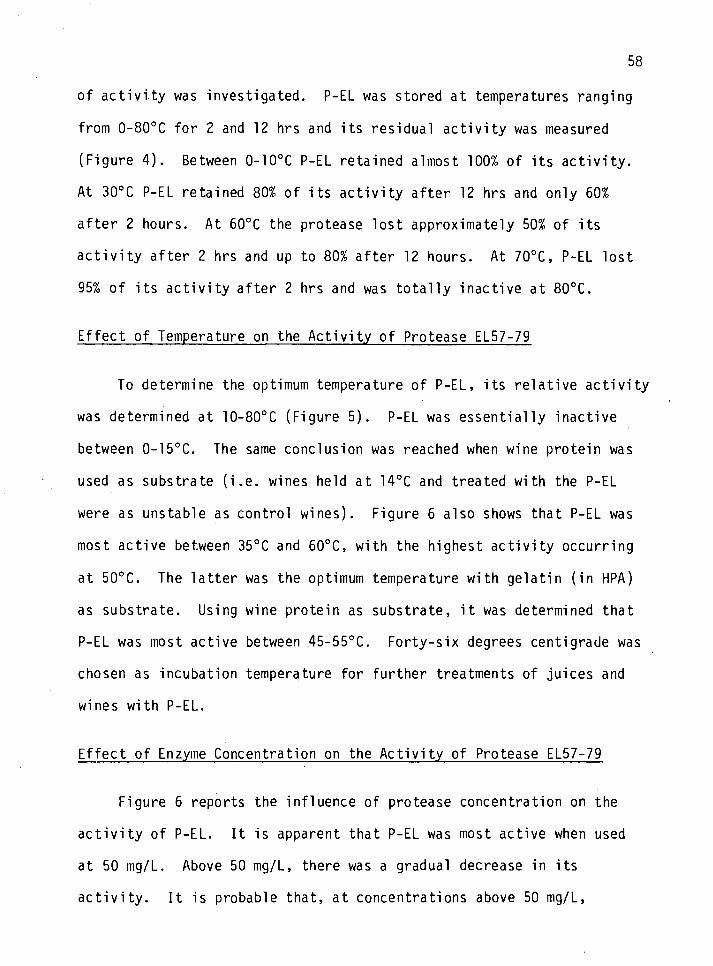
58
of activity was investigated. P-EL was stored at temperatures ranging
from 0-80oC for 2 and 12 hrs and its residual activity was measured
(Figure 4). Between 0-10oC P-EL retained almost 100% of its activity.
At 30oC P-EL retained 80% of its activity after 12 hrs and only 60%
after 2 hours. At 60oC the protease lost approximately 50% of its
activity after 2 hrs and up to 80% after 12 hours. At 70oC, P-EL lost
95% of its activity after 2 hrs and was totally inactive at 80oC.
Effect of Temperature on the Activity of Protease EL57-79
To determine the optimum temperature of P-EL, its relative activity
was determined at 10-80oC (Figure 5). P-EL was essentially inactive
between 0-15oC. The same conclusion was reached when wine protein was
used as substrate (i.e. wines held at 140C and treated with the P-EL
were as unstable as control wines). Figure 6 also shows that P-EL was
most active between 350C and 60oC, with the highest activity occurring
at 50oC. The latter was the optimum temperature with gelatin (in HPA)
as substrate. Using wine protein as substrate, it was determined that
P-EL was most active between 45-550C. Forty-six degrees centigrade was
chosen as incubation temperature for further treatments of juices and
wines with P-EL.
Effect of Enzyme Concentration on the Activity of Protease EL57-79
Figure 6 reports the influence of protease concentration on the
activity of P-EL. It is apparent that P-EL was most active when used
at 50 mg/L. Above 50 mg/L, there was a gradual decrease in its
activity. It is probable that, at concentrations above 50 mg/L,
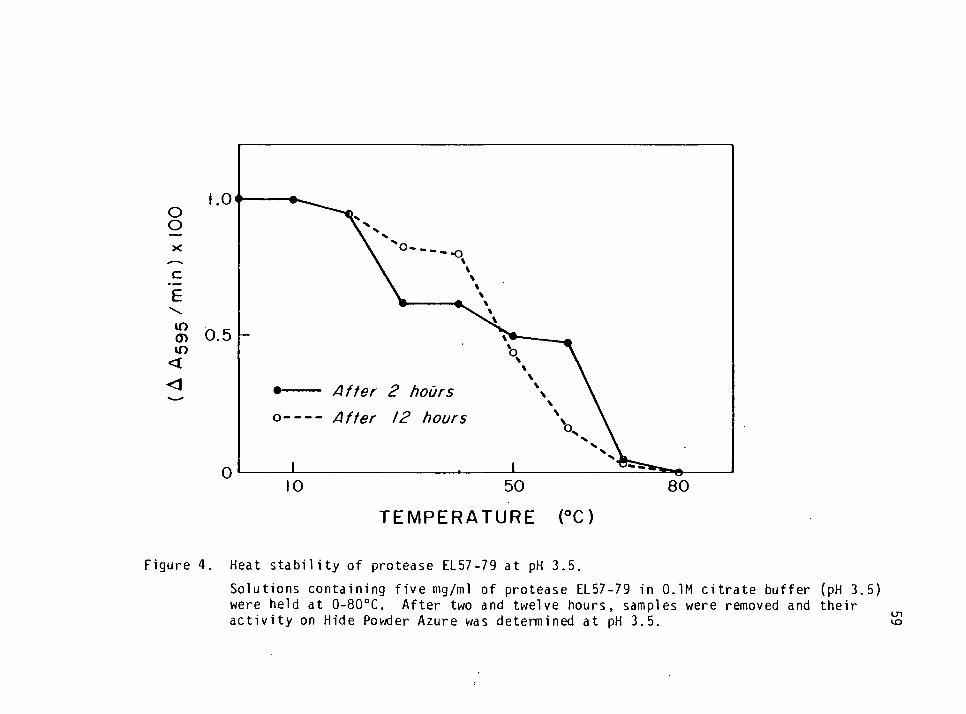
o o
c
E
.0^
<j) 0.0 m
<
0
dffer 2 hours
o After 12 hours
10 50
TEMPERATURE (0C)
Figure 4. Heat stability of protease EL57-79 at pH 3.5.
Solutions containing five mg/ml of protease EL57-79 in O.lM citrate buffer (pH 3.5) were held at 0-80oC. After two and twelve hours, samples were removed and their activity on Hide Powder Azure was determined at pH 3.5. S
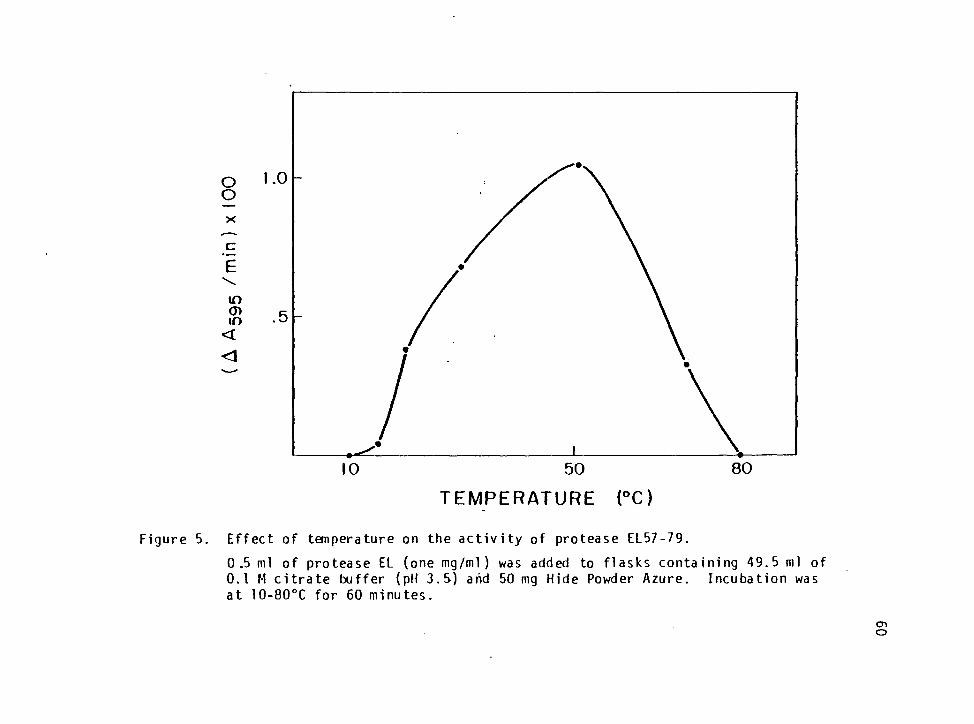
o o
"E
10
in <
TEMPERATURE (0C)
Figure 5. Effect of temperature on the activity of protease EL57-79.
0.5 ml of protease EL (one mg/ml) was added to flasks containing 49.5 ml of 0.1 M citrate buffer (pH 3.5) arid 50 mg Hide Powder Azure. Incubation was at 10-80oC for 60 minutes.
O
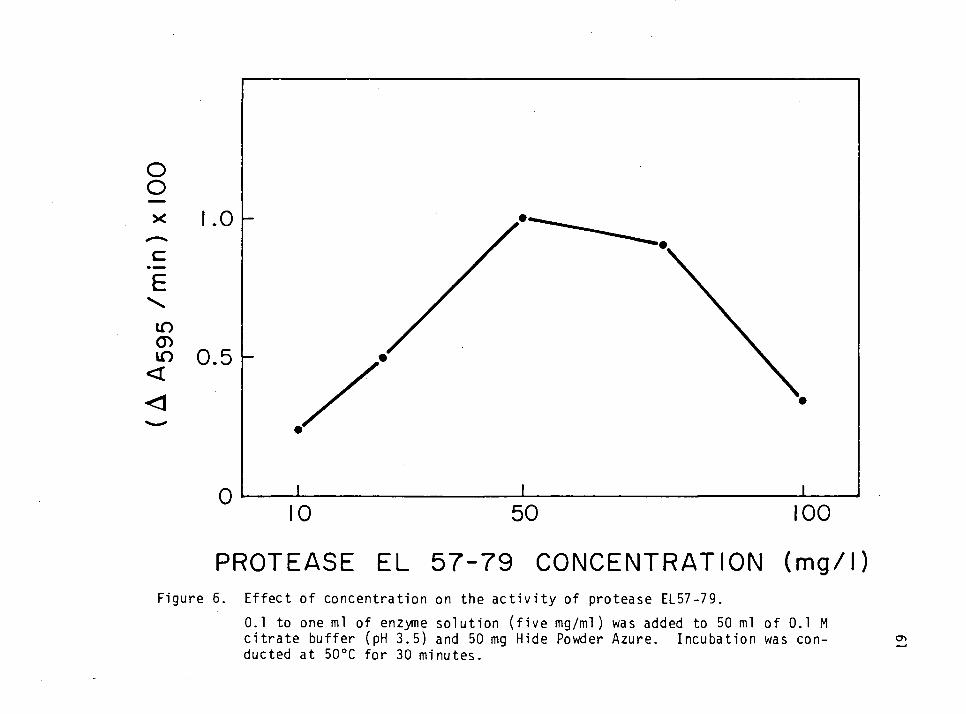
o o
E
10
<
1.0 -
0.5 -
0
PROTEASE EL 57-79 CONCENTRATION (mg/l) Figure 6. Effect of concentration on the activity of protease EL57-79.
0.1 to one ml of enzyme solution (five mg/ml) was added to 50 ml of 0.1 M citrate buffer (pH 3.5) and 50 mg Hide Powder Azure. Incubation was con- ducted at 50oC for 30 minutes.
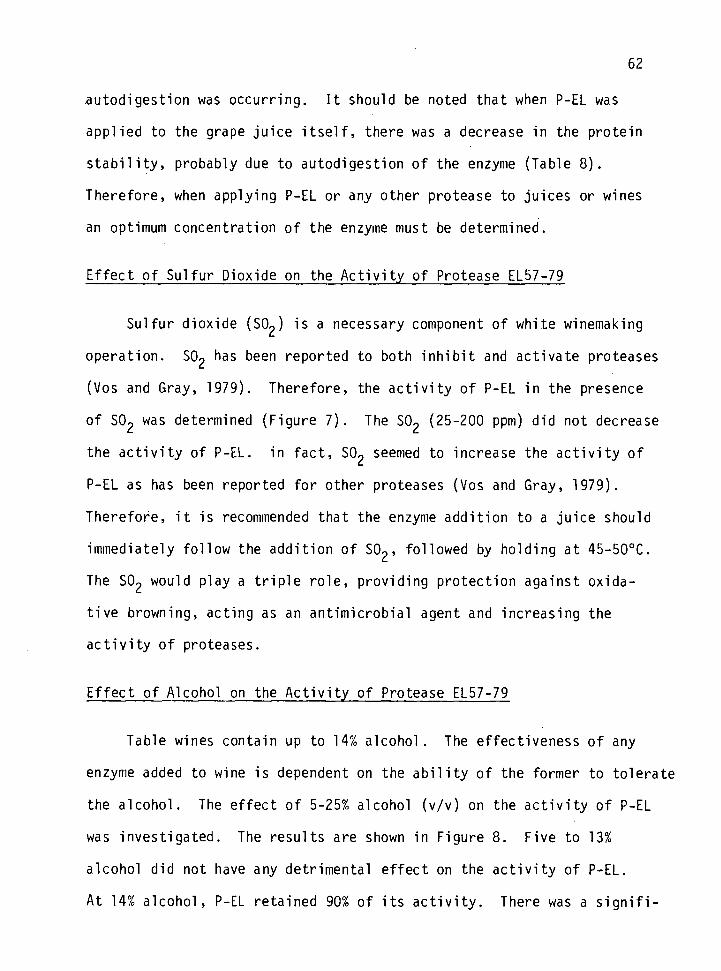
62
autodigestion was occurring. It should be noted that when P-EL was
applied to the grape juice itself, there was a decrease in the protein
stability, probably due to autodigestion of the enzyme (Table 8).
Therefore, when applying P-EL or any other protease to juices or wines
an optimum concentration of the enzyme must be determined.
Effect of Sulfur Dioxide on the Activity of Protease EL57-79
Sulfur dioxide (SO2) is a necessary component of white winemaking
operation. SOn has been reported to both inhibit and activate proteases
(Vos and Gray, 1979). Therefore, the activity of P-EL in the presence
of SO2 was determined (Figure 7). The SO2 (25-200 ppm) did not decrease
the activity of P-EL. in fact, SO2 seemed to increase the activity of
P-EL as has been reported for other proteases (Vos and Gray, 1979).
Therefore, it is recommended that the enzyme addition to a juice should
immediately follow the addition of SO2, followed by holding at 45-50oC.
The SO2 would play a triple role, providing protection against oxida-
tive browning, acting as an antimicrobial agent and increasing the
activity of proteases.
Effect of Alcohol on the Activity of Protease EL57-79
Table wines contain up to 14% alcohol. The effectiveness of any
enzyme added to wine is dependent on the ability of the former to tolerate
the alcohol. The effect of 5-25% alcohol (v/v) on the activity of P-EL
was investigated. The results are shown in Figure 8. Five to 13%
alcohol did not have any detrimental effect on the activity of P-EL.
At 14% alcohol, P-EL retained 90% of its activity. There was a signifi-
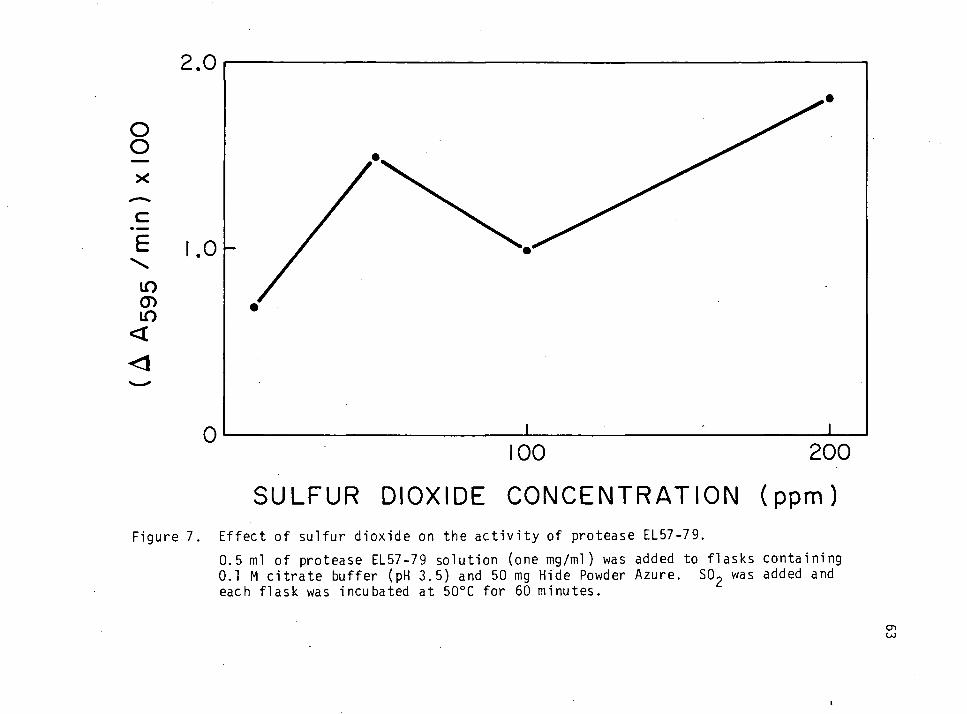
o o
c 6
10
10 <
SULFUR DIOXIDE CONCENTRATION (ppm) Figure 7. Effect of sulfur dioxide on the activity of protease EL57-79.
0.5 ml of protease EL57-79 solution (one mg/ml) was added to flasks containing 0.1 M citrate buffer (pH 3.5) and 50 mg Hide Powder Azure. S02 was added and each flask was incubated at 50oC for 60 minutes.
CTl CO
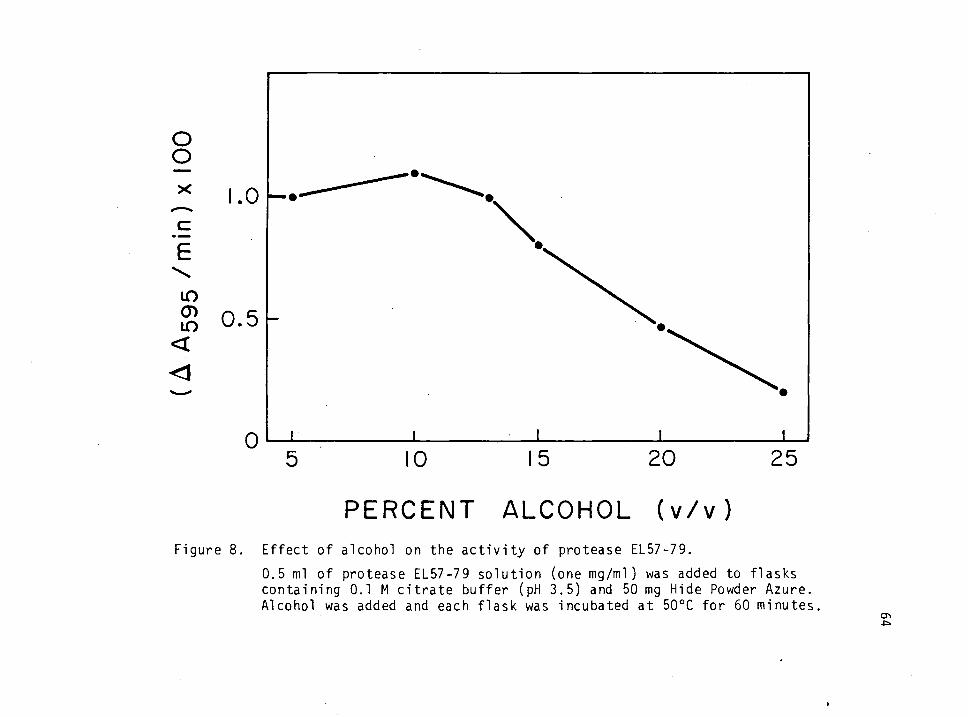
o o
*E
in CD to
<
PERCENT ALCOHOL (v/v) Figure 8. Effect of alcohol on the activity of protease EL57-79.
0.5 ml of protease EL57-79 solution (one mg/ml) was added to flasks containing 0.1 M citrate buffer (pH 3.5) and 50 mg Hide Powder Azure. Alcohol was added and each flask was incubated at 50oC for 60 minutes,
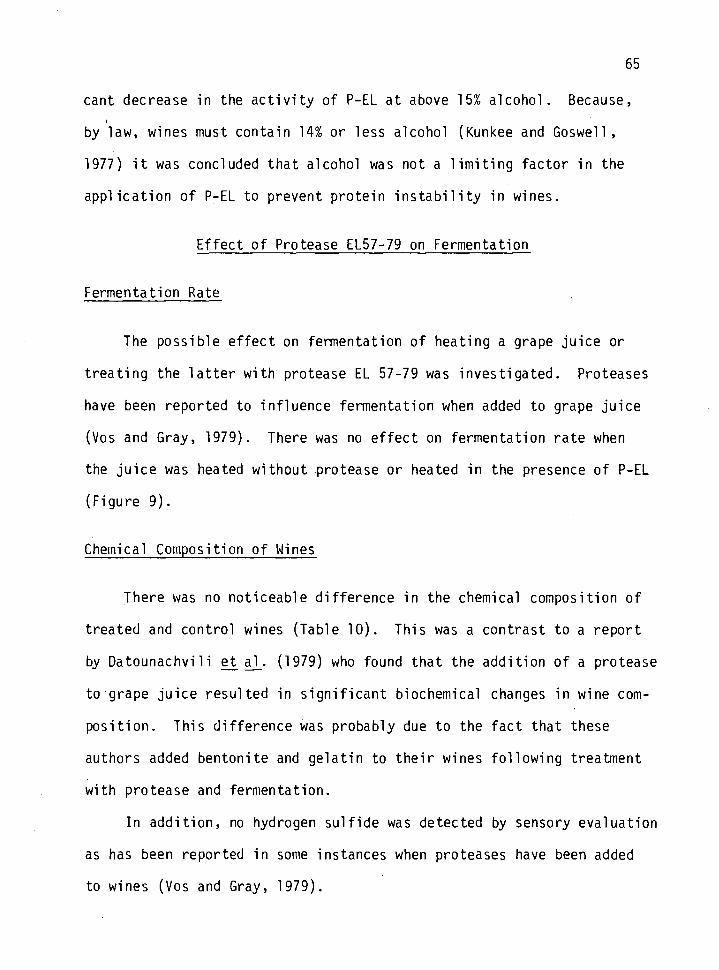
65
cant decrease in the activity of P-EL at above 15% alcohol. Because,
by law, wines must contain 14% or less alcohol (Kunkee and Goswell,
1977) it was concluded that alcohol was not a limiting factor in the
application of P-EL to prevent protein instability in wines.
Effect of Protease EL57-79 on Fermentation
Fermentation Rate
The possible effect on fermentation of heating a grape juice or
treating the latter with protease EL 57-79 was investigated. Proteases
have been reported to influence fermentation when added to grape juice
(Vos and Gray, 1979). There was no effect on fermentation rate when
the juice was heated without protease or heated in the presence of P-EL
(Figure 9).
Chemical Composition of Wines
There was no noticeable difference in the chemical composition of
treated and control wines (Table 10). This was a contrast to a report
by Datounachvili et aj_. (1979) who found that the addition of a protease
to grape juice resulted in significant biochemical changes in wine com-
position. This difference was probably due to the fact that these
authors added bentom'te and gelatin to their wines following treatment
with protease and fermentation.
In addition, no hydrogen sulfide was detected by sensory evaluation
as has been reported in some instances when proteases have been added
to wines (Vos and Gray, 1979).
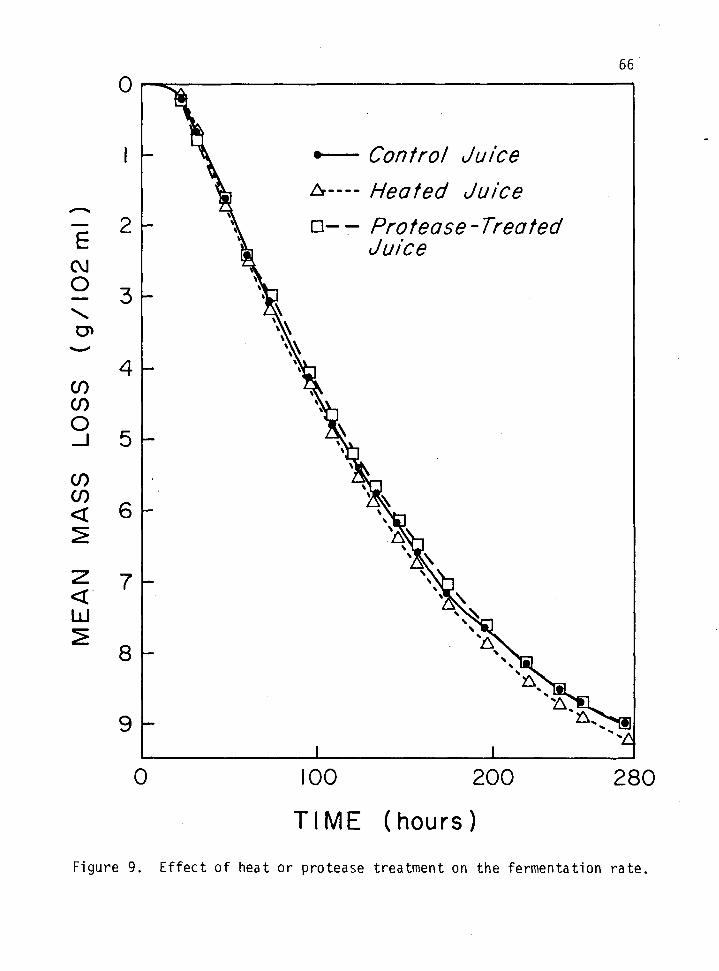
OJ o
en
CO CO O
CO CO <
< LJ
0
1
66
A A^ • Control Juice
\ A— Heated Juice
2 — A □-- Protease-Treated \ Juice
3
4
\
5 —
\
6 \
7
8
-
9 -
i i
0 100 200 280
TIME (hours)
Figure 9. Effect of heat or protease treatment on the fermentation rate.
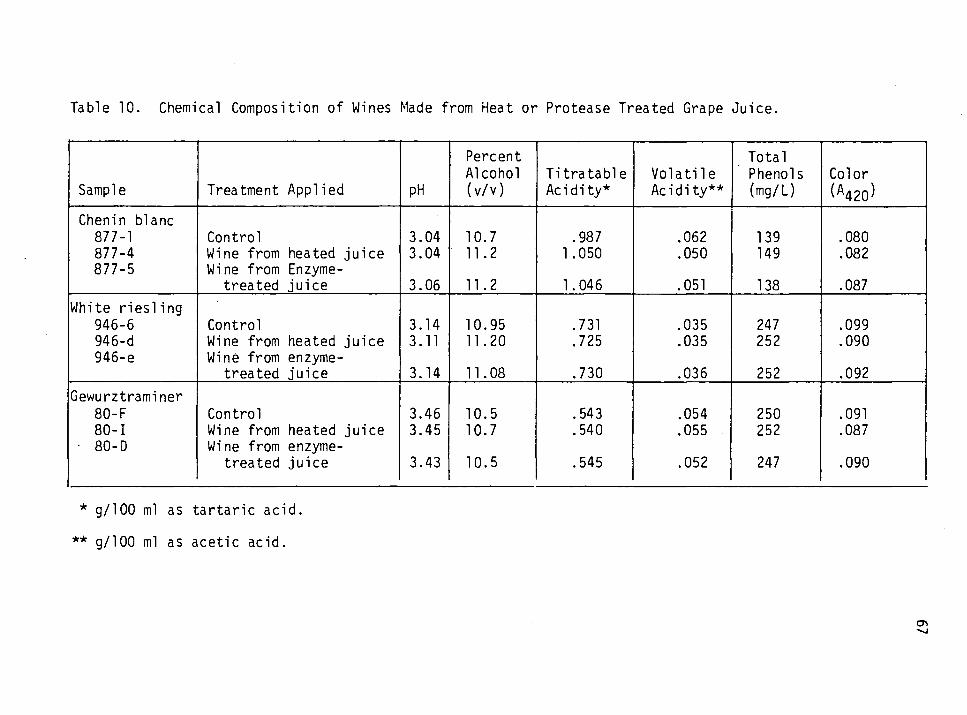
Table 10. Chemical Composition of Wines Made from Heat or Protease Treated Grape Juice.
Percent Total Alcohol Titratable Volatile Phenols Color
Sample Treatment Applied PH (v/v) Acidity* Acidity** (mg/L) (A420)
Chenin blanc 877-1 Control 3.04 10.7 .987 .062 139 .080 877-4 Wine from heated juice 3.04 11.2 1.050 .050 149 .082 877-5 Wine from Enzyme-
treated juice 3.06 11.2 1.046 .051 138 .087
White riesling 946-6 Control 3.14 10.95 .731 .035 247 .099 946-d Wine from heated juice 3.11 11.20 .725 .035 252 .090 946-e Wine from enzyme-
treated juice 3.14 11.08 .730 .036 252 .092
Gewurztraminer 80-F Control 3.46 10.5 .543 .054 250 .091 80-1 Wine from heated juice 3.45 10.7 .540 .055 252 .087
• 80- D Wine from enzyme- treated juice 3.43 10.5 .545 .052 247 .090
* g/100 ml as tartaric acid.
** g/100 ml as acetic acid.
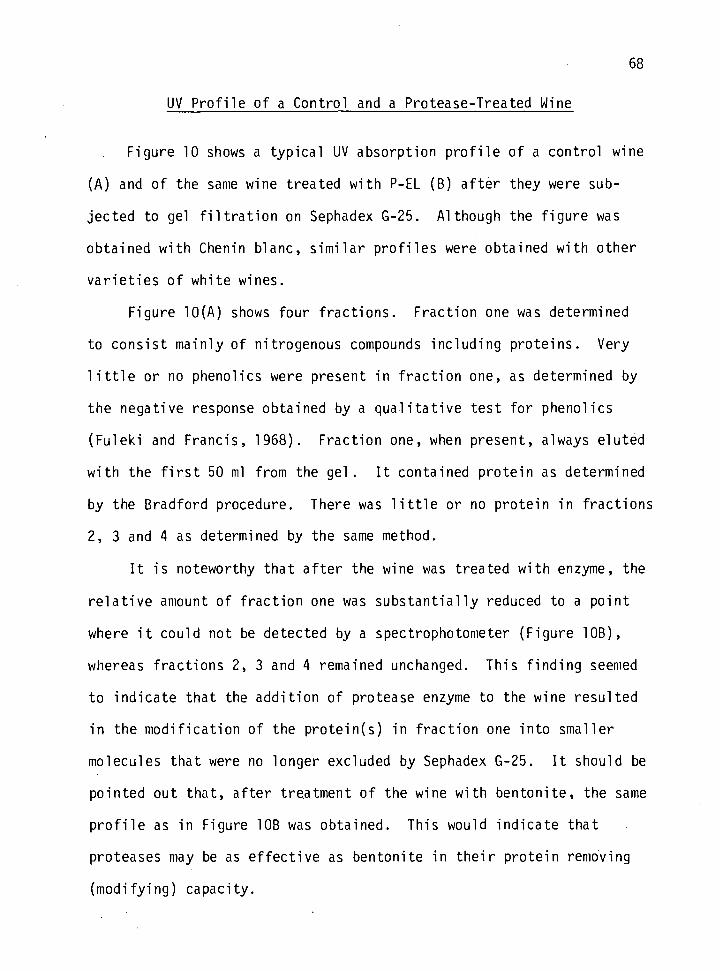
68
UV Profile of a Control and a Protease-Treated Wine
Figure 10 shows a typical UV absorption profile of a control wine
(A) and of the same wine treated with P-EL (B) after they were sub-
jected to gel filtration on Sephadex G-25. Although the figure was
obtained with Chenin blanc, similar profiles were obtained with other
varieties of white wines.
Figure 10(A) shows four fractions. Fraction one was determined
to consist mainly of nitrogenous compounds including proteins. Very
little or no phenolics were present in fraction one, as determined by
the negative response obtained by a qualitative test for phenolics
(Fuleki and Francis, 1968). Fraction one, when present, always eluted
with the first 50 ml from the gel. It contained protein as determined
by the Bradford procedure. There was little or no protein in fractions
2, 3 and 4 as determined by the same method.
It is noteworthy that after the wine was treated with enzyme, the
relative amount of fraction one was substantially reduced to a point
where it could not be detected by a spectrophotometer (Figure 10B),
whereas fractions 2, 3 and 4 remained unchanged. This finding seemed
to indicate that the addition of protease enzyme to the wine resulted
in the modification of the protein(s) in fraction one into smaller
molecules that were no longer excluded by Sephadex G-25. It should be
pointed out that, after treatment of the wine with bentonite, the same
profile as in Figure 10B was obtained. This would indicate that
proteases may be as effective as bentonite in their protein removing
(modifying) capacity.
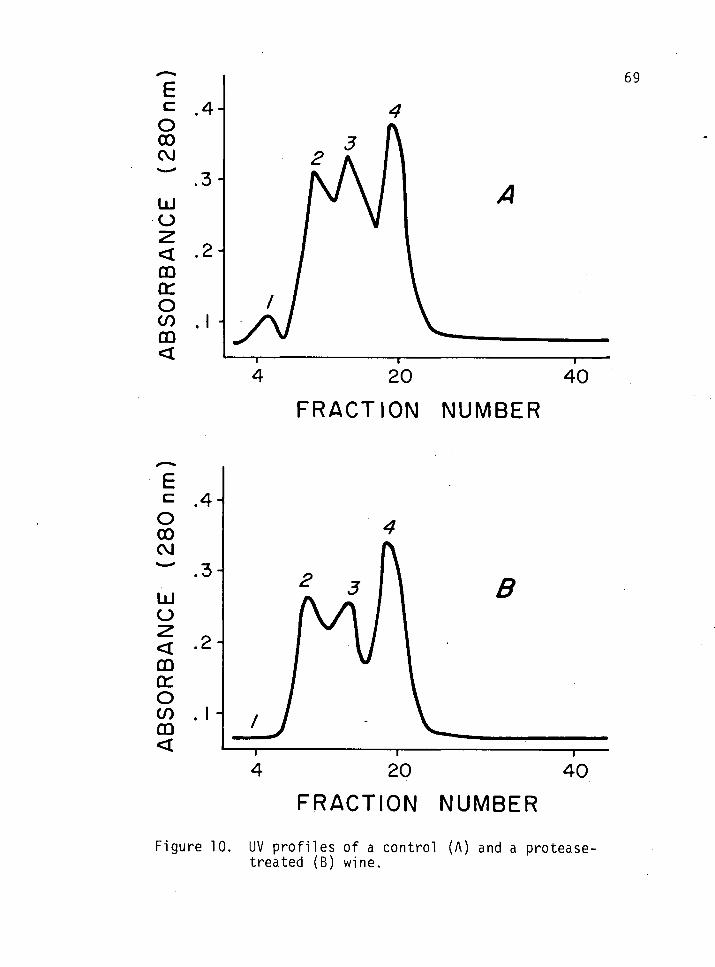
E c O CD OJ
UJ O
< CD OC O <n GO <
.4-
^A
4
A .3- /A A
.2-
/ / /
w
.1 ■ ^ V
69
4 20 40
FRACTION NUMBER
E c O 00 OJ
LU O
< CO cr o CO GO <
.4-
3- B
20
FRACTION NUMBER
40
Figure 10. UV profiles of a control (A) and a protease- treated (B) wine.
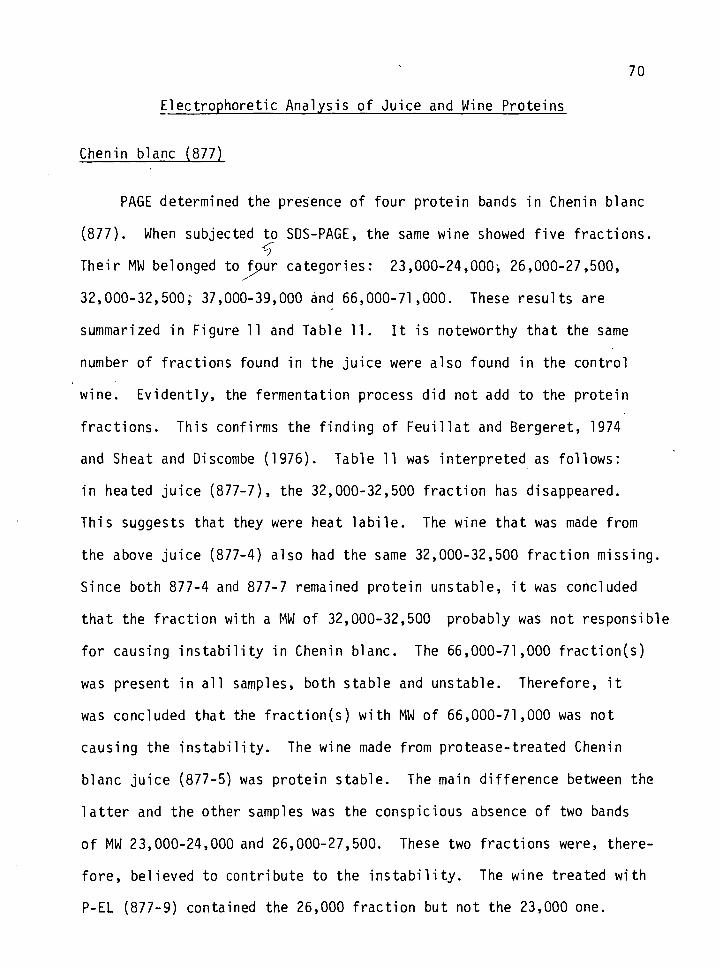
70
Electrophoretic Analysis of Juice and Wine Proteins
Chenin blanc (877)
PAGE determined the presence of four protein bands in Chenin blanc
(877). When subjected to SDS-PAGE, the same wine showed five fractions.
Their MW belonged to fpur categories: 23,000-24,000; 26,000-27,500,
32,000-32,500,' 37,000-39,000 and 66,000-71,000. These results are
summarized in Figure 11 and Table 11. It is noteworthy that the same
number of fractions found in the juice were also found in the control
wine. Evidently, the fermentation process did not add to the protein
fractions. This confirms the finding of Feuillat and Bergeret, 1974
and Sheat and Discombe (1976). Table 11 was interpreted as follows:
in heated juice (877-7), the 32,000-32,500 fraction has disappeared.
This suggests that they were heat labile. The wine that was made from
the above juice (877-4) also had the same 32,000-32,500 fraction missing.
Since both 877-4 and 877-7 remained protein unstable, it was concluded
that the fraction with a MW of 32,000-32,500 probably was not responsible
for causing instability in Chenin blanc. The 66,000-71,000 fraction(s)
was present in all samples, both stable and unstable. Therefore, it
was concluded that the fraction(s) with MW of 66,000-71,000 was not
causing the instability. The wine made from protease-treated Chenin
blanc juice (877-5) was protein stable. The main difference between the
latter and the other samples was the conspicious absence of two bands
of MW 23,000-24,000 and 26,000-27,500. These two fractions were, there-
fore, believed to contribute to the instability. The wine treated with
P-EL (877-9) contained the 26,000 fraction but not the 23,000 one.
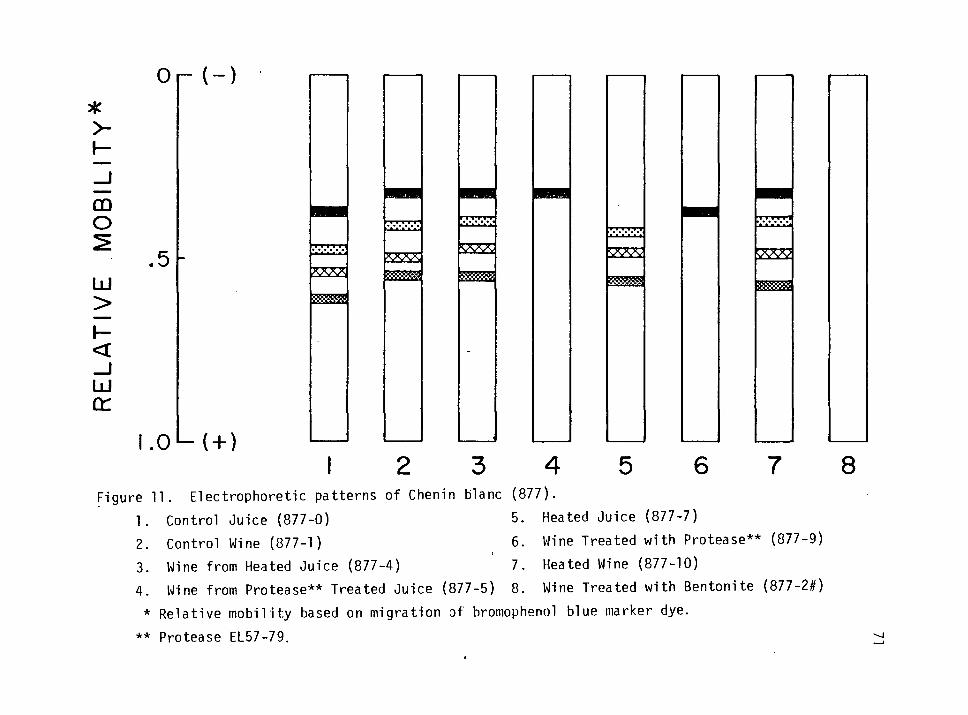
ia
c
-i
* ■P
>
OJ
r\3
—J
(D
*
* •
• '
_,
-a
TO
—'
-5
a>
z*
3^
' o
n
•
O
-^
—J.
—J.
o
o
f-l-
OJ
3
3
3
3
CD
r+
fD
fD
c-+
c+
m
a
i —
J.
-5
-s
—*
en
<
-h
-h
o
o
fD
a>
n>
-s
o
-5
o
—'
' m
=
i =1
^
S"
o
-s
(—
o
—J.
c
o
en
o
- -o
^
3
—*
. -a
■v
j -s
fD
n>
n
3"
i
—J
o
Ol
fD
o
^J
^ s
c+
r+
*—
*. -5
<.
o ^-^
fD
fD
C
O
^—«
fD
^
OJ
CL
^
J
00
r+
in
^
J
^1
-j-
o-
fD
O
1 -^
1 n
a>
*
c
—i
1 to
*
—J.
*
* o
-a
CD
n
a
i Q
. -1
fD
O
fD
^-^
fD
3
o>
co
-s
3
=i
fD
"vj
(/>
a.
1 to
-p
» o
-5
o
, ^_
-' -h
at
c
r+
—J*
O
-J.
o
3-
o
(D
fD
3
3
—4
.
o
00
3
"*
^
1
CT
zr
1 ^
-s
cn
Q
J
o
3
n
o
-c
co
^J
<J
\ CJ
1 ^-
^ 3
"
. •
00
(D
~
J
3
~~
j
O
s
~r*
s:
n:
>_^
—^
—1*
fD
fD
>
3
Q>
3
Q)
a-
fD
r+
fD
r+
fD
fD
c
■H
CL
—
1 Q
. n>
-5
-5
fD
S
^
fD
C_,
^
OJ
—t.
a>
c
a>
r+
3
r+
-J.
-s
fD
fD
fD
n
^r
a.
a.
fD
ro
*—
■*
-5
r 0
0
s .—
-«. —*
• ^
J
^*
00
C
L
r+
-~J
c+
■-»
4 ^
3
"
1 3
"
•~J
m
—J
1 0
0
o
-o
-O
fD
-! *—
^ 3
O
r+
n
- O
fD
3
at
-J*
V
) ri
- fD
(D
*
^—^
00
^-*
^ ^
J
co
»vl
ro
i =t
fc
lO
RE
LA
TIV
E M
OB
ILIT
Y^
—r-
+
ro
ET
OJ
oi
CD
1
CO
LZ
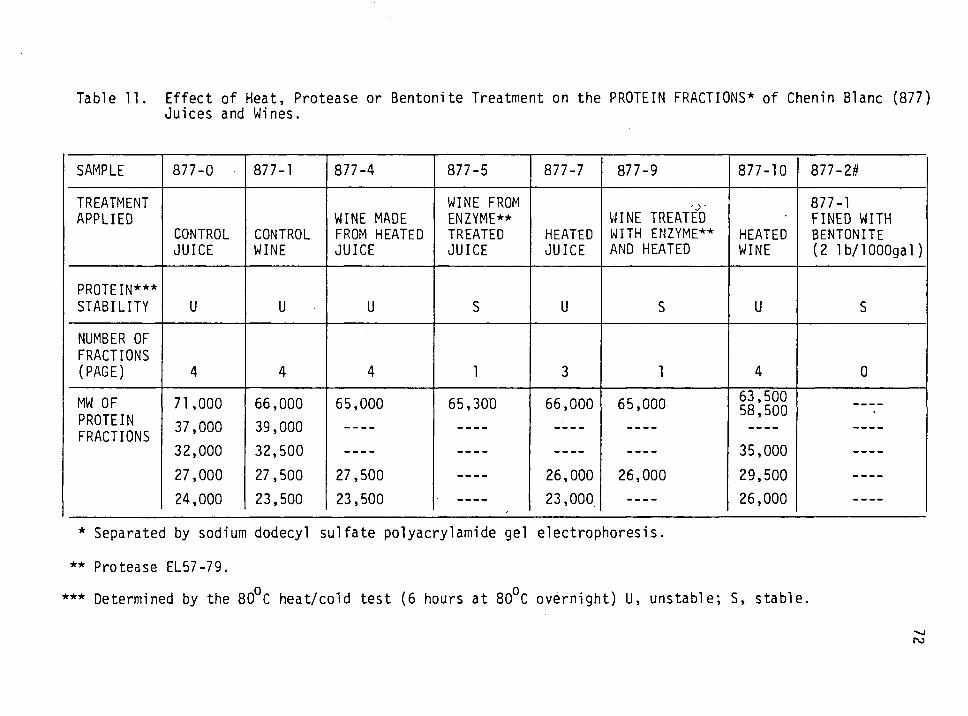
Table 11. Effect of Heat, Protease or Bentonite Treatment on the PROTEIN FRACTIONS* of Chenin Blanc (877) Juices and Wines.
SAMPLE 877-0 877-1 877-4 877-5 877-7 877-9 877-10 877-2#
TREATMENT APPLIED
CONTROL JUICE
CONTROL WINE
WINE MADE FROM HEATED JUICE
WINE FROM ENZYME** TREATED JUICE
HEATED JUICE
WINE TREATED WITH ENZYME** AND HEATED
HEATED WINE
877-1 FINED WITH BENTONITE (2 Ib/lOOOgal)
PROTEIN*** STABILITY U U U S U S U S
NUMBER OF FRACTIONS (PAGE) 4 4 4 1 3 1 4 0
MW OF PROTEIN FRACTIONS
71,000
37,000
32,000
27,000
24,000
66,000
39,000
32,500
27,500
23,500
65,000
27,500
23,500
65,300 66,000
26,000
23,000
65,000
26,000
63,500 58,500
35,000
29,500
26,000
* Separated by sodium dodecyl sulfate polyacrylamide gel electrophoresis.
** Protease EL57-79.
*** Determined by the 80OC heat/cold test (6 hours at 80OC overnight) U, unstable; S, stable.
73
Considering that 877-9 was protein stable, it was concluded that the
26,000 fraction(s) was heat stable and that the fraction of MW 23,000-
24,000 was the major protein responsible for causing the instability in
Chenin blanc (877).
White riesling (946)
PAGE determined that there were up to five fractions in White
riesling (946) wines and juices (Figure 12). As with Chenin blanc (877)
the same number of fractions present in the juice were also present in
the wine. SDS-PAGE showed that the five protein fractions had MW of
22,000-25,000 and 34,000-38,000 (Table 12). The same two MW fractions
were present in all white riesling (946) samples except the wine treated
with P-EL (946-C) and that fined with bentonite (946-2#) which showed no
fractions with either PAGE or SDS-PAGE and the wine made from P-EL-
treated juice (946-E) which had only the 37,500 fraction. This led to
the conclusion that the protein fraction(s) with a MW of 22,000-25,000
was responsible for causing the instability in White riesling (946),
since all samples in which it was present were protein unstable, whereas
the samples in which it was absent were protein stable.
Gewurztraminer (80)
Figure 13 and Table 13 summarize the results of the PAGE and SDS-
PAGE obtained with Gewurztraminer (80). Both the juice and wine had a
maximum of seven bands with their MW ranging from 16,500-90,000. It is
noteworthy that this particular sample which had a higher concentration
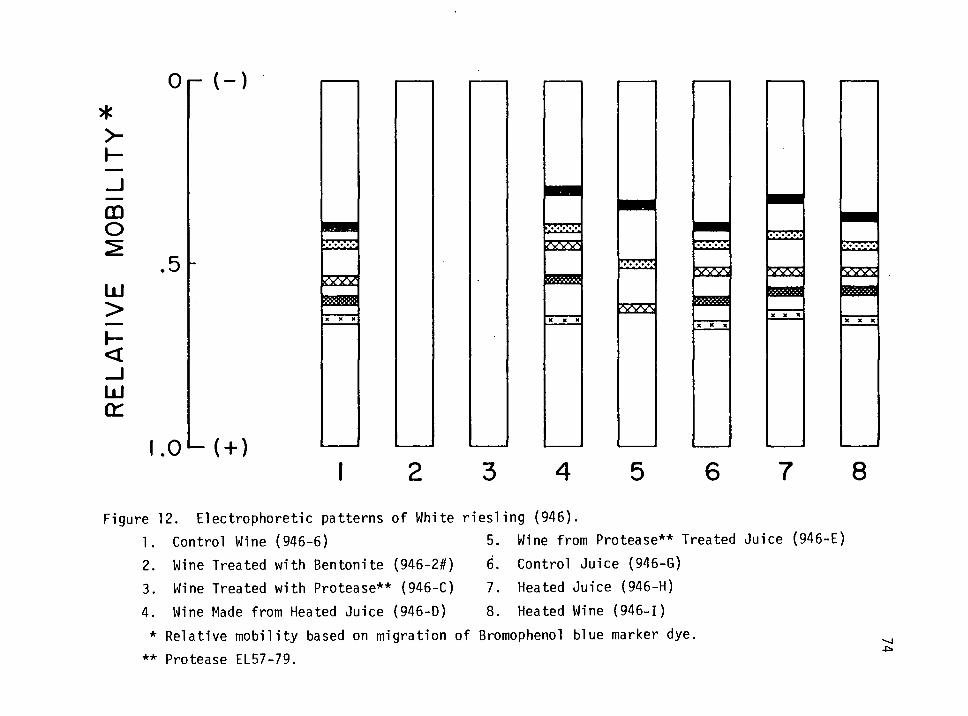
>-
CD O
LU >
UJ
Or (-)
.5
1.0 L( + )
<vw
SSSS3S3S
?xY7
nocona
^s
'-*■*■■*■
vyx> S22S ww BBBBBB
8
Figure 12. Electrophoretic patterns of White riesling (946).
1. Control Wine (946-6) 5. Wine from Protease** Treated Juice (946-E)
2. Wine Treated with Bentonite (946-2#) 6. Control Juice (946-G)
3. Wine Treated with Protease** (946-C) 7. Heated Juice (946-H)
4. Wine Made from Heated Juice (946-D) 8. Heated Wine (946-1)
* Relative mobility based on migration of Bromophenol blue marker dye.
** Protease EL57-79.
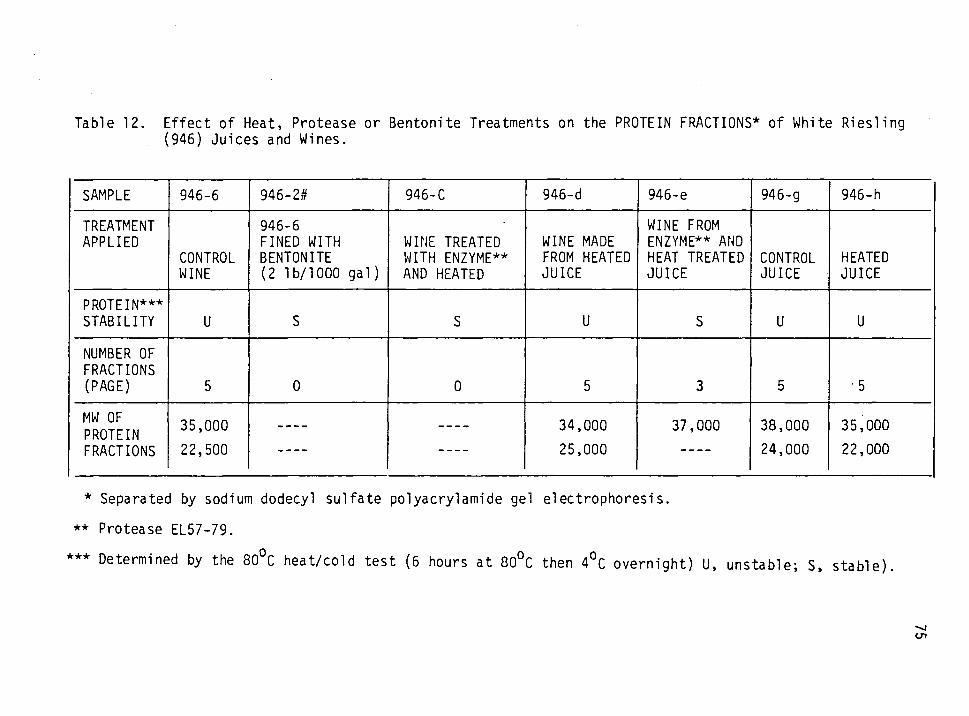
Table 12. Effect of Heat, Protease or Bentonite Treatments on the PROTEIN FRACTIONS* of White Riesling (946) Juices and Wines.
SAMPLE 946-6 946-2# 946-C 946-d 946-e 946-g 946-h
TREATMENT APPLIED
CONTROL WINE
946-6 FINED WITH BENTONITE (2 lb/1000 gal)
WINE TREATED WITH ENZYME** AND HEATED
WINE MADE FROM HEATED JUICE
WINE FROM ENZYME** AND HEAT TREATED JUICE
CONTROL JUICE
HEATED JUICE
PROTEIN*** STABILITY U S S U S U U
NUMBER OF FRACTIONS (PAGE) 5 0 0 5 3 5 5
MW OF PROTEIN FRACTIONS
35,000
22,500
34,000
25,000
37,000 38,000
24,000
35,000
22,000
* Separated by sodium dodecyl sulfate polyacrylamide gel electrophoresis.
** Protease EL57-79.
Determined by the 80OC heat/cold test (6 hours at 80OC then 40C overnight) U, unstable; S, stable) ***
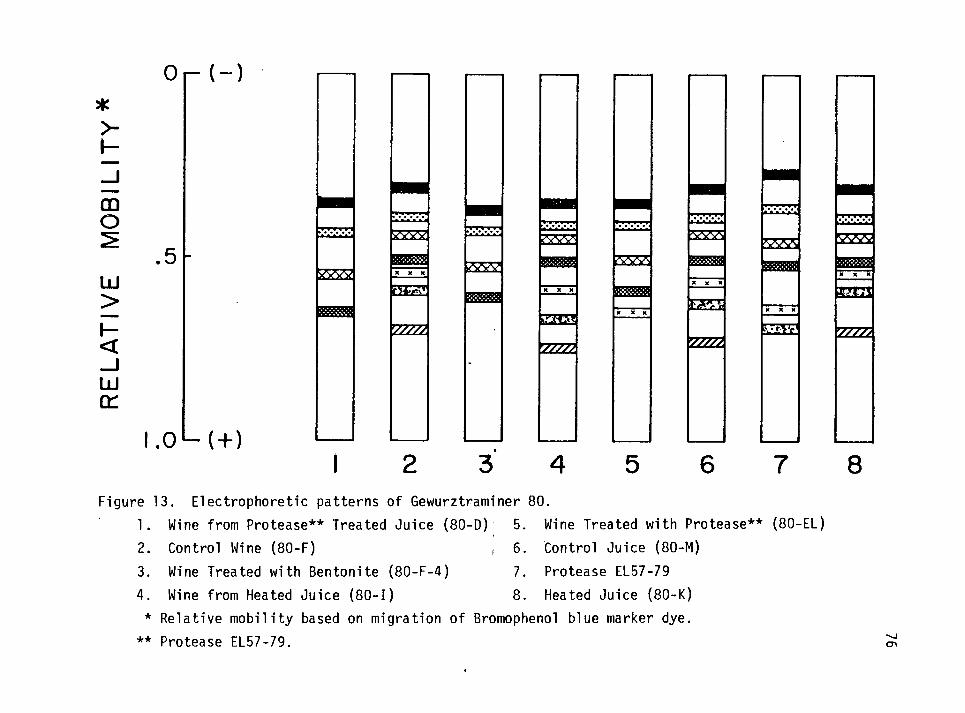
DQ O
LU >
< _J LJ
0
.5
(-)
ZZZ2
l.0L-( + )
xvyy
[5122
Z^
????
• ■•■II
S2Z
232!
2ZZZ2
ESSS
"VVVS
ES
TZ^?
^> w * w r
SZS
SZ23
i ■ i ■ ■ i
vwv
szm
7777;
8 Figure 13. Electrophoretic patterns of Gewurztraminer 80.
1. Wine from Protease** Treated Juice (80-D) 5. Wine Treated with Protease** (80-EL)
2. Control Wine (80-F) j 6. Control Juice (80-M)
3. Wine Treated with Bentonite (80-F-4) 7. Protease EL57-79
4. Wine from Heated Juice (80-1) 8. Heated Juice (80-K)
* Relative mobility based on migration of Bromophenol blue marker dye.
** Protease EL57-79. en
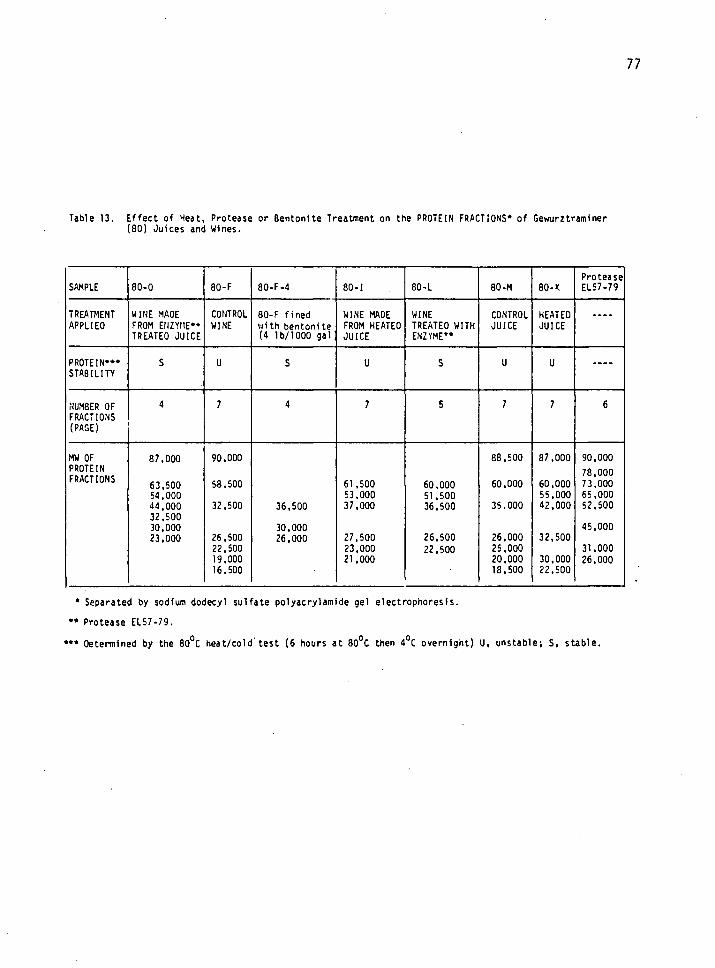
77
Table 13. Effect of Heat, Protease or Bentonlte Treatment on the PROTEIN FRACTIONS* of Gewurztramlner (80) Juices and Wines.
Protease SAMPLE 80-0 80-F 80-F-4 80-1 80-L 80-M 80-K EL57-79
TREATMENT WINE MADE CONTROL 80-F fined WINE MADE WINE CONTROL HEATED .>••• APPLIED FROM ENZYME**
TREATED JUICE WINE with bentonite
(4 lb/1000 gal FROM HEATED JUICE
TREATED WITH ENZYME**
JUICE JUICE
PROTEIN*** S U S U S U U STABILITY
NUMBER OF 4 7 4 7 5 7 7 6 FRACTIONS (PAGE)
MW OF 87,000 90,000 88.500 87.000 90.000 PROTEIN 78,000 FRACTIONS
63,500 53,500 61,500 60,000 60,000 60,000 73.000 54,000 53,000 51,500 55,000 65.000 44,000 32.500 36,500 37,000 36,500 35.000 42,000 52.500 32.500 30,000 30.000 45.000 23,000 26,500 26,000 27,500 26,500 26.000 32,500
22,500 23.000 22,500 25,000 31.000 19,000 21,000 20,000 30,000 26,000 16,500 18,500 22.500
* Separated by sodium dodecyl sulfate polyacrylamide gel electrophoresfs.
** Protease EL57-79.
*** Determined by the 800C heat/cold'test (6 hours at 800C then 40C overnight) U, unstable; S, stable.
78
of protein than either the Chenin blanc or the White riesling, required
more bentonite to become stable (4 lbs/1000 gal), also had a higher
number of protein fractions.
A conspicious feature of Table 13 is the presence of the 16,BOO-
TS, 500 and the 20,000-23,000 fractions in the protein unstable samples
(80-F, 80-1 and 80-M). Furthermore, the three stable samples (80-D, 80-
F-4# and 80-1) contained the 20,500 but not the 16,000 and 19,000
fractions. By a process of elimination it was concluded that the
protein fractions of MW 16,000-19,000 were responsible for causing the
instability in Gewurztraminer (80) juice and wine.
In the latter sample, as in Chenin blanc (877) and in White riesling
(946), the lowest MW fractions were responsible for causing the protein
instability. One explanation is that, when polymerized phenolics or
tannins mix with the larger MW protein fractions, the resulting copolymers
are too "heavy" and precipitate out during normal vinification, where-
as the copolymers formed with the low MW protein fractions are not "heavy"
enough to be eliminated, thus they remain in the wine and become unstable
in time, after bottling, when conditions are more favorable for their
precipitation. Another important factor is the isoelectric points of
the wine proteins which determine when the individual proteins remain
soluble or precipitate out of solution. Furthermore, it may be that
smaller polypeptides or protein are more easily denatured by alcohol
produced during fermentation and are more readily attacked by proteases.
Indeed, their secondary and/or tertiairy structures may be more easily
disrupted and require less energy to denature than those of larger more
complex proteins.
79
Effect of Bentonite Concentration on Wine Protein Fractions
Table 14 shows the effect of increasing bentonite concentrations on
the various fractions of proteins in wines. In all three varieties
studied, as bentonite was added it tended to remove the larger MW
fractions of protein first. This could be due to a size factor since
the larger MW proteins have more surface area and can come in contact
with more of the bentonite micelles. Upon removing these fractions the
wine did not become protein stable. Only after the lower MW protein
fractions were removed by the addition of more bentonite did the wines
become protein stable. In particular, after the addition of 3 lbs/1000
gal of bentonite to Gewurztraminer (80) the 90,000 and 60,000 MW
fractions were eliminated, but the wine was still protein unstable.
After four lbs of bentonite/1000 gal the 19,000 and 23,000 fractions
were also removed, and the wine became protein stable. Therefore, it
was concluded that either one or both of these fractions were causing
the instability in Gewurztraminer (80).
These findings are very significant because the same results were
obtained after treatment of the wines with P-EL57-79; the latter elimin-
ated the large MW protein fractions first. Therefore, it is proposed
that there exists a similarity in the way bentonite and proteases
stabilize wine proteins.
In summary, when bentonite or protease EL57-79 were added to juices
or wines made from Chem'n blanc (877), White riesling (946) and
Gewurztraminer (80) they first removed or modified the larger proteins,
then they did the same to the lower MW proteins which were responsible for
causing the instability. This is in contrast to previous reports in the
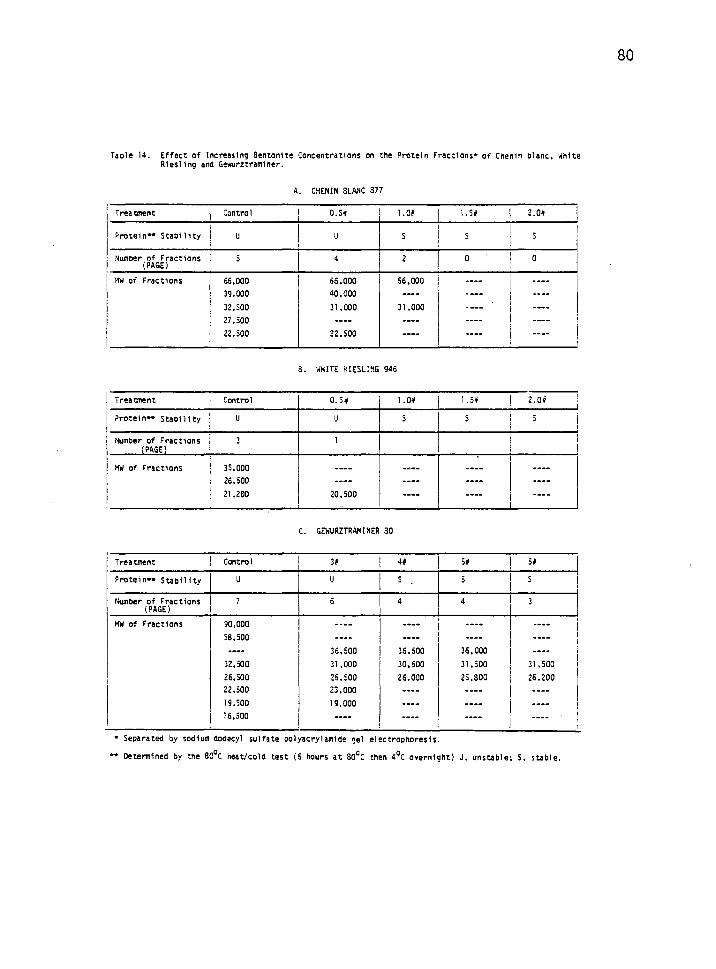
80
Table 14. Effect of Increasing Sentonite Concentrations on the Protein Fractions* of Chenin blanc, Riesling and Gewurztraminer.
A. CHENIN BLANC 877
Treatment Control 0.5# 1.0# 1.5* 2.0*
Protein" Stability U U S S s
Number of Fractions (PAGE)
S 4 2 o ■ 0
MW of Fractions 66.000 66,000 66,000 — — 39,000 40,000 — — 32.500 31,000 31,000 — — 27,500 — — 22,500 22,500 —
3. WHITE KIESLiNG 946
Treatment Control 0.5# 1.0# 1.5* 2.0*
?rotein»» Stability U U s S s
Number of Fractions (PAGE)
3 1
MW of Fractions 35,000
26,500
21,200 20,500 .... ....
GEWURZTRAMINER 80
Treatment Control 3# 4# 5* 5*
Protein-* stability U U S . S S
Number of Fractions (PAGE)
7 6 4 4 3
MW of Fractions 90,000 58,500
36,500 36,500 36,000
32,500 31,000 30,600 31,500 31,500
26,500 26.500 26.000 25,800 26.200
22,500 23,000 19,500 19,000 16.500 — ;
* Separated by sodium dodecyl sulfate oolyacrylanide eel electropnoresis.
** Determined by the 800C heat/cold test (6 hours at a0cC then 40C overnight) U, unstable; S, stable.
81
literature which state that the higher MW fractions are responsible for
instability and that bentonite tends to remove the more unstable proteins
in priority (Singleton, 1974). It is possible that this discrepancy was
due to varietal differences.
Isoelectric Focusing of Wine Proteins
The isoelectric points (pis) of the proteins in Chenin blanc (877),
White riesling (.946) and Gewurztraminer (80) were determined (Table 15).
There were more pis than the number of protein fractions deter-
mined by PAGE and SDS-PAGE. One explanation is that two or more proteins
had the same MW, but not the same pis. The pis ranged from 4.8-8.0
with most of them being between 5.2-5.9. This was in contrast to
reports in the literature which claim that the pis of proteins from
wines fall in the range of 3.3-3.7 and are very close to the pH of the
wines (Singleton, 1974). Isoelectric points of 3.89-8.22 have been
reported for grape juice proteins, but those with the highest pis are
believed to be eliminated during wine processing (Singleton, 1974).
Chenin blanc (877) proteins had pis of 5.2-5.9, only the fraction
with a pi of 5.8 was eliminated by heat treatment (877-4). P-EL re-
moved all protein fractions from Chenin blanc except that which has a
pi of 5.9 (877-5), whereas bentonite fining removed all fractions.
This is in agreement with results obtained by electrophoresis (Figure
12). The protein fraction with a pi of 5.9 was present in all samples,
both stable and unstable. Therefore, it was probably not responsible
for the instability. SDS-PAGE determined that the protein with a MW of
65,000-71,000 was present in all Chenin blanc samples (Table 11). In
82
particular, wine 877-5 showed only one fraction with a MW of 65,300 and
its isoelectric focusing showed one pi at 5.9 (Table 15). Therefore, it
was concluded that the protein fraction with a MW 65,300 had a pi of 5.9
and was not "unstable". The unstable fraction(s) could be any of those
with pis of 5.2-5.9.
The protein fractions in White riesling (946) had MW of 32,500 and
35,000 (Table 12). Isoelectric focusing showed that these fractions had
eight pis ranging from 5.2-5.9. White riesling 946-2#, which was
protein stable as a result of bentonite fining, showed no protein
fractions with isoelectric focusing (Table 15) as with electrophoresis
(Table 14). The White riesling wine which was made from the enzyme-
treated juice (946-E) was also protein stable and its three protein
fractions had pis of 5.2, 5.3 and 5.4. All proteins with a pi higher
than 5.4 had been eliminated, except for that with pi 5.9, which was
present in all samples, stable and unstable. Therefore, it was con-
cluded that the unstable fractions had pis of 5.5-5.8, whereas the
stable fractions had pis of 5.2-5.4.
Gewurztraminer (80) protein fractions had pis ranging from 4.8-8.0.
Those with pis of 4.8-5.6 were present in one or more of the stable
wines (80-D and 80-F-4#) as shown in Table 15. Those protein fractions
with pis of 6.6, 7.1, 7.6 and 8.0 were present in the unstable samples
(80-F and 80-1) but were missing in the stable samples. It was con-
cluded that either one or all of these fractions were unstable. So, as
in White riesling, those proteins with the highest pis were more
prone to causing the instability. This is compatible with infor-
mation available in the literature (Singleton, 1974). Isoelectric
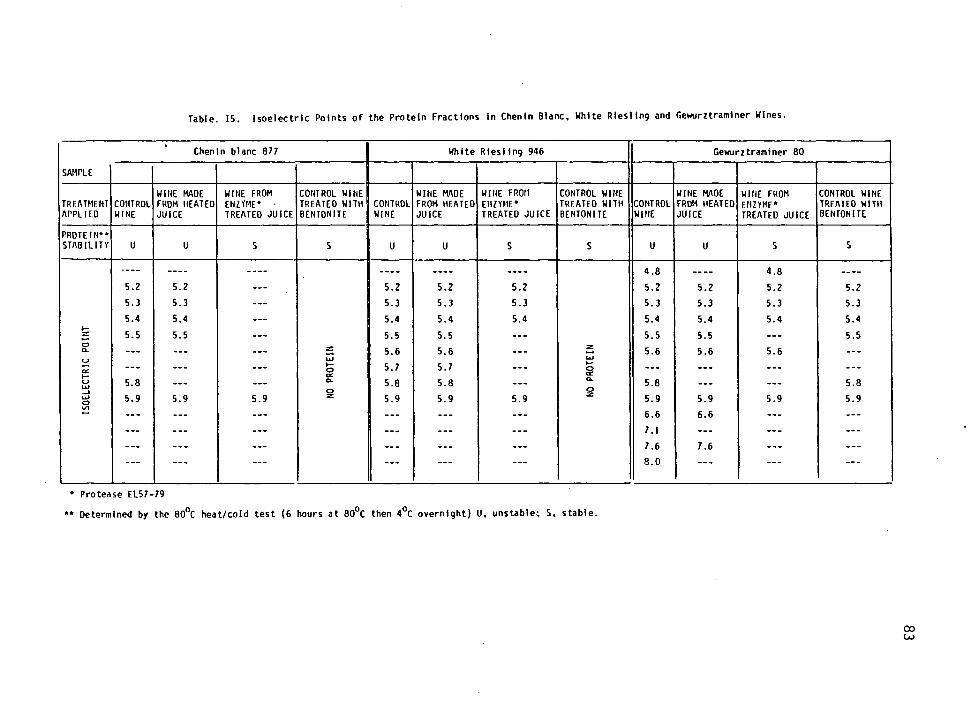
Table. 15. Isoelectric Points of the Protein Fractions In Chenin Blanc, White Riesling and Gewurztramlner Wines.
SAMPLE
Chenin blanc 877 White Riesling 946 Gewurztraminer 80
TREATMENT APPLIED
CONTROL WINE
WINE HADE FROM HEATED JUICE
WINE FROM ENZYME* • TREATED JUICE
CONTROL WINE TREATED WITH BENTONITE
CONTROL WINE
WINE MADE FROM HEATED JUICE
WINE FROM ENZYME* TREATED JUICE
CONTROL WINE TREATED WITH BENTONITE
CONTROL WINE
WINE MADE FROM HEATED JUICE
WINE FROM ENZYME* TREATED JUICE
CONTROL WINE TREATED WITH BENTONITE
PROTEIN** STABILITY u U S S U U S S U U S S
4.8 4.8 5.2 5.2 — 5.2 5.2 5.2 5.2 5.2 5.2 5.2 5.3 5.3 ... 5.3 5.3 5.3 5.3 5.3 5.3 5.3 5.4 5.4 ... 5.4 5.4 5.4 5.4 5.4 5.4 5.4
5.5 5.5 ... 5.5 5.5 ... 5.5 5.5 ... 5.5 Q-
CJ
Qd 1- CJ UJ _l ui o
5.8
5.9 5.9 5.9
z UJ ►- o a: a.
§
5.6
5.7
5.8
5.9
5.6
5.7
5.8
5.9 5.9
UJ 1- o ac a. o 2=
5.6
5.8
5.9
5.6
5.9
5.6
5.9
5.8
5.9
-•- — :::
— — :::
6.6
7.1
6.6 :::
—
... ... ... ... ... ... 7.6
8.0
7.6 ... ...
* Protease EL57-79
** Determined by the 80oC heat/cold test (6 hours at 80oC then 40C overnight) U, unstable; S, stable.
CO
84
focusing also confirmed that heat treatment (up to 50oC), when applied
without enzyme, did not have much effect on wine protein fractions
(Table 15).
In general, the protein fractions in the varieties studied, Chenin
blanc. White riesling and Gewurztraminer had their pis in the range of
4.8-8.0 with the majority of the pis between 5.0-6.0, and they had MW
of 16,000-90,000. Those protein fractions responsible for the in-
stability, tended to have lower MW and higher pis than the more heat
stable ones.
85
SUMMARY
Selected 1978 and 1979 Oregon and Washington white varietal wines
were screened for protein content and protein stability. Three varieties,
chenin blanc, White riesling and Gewurztraminer were studied in detail.
The potential use of commercial protease S and experimental protease
EL57-79, PVPP, XAD-4 and silica sols as bentonite substitutes to protein
stabilize wines was investigated.
Individual protein fractions present in the control (unstable) wines
and the wines stabilized with proteases or bentonite were studied by
electrophoresis and isoelectric focusing.
The results and conclusions may be summarized as follows:
1. 1978 wines contained an average of 153.2 mg/L of protein and
required 4.9 lbs of bentonite/1000 gal. for stabilization; 1979 contained
177.6 mg/L of protein and required 3.6 lbs of bentonite/1000 gal. for
stabilization. A few of the wines required up to 12 lbs of bentonite/
1000 gal. There was protein instability in wines made from Oregon and
Washington grapes.
2. The shorter (one day) 80oC heat test was more convenient and it
compared favorably with the longer (six days) heat test, when used to
predict protein instability.
3. It was possible to use the Hunter Color/Difference Meter to mea-
sure protein haze and correlate the results to practical protein stability.
4.. The Bradford procedure for the determination of protein was a
rapid and reliable method to determine non-dialyzable proteins in white
table wines.
86
5. PVPP, XAD-4 and Silica sols did not significantly improve the
protein stability of wines to which they were added.
6. Commercial protease S was ineffective as a substitute for
bentonite in protein stabilizing wines, due to their low activity at
wine pH.
7. It was possible to produce protein stable wines using exper-
mental protease EL57-79 on grape juices or wines at temperatures of 45-
50oC.
8. Experimental protease EL57-79 had the most activity between pH
3 and 5 and had a pH optimum of 3.5 and a temperature optimum of 50oC
with gelatin as substrate. It was inactive between 0oC and 150C. Its
activity was not impaired by up to 13% alcohol and up to 200 ppm sulfur
dioxide.
9. The application of protease to the juice did not have any
effect on the fermentation rate and on the color and the chemical
composition of the resulting wines.
10. Four fractions were obtained from chromatography of control
wine on Sephadex G-25. The first fraction consisting mainly of protein
was almost totally removed after treatment of the wine with either
protease or bentonite.
11. Chenin blanc (.877) contained proteins with MW ranging from
23,000 to 71,000 and Pis ranging from 5.2 to 5.9. Those protein(s) with
MW of 23,000-24,000 and pis of 5.2-5.5 were unstable.
12. White riesling (946) had proteins with MW of 22,000-38,000 and
Pis of 5.2 to 5.9; the unstable ones had MW of 22,000-24,000 and Pis of
5.5-5.8.
87
13. Gewurztraminer (80) proteins had MW of 16,000-90,000 and Pis
of 4.8-8.0. The unstable proteins had MW of 16,000-19,000 and Pis of
6.6, 7.1 and 8.0.
14. There was a similarity in the ways bentonite and protease EL57-79
stabilize wines. Both tended to eliminate (or modify) the large MW
proteins first, before acting on the lower MW proteins which were more
unstable.
15. The application of a protease enzyme such as experimental
protease EL57-79 as a bentonite substitute for protein stabilizing wines is
a promising technology deserving further evaluation.
88
BIBLIOGRAPHY
u Amerine, M.A. and Ough, C.S. 1980. Methods for Analysis of Musts and Wines. John Wiley and Sons, New York.
/ Amerine, M.A., Berg, H.W., Kunkee, R.E., Ough, C.S., Singleton, V.L. and Webb, A.D. 1979. Technology of Winemaking. AVI Publishing Company, Inc., Westport, Connecticut.
Anelli, G. 1977. The proteins of musts. Am. J. Enol. Vitic. 28(4): 200-203.
Anonymous. 1978. Technical Information on Fungal Proteinase S. Rohm Enzyme, Darmstadt, West Germany.
Anonymous. 1980. A Step-by-Step Guide to Isogel Agarose Isoelectric Focusing. FMC Marine Colloids Division of Bio Products. Rockland, Maine.
/ Bayly, F.C. and Berg, H.W. 1969. Grape and wine proteins of white wine varietals. Am. J. Enol. Vitic. 18(l):18-32.
Berg, H.W. and Akiyoshi, M. 1961. Determination of protein stability in wine. Am. J. Enol. Vitic. 12:107-110.
Boehringer, P. and Jaeger, W. 1953. Landesanstalt fuer Wein, obst-und Gartenbau, Neustadt a. d. w., Der Deutsche Weinbau. Wissenschaft- liche Beihefte., p. 190-197.
Bradford, M.M. 1976. A rapid and sensitive method for the quantitation of microgram quantities of protein utilizing the principle of protein dye-binding. Anal. Biochem. 72:248-254.
Cordonnier, R. 1966. Etude des proteines et des substances azotees: leur evolution au cours des traitements oenologiques. Conditions de la stabilite proteique des vins. Bull. O.I.V. 430:1474-1489.
Cordonnier, R. 1970. Effet du Chauffage de la vendange sur quelques constituants des mouts. Bull. O.I.V. 468:139-145.
Cordonnier, R. and Dugal, A. 1968. Les activites proteolytiques du raisin. Ann. Technol. Agric. 17(3):189-206.
Danilatos, N. and Sotiropoulos, S. 1968. Etude des proteines et des substances azotees: leur evolution au cours des traitements oenologiques. Conditions de la stabilite des vins. Bull. O.I.V. 446:468-479.
Datounachvili, E.N. 1970. Utilisation des ferments en oenologie. Bull. O.I.V. 470:376-389.
89
Datounachvili, E.N., Mindadze, R.K. and Mindadze, T.A. 1979. Stabili- zation of wine against colloidal clouding. Vinodelie i Vino- gradarstvo. SSSR 1:9-11. Abstract in: FSTA 11(11): 11H1963.
Davis, B.J. 1964 Disc Electrophoresis. II. Method and application to human serum proteins. Ann. N.Y. Acad. Sci. 121:404-427.
Drawert, F. 1967. Etude des proteines et des substances azotees: leur evolution au cours des traitements oenologiques. Conditions de la stabilite proteique des vins. Bull. O.I.V. 434:395-402.
Ferenczy, S. 1966. Proteines et substances azotees. Bull. O.I.V. 39:1313-1336.
j << Feuillat, M. and Bergeret, J. 1972. Separation, concentration et analyse par electrophorese sur gel de polyacrylamide des proteines solubles du raisin et du vin. Bull. Soc. Chim. France 5:2085-2089.
Feuillat, M., Brillant, G. and Rochard, J. 1980. Mise en evidence d' une production de proteases exocellulaires par les levures au cours de la fermentation alcoolique du mout de raisin. Connaiss. Vigne et Vin. 14(l):37-52.
Fuleki, T. and Francis, F.J. 1968. Qualitative Methods for Anthocyanins. J. Food Sci. 33:72-77.
Genevois, L. and Ribereau-Gayon, J. 1936. Sur les substances azotees des mouts et des vins. Ann. Flerm. 1:541-546.
Gutcho, M.H. 1976. Alcoholic Beverage Processes. P. 189-221. Noyes Data Corporation, Park Ridge, New Jersey.
Halim, D.H. and Montgomery, M.W. 1978. Polyphenol oxidase of d'Anjou pears (Pyrus communis L.). J. Food Sci. 43:603-605, 608.
Hartmleir, W. 1979. Immobilized pepsin: properties and use to prevent haze formation in beer and wine. Biotechnol. 1(5):225-230.
Hebert, J.P., Scriban, R. and Strobbel, B. 1978. Analytical study of proteolytic enzymes for beer stabilization. Am. Soc. Brew. Chem. J. 36:31-38.
j Hennig, K. 1970. Bilans de T azote dans les mouts et les vins nouveaux en fermentation. Bull. O.I.V. 16:82-86.
Jakob, L. 1975. The use of bentonite in treatment of must and wine. In: Proceedings 4th International Enological Symposium, Valencia, Spain. Ed. by Lemperle, E. and Frank, J. International Associa- tion of Modern Winery Technology.
90
Kean, C.E. and Marsh, G.L. 1956. Investigation of copper complexes causing cloudiness in wines. I. chemical composition. Food Res. 21:441.
, Kichkovsky, Z. and Mekhouzla, N. 1967. Etude des proteines et des substances azotees. Leur evolution au cours des traitements oenologiques. Conditions de la stabilite proteique des vins. Bull. O.I.V. 40:926-933.
Koch, J. and Sajak, E. 1959. A review and some studies on grape protein. Am. J. Enol. Vitic. 10:114-123.
Kunkee, R.E. and Goswell, R.W. 1977. Table Wines. In: Alcoholic Beverages. Ed. by Rose, AH. Academic Press, London.
Little, J.E., Sjogren, R.E. and Carson, G.R. 1979. Measurement of proteolysis in natural waters. Appl. Env. Microbiol. 37:900-908.
Loomis, W.D. 1974. Overcoming problems of.phenolics and quinones in the isolation of plant enzymes and organelles. In: Methods in Enzymology. Vol. 31, p. 528-544. Ed. by Fleischer, S. and Parker, L. Academic Press, New York.
Loomis, W.D. and Bataille, J. 1966. Plant phenolic compounds and the isolation of plant enzymes. Phytochem. 5:423-438.
Loomis, W.D., Lile, J.D., Sandstrom, R.P. and Burbot, A.J. 1979. Adsorbent polystyrene as an aid in plant enzyme isolation. Phytochem. 18:1049-1054.
Marteau, G. 1972. L'emploi des enzymes en oenology. Ann. Technol. agric. 21(4):567-587.
Vjt McFarlane, W.D. 1961. The haze problem. Its solution through funda- mental research. Masters Brewers Assoc. Tech. Proc. 74:86-93.
Moretti, R.H. and Berg, H.W. 1965. Variability among wines to protein clouding. Am. J. Enol. Vitic. 16(2):69-78.
O'Neal, R.C. and Cruess, W.V. 1950. Comparative effects of casein, gelatin and bentonite fining. Proc. Am. Soc. Enol. 1:69-72.
Ough, C.S. and Aneili, G. 1979. Zinfandel grape juice protein fractions and their amine acid make-up as affected by crop level. Am. 0. Enol. Vitic. 30(1):8-10.
Ough, C.S., Berg, H.N. and Amerine, M.A. 1969. Substances extracted during skin contact with white musts. II. Effect of bentonite additions during and after fermentation on wine composition and sensory quality. Am. J. Enol. Vitic. 20(2):101-107.
91
Pocock, K.F. and Rankine, B.C. 1973. Heat test for detecting protein instability in wine. Austral. Wine Brew, and Spirit Review. 91(5): 42-43.
^ Potty, V.H. 1969. Determination of proteins in the presence of phenols and pectins. Anal. Biochem. 29:535-539.
Poux, C, Flanzy, C. and Flanzy, M. 1964. Les levures alcooliques dans les vins; proteolyse et proteogenese. Ann. Techno!. Agric. 13(1):5-18.
Rankine, B.C. and Pocock, K.F. 1971. A new method for detecting protein instability in white wines. Austral. Wine Brew. Spirit Review. 89(10):61.
Rentschler, H. 1969. Albumin clouding in grape juice and wine and its prevention. Schweizerische Zeitschrift fuer Obst-und Weinbau 18:417-421.
, Ribereau-Gayon, J., Peynaud, E., Ribereau-Gayon, P. and Sudraud, P. 1976. Sciences et Techniques du Vin. tome 3. Vinifications. Transformations du Vin., p. 591-594. Dunod, Paris, Francis.
Rinderknecht, H., Geokas, M.C., Silverman, P. and Haverback, B.J. 1968. A new ultrasensitive method for the determination of proteolytic activity. Clin. Chim. Acta. 21:197-203.
/ Robinson, T. 1979. The determination of protein in plant extracts that contain polyphenols. Plant Sci. Letters 15:211-216.
Sheat, D. and Discombe, M.J. 1976. Protein Instability and Bentonite Fining. Oenological and Viticultural Bulletin No. 6. Ruakura Agricultural Research Center, New Zealand Ministry of Agriculture.
Smith, D.M. 1979. Methods of extraction and characterization of poly- phenol oxidase fromd'Anjou Pears (Pyrus communis L.). Masters thesis, Oregon State University.
.Singleton, V.L. 1967. Fining-phenolic relationships. Wines and Vines 48(3):23-26.
^'Singleton, V.L. 1974. Protein stability in wine. Proc. 7th Penn Wine Conf. Pennsylvania State University, December 5-6, 1974. P. 46-58.
Somers, T.C. and Ziemelis, G. 1972. Interpretations of ultraviolet adsorption in white wines. J. Sci. Food Agric. 23:441-453.
l, Sommers, T.C. and Ziemelis, G. 1973a. Direct determination of wine proteins. Am. 0. Enol. Vitic. 24(2):47-50.
92
Somers, T.C. and Ziemelis, G. 1973b. The use of gel column analysis in evaluation of bentonite fining procedures. Am. J. Enol. Vitic. 24(2):51-54.
Tarantola, C. 1971. Substances azotees du raisin et du vin. Bull. O.I.V. 44:47-54.
Tereelj, D. 1965. Etude des composes azotes du vin. Ann. Technol. Agric. 14:307-319.
Tereelj, D. 1966. La diminution des composes azotes dans le vin par differents collages. Ann. Technol. Agric. 15(l):73-77.
Thoukis, G. 1974. Chemistry of wine stabilization: a review. In: Chemistry of Winemaking. Ed. by Webb, A.D. P. 125-127. Advances in Chemistry Series. 137. American Chemistry Society.
Tzakov, D. 1970 Les ferments en oenologie. Communication Bulgare. Bull. O.I.V. 470:389-401.
y Usseglio-Tomasset, L. 1978. Acquisitions recentes sur les phenomenes colloidaux dans les mouts et les vins. Ann. Technol. Agric. 27(1): 261-274.
Vos, P.O.A. and Gray, R.S. 1979. The origin and control of hydrogen sulfide during fermentation of grape must. Am. J. Enol. Vitic. 30(3):187-197.
Vallerstein, L. 1961. Chi 11 proofing and stabilization of beer. Wallerstein Lab. Comm. 19(65).
Watson, B.T., Dodd, E.E. and Heatherbell, D.A. 1980. Final Report. Tri-State Wine Grape Demonstration Project (Enology Phase) Project No. 10896909. Submitted to the Pacific Northwest Regional Com- mission, Vancouver, Washington.
Winter, A., Ek, K. and Anderson, U. 1978. Analytical electrofocusing in thin layers of poly acrylamide gels. Application note 250. LKB-Produkter Bromma, Sweden.
. Wucherpfennig, K. 1978. Possibilites d'application de precedes utilisant des membranes pour la stabilisation des vins (ultra- filtration, osmose inverse, electrodialyse). Ann. Technol. Agric. 27(1):319-331.