Embed Size (px)
Citation preview

Title of Paper: Integrated Performance Report Board Date: Wednesday 25 th April 2012 Page 1 of 34
Agenda item: 8.1 Date: Wednesday 25 April 2012
Title: Integrated Performance Report incorporating: Quality / Performance / Finance and Activity / HR
Prepared by: Warwick Heale, Associate Director of Planning & Performance Ann Goodridge, Corporate Performance Manager
Presented by: Vaughan Lewis, Joint Medical Director
Responsible Executive:
Martin Cooper and Vaughan Lewis, Joint Medical Directors Lynn Lane, Director of Human Resources, Suzanne Tracey, Director of Finance & Business Development, Em WilkinsonBrice, Director of Nursing & Patient Care
Summary: To advise the Board of the Trust’s performance against the key performance standards and targets.
Actions required: The Board is asked to receive the Performance Report and note the progress that has been made together with any actions that are planned.
Status (*): Decision Approval Discussion InformationYes
History: This is a standing agenda item at each meeting of the Board of Directors.
Link to strategy/ Assurance framework:
This paper details The Trust’s performance in respect of key performance standards and targets. Achievement of these performance standards and targets is a key objective within the Trust’s Strategy. The performance standards and targets are grouped within this report by the Trust’s strategic themes.
Monitoring Information Please specify CQC standard numbers and tick üother boxes as appropriate
Care Quality Commission Standards Outcomes Monitor ü Finance ü Service Development Strategy Performance Management ü Local Delivery Plan Business Planning Assurance Framework Complaints Equality, diversity, human rights implications assessed Other (please specify)

Title of Paper: Integrated Performance Report Board Date: Wednesday 25 th April 2012 Page 2 of 34
1. PURPOSE 1.1 To advise the Board of the Trust’s performance against the key performance
standards and targets.
2. BACKGROUND 2.1 The Trust’s Annual Plan sets out the programme of work to be undertaken to
ensure compliance with the Monitor Compliance Framework and local and national standards and targets included in PCT commissioning contracts.
Detailed results of achievement as at 31 March 2012 are presented in Data Appendices Performance (Dashboards and Data Tables).
3. ANALYSIS & KEY ISSUES 3.1 Nonelective activity was sustained at high levels over the month of March with
an increase of 14.6% in nonelective medical admissions on the same period last year. The continued increase in nonelective activity resulted in 50 elective cancellations in the month of March which is 64% less than the previous month and represents a significant reduction from the 230 cancellations in the month of November 2011 when capacity pressures began to significantly affect RTT performance. The Trust has maintained 58 escalation beds over the reporting period, but the planned return of Knapp ward to a Surgical Admission Unit on 1 st April to support the RTT recovery plan will result in a net reduction of 20 escalation beds.
A weekly Capacity Pressure meeting with NHS Devon and NDHT has been established in order to coordinate the ongoing response to increasing non elective activity.
The Safety and Risk Group supported the decision to refurbish Durbin ward and thereby enhance patient safety and significantly improve patient experience in that environment. Work is due to commence in May and be completed by September 2012.
3.2 Performance Targets
Two of the Monitor targets assessed on a quarterly basis were not met for Quarter 4.
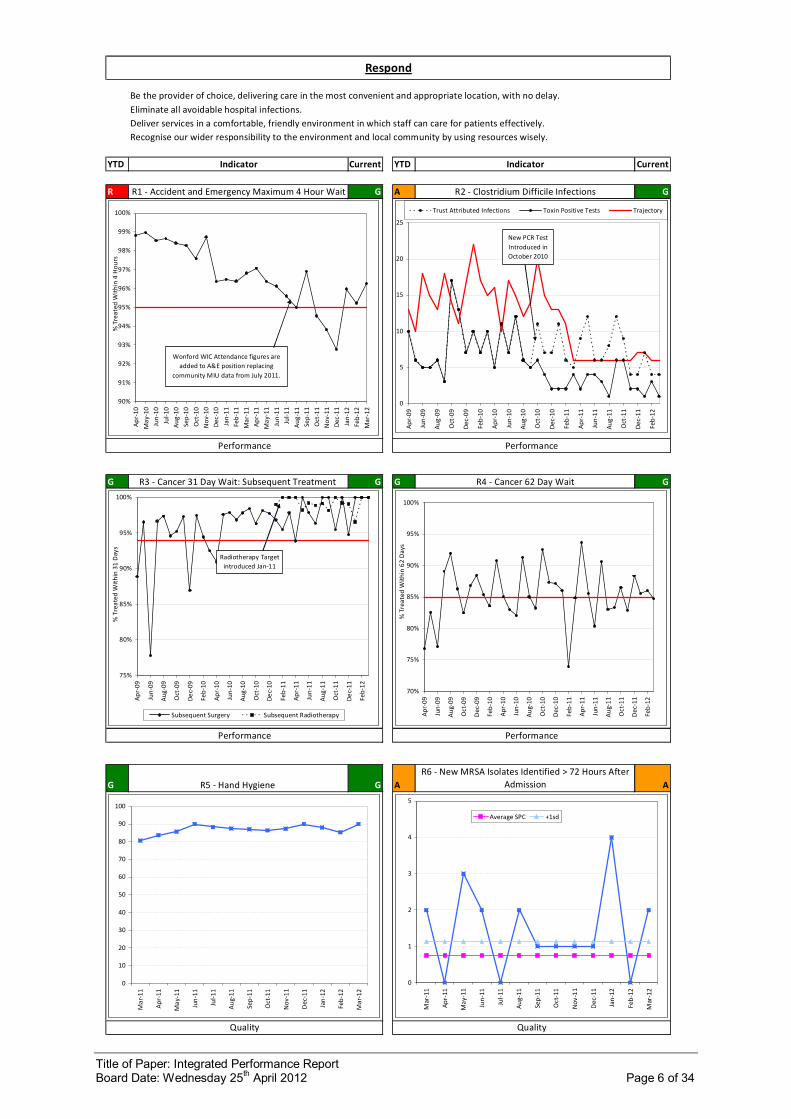
MON01 Clostridium Difficile target. The Trust achieved the target for March with 4 cases (1 toxin positive) against a trajectory of 6 and the quarter with 15 cases (5 toxin positives) but had already exceeded the trajectory for the year. The yearend position was 85 cases (35 toxin positive) against a full year target of 74. The Trust has now met the target for the last 5 months even when including the enhanced testing regime.
MON05 RTT Admitted 95 th Percentile. The Trust achieved the target for January and February with a 95 th percentile of 18.9 and 21.4 weeks respectively but failed to achieve the maximum 23 week target in March with a position of 25.7 weeks. Failure to achieve one month means that the target for the entire quarter is also considered as failing. An action plan was discussed at the February board and a summary of this is provided as an exception report in Appendix B.

Title of Paper: Integrated Performance Report Board Date: Wednesday 25 th April 2012 Page 3 of 34
3.3 Finance The key areas of financial performance are as follows:
• At year end a surplus of £3.0m has been generated compared to a budgeted surplus of £3.5m and planned surplus of £3.3m.
• A year to date Monitor Risk rating of 3 has been achieved which is in line with plan.
• £16.8m CIP has been achieved for the current year and £16.7m on a recurrent basis against a requirement of £17.1m.
• Clinical income is £0.3m under recovered at year end. • Pay is underspent by £60k at year end and nonpay is £2.2m overspent. • The Capital programme is £2.6m underspent at year end.
3.4 Quality Key issues are:
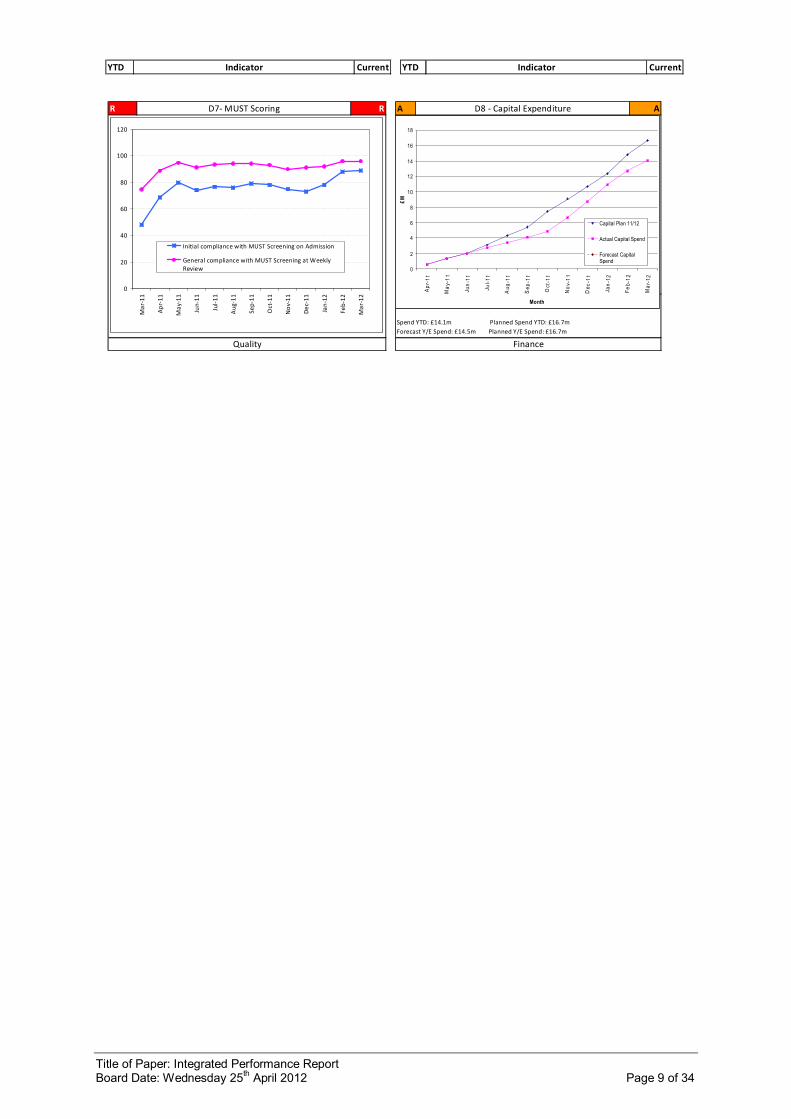
• The marked improvement in the compliance with initial assessment of nutritional screening (MUST) from 78% in January to 88% in February has been maintained in March (89%). However, despite this it is anticipated that the Trust will fail to achieve its CQUIN target for Q4.
• Monthly spot audits of recording of VTE Risk Assessments are being undertaken to provide supplementary evidence to electronic recording of risk assessments. The Trust wide performance as measured by the electronic recording methodology was 80.61% in February, whereas the latest snapshot audit of practice demonstrates that the Trust is achieving 92.65%. Work is in progress through the VTE group, reporting to the Clinical Effectiveness Committee, to improve reporting of this target and thereby achievement of the CQUIN target.
3.5 Human Resources Key issues are:
• PDR compliance rates are being maintained above the Trust target rate of 80%.
• Following discussion at the Governance Committee in March 2012, a suite of actions have been agreed to ensure an improvement in essential training compliance rates. The Workforce & Diversity Committee have been mandated to monitor the risk associated with noncompliance with mandatory training requirements throughout 201213.
• The rate of turnover for the twelve month period ending 29 th February 2012 was 9.18%, a slight decrease on the position reported last month. The turnover rate of staff with substantive contracts for reasons other than retirements continues to exceed the anticipated rate of 5%.

Title of Paper: Integrated Performance Report Board Date: Wednesday 25 th April 2012 Page 4 of 34
4. RESOURCE, LEGAL, FINANCIAL & REPUTATIONAL IMPLICATIONS Achieving NHS plan targets and milestones is an important feature of the Trust’s overall performance and demonstrates our commitment to delivering good quality care to patients. Commissioners have the discretion to apply financial penalties in respect of underperformance for the following targets:
• Nonachievement of the Clostridium difficile target (depending on the degree of target underperformance, between 0.1% and 2% of the total contract year revenue), the standard contract allows for penalties to be applied where the current year outturn exceeds the number of cases identified in the previous contract year, by more than 2 cases. In order that the Trust is not disadvantaged by the introduction of the new testing methodology, it has been agreed to exclude the impact of the cases identified using the new testing methodology from both last year's baseline and this year's figures, for the purposes of financial and contract penalties. Therefore, no penalties are due.
• Nonachievement of the referral to treatment time standard (depending on the degree of target underperformance between 0.5% and 5% of monthly elective care revenue). Given failure in March of the Referral to Treatment Standard for admitted patients (86.2% against a target of 90%) a penalty is potentially due. An update on this will be given at the meeting.
• Each of the following cancer waiting times standards (2% of the actual outturn value of the service line revenue)
o 14 day urgent GP referral o 14 day symptomatic breast o 62 days first definitive treatment for GP urgent referral, NHS Cancer
Screening Services and Consultant Upgrades o 31 day first definitive treatment o 31 day second or subsequent treatment (surgery) o 31 day second or subsequent treatment (drug treatments) o 31 day second or subsequent treatment (radiotherapy)
There may be a failure in any one month due to low volumes of cases. However as the penalties are viewed as relating to full year performance, no penalties are due.
• Breaches of the Eliminating Mixed Sex Accommodation Plan (£250 per breach per day). There have been no clinically unjustified breaches within 2011/12. Therefore no penalties are due.
5. LINKS TO BOARD ASSURANCE FRAMEWORK & KEY RISKS This paper details The Trust’s performance in respect of key performance standards and targets. Achievement of these performance standards and targets is a key objective within the Trust’s Strategy. The performance standards and targets are grouped within this report by the Trust’s strategic themes.
6. PROPOSALS The Board is asked to receive the Performance Report and note the progress that has been made together with any actions that are planned.

Title of Paper: Integrated Performance Report Board Date: Wednesday 25 th April 2012 Page 5 of 34
Graph YTD Indicator Current Source Report
R1 Red ↑ Accident and Emergency Maximum 4 Hour Wait Green Performance
R2 Amber ↓ Clostridium Difficile Infections Green Performance
R3 Green → Cancer 31 Day Wait: Subsequent Treatment Green Performance
R4 Green ↓ Cancer 62 Day Wait Green Performance
R5 Green ↑ Hand Hygiene Green Quality
R6 Amber ↓ New MRSA Isolates Amber Quality
R7 Green ↓ Referral to Treatment for Admitted Pathways Red Performance
R8 Green ↑ Referral to Treatment for Non‐Admitted Pathways Green Performance
Graph YTD Indicator Current Source Report
D1 Amber ↑ Outpatient New Attendances Amber Finance
D2 Green ↑ Elective Daycase Admissions Green Finance
D3 Amber ↑ Elective Inpatient Admissions Amber Finance
D4 Green → Non‐Elective Inpatient Admissions Amber Finance
D5 Green ↑ Pressure Sores Assessment Green Quality
D6 Amber ↓ Pressure Sores Incidence Green Quality
D7 Red → MUST Scoring Red Quality
D8 Amber → Capital Expenditure Amber Finance
Graph YTD Indicator Current Source Report
E1 Amber ↓ Bank and Agency Spend All Staff Amber Human Resources
E2 Green → Cash Green Finance
E3 Green → Cost Improvement Programmes Green Finance
E4 Green ↓ Income and Expenditure Green Finance
E5 Amber ↑ PDR/PDPs Compliance Green Human Resources
E6 Green → Risk Ratings Green Finance
E7 Amber → Sickness Absence Rate Amber Human Resources
E8 Green → Staff Employed Green Human Resources
E9 Amber → Staff Percentage Turnover Rate Amber Human Resources
E10 Red → Essential Training Compliance Red Human Resources
Red Off target or significant concerns re. achievement. Board to review exception report. Amber Slightly off target or minor concerns re. achievement. Board to be aware, but no action required. Green On target, no significant concerns re. achievement. No Board attention required.
→ Direction indicators point up for improvement, down for worsening and horizontal for no material change.
Deliver services in a comfortable, friendly environment in which staff can care for patients effectively. Recognise our wider responsibility to the environment and local community by using resources wisely.
Respond
Integrated Performance Report ‐ Summary Table
Be the provider of choice, delivering care in the most convenient and appropriate location, with no delay. Eliminate all avoidable hospital infections.
Future and sustained success through good financial management.
Deliver A high standard of care delivered by experts, which meets the needs and aspirations of patients, staff, carers and the A full range of cost‐effective accessible local hospital services. A range of excellent specialist services.
Staff to have a good work/life balance, and achieve their full potential.
Staff to do their jobs to the best of their ability, by valuing them, ensuring they have the right skills and giving them the opportunity to focus on meeting the needs of patients, so making the RD&E the employer of choice.
Enable
Additional Reported Indicators (by Exception)
Title of Paper: Integrated Performance Report Board Date: Wednesday 25 th April 2012 Page 6 of 34
Be the provider of choice, delivering care in the most convenient and appropriate location, with no delay. Eliminate all avoidable hospital infections. Deliver services in a comfortable, friendly environment in which staff can care for patients effectively. Recognise our wider responsibility to the environment and local community by using resources wisely.
YTD Indicator Current YTD Indicator Current
R R1 ‐ Accident and Emergency Maximum 4 Hour Wait G A R2 ‐ Clostridium Difficile Infections G
G R3 ‐ Cancer 31 Day Wait: Subsequent Treatment G G R4 ‐ Cancer 62 Day Wait G
G R5 ‐ Hand Hygiene G A R6 ‐ New MRSA Isolates Identified > 72 Hours After
Admission A
Quality Quality
Respond
Performance Performance
Performance Performance
0
10
20
30
40
50
60
70
80
90
100
Mar‐11
Apr‐11
May‐11
Jun‐11
Jul‐1
1
Aug‐11
Sep‐11
Oct‐11
Nov
‐11
Dec‐11
Jan‐12
Feb‐12
Mar‐12
0
1
2
3
4
5
Mar‐11
Apr‐11
May‐11
Jun‐11
Jul‐1
1
Aug‐11
Sep‐11
Oct‐11
Nov
‐11
Dec‐11
Jan‐12
Feb‐12
Mar‐12
Average SPC +1sd
90%
91%
92%
93%
94%
95%
96%
97%
98%
99%
100%
Apr‐10
May‐10
Jun‐10
Jul‐1
0 Au
g‐10
Sep‐10
Oct‐10
Nov
‐10
Dec‐10
Jan‐11
Feb‐11
Mar‐11
Apr‐11
May‐11
Jun‐11
Jul‐1
1 Au
g‐11
Sep‐11
Oct‐11
Nov
‐11
Dec‐11
Jan‐12
Feb‐12
Mar‐12
% Treated
With
in 4 Hou
rs
Wonford WIC Attendance figures are added to A&E position replacing
community MIU data from July 2011.
0
5
10
15
20
25
Apr‐09
Jun‐09
Aug‐09
Oct‐09
Dec‐09
Feb‐10
Apr‐10
Jun‐10
Aug‐10
Oct‐10
Dec‐10
Feb‐11
Apr‐11
Jun‐11
Aug‐11
Oct‐11
Dec‐11
Feb‐12
Trust Attributed Infections Toxin Positive Tests Trajectory
New PCR Test Introduced in October 2010
75%
80%
85%
90%
95%
100%
Apr‐09
Jun‐09
Aug‐09
Oct‐09
Dec‐09
Feb‐10
Apr‐10
Jun‐10
Aug‐10
Oct‐10
Dec‐10
Feb‐11
Apr‐11
Jun‐11
Aug‐11
Oct‐11
Dec‐11
Feb‐12
% Treated
With
in 31 Days
Subsequent Surgery Subsequent Radiotherapy
Radiotherapy Target introduced Jan‐11
70%
75%
80%
85%
90%
95%
100%
Apr‐09
Jun‐09
Aug‐09
Oct‐09
Dec‐09
Feb‐10
Apr‐10
Jun‐10
Aug‐10
Oct‐10
Dec‐10
Feb‐11
Apr‐11
Jun‐11
Aug‐11
Oct‐11
Dec‐11
Feb‐12
% Treated
With
in 62 Da
ys

Title of Paper: Integrated Performance Report Board Date: Wednesday 25 th April 2012 Page 7 of 34
YTD Indicator Current YTD Indicator Current
G R7 ‐ Referral to Treatment for Admitted Pathways R G R8 ‐ Referral to Treatment for Non Admitted Pathways G
Performance Performance
0
5
10
15
20
25
30
Apr‐10
May
‐10
Jun‐10
Jul‐1
0 Aug
‐10
Sep‐10
Oct‐10
Nov
‐10
Dec‐10
Jan‐11
Feb‐11
Mar‐11
Apr‐11
May
‐11
Jun‐11
Jul‐1
1 Aug
‐11
Sep‐11
Oct‐11
Nov
‐11
Dec‐11
Jan‐12
Feb‐12
Mar‐12
95th Percentile
(wee
ks)
0
2
4
6
8
10
12
14
16
18
20
Apr‐10
May
‐10
Jun‐10
Jul‐1
0 Aug
‐10
Sep‐10
Oct‐10
Nov
‐10
Dec‐10
Jan‐11
Feb‐11
Mar‐11
Apr‐11
May
‐11
Jun‐11
Jul‐1
1 Aug
‐11
Sep‐11
Oct‐11
Nov
‐11
Dec‐11
Jan‐12
Feb‐12
Mar‐12
95th Percentile
(wee
ks)

Title of Paper: Integrated Performance Report Board Date: Wednesday 25 th April 2012 Page 8 of 34
YTD Indicator Current YTD Indicator Current
A D1 ‐ Outpatient New Attendances A G D2 ‐ Elective Daycase Admissions G
A D3 ‐ Elective Inpatient Admissions A G D4 ‐ Non‐Elective Inpatient Admissions A
G D5 ‐ Pressure Sores Assessment G A D6 ‐ Pressure Sores Incidence G
Current month vs plan: 7% lower than plan 16% lower than the same month last year 16% higher than the previous month Year to date:17% lower than the same period in 2010‐11 Year to date vs plan:12% lower than plan
Current month vs plan:2% higher than plan 2% higher than the same month last year 5% higher than the previous month Year to date: 1% lower than the same period in 2010‐11 Year to date vs plan: same as plan
Deliver
Finance Finance
Finance Finance
A high standard of care delivered by experts, which meets the needs and aspirations of patients, staff, carers and the public. A full range of cost‐effective accessible local hospital services. A range of excellent specialist services.
Current month vs plan:13% lower than plan 10% lower than the same month last year 6% higher than the previous month Year to date:1% lower the same period in 2010‐11 Year to date:9% lower than plan
Current month vs plan:4% higher than plan 5% lower than the same month last year 5% higher than the previous month Year to date:3% higher than the same period in 2010‐11 Year to date vs plan: 4% higher than plan
Quality Quality
0
10
20
30
40
50
60
70
80
90
100
Mar‐11
Apr‐11
May
‐11
Jun‐11
Jul‐1
1
Aug‐11
Sep‐11
Oct‐11
Nov
‐11
Dec‐11
Jan‐12
Feb‐12
Mar‐12
0%
5%
10%
15%
20%
25%
30%
Mar‐11
Apr‐11
May
‐11
Jun‐11
Jul‐1
1
Aug‐11
Sep‐11
Oct‐11
Nov
‐11
Dec‐11
Jan‐12
Feb‐12
Mar‐12
4000
5000
6000
7000
8000
9000
10000
11000
Mar‐09
Apr‐09
May
‐09
Jun‐09
Jul‐0
9 Au
g‐09
Se
p‐09
Oct‐09
Nov
‐09
Dec‐09
Jan‐10
Fe
b‐10
Mar‐10
Apr‐10
May
‐10
Jun‐10
Jul‐1
0 Au
g‐10
Se
p‐10
Oct‐10
Nov
‐10
Dec‐10
Jan‐11
Fe
b‐11
Mar‐11
Apr‐11
May
‐11
Jun‐11
Jul‐1
1 Au
g‐11
Se
p‐11
Oct‐11
Nov
‐11
Dec‐11
Jan‐12
Fe
b‐12
Mar‐12
Plan Actual
2000 2200 2400 2600 2800 3000 3200 3400 3600 3800 4000 4200 4400 4600 4800 5000 5200 5400 5600
Mar‐09
Apr‐09
May‐09
Jun‐09
Jul‐0
9 Au
g‐09
Se
p‐09
Oct‐09
Nov
‐09
Dec‐09
Jan‐10
Fe
b‐10
Mar‐10
Apr‐10
May‐10
Jun‐10
Jul‐1
0 Au
g‐10
Se
p‐10
Oct‐10
Nov
‐10
Dec‐10
Jan‐11
Fe
b‐11
Mar‐11
Apr‐11
May‐11
Jun‐11
Jul‐1
1 Au
g‐11
Se
p‐11
Oct‐11
Nov
‐11
Dec‐11
Jan‐12
Fe
b‐12
Mar‐12
Plan Actual
500
700
900
1100
1300
1500
1700
1900
2100
Mar‐09
Apr‐09
May
‐09
Jun‐09
Jul‐0
9 Au
g‐09
Sep‐09
Oct‐09
Nov
‐09
Dec‐09
Jan‐10
Feb‐10
Mar‐10
Apr‐10
May
‐10
Jun‐10
Jul‐1
0 Au
g‐10
Sep‐10
Oct‐10
Nov
‐10
Dec‐10
Jan‐11
Feb‐11
Mar‐11
Apr‐11
May
‐11
Jun‐11
Jul‐1
1 Au
g‐11
Sep‐11
Oct‐11
Nov
‐11
Dec‐11
Jan‐12
Feb‐12
Mar‐12
Plan Actual
0
500
1000
1500
2000
2500
3000
3500
Mar‐09
Apr‐09
May
‐09
Jun‐09
Jul‐0
9 Au
g‐09
Se
p‐09
Oct‐09
Nov
‐09
Dec‐09
Jan‐10
Fe
b‐10
Mar‐10
Apr‐10
May
‐10
Jun‐10
Jul‐1
0 Au
g‐10
Se
p‐10
Oct‐10
Nov
‐10
Dec‐10
Jan‐11
Fe
b‐11
Mar‐11
Apr‐11
May
‐11
Jun‐11
Jul‐1
1 Au
g‐11
Se
p‐11
Oct‐11
Nov
‐11
Dec‐11
Jan‐12
Fe
b‐12
Mar‐12
Plan Actual
Title of Paper: Integrated Performance Report Board Date: Wednesday 25 th April 2012 Page 9 of 34
YTD Indicator Current YTD Indicator Current
R D7‐ MUST Scoring R A D8 ‐ Capital Expenditure A
Spend YTD: £14.1m Planned Spend YTD: £16.7m Forecast Y/E Spend: £14.5m Planned Y/E Spend: £16.7m
Finance Quality
0
20
40
60
80
100
120
Mar‐11
Apr‐11
May
‐11
Jun‐11
Jul‐1
1
Aug‐11
Sep‐11
Oct‐11
Nov
‐11
Dec‐11
Jan‐12
Feb‐12
Mar‐12
Initial compliance with MUST Screening on Admission
General compliance with MUST Screening at Weekly Review 0
2
4
6
8
10
12
14
16
18
Apr11
Ma y
11
Jun 11
Jul1
1
Aug
11
Sep
11
Oct11
No v
11
Dec
11
Jan 12
Feb1 2
Ma r12
Month
£M
Capital Plan 11/12
Actual Capital Spend
Forecast Capital Spend

Title of Paper: Integrated Performance Report Board Date: Wednesday 25 th April 2012 Page 10 of 34
YTD Indicator Current YTD Indicator Current
A E1 ‐ Bank, Agency & Overtime Spend All Staff A G E2 ‐ Cash G
G E3 ‐ Cost Improvement Programmes G G E4 ‐ Income and Expenditure G
A E5 ‐ PDR/PDPs Compliance G G E6 ‐ Risk Ratings G
PDR activity excludes Medical and Dental staff.
Actual Surplus YTD: £3m Budgeted Surplus YTD: £3.5m Forecast Surplus Y/E: £3m Budgeted Surplus Y/E: £3.5m Actual Efficiency: 0.86% Budgeted Efficiency: 0.97%
Finance Finance
The above chart indicates the amount of spend relating to staff registered on the bank, staff supplied by agencies and overtime worked by substantive staff.
Research and innovation.
Finance Human Resources
Enable
Human Resources Finance
Staff to do their jobs to the best of their ability, by valuing them, ensuring they have the right skills and giving them the opportunity to focus on meeting the needs of patients, so making the RD&E the employer of choice.
Staff to have a good work/life balance, and achieve their full potential.
Future and sustained success through good financial management.
Cash in hand and at bank: £49.6m Working Capital Facility: £0m Cash Invested @ Month End: £0m
£0
£100,000
£200,000
£300,000
£400,000
£500,000
£600,000
Feb11
Mar11
Apr11
May11
Jun11
Jul11
Aug11
Sep11
Oct11
Nov11
Dec11
Jan12
Feb12
Agency Bank Overtime
50%
55%
60%
65%
70%
75%
80%
85%
90%
95%
100%
Mar‐11
Apr‐11
May
‐11
Jun‐11
Jul‐1
1
Aug‐11
Sep‐11
Oct‐11
Nov
‐11
Dec‐11
Jan‐12
Feb‐12
Mar‐12
Risk Ratings
0
1
2
3
4
5 EBITDA Margin
EBITDA % Achieved
ROA
I&E Surplus Margin
Liquidity
Overall Rating
Plan YTD Actual YTD Plan Y/E Forecast Y/E
Other Ratios Plan YTD Actual YTD Plan Y/E Forecast Y/E
Trade Creditor Days 6.4 6.3 6.4 6.3 NHS Trade Debtor Days 8.9 8.5 8.9 8.5 Debt to Asset Ratio 6.3% 6.5% 6.3% 6.5% Other items £ £ £ £ Revenue available for debt service 23.9m 23.3m 23.9m 23.3m Debt 20.2m 20.2m 20.2m 20.2m Total Assets 321.9m 311.3m 321.9m 311.3m
0
2000
4000
6000
8000
10000
12000
14000
16000
18000
April
May
June
July
August
September
October
Novem
ber
Decem
ber
January
February
March
Month
£m
CIP Plan
CIP Actual
CIP Forecast
12 Month forecast cashflow v plan
(20)
(10)
10
20
30
40
50
60
70
80
Apr11
May
11
Jun11
Jul11
Aug
11
Sep11
Oct11
Nov
11
Dec
11
Jan12
Feb12
Mar12
Month
£M Plan
Actual
Forecast
Commited Facility
Comparison of actual cumulative net surplus/deficit compared to plan
3,000
2,000
1,000
0
1,000
2,000
3,000
4,000
5,000
April
May
June
July
August
Septembe
r
October
Novem
ber
Decem
ber
January
February
March
Month
£
Actual
Budget

Title of Paper: Integrated Performance Report Board Date: Wednesday 25 th April 2012 Page 11 of 34
YTD Indicator Current YTD Indicator Current
A E7 ‐ Sickness Absence Rate A G E8 ‐ Staff Employed G
A E9 ‐ Staff Percentage Turnover Rate A R E10 ‐ Essential Training Compliance R
The total FTE has decreased by 8.02 to 4960.29. This is below the funded FTE establishment of 5182.39. Headcount has decreased by 4 to 5740. The cumulative rate for 12 months to 29th February 2012 is 3.57%.
Human Resources Human Resources
Human Resources Human Resources
The turnover rate of 9.18% for the combined 12 month period to end of February 2012 is higher than the 8.26% for the equivalent period last year. Essential Training compliance rates subject to data validation exercise.
0.0%
1.0%
2.0%
3.0%
4.0%
5.0%
Feb11
Mar11
Apr11
May11
Jun11
Jul11
Aug11
Sep11
Oct11
Nov11
Dec11
Jan12
Feb12
Long Term Medium Term Short Term
0%
2%
4%
6%
8%
10%
12%
Feb11
Mar11
Apr11
May11
Jun11
Jul11
Aug11
Sep11
Oct11
Nov11
Dec11
Jan12
Feb12
Substantive Staff Substantive less retirements Predicted Substantive less retirements
50%
55%
60%
65%
70%
75%
80%
85%
90%
95%
100%
Mar‐11
Apr‐11
May
‐11
Jun‐11
Jul‐1
1
Aug‐11
Sep‐11
Oct‐11
Nov
‐11
Dec‐11
Jan‐12
Feb‐12
Mar‐12
Equality & Diversity Fire Infection Control Manual Handling
4,800
4,850
4,900
4,950
5,000
5,050
5,100
5,150
5,200
5,250
5,300
Feb‐11
Mar‐11
Apr‐11
May‐11
Jun‐11
Jul‐1
1
Aug‐11
Sep‐11
Oct‐11
Nov
‐11
Dec‐11
Jan‐12
Feb‐12
Contracted FTE Funded FTE Worked FTE

Title of Paper: Integrated Performance Report Board Date: Wednesday 25 th April 2012 Page 12 of 34
Finance FINANCIAL REPORT FOR THE TRUST COVERING THE PERIOD ENDING
31 st MARCH 2012
Executive Summary
The Trust has achieved a surplus at year end of £3.0m compared to a budgeted surplus of £3.5m and planned surplus of £3.3m. This position gives the Trust a Monitor Risk Rating a 3 in line with plan.
The year to date (YTD) surplus has deteriorated compared to the forecast in the month 11 report by £230k. This is due to both income and expense deteriorating, please see below for further explanation.
Please note all variances given below are compared to budget.
INCOME
At year end clinical income is £334k under recovered which is a deterioration of £166k on the month 11 YTD position, but is an improvement on the month 11 forecast position by £593k.
At month 12 (based on 11 months actual activity) the contract with NHS Devon (including NHS Devon element of Specialist Commissioning Group) is £1.6m over contract. Activity for month 12 has been estimated and agreed with NHS Devon. Any variance to this estimate will be reflected in the month 1 invoicing for 2012/13.
The main Divisional over/under performances year to date (for all Commissioners) are; • Women & Childs’ Health is the main area to over recover by £1.6m at year end. This is
mainly within Gynaecology (£1.2m) due to planned activity overperforming. Daycase activity has over recovered by 42% above budget and outpatient activity 16%. Midwife activity is another area to over recover by £689k, a slight decrease on last month.
• Medicine is another area to over recover significantly at year end, by £1.2m. Activity within Neurology (£622k) and Cardiology (£670k) are the principle areas. Neurology has experienced an increase in both elective and non elective activity, whereas the Cardiology over recovery is predominantly due to elective activity only.
• The Surgery Division is the main area to underperform during the year by £1.5m mainly as a result of elective capacity being reduced during the winter period. General surgery, Thoracic Surgery and Plastic Surgery are the main areas effected (£634k, £662k and £562k respectively).
• Trauma & Orthopaedics Directorate is another area to underperform compared to budget (£1.4m). Orthopaedic elective activity is 14% (£1.8m) down compared to budget
YTD Month 12 YTD Month 11 Change £’000 £’000 £’000
I&E year to date 3,030 3,260 230 I&E Forecast 3,030 3,319 289 I&E year end forecast variance to budget/Plan
470 181 289
Total Income variance to date 186 86 100 CIP variance to date 370 1,055 685 Pay expenditure variance to date 60 140 80 Non pay (excl. R&D) expenditure variance to date
2,204 1,720 484
Cash at month end 49,621 55,524 5,903

Title of Paper: Integrated Performance Report Board Date: Wednesday 25 th April 2012 Page 13 of 34
which is mainly due to cancelling work as a result of winter pressures. This is partially offset by over performances within Trauma (£111k) and Rheumatology (£233k).
Other income is £311k over recovered at yearend a marginal improvement on month 11 reported year to date position. This is mainly due to additional income within Laundry & Transport (£126k), IT services (£123k) and Pharmacy services (£133k).
EXPENDITURE
At the year end pay is underspent by £60k which is a deterioration on month 11 report by £80k. The main areas of over and under spends within pay are as follows: • Nursing spend including bank and agency are £873k overspent at year end. Due to a
combination of winter pressures and a shortage of immediately available qualified nurses it has been necessary to use agencies to maintain safety and prevent any further elective activity from being cancelled. Agency nursing spend for 2011/12 amounts to £1.6m compared to £325k in 2010/11. This is being reviewed so that future winter pressures do not incur this level of spend.
• Senior, Junior and agency medical staff is overspent by £500k. This is due to the same reasons for the nursing overspend and also for the recovery against the Refer to Treat (RTT) target additional spend has been necessary.
• Admin and Clerical staff is £1.1m underspent at year end, this is partially offset by £236k additional spend on agency admin staff. It is expected the majority of this underspend will be transferred to CIP as part of the recurrent admin saving.
• Support staff areas (MTO’s, Estates staff, ancillary staff) is an area under spending by £717k.
Nonpay expenditure at yearend is overspent by £2.2m which is a deterioration on last month’s report by £484k. This deterioration is mainly due to a decrease in theatre stock level at year end by £378k which has impacted on the expense budget.
The main areas to under/overspend year to date are as follows: • Clinical supplies is the main area overspending by £1.4m with is activity related spend
in Medicine, Radiology, Critical Care and Women and Childs’ Health. This includes the stock adjustment mentioned above.
• Maintenance contractor costs are overspent by £422k with spend across the Trust but mainly within the Trust’s Estates Departments (£394k RD&E Estates, £60k Community Estates which is recoverable). A proportion of the RD&E Estates cost is partially offset by the saving in Estates staff mentioned above.
• Overall utilities expenditure (including electricity, gas, oil, water and sewerage) is £451k over spent. This is partially due to the combined heat and power (CHP) not operating effectively and increasing spend on electricity (£264k).
COST IMPROVEMENT PROGRAMME (CIP)
Current Year Overall £16.8m of savings have been achieved during 2011/12 for the current year. £7.4m has been generated via the 10 work streams and a further £9.4m has been generated centrally.
Recurrently On a recurrent basis £16.7m of savings have been achieved, £11.4m via the 10 work streams and £5.2m centrally. The remaining £464k currently unidentified will be achieved via other schemes during 2012/13.
Please refer to appendix 7 for more detail on the 10 CIP work streams.

Title of Paper: Integrated Performance Report Board Date: Wednesday 25 th April 2012 Page 14 of 34
CAPITAL
Additions Actual capital expenditure for the year was £14.1m in comparison to £16.7m in the plan. Capital expenditure is therefore £2.6m lower than planned, representing 15.6% of planned capital expenditure. (Excluding the University’s RILD capital additions, capital expenditure would be £4.1m lower than planned representing a 24.5% capital slippage).
Appendix 6 provides details of expenditure variances for capital schemes in excess of £1 million.
Revaluation As previously advised the annual plan included a £10.4m estimated increase in the value of land and buildings as at 31 March 2012. The District Valuer has advised that there will be a small fall in value for land and buildings. The change in value is not considered sufficiently material to require the Trust to revalue its land and buildings. The Trust’s external auditors have been advised.
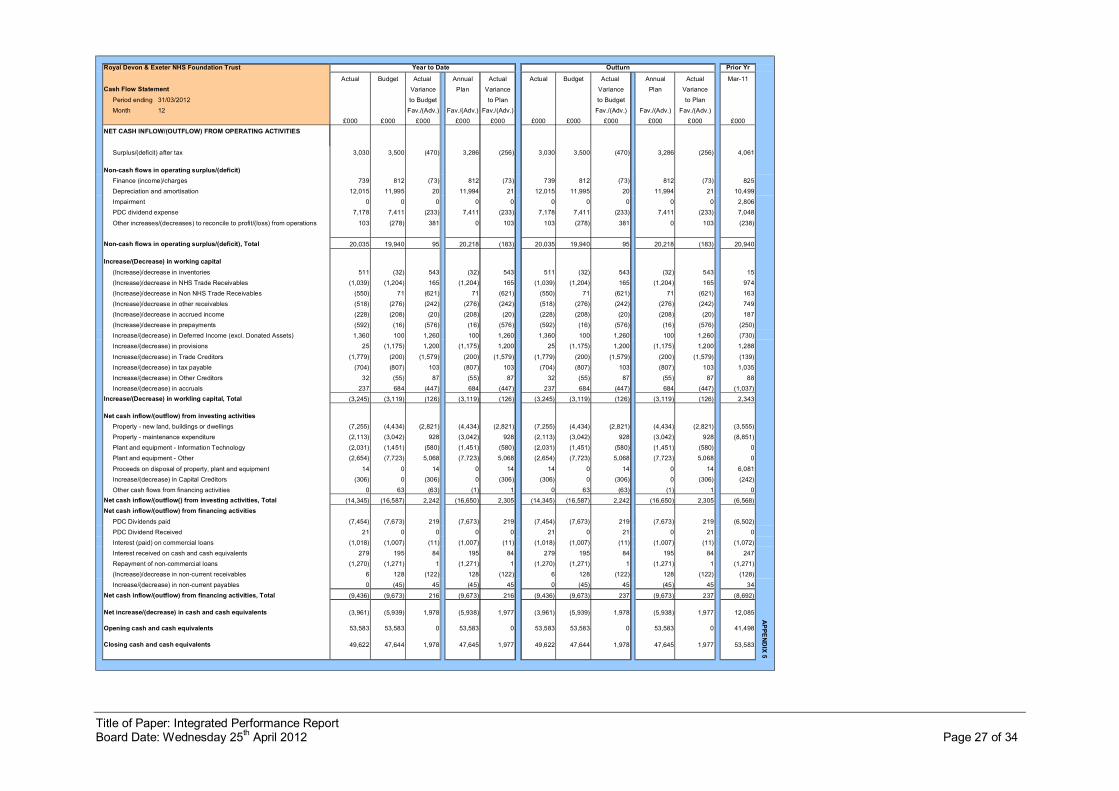
CASH
The cash balance at the end of March is £49.6m, which is £2m higher than budget (£47.6m). See cash flow statement for details of movements.
INVESTMENTS
At the year end £49.6m of cash balances were included within the Government Banking Service account, representing 99.96% of cash balances.
ACTIVITY
Outpatient, daycase and elective inpatients have all had lower activity levels during March 12 than that delivered in March 11 (10%, 5% and 16% respectively); the only exception being nonelective activity at 2% higher. When comparing activity for the whole of 2011/12 to that delivered during 2010/11 all areas undertook lower activity (outpatient 1%, elective inpatients 17% and non elective 1%) with the exception of daycase activity (3% higher).
Daycase and nonelective activity are higher than planned activity for March (4% and 2% respectively) with outpatient and elective lower than plan (13% and 7% respectively). For the whole of 2011/12 outpatient and elective inpatient activity were below plan (9% and 12% respectively), with daycase activity above plan (4%) and nonelective activity being virtually in line with plan.
Referrals received during March were 6.4% lower than those received during March 2011 (724 referrals). Overall for the year 120,022 referrals have been received which is 2% lower than the equivalent period last year.
OTHER ISSUES
Service Line Reporting Appendix 8 shows a surplus/deficit analysis by Directorate and is based on a Service Line Reporting perspective. It should be noted the figures relate to the Month 11 position. Although a Directorate summary is shown here, the information produced each month is published at Service Line level and made available to inform Service Line Management Team discussions.

Title of Paper: Integrated Performance Report Board Date: Wednesday 25 th April 2012 Page 15 of 34
SLR finance reports are increasingly used in a range of work now and will be used to inform segmental reporting in the statement of accounts and the Trust’s reference cost submission. The information is regularly included in the quarterly review process and increasingly features in work relating to Strategic redesign and Cost Improvement Programmes.
The Finance department continues to work with colleagues across the Trust on an action plan of work to improve accuracy and presentation of SLR financial reports.
CONCLUSION
The key areas of financial performance are as follows: • At year end a surplus of £3.0m has been generated compared to a budgeted surplus of
£3.5m and planned surplus of £3.3m. • A year to date Monitor Risk rating of 3 has been achieved which is in line with plan. • £16.8m CIP has been achieved for the current year and £16.7m on a recurrent basis
against a requirement of £17.1m. • Clinical income is £0.3m under recovered at year end. • Pay is underspent by £60k at year end and nonpay is £2.2m overspent. • The above variances have been offset on a non recurrent basis only by slippage in
other areas. • The Capital programme is £2.6m underspent at year end.

Title of Paper: Integrated Performance Report Board Date: Wednesday 25 th April 2012 Page 16 of 34
Quality
MUST Nutritional Assessment on admission This measure has improved from 78% in January to 88% in February, and is maintained at 89% in March, which it is anticipated will result in the Trust failing to achieve its CQUIN target for Q4. However 96% of patients do have a MUST assessment during their hospital inpatient stay. Patients have an increasing number of assessments that are routinely undertaken on admission and these are currently being reviewed to ensure that they are completed at the most appropriate time, and all opportunity to streamline the process are exploited. An evaluation of the assessment reporting methodologies which underpin the Ward to Board dashboard are outlined in greater detail within the Ward to Board evaluation paper being presented separately to Board.
Electronic VTE Assessment The target for this is 90% and currently the electronic reporting against this indicator is showing the Trust is achieving 81%. The latest snapshot audit of practice is showing that the Trust is achieving 92.65% which is an improvement upon the rate reported last month.
Further commentary on the Ward to Board dashboard is contained within the Quarterly Ward to Board drilldown report, which is being tabled for discussion separately to this performance report.

Title of Paper: Integrated Performance Report Board Date: Wednesday 25 th April 2012 Page 17 of 34
Human Resources
Sickness Absence Although the annual sickness absence rate has remained static this month with a rate of 3.57%, the rate for the individual month of February of 3.71% is lower than the 3.85% for the same month last year.
Turnover With a reported rate of 9.18% for March 2012, the annual rate of turnover continues to drop. At 5.13%, the turnover rate for staff with substantive contracts leaving the Trust for reasons other than retirement continues to exceed the anticipated rate of 5%.
Staff Numbers At 4960.29 FTE staff numbers have reduced by 8.02 FTE during February 2012 and remains below the funded FTE of 5182.39. Employees leaving the organisation in February are from a range of departments and roles with no single area giving cause for concern. Given the level of vacancies currently across the Trust we are reinforcing the requirement for managers to conduct exit interviews to identify any core issues which could be resolved.
The number of staff employed on fixed term contracts ending in the next twelve months continues to decrease with 317 staff (245.8 FTE) recorded at the end of March 2012.
Bank, Agency & Overtime Spend Bank, agency and overtime payments have all risen sharply this month. Staff are being encouraged to work additional hours to cover a number of vacancies, particularly in nursing and administrative areas, and this has contributed to the increase in bank and overtime spend.
Personal Development Reviews (PDRs) and Essential Training Compliance Work is underway to improve compliance with essential learning across the Trust, with a paper tabled at the Governance Committee in March. A number of actions were agreed with the Senior Operational Group which, following achievement would reduce the current risk rating of 15 to 10 by April 2013. The Workforce and Diversity Committee have been mandated to monitor this risk through their meeting schedule throughout the year. The following exception report outlines the actions being undertaken to ensure manual handling compliance rates improve by June 2012.
Title of Paper: Integrated Performance Report Board Date: Wednesday 25 th April 2012 Page 18 of 34
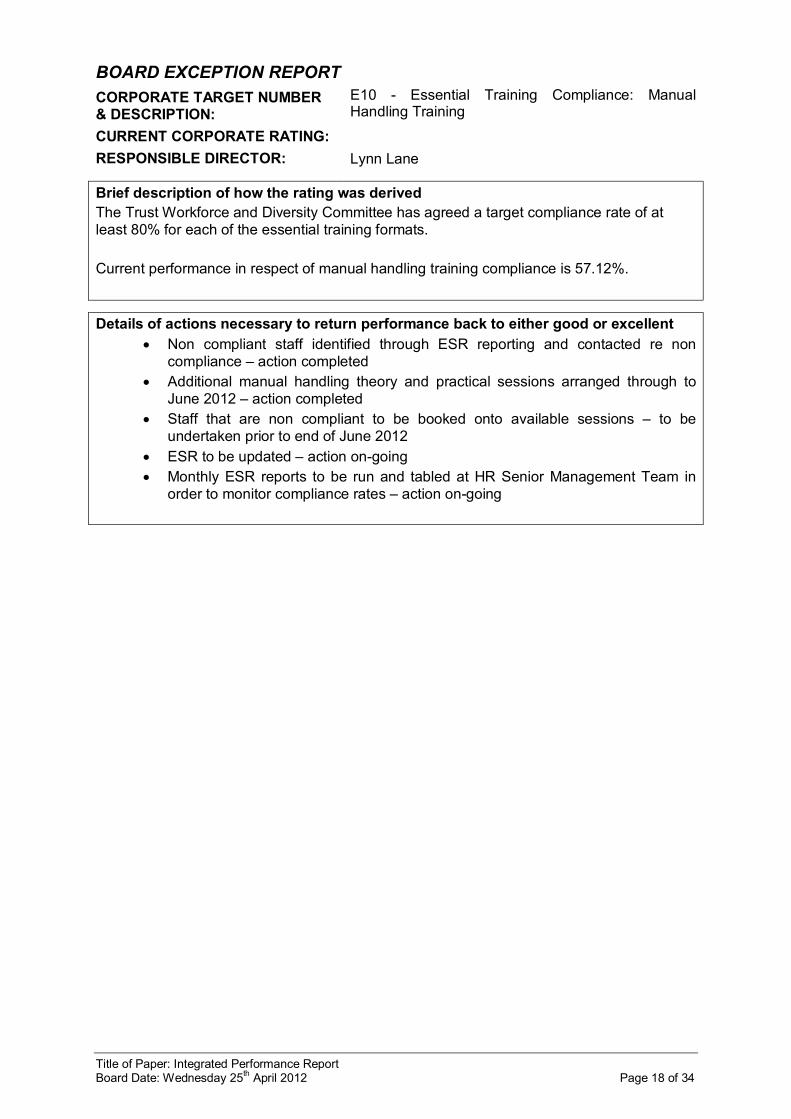
BOARD EXCEPTION REPORT CORPORATE TARGET NUMBER & DESCRIPTION:
E10 Essential Training Compliance: Manual Handling Training
CURRENT CORPORATE RATING: RESPONSIBLE DIRECTOR: Lynn Lane
Brief description of how the rating was derived The Trust Workforce and Diversity Committee has agreed a target compliance rate of at least 80% for each of the essential training formats.
Current performance in respect of manual handling training compliance is 57.12%.
Details of actions necessary to return performance back to either good or excellent • Non compliant staff identified through ESR reporting and contacted re non
compliance – action completed • Additional manual handling theory and practical sessions arranged through to
June 2012 – action completed • Staff that are non compliant to be booked onto available sessions – to be
undertaken prior to end of June 2012 • ESR to be updated – action ongoing • Monthly ESR reports to be run and tabled at HR Senior Management Team in
order to monitor compliance rates – action ongoing

Title of Paper: Integrated Performance Report Board Date: Wednesday 25 th April 2012 Page 19 of 34
BOARD EXCEPTION REPORT CORPORATE TARGET NUMBER & DESCRIPTION:
MON05 / R7 RTT Admitted 95th Percentile
CURRENT CORPORATE RATING: RESPONSIBLE DIRECTOR: Chief Operating Officer
Brief description of how the rating was derived The target is defined as a maximum wait of 23 weeks from referral to treatment for the 95 th percentile of patients receiving treatment in an admitted care setting.
Background & Contributing factors
The failure of the RTT target is essentially due to 2 key factors
• The impact of winter pressures, which has constricted patient flow, resulted in a high number of cancellations of elective surgery and also inhibited the Trust’s ability to improve efficiency within theatres due to bed problems.
• An underlying capacity gap within orthopaedics of around 25 surgical cases per month, which is being addressed by the Orthopaedic Directorate through service redesign and increasing use of the community Day Case Units.
Details of actions necessary to return performance back to either good or excellent
The internal actions to provide increased surgical activity are on track. Action Lead Timescale Progress Weekly RTT meeting chaired by the Deputy Chief Operating Officer in order to ensure that all aspects of the RTT targets are closely managed.
Pete Adey
Ongoing Effective coordination meetings have taken place since February.
Weekly operational RTT meeting set up to ensure that the specific actions required to increase activity are well coordinated.
Phil Luke
Ongoing Effective coordination meetings have taken place since early March.
Transfer around 300 cases to the Nuffield.
Phil Luke
March September 2012
Transfer process and finances agreed with the Nuffield. Orthopaedic and General surgical cases have taken place in March with firm plans in place going forwards.
Additional capacity on Saturdays. Phil Luke
Late April September 2102
All arrangements in place. Lists have commenced as planned during April.

Title of Paper: Integrated Performance Report Board Date: Wednesday 25 th April 2012 Page 20 of 34
Work with internal and external stakeholders to manage the hospital bed capacity problems, which threaten to cause further cancellations and disruption.
Pete Adey
Ongoing Weekly capacity meetings continue alone with weekly healthcare community meetings to accelerate onward care provision, emergency admission avoidance and to monitor the whole system’s performances.
Increase utilisation of the community Day Case Units.
Phil Luke
May 2012 Proposal put to Tiverton steering group by Em WilkinsonBrice in early April regarding overnight stays was well received.
Relocate a fortnightly plastics list from orthopaedic theatres to the community Day Case Units in order to provide additional inpatient orthopaedic capacity.
Phil Luke
June 2012 No solution identified to this so far, however, further meetings to explore opportunities are set up.
Low risk to delivery Medium risk to delivery High risk to delivery

Title of Paper: Integrated Performance Report Board Date: Wednesday 25 th April 2012 Page 21 of 34
Data Appendices – Performance
Indicator Position for Quarter
Target Monitor Weighting
Risk for Period
Risk for Year
Indicator Position for Quarter
Target for Period
Monitor Weighting
Risk for Period
Risk for Year
Indicates that the target has been achieved for the quarter Indicates that the target has been achieved for that month but the quarter has not yet finished Indicates that the target has not been achieved for the quarter Indicates that the target has not been achieved for that month but the quarter has not yet finished
Indicates that the target is not yet enforced
1 MON01 ‐ Clostridium Difficile ‐ Whilst the quarterly trajectory has been achieved for Q3 and currently Q4 the full year trajectory has already been exceeded and therefore both Q3 and Q4 will be judged by Monitor as not achieved.
Low Low min. 96% MON11
Learning Disabi li ty Compl iance
The position for Cancer targets is subject to change when the data is uploaded to the National Cancer Waiting Times Database 6 weeks after month end.
Trend graphs run from April 2010 to current month
98.1% (11 of 572)
0.5 Compl iant
Monitor Dashboard ‐ March 2012
Trend Trend
MON01 Clostridium
Diffici le 1 15 (19)
max. 74 annual
High Very Low
Not Set
MON07 Cancer 31 Day First Treatment
1.0
max. 3 annual
0 (0)
MON03.I Cancer 31 Day Subsequent Surgery
100.0% (0 of 65)
min. 94% Low
min. 98%
1.0
Medium
Medium
MON03.II I Cancer 31 Day Subsequent Radiotherapy
min. 94% Low
MON03.II Cancer 31 Day
Subsequent Drug
100.0% (0 of 241)
98.7% (5 of 372)
MON02 MRSA
Medium
High MON08.I
Cancer 14 Day GP Urgent
95.1% (118 of 2395)
Medium
Medium MON08.II
Cancer 14 Day Symptomatic Breast
98.8% (2 of 161)
Very Low
0.5
min. 93%
Not Set
Not Set Not Set
min. 93% Low
Very Low
95 th Percenti le max.
4 hours Not Set 4.2
MON09.I A&E ‐ Total Time 2
MON05 RTT Admitted
95 th Percenti le
Medium
High 2.1% 1.0
MON09.IV A&E ‐ Unplanned
Reattendance Rate 2
MON09.II I A&E ‐ Time to
Treatment Deci sion 2
22.3
min. 85%
MON09.II A&E ‐ Time to Initial
Assessment 2
Medium
1.0 Low
MON06 RTT Non‐Admitted 95 th Percenti le
MON04.II Cancer 62 Day
Screening
95.8% (1.5 of 35.5)
Medium
1.0
min. 90% Medium
MON04.I Cancer 62 Day
GP Urgent
85.4% (38 of 260.5)
95 th Percenti le max.
23 weeks max. 5%
40.0
20.0
Median max.
60 minutes
7.6% max. 5%
95 th Percenti le max.
15 minutes
MON10 Stroke Indicator
Low 15.3 95 th Percenti le
max. 18.3 weeks
Low
MON09.V A&E ‐ Left Without
Being Seen 2 Medium
Very Low Very Low
n/a Not known
0.5
Not Set
Compl iant
Not Set
Not applicable
1.0
0.5 for each indicator fai lure
capped at a maximum of
1.0
0.5
Not Set
Not Set
Not Yet Defined Not Set
2 MON09.I to MON09.V ‐ Following amendments to the 2011/12 Operating Framework Monitor sent a letter to Foundation Trusts on the 2nd August 2011 with the subject Changes to A&E indicator in the 2011/12 Compliance Framework which stated that the A&E performance will be assessed on the number of patients treated within 4 hours but unlike the previous A&E target this would become site specific. The 5 Clinical Indicators for A&E will still need to be monitored but are now no longer part of the Compliance Framework.
Not Set Not Set
Medium MON09
A&E ‐ 4 Hour Target 95.8% min. 95% 1.0 Medium

Title of Paper: Integrated Performance Report Board Date: Wednesday 25 th April 2012 Page 22 of 34
Code Target Jan‐12 Feb‐12 Mar‐12 Q1 Q2 Q3 Q4 Weighting Position Risk for Quarter
Risk for Year
MON01 74 7 (7) 4 (6) 4 (6) 27 (18) 26 (18) 17 (19) 15 (19) 1.0 Achieving High High
MON02 3 0 (0) 0 (0) 0 (0) 0 (1) 1 (1) 0 (1) 0 (0) 1.0 Achieving Medium Medium surgery MON03.I 94% 100.0%
(0 of 16) 100.0% (0 of 21)
100.0% (0 of 28)
97.4% (4 of 153)
98.8% (2 of 162)
96.8% (4 of 125)
100.0% (0 of 65)
Low Medium
anti cancer drug treatments
MON03.II 98% 100.0% (0 of 89)
100.0% (0 of 84)
100.0% (0 of 68)
99.5% (1 of 203)
99.6% (1 of 225)
100.0% (0 of 200)
100.0% (0 of 241)
Low Medium
radiotherapy MON03.III 94%
96.6% (5 of 146)
100.0% (0 of 113)
100.0% (0 of 113)
99.0% (3 of 314)
98.8% (4 of 320)
99.4% (2 of 344)
98.7% (5 of 372)
Low Medium
from urgent GP referral to treatment MON04.I 85%
85.6% (15 of 104)
86.0% (10 of 71.5)
84.7% (13 of 85)
86.1% (41 of 294.5)
85.9% (38.5 of 273.5)
85.9% (40 of 283)
85.4% (38 of 260.5)
Medium Medium
from consultant screening service referral MON04.II 90%
91.9% (1.5 of 18.5)
100.0% (0 of 10)
100.0% (0 of 7)
94.9% (2 of 39.5)
92.9% (3 of 42)
91.7% (4 of 48)
95.8% (1.5 of 35.5) Medium Medium
admitted pathways MON05 23 weeks 18.9 21.4 25.7 19.3 18.0 18.1 22.3 1.0 Not Achieving High Medium non‐admitted pathways MON06 18.3 weeks 15.1 15.3 15.0 14.0 14.3 14.9 15.3 1.0 Achieving Low Low
MON07 96% 96.3% (7 of 191)
98.7% (2 of 158)
99.1% (2 of 223)
98.1% (12 of 639)
98.0% (12 of 598)
98.5% (8 of 545)
98.1% (11 of 572)
0.5 Achieving Low Low
al l cancers MON08.I 93%
92.1% (60 of 763)
94.2% (46 of 798)
98.6% (12 of 834)
96.3% (93 of 2484)
94.7% (124 of 2357)
95.0% (121 of 2435)
95.1% (118 of 2395)
Low Very Low
for symptomatic breast patients (cancer not initially suspected)
MON08.II 93% 95.7%
(2 of 47) 100.0% (0 of 45)
100.0% (0 of 69)
100.0% (0 of 136)
99.2% (1 of 123)
98.3% (2 of 116)
98.8% (2 of 161)
Very Low Very Low
MON09 95% 96.0% 95.2% 96.3% 96.5% 95.8% 93.7% 95.8% 1.0 Achieving Medium Medium A&E Clinical Qual ity Indicators 2 Total time in A&E (95th
percenti le) MON09.I ≤4 hrs 4.0 4.5 4.0 4.8 4.3 5.0 4.2 Not Yet
Implemented Not Set Not Set
Time to initial assessment (95th percenti le)
MON09.II ≤15 mins 18.0 20.0 23.0 29.0 22.0 19.0 20.0 Not Yet Implemented
Not Set Not Set
Time to treatment decision (median)
MON09.III ≤60 mins 37.0 41.0 41.0 45.0 41.0 40.0 40.0 Not Yet Implemented
Not Set Not Set
Unplanned reattendance rate
MON09.IV ≤5% 7.2% 7.8% 7.7% 8.2% 7.3% 7.5% 7.6% Not Yet
Implemented Not Set Not Set
Left without being seen MON09.V ≤5% 1.7% 2.1% 2.4% 2.8% 2.6% 2.7% 2.1%
Not Yet Implemented
Not Set Not Set
MON10 tbc 0.5 Not Known Not Set Not Set Patient
experience MON11 n/a 0.5 Achieving Very Low Very Low
Quality
Monitor Targets Detail ‐ March 2012
Indicator
Clostridium Diffici le – meeting the Clostridium Diffici le objective 1
MRSA – meeting the MRSA objective
Not yet defined
Safety
Qual ity
Referral to treatment waiting times – (95th percentile)
Patient experience
Al l cancers: 62‐day wait for first treatment
Stroke Indicator
Achieving
Achieving
Achieving
1.0
1.0
Al l cancers: 31‐day wait for second or subsequent treatment
2 MON09.I to MON09.V ‐ Following amendments to the 2011/12 Operating Framework Monitor sent a letter to Foundation Trusts on the 2nd August 2011 with the subject Changes to A&E indicator in the 2011/12 Compliance Framework which stated that the A&E performance will be assessed on the number of patients treated within 4 hours but unlike the previous A&E target this would become site specific. The 5 Clinical Indicators for A&E will still need to be monitored but are now no longer part of the Compliance Framework.
The position for Cancer targets is subject to change when the data is uploaded to the National Cancer Waiting Times Database 6 weeks after month end. 1 MON01 ‐ Clostridium Difficile ‐ Whilst the quarterly trajectory has been achieved for Q3 and currently Q4 the full year trajectory has already been exceeded and therefore both Q3 and Q4 will be judged by Monitor as not achieved.
All cancers: 31‐day wait from diagnosis to first treatment
Cancer: two week wait from referral to date first seen
0.5
Certi fication against compliance with requirements regarding access to healthcare for people with a learning disabil ity
Compliant
0.5 for each indicator failure capped at a maximum of 1.0
4 Hour Target A&E

Title of Paper: Integrated Performance Report Board Date: Wednesday 25 th April 2012 Page 23 of 34
Data Appendices – Finance
Actual Surplus YTD Budgeted Surplus YTD Spend YTD Planned Spend YTD £3m £3.5m £14.1m £16.7m
Forecast Surplus Y/E BudgetedSurplus Y/E Forecast Y/E Spend Planned Y/E Spend £3m £3.5m £14.5m £16.7m
Actual Efficiency* Budgeted Efficiency* 0.86% 0.97%
Other Ratios Plan YTD Actual YTD Plan Y/E Forecast Y/E
Trade Creditor Days 6.4 4.4 6.4 4.4 NHS Trade Debtor Days 8.9 8.5 8.9 8.5 Debt to Asset Ratio 6.3% 6.5% 6.3% 6.5% Other items £ £ £ £ Revenue available for debt service 23.7m 23.3m 23.7m 23.3m Debt 20.2m 20.2m 20.2m 20.2m Total Assets 321.9m 309.9m 321.9m 309.9m
Cash in hand and at bank £49.6m Working Capital Facility £0m Cash invested @ Month End £0m
*(planned surplus / planned operating income *100) *(forecast surplus / forecast operating income *100)
4. Cash 6. WTE
RD&E Financial Overview as at 31st March (YTD Month 12) 1. I&E 3. Capital 5. Ratios/Risk Rating
Graph – Capital Plan Vs Actual and forecast spend
2. CIP Graph – Actual, Forecast & Plan
APPEN
DIX 1
CIP Plan v Actual
0
2000
4000
6000
8000
10000
12000
14000
16000
18000
April
May
June
July
August
September
October
November
Decem
ber
January
February
March
Month
£m
CIP Plan
CIP Actual
CIP Forecast
Contracted WTE, Worked WTE & Funded WTE
4700
4800
4900
5000
5100
5200
5300
5400
M710/11
M810/11
M910/11
M1010/11
M1110/11
M1210/11
M1
M2
M3
M4
M5
M6
M7
M8
M9 M10
M11 M12
Month
WTE
Worked WTE
Contract WTE
Funded WTE
Annual Plan WTE
Risk Ratings
0
0.5
1
1.5
2
2.5
3
3.5
4
4.5
5
EBITDA Margin
EBITDA % Achieved
ROA
I&E Surplus Margin
Liquidity
Overall Rating
Plan YTD
Actual YTD
Plan Y/E
Forecast Y/E
Comparison of actual cumulative net surplus/deficit compared to plan
3,000
2,000
1,000
0
1,000
2,000
3,000
4,000
5,000
April
May
June
July
August
September
October
November
December
January
February
March
Month
£
Actual
Budget 0
2
4
6
8
10
12
14
16
18
£M
Month
Capital Spend
Capital Plan 11/12
Actual Capital Spend
Forecast Capital Spend
(20)
(10)
10
20
30
40
50
60
70
80
Apr11
May11
Jun11
Jul11
Aug11
Sep11
Oct11
Nov11
Dec11
Jan12
Feb12
Mar12
£M
Month
12 Month forecast cashflow v plan
Plan
Actual
Forecast
Commited Facility

Title of Paper: Integrated Performance Report Board Date: Wednesday 25 th April 2012 Page 24 of 34
Overall : Year to Date 1% down compared to similar period in 1011
OP 1st Attendances Current Month 13% below plan. Daycase 1st FCEs Current Month 4% above plansame as plan.
10% lower than the same month last year 5% lower than the same month last year
6% higher than previous month 5% higher than the previous month
Year to Date 1% down on same period in 1011
Year to Date 3% above than same period in 1011.
Year to date 9% below plan. Year to date 4% above plan.
Elective IP 1st FCEs Current Month 7% below plan.
Non Elective IP 1st FCEs Current Month 2% above plan.
16% lower than the same month last year 2% higher than same month last year
16% higher than previous month 5% higher than previous month
Year to Date 17% lower than the same period in 1011.
Year to Date 1% lower than same period in 1011.
Year to date 12% below plan. Year to date same as plan.
RD&E Activity Overview as at 31 March 2012 (YTD ‐ Month 12)
OP 1st Attendances
4000
5000
6000
7000
8000
9000
10000
11000 Mar‐09
Apr‐09
May‐09
Jun‐09
Jul‐0
9 Au
g‐09
Se
p‐09
Oct‐09
Nov
‐09
Dec‐09
Jan‐10
Fe
b‐10
Mar‐10
Apr‐10
May‐10
Jun‐10
Jul‐1
0 Au
g‐10
Se
p‐10
Oct‐10
Nov
‐10
Dec‐10
Jan‐11
Fe
b‐11
Mar‐11
Apr‐11
May‐11
Jun‐11
Jul‐1
1 Au
g‐11
Se
p‐11
Oct‐11
Nov
‐11
Dec‐11
Jan‐12
Fe
b‐12
Mar‐12
Plan Actual
Day Case 1st FCEs
2000
2200
2400
2600
2800
3000
3200
3400
3600
3800
4000
4200
4400
4600
4800
5000
5200
5400
5600
Mar‐09
Apr‐09
May‐09
Jun‐09
Jul‐0
9 Au
g‐09
Se
p‐09
Oct‐09
Nov
‐09
Dec‐09
Jan‐10
Fe
b‐10
Mar‐10
Apr‐10
May‐10
Jun‐10
Jul‐1
0 Au
g‐10
Se
p‐10
Oct‐10
Nov
‐10
Dec‐10
Jan‐11
Fe
b‐11
Mar‐11
Apr‐11
May‐11
Jun‐11
Jul‐1
1 Au
g‐11
Se
p‐11
Oct‐11
Nov
‐11
Dec‐11
Jan‐12
Fe
b‐12
Mar‐12
Plan Actual
Non‐Elective IP 1st FCEs
0
500
1000
1500
2000
2500
3000
3500
Mar‐09
Apr‐09
May‐09
Jun‐09
Jul‐0
9 Au
g‐09
Se
p‐09
Oct‐09
Nov
‐09
Dec‐09
Jan‐10
Fe
b‐10
Mar‐10
Apr‐10
May‐10
Jun‐10
Jul‐1
0 Au
g‐10
Se
p‐10
Oct‐10
Nov
‐10
Dec‐10
Jan‐11
Fe
b‐11
Mar‐11
Apr‐11
May‐11
Jun‐11
Jul‐1
1 Au
g‐11
Se
p‐11
Oct‐11
Nov
‐11
Dec‐11
Jan‐12
Fe
b‐12
Mar‐12
Plan Actual
Elective IP 1st FCEs
500
700
900
1100
1300
1500
1700
1900
2100
Mar‐09
Apr‐09
May‐09
Jun‐09
Jul‐0
9 Au
g‐09
Sep‐09
Oct‐09
Nov‐09
De
c‐09
Jan‐10
Feb‐10
Mar‐10
Apr‐10
May‐10
Jun‐10
Jul‐1
0 Au
g‐10
Sep‐10
Oct‐10
Nov‐10
De
c‐10
Jan‐11
Feb‐11
Mar‐11
Apr‐11
May‐11
Jun‐11
Jul‐1
1 Au
g‐11
Sep‐11
Oct‐11
Nov‐11
De
c‐11
Jan‐12
Feb‐12
Mar‐12
Plan Actual

Title of Paper: Integrated Performance Report Board Date: Wednesday 25 th April 2012 Page 25 of 34
Royal Devon & Exeter NHS Foundation Trust Prior Yr Actual Budget Actual Annual Actual Actual Budget Actual Annual Actual Mar11
Income Statement Variance Plan Variance Variance Plan Variance Actual Period ending 31/03/2012 to Budget to Plan to Budget to Plan Month 12 Fav./(Adv.) Fav./(Adv.) Fav./(Adv.) Fav./(Adv.) Fav./(Adv.) Fav./(Adv.)
£000 £000 £000 £000 £000 £000 £000 £000 £000 £000 £000 Income
NHS Clinical Income 286,274 286,608 (334) 1 278,936 7,338 286,274 286,608 (334) 1 278,936 7,338 1 287,191
Private patient income 970 1,151 (181) 1,150 (180) 970 1,151 (181) 1,150 (180) 1,142
Research and Development 12,936 12,957 (21) 12,649 287 12,936 12,957 (21) 12,649 287 13,071
Education and Training 13,901 13,862 39 12,982 919 13,901 13,862 39 12,982 919 14,231
Other income 36,503 36,192 311 2 34,592 1,911 36,503 36,192 311 2 34,592 1,911 35,035
Total income 350,584 350,770 (186) 340,310 10,274 350,584 350,770 (186) 340,310 10,274 350,670 Expense
Employee Benefits Expenses (Pay) (203,756) (203,816) 60 (198,588) (5,168) (203,756) (203,816) 60 (198,588) (5,168) (203,420)
Drug Costs (30,090) (30,281) 191 (29,120) (970) (30,090) (30,281) 191 (29,120) (970) 2 (27,777)
Clinical Supplies (37,149) (35,738) (1,411) 3 (38,858) 1,709 (37,149) (35,738) (1,411) 3 (38,858) 1,709 2 (40,253)
Non Clinical Supplies (5,107) (4,878) (229) (4,364) (743) (5,107) (4,878) (229) (4,364) (743) (4,432)
Research & Development Expenses (12,144) (12,145) 1 (12,861) 717 (12,144) (12,145) 1 (12,861) 717 (13,009)
Misc. Other Operating Expenses (39,273) (38,518) (755) 4 (33,016) (6,257) (39,273) (38,518) (755) 4 (33,016) (6,257) 3 (36,505)
Reserves 0 (1,676) 1,676 0 0 0 (1,676) 1,676 0 0 0
Total Costs (327,519) (327,052) (467) (316,806) (10,713) (327,519) (327,052) (467) (316,806) (10,713) 7 (325,396)
EBITDA 23,065 23,718 (653) 23,504 (439) 23,065 23,718 (653) 23,504 (439) 25,274
Profit / loss on asset disposals (103) 0 (103) 0 (103) (103) 0 (103) 0 (103) (2,841) Exceptional Income/ Costs & Impairments **
Total Depreciation (12,015) (11,995) (20) (11,994) (21) (12,015) (11,995) (20) (11,994) (21) (10,499)
Total operating surplus (deficit) 10,947 11,723 (776) 11,509 (562) 10,947 11,723 (776) 11,509 (562) 11,934
279 195 84 195 84 279 195 84 195 84 247
Total interest payable on Loans and leases (1,018) (1,007) (11) (1,007) (11) (1,018) (1,007) (11) (1,007) (11) (1,072)
PDC Dividend (7,178) (7,411) 233 (7,411) 233 (7,178) (7,411) 233 (7,411) 233 (7,048)
Net Surplus/(deficit) 3,030 3,500 (470) 3,286 (256) 3,030 3,500 (470) 3,286 (256) 4,061
KEY MOVEMENTS
1 2 Over recovery of commercial income for the following services: Laundry, Transport, IT and Pharmacy 3 4
Year to Date Outturn
Total interest receivable/ (payable) inc committed WC facilities
APPE
NDIX 3
Over recovery of income within W&C Health, Medicine and Critical Care. Under recovery of income within Trauma & Orthopaedics, Surgery, Cancer Services and Professional Services
Clinical supplies overspend has increased compared to month 11 by £591k, this is mainly due to a decrease in Theatre stock levels. Other operating expense is overspent mainly due to maintenance contractors within RD&E Estates and spend on utilities (electricity, gas, oil, water and sewerage)
Title of Paper: Integrated Performance Report Board Date: Wednesday 25 th April 2012 Page 26 of 34
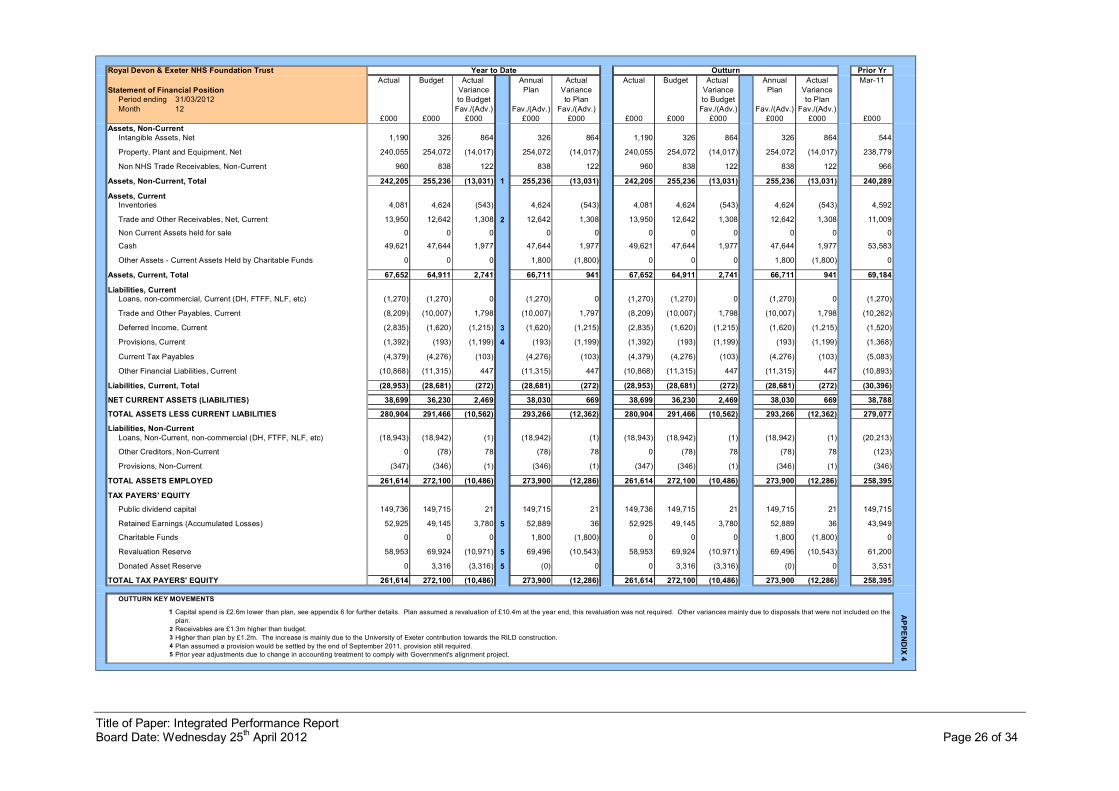
Royal Devon & Exeter NHS Foundation Trust Prior Yr Actual Budget Actual Annual Actual Actual Budget Actual Annual Actual Mar11
Statement of Financial Position Variance Plan Variance Variance Plan Variance Period ending 31/03/2012 to Budget to Plan to Budget to Plan Month 12 Fav./(Adv.) Fav./(Adv.) Fav./(Adv.) Fav./(Adv.) Fav./(Adv.) Fav./(Adv.)
£000 £000 £000 £000 £000 £000 £000 £000 £000 £000 £000 Assets, NonCurrent
Intangible Assets, Net 1,190 326 864 326 864 1,190 326 864 326 864 544
Property, Plant and Equipment, Net 240,055 254,072 (14,017) 254,072 (14,017) 240,055 254,072 (14,017) 254,072 (14,017) 238,779
Non NHS Trade Receivables, NonCurrent 960 838 122 838 122 960 838 122 838 122 966
Assets, NonCurrent, Total 242,205 255,236 (13,031) 1 255,236 (13,031) 242,205 255,236 (13,031) 255,236 (13,031) 240,289
Assets, Current Inventories 4,081 4,624 (543) 4,624 (543) 4,081 4,624 (543) 4,624 (543) 4,592
Trade and Other Receivables, Net, Current 13,950 12,642 1,308 2 12,642 1,308 13,950 12,642 1,308 12,642 1,308 11,009
Non Current Assets held for sale 0 0 0 0 0 0 0 0 0 0 0
Cash 49,621 47,644 1,977 47,644 1,977 49,621 47,644 1,977 47,644 1,977 53,583
Other Assets Current Assets Held by Charitable Funds 0 0 0 1,800 (1,800) 0 0 0 1,800 (1,800) 0
Assets, Current, Total 67,652 64,911 2,741 66,711 941 67,652 64,911 2,741 66,711 941 69,184
Liabilities, Current Loans, noncommercial, Current (DH, FTFF, NLF, etc) (1,270) (1,270) 0 (1,270) 0 (1,270) (1,270) 0 (1,270) 0 (1,270)
Trade and Other Payables, Current (8,209) (10,007) 1,798 (10,007) 1,797 (8,209) (10,007) 1,798 (10,007) 1,798 (10,262)
Deferred Income, Current (2,835) (1,620) (1,215) 3 (1,620) (1,215) (2,835) (1,620) (1,215) (1,620) (1,215) (1,520)
Provisions, Current (1,392) (193) (1,199) 4 (193) (1,199) (1,392) (193) (1,199) (193) (1,199) (1,368)
Current Tax Payables (4,379) (4,276) (103) (4,276) (103) (4,379) (4,276) (103) (4,276) (103) (5,083)
Other Financial Liabilities, Current (10,868) (11,315) 447 (11,315) 447 (10,868) (11,315) 447 (11,315) 447 (10,893)
Liabilities, Current, Total (28,953) (28,681) (272) (28,681) (272) (28,953) (28,681) (272) (28,681) (272) (30,396)
NET CURRENT ASSETS (LIABILITIES) 38,699 36,230 2,469 38,030 669 38,699 36,230 2,469 38,030 669 38,788
TOTAL ASSETS LESS CURRENT LIABILITIES 280,904 291,466 (10,562) 293,266 (12,362) 280,904 291,466 (10,562) 293,266 (12,362) 279,077
Liabilities, NonCurrent Loans, NonCurrent, noncommercial (DH, FTFF, NLF, etc) (18,943) (18,942) (1) (18,942) (1) (18,943) (18,942) (1) (18,942) (1) (20,213)
Other Creditors, NonCurrent 0 (78) 78 (78) 78 0 (78) 78 (78) 78 (123)
Provisions, NonCurrent (347) (346) (1) (346) (1) (347) (346) (1) (346) (1) (346)
TOTAL ASSETS EMPLOYED 261,614 272,100 (10,486) 273,900 (12,286) 261,614 272,100 (10,486) 273,900 (12,286) 258,395
TAX PAYERS' EQUITY
Public dividend capital 149,736 149,715 21 149,715 21 149,736 149,715 21 149,715 21 149,715
Retained Earnings (Accumulated Losses) 52,925 49,145 3,780 5 52,889 36 52,925 49,145 3,780 52,889 36 43,949
Charitable Funds 0 0 0 1,800 (1,800) 0 0 0 1,800 (1,800) 0
Revaluation Reserve 58,953 69,924 (10,971) 5 69,496 (10,543) 58,953 69,924 (10,971) 69,496 (10,543) 61,200
Donated Asset Reserve 0 3,316 (3,316) 5 (0) 0 0 3,316 (3,316) (0) 0 3,531
TOTAL TAX PAYERS' EQUITY 261,614 272,100 (10,486) 273,900 (12,286) 261,614 272,100 (10,486) 273,900 (12,286) 258,395
OUTTURN KEY MOVEMENTS
1
2 3 4 5
Year to Date Outturn
APPE
NDIX 4
Capital spend is £2.6m lower than plan, see appendix 6 for further details. Plan assumed a revaluation of £10.4m at the year end, this revaluation was not required. Other variances mainly due to disposals that were not included on the plan. Receivables are £1.3m higher than budget. Higher than plan by £1.2m. The increase is mainly due to the University of Exeter contribution towards the RILD construction. Plan assumed a provision would be settled by the end of September 2011, provision still required. Prior year adjustments due to change in accounting treatment to comply with Government's alignment project.
Title of Paper: Integrated Performance Report Board Date: Wednesday 25 th April 2012 Page 27 of 34
Royal Devon & Exeter NHS Foundation Trust Prior Yr
Actual Budget Actual Annual Actual Actual Budget Actual Annual Actual Mar11 Cash Flow Statement Variance Plan Variance Variance Plan Variance
Period ending 31/03/2012 to Budget to Plan to Budget to Plan Month 12 Fav./(Adv.) Fav./(Adv.) Fav./(Adv.) Fav./(Adv.) Fav./(Adv.) Fav./(Adv.)
£000 £000 £000 £000 £000 £000 £000 £000 £000 £000 £000 NET CASH INFLOW/(OUTFLOW) FROM OPERATING ACTIVITIES
Surplus/(deficit) after tax 3,030 3,500 (470) 3,286 (256) 3,030 3,500 (470) 3,286 (256) 4,061
Noncash flows in operating surplus/(deficit) Finance (income)/charges 739 812 (73) 812 (73) 739 812 (73) 812 (73) 825 Depreciation and amortisation 12,015 11,995 20 11,994 21 12,015 11,995 20 11,994 21 10,499 Impairment 0 0 0 0 0 0 0 0 0 0 2,806 PDC dividend expense 7,178 7,411 (233) 7,411 (233) 7,178 7,411 (233) 7,411 (233) 7,048
Other increases/(decreases) to reconcile to profit/(loss) from operations 103 (278) 381 0 103 103 (278) 381 0 103 (238)
Noncash flows in operating surplus/(deficit), Total 20,035 19,940 95 20,218 (183) 20,035 19,940 95 20,218 (183) 20,940
Increase/(Decrease) in working capital (Increase)/decrease in inventories 511 (32) 543 (32) 543 511 (32) 543 (32) 543 15 (Increase)/decrease in NHS Trade Receivables (1,039) (1,204) 165 (1,204) 165 (1,039) (1,204) 165 (1,204) 165 974 (Increase)/decrease in Non NHS Trade Receivables (550) 71 (621) 71 (621) (550) 71 (621) 71 (621) 163 (Increase)/decrease in other receivables (518) (276) (242) (276) (242) (518) (276) (242) (276) (242) 749 (Increase)/decrease in accrued income (228) (208) (20) (208) (20) (228) (208) (20) (208) (20) 187 (Increase)/decrease in prepayments (592) (16) (576) (16) (576) (592) (16) (576) (16) (576) (250) Increase/(decrease) in Deferred Income (excl. Donated Assets) 1,360 100 1,260 100 1,260 1,360 100 1,260 100 1,260 (730) Increase/(decrease) in provisions 25 (1,175) 1,200 (1,175) 1,200 25 (1,175) 1,200 (1,175) 1,200 1,288
Increase/(decrease) in Trade Creditors (1,779) (200) (1,579) (200) (1,579) (1,779) (200) (1,579) (200) (1,579) (139) Increase/(decrease) in tax payable (704) (807) 103 (807) 103 (704) (807) 103 (807) 103 1,035 Increase/(decrease) in Other Creditors 32 (55) 87 (55) 87 32 (55) 87 (55) 87 88 Increase/(decrease) in accruals 237 684 (447) 684 (447) 237 684 (447) 684 (447) (1,037)
Increase/(Decrease) in workling capital, Total (3,245) (3,119) (126) (3,119) (126) (3,245) (3,119) (126) (3,119) (126) 2,343
Net cash inflow/(outflow) from investing activities Property new land, buildings or dwellings (7,255) (4,434) (2,821) (4,434) (2,821) (7,255) (4,434) (2,821) (4,434) (2,821) (3,555) Property maintenance expenditure (2,113) (3,042) 928 (3,042) 928 (2,113) (3,042) 928 (3,042) 928 (8,851) Plant and equipment Information Technology (2,031) (1,451) (580) (1,451) (580) (2,031) (1,451) (580) (1,451) (580) 0 Plant and equipment Other (2,654) (7,723) 5,068 (7,723) 5,068 (2,654) (7,723) 5,068 (7,723) 5,068 0
Proceeds on disposal of property, plant and equipment 14 0 14 0 14 14 0 14 0 14 6,081 Increase/(decrease) in Capital Creditors (306) 0 (306) 0 (306) (306) 0 (306) 0 (306) (242) Other cash flows from financing activities 0 63 (63) (1) 1 0 63 (63) (1) 1 0
Net cash inflow/(outflow() from investing activities, Total (14,345) (16,587) 2,242 (16,650) 2,305 (14,345) (16,587) 2,242 (16,650) 2,305 (6,568) Net cash inflow/(outflow) from financing activities
PDC Dividends paid (7,454) (7,673) 219 (7,673) 219 (7,454) (7,673) 219 (7,673) 219 (6,502) PDC Dividend Received 21 0 0 0 0 21 0 21 0 21 0 Interest (paid) on commercial loans (1,018) (1,007) (11) (1,007) (11) (1,018) (1,007) (11) (1,007) (11) (1,072) Interest received on cash and cash equivalents 279 195 84 195 84 279 195 84 195 84 247 Repayment of noncommercial loans (1,270) (1,271) 1 (1,271) 1 (1,270) (1,271) 1 (1,271) 1 (1,271) (Increase)/decrease in noncurrent receivables 6 128 (122) 128 (122) 6 128 (122) 128 (122) (128) Increase/(decrease) in noncurrent payables 0 (45) 45 (45) 45 0 (45) 45 (45) 45 34
Net cash inflow/(outflow) from financing activities, Total (9,436) (9,673) 216 (9,673) 216 (9,436) (9,673) 237 (9,673) 237 (8,692)
Net increase/(decrease) in cash and cash equivalents (3,961) (5,939) 1,978 (5,938) 1,977 (3,961) (5,939) 1,978 (5,938) 1,977 12,085
Opening cash and cash equivalents 53,583 53,583 0 53,583 0 53,583 53,583 0 53,583 0 41,498
Closing cash and cash equivalents 49,622 47,644 1,978 47,645 1,977 49,622 47,644 1,978 47,645 1,977 53,583
Year to Date Outturn
APPE
NDIX 5

Title of Paper: Integrated Performance Report Board Date: Wednesday 25 th April 2012 Page 28 of 34
Royal Devon and Exeter NHS Foundation Trust
Capital expenditure
Period ending 31/03/2012
Month 12 Column B Column C Column D Column E Column F Column G Column H
YTD planned expenditure per annual plan
YTD actual expenditure
YTD variance slippage / (overspend)
Forecast future capital
expenditure for the year
Forecast total capital
expenditure for the year
Full year expenditure per annual plan
11/12 forecast slippage / (overspend)
Expenditure approved by the Exec Group
Total expenditure forecast for the
scheme
Scheme variance under spend / (overspend)
( B C) (C + E) (G F) £'000 £'000 £'000 £'000 £'000 £'000 £'000 £'000 £'000 £'000
FBC 2,251 2,867 ( 616) 2,867 2,251 ( 616) 8,344 8,344 31Mar15
FBC 378 809 ( 431) 809 378 ( 431) 7,239 7,239 31Mar15
FBC 2,261 2,447 ( 186) 2,447 2,261 ( 186) 6,200 5,901 299 30Jun12
Approved 165 108 57 108 165 57 5,000 5,000 31Mar14
FBC 17 ( 17) 17 ( 17) 3,126 3,126 Occupied
FBC ( 22) ( 18) ( 4) ( 18) ( 22) ( 4) 2,370 1,925 445 Complete
FBC 527 256 271 256 527 271 2,207 2,207 31Mar14
FBC 77 29 48 29 77 48 1,366 1,104 262 Complete
FBC 18 ( 18) 18 ( 18) 1,248 1,304 ( 56) Occupied
Note 1 (CAP1 rec'd) 267 267 267 267 1,175 1,175 31Mar15
Approved 8,613 4,468 4,145 4,468 8,613 4,145
14,516 11,000 3,516 11,000 14,516 3,516
FBC 1,484 1,557 ( 73) 1,557 1,484 ( 73) 4,014 4,014 31Mar15
Note 1 250 250 250 250 2,787 2,787 31Mar14
Note 1 400 400 400 400 1,440 1,440 On hold
2,134 1,557 577 1,557 2,134 577
16,650 12,557 4,093 12,557 16,650 4,093
Note 2 1,497 ( 1,497) 1,497 ( 1,497) 16,361 16,361 31Mar15
16,650 14,054 2,596 14,054 16,650 2,596
Approval Level Key OBC Outline business case FBC Full business case SOC Strategic outline case Note 1 Subject to Board approval of full business cases (SOC, OBC, FBC) Note 2
APPEN
DIX 6
Total Priority 1 and Priority 2
RILD University of Exeter element (The University's RILD capital additions were not included on the Annual Plan, these additions are suppressing the Trust's actual capital slippage, excluding them the Trust's capital slippage would be £4.093m to date)
Grand total
Priority 2 schemes £2,768k allocated below plus £184k allocated to priority 1 Durbin Ward refurbishment
Electronic Document Management (eNotes)
Full cost of RILD scheme capitalised during the construction period. When asset is brought into use the cost of the university's element will be offset against their contribution received. There is no loss anticipated.
Replacement PAS,CDM & ward whiteboard
North Devon expansion and central water processing plant
Priority 2 total
Core network upgrade
Other schemes < £1m and contingency
Priority 1 total
Priority 2
Renal Heavitree
Order comms and eprescribing IT systems
Procurement of third CT scanner
Nursery expansion
Research, Innovation, Learning and Development (RILD)
Increasing radiotherapy capacity(3rd LINACC)
Estates infrastructure (for capital schemes moved to revenue please see below)
Pain management (inc. physio)
Scheme Approval level
Priority 1 Rebuild CIVAS unit and equip.
Expected completion date
Actual expenditure to date compared to budget on annual plan
Total expenditure forecast for the year compared to the budget on the annual plan
Total expected expenditure compared to the value approved by the Exec Group.
Schemes over £1 million in progress or planned
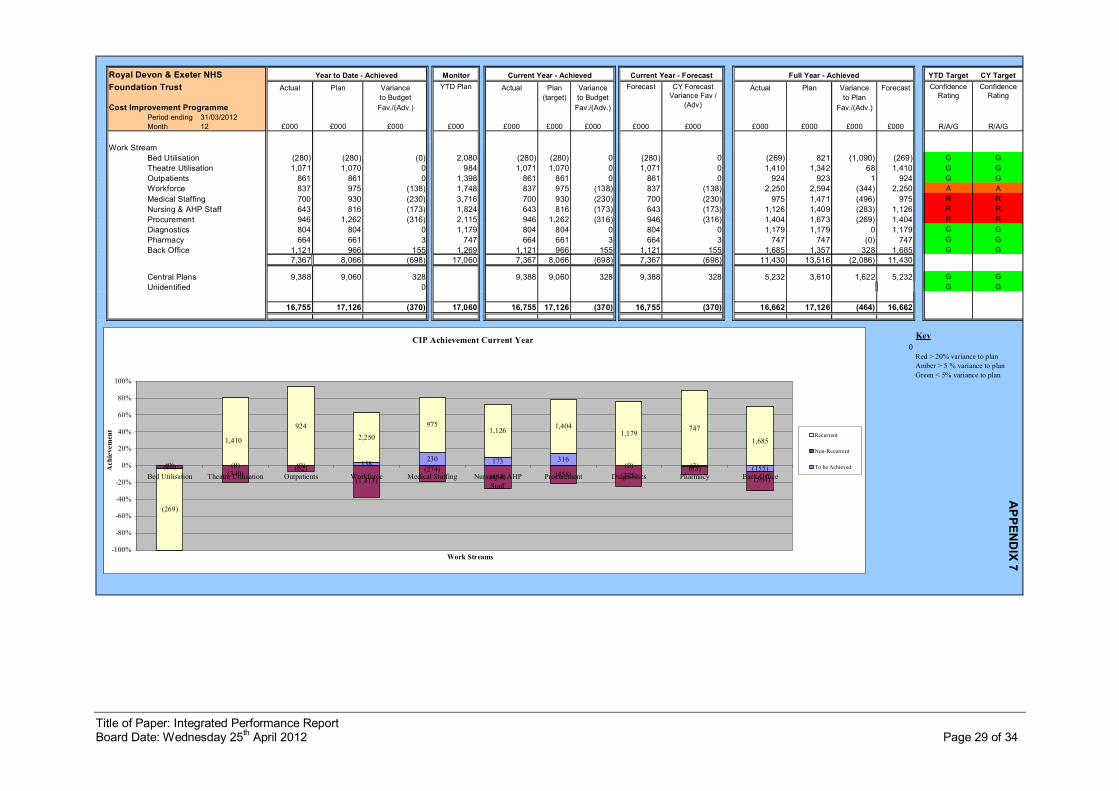
Title of Paper: Integrated Performance Report Board Date: Wednesday 25 th April 2012 Page 29 of 34
Royal Devon & Exeter NHS Monitor YTD Target CY Target Foundation Trust Actual Plan Variance Actual Plan Variance Actual Plan Variance Forecast
to Budget (target) to Budget to Plan Cost Improvement Programme Fav./(Adv.) Fav./(Adv.) Fav./(Adv.)
Period ending 31/03/2012 Month 12 £000 £000 £000 £000 £000 £000 £000 £000 £000 £000 £000 £000 £000 R/A/G R/A/G
Work Stream Bed Utilisation (280) (280) (0) 2,080 (280) (280) 0 (280) 0 (269) 821 (1,090) (269) G G Theatre Utilisation 1,071 1,070 0 984 1,071 1,070 0 1,071 0 1,410 1,342 68 1,410 G G Outpatients 861 861 0 1,398 861 861 0 861 0 924 923 1 924 G G Workforce 837 975 (138) 1,748 837 975 (138) 837 (138) 2,250 2,594 (344) 2,250 A A Medical Staffing 700 930 (230) 3,716 700 930 (230) 700 (230) 975 1,471 (496) 975 R R Nursing & AHP Staff 643 816 (173) 1,824 643 816 (173) 643 (173) 1,126 1,409 (283) 1,126 R R Procurement 946 1,262 (316) 2,115 946 1,262 (316) 946 (316) 1,404 1,673 (269) 1,404 R R Diagnostics 804 804 0 1,179 804 804 0 804 0 1,179 1,179 0 1,179 G G Pharmacy 664 661 3 747 664 661 3 664 3 747 747 (0) 747 G G Back Office 1,121 966 155 1,269 1,121 966 155 1,121 155 1,685 1,357 328 1,685 G G
7,367 8,066 (698) 17,060 7,367 8,066 (698) 7,367 (698) 11,430 13,516 (2,086) 11,430
RESTOT Central Plans 9,388 9,060 328 9,388 9,060 328 9,388 328 5,232 3,610 1,622 5,232 G G RESTOT Unidentified 0 G G
16,755 17,126 (370) 17,060 16,755 17,126 (370) 16,755 (370) 16,662 17,126 (464) 16,662
Key 0 Red > 20% variance to plan Amber > 5 % variance to plan Green < 5% variance to plan
YTD Plan Forecast CY Forecast Variance Fav /
(Adv)
Year to Date Achieved Current Year Achieved Current Year Forecast Full Year Achieved Confidence Rating
Confidence Rating
APPEN
DIX 7
CIP Achievement Current Year
(0) (0) (0) 138 230 173 316 (0) (3) (155) (11)
(340) (62)
(1,413) (484) (458) (375)
(269)
924 2,250
975 1,126 1,404
1,179
(274) (83) (564)
1,410
747
1,685
100%
80%
60%
40%
20%
0%
20%
40%
60%
80%
100%
Bed Utilisation Theatre Utilisation Outpatients Workforce Medical Staffing Nursing & AHP Staff
Procurement Diagnostics Pharmacy Back Office
Work Streams
Achievement
Recurrent
NonRecurrent
To be Achieved
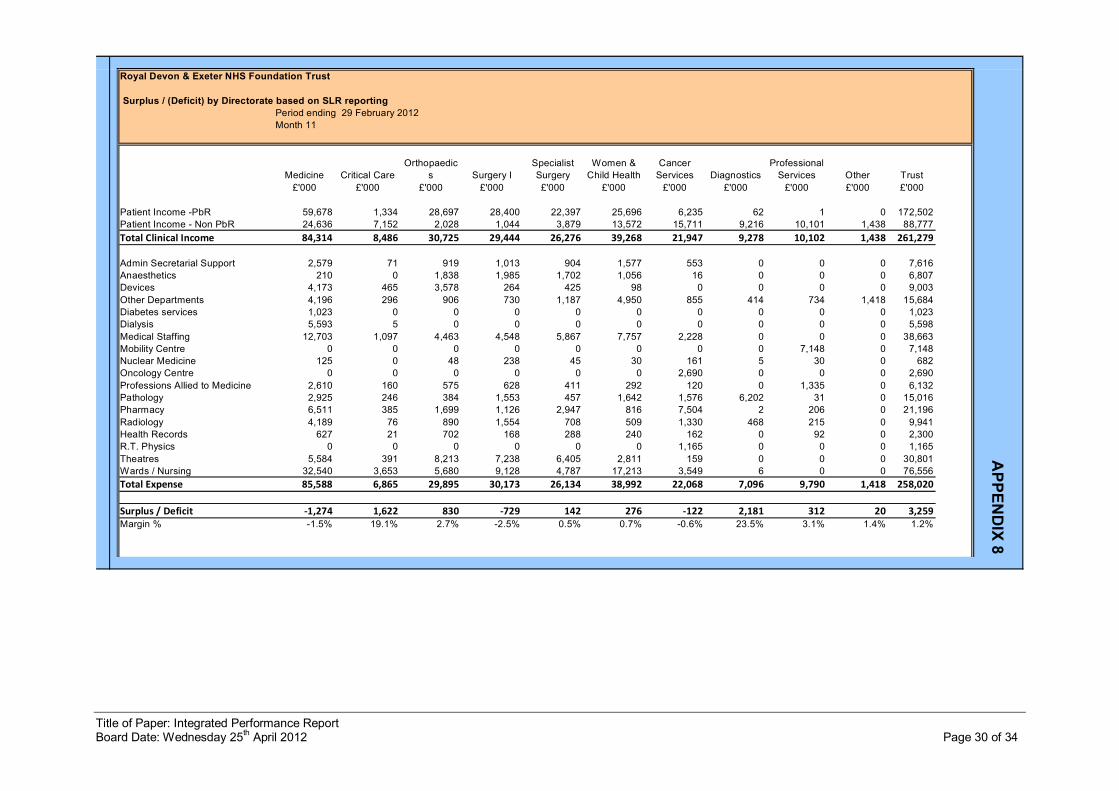
Title of Paper: Integrated Performance Report Board Date: Wednesday 25 th April 2012 Page 30 of 34
Royal Devon & Exeter NHS Foundation Trust
Surplus / (Deficit) by Directorate based on SLR reporting
Medicine Critical Care Orthopaedic
s Surgery I Specialist Surgery
Women & Child Health
Cancer Services Diagnostics
Professional Services Other Trust
£'000 £'000 £'000 £'000 £'000 £'000 £'000 £'000 £'000 £'000 £'000
Patient Income PbR 59,678 1,334 28,697 28,400 22,397 25,696 6,235 62 1 0 172,502 Patient Income Non PbR 24,636 7,152 2,028 1,044 3,879 13,572 15,711 9,216 10,101 1,438 88,777 Total Clinical Income 84,314 8,486 30,725 29,444 26,276 39,268 21,947 9,278 10,102 1,438 261,279
Admin Secretarial Support 2,579 71 919 1,013 904 1,577 553 0 0 0 7,616 Anaesthetics 210 0 1,838 1,985 1,702 1,056 16 0 0 0 6,807 Devices 4,173 465 3,578 264 425 98 0 0 0 0 9,003 Other Departments 4,196 296 906 730 1,187 4,950 855 414 734 1,418 15,684 Diabetes services 1,023 0 0 0 0 0 0 0 0 0 1,023 Dialysis 5,593 5 0 0 0 0 0 0 0 0 5,598 Medical Staffing 12,703 1,097 4,463 4,548 5,867 7,757 2,228 0 0 0 38,663 Mobility Centre 0 0 0 0 0 0 0 0 7,148 0 7,148 Nuclear Medicine 125 0 48 238 45 30 161 5 30 0 682 Oncology Centre 0 0 0 0 0 0 2,690 0 0 0 2,690 Professions Allied to Medicine 2,610 160 575 628 411 292 120 0 1,335 0 6,132 Pathology 2,925 246 384 1,553 457 1,642 1,576 6,202 31 0 15,016 Pharmacy 6,511 385 1,699 1,126 2,947 816 7,504 2 206 0 21,196 Radiology 4,189 76 890 1,554 708 509 1,330 468 215 0 9,941 Health Records 627 21 702 168 288 240 162 0 92 0 2,300 R.T. Physics 0 0 0 0 0 0 1,165 0 0 0 1,165 Theatres 5,584 391 8,213 7,238 6,405 2,811 159 0 0 0 30,801 Wards / Nursing 32,540 3,653 5,680 9,128 4,787 17,213 3,549 6 0 0 76,556 Total Expense 85,588 6,865 29,895 30,173 26,134 38,992 22,068 7,096 9,790 1,418 258,020
Surplus / Deficit ‐1,274 1,622 830 ‐729 142 276 ‐122 2,181 312 20 3,259 Margin % 1.5% 19.1% 2.7% 2.5% 0.5% 0.7% 0.6% 23.5% 3.1% 1.4% 1.2%
APPEN
DIX 8
Period ending 29 February 2012 Month 11

Title of Paper: Integrated Performance Report Board Date: Wednesday 25 th April 2012 Page 31 of 34
MONITOR PROPOSED FURTHER INDICATORS FOR FRR COMPLIANCE FRAMEWORK CONSULTATION
Proposed indicator Potential financial weakness Criteria to measure against
Unplanned decrease in EBITDA margin in two consecutive quarters Deteriorating trend in operating performance and cashflow generation Variance to planned EBITDA margin NO 103.24% NO 107.96% NO 104.29% NO 97.23%
Quarterly selfcertification by trust that FRR may be less than 3 in the next 12 months
Identified risk of potential financial breach within the next year
Forecast financial risk rating for the next 12 months NO 3+ NO 3+ NO 3+ NO 3+
FRR 2 for any one quarter In year deterioration in financial performance Current period Financial Risk Rating NO 4 NO 3 NO 3 NO 3
Debtors more than 90 days past due account for more than 5% of total debtor balances
Potential for payment / debtor collection concerns
% of Debtors more than 90 days past due account NO 1.04% NO 2.06% NO 2.19% NO 3.13%
Creditors more than 90 days past due account for more than 5% of total creditor balances
Potential for build up in creditors, resulting in future liquidity concerns
% of Creditors more than 90 days past due account NO 0.00% NO 0.00% NO 0.00% NO 0.00%
Capital expenditure is less than 75% of plan for the year to date Capital expenditure plans are delayed to conserve cash Capital expenditure variance to plan NO 81.44% NO 88.36% NO 85.91% NO 84.41%
Quarter end cash balance less than 10 days of operating expenses Potential liquidity concerns and ability to meet liabilities as they fall due Liquidity days at period end NO 55.61 NO 62.39 NO 62.44 NO 55.30
Working capital facility (WCF) agreement includes default clause. This will require all trusts to review their WCF agreements.
Risk that WCF, whilst included in calculation of liquidity days for the purpose of FRR, may not be available if and when required (eg: FRR 1 or 2). Review of WCF NO NO NO NO NO NO NO NO
Interim Finance Director in place over more than one quarter end Absence of permanent / substantive appointment to key position NO NO NO NO NO NO NO NO
Two or more changes in Finance Director in a twelve month period Multiple changes in a short period of lead financial officer NO NO NO NO NO NO NO NO
Notes / Explanations
29/02/2012 31/03/2012
Please note the Capital Expenditre indicator is calculated using the total capital expense which includes the University of Exeter's element of expense for the RILD build.
31/12/2011 31/01/2012 APPE
NDIX 9

Title of Paper: Integrated Performance Report Board Date: Wednesday 25 th April 2012 Page 32 of 34
Data Appendices – Quality
Green
Trust Process ‐ Pressure Sores Assessment Process ‐ MUST, MST, STAMP Score Process ‐ Hand Hygiene
General (Green)
Outcome ‐ MUST Score
Green
Red
Green
Outcome ‐ Pressure Sores Outcome ‐ New MRSA Isolates Identified > 72 Hours After Admission
Initial (Red)
Threshold ‐ 95% Threshold ‐ 85%
Threshold ‐ 0.8% Threshold ‐ 0 cases
0
10
20
30
40
50
60
70
80
90
100
Mar‐11 May‐11 Jul‐11 Sep‐11 Nov‐11 Jan‐12 Mar‐12
0
20
40
60
80
100
120
Mar‐11 May‐11 Jul‐11 Sep‐11 Nov‐11 Jan‐12 Mar‐12
Initial compliance with MUST Screening on Admission
General compliance with MUST Screening at Weekly Review
0
10
20
30
40
50
60
70
80
90
100
Mar‐11 May‐11 Jul‐11 Sep‐11 Nov‐11 Jan‐12 Mar‐12
0%
5%
10%
15%
20%
25%
30%
Mar‐11 May‐11 Jul‐11 Sep‐11 Nov‐11 Jan‐12 Mar‐12
0
1
2
3
4
5
Mar‐11 May‐11 Jul‐11 Sep‐11 Nov‐11 Jan‐12 Mar‐12
Average SPC +1sd
Indicator to be developed

Title of Paper: Integrated Performance Report Board Date: Wednesday 25 th April 2012 Page 33 of 34
Green Outcome ‐ C.Difficile Infections Identified > 72 Hours After Admission Outcome ‐ Inpatient Slips, Trips & Falls Outcome ‐ Cardiac Arrest Calls
Process ‐ Housekeeping & Equipment Cleaning Process ‐ Falls Risk Assessment Process ‐ EWS Calls Housekeeping (Green) Equipment (Green)
Trust
Threshold ‐ Housekeeping 90% Equipment 90% No Threshold
Green
Threshold ‐ 6 cases No Threshold No Threshold
0
5
10
15
20
25
Mar‐11 May‐11 Jul‐11 Sep‐11 Nov‐11 Jan‐12 Mar‐12
Actual Cases Trust Theshold
80
82
84
86
88
90
92
94
96
98
100
Mar‐11 May‐11 Jul‐11 Sep‐11 Nov‐11 Jan‐12 Mar‐12
Housekeeping Equipment
0%
10%
20%
30%
40%
50%
60%
70%
80%
90%
100%
Nov‐11 Dec‐11 Jan‐12 Feb‐12 Mar‐12
0
5
10
15
20
25
30
35
40
45
50
Mar‐11 May‐11 Jul‐11 Sep‐11 Nov‐11 Jan‐12 Mar‐12
0
20
40
60
80
100
120
140
160
180
200
Mar‐11 May‐11 Jul‐11 Sep‐11 Nov‐11 Jan‐12 Mar‐12 0
5
10
15
20
25
Mar‐11 May‐11 Jul‐11 Sep‐11 Nov‐11 Jan‐12 Mar‐12

Title of Paper: Integrated Performance Report Board Date: Wednesday 25 th April 2012 Page 34 of 34
Outcome ‐ Thromboprophylaxis Audit Outcome ‐ Estimated Date of Discharge met Outcome ‐ Incidents & Complaints/Concerns
Process ‐ Bank & Agency WTE Staff Usage
Trust
No Threshold No Threshold
Green
Threshold ‐ 100% Threshold ‐ 40% No Threshold
Process ‐ Electronic VTE Risk Assessment Process ‐ Estimated Date of Discharge Red
0.0%
10.0%
20.0%
30.0%
40.0%
50.0%
60.0%
70.0%
80.0%
90.0%
100.0%
Oct‐11 Nov‐11 Dec‐11 Jan‐12 Feb‐12 Mar‐12
0
10
20
30
40
50
60
70
80
90
100
Mar‐11 May‐11 Jul‐11 Sep‐11 Nov‐11 Jan‐12 Mar‐12
0
20
40
60
80
100
120
Mar‐11 May‐11 Jul‐11 Sep‐11 Nov‐11 Jan‐12 Mar‐12
Bank Assigned Agency Assigned
Indicator to be developed
0%
10%
20%
30%
40%
50%
60%
70%
80%
90%
100%
Mar‐11 May‐11 Jul‐11 Sep‐11 Nov‐11 Jan‐12 Mar‐12
0
50
100
150
200
250
300
350
400
450
500
Mar‐11 May‐11 Jul‐11 Sep‐11 Nov‐11 Jan‐12 Mar‐12
Complaints/Concerns Incidents