Embed Size (px)
Citation preview
Microsoft TechDays 2007 - Lisboa 22/03/2007 4:49 PM
2007 Microsoft Corporation. All rights reserved.
This presentation is for informational purposes only. Microsoft makes no warranties, express or implied, in this summary. 1
DAT001
High Impact Data Warehousing with SQL Server Analysis Services
Grant [email protected] Manager, SQL Server Integration ServicesMicrosoft
Patrocinadores Agenda
Server architecture and UDM basics
Optimizing the cube design
Partitioning and Aggregations
Processing
Queries and calculations
Conclusion
Microsoft TechDays 2007 - Lisboa 22/03/2007 4:49 PM
2007 Microsoft Corporation. All rights reserved.
This presentation is for informational purposes only. Microsoft makes no warranties, express or implied, in this summary. 2
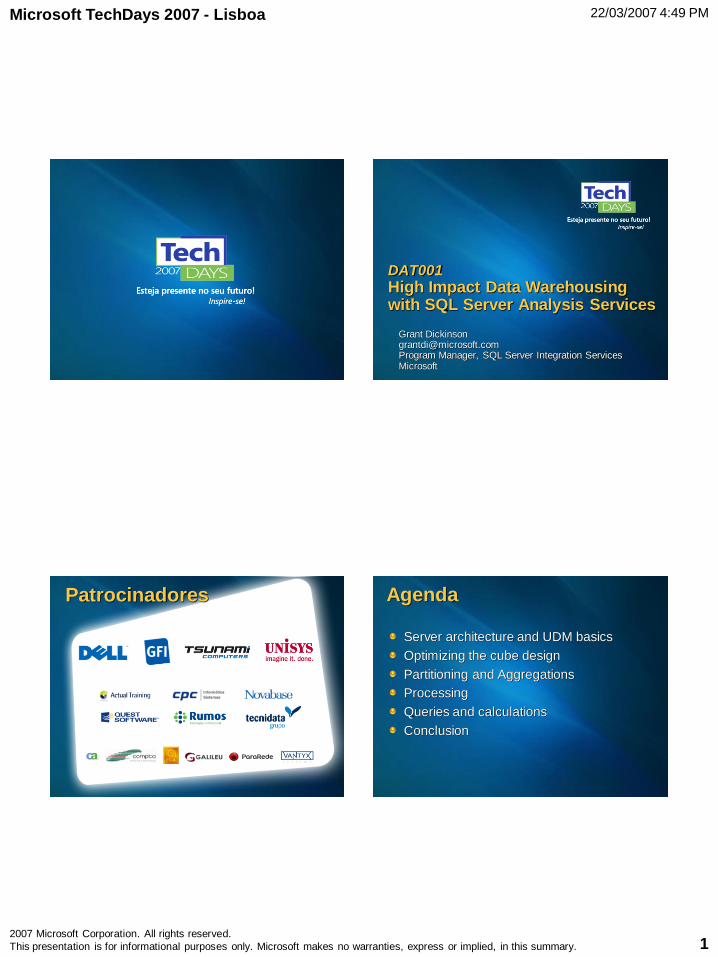
A DW architecture
Datawarehouse(SQL Server, Oracle,
DB2, Teradata)
SQL/OracleSAP/Dynamic
sLegacy Text XML
Integration Services
Reports Dashboard Scorecards Excel BI tools
Analysis Services (DAT001)
Clippy® for Business Intelligence!
Analysis
Server
OLEDB
ADOMD .NET
AMO IIS
TCP
HTTP
XMLA
ADOMD
Client Apps
BIDS
SSMS
Profiler
Excel
Client Server Architecture Dimension
An entity on which analysis is to be performed (e.g. Customers)
Consists of:
Attributes that describe the entity
Hierarchies that organize dimension members in meaningful ways
Customer
ID
First
Name
Last
Name
State City Marital
Status
Gender … Age
123 John Doe WA Seattle Married Male … 42
456 Lance Smith WA Redmond Unmarried Male … 34
789 Jill Thompson OR Portland Married Female … 21
Microsoft TechDays 2007 - Lisboa 22/03/2007 4:49 PM
2007 Microsoft Corporation. All rights reserved.
This presentation is for informational purposes only. Microsoft makes no warranties, express or implied, in this summary. 3
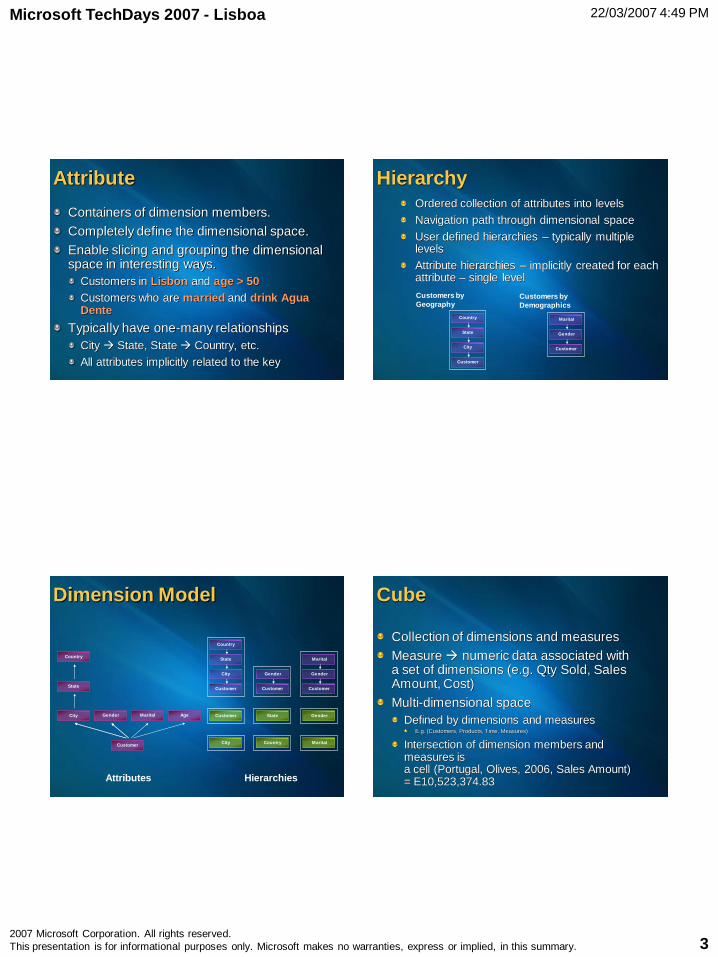
Attribute
Containers of dimension members.
Completely define the dimensional space.
Enable slicing and grouping the dimensional space in interesting ways.
Customers in Lisbon and age > 50
Customers who are married and drink Agua Dente
Typically have one-many relationships
City State, State Country, etc.
All attributes implicitly related to the key
Ordered collection of attributes into levels
Navigation path through dimensional space
User defined hierarchies – typically multiple levels
Attribute hierarchies – implicitly created for each attribute – single level
Hierarchy
Customers by
Geography
Country
State
City
Customer
Customers by
Demographics
Marital
Gender
Customer
Customer
City
State
Country
Gender Marital
Country
State
City
Customer
Gender
Customer
Marital
Gender
Customer
Customer
City
State
Country
Gender
Marital
Attributes Hierarchies
Age
Dimension Model Cube
Collection of dimensions and measures
Measure numeric data associated with a set of dimensions (e.g. Qty Sold, Sales Amount, Cost)
Multi-dimensional space
Defined by dimensions and measuresE.g. (Customers, Products, Time, Measures)
Intersection of dimension members and measures is a cell (Portugal, Olives, 2006, Sales Amount) = E10,523,374.83
Microsoft TechDays 2007 - Lisboa 22/03/2007 4:49 PM
2007 Microsoft Corporation. All rights reserved.
This presentation is for informational purposes only. Microsoft makes no warranties, express or implied, in this summary. 4
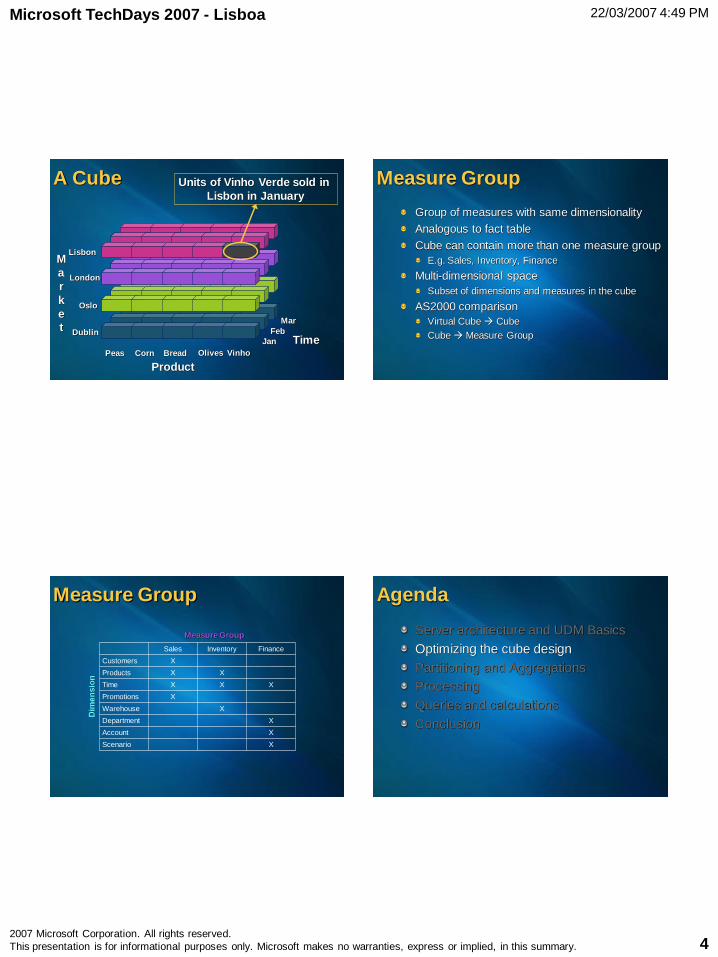
A Cube
Product
Peas Corn Bread Olives Vinho
M
a
r
k
et
Lisbon
London
Oslo
DublinJan
Mar
Feb
Time
Units of Vinho Verde sold in
Lisbon in January
Measure Group
Group of measures with same dimensionality
Analogous to fact table
Cube can contain more than one measure group
E.g. Sales, Inventory, Finance
Multi-dimensional space
Subset of dimensions and measures in the cube
AS2000 comparison
Virtual Cube Cube
Cube Measure Group
Sales Inventory Finance
Customers X
Products X X
Time X X X
Promotions X
Warehouse X
Department X
Account X
Scenario X
Measure Group
Measure Group Agenda
Server architecture and UDM Basics
Optimizing the cube design
Partitioning and Aggregations
Processing
Queries and calculations
Conclusion
Microsoft TechDays 2007 - Lisboa 22/03/2007 4:49 PM
2007 Microsoft Corporation. All rights reserved.
This presentation is for informational purposes only. Microsoft makes no warranties, express or implied, in this summary. 5
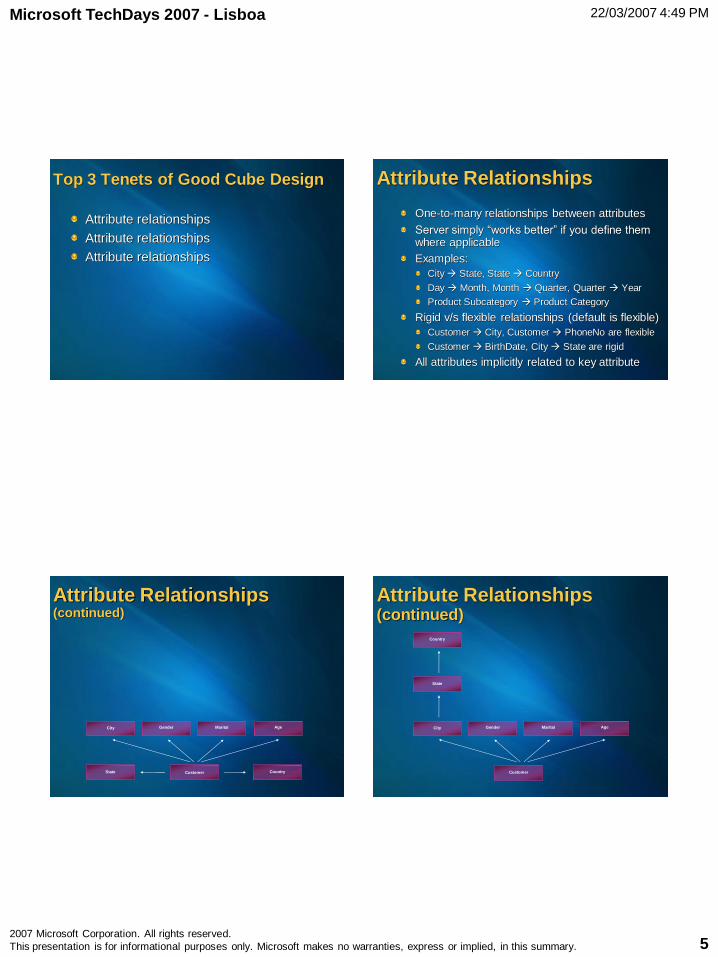
Top 3 Tenets of Good Cube Design
Attribute relationships
Attribute relationships
Attribute relationships
Attribute Relationships
One-to-many relationships between attributes
Server simply “works better” if you define them where applicable
Examples:
City State, State Country
Day Month, Month Quarter, Quarter Year
Product Subcategory Product Category
Rigid v/s flexible relationships (default is flexible)
Customer City, Customer PhoneNo are flexible
Customer BirthDate, City State are rigid
All attributes implicitly related to key attribute
Customer
City
State Country
Gender Marital Age
Attribute Relationships (continued)
Customer
City
State
Country
Gender Marital Age
Attribute Relationships (continued)
Microsoft TechDays 2007 - Lisboa 22/03/2007 4:49 PM
2007 Microsoft Corporation. All rights reserved.
This presentation is for informational purposes only. Microsoft makes no warranties, express or implied, in this summary. 6
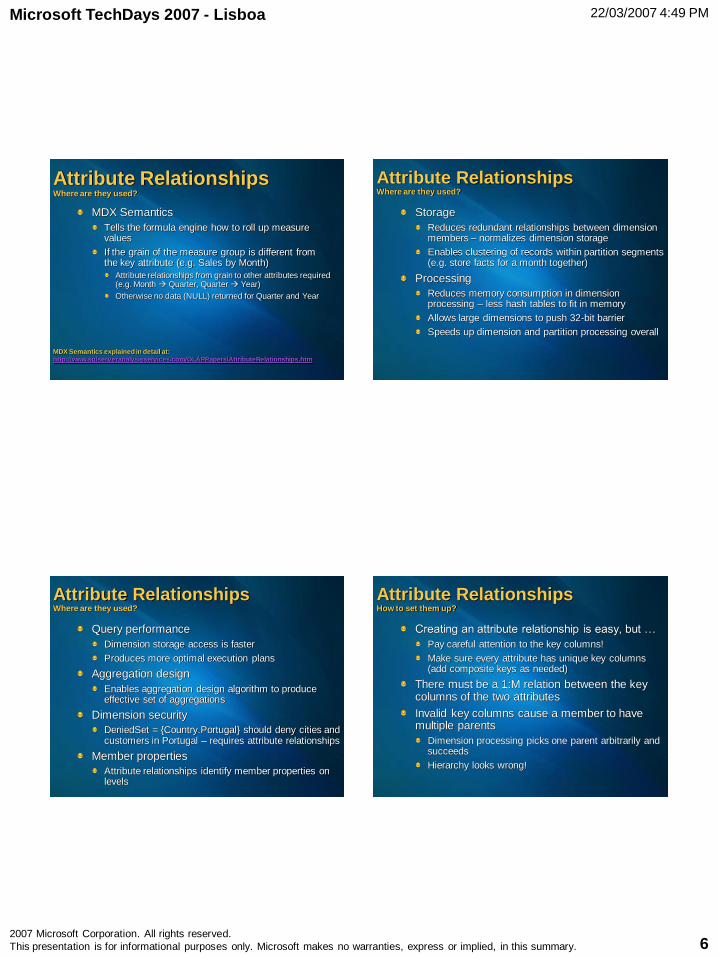
Attribute Relationships Where are they used?
MDX Semantics
Tells the formula engine how to roll up measure values
If the grain of the measure group is different from the key attribute (e.g. Sales by Month)
Attribute relationships from grain to other attributes required (e.g. Month Quarter, Quarter Year)
Otherwise no data (NULL) returned for Quarter and Year
MDX Semantics explained in detail at:http://www.sqlserveranalysisservices.com/OLAPPapers/AttributeRelationships.htm
Attribute RelationshipsWhere are they used?
Storage
Reduces redundant relationships between dimension members – normalizes dimension storage
Enables clustering of records within partition segments (e.g. store facts for a month together)
Processing
Reduces memory consumption in dimension processing – less hash tables to fit in memory
Allows large dimensions to push 32-bit barrier
Speeds up dimension and partition processing overall
Attribute RelationshipsWhere are they used?
Query performance
Dimension storage access is faster
Produces more optimal execution plans
Aggregation design
Enables aggregation design algorithm to produce effective set of aggregations
Dimension security
DeniedSet = {Country.Portugal} should deny cities and customers in Portugal – requires attribute relationships
Member properties
Attribute relationships identify member properties on levels
Attribute RelationshipsHow to set them up?
Creating an attribute relationship is easy, but …
Pay careful attention to the key columns!
Make sure every attribute has unique key columns (add composite keys as needed)
There must be a 1:M relation between the key columns of the two attributes
Invalid key columns cause a member to have multiple parents
Dimension processing picks one parent arbitrarily and succeeds
Hierarchy looks wrong!
Microsoft TechDays 2007 - Lisboa 22/03/2007 4:49 PM
2007 Microsoft Corporation. All rights reserved.
This presentation is for informational purposes only. Microsoft makes no warranties, express or implied, in this summary. 7
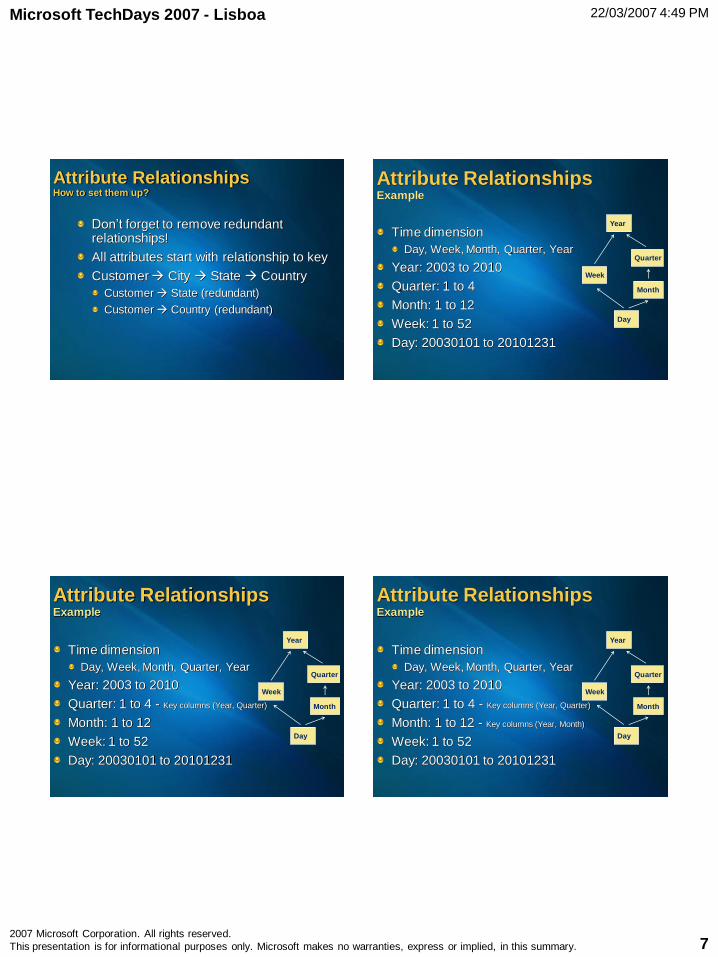
Attribute RelationshipsHow to set them up?
Don’t forget to remove redundant relationships!
All attributes start with relationship to key
Customer City State Country
Customer State (redundant)
Customer Country (redundant)
Attribute RelationshipsExample
Time dimension
Day, Week, Month, Quarter, Year
Year: 2003 to 2010
Quarter: 1 to 4
Month: 1 to 12
Week: 1 to 52
Day: 20030101 to 20101231
Day
Week
Month
Quarter
Year
Attribute RelationshipsExample
Time dimension
Day, Week, Month, Quarter, Year
Year: 2003 to 2010
Quarter: 1 to 4 - Key columns (Year, Quarter)
Month: 1 to 12
Week: 1 to 52
Day: 20030101 to 20101231
Day
Week
Month
Quarter
Year
Time dimension
Day, Week, Month, Quarter, Year
Year: 2003 to 2010
Quarter: 1 to 4 - Key columns (Year, Quarter)
Month: 1 to 12 - Key columns (Year, Month)
Week: 1 to 52
Day: 20030101 to 20101231
Day
Week
Month
Quarter
Year
Attribute RelationshipsExample
Microsoft TechDays 2007 - Lisboa 22/03/2007 4:49 PM
2007 Microsoft Corporation. All rights reserved.
This presentation is for informational purposes only. Microsoft makes no warranties, express or implied, in this summary. 8
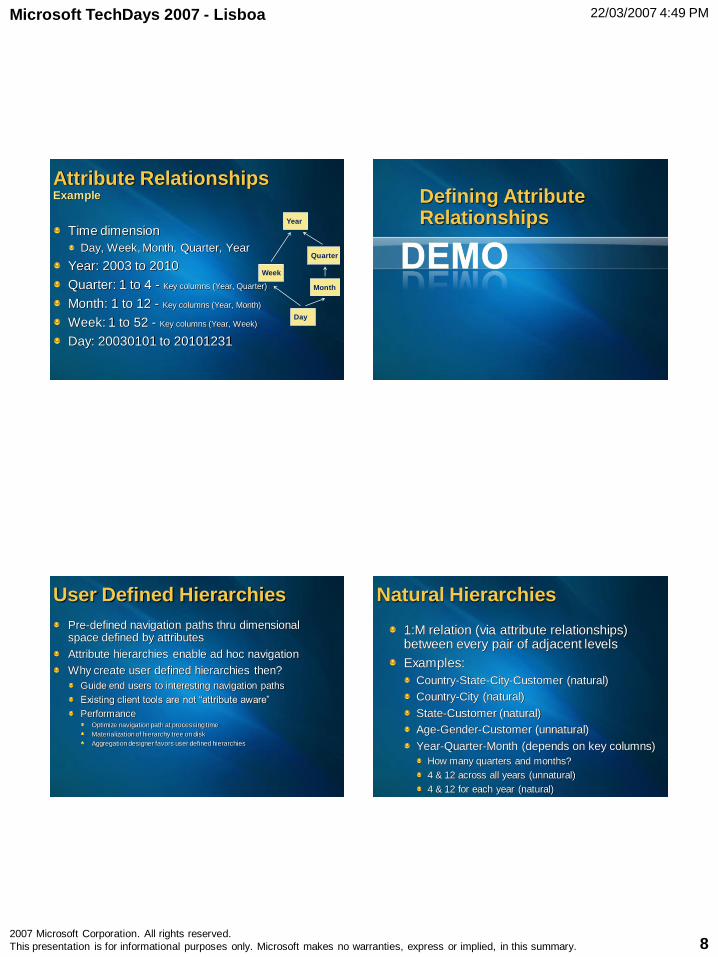
Time dimension
Day, Week, Month, Quarter, Year
Year: 2003 to 2010
Quarter: 1 to 4 - Key columns (Year, Quarter)
Month: 1 to 12 - Key columns (Year, Month)
Week: 1 to 52 - Key columns (Year, Week)
Day: 20030101 to 20101231
Day
Week
Month
Quarter
Year
Attribute RelationshipsExample Defining Attribute
Relationships
User Defined Hierarchies
Pre-defined navigation paths thru dimensional space defined by attributes
Attribute hierarchies enable ad hoc navigation
Why create user defined hierarchies then?
Guide end users to interesting navigation paths
Existing client tools are not “attribute aware”
PerformanceOptimize navigation path at processing time
Materialization of hierarchy tree on disk
Aggregation designer favors user defined hierarchies
Natural Hierarchies
1:M relation (via attribute relationships) between every pair of adjacent levels
Examples:
Country-State-City-Customer (natural)
Country-City (natural)
State-Customer (natural)
Age-Gender-Customer (unnatural)
Year-Quarter-Month (depends on key columns)
How many quarters and months?
4 & 12 across all years (unnatural)
4 & 12 for each year (natural)
Microsoft TechDays 2007 - Lisboa 22/03/2007 4:49 PM
2007 Microsoft Corporation. All rights reserved.
This presentation is for informational purposes only. Microsoft makes no warranties, express or implied, in this summary. 9
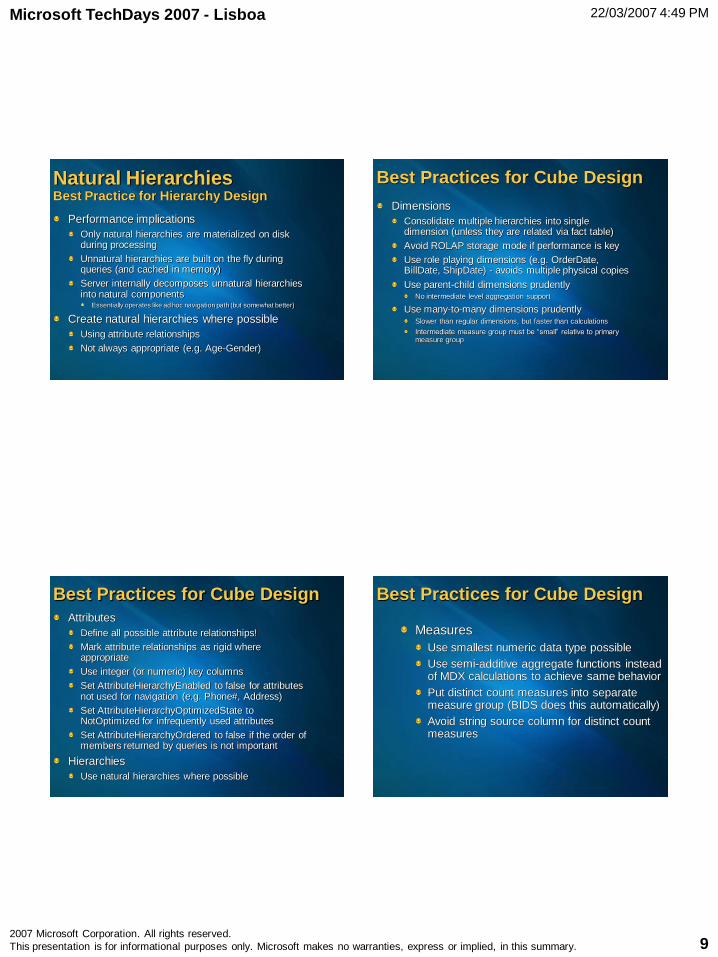
Natural Hierarchies Best Practice for Hierarchy Design
Performance implications
Only natural hierarchies are materialized on disk during processing
Unnatural hierarchies are built on the fly during queries (and cached in memory)
Server internally decomposes unnatural hierarchies into natural components
Essentially operates like ad hoc navigation path (but somewhat better)
Create natural hierarchies where possible
Using attribute relationships
Not always appropriate (e.g. Age-Gender)
Best Practices for Cube Design
Dimensions
Consolidate multiple hierarchies into single dimension (unless they are related via fact table)
Avoid ROLAP storage mode if performance is key
Use role playing dimensions (e.g. OrderDate, BillDate, ShipDate) - avoids multiple physical copies
Use parent-child dimensions prudentlyNo intermediate level aggregation support
Use many-to-many dimensions prudentlySlower than regular dimensions, but faster than calculations
Intermediate measure group must be “small” relative to primary measure group
Best Practices for Cube Design
Attributes
Define all possible attribute relationships!
Mark attribute relationships as rigid where appropriate
Use integer (or numeric) key columns
Set AttributeHierarchyEnabled to false for attributes not used for navigation (e.g. Phone#, Address)
Set AttributeHierarchyOptimizedState to NotOptimized for infrequently used attributes
Set AttributeHierarchyOrdered to false if the order of members returned by queries is not important
Hierarchies
Use natural hierarchies where possible
Best Practices for Cube Design
Measures
Use smallest numeric data type possible
Use semi-additive aggregate functions instead of MDX calculations to achieve same behavior
Put distinct count measures into separate measure group (BIDS does this automatically)
Avoid string source column for distinct count measures
Microsoft TechDays 2007 - Lisboa 22/03/2007 4:49 PM
2007 Microsoft Corporation. All rights reserved.
This presentation is for informational purposes only. Microsoft makes no warranties, express or implied, in this summary. 10
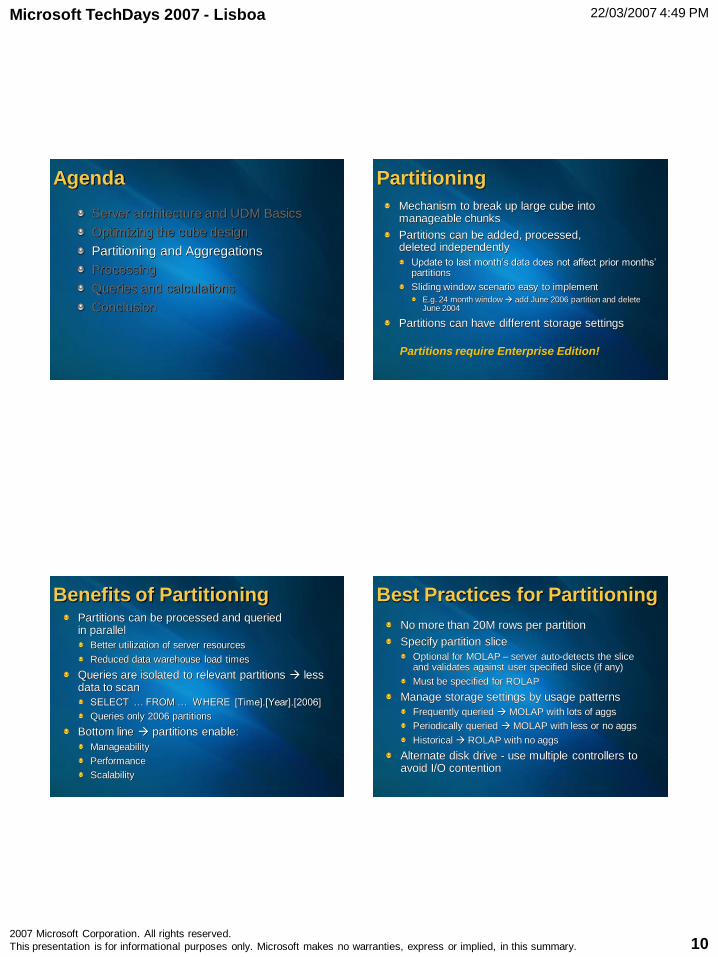
Agenda
Server architecture and UDM Basics
Optimizing the cube design
Partitioning and Aggregations
Processing
Queries and calculations
Conclusion
Partitioning
Mechanism to break up large cube into manageable chunks
Partitions can be added, processed, deleted independently
Update to last month’s data does not affect prior months’ partitions
Sliding window scenario easy to implement
E.g. 24 month window add June 2006 partition and delete June 2004
Partitions can have different storage settings
Partitions require Enterprise Edition!
Benefits of PartitioningPartitions can be processed and queried in parallel
Better utilization of server resources
Reduced data warehouse load times
Queries are isolated to relevant partitions less data to scan
SELECT … FROM … WHERE [Time].[Year].[2006]
Queries only 2006 partitions
Bottom line partitions enable:
Manageability
Performance
Scalability
Best Practices for Partitioning
No more than 20M rows per partition
Specify partition slice
Optional for MOLAP – server auto-detects the slice and validates against user specified slice (if any)
Must be specified for ROLAP
Manage storage settings by usage patterns
Frequently queried MOLAP with lots of aggs
Periodically queried MOLAP with less or no aggs
Historical ROLAP with no aggs
Alternate disk drive - use multiple controllers to avoid I/O contention
Microsoft TechDays 2007 - Lisboa 22/03/2007 4:49 PM
2007 Microsoft Corporation. All rights reserved.
This presentation is for informational purposes only. Microsoft makes no warranties, express or implied, in this summary. 11
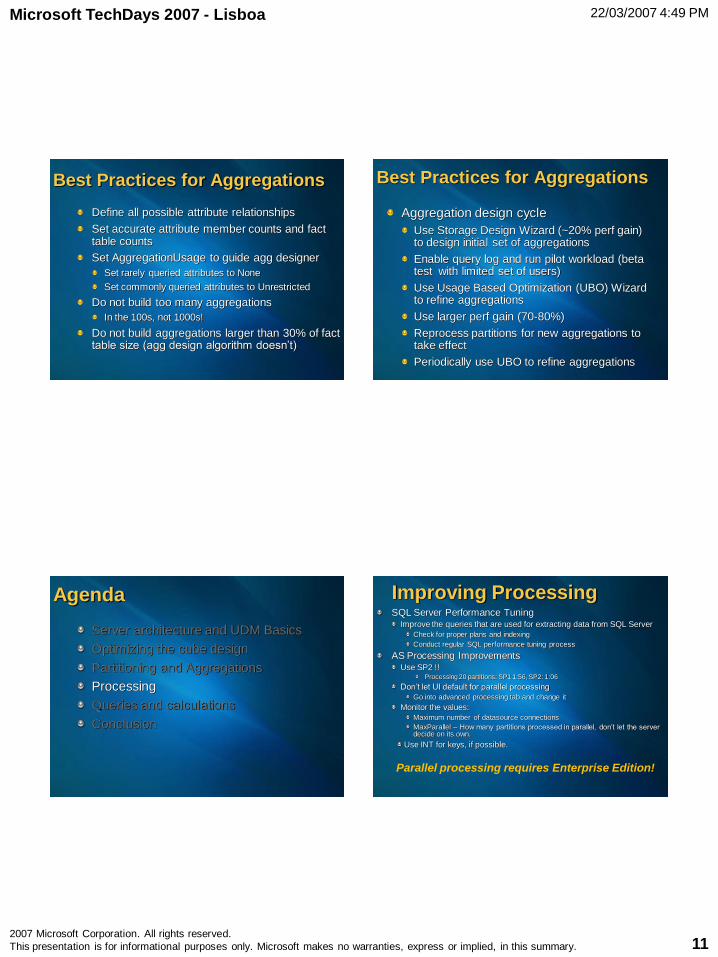
Best Practices for Aggregations
Define all possible attribute relationships
Set accurate attribute member counts and fact table counts
Set AggregationUsage to guide agg designer
Set rarely queried attributes to None
Set commonly queried attributes to Unrestricted
Do not build too many aggregations
In the 100s, not 1000s!
Do not build aggregations larger than 30% of fact table size (agg design algorithm doesn’t)
Best Practices for Aggregations
Aggregation design cycle
Use Storage Design Wizard (~20% perf gain) to design initial set of aggregations
Enable query log and run pilot workload (beta test with limited set of users)
Use Usage Based Optimization (UBO) Wizard to refine aggregations
Use larger perf gain (70-80%)
Reprocess partitions for new aggregations to take effect
Periodically use UBO to refine aggregations
Agenda
Server architecture and UDM Basics
Optimizing the cube design
Partitioning and Aggregations
Processing
Queries and calculations
Conclusion
Improving ProcessingSQL Server Performance Tuning
Improve the queries that are used for extracting data from SQL Server
Check for proper plans and indexing
Conduct regular SQL performance tuning process
AS Processing ImprovementsUse SP2 !!
Processing 20 partitions: SP1 1:56, SP2: 1:06
Don’t let UI default for parallel processing
Go into advanced processing tab and change it
Monitor the values:
Maximum number of datasource connections
MaxParallel – How many partitions processed in parallel, don’t let the server decide on its own.
Use INT for keys, if possible.
Parallel processing requires Enterprise Edition!
Microsoft TechDays 2007 - Lisboa 22/03/2007 4:49 PM
2007 Microsoft Corporation. All rights reserved.
This presentation is for informational purposes only. Microsoft makes no warranties, express or implied, in this summary. 12
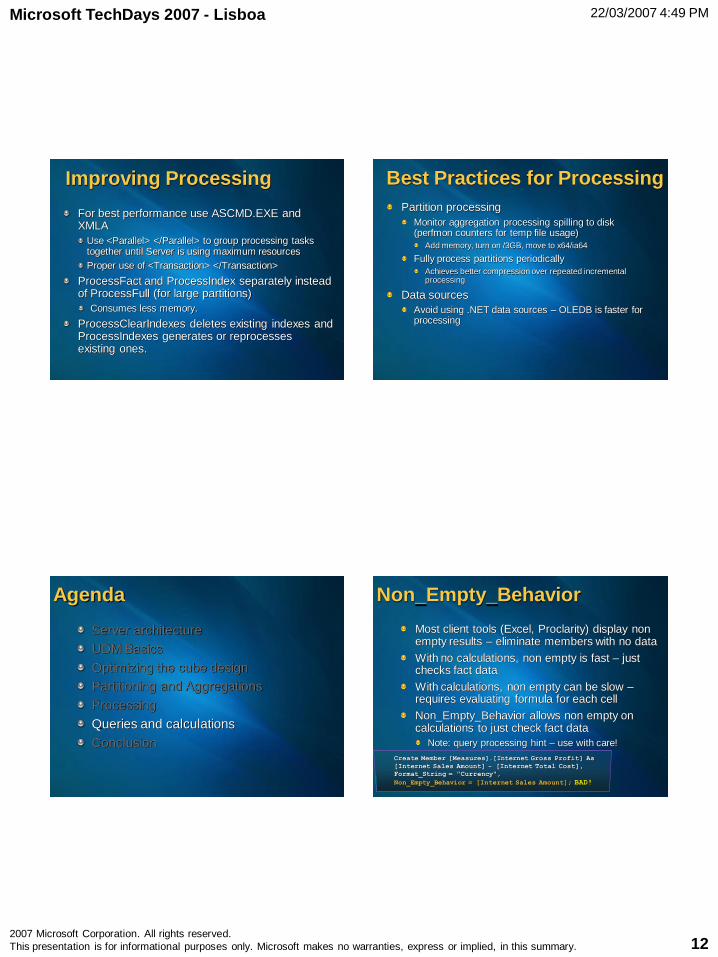
Improving Processing
For best performance use ASCMD.EXE and XMLA
Use <Parallel> </Parallel> to group processing tasks together until Server is using maximum resources
Proper use of <Transaction> </Transaction>
ProcessFact and ProcessIndex separately instead of ProcessFull (for large partitions)
Consumes less memory.
ProcessClearIndexes deletes existing indexes and ProcessIndexes generates or reprocesses existing ones.
Best Practices for Processing
Partition processing
Monitor aggregation processing spilling to disk (perfmon counters for temp file usage)
Add memory, turn on /3GB, move to x64/ia64
Fully process partitions periodically
Achieves better compression over repeated incremental processing
Data sources
Avoid using .NET data sources – OLEDB is faster for processing
Agenda
Server architecture
UDM Basics
Optimizing the cube design
Partitioning and Aggregations
Processing
Queries and calculations
Conclusion
Non_Empty_Behavior
Most client tools (Excel, Proclarity) display non empty results – eliminate members with no data
With no calculations, non empty is fast – just checks fact data
With calculations, non empty can be slow –requires evaluating formula for each cell
Non_Empty_Behavior allows non empty on calculations to just check fact data
Note: query processing hint – use with care!
Create Member [Measures].[Internet Gross Profit] As
[Internet Sales Amount] - [Internet Total Cost],
Format_String = "Currency",
Non_Empty_Behavior = [Internet Sales Amount]; BAD!
Microsoft TechDays 2007 - Lisboa 22/03/2007 4:49 PM
2007 Microsoft Corporation. All rights reserved.
This presentation is for informational purposes only. Microsoft makes no warranties, express or implied, in this summary. 13
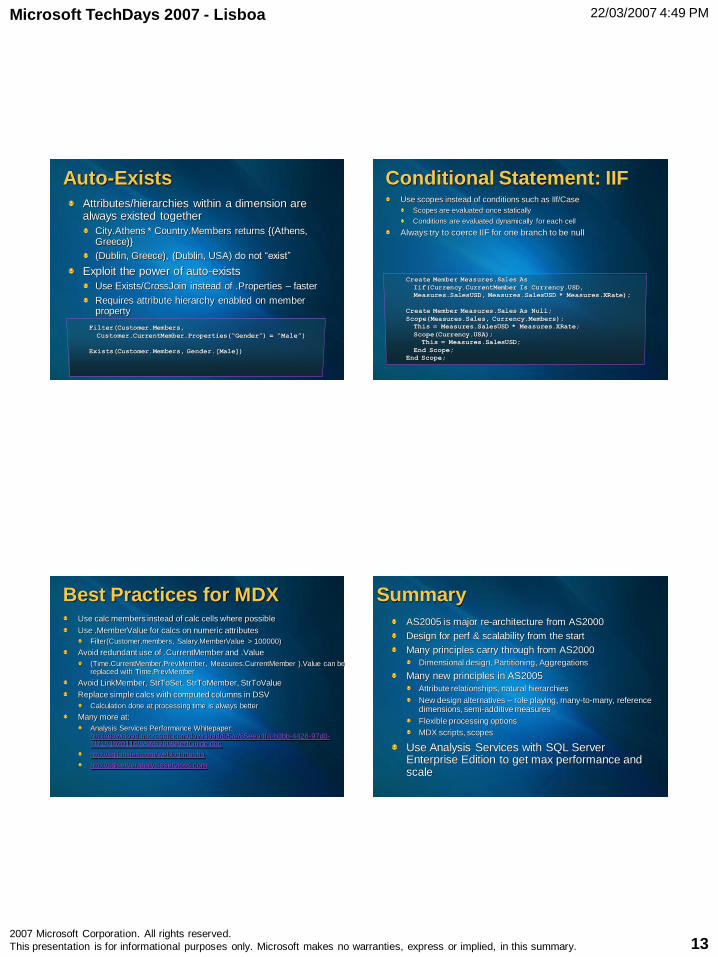
Auto-ExistsAttributes/hierarchies within a dimension are always existed together
City.Athens * Country.Members returns {(Athens, Greece)}
(Dublin, Greece), (Dublin, USA) do not “exist”
Exploit the power of auto-exists
Use Exists/CrossJoin instead of .Properties – faster
Requires attribute hierarchy enabled on member property
Filter(Customer.Members,
Customer.CurrentMember.Properties(“Gender”) = “Male”)
Exists(Customer.Members, Gender.[Male])
Conditional Statement: IIFUse scopes instead of conditions such as IIf/Case
Scopes are evaluated once statically
Conditions are evaluated dynamically for each cell
Always try to coerce IIF for one branch to be null
Create Member Measures.Sales As
Iif(Currency.CurrentMember Is Currency.USD,
Measures.SalesUSD, Measures.SalesUSD * Measures.XRate);
Create Member Measures.Sales As Null;
Scope(Measures.Sales, Currency.Members);
This = Measures.SalesUSD * Measures.XRate;
Scope(Currency.USA);
This = Measures.SalesUSD;
End Scope;
End Scope;
Best Practices for MDXUse calc members instead of calc cells where possible
Use .MemberValue for calcs on numeric attributes
Filter(Customer.members, Salary.MemberValue > 100000)
Avoid redundant use of .CurrentMember and .Value
(Time.CurrentMember.PrevMember, Measures.CurrentMember ).Value can be replaced with Time.PrevMember
Avoid LinkMember, StrToSet, StrToMember, StrToValue
Replace simple calcs with computed columns in DSV
Calculation done at processing time is always better
Many more at:
Analysis Services Performance Whitepaper: http://download.microsoft.com/download/8/5/e/85eea4fa-b3bb-4426-97d0-7f7151b2011c/SSAS2005PerfGuide.doc
http://sqljunkies.com/weblog/mosha
http://sqlserveranalysisservices.com
Summary
AS2005 is major re-architecture from AS2000
Design for perf & scalability from the start
Many principles carry through from AS2000
Dimensional design, Partitioning, Aggregations
Many new principles in AS2005
Attribute relationships, natural hierarchies
New design alternatives – role playing, many-to-many, reference dimensions, semi-additive measures
Flexible processing options
MDX scripts, scopes
Use Analysis Services with SQL Server Enterprise Edition to get max performance and scale
Microsoft TechDays 2007 - Lisboa 22/03/2007 4:49 PM
2007 Microsoft Corporation. All rights reserved.
This presentation is for informational purposes only. Microsoft makes no warranties, express or implied, in this summary. 14
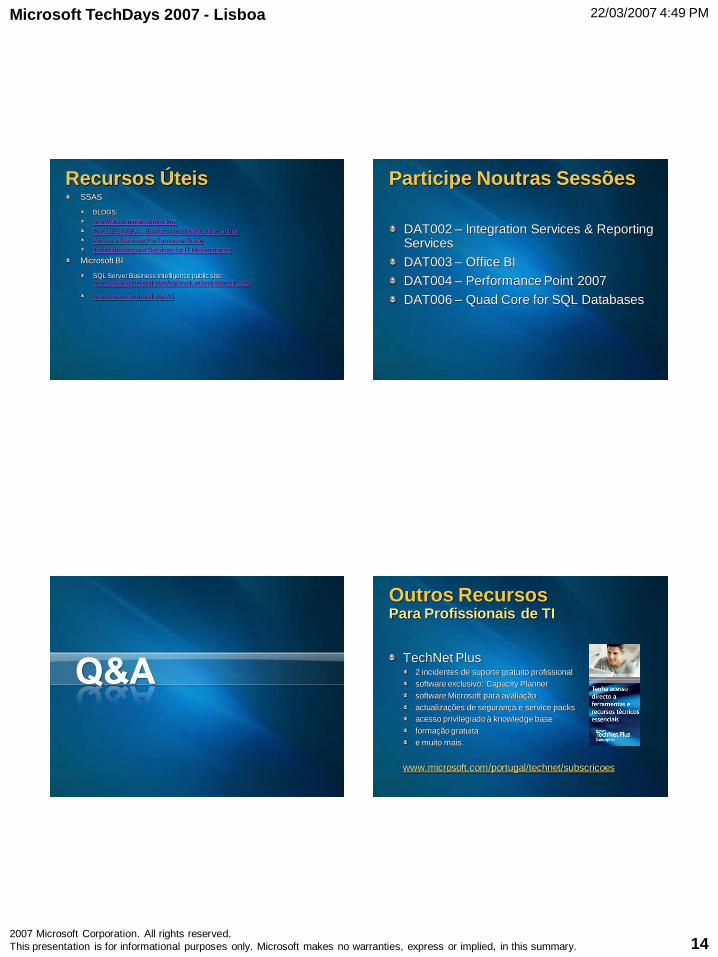
Recursos ÚteisSSAS
BLOGS:
http://blogs.msdn.com/sqlcat
PROJECT REAL-Business Intelligence in Practice
Analysis Services Performance Guide
TechNet: Analysis Services for IT Professionals
Microsoft BI
SQL Server Business Intelligence public site: http://www.microsoft.com/sql/evaluation/bi/default.asp
http://www.microsoft.com/bi
Participe Noutras Sessões
DAT002 – Integration Services & Reporting Services
DAT003 – Office BI
DAT004 – Performance Point 2007
DAT006 – Quad Core for SQL Databases
Outros RecursosPara Profissionais de TI
TechNet Plus2 incidentes de suporte gratuito profissional
software exclusivo: Capacity Planner
software Microsoft para avaliação
actualizações de segurança e service packs
acesso privilegiado à knowledge base
formação gratuita
e muito mais.
www.microsoft.com/portugal/technet/subscricoes
Microsoft TechDays 2007 - Lisboa 22/03/2007 4:49 PM
2007 Microsoft Corporation. All rights reserved.
This presentation is for informational purposes only. Microsoft makes no warranties, express or implied, in this summary. 15
Questionário de AvaliaçãoPassatempo!
Complete o questionário de avaliação e devolva-o no balcão da recepção.
Habilite-se a ganhar uma Xbox 360 por dia!
DAT001High Impact Data Warehousing with SQL Server Analysis Services
© 2007 Microsoft Corporation. All rights reserved.This presentation is for informational purposes only. Microsoft makes no warranties, express or implied, in this summary.