Embed Size (px)
Citation preview
DSEE 2010/13
Examiner: Torsten FRANSSON
Supervisor: Amir VADEIE
FACULTY OF ENGINEERING AND SUSTAINABLE DEVELOPMENT
TITLE OF THE THESIS
The Role Renewable Energies in Energy Supply and Management
for Sustainable Development “Case of Rwanda”
The Authors: John RUTAGENGWA
09, 2013
Master’s Thesis in Sustainable Power generation
DSEE 2010/13
Examiner: Torsten FRANSSON
Supervisor: Amir VADEIE
I. ABSTRACT
This report provides an overview of the main results from the scenarios analysed in the
Rwanda energy policy strategy, planning and prospective energy initiatives and alternatives
(Hydropower, Biomass, Solar, Methane, Peat, etc.) as well as other Government Development
Frameworks meant for poverty reduction strategies and economic development. Under this
context, the report attempts to assess the role of renewable energies in general and in
particular micro hydropower in solving Rwanda energy supply and management issues for
sustainable development. The main conclusion is that renewable energies (micro hydropower)
substantially contribute to reducing greenhouse gas emissions and improving diversification of
the energy production and supply into the national grid as well as independent off-grid
systems particularly in rural based areas that are far from the grid. This becomes even more
significant and relevant when considering that electricity access in the country stands at about
14% leaving about 86% of the population especially in rural areas without power supply.
Although other technologies are still used to meet urgent and pressing power demand,
Renewable energy sources are well placed in offering medium and long term solution in a
sustainable manner.
To this effect therefore, the report has tried to outline the impacts, costs and benefits of
ambitious renewable energy targets for Rwanda in the medium and long term perspectives.
DSEE 2010/13
Examiner: Torsten FRANSSON
Supervisor: Amir VADEIE
II. PREFACE
Many people around the world live in areas where the water streams and Rivers are potential
sources of energy supply for lighting, communication and processing industries (small and big).
This has proven to be a very valuable natural resource, which can be exploited even at lower
levels through building of small hydro power schemes that can go as low as few kilowatts to
assist communities.
Unfortunately, no two hydro plants are ever exactly similar. However, scheming and
constructing them requires a wide analysis and skills with design experience. A further obstacle
to widespread implementation has been the scarcity of both designers and local manufacturers
of equipments. This has been largely due to unfamiliarity with the technology, and the absence
of the infrastructural support.
Intermediate Technology (the simplest technology, “micro hydropower” that can be afforded and
handled by rural villagers e.g. Peru) has thought to relieve this situation over recent years by
developing comprehensive guidelines which are presented here in this project. It is hoped that
this guidance will encourage familiarity with the technology and will assist manufacturers to
develop their markets and assuming an increase of activities for the local design consultants in
Rwanda.
Finally, the financial analysis and proposed project structure will help introduce renewable
energy sources and in particular micro hydropower potentials more firmly into routine rural
development planning and improved energy supply management.
This project serves as an input to the energy debate of the government of Rwanda at the
moment when very important decisions that may influence the use of Renewable energy for
socio-economic development through energy supply security in the country that is sustainable,
reliable and cost effective. It seeks to scientifically and technologically explore the way forward
for a Sustainable future system design.
DSEE 2010/13
Examiner: Torsten FRANSSON
Supervisor: Amir VADEIE
III. ACKNOWLEDGEMENT
The formation of this paper document was a consultative process encompassing members of
staff from MININFRA, EWSA, RURA and other stakeholders in the country, experts, private
sectors and civil society who offered very valuable inputs.
I would like to pay special acknowledgment to the administration at Royal Institute of
Technology (KTH) (coordinators, lecturers and Assistants) for their inspiration, strategic
guidance and leadership that paved the way in one or the other for the successful establishment
of this paper.
I also wish to recognise inputs from different people that contributed much to the content of this
project. I’m appreciative to the affiliated University’s administration (coordinators, facilitators),
gratefully my local supervisor, PhD Albert BUTARE and colleagues for the roles and guidelines
played to facilitate the establishment of this paper.
DSEE 2010/13
Examiner: Torsten FRANSSON
Supervisor: Amir VADEIE
IV. TABLE OF CONTENTS
I. ABSTRACT ......................................................................................................................................................... ii
II. PREFACE .......................................................................................................................................................... iii
III. ACKNOWLEDGEMENT .............................................................................................................................. iv
IV. TABLE OF CONTENTS ................................................................................................................................ v
V. LIST OF FIGURES .......................................................................................................................................... vii
VII. ACRONYMES ............................................................................................................................................... ix
1. BACKGROUND AND INTRODUCTION ........................................................................................................ 1
1.1. Introduction ................................................................................................................................................. 1
1.2. Country Background .................................................................................................................................. 2
2. OBJECTIVES AND GOALS ............................................................................................................................. 5
3. RESEARCH METHODOLOGY ....................................................................................................................... 6
3.1. Rwanda Energy Sector Overview ........................................................................................................... 8
3.1.1. Present Situation ................................................................................................................................ 8
3.1.2. Rwanda Strategic energy Plan ...................................................................................................... 23
4. PICO AND MICRO HYDROPOWER IN RWANDA .................................................................................... 26
4.1. Off-Grid Electrification ............................................................................................................................. 27
4.1.1. Why use Pico and micro hydropower potentials of energy. ...................................................... 28
5. SITES RECONNAISANCE/ PRE-LIMINARY INVESTIGATION. “CASE OF Nyaruguru &
NYAMAGABE DISTRICTS”: .................................................................................................................................. 29
5.1. Districts Background ............................................................................................................................... 29
5.1.1. NYARUGURU DISTRICT ............................................................................................................... 29
5.1.2. NYAMGABE DSITRICT .................................................................................................................. 30
5.2. Sites Studies procedures ........................................................................................................................ 32
5.3. Pre- Feasibility Studies procedures ...................................................................................................... 32
5.3.1. Hydrological analysis ....................................................................................................................... 34
5.3.2. Environmental impact assessment ............................................................................................... 35
5.3.3. Flow/Discharge measurement; ...................................................................................................... 38
5.3.4. Micro hydropower technical review ............................................................................................... 40
6.2. Social Economic Benefit Analysis ......................................................................................................... 46
6.2.1. Benefits to the community .............................................................................................................. 48
DSEE 2010/13
Examiner: Torsten FRANSSON
Supervisor: Amir VADEIE
6.3. Financial Analysis .................................................................................................................................... 48
7. CONCLUSION & RECOMMENDATION ...................................................................................................... 51
8. REFERENCES: ................................................................................................................................................ 52
9. APPENDICES: ................................................................................................................................................. 54
DSEE 2010/13
Examiner: Torsten FRANSSON
Supervisor: Amir VADEIE
V. LIST OF FIGURES
Figure 1: Rwanda atlas, 2010 [10] .......................................................................................................................... 3
Figure 2: GDP growth of Rwanda [9] ...................................................................................................................... 4
Figure 3: Energy balance of Rwanda, 2011 [12] .................................................................................................. 9
Figure 4: Annual per capita electricity consumption in the east & central Africa countries, 2010
KW/Person [12] ........................................................................................................................................................ 10
Figure 5: Number of electricity consumers connected in Rwanda, 2000-2010 [10 &12] .............................. 12
Figure 6: Electricity capacity demand forecasts for 2011-2017, MW [1] ......................................................... 14
Figure 7: Comparative data on electricity consumption in region [10] ............................................................. 15
Figure 8: Human development index and Energy Consumption [10] .............................................................. 15
Figure 9: Cost per kilowatt hour of electricity with respect to the energy source ........................................... 17
Figure 10: Deforestation (trees cut for charcoal) in Nyaruguru district ............................................................ 27
Figure 11: Umunywanzuki hydropower stream upstream. ................................................................................ 34
Figure 12: Investigation survey pictures ............................................................................................................... 35
Figure 13: Monthly minimum, maximum and average temperatures for Nyaruguru weather station (1700
m a. s. l.) [19]. ........................................................................................................................................................... 36
Figure 14: the average Precipitation during year for Ruhengeri a neighbor to Nyamagabe district weather
station [20]. ............................................................................................................................................................... 37
Figure 15: Comparison between rainy, dry and average years for Rubengera weather station to a close
Nyamagabe district [20 & 22]. ................................................................................................................................ 37
Figure 16: Flow measurement sections ............................................................................................................... 40
Figure 17: Run-of-River Micro hydropower scheme........................................................................................... 41
6. Figure 18: head is the difference between forebay position and tailrace of the scheme [13]. ............. 42
Figure 19: General Losses through hydropower scheme (Source: micro hydro manual design) ............... 44
Figure 20: Turbine application chart [24] .............................................................................................................. 46
DSEE 2010/13
Examiner: Torsten FRANSSON
Supervisor: Amir VADEIE
VI. LIST OF TABLES
Table 1: The summarised research methods based on theories and research tools ................................... 7
Table 2: Current and planned electricity generation capacity in Rwanda [8] ................................................. 11
Table 3: Roles and Responsibilities of energy sector stakeholders ................................................................ 21
Table 4: The government’s target for the electricity access present and future [2] ....................................... 24
Table 5: Baseline electricity access per year and available energy from 2000-2010 ................................... 25
Table 6: Estimated power capacity from the measured discharge and flow during the sites’
Reconnaissance....................................................................................................................................................... 43
Table 7: Price of electricity set in RURA document “Rwanda energy investors’ forum”............................... 47
DSEE 2010/13
Examiner: Torsten FRANSSON
Supervisor: Amir VADEIE
VII. ACRONYMES
GoR: Government of Rwanda
GDP: Growth Domestic Product
IPPs: Independent Power Producers
EWSA: Energy Water and Sanitation Authority
RURA: Rwanda Utilities Regulatory Agency
MININFRA: Ministry of Infrastructure
MINICOFIN: Ministry of commerce and Finance
MINICOM: Ministry of Commerce
REMA: Rwanda Environment and Management Agency
REFIT: Renewable Energy Feed-in Tariff
RECO: Rwanda Electricity cooperation
RWASCO: Rwanda Water and Sanitation cooperation
ELECTROGAZ: Établissement Rwandais de Distribution de l’Eau, d’Electricité et de GAZ
PPAs: Power Purchase Agreements
MINALOC: Ministry of Local Government
MINEDUC: Ministry of Education
MINIRENA: Ministry if Natural Resources
EDPRS: Economic Development and Poverty Reduction Strategy
MDGs: Millennium Development Goals

DSEE 2010/13
Examiner: Torsten FRANSSON
Supervisor: Amir VADEIE
KV: Kilovolt
LV: Low voltage
MV: Medium voltage
MHP: Micro Hydropower
KWh: Kilowatt-hour
KW: Kilowatt
MW: Mega-watt
RWf: Rwanda francs
USD: United States Dollars
EPC: Engineering Procurement Contract
DSEE 2010/13
Examiner: Torsten FRANSSON
Supervisor: Amir VADEIE
1. BACKGROUND AND INTRODUCTION
The existing worldwide trends in power supply and management are potentially less
sustainable in all aspects of socio-economic, environment towards the development of
people’s welfare. But still we have time to change the expedition in which the world is running
in [23]. There is still time to change the journey we are on now. This is not to say that the
forecast of the social prosperity relies on how effectiveness we go for the power supply and
management challenges for sustainable development the world is facing today; maintaining
the supply of reliable and affordable energy; and leading to a tremendous transformation of a
carbon dioxide free, efficient and environmentally proper management of energy systems [19].
1.1. Introduction
This paper provides a draw round and brief description, together with the essential use of
Renewable energy sources and their significance for the improvement of energy supply
mostly in rural areas off-grid with simple energy technologies. Renewable energy sources
available in the region are; hydropower, solar, wind, biomass, geothermal and natural gas.
Besides all of the mentioned sources of renewable energies, this report particularly intended
to fully study the potential Pico and micro hydropower scattered around the country and in
partition selected only two districts of Nyaruguru from south eastern and Nyamagabe from
south western part of the country. The paper explains the general overview of micro
hydropower design technology and their importance over other sources of energy mostly for
rural electrification based on the cited case of study.
Since the case of study is a landlocked country, some of the renewable energy sources like
tidal and waves are not considered but still other than Rwanda countries touching to the
oceans may explore these sources for their benefit and carbon reduction.
However, micro hydropower technologies such as Run-of-River type is more relevant for
developing countries as mostly this technology is of simple nature and would require
moderate investments as well as minimum level of skills but still this remains a constraint in
our Rwanda due to lack of renewable energy policy for off-grid electrification [6].
DSEE 2010/13
Examiner: Torsten FRANSSON
Supervisor: Amir VADEIE
The study also reviews the costs and reliability of the different technologies and discusses
common technical and non-technical barriers and issues limiting the wide spread of
renewable energy in Rwanda.
This paper is of crucial benefit to the country strategic plan of increasing access to electricity
to approximately 50% by 2017 and more than 3,500,000 households connected and as well
achieving the targeted objectives of the energy policy. [6].
1.2. Country Background
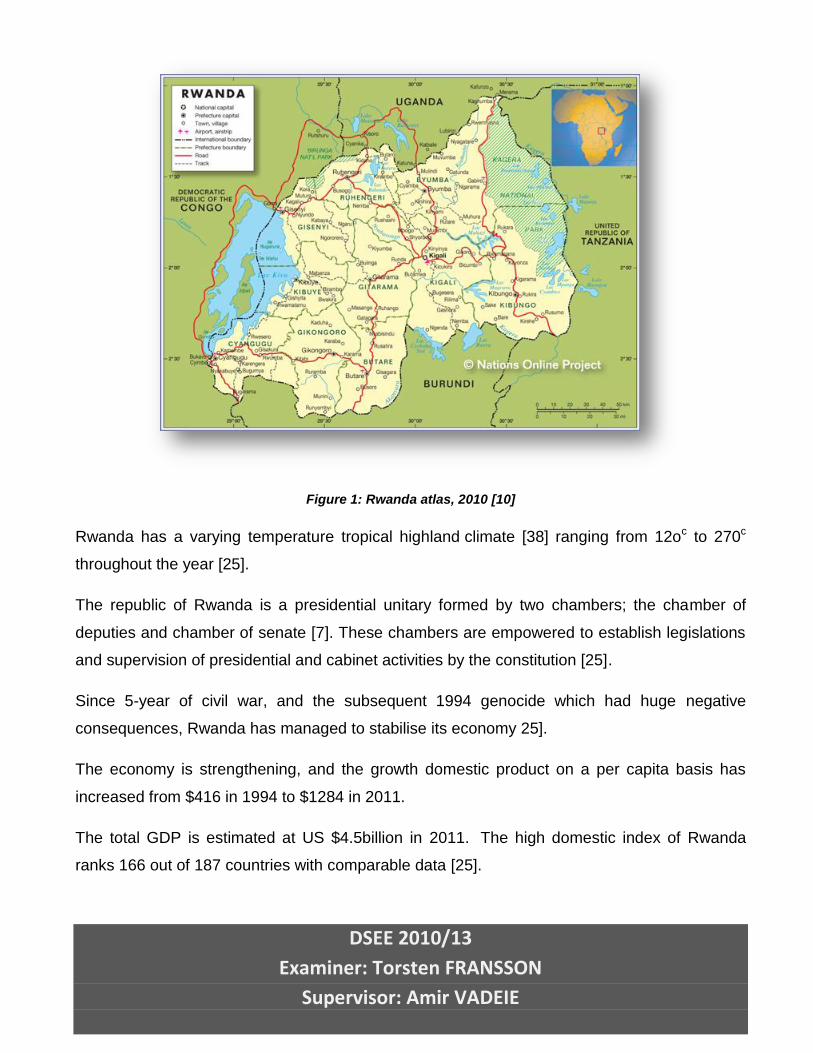
Despite the fact that Rwanda is being located [7] in the central and eastern of Africa, it is also a
landlocked country with around a population density of over 11.4 million as of the year 2011 on
total size of 26,338 square kilometres. Rwanda is located at 2 degrees south and 30 degrees
east. At 433 inhabitants per km2, Rwanda is amongst the highest populated in the region [9].
Rwanda is a landlocked country bordered by the countries such as Uganda from north,
Tanzania from east, Burundi from south and DRC from west. The entire region is hilly and
mountainous with an approximate lowest altitude 950m above the sea level [10].
DSEE 2010/13
Examiner: Torsten FRANSSON
Supervisor: Amir VADEIE
Figure 1: Rwanda atlas, 2010 [10]
Rwanda has a varying temperature tropical highland climate [38] ranging from 12oc to 270c
throughout the year [25].
The republic of Rwanda is a presidential unitary formed by two chambers; the chamber of
deputies and chamber of senate [7]. These chambers are empowered to establish legislations
and supervision of presidential and cabinet activities by the constitution [25].
Since 5-year of civil war, and the subsequent 1994 genocide which had huge negative
consequences, Rwanda has managed to stabilise its economy 25].
The economy is strengthening, and the growth domestic product on a per capita basis has
increased from $416 in 1994 to $1284 in 2011.
The total GDP is estimated at US $4.5billion in 2011. The high domestic index of Rwanda
ranks 166 out of 187 countries with comparable data [25].
DSEE 2010/13
Examiner: Torsten FRANSSON
Supervisor: Amir VADEIE
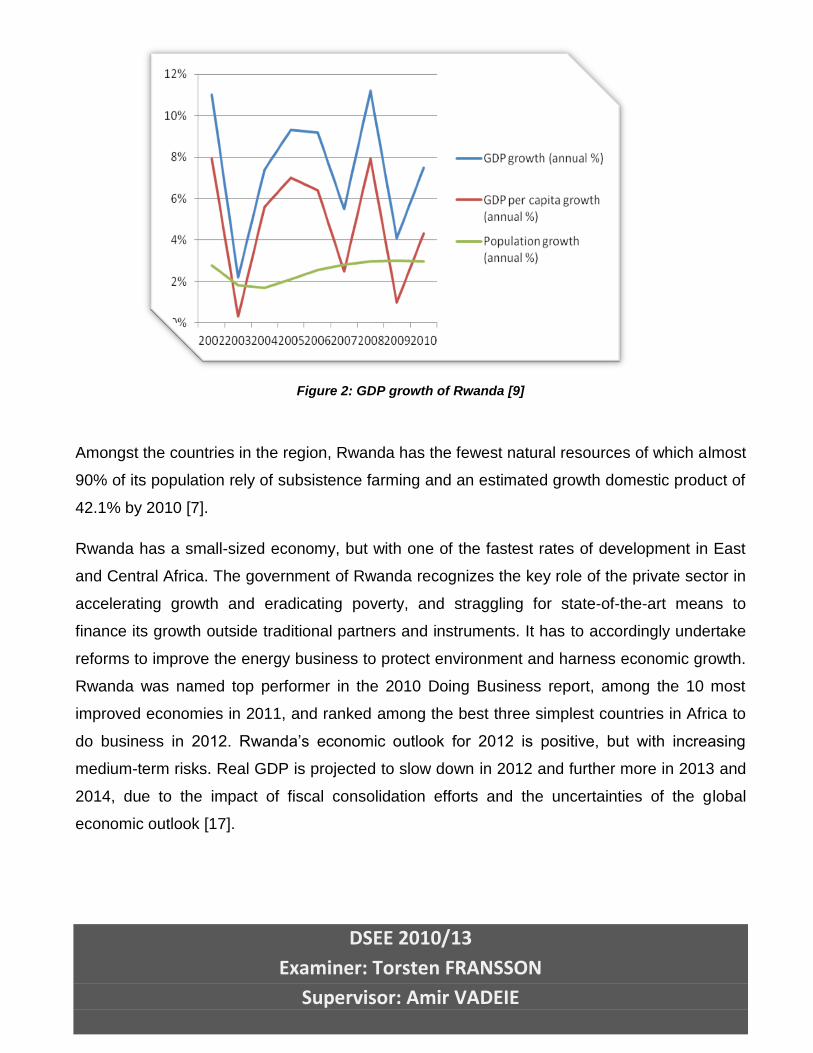
Figure 2: GDP growth of Rwanda [9]
Amongst the countries in the region, Rwanda has the fewest natural resources of which almost
90% of its population rely of subsistence farming and an estimated growth domestic product of
42.1% by 2010 [7].
Rwanda has a small-sized economy, but with one of the fastest rates of development in East
and Central Africa. The government of Rwanda recognizes the key role of the private sector in
accelerating growth and eradicating poverty, and straggling for state-of-the-art means to
finance its growth outside traditional partners and instruments. It has to accordingly undertake
reforms to improve the energy business to protect environment and harness economic growth.
Rwanda was named top performer in the 2010 Doing Business report, among the 10 most
improved economies in 2011, and ranked among the best three simplest countries in Africa to
do business in 2012. Rwanda’s economic outlook for 2012 is positive, but with increasing
medium-term risks. Real GDP is projected to slow down in 2012 and further more in 2013 and
2014, due to the impact of fiscal consolidation efforts and the uncertainties of the global
economic outlook [17].
DSEE 2010/13
Examiner: Torsten FRANSSON
Supervisor: Amir VADEIE
2. OBJECTIVES AND GOALS
Rwanda, besides being a land locked country it deeply depends on subsistence farming that
accounts almost 90% of the population. Renewable energies can contribute significantly to a
future sustainable energy system that is one of the prime movers for the development of any
economy.
The purpose of this paper is to place at the centre the role and significance of renewable
energy use for social and economic development of Rwanda and features related to planning
and policy initiatives that should be pursued by the energy sector to fulfil the national
objectives.
Specifically, the project takes into consideration the following;
Ensure affordability, reliability and continuous electricity access around the country
Improve energy sector frame work to encourage investors invest in rural electrification
with small hydropower.
Ensure diversification of energy sources domestically available in the region
Foster to optimise power capacity and energy conservation
Improve energy skills (capacity building for all energy working groups) such that to tale
lead of all activities and operational services in cases of foreign experts leave.
undertake renewable energy technology preferences
DSEE 2010/13
Examiner: Torsten FRANSSON
Supervisor: Amir VADEIE
3. RESEARCH METHODOLOGY
Research Questions
In assessing the future development of the Rwanda Energy system and the electricity access
strategy, the following research questions arise:
How can Rwanda Energy sector be developed in a sustainable manner and what
kind of institutional change is needed?
To answer the question, the following four sub-questions arise.
1. What is the Rwandan current political and available technological situation of energy
sector and what are the serious issues from the outlook of sustainability?
To respond to the above sub-question, an overview of the current Rwanda energy system and
essential sustainability issues are provided.
2. What is the national energy resources base for the adoption of the future development
of the Rwanda energy system?
The answer for this sub-question can clearly be responded through the assessment of the
domestic energy resources and essential data provided for the analysis of possible future
forecasts for development.
3. To what extent does sustainable solution for re-designing the Rwanda energy supply
management system for sustainable development is?
The best choice for developing a more sustainable development for Rwanda energy sector can
be identified based on the physical resource potentials, technological choices, social impacts,
sustainability considerations and socio-economic and environmental effects of the chosen
resource are compared.
DSEE 2010/13
Examiner: Torsten FRANSSON
Supervisor: Amir VADEIE
4. What is the change character needed in the institutional setting of the Rwanda energy
system for implementing sustainable alternatives and what are the thoughts and
possibilities of the key stakeholders?
In order to respond, the level and change of nature of the necessary system has to be
determined. In addition, the key stakeholders of the Rwanda energy system are identified
along with their duties and institutions.
Key activities involved
Identification of diversified energy resources within the Rwanda country
Perform interviews to different people about socio-economic barriers in the area of
study
Work for Best practices that could drive socio-economic and welfare of the people
before and after access to electricity
Know the current general overview of the country energy sector
Choose technology choices depending on the energy resource (renewable and non-
renewable energy resources comparison)
Demand side and supply management techniques
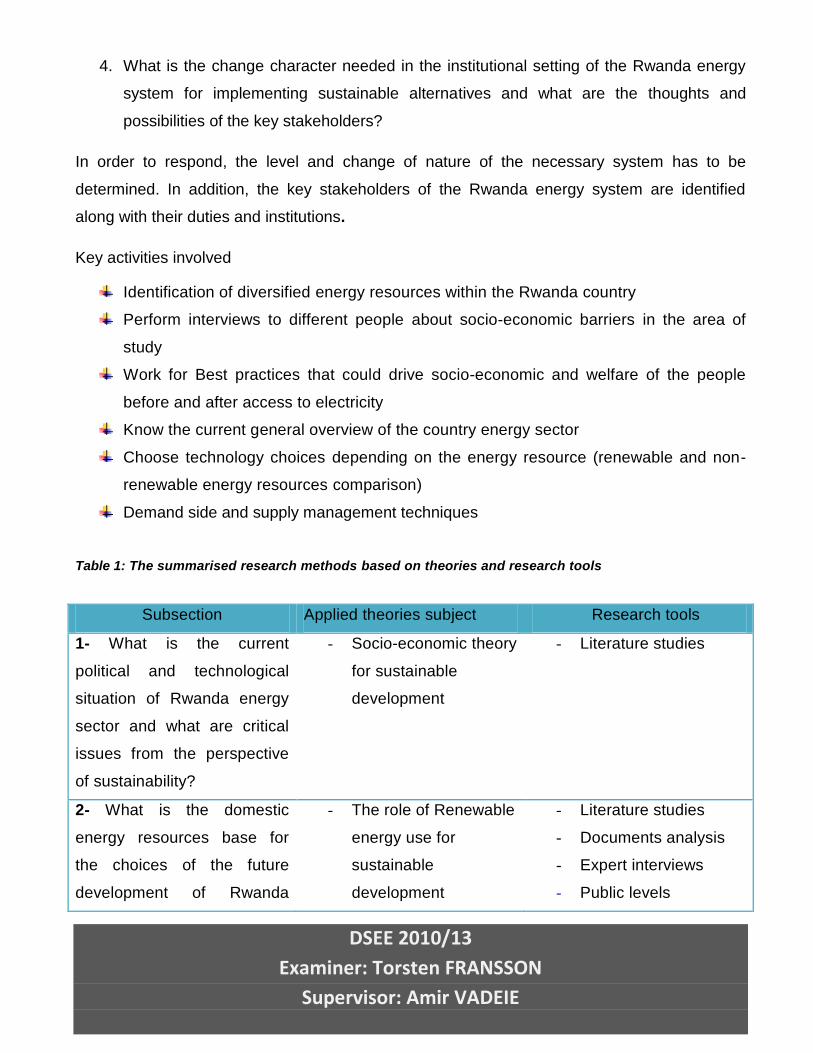
Table 1: The summarised research methods based on theories and research tools
Subsection Applied theories subject Research tools
1- What is the current
political and technological
situation of Rwanda energy
sector and what are critical
issues from the perspective
of sustainability?
- Socio-economic theory
for sustainable
development
- Literature studies
2- What is the domestic
energy resources base for
the choices of the future
development of Rwanda
- The role of Renewable
energy use for
sustainable
development
- Literature studies
- Documents analysis
- Expert interviews
- Public levels
DSEE 2010/13
Examiner: Torsten FRANSSON
Supervisor: Amir VADEIE
energy system interviews (rural and
urban)
3- What is a sustainable
solution for using energy mix
among other Rwanda energy
systems
- Theory of future
analysis
- Theory of project
impacts after appraisal
- Literature studies
- Document analysis
- Cost reflection
analysis
- Energy plan strategy
and policy framework
4- What is the character of
the change necessary in the
institutional setting of the
Rwanda energy system for
implementing a sustainable
alternatives and what are the
clear options and energy
working group (stakeholders)
- Theory of radical
technological change
- Theory of institutional
analysis
- Institutional change
theory
- Stakeholders theory
- Literature studies
- Expert interviews
- Institutional change
analysis
- Stakeholder analysis
3.1. Rwanda Energy Sector Overview
3.1.1. Present Situation
3.1.1.1. Primary Energy Balance
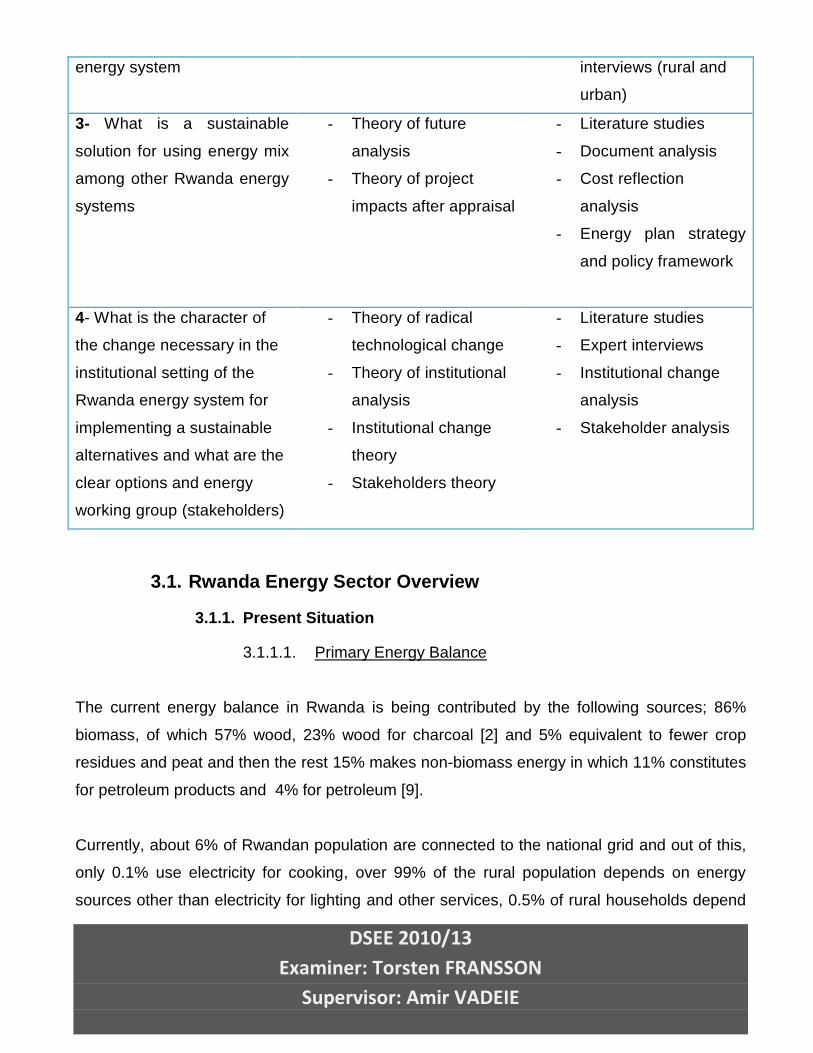
The current energy balance in Rwanda is being contributed by the following sources; 86%
biomass, of which 57% wood, 23% wood for charcoal [2] and 5% equivalent to fewer crop
residues and peat and then the rest 15% makes non-biomass energy in which 11% constitutes
for petroleum products and 4% for petroleum [9].
Currently, about 6% of Rwandan population are connected to the national grid and out of this,
only 0.1% use electricity for cooking, over 99% of the rural population depends on energy
sources other than electricity for lighting and other services, 0.5% of rural households depend
DSEE 2010/13
Examiner: Torsten FRANSSON
Supervisor: Amir VADEIE
on electricity for lighting, whereas the corresponding figure for the urban population is 23% [1]..
Figure 3: Energy balance of Rwanda, 2011 [12]
3.1.1.2. Electricity Generation
Though electricity generation in Rwanda has gradually increased from the lowest value of
40MW and stabilised since the severe power shortage and deficit in 2004, the country’s power
generation capacity is still very low in comparison to the demand [12].
Currently Rwanda has approximately 96.8MW of installed capacity of which only 85.9MW of
electricity generation is available [12]. Out of the available generation capacity, only 13% of
households are connected to the grid [12]. Considering the report from the electricity utility
institution, its target is to round up to at least 350,000 households electrified and to reach
electrification rate of 16% by 2014[12]. However, inadequate of installed generation capacities
and the poor infrastructure electricity plan result in very low levels of electricity generation and
consumption. They also become main obstacle for the economic development of the country in
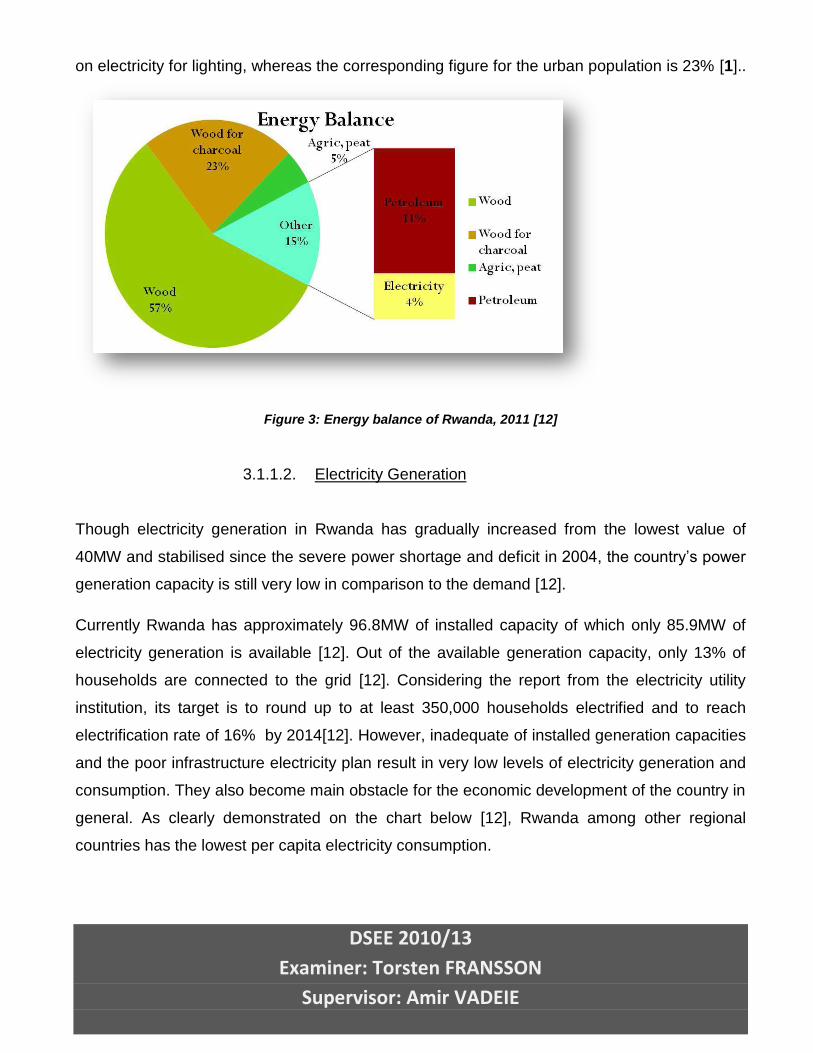
general. As clearly demonstrated on the chart below [12], Rwanda among other regional
countries has the lowest per capita electricity consumption.
DSEE 2010/13
Examiner: Torsten FRANSSON
Supervisor: Amir VADEIE
Figure 4: Annual per capita electricity consumption in the east & central Africa countries, 2010 KW/Person [12]
To overcome issues related to the shortage of local generation facilities, the government of
Rwanda has had to rent standby generators and import electricity from the neighbouring
countries. The share of electricity by the rented generators and imports from foreign sources
accounts almost as high as 30% of the total energy consumption [12]. The need for additional
electricity becomes evident especially during peak hours of demand.
Rwanda also has the highest electricity tariffs in the region that rounds to 20.7 US cents per
KWh including 18% VAT for large industrial customers, and 22.2 US cents including 18% VAT
for other customers [12]. In case the fuel tax is not exempted and the gov’t doesn’t subsidize
the cost of electricity, electricity produced by the rented generators in the country would be
much expensive. The tariffs are expected to grow even further in view of the need to rent
additional diesel generators.
DSEE 2010/13
Examiner: Torsten FRANSSON
Supervisor: Amir VADEIE
3.1.1.3. Installed capacity and forecasts
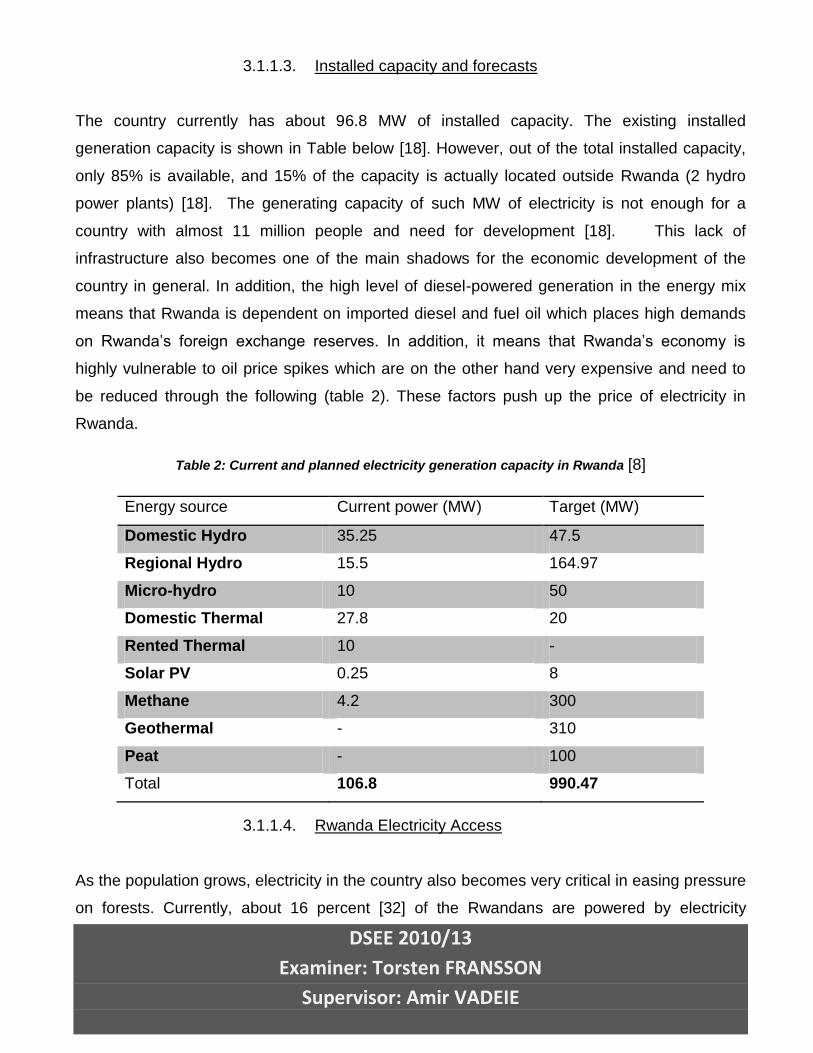
The country currently has about 96.8 MW of installed capacity. The existing installed
generation capacity is shown in Table below [18]. However, out of the total installed capacity,
only 85% is available, and 15% of the capacity is actually located outside Rwanda (2 hydro
power plants) [18]. The generating capacity of such MW of electricity is not enough for a
country with almost 11 million people and need for development [18]. This lack of
infrastructure also becomes one of the main shadows for the economic development of the
country in general. In addition, the high level of diesel-powered generation in the energy mix
means that Rwanda is dependent on imported diesel and fuel oil which places high demands
on Rwanda’s foreign exchange reserves. In addition, it means that Rwanda’s economy is
highly vulnerable to oil price spikes which are on the other hand very expensive and need to
be reduced through the following (table 2). These factors push up the price of electricity in
Rwanda.
Table 2: Current and planned electricity generation capacity in Rwanda [8]
Energy source Current power (MW) Target (MW)
Domestic Hydro 35.25 47.5
Regional Hydro 15.5 164.97
Micro-hydro 10 50
Domestic Thermal 27.8 20
Rented Thermal 10 -
Solar PV 0.25 8
Methane 4.2 300
Geothermal - 310
Peat - 100
Total 106.8 990.47
3.1.1.4. Rwanda Electricity Access
As the population grows, electricity in the country also becomes very critical in easing pressure
on forests. Currently, about 16 percent [32] of the Rwandans are powered by electricity
DSEE 2010/13
Examiner: Torsten FRANSSON
Supervisor: Amir VADEIE
meaning that a staggering 84% of the population depends on wood energy for cooking and
lighting [10]. The figure could be even higher based on the connections [27] and the
technology of power generation.
From 16% of access to electricity, a big number of people use it for lighting other than cooking
because of high cost per unit kilowatt of electricity [10].
A situation whereby 84% of the population depends on wood is unsustainable because
Rwanda does not have enough forest cover to provide wood energy for a growing population.
According to EWSA, by 2017 the country is planning to have at least 1,700,000 new
connections to the electrical grid, thus the electrification rate should reach 50% [10]. This
national target is a timely and central initiative that will help protect the country’s environment
as well as provide the much needed energy through diversification of resources (use of
available domestic energy resources by simple technology off grid) to power the country to
prosperity.
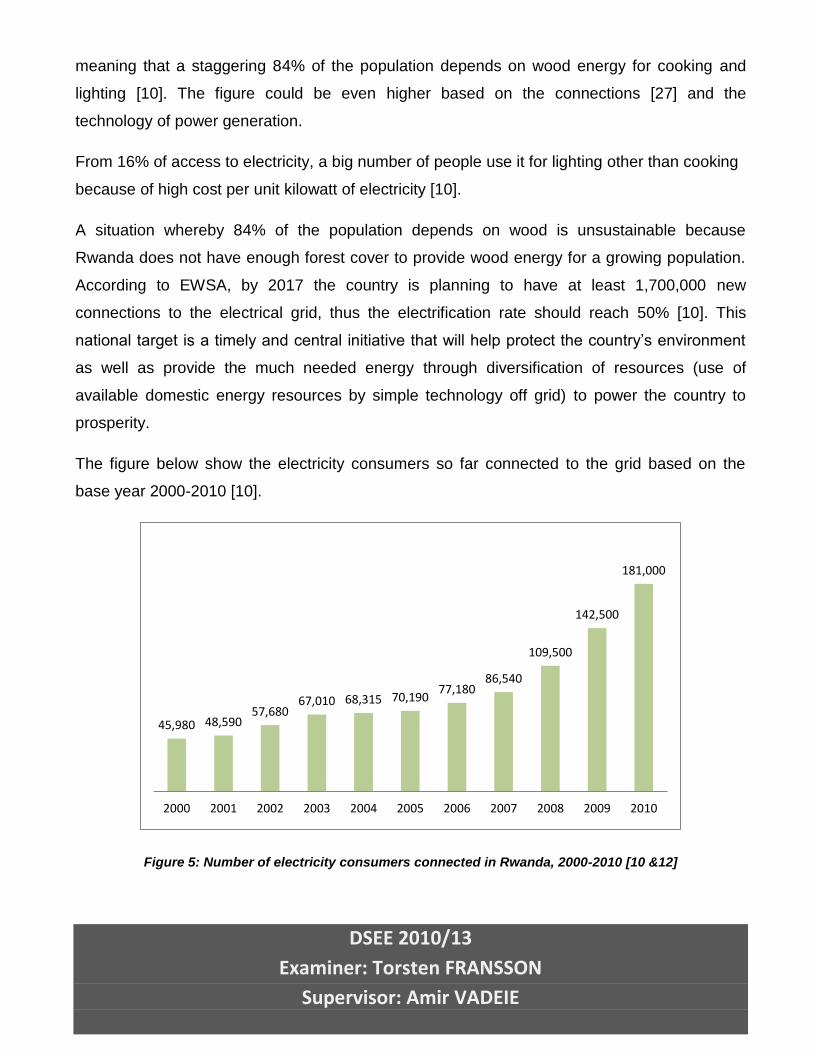
The figure below show the electricity consumers so far connected to the grid based on the
base year 2000-2010 [10].
Figure 5: Number of electricity consumers connected in Rwanda, 2000-2010 [10 &12]
45,980 48,590 57,680
67,010 68,315 70,190 77,180
86,540
109,500
142,500
181,000
2000 2001 2002 2003 2004 2005 2006 2007 2008 2009 2010
DSEE 2010/13
Examiner: Torsten FRANSSON
Supervisor: Amir VADEIE
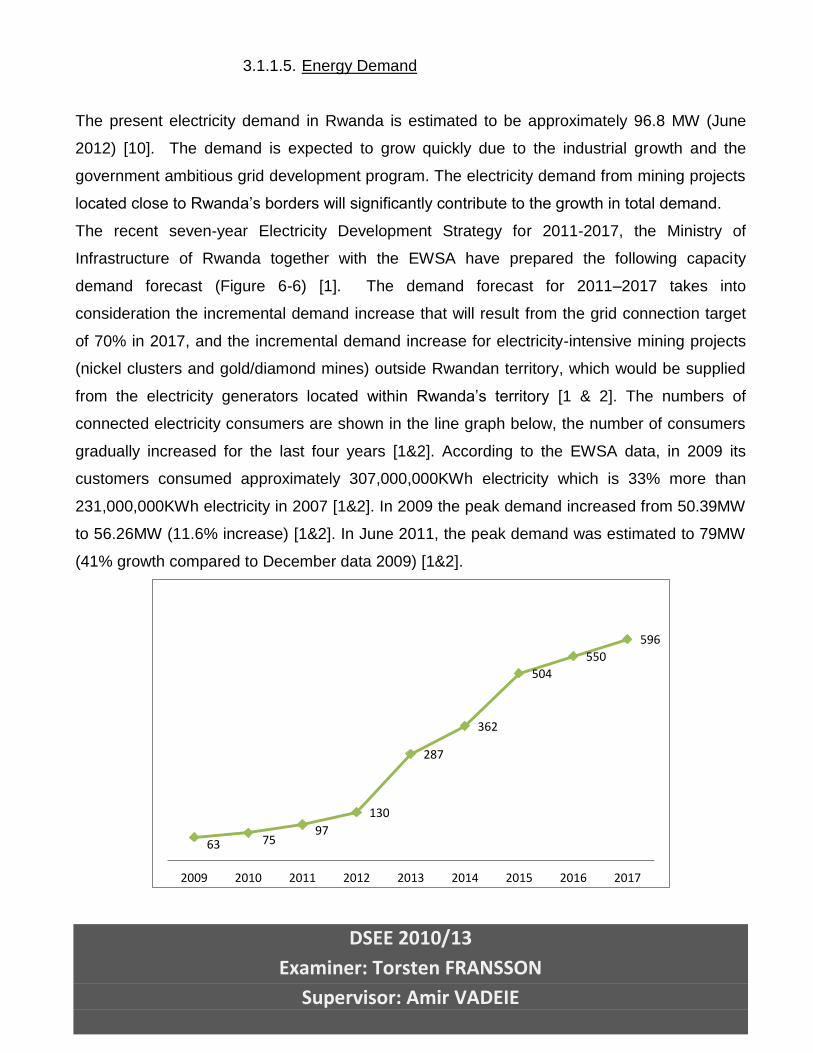
3.1.1.5. Energy Demand
The present electricity demand in Rwanda is estimated to be approximately 96.8 MW (June
2012) [10]. The demand is expected to grow quickly due to the industrial growth and the
government ambitious grid development program. The electricity demand from mining projects
located close to Rwanda’s borders will significantly contribute to the growth in total demand.
The recent seven-year Electricity Development Strategy for 2011-2017, the Ministry of
Infrastructure of Rwanda together with the EWSA have prepared the following capacity
demand forecast (Figure 6-6) [1]. The demand forecast for 2011–2017 takes into
consideration the incremental demand increase that will result from the grid connection target
of 70% in 2017, and the incremental demand increase for electricity-intensive mining projects
(nickel clusters and gold/diamond mines) outside Rwandan territory, which would be supplied
from the electricity generators located within Rwanda’s territory [1 & 2]. The numbers of
connected electricity consumers are shown in the line graph below, the number of consumers
gradually increased for the last four years [1&2]. According to the EWSA data, in 2009 its
customers consumed approximately 307,000,000KWh electricity which is 33% more than
231,000,000KWh electricity in 2007 [1&2]. In 2009 the peak demand increased from 50.39MW
to 56.26MW (11.6% increase) [1&2]. In June 2011, the peak demand was estimated to 79MW
(41% growth compared to December data 2009) [1&2].
63 75 97
130
287
362
504
550
596
2009 2010 2011 2012 2013 2014 2015 2016 2017
DSEE 2010/13
Examiner: Torsten FRANSSON
Supervisor: Amir VADEIE
Figure 6: Electricity capacity demand forecasts for 2011-2017, MW [1]
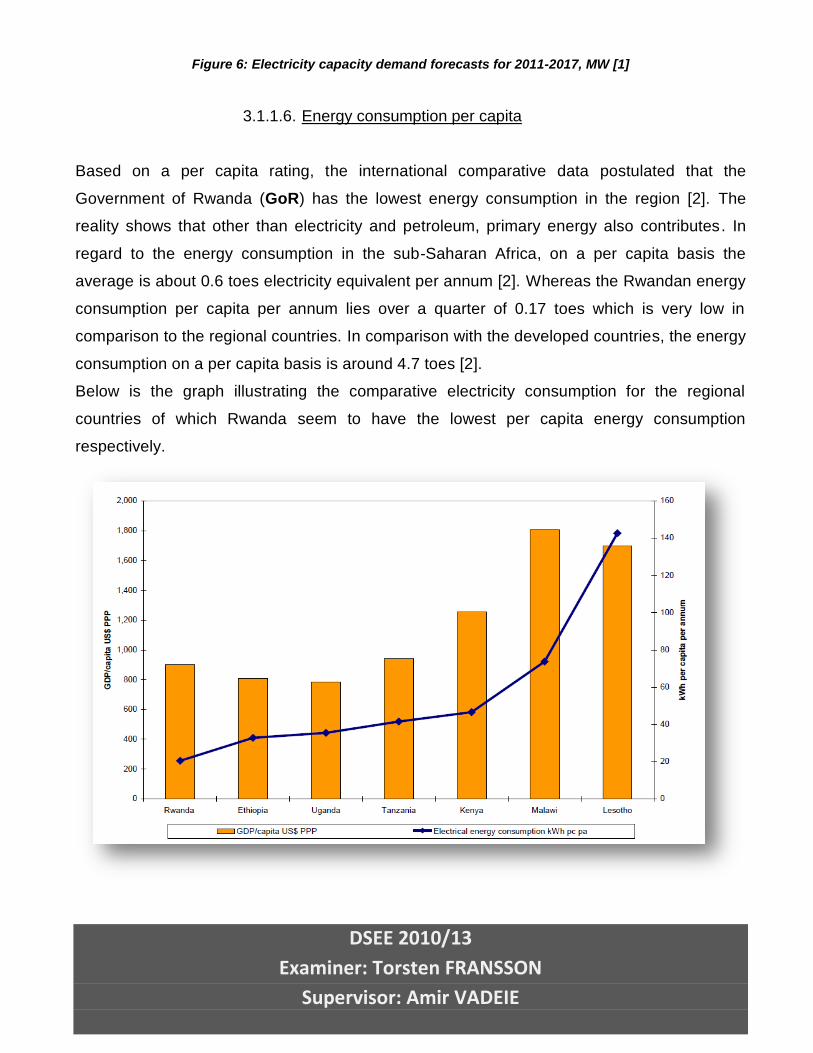
3.1.1.6. Energy consumption per capita
Based on a per capita rating, the international comparative data postulated that the
Government of Rwanda (GoR) has the lowest energy consumption in the region [2]. The
reality shows that other than electricity and petroleum, primary energy also contributes. In
regard to the energy consumption in the sub-Saharan Africa, on a per capita basis the
average is about 0.6 toes electricity equivalent per annum [2]. Whereas the Rwandan energy
consumption per capita per annum lies over a quarter of 0.17 toes which is very low in
comparison to the regional countries. In comparison with the developed countries, the energy
consumption on a per capita basis is around 4.7 toes [2].
Below is the graph illustrating the comparative electricity consumption for the regional
countries of which Rwanda seem to have the lowest per capita energy consumption
respectively.
DSEE 2010/13
Examiner: Torsten FRANSSON
Supervisor: Amir VADEIE
Figure 7: Comparative data on electricity consumption in region [10]
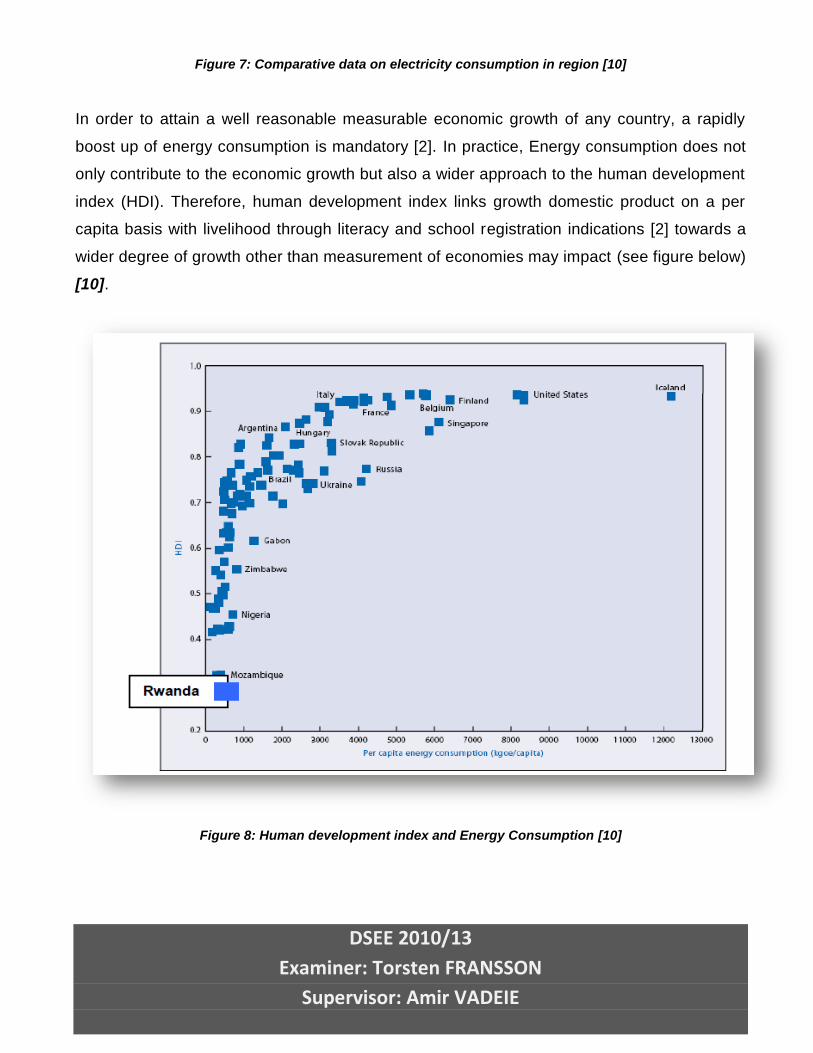
In order to attain a well reasonable measurable economic growth of any country, a rapidly
boost up of energy consumption is mandatory [2]. In practice, Energy consumption does not
only contribute to the economic growth but also a wider approach to the human development
index (HDI). Therefore, human development index links growth domestic product on a per
capita basis with livelihood through literacy and school registration indications [2] towards a
wider degree of growth other than measurement of economies may impact (see figure below)
[10].
Figure 8: Human development index and Energy Consumption [10]
DSEE 2010/13
Examiner: Torsten FRANSSON
Supervisor: Amir VADEIE
3.1.1.7. Electricity tariff and cost per KWh
Electricity tariffs in Rwanda are based on a flat tariff system for two types of customers:
Households and large commercial/industrial consumers. A social tariff has already put in
place in manner that is not favouring the subscribers whereby instead of lowering the cost
per KWh of electricity consumed, the cost raised by 20% per KWh for all households keeping
constant the industrial or commercial consumption cost per KWh which is not affordable and
cost reflective on the other hand [1]. The end-user pays a monthly flat fee plus energy fee.
The retail tariff is 112/KWh+20% increment on KWh which is equivalent to $0.21 per kilowatt
hour for low customers [2] and a 105RWf equivalent to $0.19 per kilowatt hour for large
customers Plus 18% VAT) [1&10]. This cost of electricity comprises government subsidies;
exemptions [2] on tax for the imported fuel for thermal power for electricity production and
subsidy on capacity for rented thermal generation. With the GoR intending at a Build–own-
operate-transfer (BOOT) modality for power generation, the future tariff will much depend on
the cost of lending and the expected return on equity. Electricity consumers connected to
isolated grids are currently charged a tariff that is equal to that of public utility customers [8]
(normally FRW 134.4/KWh+VAT) which seem to be challenging partly for the IPPs
depending on operational and maintenance services for a sustainable economy and long live
service [1&10].
However the cost of supplying off-grid-customers is typically greater than the cost of
supplying grid-connected customers because a grid connected customers only need much
less techniques and economically less to be connected than a refresh design of whether a
transmission or distribution system and critical equipments to connect the isolated
customers. Until now, the price for the sale of the electricity produced by IPPs to EWSA was
negotiated particularly [48] still which is a challenge for the IPPs categorically (the cost value
stands at 60RWf/KWh) [1&10].
With lack of independent power producers with isolated networks, the Government of
Rwanda has largely the vital challenge for the low access of electricity to households
dominated off-grid.
DSEE 2010/13
Examiner: Torsten FRANSSON
Supervisor: Amir VADEIE
In addition, there has also been not tariff structure for direct electricity uptakes either has
there been the wheeling tariff structure all this has to be worked on by the Regulator
(Rwanda Utilities Regulatory Agency).
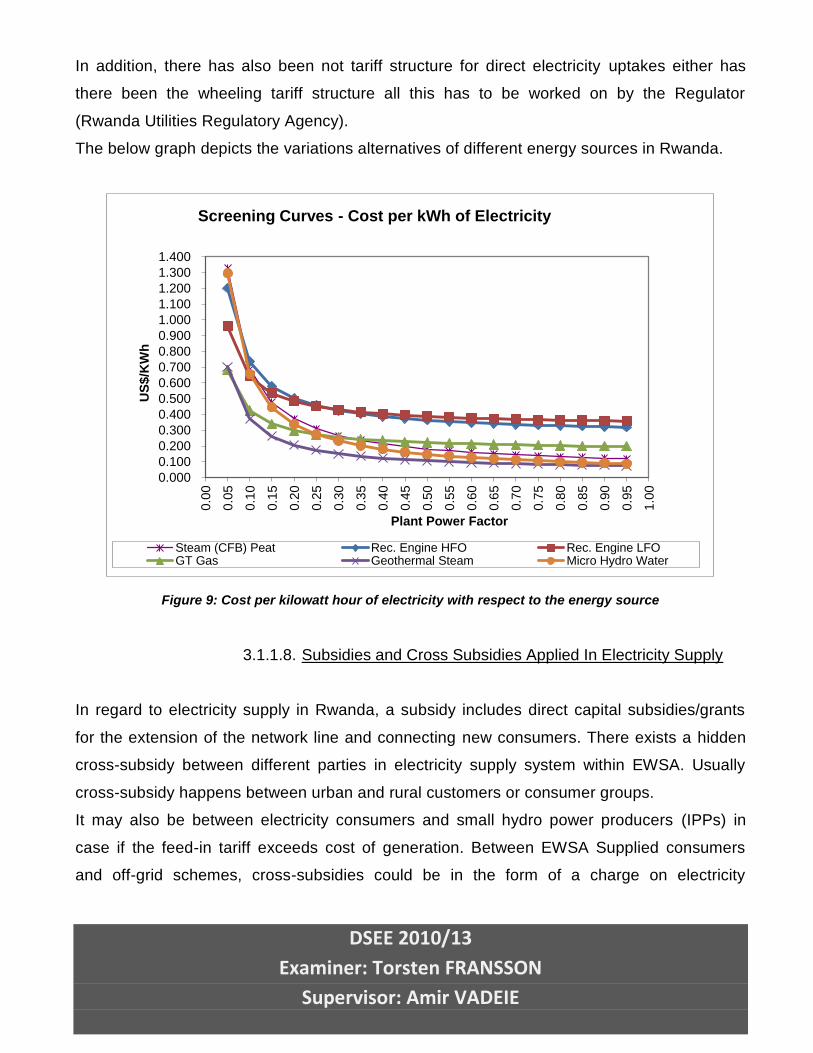
The below graph depicts the variations alternatives of different energy sources in Rwanda.
Figure 9: Cost per kilowatt hour of electricity with respect to the energy source
3.1.1.8. Subsidies and Cross Subsidies Applied In Electricity Supply
In regard to electricity supply in Rwanda, a subsidy includes direct capital subsidies/grants
for the extension of the network line and connecting new consumers. There exists a hidden
cross-subsidy between different parties in electricity supply system within EWSA. Usually
cross-subsidy happens between urban and rural customers or consumer groups.
It may also be between electricity consumers and small hydro power producers (IPPs) in
case if the feed-in tariff exceeds cost of generation. Between EWSA Supplied consumers
and off-grid schemes, cross-subsidies could be in the form of a charge on electricity
0.000
0.100
0.200
0.300
0.400
0.500
0.600
0.700
0.800
0.900
1.000
1.100
1.200
1.300
1.400
0.0
0
0.0
5
0.1
0
0.1
5
0.2
0
0.2
5
0.3
0
0.3
5
0.4
0
0.4
5
0.5
0
0.5
5
0.6
0
0.6
5
0.7
0
0.7
5
0.8
0
0.8
5
0.9
0
0.9
5
1.0
0
US
$/K
Wh
Plant Power Factor
Screening Curves - Cost per kWh of Electricity
Steam (CFB) Peat Rec. Engine HFO Rec. Engine LFOGT Gas Geothermal Steam Micro Hydro Water
DSEE 2010/13
Examiner: Torsten FRANSSON
Supervisor: Amir VADEIE
consumption to help fund the capital cost of off-grid schemes such that the tariff charged to
off-grid consumers equals that of grid connected customers.
This formal charge of EWSA consumers was proposed in the electricity law but this law is
quite to whether subsidy should be provided as a capital subsidy or an operational subsidy.
Regarding the Renewable energy feed-in tariff (REFIT) regulation, RURA published the
information on 9th February, 2012 on a feed-in tariff applicable to the hydro power plants [15].
This regulation is applied to any person intending to construct and operate any hydro power
plant that produces a minimum of 50KW up to 10MW but this does not apply to those off-grid
power developers [7]. The regulation also applies to projects located 10km away from the
grid; therefore in this case the transmission operators distant 10km to the grid negotiate for
discounts [7]. The feed-in tariff range from USD cent 16.6/KW for a plant of installed capacity
of 50KW to USD cent 6.7/KWh for a plant installed capacity of 10MW [15].
While comparing to region member countries, in Uganda the value is different from which for
a small scale renewable energy system of priority technology that is up to a maximum of an
installed capacity of 20MW and greater than 0.5MW are lower [15].
For Rwanda, in order to reduce the negative impacts of a stepped tariff, a linear tariff based
on the actual installed capacity was developed for mid-range hydro projects (1- 8.9MW) [15].
It remains to be seen if the subsidy scheme is viable. It was indicated at the 1st Energy
Sector Forum that subsidy schemes are on the way in 2012 for other technologies as well.
3.1.1.9. Energy stakeholders
The key players in Rwanda’s energy sector are divided into units of policy and regulation,
operation and customers and planning and finance.
Policy and regulation:
The Ministry of Infrastructures (MININFRA) sets the sector policy, The Rwanda Utilities
Regulatory Authority (RURA) provides licenses and regulates tariffs and District
administrations assist where expropriation of residents is involved and other social related
aspects. Other line Ministries provide indirect inputs on relevant issues [10].
DSEE 2010/13
Examiner: Torsten FRANSSON
Supervisor: Amir VADEIE
Operation and customers:
Rwanda Government owns and manages EWSA (former ELECTROGAZ/RECO-RWASCO
now is EWSA) which, with the small-scale providers, provides electricity to consumers [10].
Planning and finance:
The Ministry of Finance and Economic Planning (MINECOFIN) provides subsidies for hydro
infrastructures and to some extent on thermal energy related operations [10]. MININFRA has
also the responsibility to plan development of new hydroelectric plants provides concessions
and along with EWSA negotiates Power Purchase Agreements (PPAs) and Development
Partners, in their side, attends generally to provide subsidies Whilst this report covers more
than hydro, hydro is by far the most developed sector within the scope of this report.
Consequently, the focus is on the organization of mainly hydro, in which other technologies
will need to mirror themselves as they mature.
Central and local Government:
Central Government’s role in the hydro electricity sector is to set sector policy, monitor
performance and implement sector rules and regulations [10]. This sector also plays part in
assisting planning and financing new energy businesses, bolstering capacity in Rwanda to
prepare for future demand and engage private sector investors. Since the power utility is a
state owned system, institution under control of ministry if infrastructure serves as the
electricity supplier in the region.
Local administrative entities include provinces (Intara), districts (Akarere), sectors
(Umurenge), cells (Akagari) and the village (Umudugudu). The duties of municipal authorities
in the electricity sector include implementation, service delivery, participation and
accountability. The decentralization policy in Rwanda creates opportunities to seek quick
resolutions and provide quality service delivery against problems through coordination with
DSEE 2010/13
Examiner: Torsten FRANSSON
Supervisor: Amir VADEIE
local communities. This is particularly important for development partners that support
service delivery activities, particularly in small electricity systems based on peat and mini-
hydro resources.
3.1.1.10. Ministries and Government Agencies
MNINFRA Is the ministry that leads the policy making of the Government amongst the decision
makers in the energy sector. Its role is to advise on policy issues and reach a consensus on
policy goals. Concerning projects, MININFRA has been involved in planning major energy
sector investments and obtaining funding for investments from MINICOFIN.MININFRA is also
responsible for negotiating power purchase agreements with private investors.
RURA is responsible for electricity and gas regulation, created as an independent Agency with
autonomous to regulate public utilities. It is also responsible to promote the interests of users
and potentials users who require services provided by certain public utilities. RURA is also
required to set tariffs and tariff methodologies that are on a discriminatory, fair competitive,
cost reflective and allow the recovery of justifiable costs and promote economic development.
Concerning supply management and socio-economic development, the ministry of
infrastructure sets up energy strategic policies to bring the participation of all energy sector
stakeholders to be engaged in the electricity generation whilst including the local
Government MINALOC (the representatives of the Municipal and District authorities),
MINEDUC, MINASANTE etc. These line Ministries are interested particularly in accessing
targets to health centres, schools, administrative offices.
EWSA is a public Utility established by the law in 2010 that performs both commercial and
industrial functions. Through fields of renewable energy, the EWSA’s obligation includes but
not limited to coordination of all activities related with programs aimed at planning and
implementation of the projects (Renewable energy projects program), mobilisation of all
users of energy and of any kind in relation, water and sanitation scenarios.
DSEE 2010/13
Examiner: Torsten FRANSSON
Supervisor: Amir VADEIE
MINECOFIN plays as a lead partner in the energy sector. It holds an important role in
resourcing and running the sector programs. The Ministry is merely responsible for taxation
and economic planning development of energy sector in the country. In the chains of public
authorities, also includes MINIRENA in charge of resources and mining and REMA in charge
of environmental protection and policy strategies of land use regulations.
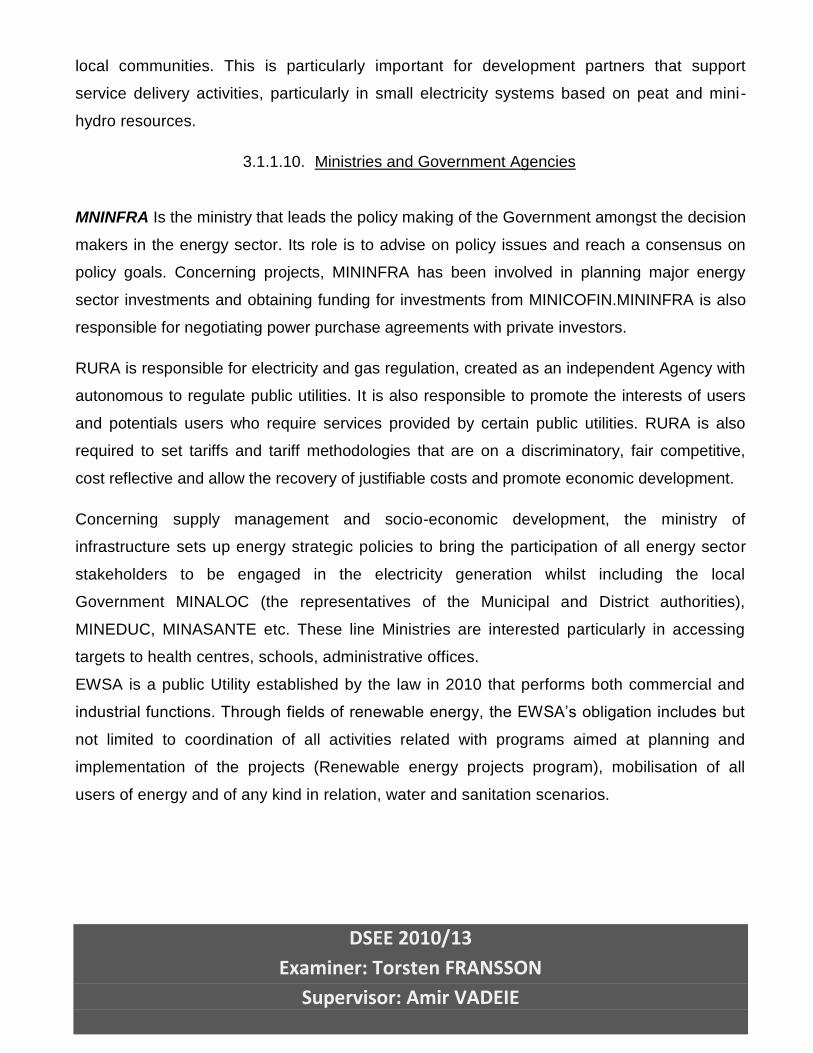
The table below justifies the roles and responsibilities of all energy sectors working group
with respect to the Rwanda energy sector stakeholders including all the government
Ministries, authorities, agencies and non-government investors (Private sector).
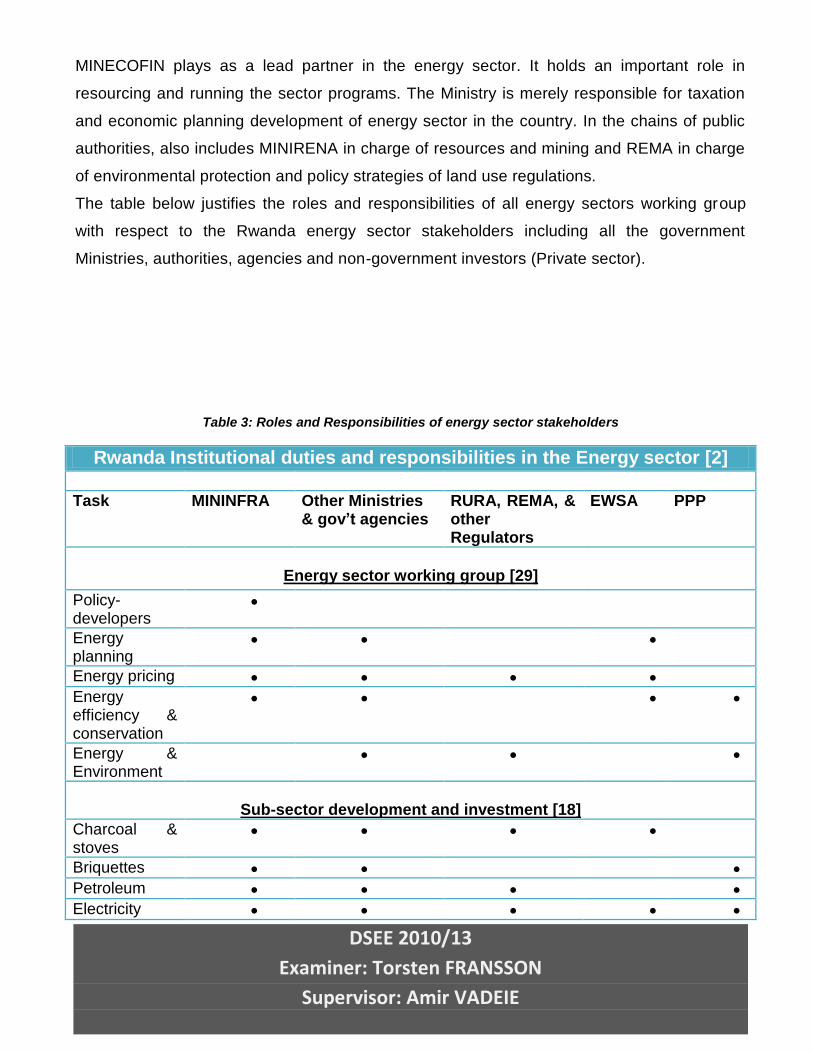
Table 3: Roles and Responsibilities of energy sector stakeholders
Rwanda Institutional duties and responsibilities in the Energy sector [2]
Task MININFRA Other Ministries & gov’t agencies
RURA, REMA, & other Regulators
EWSA PPP
Energy sector working group [29]
Policy-developers
Energy planning
Energy pricing
Energy efficiency & conservation
Energy & Environment
Sub-sector development and investment [18]
Charcoal & stoves
Briquettes
Petroleum
Electricity
DSEE 2010/13
Examiner: Torsten FRANSSON
Supervisor: Amir VADEIE
Methane
Peat
Waste
Geothermal
Solar water heating
Biomass
Solar PV
Wind
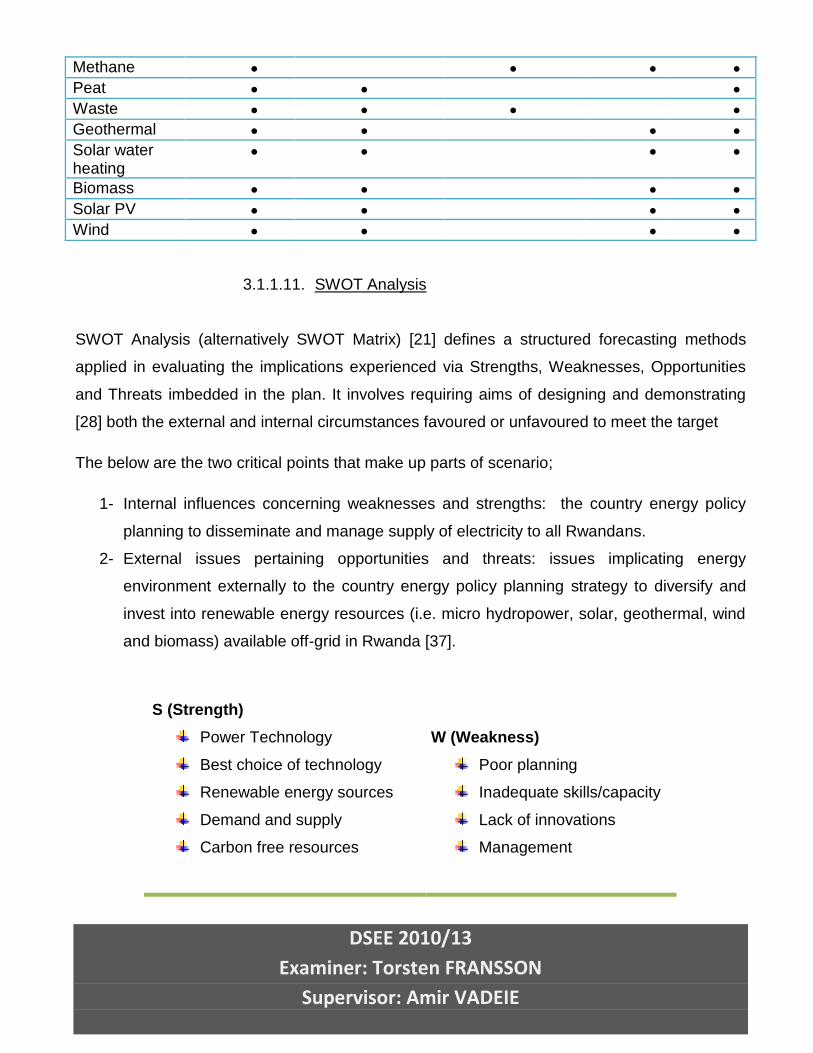
3.1.1.11. SWOT Analysis
SWOT Analysis (alternatively SWOT Matrix) [21] defines a structured forecasting methods
applied in evaluating the implications experienced via Strengths, Weaknesses, Opportunities
and Threats imbedded in the plan. It involves requiring aims of designing and demonstrating
[28] both the external and internal circumstances favoured or unfavoured to meet the target
The below are the two critical points that make up parts of scenario;
1- Internal influences concerning weaknesses and strengths: the country energy policy
planning to disseminate and manage supply of electricity to all Rwandans.
2- External issues pertaining opportunities and threats: issues implicating energy
environment externally to the country energy policy planning strategy to diversify and
invest into renewable energy resources (i.e. micro hydropower, solar, geothermal, wind
and biomass) available off-grid in Rwanda [37].
S (Strength)
Power Technology
Best choice of technology
Renewable energy sources
Demand and supply
Carbon free resources
W (Weakness)
Poor planning
Inadequate skills/capacity
Lack of innovations
Management
DSEE 2010/13
Examiner: Torsten FRANSSON
Supervisor: Amir VADEIE
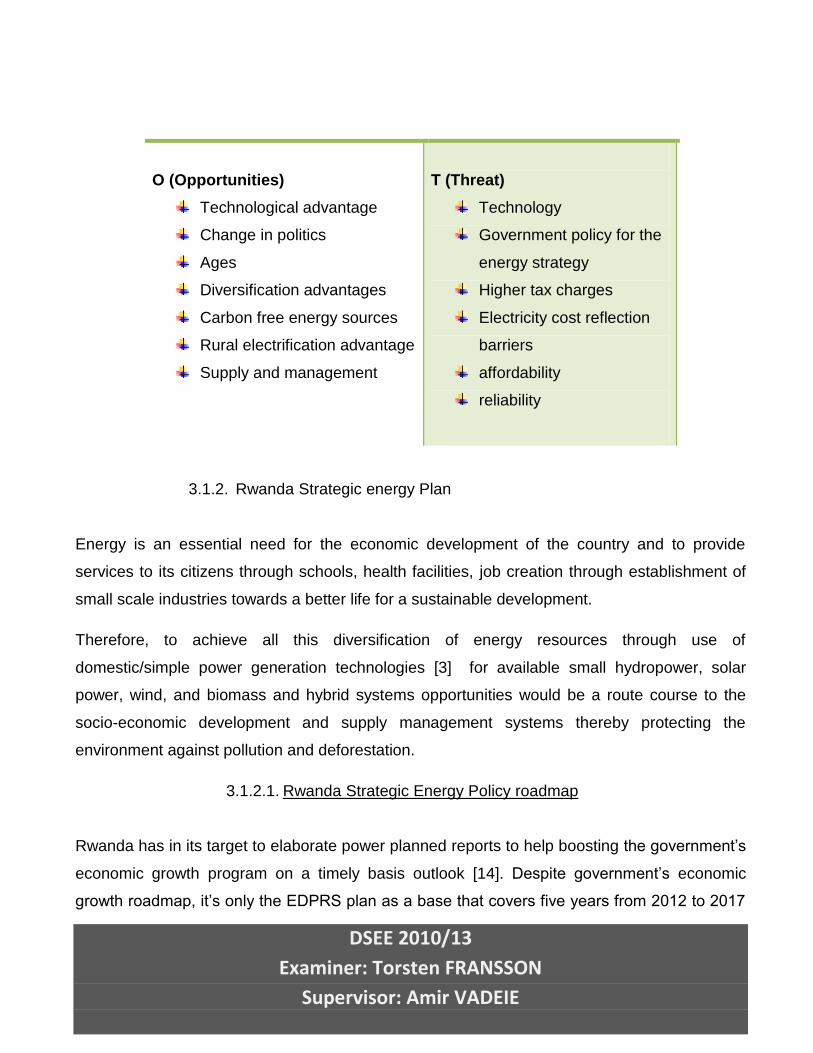
O (Opportunities)
Technological advantage
Change in politics
Ages
Diversification advantages
Carbon free energy sources
Rural electrification advantage
Supply and management
T (Threat)
Technology
Government policy for the
energy strategy
Higher tax charges
Electricity cost reflection
barriers
affordability
reliability
3.1.2. Rwanda Strategic energy Plan
Energy is an essential need for the economic development of the country and to provide
services to its citizens through schools, health facilities, job creation through establishment of
small scale industries towards a better life for a sustainable development.
Therefore, to achieve all this diversification of energy resources through use of
domestic/simple power generation technologies [3] for available small hydropower, solar
power, wind, and biomass and hybrid systems opportunities would be a route course to the
socio-economic development and supply management systems thereby protecting the
environment against pollution and deforestation.
3.1.2.1. Rwanda Strategic Energy Policy roadmap
Rwanda has in its target to elaborate power planned reports to help boosting the government’s
economic growth program on a timely basis outlook [14]. Despite government’s economic
growth roadmap, it’s only the EDPRS plan as a base that covers five years from 2012 to 2017
DSEE 2010/13
Examiner: Torsten FRANSSON
Supervisor: Amir VADEIE
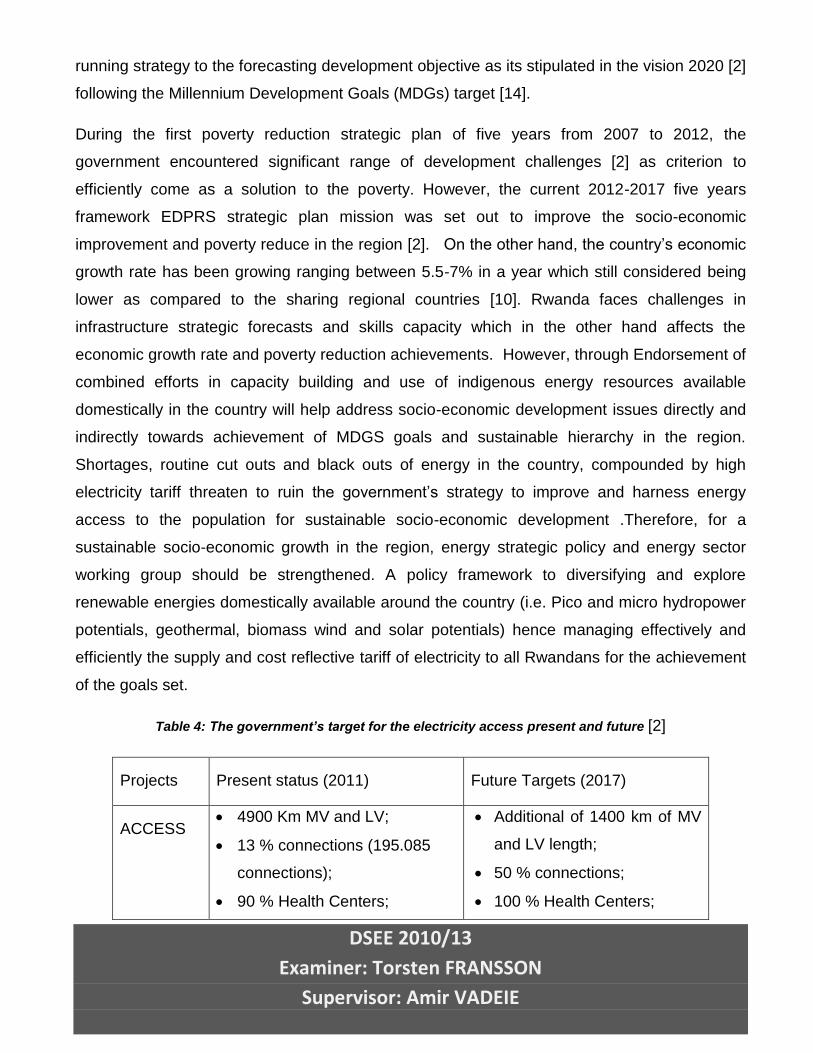
running strategy to the forecasting development objective as its stipulated in the vision 2020 [2]
following the Millennium Development Goals (MDGs) target [14].
During the first poverty reduction strategic plan of five years from 2007 to 2012, the
government encountered significant range of development challenges [2] as criterion to
efficiently come as a solution to the poverty. However, the current 2012-2017 five years
framework EDPRS strategic plan mission was set out to improve the socio-economic
improvement and poverty reduce in the region [2]. On the other hand, the country’s economic
growth rate has been growing ranging between 5.5-7% in a year which still considered being
lower as compared to the sharing regional countries [10]. Rwanda faces challenges in
infrastructure strategic forecasts and skills capacity which in the other hand affects the
economic growth rate and poverty reduction achievements. However, through Endorsement of
combined efforts in capacity building and use of indigenous energy resources available
domestically in the country will help address socio-economic development issues directly and
indirectly towards achievement of MDGS goals and sustainable hierarchy in the region.
Shortages, routine cut outs and black outs of energy in the country, compounded by high
electricity tariff threaten to ruin the government’s strategy to improve and harness energy
access to the population for sustainable socio-economic development .Therefore, for a
sustainable socio-economic growth in the region, energy strategic policy and energy sector
working group should be strengthened. A policy framework to diversifying and explore
renewable energies domestically available around the country (i.e. Pico and micro hydropower
potentials, geothermal, biomass wind and solar potentials) hence managing effectively and
efficiently the supply and cost reflective tariff of electricity to all Rwandans for the achievement
of the goals set.
Table 4: The government’s target for the electricity access present and future [2]
Projects Present status (2011) Future Targets (2017)
ACCESS 4900 Km MV and LV;
13 % connections (195.085
connections);
90 % Health Centers;
Additional of 1400 km of MV
and LV length;
50 % connections;
100 % Health Centers;
DSEE 2010/13
Examiner: Torsten FRANSSON
Supervisor: Amir VADEIE
26 % Schools;
90 % Administrative Centers
100 % Schools;
100 % Administrative centers
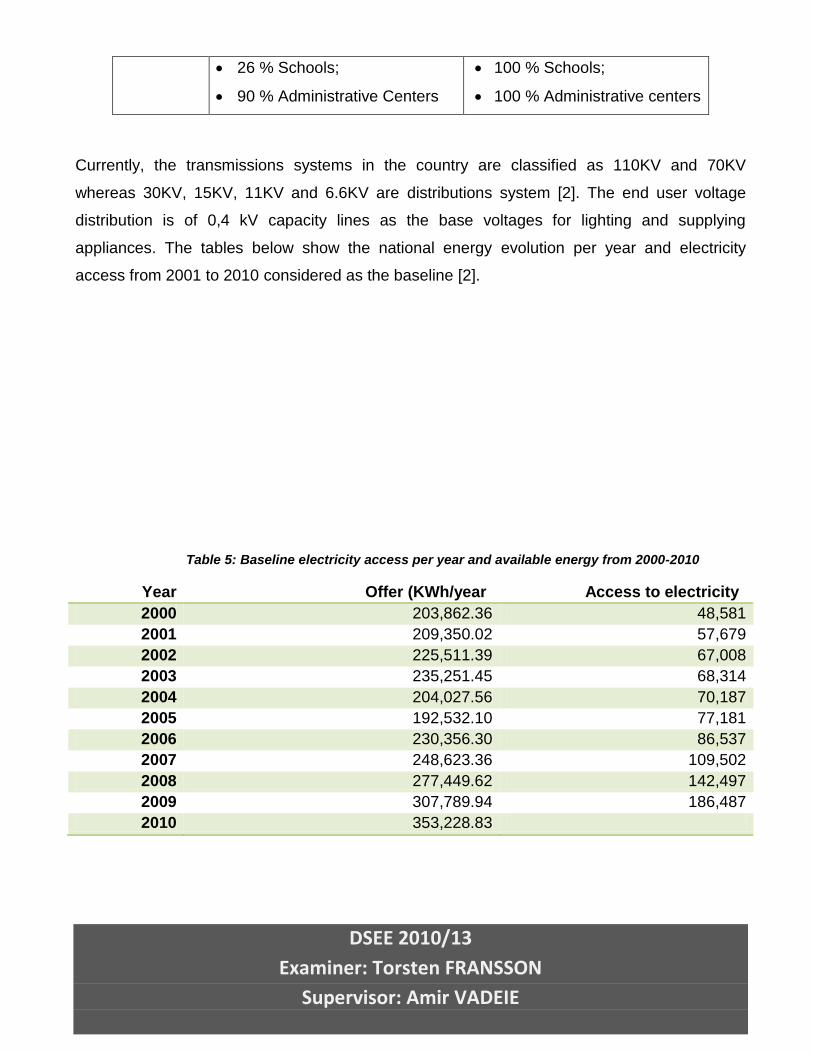
Currently, the transmissions systems in the country are classified as 110KV and 70KV
whereas 30KV, 15KV, 11KV and 6.6KV are distributions system [2]. The end user voltage
distribution is of 0,4 kV capacity lines as the base voltages for lighting and supplying
appliances. The tables below show the national energy evolution per year and electricity
access from 2001 to 2010 considered as the baseline [2].
Table 5: Baseline electricity access per year and available energy from 2000-2010
Year Offer (KWh/year Access to electricity
2000 203,862.36 48,581
2001 209,350.02 57,679
2002 225,511.39 67,008
2003 235,251.45 68,314
2004 204,027.56 70,187
2005 192,532.10 77,181
2006 230,356.30 86,537
2007 248,623.36 109,502
2008 277,449.62 142,497
2009 307,789.94 186,487
2010 353,228.83
DSEE 2010/13
Examiner: Torsten FRANSSON
Supervisor: Amir VADEIE
4. PICO AND MICRO HYDROPOWER IN RWANDA
The energy sector in Rwanda consists of three sub-energy sources (hydrocarbons & new and
renewable sources). Amongst the renewable sources of energy in Rwanda, the following are
the primary sources i.e. hydropower, geothermal, peat, solar and wind. Biomass is the most
dominant and most used for the Rwandan economy.
Energy is the source for economic development. It is therefore known that the current
insufficient and expensive energy supply constitutes a restraining factor to the Rwandan
sustainable development.
This study is performed to emphasise the need for socio-economic growth, environmental
protection, clean development mechanism through use of renewable energies, poverty
reduction, and demand satisfaction in affordability, reliability and sustainability.
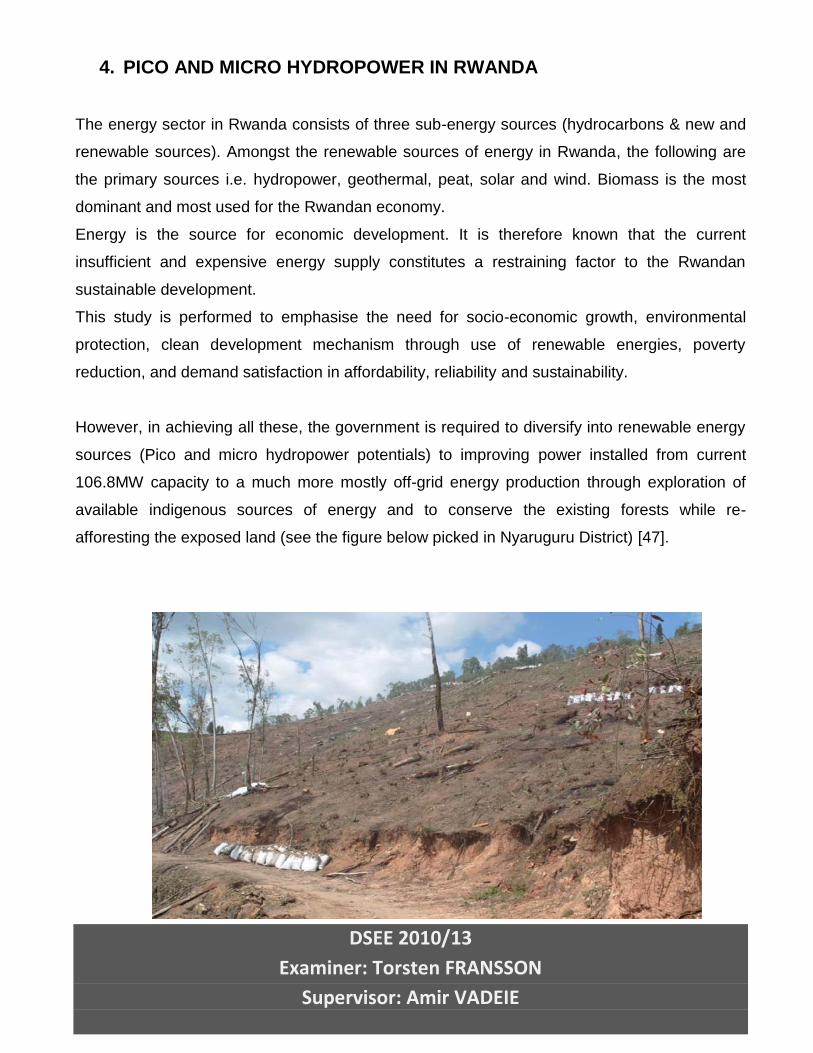
However, in achieving all these, the government is required to diversify into renewable energy
sources (Pico and micro hydropower potentials) to improving power installed from current
106.8MW capacity to a much more mostly off-grid energy production through exploration of
available indigenous sources of energy and to conserve the existing forests while re-
afforesting the exposed land (see the figure below picked in Nyaruguru District) [47].
DSEE 2010/13
Examiner: Torsten FRANSSON
Supervisor: Amir VADEIE
Figure 10: Deforestation (trees cut for charcoal) in Nyaruguru district
4.1. Off-Grid Electrification
Energy demands are increasing worldwide and particularly in Rwanda. Rising fuel costs
around 97,517,100$ per year including staff welfare and working facilitations for all six (6)
thermal power plants that contributes 47.8MW capacity of the available power (48.58%) with in
Rwanda country and concerns over climate change due to pollutions have prompted interest in
replacing thermal power operations through exploration of existing renewable sources. (I.e.
development of micro hydropower potentials available) [24]. The Rwandan provisional results
of 4th population and housing census show a total resident of 10, 537,222 by 2012 [24]. While
comparing with the census number of 2002 of 8,128,553, the number increased by 2,408,669
people and an average annual growth of 2.6% dominated in rural areas which largely not
powered by electricity [24].
Based on the provisional outcomes during the year 2012, the eastern province which is reach
at solar radiation has the highest population of about 2,600,814 people followed by the
southern and western provinces that are also among the provinces in the country that are
reach in hydropower potentials springing from Nyungwe national forest with a population of
2,594,428 and 2.476,943 and Kigali the least populated with 1,135,428 people and largely
connected.
The average annual growth rate of Rwanda among Africa is the highest with 2.6% by 2012 and
its highest growth rate is in the Eastern province with 4.3%, southern province with 1.9%,
Kigali with 4.0%, western province with 2.1% and the Northern Province growth rate with 1.0%
as the lowest [24].
Rwanda energy sector and policy makers, private investors and independent power producers
will be guided through to invest in power generation from renewable energy sources scattered
DSEE 2010/13
Examiner: Torsten FRANSSON
Supervisor: Amir VADEIE
remote off-grid all over the country. The term used in this paper is Pico and micro hydropower
which are easily applied to sites ranging from a small scheme to develop few kilowatts to
electrify hundreds villages and or injected into the network [42].
Designing of selected based small power plant procedures include the following parameters;
- The basic concepts of generating power from water
- Accessing and Reconnaissance survey
- The different components of a hydropower plant/scheme
- The principle steps in developing a micro hydropower project
- The choice of technology involved
- Socio-economic and cost benefit analysis
- Environmental impact assessment
- Market and transportation
- Etc.
4.1.1. Why use Pico and micro hydropower potentials of energy.
Small hydropower potentials are the most significant and economically viable in solving
electricity shortage and improvement of access to electricity. Since Rwanda is amongst
countries of lowest access to electricity, rural electrification based on the project target would
play a great role in electrifying a number of households off-grid in rural areas. The technology
is comparatively simple and environmentally friend relative to other technologies for different
sources of energy.
The following are the critical significant advantages of exploring small hydropower
technologies than any other source of energy [24];
- High efficiency ranging between 75-98% based on all power production technologies
- This type of technology has the highest capacity factor that is greater than 50% in
relation to the 10% solar and 30% wind.
- Hydropower plants produce electricity annually with predictable varying productions.
- The output of the plant varies gradually on a per day basis or monthly which is different
for wind and solar that change instantaneously sometimes on time.
DSEE 2010/13
Examiner: Torsten FRANSSON
Supervisor: Amir VADEIE
- Proportional supply and demand management during peak and shortage hours.
- Hydropower systems are strong and can last longer for more than 30 years with
minimum costs of operation and maintenance.
- Being a carbon free energy system, the technology is environmentally friend to the
global and surrounding ecosystems.
- It is a good source of power to disperse and harness supply and management of power
for socio-economic development in the country and especially in rural areas off-grid.
Nevertheless, the preferable small hydropower technology based on the reconnaissance study
investigations carried out and on the geographical nature of the region is a Run-of-River
scheme.
5. SITES RECONNAISANCE/ PRE-LIMINARY INVESTIGATION. “CASE OF
Nyaruguru & NYAMAGABE DISTRICTS”:
In a determination to manage the study as practical as possible, 9 sites in Nyaruguru and
Nyamagabe districts were chosen for investigation study. From the reconnaissance of these
sites, observations were drawn about other potential sites around the country about the
availability of stream water based systems in general. The technology (i.e. run-of-River
scheme) to develop practical micro hydropower potentials above 100kw is well estimated and
widely available [25]. Familiarizing this technology to link with the existing micro hydropower
potentials off-grid was found to involve considerable solution for energy supply and sustainable
development in rural areas and to harness power in the country to all.
5.1. Districts Background
5.1.1. NYARUGURU DISTRICT
Nyaruguru is one of the districts located from the south eastern parts of the country that make
up 8 Districts with a surface area of 1010km2 and a population density of 300,000 scattered all
over the district. This District consists of 14 sectors that are broken down into 72 cells and 332
villages (Imidugudu).
DSEE 2010/13
Examiner: Torsten FRANSSON
Supervisor: Amir VADEIE
Nyaruguru District is bordered by Gisagara in the east, Nyamagabe and Huye in the north and
in the west by the Government of the Republic of Burundi.
The relief of Nyaruguru ranges between 1600m and 1800m of altitude and its average rainfall
is around 1200mm with the temperature average of more or less that 20oC [25].
Nyaruguru District is made up of hilly, scattered mountainous hills with aspects of peaks
chained by IBISI Mountains located in the former sectors of Gishavu, Runyinya and Nyakizu
that naturally experience flow streams of water (rivers). This sequence of foothills is only a
branch of the Congo-Nile Peaks along bottom neck of Nyungwe forest that produce several
springs and water streams.
Amongst the households, schools, health centers and administrative buildings, one secondary
school, 6 health centres, 3 administrative bureaus and 12 individual’s houses are electrified by
solar energy for lighting and other small consuming appliances [25]. However, over 14 sectors,
only two sectors are connected to the national grid which still remains a shortage to the
existing demand. The population of Nyaruguru are largely around 98% dependent on biomass
that results in land slide and soil erosion due to deforestation [25]. Access to electricity which
on the hand hinders the socio-economic development and environmental protection can help
the people engage into intermediate technologies that can improve their standards of life and
ensure sustainable development.
Therefore, use of indigenous source of energy such as micro hydropower which are potential
available would help achieving supply management of electricity sustainable economic
development through technology transformation. [25]
5.1.2. NYAMGABE DSITRICT
This district is located in the southern province bordered by Huye district in the east and
Nyamasheke district in the south. It captures large part of Nyungwe forest and former
Gikongoro district that are good at tourism features. This thick forest is the last remaining in the
country where you can find variety of species of which tourists like and has 17 sectors.

DSEE 2010/13
Examiner: Torsten FRANSSON
Supervisor: Amir VADEIE
Formal education in the district is carried on ordinary, primary and secondary schools levels.
The district also has literacy teaching centers that make people learn how to read and write.
Nyamagabe District has got about 220 primary schools amongst most of which are private
schools and Children who manage schooling in the district are about 7,286 that are made up of
3,571 boys and 3,715 girls. The starting age of children at school is at 3-5 years range.
The average number of students is about 33 pupils in a class and the academic year according
to the government policy for formal education is nine months that is split into 3 trimesters.
Amongst 263 teachers, 53 are men and 210 are women and almost all of them are eligible and
qualified for their duties. They are some who work on a casual payment by the parents.
Due to lack of enough room, some of students do take their lessons in borrowed buildings
such as churches, local authority’s rooms and privately owned buildings. Etc. Mostly these
areas are located off-grid and in remote areas, therefore, they do experience a shortage of
power, clean water, toilets resulting in poor sanitation and social welfare.
There is need to encourage foreign investors to invest in the energy business especially in the
development of micro hydropower potentials to electrify the off-grid households, schools,
health centers, administrative offices and power the small coffee and tea processing factories
in the region. Enhance agricultural transformation technology into other forms of products such
as fertilizers through manual decomposition, heat through combustion for cooking to conserve
the forests, quality products from the soil fertility. There is also need to encourage the
population to use locally simple methods of technologies in order to increase their productivity
and hence improve their standards of living.
Its target gives the high cost of imported oil products, there is a need to fully exploit the
available indigenous energy resources (Pico and micro hydropower) potentials spread all over
the country to the extent that they are financially, economically and socially beneficial and
environmentally friendly.
DSEE 2010/13
Examiner: Torsten FRANSSON
Supervisor: Amir VADEIE
Use efficient technologies from the best use of available energy sources (micro hydropower
potentials) to enhance Energy supply in remote far from the national grid and optimise energy
efficiency and Conservation to manage energy supplies and reduce environmental impacts.
Develop cost-reflective energy prices based on the strategic Energy pricing and subsidy
policies (REFIT) making necessary investments to expand power supply in remote off-grid.
Direct subsidies to one-time capital expenditures rather than to recurrent costs, and provide all
subsidies in a transparent manner. [26]
5.2. Sites Studies procedures
Despite the fact of the survey, this work design includes the findings obtained in the defined
formats for different studies and specific details for each of sites studied and the following are
the key components that make up full report. Reconnaissance study or preliminary design
Pre-feasibility design
Feasibility design
The feasibility study design will be conducted by anybody else interested in generating power
following the presented run-of- River technology in this report.
5.3. Pre- Feasibility Studies procedures
This study focuses on identifying and evaluating nine (9) micro hydropower potential sites
located in Nyaruguru and Nyamagabe districts that have both high topographic relief and
large catchment areas that may be promising for hydroelectric development. The study is
structured to assist decision makers and IPPs in determining whether micro hydropower sites
are viable and feasible resources for small-scale, distributed power generation and or on-grid.
The engineering solutions provided herein are based on the best-available information and
were derived solely for the purpose of assessing feasibility. More precise data collection and
analysis should follow the decision to develop any specific site.
DSEE 2010/13
Examiner: Torsten FRANSSON
Supervisor: Amir VADEIE
From this evaluation, conclusion about other potential sites within the country and about the
viability of stream water-based micro hydropower potentials is drawn in general. Through these
efforts, we seek to answer four basic questions:
1) How much energy is there falling down the headlands of Rwanda country in the form of run-
of-rivers?
2) How much of this energy can be harnessed for electrical generation in the country?
3) What is the preferred strategic method to be engaged in rural areas to improve accessibility
of electricity in the country?
4) Is it practical and cost-effective to develop micro hydropower resources in the country?
The first question is strictly theoretical. It attends to compute the energy of the resource without
regard for how it might be captured. Is there a lot of energy present or only a little?
The answer places a magnitude on the resource so that we can estimate the benefits of
developing these sources of energy.
The second question considers the restrictions and limitations of practical systems. Out of the
total energy available, only portion can be taken for use. How much is the energy?
Next question explores resolutions considering existing technology. Although the field of micro-
hydro is continually evolving, with new products being developed all the time, every effort has
been made to encompass resolutions that effects or have a high probability of success.
The fourth question tries to place the proposal within a framework that decision makers can
use to assess its viability. Cost ration and economic benefit is central to this process, but still
has not to be the lone basis for a decision. Less quantifiable factors such as personal values,
community involvement and education should also be considered [24].
DSEE 2010/13
Examiner: Torsten FRANSSON
Supervisor: Amir VADEIE
5.3.1. Hydrological analysis
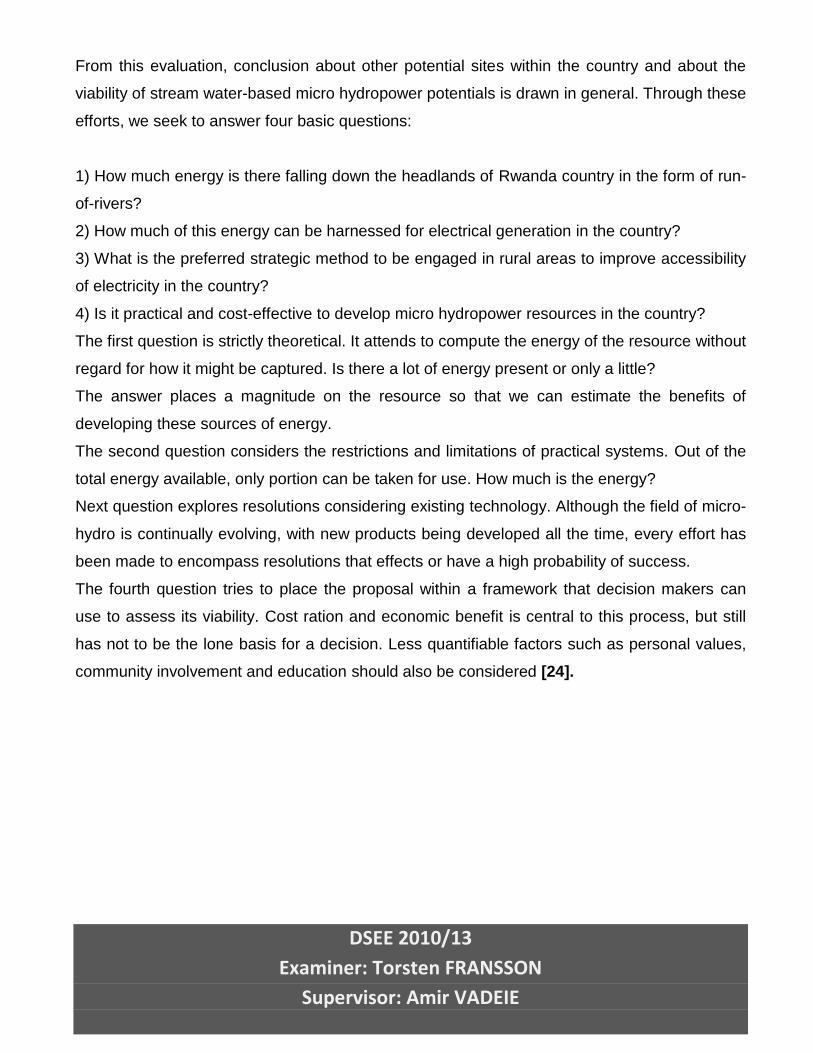
The Government of Rwanda, through Mininfra
developed a micro-hydro Atlas that provides an
account of all hydro ranging from Pico, micro and
mini hydropower potential sites in the country [1].
Mininfra directly and through the associated
private sector developed some pre and feasibility
studies for some of the micro hydro sites in order
to develop them for electricity production of which
due to poor feasibility studies have gone long to
operate.
Figure 11: Umunywanzuki hydropower stream upstream.
While carrying out Micro hydropower potentials identification and investigation, a number of sites
in the south eastern and western part of the country in sites investigations and power
estimations derived from the estimated discharge and head were calculated taking into account
the topographical, geographical and geological nature of the land along the overall scheme of
each site in Nyaruguru and Nyamagabe district.
During the time of investigation, public communication was also conducted with the aim of
understanding which benefits the population around would achieve from electricity generated.
In this case the existing network was also traced in case if the capacity exceeds the demand,
power generated may be injected into the grid.
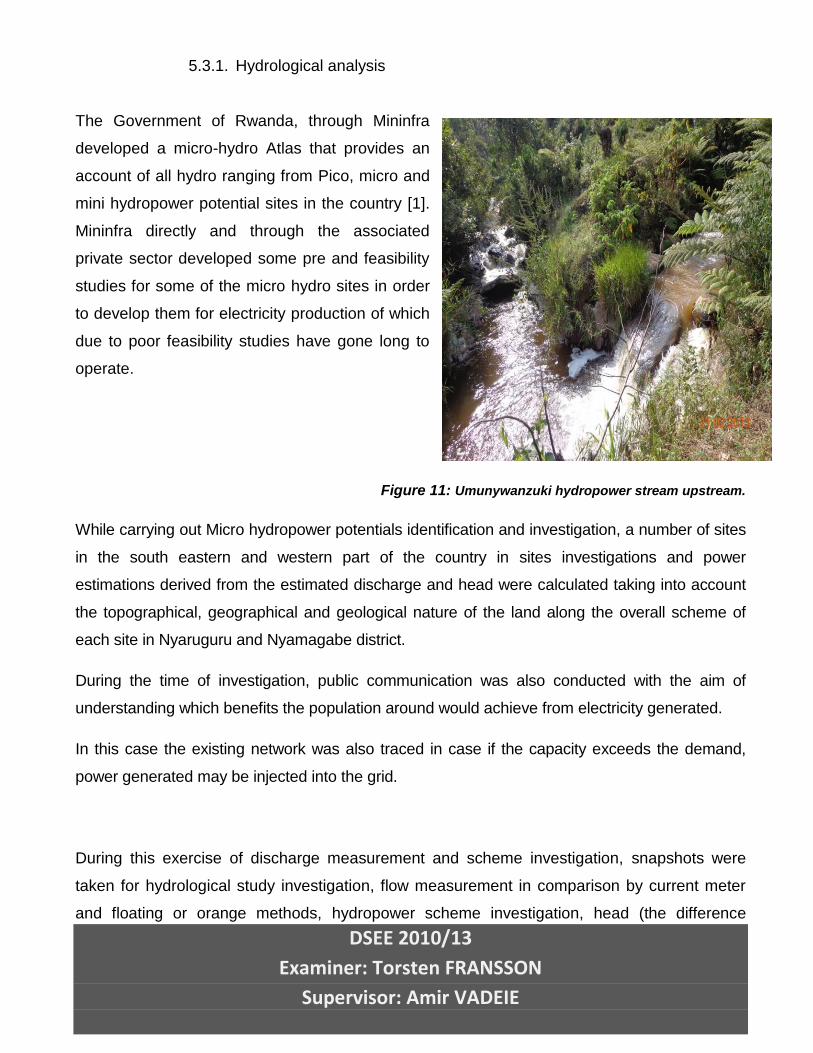
During this exercise of discharge measurement and scheme investigation, snapshots were
taken for hydrological study investigation, flow measurement in comparison by current meter
and floating or orange methods, hydropower scheme investigation, head (the difference
DSEE 2010/13
Examiner: Torsten FRANSSON
Supervisor: Amir VADEIE
between the upstream altitude (intake) and the downstream altitude value (power house
location), geological survey, environmental impact and socio-economic impacts was conducted
and flow discharge and power calculations estimated following all equations and conditions.
Figure 12: Investigation survey pictures
The above figures depicts the flow measurement by current meter method (1), the hydropower
scheme upstream to the intake location (2), socio-economic benefit/expropriation (3), and the
downstream the scheme where the power house was proposed (4) and geological survey (5).
5.3.2. Environmental impact assessment
Rwanda being at high elevation, it makes its climate temperate. The relief patterns of Rwanda
give its climate to be cool due to the influence of altitudes. Average annual temperature is
about 18.5°C and average rainfall range is 1250mm per year [18]. The maximum and minimum
Temperature values do not vary much during the year, while precipitation could vary
significantly and the rainfall patterns are characterized by four seasons, small rainy season
and longer season with the intermediate dry seasons between these two rainy seasons.
DSEE 2010/13
Examiner: Torsten FRANSSON
Supervisor: Amir VADEIE
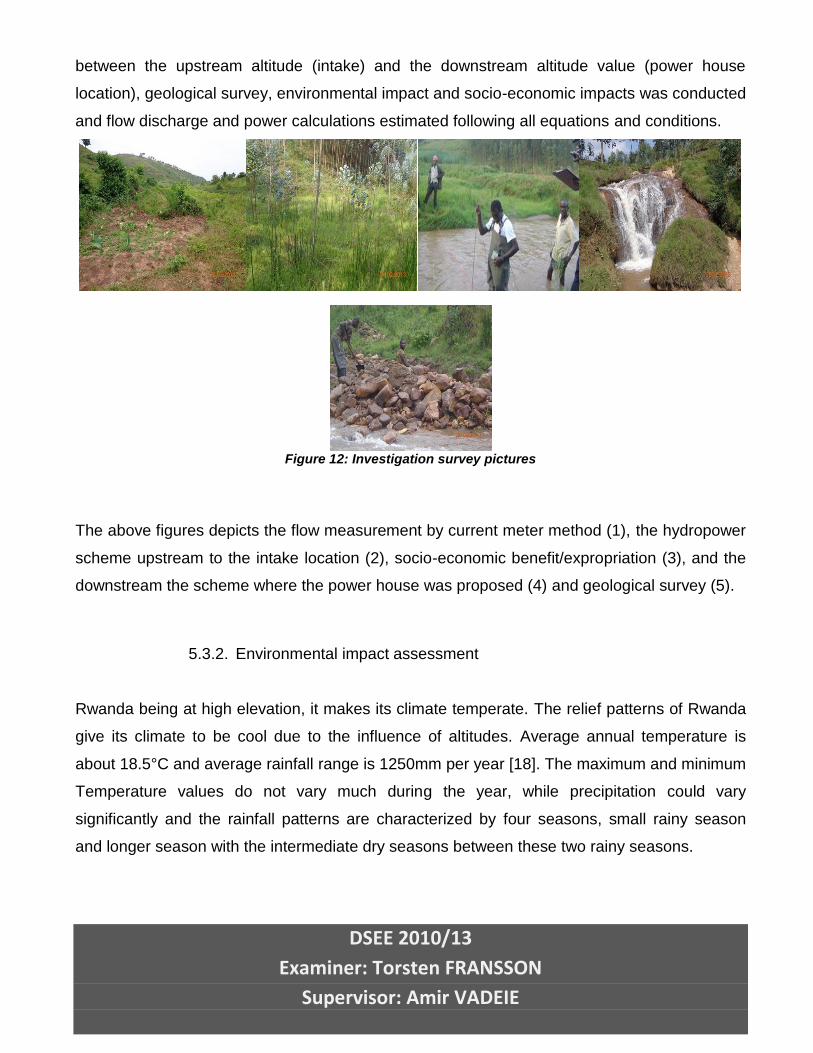
For Nyaruguru region the average annual temperature is 20.2°C. Maximum temperatures
range between 22.9°C and 27.8°C with an average value of 25.5°C, while minimum
temperatures vary between 12.5°C and 16.9°C with an average value of 14.9°C [19].
Figure 13: Monthly minimum, maximum and average temperatures for Nyaruguru weather station (1700 m a. s. l.) [19].
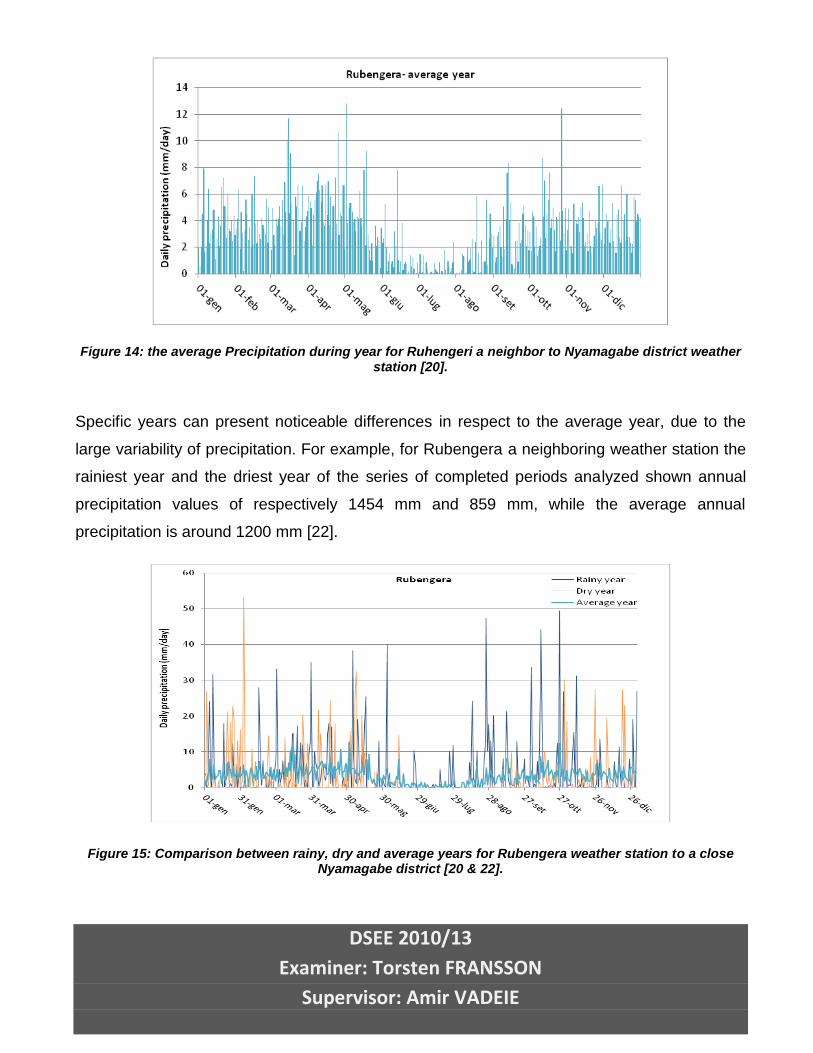
Average annual rainfall for Rubengera region is around 1200 mm per year [19]. Seasonal
trends in precipitation are pretty evident: rainfall is quite abundant for several months, from
September until May, while the driest month is July. Rainfall maximum values are registered
for only four month in a year [19].
DSEE 2010/13
Examiner: Torsten FRANSSON
Supervisor: Amir VADEIE
Figure 14: the average Precipitation during year for Ruhengeri a neighbor to Nyamagabe district weather station [20].
Specific years can present noticeable differences in respect to the average year, due to the
large variability of precipitation. For example, for Rubengera a neighboring weather station the
rainiest year and the driest year of the series of completed periods analyzed shown annual
precipitation values of respectively 1454 mm and 859 mm, while the average annual
precipitation is around 1200 mm [22].
Figure 15: Comparison between rainy, dry and average years for Rubengera weather station to a close Nyamagabe district [20 & 22].
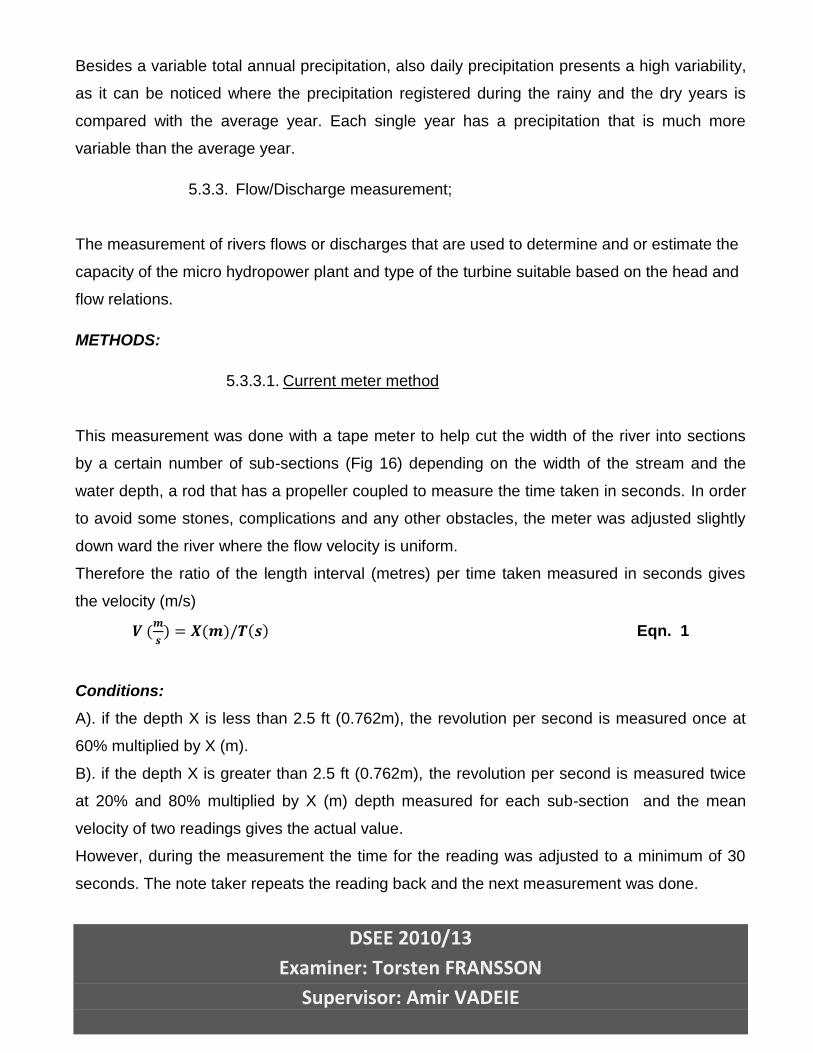
DSEE 2010/13
Examiner: Torsten FRANSSON
Supervisor: Amir VADEIE
Besides a variable total annual precipitation, also daily precipitation presents a high variability,
as it can be noticed where the precipitation registered during the rainy and the dry years is
compared with the average year. Each single year has a precipitation that is much more
variable than the average year.
5.3.3. Flow/Discharge measurement;
The measurement of rivers flows or discharges that are used to determine and or estimate the
capacity of the micro hydropower plant and type of the turbine suitable based on the head and
flow relations.
METHODS:
5.3.3.1. Current meter method
This measurement was done with a tape meter to help cut the width of the river into sections
by a certain number of sub-sections (Fig 16) depending on the width of the stream and the
water depth, a rod that has a propeller coupled to measure the time taken in seconds. In order
to avoid some stones, complications and any other obstacles, the meter was adjusted slightly
down ward the river where the flow velocity is uniform.
Therefore the ratio of the length interval (metres) per time taken measured in seconds gives
the velocity (m/s)
Eqn. 1
Conditions:
A). if the depth X is less than 2.5 ft (0.762m), the revolution per second is measured once at
60% multiplied by X (m).
B). if the depth X is greater than 2.5 ft (0.762m), the revolution per second is measured twice
at 20% and 80% multiplied by X (m) depth measured for each sub-section and the mean
velocity of two readings gives the actual value.
However, during the measurement the time for the reading was adjusted to a minimum of 30
seconds. The note taker repeats the reading back and the next measurement was done.
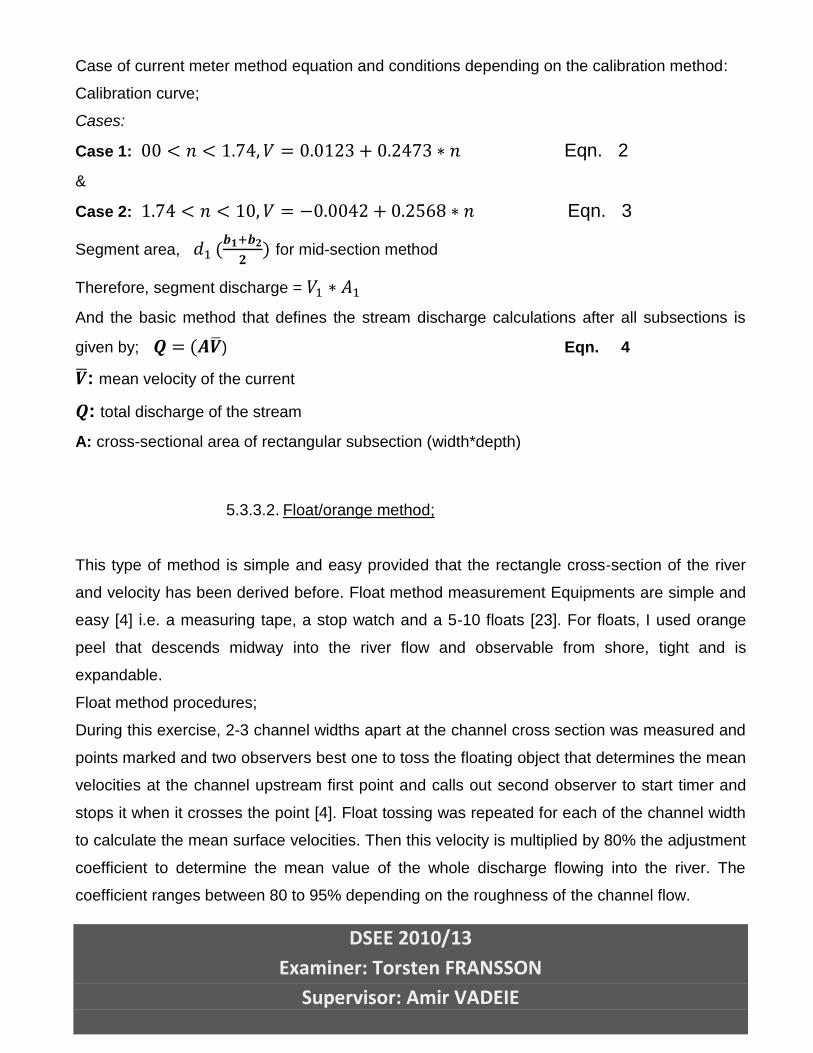
DSEE 2010/13
Examiner: Torsten FRANSSON
Supervisor: Amir VADEIE
Case of current meter method equation and conditions depending on the calibration method:
Calibration curve;
Cases:
Case 1: Eqn. 2
&
Case 2: Eqn. 3
Segment area,
for mid-section method
Therefore, segment discharge =
And the basic method that defines the stream discharge calculations after all subsections is
given by; ) Eqn. 4
: mean velocity of the current
: total discharge of the stream
A: cross-sectional area of rectangular subsection (width*depth)
5.3.3.2. Float/orange method;
This type of method is simple and easy provided that the rectangle cross-section of the river
and velocity has been derived before. Float method measurement Equipments are simple and
easy [4] i.e. a measuring tape, a stop watch and a 5-10 floats [23]. For floats, I used orange
peel that descends midway into the river flow and observable from shore, tight and is
expandable.
Float method procedures;
During this exercise, 2-3 channel widths apart at the channel cross section was measured and
points marked and two observers best one to toss the floating object that determines the mean
velocities at the channel upstream first point and calls out second observer to start timer and
stops it when it crosses the point [4]. Float tossing was repeated for each of the channel width
to calculate the mean surface velocities. Then this velocity is multiplied by 80% the adjustment
coefficient to determine the mean value of the whole discharge flowing into the river. The
coefficient ranges between 80 to 95% depending on the roughness of the channel flow.
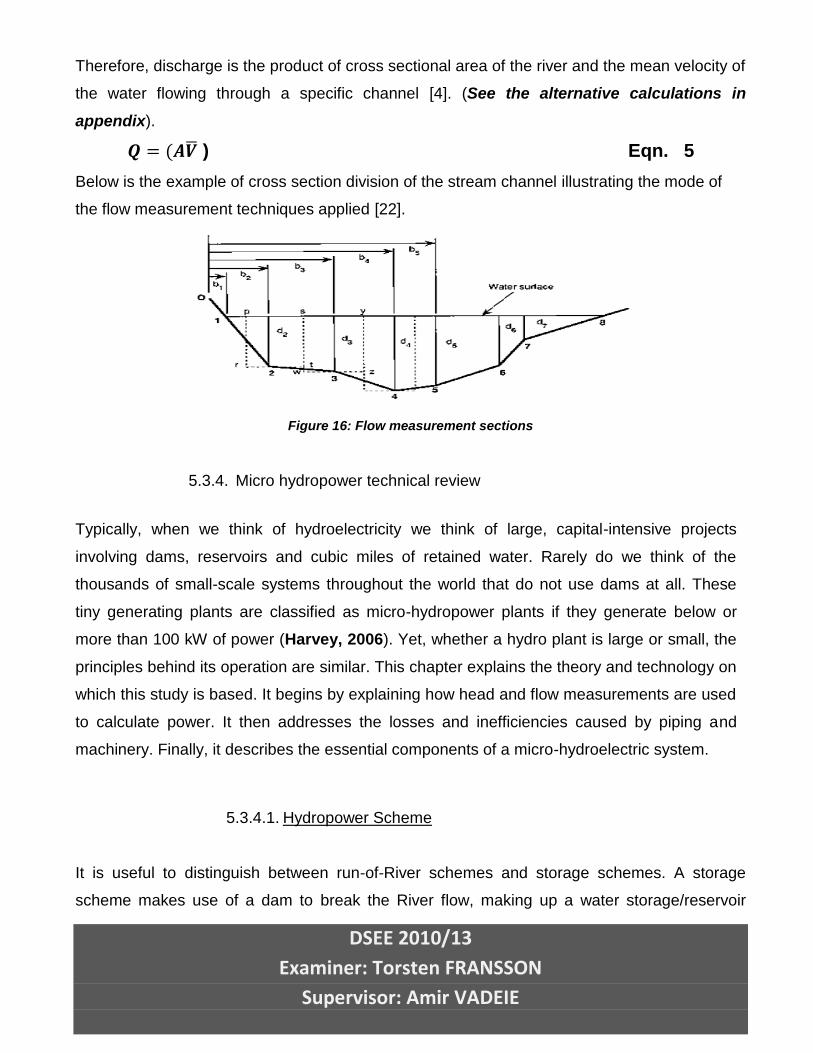
DSEE 2010/13
Examiner: Torsten FRANSSON
Supervisor: Amir VADEIE
Therefore, discharge is the product of cross sectional area of the river and the mean velocity of
the water flowing through a specific channel [4]. (See the alternative calculations in
appendix).
) Eqn. 5
Below is the example of cross section division of the stream channel illustrating the mode of
the flow measurement techniques applied [22].
Figure 16: Flow measurement sections
5.3.4. Micro hydropower technical review
Typically, when we think of hydroelectricity we think of large, capital-intensive projects
involving dams, reservoirs and cubic miles of retained water. Rarely do we think of the
thousands of small-scale systems throughout the world that do not use dams at all. These
tiny generating plants are classified as micro-hydropower plants if they generate below or
more than 100 kW of power (Harvey, 2006). Yet, whether a hydro plant is large or small, the
principles behind its operation are similar. This chapter explains the theory and technology on
which this study is based. It begins by explaining how head and flow measurements are used
to calculate power. It then addresses the losses and inefficiencies caused by piping and
machinery. Finally, it describes the essential components of a micro-hydroelectric system.
5.3.4.1. Hydropower Scheme
It is useful to distinguish between run-of-River schemes and storage schemes. A storage
scheme makes use of a dam to break the River flow, making up a water storage/reservoir

DSEE 2010/13
Examiner: Torsten FRANSSON
Supervisor: Amir VADEIE
behind the wall/dam. The flow is then released through the piping to the turbine when power is
needed. The advantage of this technology is that rainfall can accumulate during the wet
season of the year and then release power during some or all of the drier periods of the year.
A run-of-River schemes does not stop the river flow, but instead diverts parts of the river flow
into a channel (headrace channel) and pipe and then through a turbine to produce mechanical
power which further converted using an alternator into useful energy (hydroelectric power) see
the figure below illustrating a run-of-River scheme.
Figure 17: Run-of-River Micro hydropower scheme
DSEE 2010/13
Examiner: Torsten FRANSSON
Supervisor: Amir VADEIE
6. Figure 18: head is the difference between forebay position and tailrace of the scheme [13].
6.1.1.1. Head and Flow analysis
Whenever water flows from a higher elevation to a lower elevation there is the potential to
harness that energy to do useful work. The energy available in the water is a function of two
variables: the head and the flow-rate. The head is the vertical distance through which the
water can be made to fall. It is typically measured in units of metres. The discharge or flow is
the amount of water flowing over fixed points of the channel in a specific time [22] and is
measured in cubic metre per second (m3/s) (see fig. 16-11above). Both head and flow-rate
contribute equally to the energy of a stream. The greater the volume of water and the higher
up it is, the more energy it generates. A small stream with a large vertical drop can supply the
same amount of energy as a much larger stream with a very slight drop. It is the interaction of
head and flow-rate that determines power. For this reason, Nyaruguru and Nyamagabe
districts, with their impressive vertical drops can potentially generate useful amounts of power
using relatively small volumes of water ( see the figure and relation below);
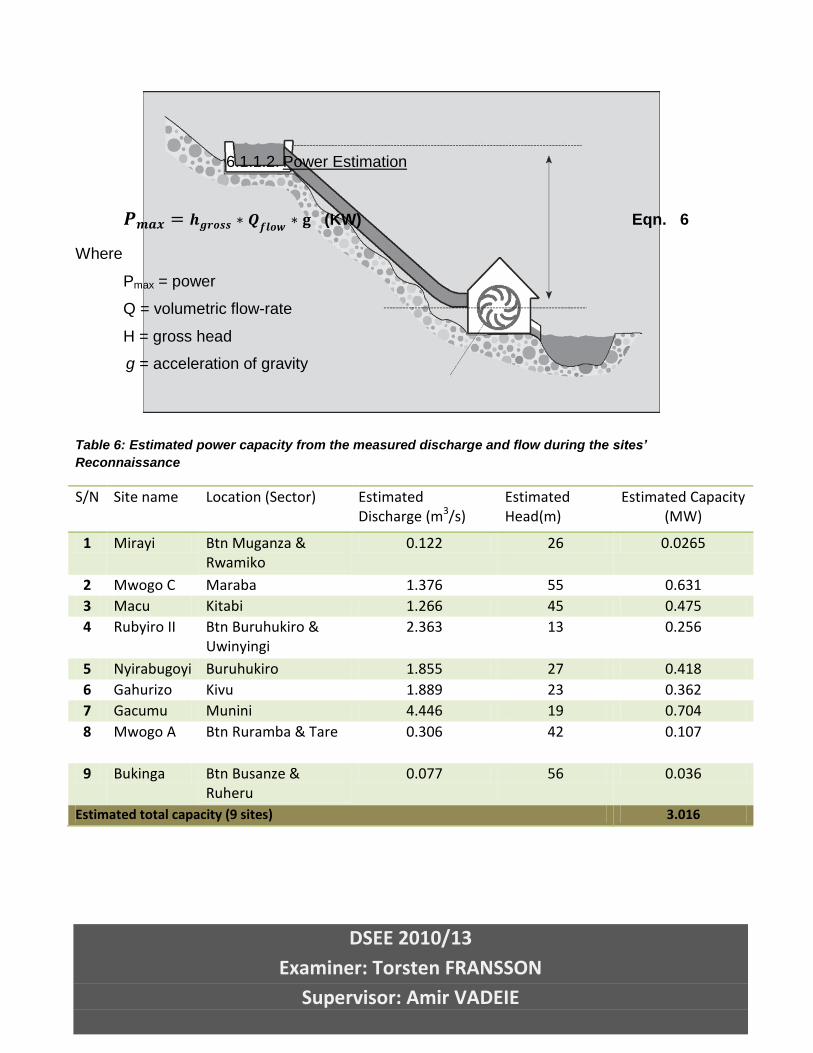
DSEE 2010/13
Examiner: Torsten FRANSSON
Supervisor: Amir VADEIE
6.1.1.2. Power Estimation
(KW) Eqn. 6
Where
Pmax = power
Q = volumetric flow-rate
H = gross head
g = acceleration of gravity
Table 6: Estimated power capacity from the measured discharge and flow during the sites’
Reconnaissance
S/N Site name Location (Sector) Estimated Discharge (m3/s)
Estimated Head(m)
Estimated Capacity (MW)
1 Mirayi Btn Muganza & Rwamiko
0.122 26 0.0265
2 Mwogo C Maraba 1.376 55 0.631
3 Macu Kitabi 1.266 45 0.475
4 Rubyiro II Btn Buruhukiro & Uwinyingi
2.363 13 0.256
5 Nyirabugoyi Buruhukiro 1.855 27 0.418
6 Gahurizo Kivu 1.889 23 0.362
7 Gacumu Munini 4.446 19 0.704
8 Mwogo A Btn Ruramba & Tare 0.306 42 0.107
9 Bukinga Btn Busanze & Ruheru
0.077 56 0.036
Estimated total capacity (9 sites) 3.016
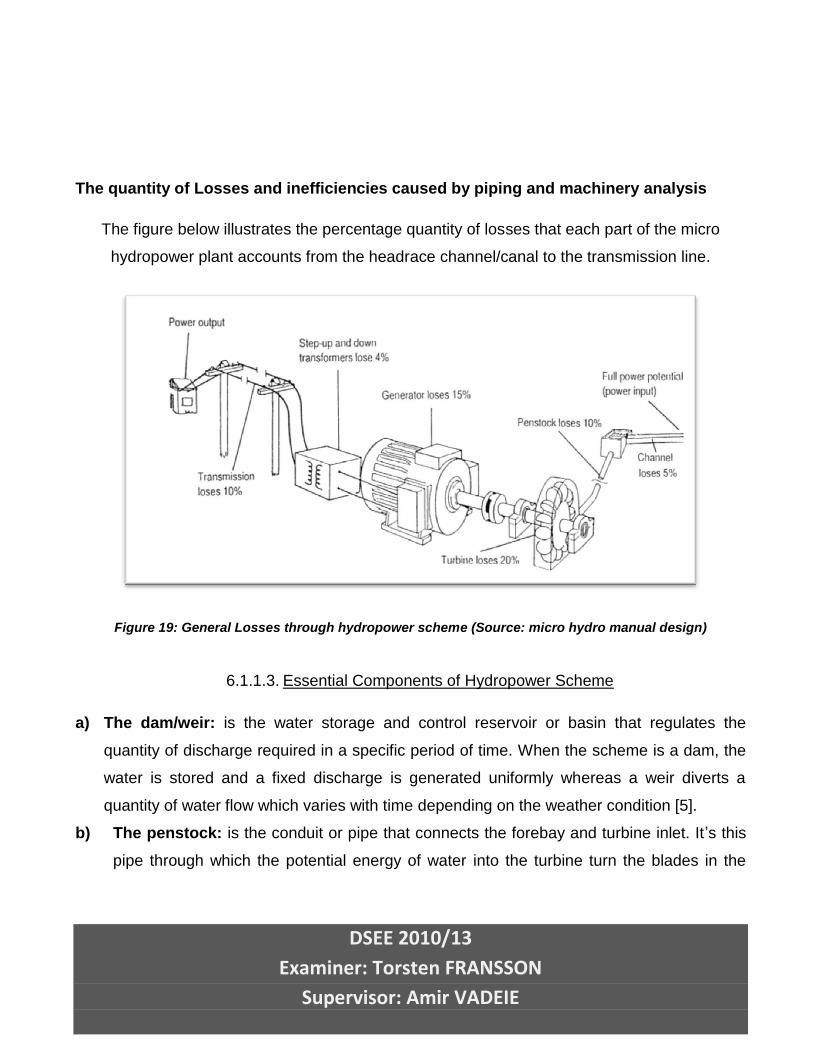
DSEE 2010/13
Examiner: Torsten FRANSSON
Supervisor: Amir VADEIE
The quantity of Losses and inefficiencies caused by piping and machinery analysis
The figure below illustrates the percentage quantity of losses that each part of the micro
hydropower plant accounts from the headrace channel/canal to the transmission line.
Figure 19: General Losses through hydropower scheme (Source: micro hydro manual design)
6.1.1.3. Essential Components of Hydropower Scheme
a) The dam/weir: is the water storage and control reservoir or basin that regulates the
quantity of discharge required in a specific period of time. When the scheme is a dam, the
water is stored and a fixed discharge is generated uniformly whereas a weir diverts a
quantity of water flow which varies with time depending on the weather condition [5].
b) The penstock: is the conduit or pipe that connects the forebay and turbine inlet. It’s this
pipe through which the potential energy of water into the turbine turn the blades in the
DSEE 2010/13
Examiner: Torsten FRANSSON
Supervisor: Amir VADEIE
direction of force that is converted into kinetic energy to mechanical power across the
shaft [5].
c) The turbine: is mechanical equipment that is made of blades, gates and casing into which
the kinetic energy due to rotating blades is developed. With the shaft coupled directly to
the turbine, the kinetic energy is converted into mechanical energy [5].
d) The generator: is an electrical machine made of rotor and stator into which due to
magnetic fields the mechanical energy generated by the shaft is converted into electrical
power for transformation and transmission to the grid [5].
e) The power house: is the shelter house built downstream the penstock that covers all
electrical and mechanical equipments of the scheme and power control kits [16].
f) Power line: is the path through which by means of cables the electric power developed by
the generator flows to different points with in the line of the network. High voltage is
stepped down through a lower transformer before supplied to the load [5].
However, after the turbine, the water flow is released through an outlet pipe called the tailrace
back to the river downstream of the power house.
6.1.1.4. Turbine technology
Selection of the appropriate turbine technology
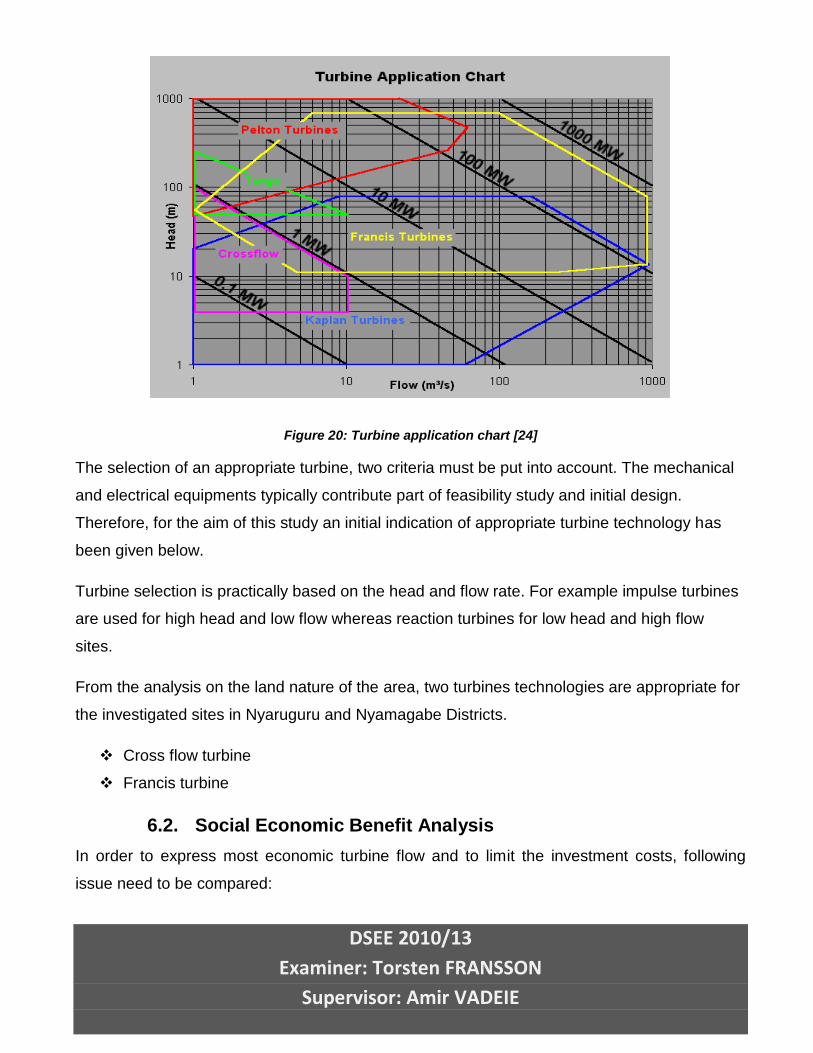
DSEE 2010/13
Examiner: Torsten FRANSSON
Supervisor: Amir VADEIE
Figure 20: Turbine application chart [24]
The selection of an appropriate turbine, two criteria must be put into account. The mechanical
and electrical equipments typically contribute part of feasibility study and initial design.
Therefore, for the aim of this study an initial indication of appropriate turbine technology has
been given below.
Turbine selection is practically based on the head and flow rate. For example impulse turbines
are used for high head and low flow whereas reaction turbines for low head and high flow
sites.
From the analysis on the land nature of the area, two turbines technologies are appropriate for
the investigated sites in Nyaruguru and Nyamagabe Districts.
Cross flow turbine
Francis turbine
6.2. Social Economic Benefit Analysis
In order to express most economic turbine flow and to limit the investment costs, following
issue need to be compared:
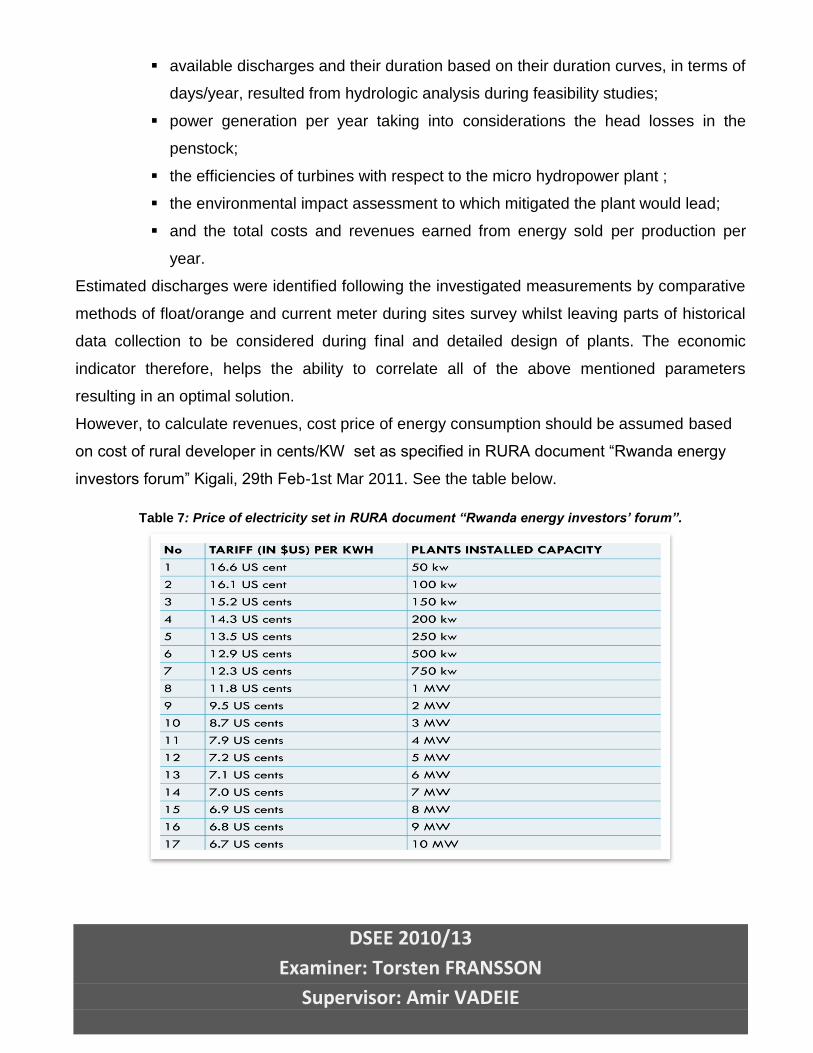
DSEE 2010/13
Examiner: Torsten FRANSSON
Supervisor: Amir VADEIE
available discharges and their duration based on their duration curves, in terms of
days/year, resulted from hydrologic analysis during feasibility studies;
power generation per year taking into considerations the head losses in the
penstock;
the efficiencies of turbines with respect to the micro hydropower plant ;
the environmental impact assessment to which mitigated the plant would lead;
and the total costs and revenues earned from energy sold per production per
year.
Estimated discharges were identified following the investigated measurements by comparative
methods of float/orange and current meter during sites survey whilst leaving parts of historical
data collection to be considered during final and detailed design of plants. The economic
indicator therefore, helps the ability to correlate all of the above mentioned parameters
resulting in an optimal solution.
However, to calculate revenues, cost price of energy consumption should be assumed based
on cost of rural developer in cents/KW set as specified in RURA document “Rwanda energy
investors forum” Kigali, 29th Feb-1st Mar 2011. See the table below.
Table 7: Price of electricity set in RURA document “Rwanda energy investors’ forum”.
DSEE 2010/13
Examiner: Torsten FRANSSON
Supervisor: Amir VADEIE
6.2.1. Benefits to the community
In general Rwandan people particularly those from near villages to the projects locations, are
the main beneficiaries of the project, there will be in the long run more households/premises be
connected to the either standalone plants or national grid and enough power supply at the
completion of the project;
Hydropower sites will contribute to achieving the government’s developmental goals in
reducing poverty, and improving living standards; this would result in creation of
employment, environmental protection and economic growth.
Hydropower development in the specified areas will contribute to the behavior of the
network while increasing the capacity and electrify the surrounding households.
During construction phase, jobs such as vegetation clearing man power, drivers,
machine operators etc. will be generated for the inhabitants located around sites.
No Power especially in the project area and power shortage will be experienced in
particular areas where subjected to the power sites.
Power security and electricity access in the area will be achieved through micro
hydropower development effecting households, improved education, improved living
standards of women and self-innovativeness through handcrafts and infrastructure
development etc.
6.3. Financial Analysis
The basic purpose of the financial analysis is the assessment of the viability of the envisaged
project. This is the cost benefit analysis [13]. The financial analysis thus serves the appraisal of
the financial performance of the project over its life time. Project profitability usually measured
by the financial internal rate of return (FIRR) and the Net Present Value (NPV). The
benefit/cost ratio (B/C ratio) can also be used as a further criterion for the assessment of the
financial viability of the project [13]. For the calculation of FIRR and NPV, it is sufficient to
compare the project costs with the benefits in a simplified cash flow analysis without
consideration of a financing plan. In order to define “most economic turbine flow” and to limit
the investment costs of plant, following issue were compared:
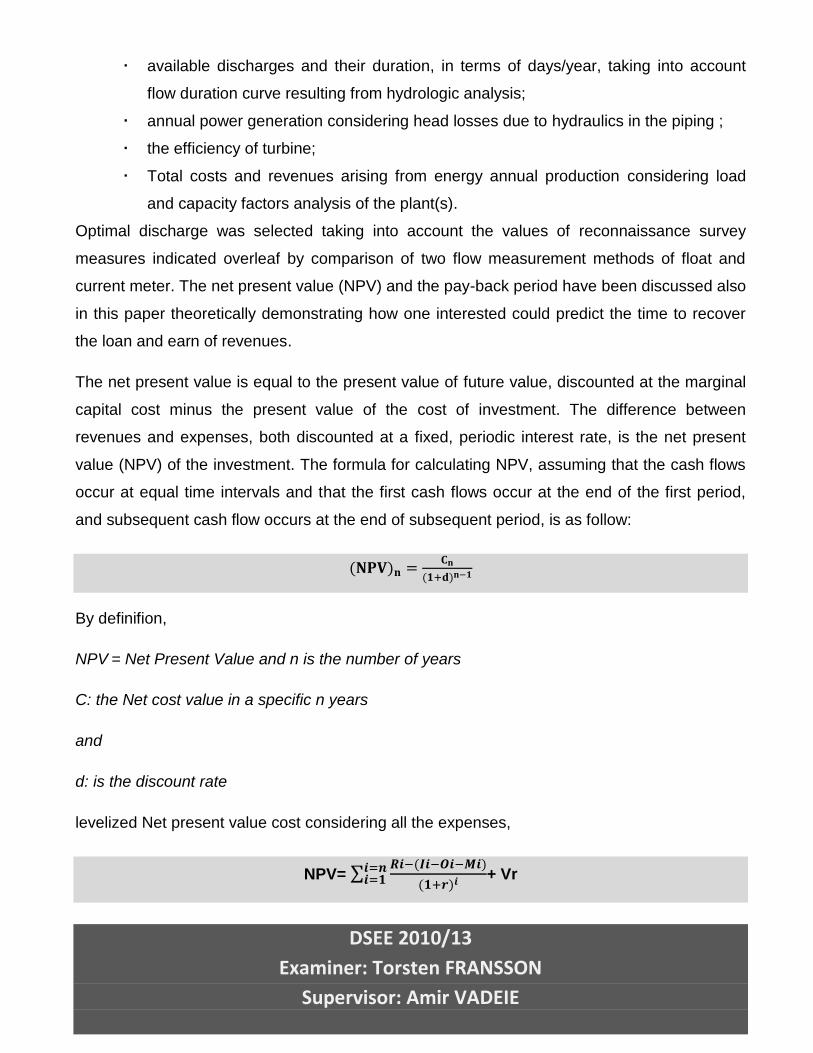
DSEE 2010/13
Examiner: Torsten FRANSSON
Supervisor: Amir VADEIE
available discharges and their duration, in terms of days/year, taking into account
flow duration curve resulting from hydrologic analysis;
annual power generation considering head losses due to hydraulics in the piping ;
the efficiency of turbine;
Total costs and revenues arising from energy annual production considering load
and capacity factors analysis of the plant(s).
Optimal discharge was selected taking into account the values of reconnaissance survey
measures indicated overleaf by comparison of two flow measurement methods of float and
current meter. The net present value (NPV) and the pay-back period have been discussed also
in this paper theoretically demonstrating how one interested could predict the time to recover
the loan and earn of revenues.
The net present value is equal to the present value of future value, discounted at the marginal
capital cost minus the present value of the cost of investment. The difference between
revenues and expenses, both discounted at a fixed, periodic interest rate, is the net present
value (NPV) of the investment. The formula for calculating NPV, assuming that the cash flows
occur at equal time intervals and that the first cash flows occur at the end of the first period,
and subsequent cash flow occurs at the end of subsequent period, is as follow:
By definifion,
NPV = Net Present Value and n is the number of years
C: the Net cost value in a specific n years
and
d: is the discount rate
levelized Net present value cost considering all the expenses,
NPV= ∑
+ Vr
DSEE 2010/13
Examiner: Torsten FRANSSON
Supervisor: Amir VADEIE
where:
Ii= investment in period i;
Ri= revenues in period I;
Oi= operating costs in period I;
Mi= maintenance costs in period I;
Vr: is the plant residue value over its life time (the equipments lasts longer than the plant’s
working time).
r: is the lifetime discount rate of the plant
n: is the time elapsed by the plant in terms of years, quarters and months.
The payback period method determines the number of years required for the invested capital
to be recovered by resulting benefits. The required number of years elapsed to complete loan
payment is termed as the payback period. The calculation is as follow:
Payback period =
Investment costs are usually defined as capital costs spent on the following initially before the
plant operation through civil works, electrical and hydro mechanical equipments while benefits
are the resulting net yearly revenues earned from power selling less the operation and
maintenance costs spent in a certain period of time.
DSEE 2010/13
Examiner: Torsten FRANSSON
Supervisor: Amir VADEIE
7. CONCLUSION & RECOMMENDATION
Based on the results presented from the sites investigation survey of nine micro hydropower
plants in Nyaruguru and Nyamagabe districts, the following conclusions can be made;
- Under considerations of the dominant topographic, geologic, and hydrologic,
infrastructure, environment, and socio-economic boundaries, the hydropower plants are
proven a predicted technically feasible project that offers safe, rational and reliable
project setup.
- Based on the surrounding villages, schools, health centres, commercial centres, local
offices and small scale factories available, projects can generate sufficient cash leading
to acceptable returns but only such tariffs applying are much higher than the foreseen
feed-in-tariffs set by the Regulator.
- Under consideration of the current government’s target of improving energy from the
existing 106.8MW to 486MW by 2017 and incrementing access to electricity from
current 15% to 50% by 2017 and based also on the objective of extending power from
urban to rural areas, the project will help meeting the target if domestic Pico and micro
hydropower sources are well explored.
DSEE 2010/13
Examiner: Torsten FRANSSON
Supervisor: Amir VADEIE
Indeed, the project has many positive socio-economic impacts both locally, regionally, and
nationally.
In order to bring the project into the final feasibility study and EPC stage and to ensure
successful implementation, the following recommendations have to be considered;
- To consider a long duration continuous analysis based on the historic information that
allows having an idea of the average annual behaviour of the site and model seasonal
trends in order to come up with the final objective to define the flow duration curve
which is the base for the design of the hydropower plant.
Finally, development of the micro hydropower plants projects and taking into account the
recommended issues will eventually fulfil safety and reliability in terms of design while reducing
technical risks related to the project and consequently ensure successful implementation.
8. REFERENCES:
1. Ministry of Infrastructure “electricity master plan” (Rwanda)
2. Energy Water and Sanitation Authority (EWSA, Rwanda)
3. Key to sustainable, socio-economic development of Bhutan
4. Renewable Energy in the context of Economic Development, Chapter 9
5. Final report CASCADE MINTS Part 2
6. Designing a sustainable Swiss Energy System” A technological and Institutional
Perspective” 2010
7. Alternative of future energy scenarios for Brazil using an energy mix model
8. Renewable Energy technologies” Long term research in the 6th frame work programme
2002/2006”
9. Rwanda Renewable Energy studies “Grant Number N TF94928-RW”
10. National Energy Policy and Strategies “Kigali, May 2011”
11. Energy for large cities” world energy council study, Cape Town Energy case Study
12. Renewable Energies, (the Greening of the of your Energy Supply)
13. Biomass Energy Strategy BEST-Rwanda
DSEE 2010/13
Examiner: Torsten FRANSSON
Supervisor: Amir VADEIE
14. Scaling Up Renewable Energy in Africa, 12th Ordinary Session of Heads of State and
Governments of the African Union.
15. 2009 Renewable Energy Data BOOK
16. USGS (U. S. Geological Survey) web site, http://gdex.cr.usgs.gov/gdex/
17. Rwanda State of Environment and Outlook, UNEP and REMA (2009)
18. Pearce, “Rural electrification in developing countries” Energy policy 1987,
19. Pourrut P., Atlas du Rwanda – Hydrologie, ORSTOM (1975)
20. Serge Herk Boyogueno. Prediction of flow-rate of sanaga Basins in Cameroon.
21. Gal, Yoat, and Eflat Hadas. “Land allocations; Agriculture vs urban development.
22. Pena, Rafael and Aurelio Medi. “Capacity Estimation methods Applied to Mini Grids”
23. Neil Gunningham. “Confronting the Challenges of Energy Governance” Transnational.
24. Intergovernmental Panel on Climate Change (IPCC) Data Distribution Centre (DDC)
web site, http://www.ipcc-data.org/maps/
25. Feldman A. D., Hydrologic Modelling System HEC-HMS, Technical Reference Manual,
U. S. Army Corps of Engineers (2000)
26. Scharffenberger W. A., Fleming M. J. (2010), Hydrologic Modelling System HEC-HMS,
User’s Manual, U. S. Army Corps of Engineers.
27. Chapter 12 - HYDROLOGICAL MEASUREMENTS
28. DOE/GO-102001-1173 FS217, July 2001
29. Lower Manuherikia Valley water resources study “Mini hydropower station prefeasibility
study”
30. Two Activities left for Distant old Student, 2012
31. Government Determined to win Race against Darkness by 2017, Africa.
32. Off-grid Renewable Energy Options for Renewable Electrification in western China
33. Laidlar, John. Bibliographic and Research Information “ Portuguese studies”
34. Taele, B.M….An Overview of Small hydropower development in Lesotho. Challenges.
35. “Experts Predict Bleak EAC Outlook over Bad Infrastructure” Rwanda Newsletter.
Websites
1. Source: www.nyaruguru.gov.rw
2. Source: www.nyamagabe.gov.rw
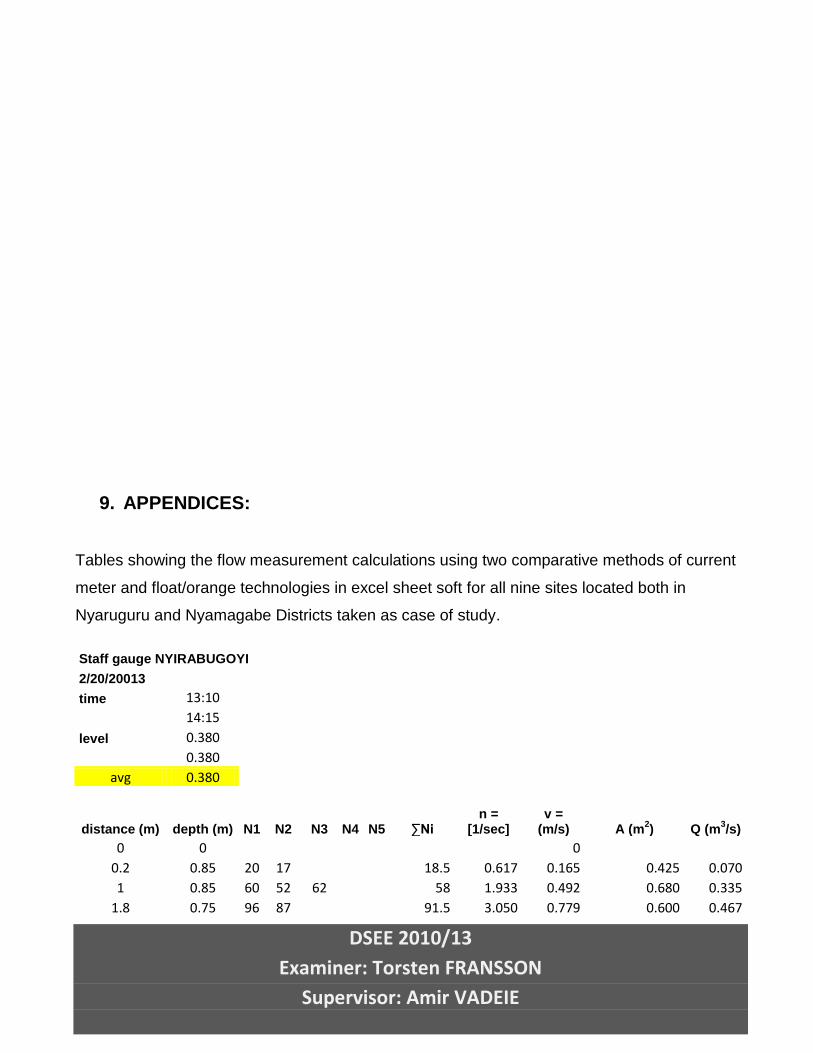
DSEE 2010/13
Examiner: Torsten FRANSSON
Supervisor: Amir VADEIE
9. APPENDICES:
Tables showing the flow measurement calculations using two comparative methods of current
meter and float/orange technologies in excel sheet soft for all nine sites located both in
Nyaruguru and Nyamagabe Districts taken as case of study.
Staff gauge NYIRABUGOYI
2/20/20013
time 13:10
14:15 level 0.380
0.380 avg 0.380
distance (m) depth (m) N1 N2 N3 N4 N5 ∑Ni
n = [1/sec]
v = (m/s) A (m
2) Q (m
3/s)
0 0
0 0.2 0.85 20 17
18.5 0.617 0.165 0.425 0.070
1 0.85 60 52 62
58 1.933 0.492 0.680 0.335
1.8 0.75 96 87
91.5 3.050 0.779 0.600 0.467
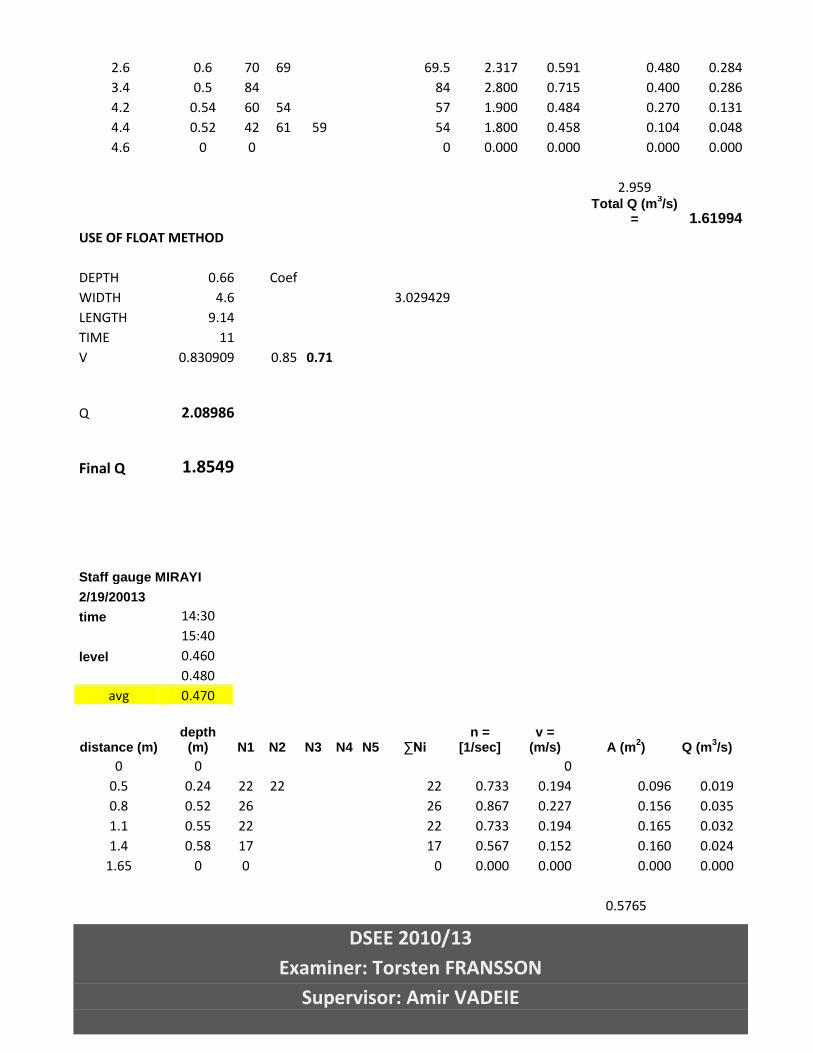
DSEE 2010/13
Examiner: Torsten FRANSSON
Supervisor: Amir VADEIE
2.6 0.6 70 69
69.5 2.317 0.591 0.480 0.284
3.4 0.5 84
84 2.800 0.715 0.400 0.286
4.2 0.54 60 54
57 1.900 0.484 0.270 0.131
4.4 0.52 42 61 59
54 1.800 0.458 0.104 0.048
4.6 0 0
0 0.000 0.000 0.000 0.000
2.959
Total Q (m3/s)
= 1.61994
USE OF FLOAT METHOD
DEPTH 0.66
Coef WIDTH 4.6
3.029429
LENGTH 9.14 TIME 11 V 0.830909
0.85 0.71
Q 2.08986
Final Q 1.8549
Staff gauge MIRAYI
2/19/20013
time 14:30
15:40 level 0.460
0.480 avg 0.470
distance (m)
depth (m) N1 N2 N3 N4 N5 ∑Ni
n = [1/sec]
v = (m/s) A (m
2) Q (m
3/s)
0 0
0 0.5 0.24 22 22
22 0.733 0.194 0.096 0.019
0.8 0.52 26
26 0.867 0.227 0.156 0.035
1.1 0.55 22
22 0.733 0.194 0.165 0.032
1.4 0.58 17
17 0.567 0.152 0.160 0.024
1.65 0 0
0 0.000 0.000 0.000 0.000
0.5765
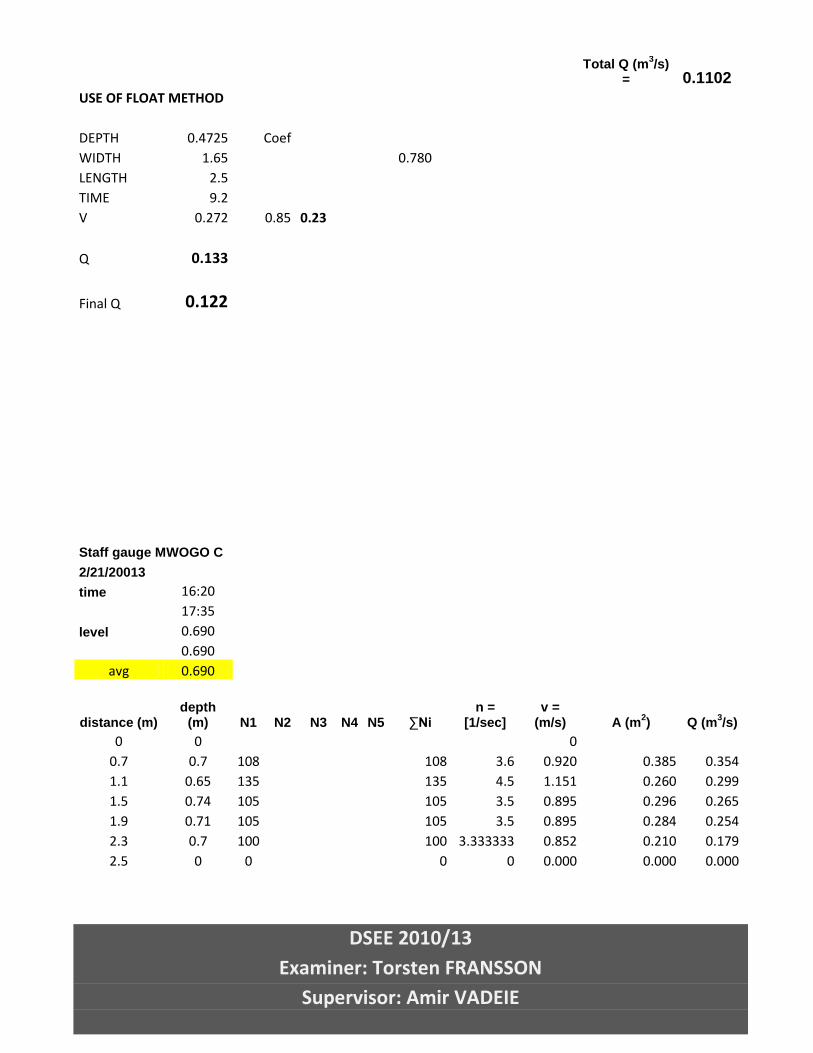
DSEE 2010/13
Examiner: Torsten FRANSSON
Supervisor: Amir VADEIE
Total Q (m3/s)
= 0.1102
USE OF FLOAT METHOD
DEPTH 0.4725
Coef WIDTH 1.65
0.780
LENGTH 2.5 TIME 9.2 V 0.272
0.85 0.23
Q 0.133
Final Q 0.122
Staff gauge MWOGO C
2/21/20013
time 16:20
17:35 level 0.690
0.690 avg 0.690
distance (m)
depth (m) N1 N2 N3 N4 N5 ∑Ni
n = [1/sec]
v = (m/s) A (m
2) Q (m
3/s)
0 0
0 0.7 0.7 108
108 3.6 0.920 0.385 0.354
1.1 0.65 135
135 4.5 1.151 0.260 0.299
1.5 0.74 105
105 3.5 0.895 0.296 0.265
1.9 0.71 105
105 3.5 0.895 0.284 0.254
2.3 0.7 100
100 3.333333 0.852 0.210 0.179
2.5 0 0
0 0 0.000 0.000 0.000
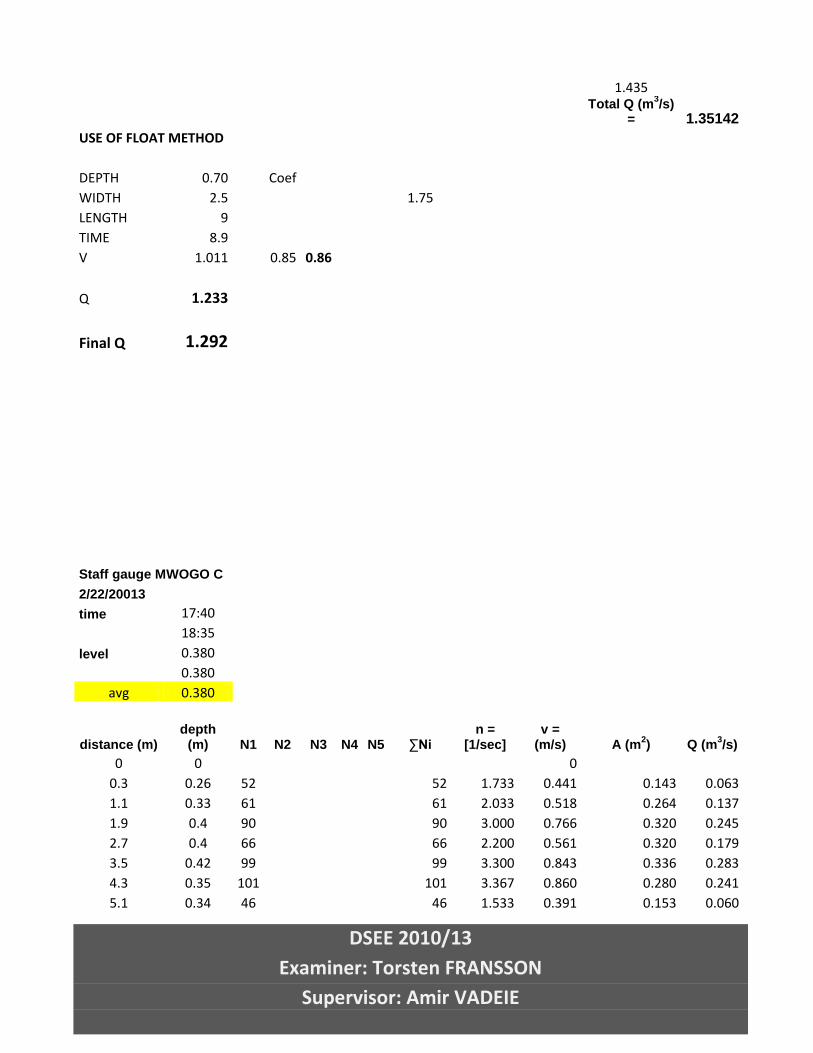
DSEE 2010/13
Examiner: Torsten FRANSSON
Supervisor: Amir VADEIE
1.435
Total Q (m3/s)
= 1.35142
USE OF FLOAT METHOD
DEPTH 0.70
Coef WIDTH 2.5
1.75
LENGTH 9 TIME 8.9 V 1.011
0.85 0.86
Q 1.233
Final Q 1.292
Staff gauge MWOGO C
2/22/20013
time 17:40
18:35 level 0.380
0.380 avg 0.380
distance (m)
depth (m) N1 N2 N3 N4 N5 ∑Ni
n = [1/sec]
v = (m/s) A (m
2) Q (m
3/s)
0 0
0 0.3 0.26 52
52 1.733 0.441 0.143 0.063
1.1 0.33 61
61 2.033 0.518 0.264 0.137
1.9 0.4 90
90 3.000 0.766 0.320 0.245
2.7 0.4 66
66 2.200 0.561 0.320 0.179
3.5 0.42 99
99 3.300 0.843 0.336 0.283
4.3 0.35 101
101 3.367 0.860 0.280 0.241
5.1 0.34 46
46 1.533 0.391 0.153 0.060
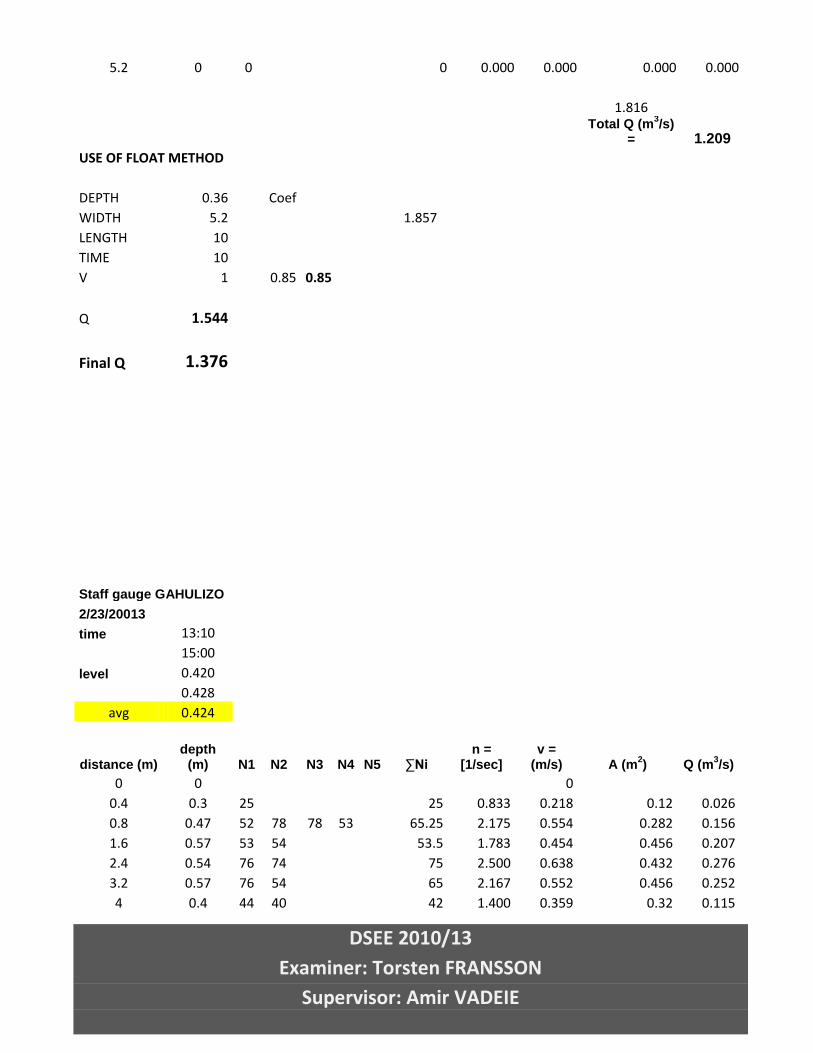
DSEE 2010/13
Examiner: Torsten FRANSSON
Supervisor: Amir VADEIE
5.2 0 0
0 0.000 0.000 0.000 0.000
1.816
Total Q (m3/s)
= 1.209
USE OF FLOAT METHOD
DEPTH 0.36
Coef WIDTH 5.2
1.857
LENGTH 10 TIME 10 V 1
0.85 0.85
Q 1.544
Final Q 1.376
Staff gauge GAHULIZO
2/23/20013
time 13:10
15:00 level 0.420
0.428 avg 0.424
distance (m)
depth (m) N1 N2 N3 N4 N5 ∑Ni
n = [1/sec]
v = (m/s) A (m
2) Q (m
3/s)
0 0
0 0.4 0.3 25
25 0.833 0.218 0.12 0.026
0.8 0.47 52 78 78 53
65.25 2.175 0.554 0.282 0.156
1.6 0.57 53 54
53.5 1.783 0.454 0.456 0.207
2.4 0.54 76 74
75 2.500 0.638 0.432 0.276
3.2 0.57 76 54
65 2.167 0.552 0.456 0.252
4 0.4 44 40
42 1.400 0.359 0.32 0.115
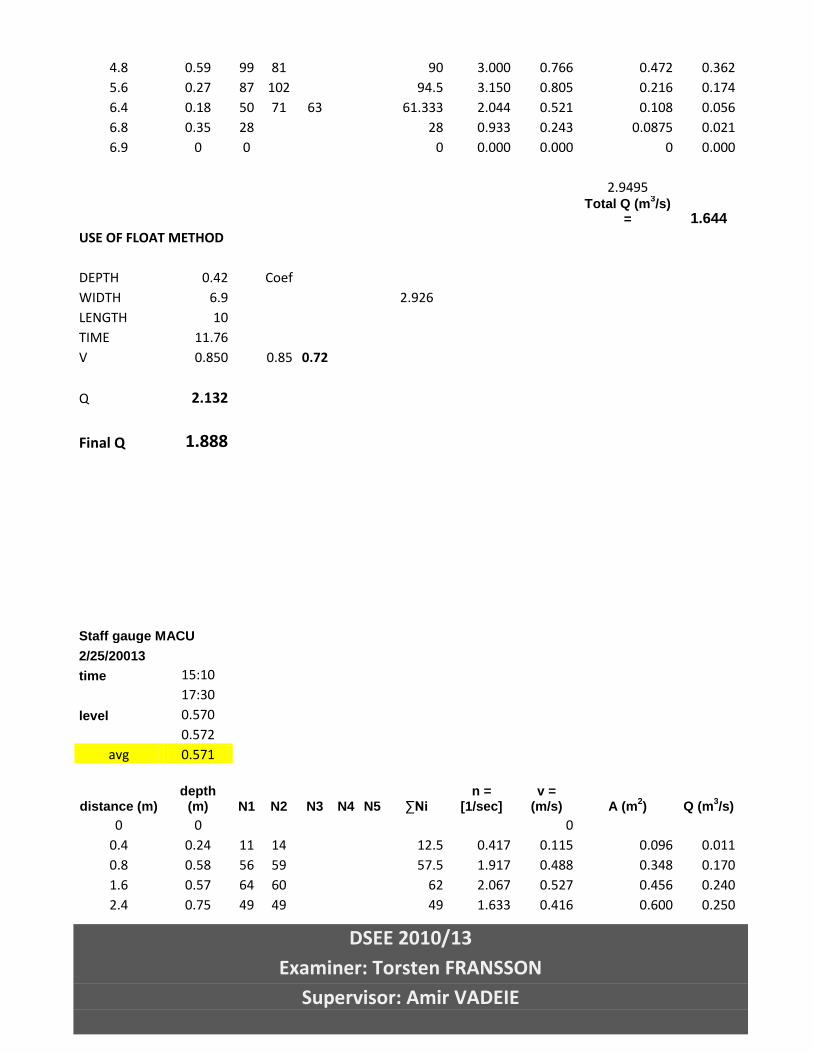
DSEE 2010/13
Examiner: Torsten FRANSSON
Supervisor: Amir VADEIE
4.8 0.59 99 81
90 3.000 0.766 0.472 0.362
5.6 0.27 87 102
94.5 3.150 0.805 0.216 0.174
6.4 0.18 50 71 63
61.333 2.044 0.521 0.108 0.056
6.8 0.35 28
28 0.933 0.243 0.0875 0.021
6.9 0 0
0 0.000 0.000 0 0.000
2.9495
Total Q (m3/s)
= 1.644
USE OF FLOAT METHOD
DEPTH 0.42
Coef WIDTH 6.9
2.926
LENGTH 10 TIME 11.76 V 0.850
0.85 0.72
Q 2.132
Final Q 1.888
Staff gauge MACU
2/25/20013
time 15:10
17:30 level 0.570
0.572 avg 0.571
distance (m)
depth (m) N1 N2 N3 N4 N5 ∑Ni
n = [1/sec]
v = (m/s) A (m
2) Q (m
3/s)
0 0
0 0.4 0.24 11 14
12.5 0.417 0.115 0.096 0.011
0.8 0.58 56 59
57.5 1.917 0.488 0.348 0.170
1.6 0.57 64 60
62 2.067 0.527 0.456 0.240
2.4 0.75 49 49
49 1.633 0.416 0.600 0.250
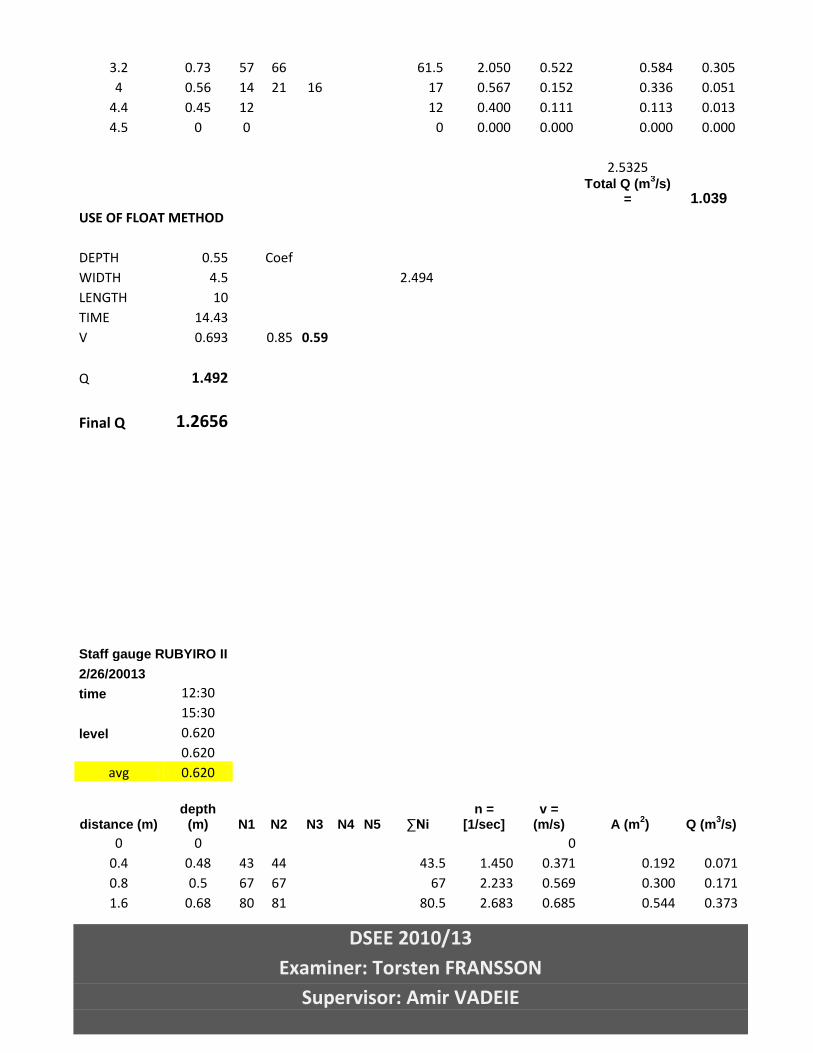
DSEE 2010/13
Examiner: Torsten FRANSSON
Supervisor: Amir VADEIE
3.2 0.73 57 66
61.5 2.050 0.522 0.584 0.305
4 0.56 14 21 16
17 0.567 0.152 0.336 0.051
4.4 0.45 12
12 0.400 0.111 0.113 0.013
4.5 0 0
0 0.000 0.000 0.000 0.000
2.5325
Total Q (m3/s)
= 1.039
USE OF FLOAT METHOD
DEPTH 0.55
Coef WIDTH 4.5
2.494
LENGTH 10 TIME 14.43 V 0.693
0.85 0.59
Q 1.492
Final Q 1.2656
Staff gauge RUBYIRO II
2/26/20013
time 12:30
15:30 level 0.620
0.620 avg 0.620
distance (m)
depth (m) N1 N2 N3 N4 N5 ∑Ni
n = [1/sec]
v = (m/s) A (m
2) Q (m
3/s)
0 0
0 0.4 0.48 43 44
43.5 1.450 0.371 0.192 0.071
0.8 0.5 67 67
67 2.233 0.569 0.300 0.171
1.6 0.68 80 81
80.5 2.683 0.685 0.544 0.373
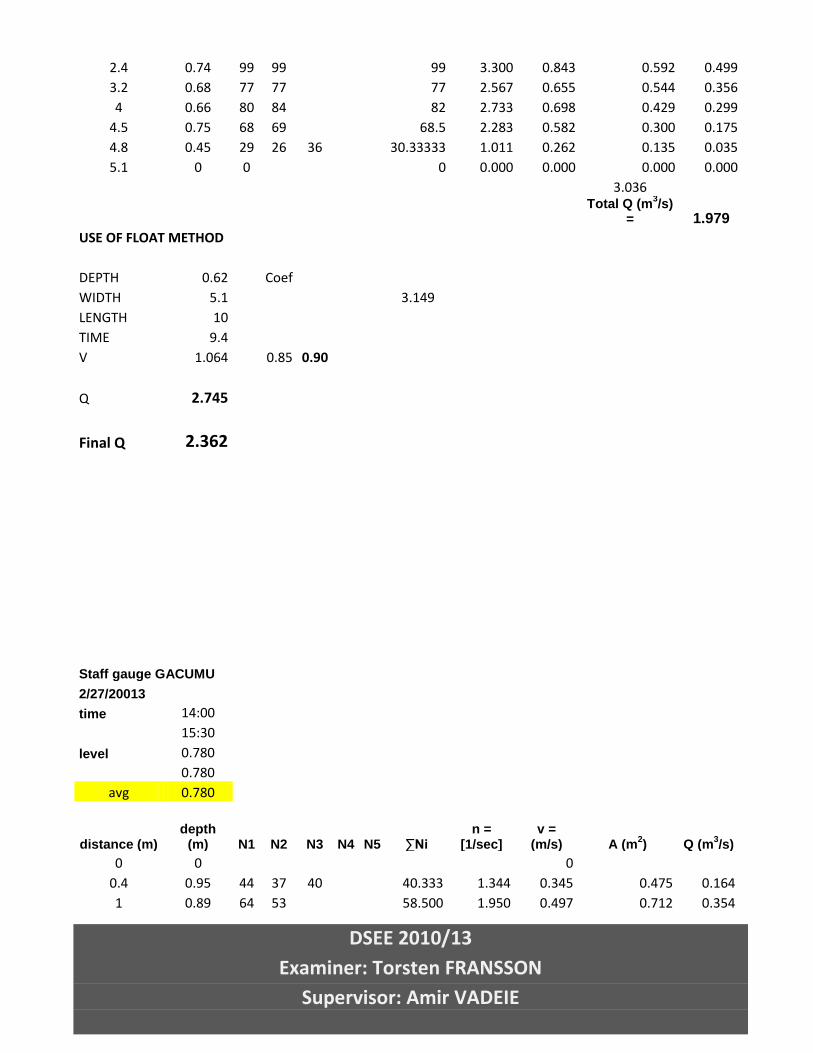
DSEE 2010/13
Examiner: Torsten FRANSSON
Supervisor: Amir VADEIE
2.4 0.74 99 99
99 3.300 0.843 0.592 0.499
3.2 0.68 77 77
77 2.567 0.655 0.544 0.356
4 0.66 80 84
82 2.733 0.698 0.429 0.299
4.5 0.75 68 69
68.5 2.283 0.582 0.300 0.175
4.8 0.45 29 26 36
30.33333 1.011 0.262 0.135 0.035
5.1 0 0
0 0.000 0.000 0.000 0.000
3.036
Total Q (m3/s)
= 1.979
USE OF FLOAT METHOD
DEPTH 0.62
Coef WIDTH 5.1
3.149
LENGTH 10 TIME 9.4 V 1.064
0.85 0.90
Q 2.745
Final Q 2.362
Staff gauge GACUMU
2/27/20013
time 14:00
15:30 level 0.780
0.780 avg 0.780
distance (m)
depth (m) N1 N2 N3 N4 N5 ∑Ni
n = [1/sec]
v = (m/s) A (m
2) Q (m
3/s)
0 0
0 0.4 0.95 44 37 40
40.333 1.344 0.345 0.475 0.164
1 0.89 64 53
58.500 1.950 0.497 0.712 0.354
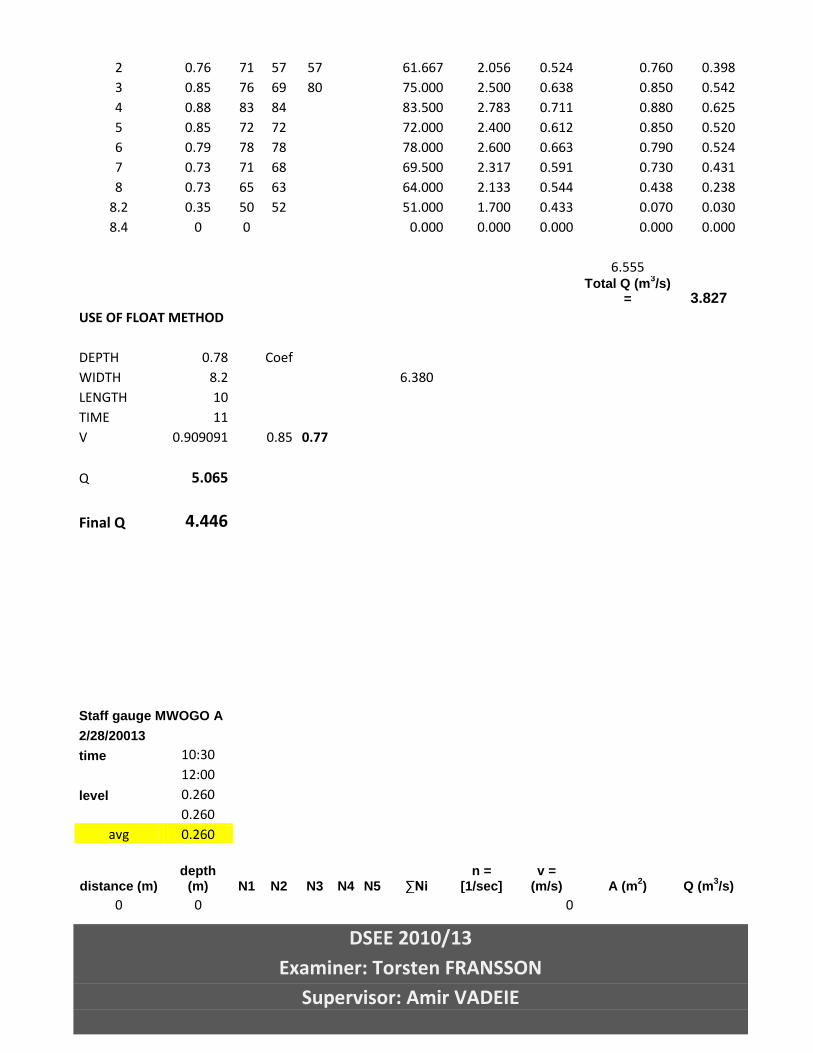
DSEE 2010/13
Examiner: Torsten FRANSSON
Supervisor: Amir VADEIE
2 0.76 71 57 57
61.667 2.056 0.524 0.760 0.398
3 0.85 76 69 80
75.000 2.500 0.638 0.850 0.542
4 0.88 83 84
83.500 2.783 0.711 0.880 0.625
5 0.85 72 72
72.000 2.400 0.612 0.850 0.520
6 0.79 78 78
78.000 2.600 0.663 0.790 0.524
7 0.73 71 68
69.500 2.317 0.591 0.730 0.431
8 0.73 65 63
64.000 2.133 0.544 0.438 0.238
8.2 0.35 50 52
51.000 1.700 0.433 0.070 0.030
8.4 0 0
0.000 0.000 0.000 0.000 0.000
6.555
Total Q (m3/s)
= 3.827
USE OF FLOAT METHOD
DEPTH 0.78
Coef WIDTH 8.2
6.380
LENGTH 10 TIME 11 V 0.909091
0.85 0.77
Q 5.065
Final Q 4.446
Staff gauge MWOGO A
2/28/20013
time 10:30
12:00 level 0.260
0.260 avg 0.260
distance (m)
depth (m) N1 N2 N3 N4 N5 ∑Ni
n = [1/sec]
v = (m/s) A (m
2) Q (m
3/s)
0 0
0
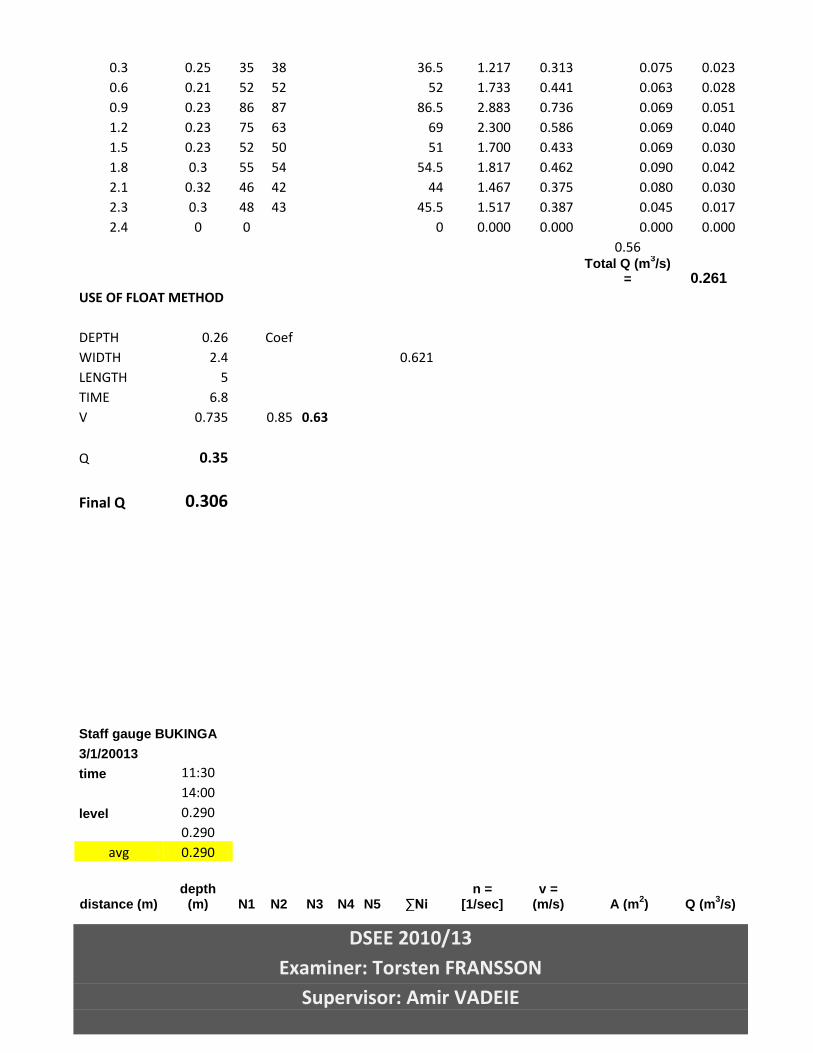
DSEE 2010/13
Examiner: Torsten FRANSSON
Supervisor: Amir VADEIE
0.3 0.25 35 38
36.5 1.217 0.313 0.075 0.023
0.6 0.21 52 52
52 1.733 0.441 0.063 0.028
0.9 0.23 86 87
86.5 2.883 0.736 0.069 0.051
1.2 0.23 75 63
69 2.300 0.586 0.069 0.040
1.5 0.23 52 50
51 1.700 0.433 0.069 0.030
1.8 0.3 55 54
54.5 1.817 0.462 0.090 0.042
2.1 0.32 46 42
44 1.467 0.375 0.080 0.030
2.3 0.3 48 43
45.5 1.517 0.387 0.045 0.017
2.4 0 0
0 0.000 0.000 0.000 0.000
0.56
Total Q (m3/s)
= 0.261
USE OF FLOAT METHOD
DEPTH 0.26
Coef WIDTH 2.4
0.621
LENGTH 5 TIME 6.8 V 0.735
0.85 0.63
Q 0.35
Final Q 0.306
Staff gauge BUKINGA
3/1/20013
time 11:30
14:00 level 0.290
0.290 avg 0.290
distance (m)
depth (m) N1 N2 N3 N4 N5 ∑Ni
n = [1/sec]
v = (m/s) A (m
2) Q (m
3/s)
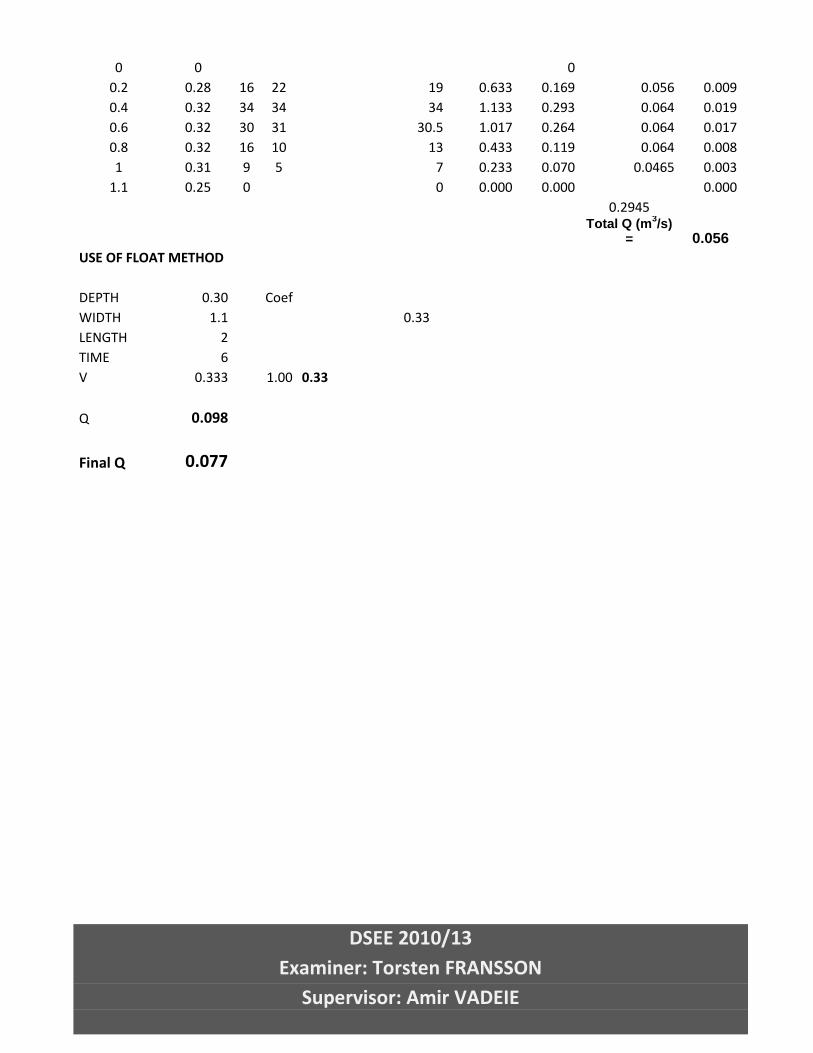
DSEE 2010/13
Examiner: Torsten FRANSSON
Supervisor: Amir VADEIE
0 0
0 0.2 0.28 16 22
19 0.633 0.169 0.056 0.009
0.4 0.32 34 34
34 1.133 0.293 0.064 0.019
0.6 0.32 30 31
30.5 1.017 0.264 0.064 0.017
0.8 0.32 16 10
13 0.433 0.119 0.064 0.008
1 0.31 9 5
7 0.233 0.070 0.0465 0.003
1.1 0.25 0
0 0.000 0.000
0.000
0.2945
Total Q (m3/s)
= 0.056
USE OF FLOAT METHOD
DEPTH 0.30
Coef WIDTH 1.1
0.33
LENGTH 2 TIME 6 V 0.333
1.00 0.33
Q 0.098
Final Q 0.077
![[THESIS TITLE] - USE ONLY UPPERCASE LETTERS A THESIS …fbe.metu.edu.tr/tr/system/files/thesis_template.pdf · [thesis title] - use only uppercase letters a thesis submitted to the](https://img.pdfslide.net/doc/110x75/5e6358eb1545806ea343ada3/thesis-title-use-only-uppercase-letters-a-thesis-fbemetuedutrtrsystemfilesthesis.jpg)


![[ TYPE THESIS TITLE ]](https://img.pdfslide.net/doc/110x75/589ae8541a28abcd468bbadf/-type-thesis-title-.jpg)


![TITLE OF [THESIS, DISSERTATION]](https://img.pdfslide.net/doc/110x75/554ba33bb4c905b3618b4c36/title-of-thesis-dissertation.jpg)