Embed Size (px)
Citation preview
SCHOOL AND NEIGHBOURHOOD RECREATIONAL ENVIRONMENTS AND THEIR IMPACT ON PHYSICAL
ACTIVITY PARTICIPATION AMONG CANADIAN YOUTH
by
Marianne Elizabeth Nichol
A thesis submitted to the Department of Community Health and Epidemiology
In conformity with the requirements for
the degree of Master of Science
Queen’s University
Kingston, Ontario, Canada
May, 2008
Copyright ©Marianne Nichol, 2008

ii
Abstract
Background: Less than half of Canadian youth meet recommended levels of physical
activity. This is of concern given the health burden associated with physical inactivity.
With the limited success of physical activity interventions, research has begun to focus on
how physical and sociocultural environments affect physical activity. Investigation of
school and neighbourhood characteristics that facilitate physical activity may identify
environmental changes that could increase participation among adolescents.
Objectives: The objectives of the two studies comprising the thesis were to examine,
among youth in grades 6 through 10: 1) the association between school recreational
characteristics and physical activity during free-time and class-time at school, and 2) the
effects of perceptions of neighbourhood safety and availability of parks and recreational
facilities on physical activity participation outside of school.
Methods: Data from the 2006 Canadian Health Behaviour in School-Aged Children
Survey (HBSC) were analyzed. Multilevel logistic regression was employed to quantify
associations between school and neighbourhood characteristics and physical activity. For
the first study, student responses to school-time physical activity scales were
dichotomized (≥ 2 vs. <2 hours/week). A cumulative index that considered together
policies, varsity and intramural athletics, presence and condition of fields, and condition
of gymnasia was constructed based on principals’ reports. In the second study, physical
activity outside of school was dichotomized (≥ 4 vs. <4 hours/week). A scale of
individuals’ perceptions of safety was constructed. The number of parks and recreational
iii
facilities within a 5 km buffer of schools was abstracted from a geographical information
system.
Results: Objective 1. School recreational features were modestly positively related to
adolescents’ physical activity at school, particularly that occurring during free-time. The
cumulative effect of school recreational features exerted a stronger effect than any single
feature. Objective 2. Perceptions of safety were associated with students’ physical
activity, whereas increased availability of parks and recreational facilities neither
prevented nor promoted physical activity.
Conclusions: Objective 1. High levels of recreational support at schools might promote
physical activity among young people. This could inform educational policies and
support funding of school recreational opportunities. Objective 2. Improving perceptions
of safety might promote physical activity participation among youth.
iv
Co-Authorship
This thesis presents the work of Marianne Nichol in collaboration with her advisors, Dr.
William Pickett and Dr. Ian Janssen.
Manuscript 1: Associations between school recreational environments and physical
activity. The idea of using the HBSC and the HBSC Administrator Survey to examine the
effects of school features on students’ physical activity was Dr. Janssen’s. The idea of
incorporating a cumulative scale of school facilities was Dr. Pickett’s. The writing of the
manuscript, the statistical analysis and the interpretation of the results were the work of
Marianne Nichol, with supervision and editorial feedback provided by Dr. Janssen and
Dr. Pickett. Classification of schools by geographical location (i.e. urban/rural location)
was the work of Laura Seliske.
Manuscript 2: Perceptions of neighbourhood safety, not recreational facilities, are
associated with physical activity in youth. The idea of using the HBSC to examine the
effects of availability of neighbourhood facilities on students’ physical activity was Dr.
Janssen’s and Dr. Pickett’s. The idea of incorporating perceptions of safety arose out of
discussion between Marianne Nichol, Dr. Janssen and Dr. Pickett. The idea of using a
scale of facility availability was Dr. Pickett’s; the method for constructing the scale was
proposed by Dr. Janssen. Marianne Nichol identified CanMap Streetfiles as an
appropriate geographical information system and collected information on numbers of
parks and recreational facilities around schools. Laura Seliske collected information on
v
geographical location (urban/rural) and area-level socioeconomic status; these represent
potential covariates within this analysis. Marianne Nichol performed the statistical
analysis, interpreted the results, and wrote the manuscript. Dr. Janssen and Dr. Pickett
provided conceptual and editorial feedback.
Marianne Nichol wrote other chapters of the thesis (introduction, background and
literature review, general discussion, and appendices), with editorial feedback and advice
from Dr. Pickett and Dr. Janssen.
vi
Acknowledgements
I would like to extend my thanks and appreciation to the many who have helped support
and guide me through the MSc Epidemiology program at Queen’s.
First and foremost, I would like to thank my supervisors Dr. William Pickett and
Dr. Ian Janssen for their guidance, expertise and encouragement throughout the
development of the thesis. I have very much appreciated their timely feedback,
constructive suggestions, and advice both in terms of the thesis and my broader academic
experience. I feel extremely lucky to have benefited from their expertise and to have
been provided with academic opportunities above and beyond the program itself.
Thanks so much Will and Ian!!!
Second, I would like to the thank Empire Life, the Canadian Institute of Health
Research, the department of Community Health and Epidemiology and my supervisors
for the financial support they provided.
Third, I would like to thank the faculty in the Department of Community Health
and Epidemiology for providing a fun and enriching learning environment and
contributing to my enjoyment of the program. I would also like to thank all of the good
friends I have made in Kingston, particularly my peers in the department, for their
academic and social support.
Finally, I would like to deeply thank my family and Matthew for their loving
support and endless encouragement.
vii
Table of Contents Abstract ............................................................................................................................................ii Co-Authorship ................................................................................................................................ iv Acknowledgements.........................................................................................................................vi Table of Contents...........................................................................................................................vii List of Figures ................................................................................................................................. ix List of Tables ................................................................................................................................... x
Manuscript 1 ............................................................................................................................ x Manuscript 2 ............................................................................................................................ x
Chapter 1 Introduction ..................................................................................................................... 1 1.1 General Overview .................................................................................................................. 1 1.2 Scientific Importance ............................................................................................................. 1 1.3 Societal Importance ............................................................................................................... 2 1.4 Empirical Objectives and Hypotheses ................................................................................... 3 1.5 Thesis Organization ............................................................................................................... 4 1.6 References.............................................................................................................................. 5
Chapter 2 Background and Literature Review................................................................................. 7 2.1 Introduction............................................................................................................................ 7 2.2 Prevalence of Physical Activity in Adolescence.................................................................... 7 2.3 Health Benefits of Physical Activity...................................................................................... 8 2.4 Influence of Individual Characteristics on Physical Activity ................................................ 9 2.5 Literature Search Strategy.................................................................................................... 11 2.6 Influence of Schools on Physical Activity ........................................................................... 11
2.6.1 School Policies and Recreational Opportunities for Physical Activity......................... 12 2.6.2 Recreational Facilities in Schools ................................................................................. 12 2.6.3 Summary of School Research ....................................................................................... 15
2.7 Influence of the Neighbourhood Environment on Physical Activity................................... 16 2.7.1 Parks and Physical Activity in Adolescence................................................................. 16 2.7.2 Recreational Facilities and Physical Activity in Adolescence ...................................... 21 2.7.3 Neighbourhood Safety .................................................................................................. 25
2.8 Summary and Directions for Future Research ..................................................................... 31 2.9 References............................................................................................................................ 32
viii
Chapter 3 Manuscript 1: Associations between school recreational environments and physical
activity ........................................................................................................................................... 38 Abstract ...................................................................................................................................... 39 Introduction................................................................................................................................ 41 Methods ..................................................................................................................................... 42 Results........................................................................................................................................ 47 Discussion.................................................................................................................................. 50 Acknowledgements.................................................................................................................... 54 References.................................................................................................................................. 55
Chapter 4 Manuscript 2: Perceptions of neighbourhood safety, not recreational facilities, are
associated with adolescent physical activity.................................................................................. 66 Abstract ...................................................................................................................................... 67 Introduction................................................................................................................................ 69 Subjects and Methods ................................................................................................................ 70 Results........................................................................................................................................ 76 Discussion.................................................................................................................................. 78 Conclusion ................................................................................................................................. 83 References.................................................................................................................................. 83
Chapter 5 General Discussion........................................................................................................ 91 5.1 Summary of Key Findings ................................................................................................... 91 5.2 Limitations of the Thesis ..................................................................................................... 91 5.3 Strengths of the Thesis......................................................................................................... 93 5.4 Statistical Power................................................................................................................... 94 5.5 Future Research Directions.................................................................................................. 95 5.6 Public Health and Policy Implications.................................................................................96 5.7 References............................................................................................................................ 97
Appendix A Exclusion Flow Chart for Manuscript 1 .................................................................... 98 Appendix B Additional Analyses for Manuscript 1....................................................................... 99 Appendix C Exclusion Flow Chart for Manuscript 2 .................................................................. 102 Appendix D Additional Analyses for Manuscript 2 .................................................................... 103 Appendix E Power Calculations ..................................................................................................111 Appendix F HBSC Survey Methodology .................................................................................... 112
ix
List of Figures
Figure 1. Effect of composite scale of school facilities and opportunities on class-time and free-
time physical activity among high school students (grade 9 and 10) by gender.................... 65
x
List of Tables
Manuscript 1
Table 1. Distribution of the student sample (n=7638) according to individual-level variables and
the association between the individual-level variables and physical activity at school during
class time and free time.......................................................................................................... 58 Table 2. Distribution of the study schools (n=154) according to school-level variables............... 59 Table 3. Bivariate associations between potential school-level confounders and students’ physical
activity during free-time and class-time at school ................................................................. 60 Table 4. Associations between school characteristics and being physically active for 2 or more
hours per week at school during class-time by gender, grade and family affluence.............. 61 Table 5. Associations between school characteristics and being physically active for 2 or more
hours per week at school during free-time by gender, grade and family affluence ............... 63
Manuscript 2
Table 1. Characteristics of the student sample (n=9114) according to individual-level variables
and their bivariate association with physical activity outside of school……………….……87
Table 2. Bivariate association between perceptions of safety, availability of facilities and physical
activity outside of school…………………………………………………………………... 88
Table 3. Multivariate analysis: associations between safety and recreational facilities and physical
activity outside of school, by gender, grade, and geographic location…………………….. 89
Table 4. Effects of individuals’ perceptions of safety on the relationship between availability of
recreational features and physical activity outside of school………………………………..90
1
Chapter 1 Introduction
1.1 General Overview
Physical inactivity is one of the leading determinants of morbidity and mortality
in Canada, having been shown to increase an individual’s risk of developing
hypertension, type 2 diabetes, cancer, and ischemic heart disease1. Physical inactivity is
highly prevalent in Canada, with more than half of Canadian adults and adolescents
reporting being physically inactive in 20012,3.
The causes of physical inactivity in adolescence are multifaceted and exist at
varying levels of Canadian society. These potential determinants include not only
individual-level characteristics (such as knowledge, attitudes, socioeconomic status, age,
and gender) but also those at the macro- and micro-environmental level. Macro-
environmental characteristics include policies at government levels, transport
infrastructures, and media influences4. Micro-environmental factors are those that act
more proximally, at the level of homes, schools and neighbourhoods4.
Using multilevel statistical methods, the research within this thesis will further
explore relationships between school and neighbourhood characteristics, specifically the
provision of recreational opportunities and facilities and neighbourhood safety, and
physical activity participation in Canadian adolescents.
1.2 Scientific Importance
Recently, the Canadian Institutes of Health Research in partnership with the Heart
and Stroke Foundation have made the effect of the built environment on physical activity

2
a research priority5. As defined by CIHR, the built environment is the outcome of
community planning, design and implementation5, in other words the man-made physical
spaces in which people live.
Two systematic reviews have recently highlighted the lack of research examining
environmental characteristics of schools and neighbourhoods associated with physical
activity in youth4,6. Of the studies that do exist, most have explored the effect of the
perceived environment; few have used objective measures of physical environments,
geographical information systems and multilevel statistical techniques4,6. The effects of
built neighbourhood features on physical activity in Canadian adolescents have yet to be
explored.
Using data from the 2006 Canadian Health Behaviour in School-Age Children
Survey and a nationwide geographic information system (CanMap Streetfiles), the aim of
the thesis is to explore relationships between the school and neighbourhood environments
and physical activity in youth. The current study will improve upon previous research
through use of a multilevel approach, a large nationally representative sample of nearly
10,000 adolescents in grades 6 through 10, context-specific measures of physical activity,
and objective measures of the school and neighbourhood environment.
1.3 Societal Importance
Physical inactivity is an important determinant of morbidity and mortality,
placing a significant economic burden on Canadian society7. Increases in the level of
physical activity in youth could not only translate into immediate health benefits, but also
reduce the incidence of physical inactivity-related chronic diseases in the future. By
3
following a mass strategy for disease prevention, small increases in individuals’ physical
activity (and resultantly small reductions in individuals’ risk of disease) would translate
into a larger reduction in the health risk of the population as a whole8. Even if this
research detects only small area-level effects in individuals, the population attributable
risk associated with the area-level factors would be greater as the majority of youth are
exposed to the school and neighbourhood environment. Thus, the impact on the health of
the entire population could be much greater9.
Because the vast majority of youth are exposed to the school environment,
schools provide an important arena for health promotion and provide opportunities to
participate in physical activity10. By identifying school features that are protective
against physical inactivity, this analysis may point towards practical interventions and
policies aimed at increasing physical activity in youth. Physical improvements to the
school environment may lead in turn to better levels of physical activity.
Similarly, neighbourhood characteristics beyond school properties can impact
upon physical activity levels not only in children and youth but also the entire
community. Identification of neighbourhood factors that promote physical activity may
lend support for the improvement of current obesogenic environments. Such
environmental planning could increase physical activity in the entire community, thereby
reducing the future burden of physical inactivity-related diseases.
1.4 Empirical Objectives and Hypotheses
1. To examine school characteristics and their association with physical activity
during school hours among youth in grades 6 through 10. It is hypothesized that
4
the presence of a playing field, the condition of physical activity facilities, and the
presence of school policies to increase physical activity will each be positively
associated with physical activity during class-time. In addition to these factors,
availability of late bus services for extracurricular activities and the number of
varsity and intramural sports offered at the school are each expected to be positively
associated with physical activity during free-time at school. It is expected that
schools will not differ widely with respect to the presence of gymnasiums and
physical activity in the curriculum; an effect on the basis of these exposures will not
be detectable.
2. To examine the independent and interactive effects of individual perceptions of
neighbourhood safety and availability of parks and recreational facilities on
physical activity participation outside of school in youth in grades 6 through 10. It
is expected that perception of neighbourhood safety will be independently
associated with physical activity outside of school. In addition, it is anticipated that
the number of parks, trails and publicly provided recreational facilities within 5
kilometres of schools will be positively associated with physical activity,
particularly in neighbourhoods perceived as safe by students.
1.5 Thesis Organization
This thesis conforms to the regulations outlined in the Queen’s School of
Graduate Studies and Research “General Forms of Theses”11. The second chapter
summarizes previous studies in the areas of school- and neighbourhood-level physical
5
activity research. The third chapter of the thesis is Manuscript 1 and is an analytic study
exploring the relationships between school characteristics and physical activity in
Canadian adolescents. This manuscript has been formatted for submission to the
American Journal of Preventive Medicine. Chapter 4 of the thesis is the second
manuscript, prepared for submission to Pediatrics. It examines associations between
perceptions of neighbourhood safety, publicly provided recreational spaces and physical
activity participation in Canadian youth. Chapter 5 contains a summary of findings, a
general discussion, and conclusions.
1.6 References
(1) Irwin CE, Jr. Eating and physical activity during adolescence: does it make a difference
in adult health status? J Adolesc Health 2004 Jun;34(6):459-60.
(2) Klein-Geltink JE, Choi BC, Fry RN. Multiple exposures to smoking, alcohol, physical
inactivity and overweight: Prevalences according to the Canadian Community Health
Survey Cycle 1.1. Chronic Dis Can 2006;27(1):25-33.
(3) Janssen I, Katzmarzyk PT, Boyce WF, Vereecken C, Mulvihill C, Roberts C, et al.
Comparison of overweight and obesity prevalence in school-aged youth from 34
countries and their relationships with physical activity and dietary patterns. Obes Rev
2005 May;6(2):123-32.
(4) Ferreira I, van der HK, Wendel-Vos W, Kremers S, van Lenthe FJ, Brug J.
Environmental correlates of physical activity in youth - a review and update. Obes Rev
2007 Mar;8(2):129-54.
(5) Canadian Institutes of Health Research. Operating Grant: Built Environment, Obesity and
Health. www irsc gc ca/e/32850 html 2007

6
(6) Davison KK, Lawson CT. Do attributes in the physical environment influence children's
physical activity? A review of the literature. Int J Behav Nutr Phys Act 2006;3:19.
(7) Katzmarzyk PT, Janssen I. The economic costs associated with physical inactivity and
obesity in Canada: an update. Can J Appl Physiol 2004;29(1):90-115.
(8) Webb P, Bain C, Pirozzo S. Essential Epidemiology: An Introduction for Students and
Health Professionals. New York: Cambridge University Press; 2005.
(9) Cohen DA, Ashwood JS, Scott MM, Overton A, Evenson KR, Staten LK, et al. Public
parks and physical activity among adolescent girls. Pediatrics 2006 Nov;118(5):e1381-
e1389.
(10) Gillander GK, Hammarstrom A. Can school-related factors predict future health
behaviour among young adolescents? Public Health 2002 Jan;116(1):22-9.
(11) School of Graduate Studies and Research, Queen’s University. General Form of Theses.
2007.
www.queensu.ca/sgs/Currentstudents/Completingyourdegree/Preparingyourthesis/general
formsoftheses.pdf
7
Chapter 2 Background and Literature Review
2.1 Introduction
The purposes of this chapter are to introduce the problem of physical inactivity
among Canadian adolescents and its consequences, and to review the state of the existing
literature evaluating the impact of school and neighbourhood characteristics on physical
activity in adolescence. “Adolescence” usually refers to the period of development from
puberty to adulthood, ranging from roughly age 10 to 18 years. Because the majority of
studies in this area have used student populations drawn on the basis of grade, for the
purpose of this review “adolescence” has been defined as the academic period from grade
6 through to the end of high school. Throughout the thesis the terms “youth”, “young
people”, and “teenagers” will be used synonymously with “adolescents”.
With respect to schools, particular focus will be given to the effects of policies for
physical activity and provision of recreational opportunities and facilities. The main
neighbourhood characteristics under consideration are parks and recreational facilities
and neighbourhood safety. Throughout the thesis, the use of the term “environment” will
refer to the built or man-made environment, and not the social or natural environment.
This chapter concludes with directions for future research.
2.2 Prevalence of Physical Activity in Adolescence
Canada’s Physical Activity Guide for Children and Youth currently recommends
that youth 10 to 14 years of age gradually increase their moderate intensity physical
activity by 60 minutes per day and their vigorous intensity physical activity by 30
8
minutes per day over the course of five months1. The Centers for Disease Control and
Prevention in the United States recommend that children and youth engage in 60 minutes
of moderate-to-vigorous physical activity on most if not all days of the week2. Moderate-
to-vigorous physical activity is that which significantly increases one’s heart rate,
breathing, and body temperature.
Only 45% of Canadian youth in grades 6 through 10 are physically active for 60
minutes at least 5 days per week3. Such low rates of physical activity are of particular
concern not only because this behaviour may track into adulthood, as demonstrated in a
recent review of 13 studies conducted by Hallal et al.4, but also because the health
benefits of physical activity can be seen as early as adolescence4.
2.3 Health Benefits of Physical Activity
Adolescent physical activity has been associated with both short- and long-term
health benefits. Some of the immediate benefits include higher self-esteem, lower levels
of depression, reduced stress and reduced anxiety4,5. Adolescent physical activity may
also influence adult health independent of physical activity levels in adulthood. For
example, adolescent physical activity may protect against fracture in adulthood,
regardless of adult physical activity levels, due to optimization of peak bone mass in
adolescence4. Adolescent physical activity may also be associated with lower risk of
developing breast cancer independent of adult activity levels, although results are
somewhat mixed; 16 case-control studies have demonstrated an association whereas 3
cohort studies have not4. In addition, establishing appropriate levels of physical activity
early in life and having the behaviour maintained throughout the course of adulthood has
9
the potential to substantially reduce the burden of physical inactivity-related chronic
diseases. According to the World Health Organization6, 10 to 16% of type 2 diabetes,
breast cancer, and colorectal cancer cases are attributable to physical inactivity. In
addition, 22% of ischemic heart disease cases are estimated to be the result of physical
inactivity6.
Not only is physical inactivity a risk factor for premature mortality independent of
adiposity levels7, it is also a determinant of obesity8, an independent risk factor for many
chronic diseases. Like physical inactivity, obesity rates in Canada are of epidemic
proportions, even among children and adolescents. Recent findings based on measured
heights and weights estimate that approximately 26% of Canadian children ages 2 to 17
years are overweight or obese9, with the prevalence of obesity having tripled in the past
25 years among youth9. Physical inactivity is a determinant of future weight gain and
obesity in adult populations8. Thus, establishment of a healthy active lifestyle early in life
has the potential to reduce future risk of developing obesity and resultant chronic
diseases.
2.4 Influence of Individual Characteristics on Physical Activity
In an extensive literature review, Sallis et al.10 summarized the associations
between individual-level characteristics and physical activity in adolescents aged 13 to 18
years using results from 54 analytic studies. The authors found that gender was the most
consistent correlate of physical activity, with girls being less physically active than
boys10. As well, the majority of studies demonstrated an inverse association between age
and physical activity. Ethnicity was also consistently associated with physical activity,
10
with higher levels of physical activity among non-Hispanic white adolescents10. No
study to date has explored the association between ethnicity and physical activity among
Canadian children or adolescents; one study conducted among Canadian adults found the
prevalence of being moderately physically active was higher among White Canadians
and Aboriginals (49% and 47%, respectively) and lower among Asian, Arab, Black, and
Hispanic Canadians, with prevalence ranging from 34% to 40%11.
The review by Sallis et al.10 concluded that socioeconomic status was unrelated to
physical activity. However, the majority of studies included in the review were conducted
in the United States; a more recent Canadian study12 found that both increased material
wealth and higher perceived socioeconomic status were significantly positively
associated with physical activity in adolescents.
Results of studies examining the influence of parents and other family members
on adolescents’ physical activity levels are mixed. In their review, Sallis et al.10
concluded that parent physical activity was unrelated to adolescent physical activity and
that the relationship was indeterminate among children. In another recent review,
Ferreira et al.13 found that the physical activity behaviour of parents, siblings, and peers
was unrelated to adolescent physical activity in most studies. The Sallis et al. review
found that help and support from parents and significant others was consistently
associated with teenagers’ physical activity; however, the Ferreira et al. review concluded
that the effect of parental and family support on physical activity was unclear13.
Over the past 20 years, many interventions, based on behavioural theories such as
the Health Belief Model and Social Cognitive Theory (as cited in 14), have been
11
developed with the focus of changing the physical activity behaviour of individuals14.
Despite these efforts, physical inactivity and obesity are still of epidemic proportions.
Increasingly, more interest has been placed on higher-level environmental and cultural
factors that may promote or hinder physical activity in populations. Along these lines,
Sallis et al.15 have developed an ecological model describing the higher-level variables
that might affect different types of physical activity. This model divides active living
into four different components: recreation, transport, occupation, and household
activities, and suggests hypotheses about the intrapersonal, perceived, environmental and
policy factors that may influence each. Research evaluating these different potential
predictors or inhibitors of physical activity may drive future intervention strategies that
target populations as well as individuals. This review focuses particularly on school and
neighbourhood factors potentially associated with adolescents’ recreational activities.
2.5 Literature Search Strategy
Studies of the effects of school and neighbourhood environments on adolescent
physical activity were identified in Medline/Pubmed using the key words: ‘physical
activity’, ‘adolescence’, ‘adolescents’, ‘childhood’, ‘children’, ‘school’, ‘neighbourhood’,
‘environment’, ‘built environment’, ‘parks’, ‘facilities’, and ‘safety’.
2.6 Influence of Schools on Physical Activity
Children and youth spend a significant proportion of their time at school, and as
such schools have the potential to influence health behaviours through the provision of
facilities and opportunities for physical activity16. In addition, schools provide
recreational support and instruction from trained educators17. There is, however, a paucity
12
of studies examining the effect of schools on physical activity in children and
adolescents13. Many studies have investigated school-based interventions for increasing
physical activity, but few observational studies have considered the effects of policies,
recreational opportunities and physical facilities in schools13.
2.6.1 School Policies and Recreational Opportunities for Physical Activity
The prevalence of policies and opportunities for physical activity among schools
has been described in both Canadian18-20 and American21-25 settings. However, to my
knowledge, no studies have assessed the impact of having school policies or other
recreational opportunities (such as intramural or varsity sports programs) on students’
physical activity levels.
2.6.2 Recreational Facilities in Schools
Only three analytic studies26-28 have examined the effect of school recreational
facilities on physical activity in children or youth. Recreational facilities are school areas
designed for sports and physical activity, such as gyms, playing fields, weight rooms, and
running tracks.
Sallis et al.26 observed the proportion of grade 6-8 students engaging in
moderate-to-vigorous intensity physical activity before and after school and during recess
across 24 middle schools in San Diego, California. The gender-specific regression
models explained 42% and 59% of the variance in non-physical education physical
activity for girls and boys, respectively. In particular, these authors reported that girls
were more physically active when both high levels of supervision and supportive features
(e.g. basketball hoops, baseball diamonds, football/soccer goals) were present; this
13
interaction explained 11% of the variance for girls. Boys were more physically active on
courts with high supervision, with this interaction explaining 16% of variance in non-
physical education physical activity. However, regardless of the physical environment, in
the schools under investigation <6% of the students were observed being moderate-to-
vigorously active. One limitation of this research may be observer bias, since both
physical characteristics and the number of students being physically activite were
determined by direct observation by data collectors. It would be difficult to blind
collectors to the exposures of interest (the environments in which students were
observed). As such, it is possible that data may have been collected differently
depending on the school features present or absent at each school. A second limitation of
this study may be lack of generalizability, as the results of the study may not be
applicable to settings outside of San Diego, California.
A second study, conducted by Fein et al.27, found that an index of the perceived
availability of school facilities was weakly positively correlated (Pearson r=0.15, p<0.01)
with adolescents’ self-reported physical activity in a sample of 610 grade 9 to 12 students
in four rural Albertan high schools. Students provided Likert responses to twelve
statements that included “The gym space allows me to do all the activities I want”, “The
sports or exercise equipment works well” and, “The athletic facilities at my school are
easily accessible to me.” The other 9 scales used to construct the index were not
described. In addition, the respective importance of each scale was not investigated27.
Because this study used perceived rather than objective measures of the school
environment, a potential limitation may be recall bias. Recall bias may have occurred if
14
active students rated their environment more favourably compared with inactive students.
In other words, although the school environment could in fact be the same, differences
may have emerged due to differences in perception. In addition, Likert scales may be
subject to central-tendency bias (individuals’ tendency to avoid extreme response
categories) or acquiescent bias (individuals’ tendency to agree with statements)29, either
of which could result in non-differential misclassification. Finally, like the previous
study, this research was limited to a geographically limited setting and thus the results
may not be widely generalizable.
Using a sample of 256 students in 7th and 8th grade across 10 school sites in
Boston, Massachusetts, Cradock et al.28 found school campus area, play area and building
area to be each positively associated with students’ physical activity during the school
day. Physical activity was measured objectively using accelerometers. School campus,
play, and building areas were determined based on land-use parcel data obtained from
local government offices, site visits, geometrically corrected aerial photographs (i.e.
orthophotos), architectural plans, and site maps. Of the three school studies identified
herein, this is the only one that used multilevel modelling to take into account the
clustered and hierarchical nature of the data. School campus area per student, play area
per student and building area per student were each significantly associated with
students’ physical activity levels, after adjusting for age, gender, race, BMI, physical
education days/week, and the time and day of physical activity measurements. For
example, each one square metre increase in play area per student was associated with a
0.347 unit increase in log-transformed vector magnitude (a measure of movement). A few
15
limitations of this study should be noted. Because the size of campus, play, and building
areas were correlated (r=0.60-0.89), the independent effects of each could not be
disentangled28. Also, data were not collected simultaneously in schools and occurred
between February and May. It is possible that seasonal differences in activity levels
might have confounded relationships if for example smaller schools were measured
during the winter and larger schools in the spring. Finally, the use of log-transformed
accelerometer data makes interpretation of the strength of associations difficult.
2.6.3 Summary of School Research
In summary, very few studies have explored the effects of school environments
on students’ physical activity levels. No studies have considered the effects of school
policies or recreational opportunities on teenagers’ physical activity levels. The three
studies summarized above have identified weak relationships between school facilities
and physical activity in youth. The major limitation of these studies is that each was
conducted in geographically limited area, and as such the generalizability of results is
questionable.
In general, further research is needed to explore the importance of physical
education, policies, recreational opportunities (such as sports programming) and facilities
on physical activity. Ideally such research should be conducted in larger and more
geographically diverse populations so that results may be generalized to either the
Canadian or American adolescent population.
16
2.7 Influence of the Neighbourhood Environment on Physical Activity
Similar to school-level research, few studies have examined the effect of the
physical neighbourhood environment on physical activity in youth13. Recent research30
has found that aspects of the built neighbourhood environment influence physical activity
participation in adults over and above the influence of individual-level characteristics.
These environmental features include street-connectivity (i.e. walkability of the street
network), land-use mix (i.e. the mix of residential and commercial use) and the density of
physical activity facilities31.
Associations observed in adults may or may not hold for younger people, who
when compared with adults have more time for recreation, tend to accumulate physical
activity through play, and engage in more spontaneous physical activity behaviours5. In
addition, because youth are not able to drive and are generally less autonomous5, their
activities may be limited to their more immediate neighbourhood surroundings. As such,
access to local parks and public facilities may be especially important for encouraging
physical activity in young people. Neighbourhood safety may also be an important factor
for children and youth, as it likely drives parents’ decisions to allow their children to play
outside and use neighbourhood recreational facilities.
2.7.1 Parks and Physical Activity in Adolescence
As a definition, a park is a public section of land provided and maintained by
municipal or provincial/state governments for outdoor recreation32. Parks often contain
features for passive enjoyment (such as benches and picnic tables) or features for active
recreation (such as baseball diamonds, outdoor hockey rinks, and walking/running trails).
17
Parks often also contain features specifically designed for use by young children, such as
playgrounds and swings. Because teenagers are less autonomous and often bound to their
immediate neighbourhoods as they are unable to drive, parks may be important supports
for their participation in physical activities. Five existing studies33-37 have examined the
association between parks and physical activity in adolescents. Three of these considered
perceived availability33-35 whereas the other two used objective measures of
neighbourhood parks36,37.
2.7.1.1 Perceived Availability of Parks
In a cross-sectional study of 8th and 9th grade girls, Motl et al.33 found that
perceived availability of parks together with perceived availability of neighbourhood
gyms and sports equipment in the home was significantly associated with self-reported
physical activity. Because this study did not separate the effects of parks from other
environment supports (e.g. gyms, home equipment), the independent effect of parks was
not measured. As with the school-level research that used perceived environmental
measures, the use of perceived measures of parks may be subject to recall bias if those
who are physically active and inactive perceive the same environment differently.
Although this bias has not been demonstrated in adolescents, Kirtland et al.38 compared
self-reported neighbourhood characteristics to objective measures among 1112 American
adults, and demonstrated that active adults were more likely to accurately report public
recreation facilities compared to inactive adults (ĸ=0.35 vs. ĸ=0.16, respectively).
Utter et al.34 concluded that New Zealand adolescents aged 13 to 17 years who
perceived living within walking distance of a park were 1.17 (95% CI: 1.1-1.3) times
18
more likely to be vigorously active for 20 minutes three days per week compared to
youth who did not live within walking distance of a park. The magnitude of association
should be interpreted with caution; since physical activity (the outcome) was not rare in
this population, with approximately 50% being active, the odds ratio will overestimate
the relative risk. Another limitation of this study is the use of perceived environmental
measures. Not only did this study depend on perceived availability of facilities,
perceived availability was dependent on perceived distance. For example, a “walkable”
distance for an active adolescent may be much greater than that of an inactive one and
since the area is larger, an active student would be more likely to report a park within
walking distance.
Both of these studies33,34 used measures of overall physical activity (i.e. context-
free measures) rather than context-specific measures of physical activity. Context-
specific measures take into consideration the settings in which physical activity
behaviour takes place, for example at school or outside of school. As suggested by Giles-
Corti39, estimates may be diluted through use of overall physical activity measures. In
other words, having the behaviour of interest more closely match the environmental
characteristic would improve the predictive ability of a model39.
Alton et al.35 considered a context-specific measure of physical activity (walking
trips outdoors) and its association with neighbourhood parks among youth age 9 to 11 in
the United Kingdom. The researchers found that youth who reported more than the mean
number of walking trips (high walkers) were 1.51 (95% CI: 0.98-2.38) more likely to
report having parks in their neighbourhoods, after adjusting for grade, sex, ethnicity, and
19
car ownership. Like the previous studies, the results of this study may have been subject
to recall bias due to the use of perceived measures.
A common limitation of these three studies is the use of self-reported physical
activity, which could result in either non-differential or differential misclassification.
Individuals are expected to over-report their physical activity participation due to social
desirability40,41. If this over-reporting occurs independent of exposure (in this case
neighbourhood features), the misclassification would be non-differential and effect
estimates would be diluted towards the null. If, on the other hand, having parks and other
recreational features in the neighbourhood causes physical activity to be viewed as a
more normative and socially desirable behaviour, adolescents exposed to these features
may be more likely to over-report their physical activity compared to youth not exposed
to these neighbourhood features.
Another common limitation is the use of perceived measures of the environment,
as has previously been explained. A few studies have, however, considered objective
measures of parks.
2.7.1.2 Objective Availability of Parks
Norman et al.36 considered the objective number of parks (as well as the number
of recreational facilities) within 1 mile (1.6 km) of individuals’ homes and its association
with objectively measured moderate-to-vigorous physical activity among 11 to 15 year
old adolescents living in San Diego, California. The locations of parks were determined
according the geographic information system database of the San Diego Association of
Governments. The authors found that number of parks was significantly but weakly
20
correlated with girls’ physical activity (r=0.14, p<0.01); no association was observed for
boys. However, once both number of parks and number of facilities was entered into a
multilevel linear regression model, parks were no longer significantly associated with
girls’ physical activity. However, lack of association in the multivariate model may have
been due to colinearity between neighbourhood parks and facilities; correlation between
facilities was not investigated. This study may also be limited by its use of total rather
than context-specific physical activity.
In a sample of 1556 American grade 6 girls, Cohen et al.37 found that each one
park increase within a half mile radius of girls’ homes (as determined objectively using a
geographical information system) was associated with a 2.8% increase in moderate-to-
vigorous physical activity participation outside of school time. Unlike the Norman et al.
study that used total physical activity as the outcome, Cohen et al. considered only
physical activity that occurred outside of school hours.
A strength of both of these studies36,37 was their use of objective measures of
physical activity and parks, thereby avoiding the problems associated with self-report
physical activity and perceived environmental measures. Another strength of these
studies is that both used multilevel linear regression to account for the hierarchical nature
of the data and clustering by school. The studies may be limited through use of circular
buffers (radii) around individuals’ homes as approximations of neighbourhoods, as it
remains unclear what radial distance is relevant for youth or adults42. In addition, circular
buffers do not consider physical barriers (such as freeways, railways, rivers etc) that
might make locations inaccessible42. It might have been possible to use network buffers
21
as an alternative to circular buffers. This more complicated method uses road distances
instead of radii to construct a polygon area around individuals’ homes. As such, a
network buffer may more accurately reflect “walkable” areas. This method may not
however be equally accurate for different types of street networks (e.g. urban dense grid
networks vs. less dense suburban network)42. Despite the limitations of circular buffers,
the above studies did find modest associations; it is possible that use of more accurate
measures of neighbourhoods might lead to stronger associations.
2.7.1.3 Summary of Parks Research
In summary, there have been five studies exploring the association between
access to parks and physical activity participation in youth, all of which have been cross-
sectional in nature. To date, no studies investigating the effects of parks have been
conducted in Canada. In general, the identified studies suggest that the presence of parks
is weakly associated with adolescents’ physical activity participation, despite differences
in methodology and some limitations. Although the effect sizes are small, small
increases in individuals’ physical activity (and resultantly small reductions in individuals’
risk of disease) could translate into a larger reduction in the health risk of the population
as a whole43. Thus, even small area-level effects in individuals may be meaningful, as the
impact on the health of the entire population could be much greater37.
2.7.2 Recreational Facilities and Physical Activity in Adolescence
As with parks, there has been little research exploring the effect of other
recreational facilities, such as gymnasia, community centres and pools, on activity levels
in young people. Only six studies were identified in a literature search34,36,44-47. Four of
22
these studies used perceptions of facility availability as the exposure of interest34,44-46,
whereas the other two36,47 used objective measures.
2.7.2.1 Perceived Availability of Recreational Facilities
The study by Utter et al.34, previously identified in Section 2.6.1.1, also found that
New Zealand youth aged 13 to 17 years who self-reported that there was a swimming
pool, gym, and youth centre within walking distance of their home were 1.38 (95% CI:
1.20-1.50), 1.44 (1.30-1.60), and 1.11 (0.90-1.30) times more likely, respectively, to be
physically active compared to those who did not report living in close proximity to such
facilities. The limitations of this study were summarized in Section 2.6.1.1.
In a sample of 74 low-income American youth aged 10 to 16 years, Romero44
found that self-reported vigorous physical activity was significantly correlated with
perceived facility quality (r=0.28, p<0.05) but not significantly correlated with perceived
availability (r=0.18, p>0.05). Availability of facilities was measured using an index that
considered not only the presence of certain facilities (namely community centres, outdoor
park/facility, YMCA/YWCA, school playgrounds, backyards, and home gyms) but also
whether each of these was free, paid for by parents, within walking distance, and whether
other transportation was available. The lack of statistical significance with respect to
perceived facility availability was likely due to the small sample size of 74.
Both of the above-mentioned studies34,44 used overall measures of physical
activity rather than focusing on more specific types of physical activity, for example that
which occurs outside of school. These studies also relied on self-reported measures of
physical activity. These two limitations have been previously addressed in Section
23
2.6.1.1. Two studies of perceived facility availability45,46 have addressed these
limitations by considering only moderate-to-vigorous physical activity outside of school,
measured objectively using accelerometry.
Evenson et al.45 found that girls who reported having 9 to 14 facilities that were
easy to get to from home or school had physical activity levels that were 15.3% higher
than girls reporting access to 4 or fewer facilities. Fourteen types of facilities were
considered together: basketball courts, beach/lakes, golf courses, health clubs, martial arts
studios, fields, parks, recreation centres, tracks, skating rinks, pools, trails, tennis courts,
and dance/gymnastic clubs. The independent effects of these facilities were not
considered. If some of these features were strongly associated and others not, the effect
of the combined measure would have been diluted.
Using the same population of grade 6 girls, Scott et al.46 addressed this limitation
by considering the separate effects of 9 of the 14 above-listed facilities on non-school
physical activity. The authors considered each facility in a separate multilevel linear
regression predicting log-transformed non-school minutes of moderate-to-vigorous
physical activity, controlling for individuals’ socioeconomic status, race, population
density, and objective measures of the environment. The study found that perceived
availability of basketball courts (ß=0.10), golf courses (ß=0.14), playing fields (ß=0.10),
running tracks (ß=0.13), pools (ß=0.12), and dance/gymnastic clubs (ß=0.06) was each
significantly but weakly linearly associated with girls’ non-school minutes of physical
activity (log-transformed), but that martial arts studios and skating rinks were not.
24
2.7.2.2 Objective Availability of Recreational Facilities
Three studies have considered objective measures of the neighbourhood
environment36,46,47. The study by Scott et al.46 considered not only the effects of
perceived but also objective measures of facilities on grade 6 girls’ physical activity
levels. Unlike perceptions of facility availability, objectively measured facilities were
not associated with girls’ physical activity, with the exception of basketball courts, after
controlling for grade, socioeconomic status, population density and perceived measures.
Based on regression models that included both the perceived and objective measure of
the facilities, the authors concluded that perceptions of facilities were associated with
physical activity independent of objective measures. The authors concluded that
objective facilities were not associated with physical activity.
Norman et al.36 examined the number of public and private recreational facilities
within 1 mile of individuals’ homes and found this was weakly correlated (r=0.11,
p<0.016) with physical activity among females but not males. Together with number of
parks and intersection density, these measures of environment explained 3% of the
variance in minutes per day of moderate-to-vigorous physical activity36. The strengths
and limitations of this study were presented in Section 2.6.1.2.
Using geographic information systems and multi-level modelling, Gordon-Larsen
et al.47 found that objective measures of the number of recreational facilities within 8 km
of homes was significantly positively related to physical activity in a sample of 20745
American adolescents. Compared to those with no recreational facilities in their
neighbourhood, those with one facility had 1.03 (95% CI: 1.01-1.06) times the odds of
25
engaging in self-reported moderate to vigorous physical activity 5 or more times per
week; those with 7 facilities had 1.26 (95% CI: 1.06-1.50) times the odds47. These
findings are strengthened by the use of a large, nationally representative sample of
American teenagers.
2.7.2.3 Summary of Recreational Facilities Research
In short, of the few studies that have investigated the effects of recreational
facilities on physical activity among youth, most have found weak associations. With the
exception of the Romero study44, the studies identified have considered only availability
and not affordability, quality or accessibility47. In addition, the effects of neighbourhood
recreational facilities have not been examined in Canadian populations.
2.7.3 Neighbourhood Safety
In addition to availability of recreational spaces, both real and perceived
neighbourhood safety may be important in influencing teenagers’ physical activity. The
safety of a neighbourhood may be described in terms of physical hazards that may cause
injury to individuals while engaging in physical activity (such as road hazards, broken
glass, discarded syringes) or social hazards (such as fear of strangers, abduction, and
other types of crime.) How an individual perceives his or her environment may be
important in influencing adolescent activity, irrespective of true levels of neighbourhood
safety.
Ten identified studies have investigated the influence of varying aspects of
neighbourhood safety on physical activity among youth33-35,44,45,48-52. Seven of these
26
considered the effects of teenagers’ perceptions of neighbourhood safety33-35, 44,45,48,49
whereas three have considered the effects of more tangible measures of safety50-52.
2.7.3.1 Perceptions of Neighbourhood Safety
Five studies have reported a positive relationship between perceptions of
neighbourhood safety and physical activity34,35,44,45,48 whereas two found no
association33,49.
Utter et al.34 found that perceptions of neighbourhood safety were positively
associated with adolescents’ (n=9699) physical activity participation in New Zealand.
Youth who reported feeling safe in their neighbourhood had 1.46 (95% CI: 1.3-1.6) times
the odds of self-reporting 20 minutes of vigorous activity at least 3 days per week,
compared to youth who felt unsafe. This study did not evaluate different types of
neighbourhood safety. It is unclear whether this construct measures the physical safety of
spaces or other dangers (such as violence, crime, or strangers).
Mota et al.48 investigated the cross-sectional association between perceptions of
crime and self-reported leisure-time physical activity among Portuguese youth. Girls
who felt that the crime rate made it unsafe/unpleasant to walk in their neighbourhood
were less likely to be physically active during their leisure time (OR: 0.60; 95% CI:0.39-
0.91); no association was observed for boys.
Romero44 considered the effect of combined perceptions of neighbourhood
hazards (traffic, trash, crime, noise, gangs, access to parks, prejudice, drugs) as well as
perceptions of recreational facility safety on physical activity among 74 students aged 10-
16 from a low-income neighbourhood. Feeling safe when certain adults are at facilities,
27
feeling that facilities are located in safe areas, and feeling safe when walking to facilities
were each positively related to physical activity. Together these variables accounted for
13% of the variance in physical activity. Conversely, more perceived hazards were
associated with increased physical activity, accounting for 4% of variance. The
independent effects of the neighbourhood hazards of interest were not considered.
Results of this study are likely not widely generalizable to other populations, as the study
population represented only low-income individuals from one geographical region with
crime rates well above the U.S. average.
Alton et al.35 found differing effects of social and physical hazards on walking
trips among 9-11 year old youth in the United Kingdom. Students who had more worries
about strangers when out alone had a lower odds of achieving the mean number of
walking trips (OR: 0.66; 95% CI: 0.45-1.02) whereas increased concerns about road
safety was associated with an increased odds of walking (OR: 1.88; 95% CI: 1.27-2.80).
The authors concluded that the former relation was likely causal whereas the latter was
attributable to the fact that children who walk more frequently have greater exposure to
the environment and more reminders from parents about being careful while walking
outdoors.
These studies all made use of self-reported physical activity, the limitations of
which have been described previously. Unlike these, Evenson et al45 considered the
effect of perceived crime on objectively measured non-school physical activity among
grade 6 American girls. A neighbourhood safety scale was constructed from 4 variables
of perceived safety (safe to walk/jog, walkers visible at night, amount of crime, and street
28
lighting). For every 1-unit increase on the safety scale, an increase of 4.6% in non-school
moderate-to-vigorous physical activity was observed. However the direction of the
association between the individual items comprising the scale differed; feelings of safety,
visibility of pedestrians, and street lighting were positively related to physical activity,
whereas perceptions of crime were inversely related. By combining these measures, the
effect of the overall scale of perceived safety was likely diluted. The authors also
considered the relative importance of perceptions of safety and perceptions of facility
availability. Increased street lighting, increased traffic, having walking trails and access
to facilities were independently associated with girls’ non-school physical activity.
Unlike these five studies that found moderate relationships between perceptions
of safety and physical activity, two studies found no association between these measures.
The first33 considered the cross-sectional and longitudinal effects of neighbourhood
safety on physical activity among 8th and 9th grade girls in South Carolina, finding no
associations. The authors used a scale of perceived safety that considered two questions
together: feeling “safe to walk or jog alone in [the] neighbourhood” and difficulty
walking in the “neighbourhood because of things like traffic, no sidewalks, dogs and
gangs”. The lack of association may be due to combining variables related to physical
activity in different ways; along these lines, the Romero44 study found that increased
perceptions of similar hazards (traffic, gangs, etc) was associated with increased physical
activity whereas feeling that facilities were unsafe was associated with decreased
physical activity. Another possible reason was lack of variability in perceptions of
safety, as the average safety score was quite high (7.5 on a scale ranging from 2 to 10)33.
29
In a subsequent study49, the authors reinvestigated the cross-sectional association
between this perceived safety scale and physical activity among 12th grade girls in South
Carolina. The authors found no association between perceptions of safety and physical
activity.
2.7.3.2 Objective Measures of Neighbourhood Safety
Gomez et al52 considered the effects of objectively measured density of violent
crime within a half mile of homes on self-reported outdoor non-school physical activity
among 7th grade mainly Mexican-American youth (n=177) living in San Antonio, Texas.
In addition to objective measures, the authors also considered perceptions of
neighbourhood safety. The authors reported that measures of violent crime and perceived
safety were significantly independently related to girls’, but not boys’, physical activity
outdoors.
Using objective measures of serious crime and a sample of nearly 18,000
American 7th to 12th grade students, Gordon-Larsen et al.50 found that students in areas
with the highest serious crime rates had 0.77 (95% CI: 0.66-0.91) times the odds of being
within the highest category of self-reported moderate-to-vigorous activity. This study did
not use multilevel modelling techniques. Higher-level data was disaggregated to the
individual and was treated as though it were independent, likely leading to overestimates
of significance53.
One subsequent study using multilevel analyses found statistical significant
associations between safety and physical activity. In their study of 1378 youth aged 12 to
16 years living in Chicago IL, Molnar et al.51 considered the effects of objective social
30
and physical disorders as well as neighbourhood safety on physical activity outside of
school. Using direct observation, the authors measured aspects of social disorder
(presence of fighting, drinking, gangs, people selling drugs, prostitution) and physical
disorder (the presence of graffiti, discarded cigarettes and beer bottles, abandoned
vehicles, condoms, and syringes). A scale was constructed that considered the adult
residents’ (n=8782) perceptions of availability of places to play other than the street,
safety of parks during the day and night, condition of equipment within parks, and
awareness of other adults watching out for children. Teenagers’ hours of extracurricular
recreational activity per week were lower in areas deemed as unsafe, as well as areas with
higher levels of social and physical disorder. Residents’ perceptions of safety were most
strongly related to youth physical activity; for every 1-unit increase on the scale assessing
neighbourhoods as unsafe to play, a 1.44 hour/week decrease in physical activity was
observed.
2.7.3.3 Summary of Neighbourhood Safety Research
Of the ten identified studies, the majority have found moderate associations
between measures of neighbourhood safety and physical activity among youth. The
majority of studies have been cross-sectional; it is plausible that individuals’ physical
activity behaviour influences their perceptions of safety through increased exposure to
the environment, rather than perceptions influencing physical activity. To date no study
has investigated the effects of perceived or objective safety on physical activity in a
defined population of Canadian adolescents. In general the studies have been limited to
small geographic regions, typically within larger urban areas.
31
2.8 Summary and Directions for Future Research
In short, based on the identified studies, both school and neighbourhood
characteristics appear to be associated with physical activity in adolescence.
Neighbourhood-level research has developed more widely than school-level research,
which is surprising given that schools are ubiquitous and provide both facilities and
opportunities for physical activity. The greater amount of neighbourhood-level research,
as compared to school-level research, may have occurred as a result of prior studies in
adult populations and the desire to extend results of these studies to younger populations.
The majority of adolescent based research appears to support the idea that
neighbourhood facilities are weakly associated with adolescents’ physical activity levels.
Stronger associations have been observed for neighbourhood safety. This may suggest
that safety is more important in influencing physical activity than availability of parks
and facilities. However, only one study to date has simultaneously considered the effects
both safety and facility availability45; as such, it remains unclear if safety and availability
of recreational features are independent predictors of physical activity and if so, which
are the strongest. This presents a unique research question to be investigated in this
thesis.
Research in the area of neighbourhood determinants of physical activity is
required, not only to determine the temporality of associations and the relative
importance of neighbourhood characteristics, but also in developing a standard approach
to measuring physical activity and the environment in order to increase comparability
between studies. The effects of school characteristics on physical activity are even less
32
clear, due to the small number of studies in this area. Few studies of schools have
focused on facilities; no studies have considered the effects of policies or recreational
opportunities on physical activity in youth. The majority of existing studies have been
conducted in small geographically limited populations. Larger, more diverse,
populations should be studied in the future.
The effects of neighbourhood and school characteristics on rates of physical
activity have yet to be extended to the Canadian context. With the exception of the two
Canadian studies exploring area-level socioeconomic status12 and the school
environment27, no other studies were identified exploring the effects of school and
neighbourhood characteristics on physical activity in Canadian adolescents.
2.9 References
(1) Public Health Agency of Canada. Canada's Physical Activity Guide for Youth. www
phac-aspc gc ca/pau-uap/paguide/child_youth/index html 2002
(2) U.S.Department of Health and Human Services, U.S.Department of Agriculture. Dietary
Guidelines for Americans 2005: Chapter 4. Physical Activity. www healthierus
goc/dietaryguidelines 2005
(3) Janssen I, Katzmarzyk PT, Boyce WF, Vereecken C, Mulvihill C, Roberts C, et al.
Comparison of overweight and obesity prevalence in school-aged youth from 34
countries and their relationships with physical activity and dietary patterns. Obes Rev
2005 May;6(2):123-32.
(4) Hallal PC, Victora CG, Azevedo MR, Wells JC. Adolescent physical activity and health:
a systematic review. Sports Med 2006;36(12):1019-30.
(5) Davison KK, Lawson CT. Do attributes in the physical environment influence children's
physical activity? A review of the literature. Int J Behav Nutr Phys Act 2006;3:19.
33
(6) World Health Organization. Global Strategy on Diet, Physical Activity and Health: Diet
and physical activity: a public health priority. www who int/dietphysicalactivity/en/ 2007
(7) Katzmarzyk PT, Janssen I, Ardern CI. Physical inactivity, excess adiposity and premature
mortality. Obes Rev 2003 Nov;4(4):257-90.
(8) Jebb SA, Moore MS. Contribution of a sedentary lifestyle and inactivity to the etiology of
overweight and obesity: current evidence and research issues. Med Sci Sports Exerc 1999
Nov;31(11 Suppl):S534-S541.
(9) Tjepkema M, Shiels M. Measured Obesity: Overweight Canadian children and
adolescents. Statistics Canada Catalogue no.82-620-XWE2005001; 2005.
(10) Sallis JF, Prochaska JJ, Taylor WC. A review of correlates of physical activity of
children and adolescents. Med Sci Sports Exerc 2000 May;32(5):963-75.
(11) Bryan SN, Tremblay MS, Perez CE, Ardern CI, Katzmarzyk PT. Physical activity and
ethnicity: evidence from the Canadian Community Health Survey. Can J Public Health
2006 Jul;97(4):271-6.
(12) Janssen I, Boyce WF, Simpson K, Pickett W. Influence of individual- and area-level
measures of socioeconomic status on obesity, unhealthy eating, and physical inactivity in
Canadian adolescents. Am J Clin Nutr 2006 Jan;83(1):139-45.
(13) Ferreira I, van der HK, Wendel-Vos W, Kremers S, van Lenthe FJ, Brug J.
Environmental correlates of physical activity in youth - a review and update. Obes Rev
2007 Mar;8(2):129-54.
(14) Sharma M. School-based interventions for childhood and adolescent obesity. Obes Rev
2006 Aug;7(3):261-9.
(15) Sallis JF, Cervero RB, Ascher W, Henderson KA, Kraft MK, Kerr J. An ecological
approach to creating active living communities. Annu Rev Public Health 2006;27:297-
322.
34
(16) Gillander GK, Hammarstrom A. Can school-related factors predict future health
behaviour among young adolescents? Public Health 2002 Jan;116(1):22-9.
(17) Booth M, Okely A. Promoting physical activity among children and adolescents: the
strengths and limitations of school-based approaches. Health Promot J Austr 2005
Apr;16(1):52-4.
(18) Dwyer JJ, Allison KR, LeMoine KN, Adlaf EM, Goodman J, Faulkner GE, et al. A
provincial study of opportunities for school-based physical activity in secondary schools.
J Adolesc Health 2006 Jul;39(1):80-6.
(19) Barnett TA, O'Loughlin J, Gauvin L, Paradis G, Hanley J. Opportunities for student
physical activity in elementary schools: a cross-sectional survey of frequency and
correlates. Health Educ Behav 2006 Apr;33(2):215-32.
(20) Allison KR, Adlaf EM. Structured opportunities for student physical activity in Ontario
elementary and secondary schools. Can J Public Health 2000 Sep;91(5):371-5.
(21) Lee SM, Burgeson CR, Fulton JE, Spain CG. Physical education and physical activity:
results from the School Health Policies and Programs Study 2006. J Sch Health 2007
Oct;77(8):435-63.
(22) Young DR, Felton GM, Grieser M, Elder JP, Johnson C, Lee JS, et al. Policies and
opportunities for physical activity in middle school environments. J Sch Health 2007
Jan;77(1):41-7.
(23) O'Hara TN, Zizzi S, Zedosky L, Wright J, Vitullo E. School-based opportunities for
physical activity in West Virginia public schools. Prev Med 2004 Oct;39(4):834-40.
(24) Lounsbery M, Bungum T, Smith N. Physical activity opportunity in K-12 public school
settings: Nevada. J Phys Act Health 2007 Jan;4(1):30-8.
(25) Metos J, Nanney MS. The strength of school wellness policies: one state's experience. J
Sch Health 2007 Sep;77(7):367-72.
35
(26) Sallis JF, Conway TL, Prochaska JJ, McKenzie TL, Marshall SJ, Brown M. The
association of school environments with youth physical activity. Am J Public Health
2001 Apr;91(4):618-20.
(27) Fein AJ, Plotnikoff RC, Wild TC, Spence JC. Perceived environment and physical
activity in youth. Int J Behav Med 2004;11(3):135-42.
(28) Cradock AL, Melly SJ, Allen JG, Morris JS, Gortmaker SL. Characteristics of school
campuses and physical activity among youth. Am J Prev Med 2007 Aug;33(2):106-13.
(29) Hully SB, Cummings SR, Browner WS, Grady D, Hearst N, Newman TB. Designing
Clinical Research. 2nd Edition ed. Philadephia: Lippincott Williams & Wilkins; 2001.
(30) Humpel N, Owen N, Leslie E. Environmental factors associated with adults' participation
in physical activity: a review. Am J Prev Med 2002 Apr;22(3):188-99.
(31) Johnson-Taylor WL, Everhart JE. Modifiable environmental and behavioral determinants
of overweight among children and adolescents: report of a workshop. Obesity (Silver
Spring) 2006 Jun;14(6):929-66.
(32) Merriam-Webster. Merriam-Webster's Online Dictionary. www merriam-webster
com/dictionary/park 2008
(33) Motl RW, Dishman RK, Ward DS, Saunders RP, Dowda M, Felton G, et al. Perceived
physical environment and physical activity across one year among adolescent girls: self-
efficacy as a possible mediator? J Adolesc Health 2005 Nov;37(5):403-8.
(34) Utter J, Denny S, Robinson EM, Ameratunga S, Watson P. Perceived access to
community facilities, social motivation, and physical activity among New Zealand youth.
J Adolesc Health 2006 Nov;39(5):770-3.
(35) Alton D, Adab P, Roberts L, Barrett T. Relationship between walking levels and
perceptions of the local neighbourhood environment. Arch Dis Child 2007 Jan;92(1):29-
33.
36
(36) Norman GJ, Nutter SK, Ryan S, Sallis JF, Calfas KJ, Patrick K. Community design and
access to recreational facilities as correlates of adolescent physical activity and Body-
Mass Index. Journal of Physical Activity and Health 2006;3(Suppl 1):S118-S128.
(37) Cohen DA, Ashwood JS, Scott MM, Overton A, Evenson KR, Staten LK, et al. Public
parks and physical activity among adolescent girls. Pediatrics 2006 Nov;118(5):e1381-
e1389.
(38) Kirtland KA, Porter DE, Addy CL, Neet MJ, Williams JE, Sharpe PA, et al.
Environmental measures of physical activity supports: perception versus reality. Am J
Prev Med 2003 May;24(4):323-31.
(39) Giles-Corti B, Timperio A, Bull F, Pikora T. Understanding physical activity
environmental correlates: increased specificity for ecological models. Exerc Sport Sci
Rev 2005 Oct;33(4):175-81.
(40) Adams SA, Matthews CE, Ebbeling CB, Moore CG, Cunningham JE, Fulton J, et al. The
effect of social desirability and social approval on self-reports of physical activity. Am J
Epidemiol 2005 Feb 15;161(4):389-98.
(41) Roberts C, Alexander L, Currie D, Haug E, Komkov A, Tynjala J, et al. Health
Behaviour in School-Aged Children Protocol for 2005/06 Survey. Section 2, Scientific
rationalesfor focus areas: Physical Activity. 2005.
(42) Oliver LN, Schuurman N, Hall AW. Comparing circular and network buffers to examine
the influence of land use on walking for leisure and errands. Int J Health Geogr
2007;6:41.
(43) Webb P, Bain C, Pirozzo S. Essential Epidemiology: An Introduction for Students and
Health Professionals. New York: Cambridge University Press; 2005.
(44) Romero AJ. Low-income neighborhood barriers and resources for adolescents' physical
activity. J Adolesc Health 2005 Mar;36(3):253-9.
37
(45) Evenson KR, Scott MM, Cohen DA, Voorhees CC. Girls' perception of neighborhood
factors on physical activity, sedentary behavior, and BMI. Obesity 2007 Feb;15(2):430-
45.
(46) Scott MM, Evenson KR, Cohen DA, Cox CE. Comparing Perceived and Objectively
Measured Access to Recreational Facilities as Predictors of Physical Activity in
Adolescent Girls. J Urban Health 2007 Mar 31.
(47) Gordon-Larsen P, Nelson MC, Page P, Popkin BM. Inequality in the built environment
underlies key health disparities in physical activity and obesity. Pediatrics 2006
Feb;117(2):417-24.
(48) Mota J, Gomes H, Almeida M, Ribeiro JC, Santos MP. Leisure time physical activity,
screen time, social background, and environmental variables in adolescents. Pediatr
Exerc Sci 2007 Aug;19(3):279-90.
(49) Motl RW, Dishman RK, Saunders RP, Dowda M, Pate RR. Perceptions of physical and
social environment variables and self-efficacy as correlates of self-reported physical
activity among adolescent girls. J Pediatr Psychol 2007 Jan;32(1):6-12.
(50) Gordon-Larsen P, McMurray RG, Popkin BM. Determinants of adolescent physical
activity and inactivity patterns. Pediatrics 2000 Jun;105(6):E83.
(51) Molnar BE, Gortmaker SL, Bull FC, Buka SL. Unsafe to play? Neighborhood disorder
and lack of safety predict reduced physical activity among urban children and
adolescents. Am J Health Promot 2004 May;18(5):378-86.
(52) Gomez JE, Johnson BA, Selva M, Sallis JF. Violent crime and outdoor physical activity
among inner-city youth. Prev Med 2004 Nov;39(5):876-81.
(53) Hox JJ. Applied Multilevel Analysis. http://www geocities com/joophox/publist/amaboek
pdf 1995
38
Chapter 3 Manuscript 1: Associations between school recreational
environments and physical activity
This manuscript conforms to the specifications for submission to the peer-reviewed journal
American Journal of Preventive Medicine.
Authors: Marianne E Nichol, B.Sc.H., William Pickett, Ph.D., Ian Janssen, Ph.D.
Departments of Community Health and Epidemiology, Emergency Medicine and School of Kinesiology and Health Studies
Queen’s University, Kingston, Ontario, Canada
Address correspondence and reprint requests to:
Dr. Ian Janssen School of Kinesiology and Health Studies Queen’s University, Kingston Ontario, Canada K7L3N6 Phone: +1 (613) 533-6000 x 78631 Fax: +1 (613) 533-2009 Email: [email protected]
Total word count (text only): 2999
Number of pages: 24
Number of tables: 5
Number of figures: 1
39
Abstract
Background: School environments may promote or hinder physical activity
among young people. The purpose of this research was to examine relationships between
adolescent physical activity, the overall school recreational environment, and individual
school characteristics.
Methods: Using multilevel logistic regression, data from 7638 grade 6-10
students from 154 schools who participated in the 2005/06 Canadian Health Behaviour in
School-Aged Children Survey were analyzed. Student responses to validated physical
activity scales were dichotomized (≥ 2 hours/week vs. <2 hours/week). Using principals’
reports, a cumulative index was constructed that considered together: policies, varsity and
intramural athletics, presence and condition of fields, and condition of gymnasia.
Results: Moderate gradients in physical activity were observed according to
number of recreational features/opportunities. Overall, students at schools with more
recreational features/opportunities experienced higher rates of class-time and free-time
physical activity; this was strongest among high school students. Boys’ rates of class-
time physical activity were 1.53 (95% CI: 1.12-1.80) times higher at high schools with
the most recreational features compared to those at schools with the fewest (ptrend< 0.05).
Similarly, girls’ rates of free-time physical activity at school were 1.62 (95% CI: 0.96-
2.21) times greater at high schools with the most opportunities/facilities compared to
those at schools with the fewest (ptrend< 0.05). Modest associations were observed
between individual school characteristics and class-time and free-time physical activity.
40
Conclusions: Taken together, the cumulative effect of school recreational
features may be more important than any one characteristic individually. School policies
surrounding physical activity require tailoring to specific grades and genders.
41
Introduction
The Centers for Disease Control and Prevention recommend that children and
youth engage in 60 minutes of moderate-to-vigorous physical activity on most if not all
days of the week1. In a recent survey of 10-15 year olds from 34 countries, less than 50%
of the participants within each country achieved this guideline of at least 5 days per
week2. These low physical activity rates are concerning. The health benefits of physical
activity are seen as early as adolescence3, and this behaviour may track into adulthood
where the health consequences are more evident4.
Given the limited success of interventions that have attempted to increase
physical activity by focusing on individual behaviour modification, research has begun to
focus on how physical and sociocultural environments affect physical activity5. In their
ecologic framework for active living, Sallis et al.5 propose that physical activity is
influenced by intrapersonal characteristics (e.g. beliefs, education) as well as physical
characteristics of neighbourhoods, homes, and schools in which individuals live.
Investigating environmental characteristics that facilitate physical activity may identify
environmental changes that could increase participation5.
Because young people spend a significant portion of their time at school, schools
have the potential to influence physical activity through the provision of facilities and
opportunities6, recreational support, and instruction from trained educators7.
Surprisingly, few studies have examined the effects of the school recreational
environment on students’ physical activity participation8. In four existing studies weak
relationships were found9-12. Each of these studies was conducted in small samples in
42
geographically limited areas. No existing observational studies have considered the
effects of school athletic opportunities and policies on different components of physical
activity participation at school (e.g. during class- or free-time).
The purpose of this study was to explore the individual and combined importance
of physical education policies, recreational opportunities (e.g. sports programming), and
facilities on physical activity participation at school. The present study is the first to
simultaneously examine relationships between all of these school characteristics. The use
of a large, nationally representative sample and a multilevel modeling approach were
additional methodological strengths.
Methods
Design
This research involved an analysis of cross-sectional data from the 2005/06
Canadian Health Behaviour in School-Aged Children Survey (HBSC). The HBSC
collected information on demographic characteristics, health behaviours, and health
outcomes from students in grades 6-10 in publicly funded schools across all Canadian
provinces and territories. Youth attending private, special-needs, or home schools were
excluded, as were institutionalized, incarcerated, or homeless youth13. Consent was
solicited from school boards and individual schools; parental and individual consent was
obtained from all participants. The survey is self-weighting and used a cluster sampling
design, with randomly selected classrooms reflecting the provincial distributions of
schools by size, location, language, and religion13. The Canadian HBSC was conducted

43
in collaboration with the World Health Organization and follows an established
international protocol13.
The principal or vice-principal of participating schools completed an
Administrator Survey that requested information about school characteristics, including
the size and demographic distribution of the school, programs and activities, availability
of facilities and the condition of facilities. This Administrator Survey was subsequently
linked to individual-level information from the student participants.
Sample
The HBSC collected information from 9672 youth in grades 6-10 from 188
schools. Thirty-four schools were not included because the administrator survey was
incomplete (19 schools) or because they could not be linked to student information (15
schools), leaving 7836 students from 154 schools. Of these, 198 students were excluded
due to incomplete physical activity information, leaving 7638 (79.0%) students for
analysis.
Measures
Outcomes – Physical activity at school
Outcomes of interest were participation in moderate-to-vigorous physical activity
at school during 1) class-time and 2) free-time. Students provided ordinal responses to
the questions: “about how many hours a week do you usually take part in physical
activity that makes you out of breath or warmer than usual in your [class time/free time
44
(example lunch)] at school?” There were 9 response categories for both questions
ranging from “none at all” through “7 or more hours”. Responses were grouped to create
two dichotomous outcomes: 1) physically active during class-time at school (≥2 vs. <2
hours/week) and 2) physically active during free-time at school (≥2 vs. <2 hours/week).
Total physical activity is composed of activities that occur inside and outside of school;
as such a threshold of 2 hours per week during free-time and class-time were respectively
assumed to be consistent with the physical activity guideline for 60 minutes of moderate-
to-vigorous physical activity on most if not all days of the week1. These thresholds
reflect the amount of physical activity met by ~45% of students, consistent with the
overall rate of physical activity participation in Canadian youth2. A dichotomous
outcome was used so that results would be easily interpretable for health policy14.
Exposures – School recreational environment and policies
Principals answered questions about the condition and availability of school
recreational facilities, and the presence of recreational policies, programs, and activities
at their school. These questions determined whether a policy was in place to increase
physical activity (yes or no), whether physical education was in the curriculum (required,
available but not required, not available), whether late-bus service was provided for
students participating in extra-curricular activities (yes or no), and the number of varsity
and intramural sports offered. Varsity sports teams are those that compete with other
schools and often require try-outs; intramural sports are usually open to anyone wishing
to play and competition occurs within a school. In addition, principals were asked if
45
their school had a playing field (yes or no) or gymnasium/weight room (yes or no) and
whether these facilities were in good condition. Responses for gym and field condition
were grouped to create 3 categories: poor condition (disagree and strongly disagree),
neutral (neither agree nor disagree), and good condition (agree and strongly agree).
Finally, an additive scale of the cumulative number of supportive recreational features
was constructed that considered: having a policy (yes/no), having 4+ varsity sports
(yes/no), having 4+ intramural sports (yes/no), presence of a playing field (yes/no),
having a field in good condition (yes/no), and having a gymnasium in good condition
(yes/no).
Confounders
Variables considered a priori as potential confounders were grade, gender, and
family socioeconomic status at the individual-level, and school safety, school size, and
urban/rural location at the area-level. Students' responses to questions regarding vehicle
and computer ownership, bedroom sharing, and holiday travel were used to create a 3-
point Family Affluence Scale (low, medium, high) which was used as a proxy for
socioeconomic status15 and which is associated with physical activity in Canadian
adolescents16. Principals were asked to what extent (not a problem, minor problem,
moderate problem, major problem) the following issues were a problem at their school:
classroom disturbances, physical conflicts, weapon possession, drug/alcohol use,
vandalism, race/ethnic based conflicts, and verbal abuse of teachers. Responses were
combined to obtain an overall dichotomous measure of school safety (not a problem;
46
minor/moderate/major problem). Principals reported the number of students attending
their school; schools were divided into low, medium, and high population tertiles.
Urban-rural school location was imputed from Statistics Canada’s Census Metropolitan
Area data and based on school postal code. Urban schools were those located in urban
cores, urban fringes, secondary urban cores, and urban areas outside metropolitan areas;
rural schools were those located in rural fringes or rural areas outside metropolitan
areas17.
Analysis
Statistical analyses were performed in SAS version 9.1 (SAS, Cary NC). The first
set of analyses examined associations between the potential confounders and physical
activity at school during class-time and free-time, respectively. Each covariate was
entered into a multilevel logistic regression model. Covariates that were significantly
(p<0.05) associated with the physical activity outcomes were retained in all subsequent
models to account for confounding. Correlation between the school-level
characteristics/policies was explored using Spearman rank correlations and chi-square
tests.
Next, relationships between school recreational characteristics and physical
activity outcomes were examined. Multilevel logistic regression was applied to account
for the clustered and hierarchical nature of the data. Because physical activity is not a
rare outcome, the odds ratios (OR) obtained from logistic regression do not approximate
relative risk18. Therefore, rate ratios (RR) were derived by adjusting OR by the
47
proportion of the outcome in the referent groups (P0) as follows: RR=OR/((1-P0) + (P0 x
OR))18.
The SAS GLIMMIX procedure was used to fit generalized linear mixed models
with a binomial distribution and logit link. The method of estimation was a restricted
maximum likelihood procedure. All multilevel logistic regression models employed a
Newton-Raphson with ridging technique to aid convergence. First, models were fit to
test whether there were random slopes for grade, gender, and family affluence to
determine whether the effects of these characteristics differed between schools. No
significant random slopes were detected for either physical activity outcome. Second,
because cross-level interactions between the school-level variables and grade, gender,
and family affluence were suspected a priori, these cross-level interactions were tested
while controlling for significant covariates. For variables with a significant interaction
by at least one of the variables, subgroup analyses for each of these variables were
performed and the statistical significance of the interaction presented.
Results
The distribution of the student participants according to demographic
characteristics is shown in Table 1. Overall, 55.1% and 49.3% of students reported being
physically active for ≥2 hours/week during class-time and free-time at school,
respectively. Table 2 presents the distribution of schools according to the recreational
features.
48
Confounders
Gender, grade, and family affluence were associated with physical activity at
school (Table 1). School safety and school population size, but not urban/rural school
location, were associated with physically activity (Table 3). Therefore, all models of the
association between school characteristics/policies and physical activity included gender,
grade, family affluence, school safety, and school population as covariates.
Overall, the school characteristics were not strongly correlated with each other,
with correlation coefficients ranging from –0.17 to 0.23 and the majority near zero
(Appendix B – Table A & B). Due to the lack of correlations between school-level
variables, multivariate relationships that simultaneously considered the individual school-
level variables were not explored.
School characteristics and physical activity
Significant interactions for at least one of the individual-level variables (gender,
grade, family affluence) were observed for the majority of the school characteristics and
physical activity associations. Therefore, results are presented within gender, age, and
family affluence subcategories (Tables 4 and 5).
Class-time physical activity (Table 4). The majority of the school characteristics
were not significantly associated with class-time physical activity; as such only
significant results are discussed. Having a playing field was positively associated with
boys’ class-time physical activity (RR: 1.29; 95% CI: 1.12-1.44). Junior high school
students at schools with gyms in poor condition were 1.28 (95% CI: 1.06-1.46) times

49
more likely to be physical activity compared to students at schools with gyms in neutral
condition. Students at high schools with 4 or more intramural sports were 1.23 (95% CI:
0.92-1.52) times more likely to be physically active during class-time than students at
high schools with no intramural sports.
Free-time physical activity (Table 5). Elementary school students attending
schools with a policy to increase physical activity were 1.20 (95% CI: 0.99-1.41) times
more likely to be physically active during their free-time compared to students attending
schools without such a policy; no association was observed for older youth. Having
varsity sports was significantly related to elementary students’ free-time physical activity.
Having a playing field was associated with boys’ (RR: 1.21; 95% CI: 1.04-1.37), but not
girls’, free-time physical activity. Conversely, the playing field condition was important
for girls but not boys. Boys at schools with gymnasia in poor and good condition were
approximately 25% more likely to be physically active during their free-time compared to
boys at schools with gymnasia in neutral condition; gymnasium condition was not
important for girls.
Cumulative effect of school characteristics on physical activity
The cumulative effect of supportive recreational facilities, opportunities, and
policies was more pronounced than the effect of the individual characteristics. Increased
number of supportive features was associated with increased participation in class-time
(Table 4) and free-time (Table 5) physical activity at school. In particular, this scale was
most strongly related to class-time physical activity among high school boys
50
(ptrend=0.004); boys’ participation in class-time physical activity was 53% higher in high
schools with 5-to-6 recreational features compared to schools with none or 1 feature
(Figure 1). The effect of increased number of recreational features was most strongly
related to high school girls’ free-time physical activity (ptrend=0.049). Girls at high
schools with several features (5-6) were 62% more likely to be physically active than
girls at schools with few features (0-1) (Figure 1).
Discussion
The cumulative effect of school recreational features on students’ physical
activity was greater than the modest associations observed between individual
characteristics and adolescents’ physical activity at school. In general, most associations
varied between boys and girls, students’ from different grades, and students’ of varying
family affluence. Taken together, the findings suggest that the overall school
recreational environment may be more important in promoting physical activity than any
single policy, facility, or recreational opportunity.
Few school characteristics were associated with adolescents’ class-time physical
activity. Because students in grades 6-9 are required to take physical education in most
school boards in Canada, one might expect little variability in the outcome. However,
this was not the case as the proportion of students participating in at least 2 hours/week of
class-time physical activity varied from 23% to 85% across the schools studied. This
variability was not well explained by the school characteristics under consideration, nor
by age and gender, well-established individual-level determinants of overall physical
51
activity. This suggests that other variables not considered here might be important in
determining students’ class-time physical activity.
Class-time physical activity occurs under the direction and supervision of a
physical education teacher, with students sometimes having little choice in the sports and
activities taught and their intensity. As such, characteristics of the school may not be as
important as characteristics of the physical education classes themselves. Speculatively,
characteristics of teachers (e.g. training, class involvement), class sizes, equipment
availability and quality, and the specific modules in the curriculum may be important in
determining class-time physical activity. Consistent with this hypothesis, McKenzie et
al.11 demonstrated that grade 6 girls’ activity during physical education classes varied
depending on characteristics of the class; girls spent a larger proportion of their time
engaging in physical activity during fitness activities (as compared to skill drills and
game play), during co-ed classes, and during outdoor classes11.
Unlike younger students who must take physical education, older youth (e.g.
those in grade 10) may choose to take physical education and as such have more control
over the physical activity they achieve during class-time. The fact that the composite
scale describing the overall school recreational environment was most strongly related to
high school students physical activity suggests that the school characteristics considered
may be important in encouraging older students to take physical education.
Unfortunately this possibility could not be explored since information on participants’
enrolment in physical education was not available.

52
Compared to class-time physical activity, the amount of free-time physical
activity in which students engage is highly self-regulated. Interestingly, several school
characteristics were related to this outcome. Having a greater number of varsity sports
was a predictor of student free-time physical activity, particularly for girls and students in
lower grades. However, the temporality of the association should be interpreted with
caution; it is plausible that schools might provide more varsity sports to accommodate the
interests of a more active student body. Likewise, temporality could potentially explain
the counterintuitive finding that poor field and gym condition were associated with
increased free-time physical activity in some subgroups; although good field and gym
condition may drive students to use these facilities, increased use of the facilities may
cause them to deteriorate. Interestingly, presence of a field but not its condition was
related to boys’ physical activity; this may suggest that aesthetics are important for
females but not males.
The composite scale describing overall recreational environment was more
strongly related to free-time physical activity than any one individual characteristic.
Similarly, Fein et al10 found that perceived availability and importance of the overall
school recreational environment was correlated with overall energy expenditure among
rural high school students living in Alberta, Canada. Although the association was weak,
it is possible that through use of a context-specific measure of physical activity (e.g.
activity at school) stronger associations may have been detected. Overall, only a few
methodologically dissimilar studies have examined the effects of varying aspects of the

53
school environment on individuals’ school time physical activity9-12; as such there is a
lack of comparable findings.
There is often a tendency in population and public health research to disregard the
importance of small effect sizes. However, the importance of a health determinant
should consider both the magnitude of effect and the prevalence of the exposure. Schools
are ubiquitous and as such school characteristics may be particularly important in
influencing physical activity rates in students. In addition, although each individual
school characteristic was weakly associated with physical activity, their combined effect
was greater, as was demonstrated by a 1.5-1.6 fold increase in physical activity among
high school students with the most recreational features (~30% of schools). This
suggests that increasing the number of schools that provide both facilities and
opportunities for recreation may be effective in increasing physical activity rates among
adolescents.
The present study examined a large, representative sample of Canadian youth.
Since adolescent physical activity rates and educational systems are likely similar across
the United States and Europe, the findings of this study may be largely generalizable to
other industrialized countries. The current study is, however, limited by its cross-
sectional design. In addition, the risk estimates may have been biased towards the null
due to the self-reported nature of the exposure and outcome measures. It is likely that
study participants over-reported their physical activity due to social desirability19
independent of the school environment, leading to non-differential misclassification of
the physical activity outcomes. In addition, dichotomous physical activity outcomes
54
were derived from ordinal responses to physical activity questions in order to make
results more easily interpretable. This may have diluted effect estimates, as individuals
with physical activity levels around the cut-point of 2 hours per week may have been
similar in their exposure experience or misclassified. In addition there are no clear
guidelines for optimal levels of physical activity during school hours; as such this
dichotomy is somewhat arbitrary. Finally, although the overall sample size provided
power to detect rate ratios as small as 1.2, subgroup analyses may have been
underpowered.
In summary, the findings of this study suggest that aspects of the school
recreational environment are modestly related to adolescents’ physical activity at school,
particularly that which occurs during free-time. Taken together, the cumulative effect of
the overall state of the school recreational environment may be more important than any
one characteristic individually. Identification of school features that promote physical
activity may inform educational policy and support funding of recreational opportunities.
Acknowledgements
This study was supported financially by the Canadian Institutes of Health
Research (Grant: 2004MOP-CHI-128223-C) and the Public Health Agency of Canada
(Contract: HT089-05205/001/SS) which funds the Canadian version of the Health
Behaviour in School-Aged Children Survey; a World Health Organization / European
Region collaborative study. International Coordinator of the 2005/2006 study: Candace
Currie, University of Edinburgh; Data Bank Manager: Oddrun Samdal, University of
Bergen. This publication reports data solely from Canada (Principal Investigator:
55
William Boyce). Ian Janssen was funded by a New Investigator Award from the
Canadian Institutes of Health Research and an Early Researcher Award from the Ontario
Ministry of Research and Innovation. Marianne Nichol was funded by an Empire Life
Fellowship and a Queen’s University Graduate Award.
References
(1) U.S.Department of Health and Human Services, U.S.Department of Agriculture. Dietary
Guidelines for Americans 2005: Chapter 4. Physical Activity. www healthierus
goc/dietaryguidelines 2005;
(2) Janssen I, Katzmarzyk PT, Boyce WF, Vereecken C, Mulvihill C, Roberts C, Currie C,
Pickett W. Comparison of overweight and obesity prevalence in school-aged youth from
34 countries and their relationships with physical activity and dietary patterns. Obes Rev
2005 May;6(2):123-32.
(3) Hallal PC, Victora CG, Azevedo MR, Wells JC. Adolescent physical activity and health:
a systematic review. Sports Med 2006;36(12):1019-30.
(4) World Health Organization. Global Strategy on Diet, Physical Activity and Health: Diet
and physical activity: a public health priority. www who int/dietphysicalactivity/en/
2007;
(5) Sallis JF, Cervero RB, Ascher W, Henderson KA, Kraft MK, Kerr J. An ecological
approach to creating active living communities. Annu Rev Public Health 2006;27:297-
322.
(6) Gillander GK, Hammarstrom A. Can school-related factors predict future health
behaviour among young adolescents? Public Health 2002 January;116(1):22-9.
56
(7) Booth M, Okely A. Promoting physical activity among children and adolescents: the
strengths and limitations of school-based approaches. Health Promot J Austr 2005
April;16(1):52-4.
(8) Ferreira I, van der HK, Wendel-Vos W, Kremers S, van Lenthe FJ, Brug J.
Environmental correlates of physical activity in youth - a review and update. Obes Rev
2007 March;8(2):129-54.
(9) Sallis JF, Conway TL, Prochaska JJ, McKenzie TL, Marshall SJ, Brown M. The
association of school environments with youth physical activity. Am J Public Health
2001 April;91(4):618-20.
(10) Fein AJ, Plotnikoff RC, Wild TC, Spence JC. Perceived environment and physical
activity in youth. Int J Behav Med 2004;11(3):135-42.
(11) McKenzie TL, Catellier DJ, Conway T, Lytle LA, Grieser M, Webber LA, Pratt CA,
Elder JP. Girls' activity levels and lesson contexts in middle school PE: TAAG baseline.
Med Sci Sports Exerc 2006 July;38(7):1229-35.
(12) Cradock AL, Melly SJ, Allen JG, Morris JS, Gortmaker SL. Characteristics of school
campuses and physical activity among youth. Am J Prev Med 2007 August;33(2):106-13.
(13) Health Behaviour in School-Aged Children: a World Health Organization Cross-National
Study. Research Protocol for the 2001/02 Survey. Scotland: University of Edinburgh;
2001.
(14) Rothman KJ. Modern Epidemiology. 1 ed. Boston: Little, Brown; 1986.
(15) Currie C, Molcho M, Boyce W, Holstein B, Torsheim T, Richter M. Researching health
inequalities in adolescents: The development of the Health Behaviour in School-Aged
Children (HBSC) Family Affluence Scale. Soc Sci Med 2008 March;66(6):1429-36.
(16) Janssen I, Boyce WF, Simpson K, Pickett W. Influence of individual- and area-level
measures of socioeconomic status on obesity, unhealthy eating, and physical inactivity in
Canadian adolescents. Am J Clin Nutr 2006 January;83(1):139-45.
57
(17) Statistics Canada. Geography Universe Index: 2006 Census Dictionary. www12 statcan
ca/english/census06/references/dictionary/geotoc cfm 2007;
(18) Zhang J, Yu KF. What's the relative risk? A method of correcting the odds ratio in cohort
studies of common outcomes. JAMA 1998 November 18;280(19):1690-1.
(19) Roberts C, Alexander L, Currie D, Haug E, Komkov A, Tynjala J, Vuori M. Health
Behaviour in School-Aged Children Protocol for 2005/06 Survey. Section 2, Scientific
rationales for focus areas: Physical Activity. 2005.
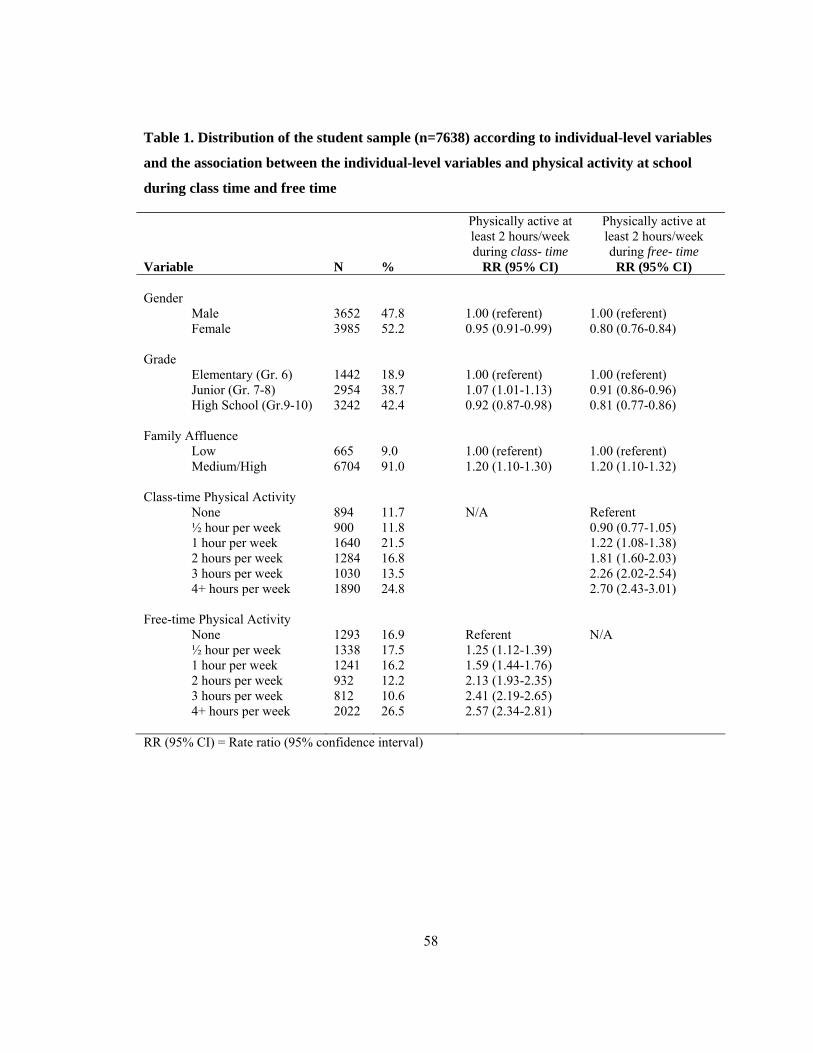
58
Table 1. Distribution of the student sample (n=7638) according to individual-level variables
and the association between the individual-level variables and physical activity at school
during class time and free time
Variable N %
Physically active at least 2 hours/week during class- time
RR (95% CI)
Physically active at least 2 hours/week during free- time
RR (95% CI) Gender Male 3652 47.8 1.00 (referent) 1.00 (referent) Female 3985 52.2 0.95 (0.91-0.99) 0.80 (0.76-0.84) Grade Elementary (Gr. 6) 1442 18.9 1.00 (referent) 1.00 (referent) Junior (Gr. 7-8) 2954 38.7 1.07 (1.01-1.13) 0.91 (0.86-0.96) High School (Gr.9-10) 3242 42.4 0.92 (0.87-0.98) 0.81 (0.77-0.86) Family Affluence Low 665 9.0 1.00 (referent) 1.00 (referent) Medium/High 6704 91.0 1.20 (1.10-1.30) 1.20 (1.10-1.32) Class-time Physical Activity
None 894 11.7 N/A Referent ½ hour per week 900 11.8 0.90 (0.77-1.05) 1 hour per week 1640 21.5 1.22 (1.08-1.38) 2 hours per week 1284 16.8 1.81 (1.60-2.03) 3 hours per week 1030 13.5 2.26 (2.02-2.54) 4+ hours per week 1890 24.8 2.70 (2.43-3.01)
Free-time Physical Activity
None 1293 16.9 Referent N/A ½ hour per week 1338 17.5 1.25 (1.12-1.39) 1 hour per week 1241 16.2 1.59 (1.44-1.76) 2 hours per week 932 12.2 2.13 (1.93-2.35) 3 hours per week 812 10.6 2.41 (2.19-2.65) 4+ hours per week 2022 26.5 2.57 (2.34-2.81)
RR (95% CI) = Rate ratio (95% confidence interval)
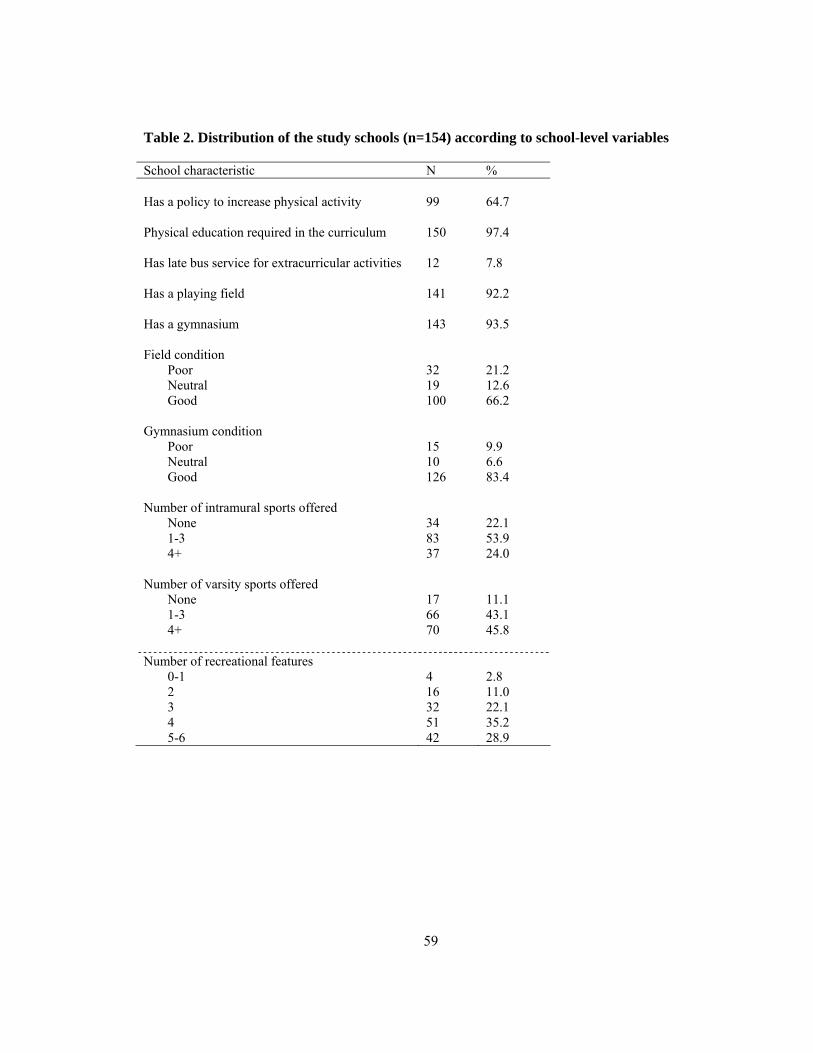
59
Table 2. Distribution of the study schools (n=154) according to school-level variables
School characteristic N % Has a policy to increase physical activity
99
64.7
Physical education required in the curriculum
150 97.4
Has late bus service for extracurricular activities 12 7.8
Has a playing field
141 92.2
Has a gymnasium
143 93.5
Field condition Poor 32 21.2 Neutral 19 12.6 Good 100 66.2 Gymnasium condition
Poor 15 9.9 Neutral 10 6.6 Good 126 83.4 Number of intramural sports offered
None 34 22.1 1-3 83 53.9 4+ 37 24.0 Number of varsity sports offered
None 17 11.1 1-3 66 43.1 4+ 70 45.8 Number of recreational features 0-1 4 2.8 2 16 11.0 3 32 22.1 4 51 35.2 5-6 42 28.9
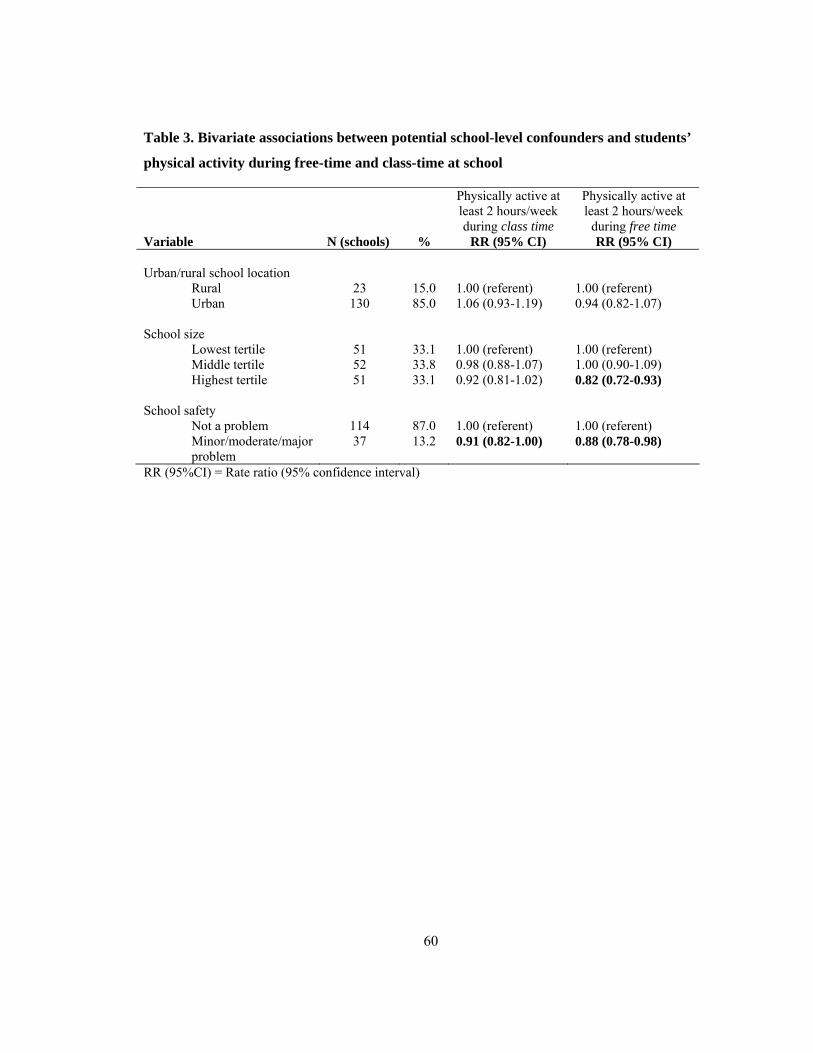
60
Table 3. Bivariate associations between potential school-level confounders and students’
physical activity during free-time and class-time at school
Variable N (schools) %
Physically active at least 2 hours/week during class time
RR (95% CI)
Physically active at least 2 hours/week
during free time RR (95% CI)
Urban/rural school location Rural 23 15.0 1.00 (referent) 1.00 (referent) Urban 130 85.0 1.06 (0.93-1.19) 0.94 (0.82-1.07) School size Lowest tertile 51 33.1 1.00 (referent) 1.00 (referent) Middle tertile 52 33.8 0.98 (0.88-1.07) 1.00 (0.90-1.09) Highest tertile 51 33.1 0.92 (0.81-1.02) 0.82 (0.72-0.93) School safety Not a problem 114 87.0 1.00 (referent) 1.00 (referent) Minor/moderate/major problem
37 13.2 0.91 (0.82-1.00) 0.88 (0.78-0.98)
RR (95%CI) = Rate ratio (95% confidence interval)
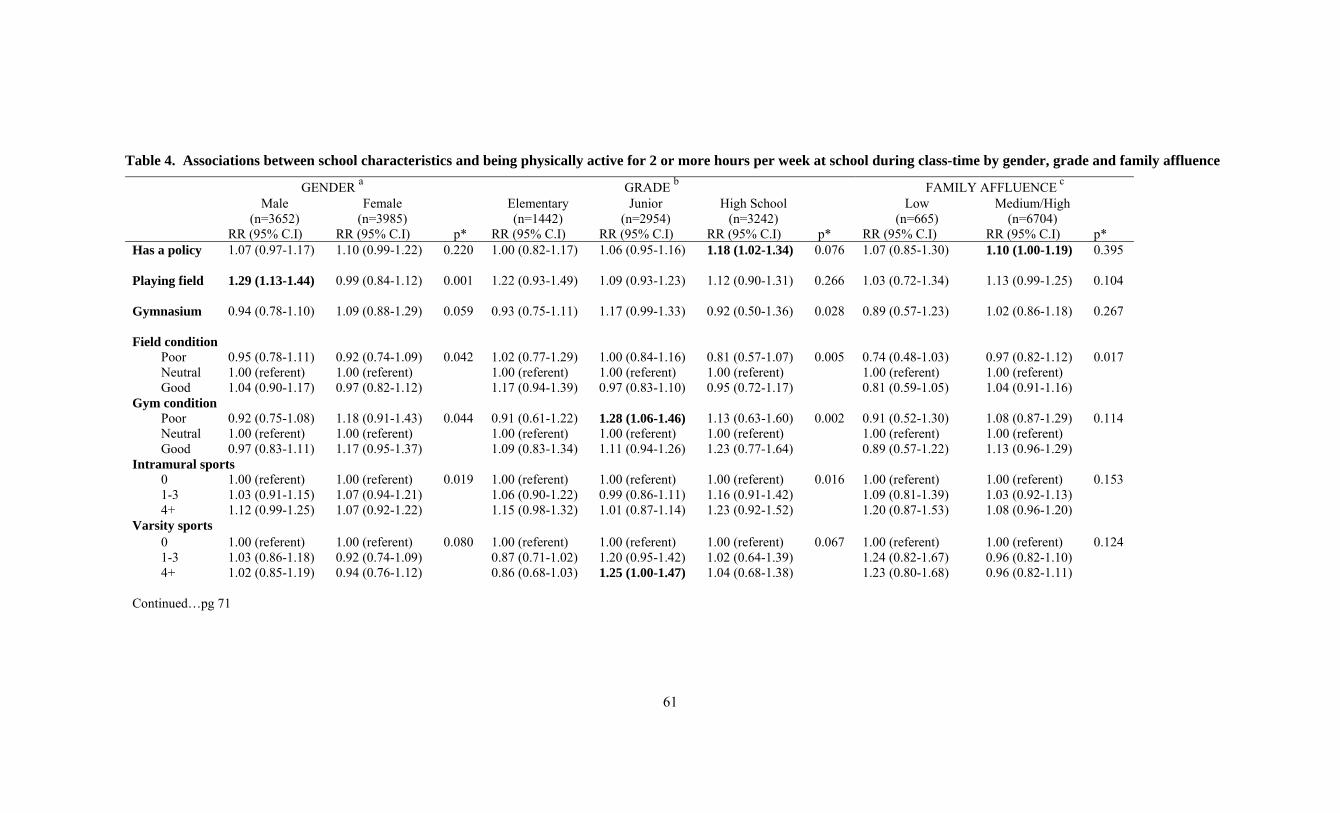
61
Table 4. Associations between school characteristics and being physically active for 2 or more hours per week at school during class-time by gender, grade and family affluence
GENDER a GRADE b FAMILY AFFLUENCE c Male
(n=3652) Female
(n=3985) Elementary
(n=1442) Junior
(n=2954) High School
(n=3242) Low
(n=665) Medium/High
(n=6704)
RR (95% C.I) RR (95% C.I) p* RR (95% C.I) RR (95% C.I) RR (95% C.I) p* RR (95% C.I) RR (95% C.I) p* Has a policy 1.07 (0.97-1.17) 1.10 (0.99-1.22) 0.220 1.00 (0.82-1.17) 1.06 (0.95-1.16) 1.18 (1.02-1.34) 0.076 1.07 (0.85-1.30) 1.10 (1.00-1.19) 0.395 Playing field 1.29 (1.13-1.44) 0.99 (0.84-1.12) 0.001 1.22 (0.93-1.49) 1.09 (0.93-1.23) 1.12 (0.90-1.31) 0.266 1.03 (0.72-1.34) 1.13 (0.99-1.25) 0.104 Gymnasium 0.94 (0.78-1.10) 1.09 (0.88-1.29) 0.059 0.93 (0.75-1.11) 1.17 (0.99-1.33) 0.92 (0.50-1.36) 0.028 0.89 (0.57-1.23) 1.02 (0.86-1.18) 0.267 Field condition Poor 0.95 (0.78-1.11) 0.92 (0.74-1.09) 0.042 1.02 (0.77-1.29) 1.00 (0.84-1.16) 0.81 (0.57-1.07) 0.005 0.74 (0.48-1.03) 0.97 (0.82-1.12) 0.017 Neutral 1.00 (referent) 1.00 (referent) 1.00 (referent) 1.00 (referent) 1.00 (referent) 1.00 (referent) 1.00 (referent) Good 1.04 (0.90-1.17) 0.97 (0.82-1.12) 1.17 (0.94-1.39) 0.97 (0.83-1.10) 0.95 (0.72-1.17) 0.81 (0.59-1.05) 1.04 (0.91-1.16) Gym condition Poor 0.92 (0.75-1.08) 1.18 (0.91-1.43) 0.044 0.91 (0.61-1.22) 1.28 (1.06-1.46) 1.13 (0.63-1.60) 0.002 0.91 (0.52-1.30) 1.08 (0.87-1.29) 0.114 Neutral 1.00 (referent) 1.00 (referent) 1.00 (referent) 1.00 (referent) 1.00 (referent) 1.00 (referent) 1.00 (referent) Good 0.97 (0.83-1.11) 1.17 (0.95-1.37) 1.09 (0.83-1.34) 1.11 (0.94-1.26) 1.23 (0.77-1.64) 0.89 (0.57-1.22) 1.13 (0.96-1.29) Intramural sports 0 1.00 (referent) 1.00 (referent) 0.019 1.00 (referent) 1.00 (referent) 1.00 (referent) 0.016 1.00 (referent) 1.00 (referent) 0.153 1-3 1.03 (0.91-1.15) 1.07 (0.94-1.21) 1.06 (0.90-1.22) 0.99 (0.86-1.11) 1.16 (0.91-1.42) 1.09 (0.81-1.39) 1.03 (0.92-1.13) 4+ 1.12 (0.99-1.25) 1.07 (0.92-1.22) 1.15 (0.98-1.32) 1.01 (0.87-1.14) 1.23 (0.92-1.52) 1.20 (0.87-1.53) 1.08 (0.96-1.20) Varsity sports 0 1.00 (referent) 1.00 (referent) 0.080 1.00 (referent) 1.00 (referent) 1.00 (referent) 0.067 1.00 (referent) 1.00 (referent) 0.124 1-3 1.03 (0.86-1.18) 0.92 (0.74-1.09) 0.87 (0.71-1.02) 1.20 (0.95-1.42) 1.02 (0.64-1.39) 1.24 (0.82-1.67) 0.96 (0.82-1.10) 4+ 1.02 (0.85-1.19) 0.94 (0.76-1.12) 0.86 (0.68-1.03) 1.25 (1.00-1.47) 1.04 (0.68-1.38) 1.23 (0.80-1.68) 0.96 (0.82-1.11) Continued…pg 71
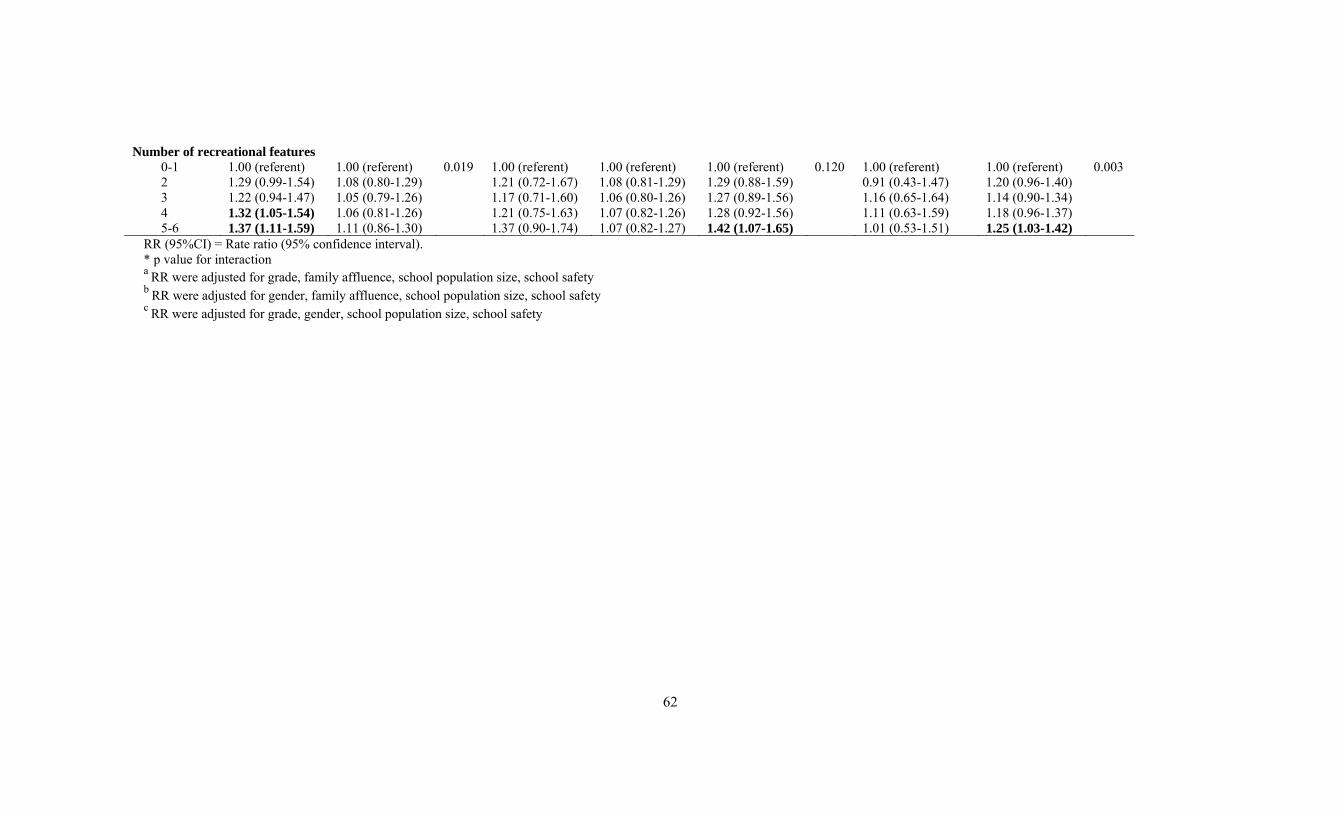
62
Number of recreational features 0-1 1.00 (referent) 1.00 (referent) 0.019 1.00 (referent) 1.00 (referent) 1.00 (referent) 0.120 1.00 (referent) 1.00 (referent) 0.003 2 1.29 (0.99-1.54) 1.08 (0.80-1.29) 1.21 (0.72-1.67) 1.08 (0.81-1.29) 1.29 (0.88-1.59) 0.91 (0.43-1.47) 1.20 (0.96-1.40) 3 1.22 (0.94-1.47) 1.05 (0.79-1.26) 1.17 (0.71-1.60) 1.06 (0.80-1.26) 1.27 (0.89-1.56) 1.16 (0.65-1.64) 1.14 (0.90-1.34) 4 1.32 (1.05-1.54) 1.06 (0.81-1.26) 1.21 (0.75-1.63) 1.07 (0.82-1.26) 1.28 (0.92-1.56) 1.11 (0.63-1.59) 1.18 (0.96-1.37) 5-6 1.37 (1.11-1.59) 1.11 (0.86-1.30) 1.37 (0.90-1.74) 1.07 (0.82-1.27) 1.42 (1.07-1.65) 1.01 (0.53-1.51) 1.25 (1.03-1.42)
RR (95%CI) = Rate ratio (95% confidence interval). * p value for interaction a RR were adjusted for grade, family affluence, school population size, school safety b RR were adjusted for gender, family affluence, school population size, school safety
c RR were adjusted for grade, gender, school population size, school safety
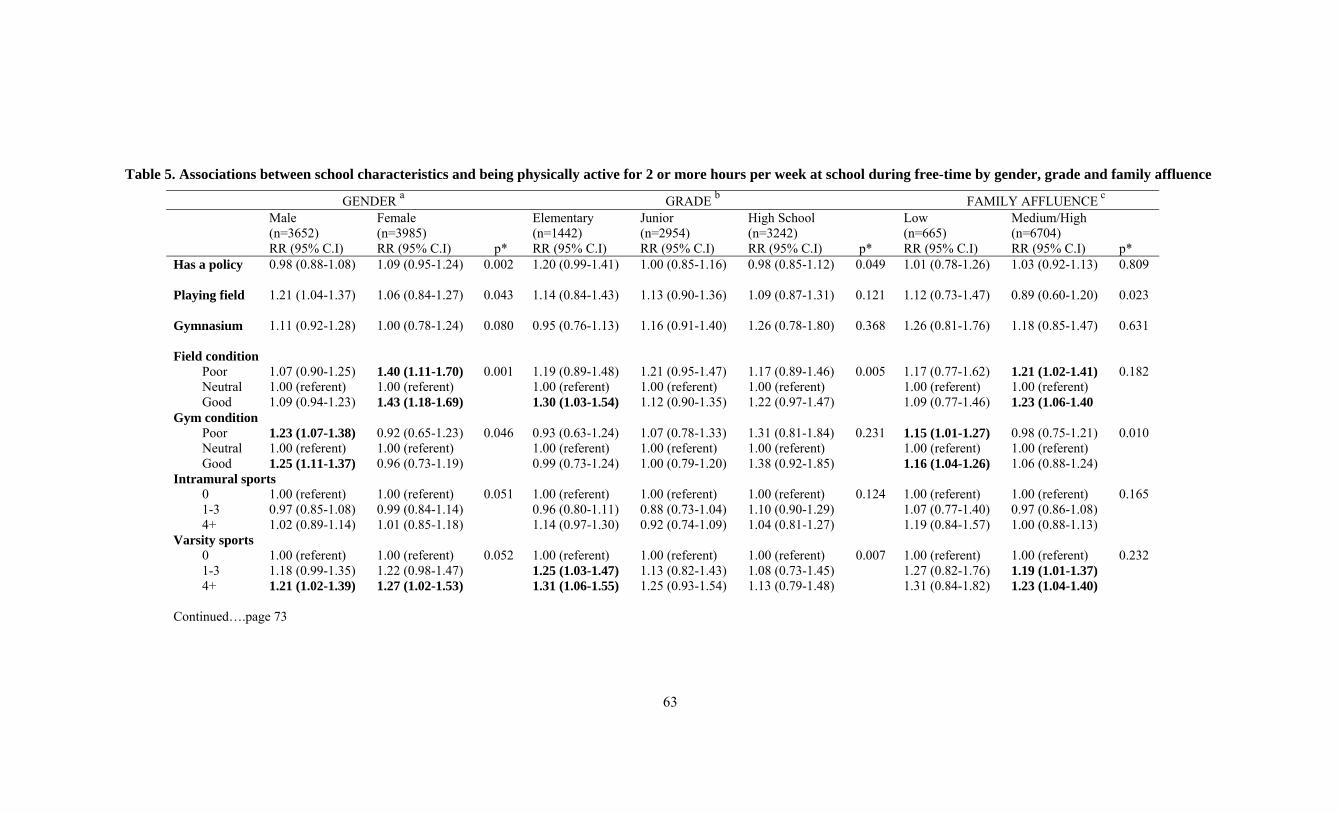
63
Table 5. Associations between school characteristics and being physically active for 2 or more hours per week at school during free-time by gender, grade and family affluence
GENDER a GRADE b FAMILY AFFLUENCE c Male
(n=3652) Female (n=3985)
Elementary (n=1442)
Junior (n=2954)
High School (n=3242)
Low (n=665)
Medium/High (n=6704)
RR (95% C.I) RR (95% C.I) p* RR (95% C.I) RR (95% C.I) RR (95% C.I) p* RR (95% C.I) RR (95% C.I) p* Has a policy 0.98 (0.88-1.08) 1.09 (0.95-1.24) 0.002 1.20 (0.99-1.41) 1.00 (0.85-1.16) 0.98 (0.85-1.12) 0.049 1.01 (0.78-1.26) 1.03 (0.92-1.13) 0.809 Playing field 1.21 (1.04-1.37) 1.06 (0.84-1.27) 0.043 1.14 (0.84-1.43) 1.13 (0.90-1.36) 1.09 (0.87-1.31) 0.121 1.12 (0.73-1.47) 0.89 (0.60-1.20) 0.023 Gymnasium 1.11 (0.92-1.28) 1.00 (0.78-1.24) 0.080 0.95 (0.76-1.13) 1.16 (0.91-1.40) 1.26 (0.78-1.80) 0.368 1.26 (0.81-1.76) 1.18 (0.85-1.47) 0.631 Field condition Poor 1.07 (0.90-1.25) 1.40 (1.11-1.70) 0.001 1.19 (0.89-1.48) 1.21 (0.95-1.47) 1.17 (0.89-1.46) 0.005 1.17 (0.77-1.62) 1.21 (1.02-1.41) 0.182 Neutral 1.00 (referent) 1.00 (referent) 1.00 (referent) 1.00 (referent) 1.00 (referent) 1.00 (referent) 1.00 (referent) Good 1.09 (0.94-1.23) 1.43 (1.18-1.69) 1.30 (1.03-1.54) 1.12 (0.90-1.35) 1.22 (0.97-1.47) 1.09 (0.77-1.46) 1.23 (1.06-1.40 Gym condition Poor 1.23 (1.07-1.38) 0.92 (0.65-1.23) 0.046 0.93 (0.63-1.24) 1.07 (0.78-1.33) 1.31 (0.81-1.84) 0.231 1.15 (1.01-1.27) 0.98 (0.75-1.21) 0.010 Neutral 1.00 (referent) 1.00 (referent) 1.00 (referent) 1.00 (referent) 1.00 (referent) 1.00 (referent) 1.00 (referent) Good 1.25 (1.11-1.37) 0.96 (0.73-1.19) 0.99 (0.73-1.24) 1.00 (0.79-1.20) 1.38 (0.92-1.85) 1.16 (1.04-1.26) 1.06 (0.88-1.24) Intramural sports 0 1.00 (referent) 1.00 (referent) 0.051 1.00 (referent) 1.00 (referent) 1.00 (referent) 0.124 1.00 (referent) 1.00 (referent) 0.165 1-3 0.97 (0.85-1.08) 0.99 (0.84-1.14) 0.96 (0.80-1.11) 0.88 (0.73-1.04) 1.10 (0.90-1.29) 1.07 (0.77-1.40) 0.97 (0.86-1.08) 4+ 1.02 (0.89-1.14) 1.01 (0.85-1.18) 1.14 (0.97-1.30) 0.92 (0.74-1.09) 1.04 (0.81-1.27) 1.19 (0.84-1.57) 1.00 (0.88-1.13) Varsity sports 0 1.00 (referent) 1.00 (referent) 0.052 1.00 (referent) 1.00 (referent) 1.00 (referent) 0.007 1.00 (referent) 1.00 (referent) 0.232 1-3 1.18 (0.99-1.35) 1.22 (0.98-1.47) 1.25 (1.03-1.47) 1.13 (0.82-1.43) 1.08 (0.73-1.45) 1.27 (0.82-1.76) 1.19 (1.01-1.37) 4+ 1.21 (1.02-1.39) 1.27 (1.02-1.53) 1.31 (1.06-1.55) 1.25 (0.93-1.54) 1.13 (0.79-1.48) 1.31 (0.84-1.82) 1.23 (1.04-1.40) Continued….page 73
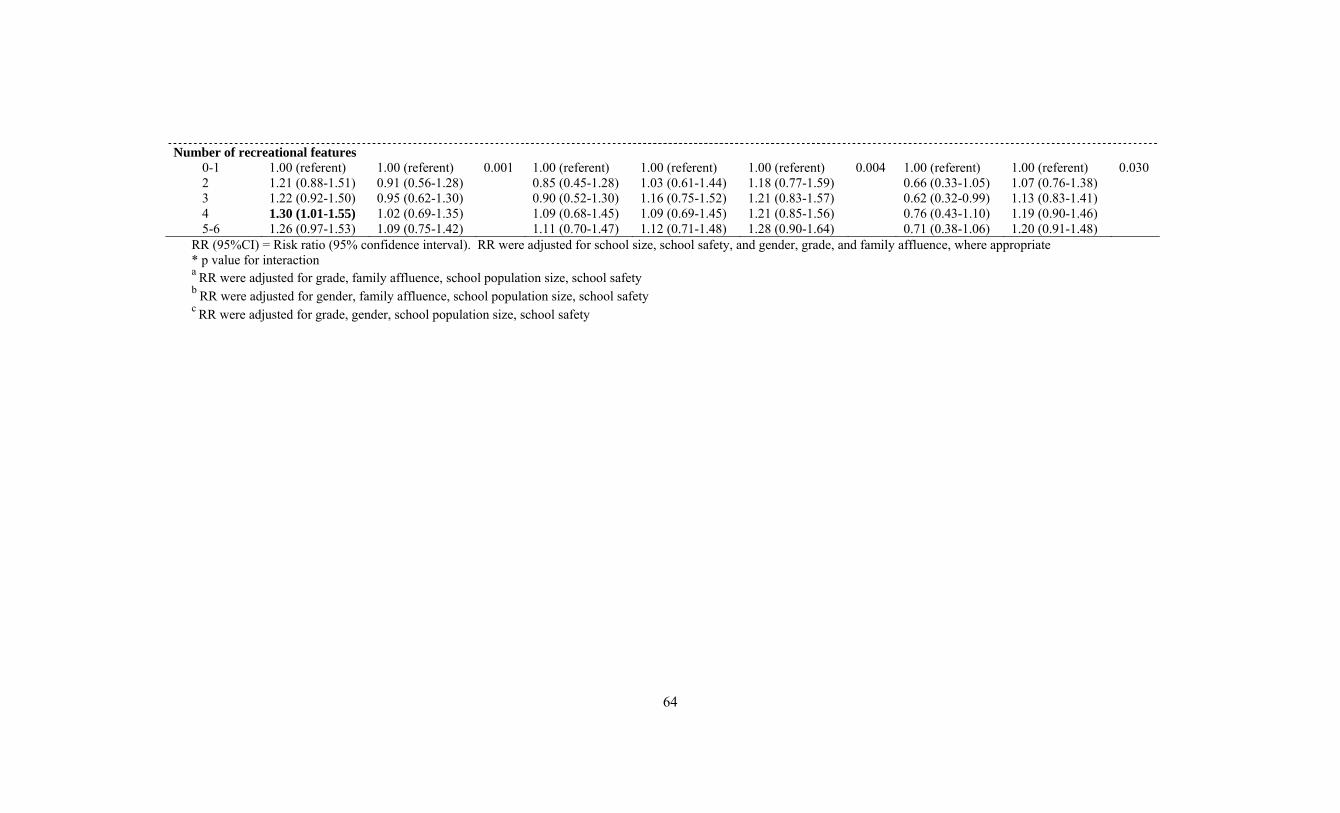
64
Number of recreational features 0-1 1.00 (referent) 1.00 (referent) 0.001 1.00 (referent) 1.00 (referent) 1.00 (referent) 0.004 1.00 (referent) 1.00 (referent) 0.030 2 1.21 (0.88-1.51) 0.91 (0.56-1.28) 0.85 (0.45-1.28) 1.03 (0.61-1.44) 1.18 (0.77-1.59) 0.66 (0.33-1.05) 1.07 (0.76-1.38) 3 1.22 (0.92-1.50) 0.95 (0.62-1.30) 0.90 (0.52-1.30) 1.16 (0.75-1.52) 1.21 (0.83-1.57) 0.62 (0.32-0.99) 1.13 (0.83-1.41) 4 1.30 (1.01-1.55) 1.02 (0.69-1.35) 1.09 (0.68-1.45) 1.09 (0.69-1.45) 1.21 (0.85-1.56) 0.76 (0.43-1.10) 1.19 (0.90-1.46) 5-6 1.26 (0.97-1.53) 1.09 (0.75-1.42) 1.11 (0.70-1.47) 1.12 (0.71-1.48) 1.28 (0.90-1.64) 0.71 (0.38-1.06) 1.20 (0.91-1.48)
RR (95%CI) = Risk ratio (95% confidence interval). RR were adjusted for school size, school safety, and gender, grade, and family affluence, where appropriate * p value for interaction
a RR were adjusted for grade, family affluence, school population size, school safety b RR were adjusted for gender, family affluence, school population size, school safety
c RR were adjusted for grade, gender, school population size, school safety
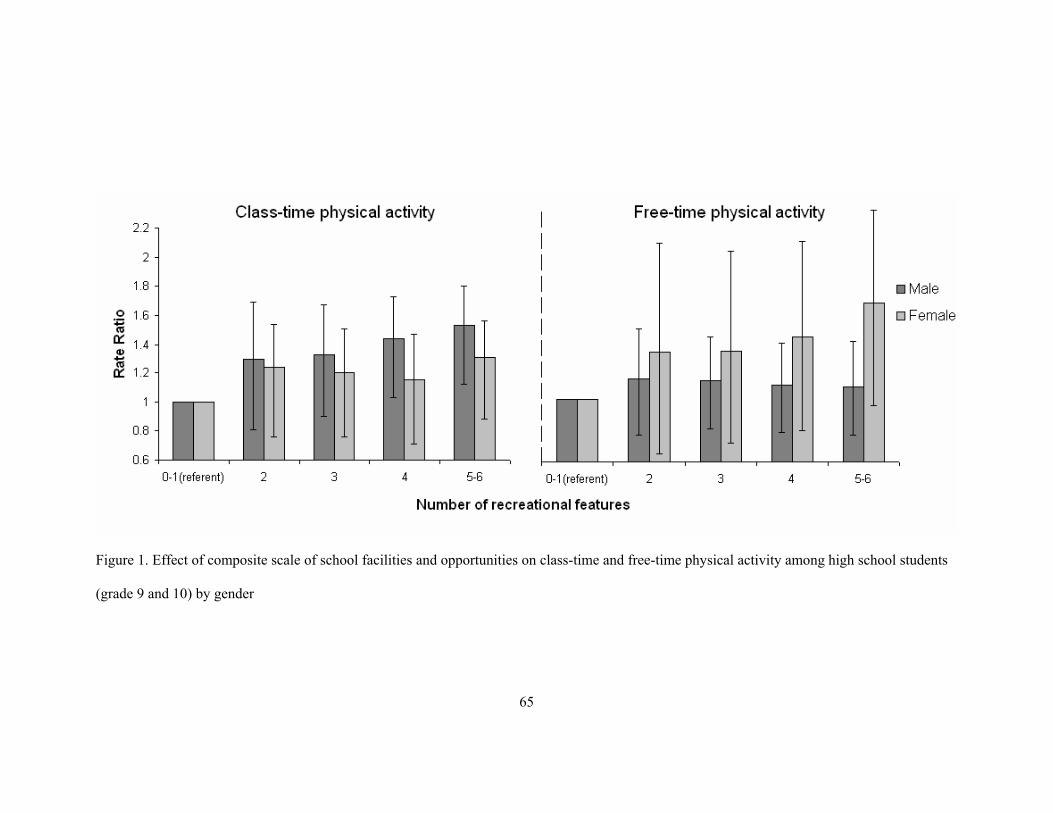
65
Figure 1. Effect of composite scale of school facilities and opportunities on class-time and free-time physical activity among high school students
(grade 9 and 10) by gender

66
Chapter 4 Manuscript 2: Perceptions of neighbourhood safety, not
recreational facilities, are associated with adolescent physical activity
This manuscript conforms to the specifications for submission to the peer-reviewed journal Pediatrics.
Authors: Marianne E Nichol, B.Sc.H.a , Ian Janssen, Ph.D.a,b , William Pickett, Ph.D.a,c
a. Department of Community Health and Epidemiology
b. School of Kinesiology and Health Studies
c. Department of Emergency Medicine
Short title: Safety associated with physical activity in youth
Abbreviations: HBSC - Health Behaviour in School-Aged Children Survey
SES- Socioeconomic status OR – odds ratio RR – rate ratio CI – confidence interval
Keywords: adolescent health, physical fitness, environmental aspects, environment and public health, epidemiology, multilevel modelling Financial disclosure: This study was supported financially by the Canadian Institutes of Health Research (Grant: 2004MOP-CHI-128223-C) and the Public Health Agency of Canada (Contract: HT089-05205/001/SS) which funds the Canadian version of the Health Behaviour in School-Aged Children Survey; a World Health Organization / European Region collaborative study. International Coordinator of the 2005/2006 study: Candace Currie, University of Edinburgh; Data Bank Manager: Oddrun Samdal, University of Bergen. This publication reports data solely from Canada (Principal Investigator: William Boyce). Ian Janssen was funded by a New Investigator Award from the Canadian Institutes of Health Research and an Early Researcher Award from the Ontario Ministry of Research and Innovation. Marianne Nichol was funded by an Empire Life Fellowship and a Queen’s University Graduate Award. Corresponding Author: Marianne Nichol Department of Community Health and Epidemiology Queen’s University, Kingston Ontario, Canada K7L3N6 Phone: +1 (613) 547-8156 Fax: Email: [email protected]
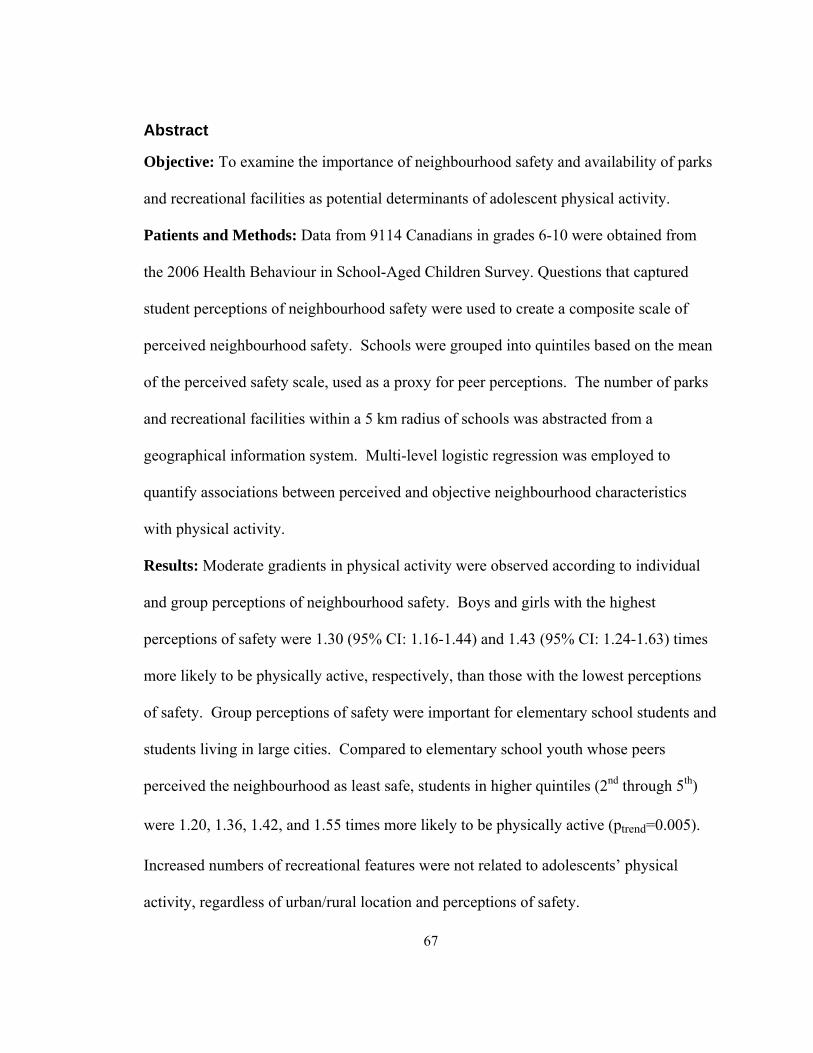
67
Abstract
Objective: To examine the importance of neighbourhood safety and availability of parks
and recreational facilities as potential determinants of adolescent physical activity.
Patients and Methods: Data from 9114 Canadians in grades 6-10 were obtained from
the 2006 Health Behaviour in School-Aged Children Survey. Questions that captured
student perceptions of neighbourhood safety were used to create a composite scale of
perceived neighbourhood safety. Schools were grouped into quintiles based on the mean
of the perceived safety scale, used as a proxy for peer perceptions. The number of parks
and recreational facilities within a 5 km radius of schools was abstracted from a
geographical information system. Multi-level logistic regression was employed to
quantify associations between perceived and objective neighbourhood characteristics
with physical activity.
Results: Moderate gradients in physical activity were observed according to individual
and group perceptions of neighbourhood safety. Boys and girls with the highest
perceptions of safety were 1.30 (95% CI: 1.16-1.44) and 1.43 (95% CI: 1.24-1.63) times
more likely to be physically active, respectively, than those with the lowest perceptions
of safety. Group perceptions of safety were important for elementary school students and
students living in large cities. Compared to elementary school youth whose peers
perceived the neighbourhood as least safe, students in higher quintiles (2nd through 5th)
were 1.20, 1.36, 1.42, and 1.55 times more likely to be physically active (ptrend=0.005).
Increased numbers of recreational features were not related to adolescents’ physical
activity, regardless of urban/rural location and perceptions of safety.

68
Conclusions: Individual and group perceptions of neighbourhood safety were modestly
associated with adolescents’ physical activity participation, whereas availability of parks
and recreational facilities was not. Improving both perceptions of safety as well as actual
safety may be effective in increasing physical activity participation among youth.
69
Introduction
A cross-national study of 11-15 year olds conducted in 34 countries revealed that
less than 50% of youth within each country achieved the recommended level of
moderate-to-vigorous physical activity1. In addition to characteristics of individuals and
their families, characteristics of the built and social environment are believed to
contribute to physical activity participation2. Most recent research has focused on aspects
of the built environment that may promote or hinder physical activity among young
people, including the availability of parks and recreational facilities within an
individuals’ neighborhood3-11. A similar number of studies have considered both
perceived and tangible measures of safety4-7;12-16. Although features of the built and
social environment are correlated with adolescents’ physical activity, it is not clear if
these features are independent determinants of physical activity and if so, which are the
most salient risk factors. In addition, individual and group perceptions of neighbourhood
safety may modify individuals’ decisions to use neighbourhood facilities alone or
socially.
The purpose of the current study was to examine the independent effects of 1)
individual and group perceptions of neighbourhood safety, and 2) availability of parks
and recreational facilities on physical activity participation in youth. It was anticipated
that availability of recreational features might only be important in areas perceived safe
by students. Identification of neighbourhood characteristics that independently promote
physical activity may inform population-level interventions or environmental planning
aimed at improving current obesogenic environments.
70
Subjects and Methods
Survey Design
Data from the cross-sectional, nationally representative 2005/06 Canadian Health
Behaviour in School-Aged Children Survey (HBSC) were analyzed. Information on
demographic, psychosocial characteristics, health behaviours, and health outcomes was
collected from students in grades 6 through 10 in 188 publicly funded schools from
across Canada. The HBSC excluded youth attending private, special-needs, and home
schools as well as institutionalized, incarcerated, and homeless youth17. Together, these
excluded groups represent ~9% of this age group in Canada18. Institutional consent was
solicited from school boards and individual schools; participating students provided
parental and individual consent. The HBSC is conducted in collaboration with the World
Health Organization, and the Canadian HBSC followed the established international
protocol17. The HBSC survey is designed to be self-weighting and uses a cluster sampling
design, with randomly selected classrooms reflecting the provincial distributions of
schools by size, location, language, and religion17.
The HBSC collected information from 9672 children in grades 6 through 10 in
188 schools. Of these, 5 schools were not included because neighbourhood-level
information could not be linked to student information, leaving 9199 students in 183
schools. Of these, 85 students were excluded due to incomplete physical activity
information, leaving 9114 (94.2%) students from 182 (97.3%) schools available for
analysis.
71
Outcome: physical activity outside of school
The outcome of interest was participation in moderate-to-vigorous physical
activity outside of school. Students provided responses to the question: “outside of
school hours, how many hours a week do you usually exercise in your free time so much
that you get out of breath or sweat?” There were six response categories: “none”, “about
½ hour”, “about 1 hour”, “about 2 to 3 hours”, “about 4 to 6 hours” and “7 or more
hours”. Ordinal responses were grouped to create a dichotomous outcome (≥ 4
hours/week vs. < 4 hours/week) that would be more easily interpretable for health
policy19. Total physical activity is composed of activities that occur inside and outside of
school; as such a threshold of 4 hours per week outside of school is assumed to be
consistent with the physical activity guideline for 60 minutes of moderate-to-vigorous
physical activity on most if not all days of the week20. This threshold was expected to be
met by 45% of students, consistent with the overall rate of physical activity participation
in Canadian youth1.
Key exposures
Individual perceptions of neighbourhood safety
Students responded to three statements/questions regarding the safety of their
neighbourhood: “I feel safe in the area where I live” (always, most of the time,
sometimes, rarely or never), “do you think that the area in which you live is a good place
to live? (it’s really good, it’s good, it’s ok, it’s not very good/ it’s not good at all), and “it
is safe for younger children to play outside during the day” (strongly agree, agree,
72
neither agree nor disagree, disagree/strongly disagree). Principal component factor
analysis revealed agreement between these 3 variables; factor loadings were 0.84, 0.85,
and 0.66, respectively. The Cronbach’s alpha coefficient indicated a reasonable level of
internal consistency (0.68). These questions were combined with equal weight and then
categorized to create a 3-point composite scale of perceived neighbourhood safety (least
safe, safe, most safe).
Group perceptions of neighbourhood safety
The group mean of the perceived safety scale was calculated for each school.
Schools were then ranked and grouped into quintiles based on the mean of the perceived
safety scale. This measure was considered as a social construct capturing peer
perceptions of neighbourhood safety.
Neighbourhood parks and recreational facilities
Neighbourhood-level data on parks and recreational facilities were obtained from
CanMap Streetfiles, a cross-national geographical information system with positionally-
accurate geospatial data for schools, parks, trails, and recreational points of interest, in
addition to other geographical information21. Using ArcGIS software (ESRI, Redlands,
CA), participating schools were identified in CanMap Streetfiles according to school
name and street address. Neighbourhood-level information was subsequently linked to
individual-level information from the student participants of the HBSC.
73
A 5-km circular buffer was applied around each school and was considered as a
proxy for the residential neighbourhood for the school. Numbers of parks and recreation
facilities within this 5-km buffer were counted. Parks included national parks, provincial
and territorial parks, and municipal parks/sports fields. Trails included educational,
recreational and park trails. The park and trail variables were classified into categories
(none, 1-3, 4-19, 20+ per 5 km radius). Types of recreational facilities considered in this
analysis were: arenas, community centres, sportsplexes/stadiums, and swimming pools;
these were also treated categorically (none, 1, 2-4, 5+ per 5 km radius). Finally, a
composite scale that considered the overall neighbourhood recreational environment was
constructed by combining ranked scores for each of the park/facilities. Schools were then
divided into quintiles based on this composite score.
Potential Covariates
Variables considered a priori as potential covariates at the individual-level were:
gender, grade, family socioeconomic status, and perceived neighbourhood aesthetics.
Neighbourhood-level confounders under consideration were neighbourhood-level
socioeconomic status (SES) and geographic location.
Gender and grade were self-reported by students. Students provided responses to
questions regarding vehicle and computer ownership, bedroom sharing and holiday
travel; these questions were used to create a 3-point Family Affluence Scale (low,
medium, high) which is used as a proxy for family socioeconomic status22 and associated
with physical activity in Canadian youth23. Students were asked how much litter, broken
74
glass and garbage was present in their neighbourhood (lots, some, none) and to what
extent there were run-down houses and buildings in the neighbourhood (lots, some,
none); responses to these questions were used to assess perceived neighbourhood
aesthetics.
Area-level socioeconomic status (SES) was obtained from 2001 Canadian Census
information using PCensus software18. Neighbourhood-level SES was determined by
combining ranked scores for median household income, employment rate and the percent
of the population with greater than high school education18. Schools were then divided
into low, medium and high SES tertiles based on this overall score. Geographic location
was imputed from Statistics Canada’s Census Metropolitan Area data and based on
school postal code18. Schools were divided into 3 groups: urban schools inside
metropolitan areas, urban schools outside metropolitan areas, and rural schools. Urban
schools inside metropolitan areas were those located in urban cores, urban fringes, and
secondary urban cores, urban schools outside metropolitan areas were considered
separately. Rural schools were those located in rural fringes or rural areas outside
metropolitan areas24.
Statistical Analysis
All statistical analyses were performed in SAS version 9.1 (SAS Inc, Carry, NC).
In order to determine the relative importance of perceptions of safety and availability of
neighbourhood recreational features, multivariate multilevel analyses were performed
that simultaneously considered: scales of individual and group perceptions of safety, a
75
scale of neighbourhood facility availability, and a parsimonious list of covariates that
were significantly associated with the study outcome (gender, grade, family affluence,
and geographic location). The SAS GLIMMIX procedure was used to fit generalized
linear mixed models with a binomial distribution and logit link, in order to account for
the clustered and hierarchical nature of the data. The method of estimation was a
restricted maximum likelihood procedure. All multilevel logistic regression models
employed a Newton-Raphson with ridging technique to aid convergence25.
Cross-level interactions between the key exposures and grade, gender, and urban
location were suspected a priori. Upon testing, significant interactions by gender, grade,
and location were observed for each of the neighbourhood scales. Therefore, multivariate
analyses that simultaneously considered individual and group perceptions of safety and
neighbourhood facility availability were performed within gender, age, and location
subcategories. In order to test the hypothesis that individual perceptions of safety modify
the relationship between facility availability and physical activity, this interaction was
tested and results were presented within perception subgroups.
Since physical activity is not a rare outcome, odds ratios obtained from multilevel
logistic regression do not necessarily approximate relative risk26. Therefore, rate ratios
(RR) and confidence intervals (CI) were derived by adjusting odds ratios obtained from
these models by the proportion of the outcome in the unexposed/referent groups (P0)
according to the formula: RR=OR/((1-P0) + (P0 x OR))26.
76
Results
The distribution of the participants according to individual-level variables is
shown in Table 1. Overall, 36.9% of students reported being physically active for ≥4
hours/week outside of school. Table 2 presents the bivariate association between
perceptions of safety, availability of facilities and physical activity outside of school.
Associations between individual recreational features and physical activity are presented
in Appendix D – Tables E, F,G.
Significant interactions by gender, grade, and geographic location were observed
for the associations between the key exposures and physical activity outside of school.
Therefore, Table 3 presents results within gender, grade, and geographic location
subcategories. Table 4 presents the interaction between individuals’ perceptions of
safety and availability of neighbourhood facilities.
Perceptions of Neighbourhood Safety
Individuals’ perceptions of safety. As indicated in Table 3, individuals’
perceptions of neighbourhood safety were associated with participation in physical
activity outside of school in all subgroups. Boys and girls with the highest perceptions of
safety were 1.30 (95% confidence interval: 1.16-1.44) and 1.43 (1.24-1.63) times more
likely to be physically active, respectively, than those with the lowest perceptions of
safety. This relationship was stronger in youth living in urban non-metropolitan areas
compared to urban metropolitan and rural youth. Urban youth outside metropolitan
areas who perceived their neighbourhood as the most safe had physical activity rates that
77
were 56% higher than the classmates who perceived their neighbourhoods as least safe;
increases of approximately 30% were observed for urban metropolitan and rural youth.
Group perceptions of safety. Group perceptions of safety were important for both
genders, elementary school students, and students living in large cities (Table 3).
Elementary school youth at schools with highest average perceptions of safety were 1.55
(1.17-1.97) times as likely to be physical active compared to those at schools with the
lowest group perceptions. Urban metropolitan youth at schools with the highest group
perceptions were 1.43 (1.20-1.68) times more likely to be physically active compared to
those at schools with the lowest group perceptions; no association was observed among
urban non-metropolitan and rural youth.
Availability of neighbourhood recreational features
Individual recreational features. Unexpectedly, unadjusted models revealed
weak inverse relationships between the number of parks, arenas, community centres, and
sportsplexes/stadiums with physical activity outside of school (Appendix D - Table E).
Further adjustment for grade, gender, family affluence, urban location, and perceived
safety revealed no consistent relationships between individual parks/facilities features
and physical activity among any of the subgroups (Appendix D - Tables F & G)).
Total number of recreational features. Overall, no consistent relationships were
observed between availability of recreational facilities and adolescents physical activity.
After controlling for perceptions of neighbourhood safety and covariates, the number of
recreational features within students’ neighbourhoods was not significantly related to
78
physical activity within any of the subgroups (Table 3). To illustrate, compared to boys
living in areas with the fewest recreational features, those living in areas with the most
recreational features experienced slightly higher rates of physical activity (1.17, 0.99-
1.34); the opposite was true for girls (0.85, 0.69-1.02) (Table 3). The relationship
between the total number of recreational features and physical activity was non-
significant irrespective of whether the students lived in neighbourhoods they perceived as
being safe or unsafe (Table 4).
Discussion
Contrary to the original hypothesis, availability of parks and recreational facilities
in school residential neighbourhoods was not associated with physical activity in school-
aged youth. This finding was not influenced by individuals’ perceptions of safety.
Individual and group perceptions of neighbourhood safety were significantly associated
with physical activity participation. The major finding is that neighbourhood safety may
be more important than availability of recreational facilities in influencing youths’
participation in physical activity outside of school.
Several studies have explored associations between access to parks3-5,8,9 and
recreational facilities4,6-8,10,11 with physical activity participation in youth. These studies
consistently suggest that availability of neighbourhood recreational features is weakly
associated with a higher physical activity participation in youth. Among studies of
neighbourhood safety3-7,12-16, the majority have observed stronger, although modest,
79
positive associations between increased neighbourhood safety and physical activity4-
7,12,14-16.
Despite the fact that many of these studies investigated both neighbourhood safety
and availability of facilities, only one previous study has simultaneously controlled for
each in order to determine their relative importance. Evenson et al.7 investigated the
relative importance of perceptions of safety and perceptions of facility availability among
grade 6 girls in 6 states across the U.S. Girls’ perceptions of a number of recreational
facilities were considered along with girls’ perceptions of crime, traffic, street lighting,
whether they felt it was safe to walk and jog outdoors, and whether pedestrians were
visible at night. Street lighting, traffic, walking trails and access to facilities were
independently associated with girls’ self-reported physical activity outside of school.
Thus, both facilities and safety were independent predictors of physical activity
participation. These findings are contrary to those of the current study in which
individual perceptions of safety, but not neighbourhood recreational facilities, were
related to physical activity. The current study is the first to consider the relative
importance of safety and availability of facilities among both boys and girls.
In addition to considering the effects of individuals’ perceptions of safety, the
current study also investigated the importance of these perceptions at the school-level.
Group perceptions of neighbourhood safety were important for younger youth.
Speculatively, this may be the result of differences in how younger youth engage in
physical activity compared to older adolescents. It is possible that younger youth are
more likely than their older counterparts to participate in more spontaneous outdoor
80
activity with their friends. In such a case, peer perceptions of safety may influence
younger people’s outdoor physical activity irrespective of their own feelings. Older youth
may be more likely to be physically active alone (for example walking and jogging
alone), in which case only their personal opinions of their neighbourhood would be
influential.
Limitations of this research warrant comment. First, due to the cross-sectional
design of the HBSC, the temporality of observed relationships could not be established; it
is plausible that individuals’ physical activity behaviour might influence their perceptions
of safety through increased exposure to the environment, rather than perceptions
influencing physical activity. Second, students often over-report their physical activity
due to social desirability27; this misclassification would likely be independent of
characteristics of the neighbourhood environment and as such may have biased effect
estimates towards the null. In addition, dichotomous physical activity outcomes were
derived from ordinal responses to physical activity questions in order to make results
more easily interpretable. This may have diluted effect estimates, as individuals with
physical activity levels around the cut-point of 2 hours per week may have been similar
in their exposure experience or misclassified. In addition there are no clear guidelines for
optimal levels of physical activity during school hours; as such this dichotomy is
somewhat arbitrary. Third, it would have been ideal to measure residential
neighbourhoods using buffers constructed around individuals’ homes; this was not
possible since the HBSC is restricted from collecting information on student home
addresses for reasons of confidentiality. It is possible that through use of a 5 km buffer
81
around schools, neighbourhood characteristics may have been ascribed to students who in
fact do not live within these radii. Finally, no standard method exists for assessment of
neighbourhood environments. Thus, it was unclear which type of buffer should be used
(radial versus street network buffers) and what radial distance around schools would be
appropriate in capturing the residential neighbourhood of schools. Circular buffers do not
consider physical barriers (e.g. freeways, railways, rivers) that might make locations
inaccessible28. It also is unclear what radial distance is relevant for youth28. It is possible
that through use of another radial distance different results may have been observed.
Stronger observed effects of safety might be attributable to students’ perceptions
providing a more accurate measure compared with the available measures of facility
availability. Lastly, there is a potential for neighbourhood-level associations to be
residually confounded by variables not captured in this research, namely street-
connectivity. Street-connectivity (i.e. the density and connectedness of roads) may
influence ease of walking and other outdoor activities29 and may also be associated road
safety and the number of parks and facilities in neighbourhoods.
Longitudinal analyses are required to establish whether perceptions of safety are
true determinants of students’ physical activity. Although perceptions of overall safety
were associated with youths’ physical activity, it is unclear what components of
neighbourhood safety are important determinants of adolescent physical activity. In
addition, it may be important to understand the extent to which perceptions of safety
correspond to the objective environment in order to plan population-based interventions.
Future studies should consider whether the accessibility, affordability and/or quality of
82
recreational features are more important than the number of features. Development of a
standard approach to measuring the built environment and physical activity in youth
would also improve comparability between studies.
Children and youth today spend less time in outdoor activities compared with
previous generations30. This is in part attributable to increased individual and parental
concerns about “stranger danger” and road safety31. Fear of strangers may be a
particularly salient factor, although potentially unrelated to actual frequency of crime
against youth by strangers31. It is estimated that only 115 non-family stereotypical child
abductions (those that involve removal of the child for the purposes of ransom, assault or
murder) occurred in the United States in 199932,33. To put this issue into perspective, the
UNICEF Report from Rich Nations concluded that traffic injuries were the leading cause
of fatal injury among children in developed countries, and that the majority of these
children were pedestrians34; in the United States, childhood pedestrian injury accounted
for 583 deaths and 33,571 non-fatal serious injuries in 2004 and 2005, respectively35.
Optimizing the safety of neighbourhoods and increasing individuals’ perception
of safety may both be effective in promoting outdoor physical activity among youth.
This might involve tangible improvement to roads and facilities or interventions that
promote greater social interaction and cohesion among community members. The latter
could lead to better social environments for young people and indirectly lead to better
rates of physical activity. Increasing the number of parks and facilities available to youth
may not be effective in promoting physical activity.
83
Conclusion
In summary, individual and group perceptions of neighbourhood safety were
modestly associated with adolescents’ physical activity participation, whereas availability
of parks and recreational facilities was not. Improving perceptions of safety may be
effective in increasing physical activity participation among youth.
References
(1) Janssen I, Katzmarzyk PT, Boyce WF, Vereecken C, Mulvihill C, Roberts C, et al.
Comparison of overweight and obesity prevalence in school-aged youth from 34
countries and their relationships with physical activity and dietary patterns. Obes Rev
2005 May;6(2):123-32.
(2) Sallis JF, Cervero RB, Ascher W, Henderson KA, Kraft MK, Kerr J. An ecological
approach to creating active living communities. Annu Rev Public Health 2006;27:297-
322.
(3) Motl RW, Dishman RK, Ward DS, Saunders RP, Dowda M, Felton G, et al. Perceived
physical environment and physical activity across one year among adolescent girls: self-
efficacy as a possible mediator? J Adolesc Health 2005 Nov;37(5):403-8.
(4) Utter J, Denny S, Robinson EM, Ameratunga S, Watson P. Perceived access to
community facilities, social motivation, and physical activity among New Zealand youth.
J Adolesc Health 2006 Nov;39(5):770-3.
(5) Alton D, Adab P, Roberts L, Barrett T. Relationship between walking levels and
perceptions of the local neighbourhood environment. Arch Dis Child 2007 Jan;92(1):29-
33.
(6) Romero AJ. Low-income neighborhood barriers and resources for adolescents' physical
activity. J Adolesc Health 2005 Mar;36(3):253-9.
84
(7) Evenson KR, Scott MM, Cohen DA, Voorhees CC. Girls' perception of neighborhood
factors on physical activity, sedentary behavior, and BMI. Obesity (Silver Spring) 2007
Feb;15(2):430-45.
(8) Norman GJ, Nutter SK, Ryan S, Sallis JF, Calfas KJ, Patrick K. Community design and
access to recreational facilities as correlates of adolescent physical activity and Body-
Mass Index. Journal of Physical Activity and Health 2006;3(Suppl 1):S118-S128.
(9) Cohen DA, Ashwood JS, Scott MM, Overton A, Evenson KR, Staten LK, et al. Public
parks and physical activity among adolescent girls. Pediatrics 2006 Nov;118(5):e1381-
e1389.
(10) Scott MM, Evenson KR, Cohen DA, Cox CE. Comparing Perceived and Objectively
Measured Access to Recreational Facilities as Predictors of Physical Activity in
Adolescent Girls. J Urban Health 2007 Mar 31.
(11) Gordon-Larsen P, Nelson MC, Page P, Popkin BM. Inequality in the built environment
underlies key health disparities in physical activity and obesity. Pediatrics 2006
Feb;117(2):417-24.
(12) Mota J, Almeida M, Santos P, Ribeiro JC. Perceived Neighborhood Environments and
physical activity in adolescents. Prev Med 2005 Nov;41(5-6):834-6.
(13) Motl RW, Dishman RK, Saunders RP, Dowda M, Pate RR. Perceptions of physical and
social environment variables and self-efficacy as correlates of self-reported physical
activity among adolescent girls. J Pediatr Psychol 2007 Jan;32(1):6-12.
(14) Gordon-Larsen P, McMurray RG, Popkin BM. Determinants of adolescent physical
activity and inactivity patterns. Pediatrics 2000 Jun;105(6):E83.
(15) Molnar BE, Gortmaker SL, Bull FC, Buka SL. Unsafe to play? Neighborhood disorder
and lack of safety predict reduced physical activity among urban children and
adolescents. Am J Health Promot 2004 May;18(5):378-86.
85
(16) Gomez JE, Johnson BA, Selva M, Sallis JF. Violent crime and outdoor physical activity
among inner-city youth. Prev Med 2004 Nov;39(5):876-81.
(17) Health Behaviour in School-Aged Children: a World Health Organization Cross-National
Study. Research Protocol for the 2001/02 Survey. Scotland: University of Edinburgh;
2001.
(18) Seliske L. The food retail environment surrounding Canadian schools and its impact on
overweight and obesity 2008. Queen’s University.
(19) Rothman KJ. Modern Epidemiology. 1 ed. Boston: Little,Brown; 1986.
(20) U.S.Department of Health and Human Services, U.S.Department of Agriculture. Dietary
Guidelines for Americans 2005: Chapter 4. Physical Activity. www healthierus
goc/dietaryguidelines 2005
(21) DMTI Spatial Inc. User Manual :CanMap Streetfiles Version 2005.1. 2005.
(22) Currie C, Molcho M, Boyce W, Holstein B, Torsheim T, Richter M. Researching health
inequalities in adolescents: The development of the Health Behaviour in School-Aged
Children (HBSC) Family Affluence Scale. Soc Sci Med 2008 Mar;66(6):1429-36.
(23) Janssen I, Boyce WF, Simpson K, Pickett W. Influence of individual- and area-level
measures of socioeconomic status on obesity, unhealthy eating, and physical inactivity in
Canadian adolescents. Am J Clin Nutr 2006 Jan;83(1):139-45.
(24) Statistics Canada. Geography Universe Index: 2006 Census Dictionary. www12 statcan
ca/english/census06/references/dictionary/geotoc cfm 2007
(25) Schabenberger O. Introducing the GLIMMIX procedure for generalized linear mixed
models. Cary, NC: SAS Institute Inc.; 2008.
(26) Zhang J, Yu KF. What's the relative risk? A method of correcting the odds ratio in cohort
studies of common outcomes. JAMA 1998 Nov 18;280(19):1690-1.
86
(27) Roberts C, Alexander L, Currie D, Haug E, Komkov A, Tynjala J, et al. Health
Behaviour in School-Aged Children Protocol for 2005/06 Survey. Section 2, Scientific
rationalesfor focus areas: Physical Activity. 2005.
(28) Oliver LN, Schuurman N, Hall AW. Comparing circular and network buffers to examine
the influence of land use on walking for leisure and errands. Int J Health Geogr
2007;6:41.
(29) Kligerman M, Sallis JF, Ryan S, Frank LD, Nader PR. Association of neighborhood
design and recreation environment variables with physical activity and body mass index
in adolescents. Am J Health Promot 2007 Mar;21(4):274-7.
(30) Karsten L. It all used to be better? Different generations on continuity and change in
urban children's daily use of space. Children's Geographics 2005;3(3):275-90.
(31) Carver A, Timperio A, Crawford D. Playing it safe: the influence of neighbourhood
safety on children's physical activity. A review. Health Place 2008 Jun;14(2):217-27.
(32) Finkelhor D, Hammer H, Sedlak AJ. Nonfamily abducted children: national estimates
and characteristics, NISMART. Washington, D.C.: U.S. Department of Justice; 2002.
(33) Dalley ML, Ruscoe J. The abduction of children by strangers in Canada: nature and
scope. National Missing Children Services, National Polic Service, Royal Canadian
Mounted Police; 2003.
(34) UNICEF. A league table of child deaths by injury in rich nations: Innocenti Report Card
No.2. Florence: UNICEF Innocenti Research Centre; 2001.
(35) Taft C, Paul H, Consunji R. Childhood unintentional injury worldwide: meeting the
challenge. Washington, D.C.: Safe Kids Worldwide; 2002.
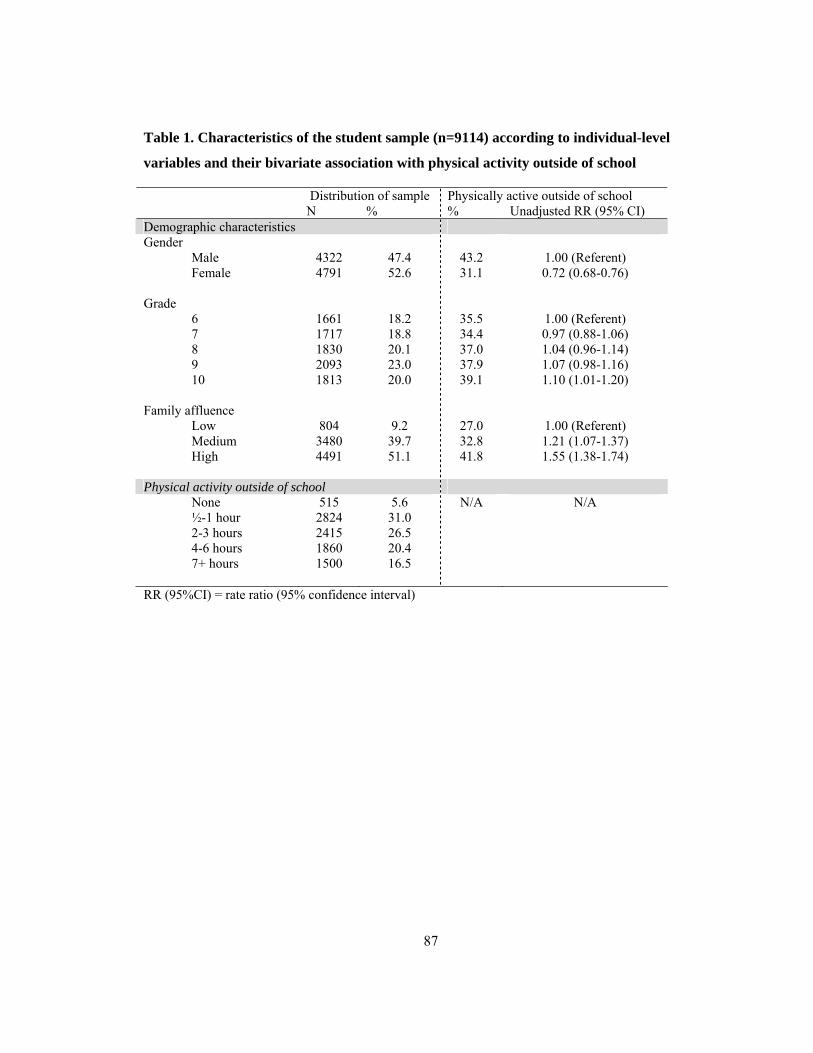
87
Table 1. Characteristics of the student sample (n=9114) according to individual-level
variables and their bivariate association with physical activity outside of school
Distribution of sample Physically active outside of school N % % Unadjusted RR (95% CI) Demographic characteristics Gender Male 4322 47.4 43.2 1.00 (Referent) Female 4791 52.6 31.1 0.72 (0.68-0.76) Grade 6 1661 18.2 35.5 1.00 (Referent) 7 1717 18.8 34.4 0.97 (0.88-1.06) 8 1830 20.1 37.0 1.04 (0.96-1.14) 9 2093 23.0 37.9 1.07 (0.98-1.16) 10 1813 20.0 39.1 1.10 (1.01-1.20) Family affluence Low 804 9.2 27.0 1.00 (Referent) Medium 3480 39.7 32.8 1.21 (1.07-1.37) High 4491 51.1 41.8 1.55 (1.38-1.74) Physical activity outside of school None 515 5.6 N/A N/A ½-1 hour 2824 31.0 2-3 hours 2415 26.5 4-6 hours 1860 20.4 7+ hours 1500 16.5 RR (95%CI) = rate ratio (95% confidence interval)
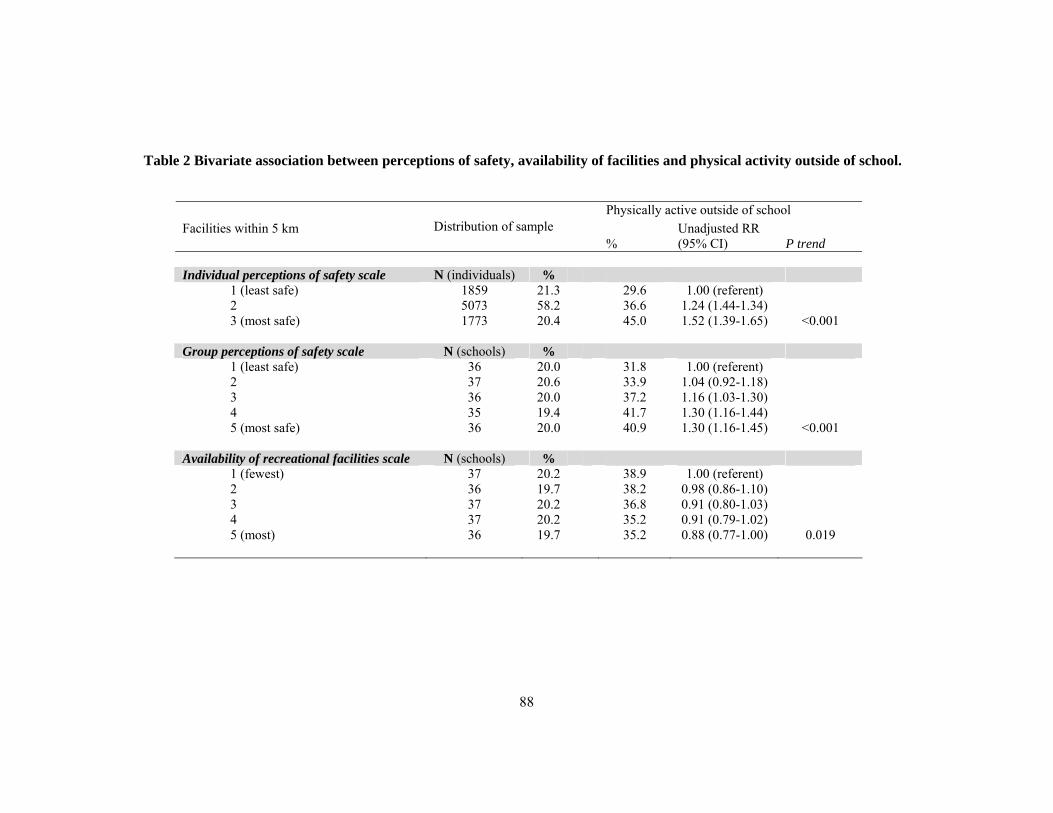
88
Table 2 Bivariate association between perceptions of safety, availability of facilities and physical activity outside of school.
Physically active outside of school Facilities within 5 km Distribution of sample
% Unadjusted RR (95% CI) P trend
Individual perceptions of safety scale N (individuals) % 1 (least safe) 1859 21.3 29.6 1.00 (referent) 2 5073 58.2 36.6 1.24 (1.44-1.34) 3 (most safe) 1773 20.4 45.0 1.52 (1.39-1.65) <0.001 Group perceptions of safety scale N (schools) % 1 (least safe) 36 20.0 31.8 1.00 (referent) 2 37 20.6 33.9 1.04 (0.92-1.18) 3 36 20.0 37.2 1.16 (1.03-1.30) 4 35 19.4 41.7 1.30 (1.16-1.44) 5 (most safe) 36 20.0 40.9 1.30 (1.16-1.45) <0.001 Availability of recreational facilities scale N (schools) % 1 (fewest) 37 20.2 38.9 1.00 (referent) 2 36 19.7 38.2 0.98 (0.86-1.10) 3 37 20.2 36.8 0.91 (0.80-1.03) 4 37 20.2 35.2 0.91 (0.79-1.02) 5 (most) 36 19.7 35.2 0.88 (0.77-1.00) 0.019
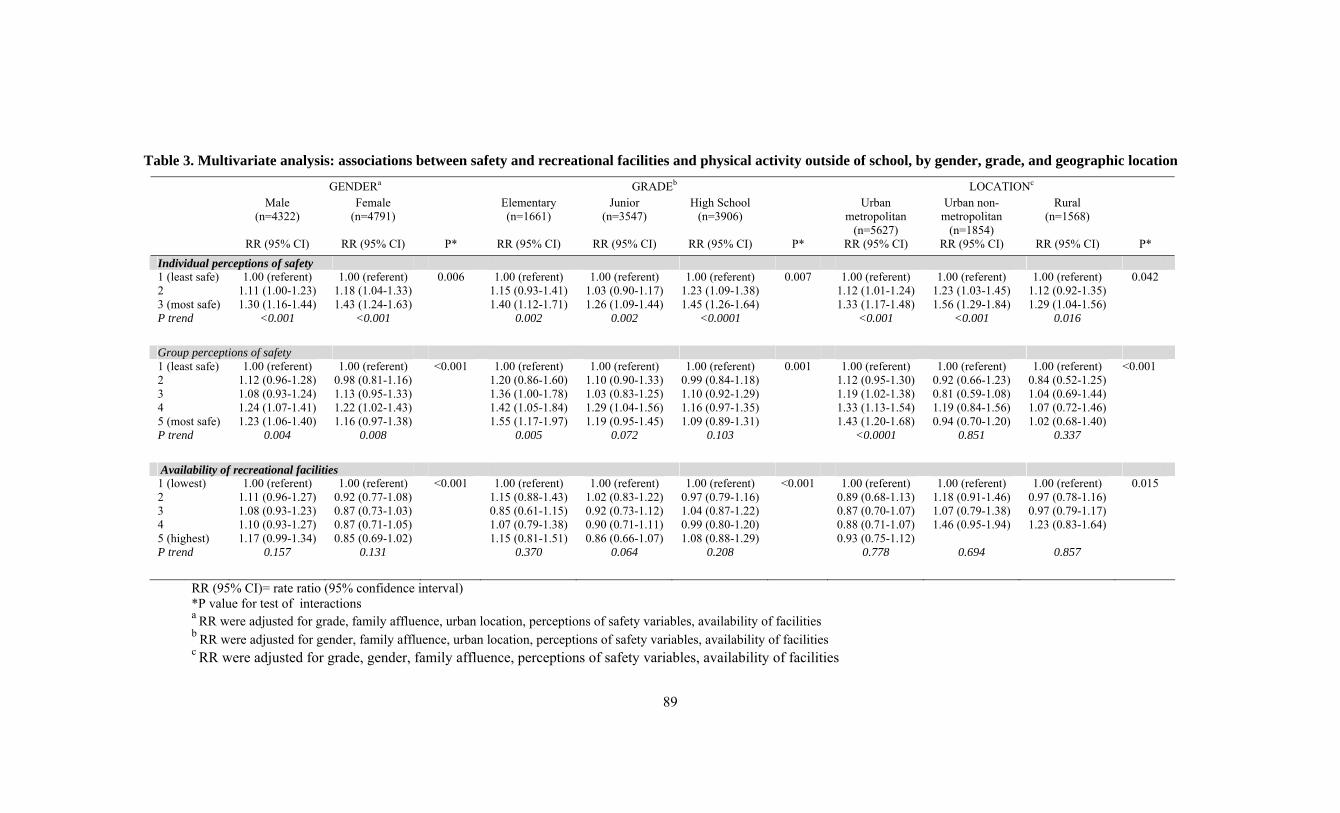
89
Table 3. Multivariate analysis: associations between safety and recreational facilities and physical activity outside of school, by gender, grade, and geographic location GENDERa GRADEb LOCATIONc
Male (n=4322)
Female (n=4791)
Elementary (n=1661)
Junior (n=3547)
High School (n=3906)
Urban metropolitan
(n=5627)
Urban non-metropolitan
(n=1854)
Rural (n=1568)
RR (95% CI) RR (95% CI) P* RR (95% CI) RR (95% CI) RR (95% CI) P* RR (95% CI) RR (95% CI) RR (95% CI) P* Individual perceptions of safety 1 (least safe) 1.00 (referent) 1.00 (referent) 0.006 1.00 (referent) 1.00 (referent) 1.00 (referent) 0.007 1.00 (referent) 1.00 (referent) 1.00 (referent) 0.042 2 1.11 (1.00-1.23) 1.18 (1.04-1.33) 1.15 (0.93-1.41) 1.03 (0.90-1.17) 1.23 (1.09-1.38) 1.12 (1.01-1.24) 1.23 (1.03-1.45) 1.12 (0.92-1.35) 3 (most safe) 1.30 (1.16-1.44) 1.43 (1.24-1.63) 1.40 (1.12-1.71) 1.26 (1.09-1.44) 1.45 (1.26-1.64) 1.33 (1.17-1.48) 1.56 (1.29-1.84) 1.29 (1.04-1.56) P trend <0.001 <0.001 0.002 0.002 <0.0001 <0.001 <0.001 0.016
Group perceptions of safety 1 (least safe) 1.00 (referent) 1.00 (referent) <0.001 1.00 (referent) 1.00 (referent) 1.00 (referent) 0.001 1.00 (referent) 1.00 (referent) 1.00 (referent) <0.001 2 1.12 (0.96-1.28) 0.98 (0.81-1.16) 1.20 (0.86-1.60) 1.10 (0.90-1.33) 0.99 (0.84-1.18) 1.12 (0.95-1.30) 0.92 (0.66-1.23) 0.84 (0.52-1.25) 3 1.08 (0.93-1.24) 1.13 (0.95-1.33) 1.36 (1.00-1.78) 1.03 (0.83-1.25) 1.10 (0.92-1.29) 1.19 (1.02-1.38) 0.81 (0.59-1.08) 1.04 (0.69-1.44) 4 1.24 (1.07-1.41) 1.22 (1.02-1.43) 1.42 (1.05-1.84) 1.29 (1.04-1.56) 1.16 (0.97-1.35) 1.33 (1.13-1.54) 1.19 (0.84-1.56) 1.07 (0.72-1.46) 5 (most safe) 1.23 (1.06-1.40) 1.16 (0.97-1.38) 1.55 (1.17-1.97) 1.19 (0.95-1.45) 1.09 (0.89-1.31) 1.43 (1.20-1.68) 0.94 (0.70-1.20) 1.02 (0.68-1.40) P trend 0.004 0.008 0.005 0.072 0.103 <0.0001 0.851 0.337
Availability of recreational facilities 1 (lowest) 1.00 (referent) 1.00 (referent) <0.001 1.00 (referent) 1.00 (referent) 1.00 (referent) <0.001 1.00 (referent) 1.00 (referent) 1.00 (referent) 0.015 2 1.11 (0.96-1.27) 0.92 (0.77-1.08) 1.15 (0.88-1.43) 1.02 (0.83-1.22) 0.97 (0.79-1.16) 0.89 (0.68-1.13) 1.18 (0.91-1.46) 0.97 (0.78-1.16) 3 1.08 (0.93-1.23) 0.87 (0.73-1.03) 0.85 (0.61-1.15) 0.92 (0.73-1.12) 1.04 (0.87-1.22) 0.87 (0.70-1.07) 1.07 (0.79-1.38) 0.97 (0.79-1.17) 4 1.10 (0.93-1.27) 0.87 (0.71-1.05) 1.07 (0.79-1.38) 0.90 (0.71-1.11) 0.99 (0.80-1.20) 0.88 (0.71-1.07) 1.46 (0.95-1.94) 1.23 (0.83-1.64) 5 (highest) 1.17 (0.99-1.34) 0.85 (0.69-1.02) 1.15 (0.81-1.51) 0.86 (0.66-1.07) 1.08 (0.88-1.29) 0.93 (0.75-1.12) P trend 0.157 0.131 0.370 0.064 0.208 0.778 0.694 0.857
RR (95% CI)= rate ratio (95% confidence interval) *P value for test of interactions a RR were adjusted for grade, family affluence, urban location, perceptions of safety variables, availability of facilities b RR were adjusted for gender, family affluence, urban location, perceptions of safety variables, availability of facilities c RR were adjusted for grade, gender, family affluence, perceptions of safety variables, availability of facilities
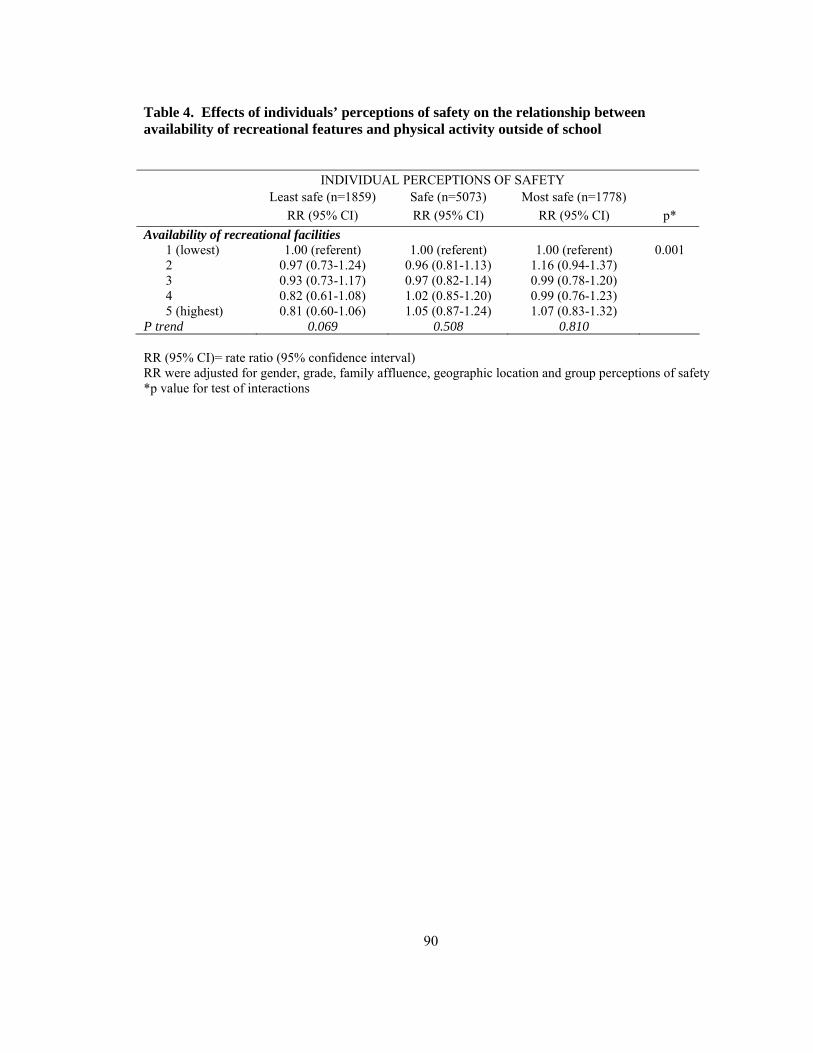
90
Table 4. Effects of individuals’ perceptions of safety on the relationship between availability of recreational features and physical activity outside of school
INDIVIDUAL PERCEPTIONS OF SAFETY Least safe (n=1859) Safe (n=5073) Most safe (n=1778) RR (95% CI) RR (95% CI) RR (95% CI) p* Availability of recreational facilities 1 (lowest) 1.00 (referent) 1.00 (referent) 1.00 (referent) 0.001 2 0.97 (0.73-1.24) 0.96 (0.81-1.13) 1.16 (0.94-1.37) 3 0.93 (0.73-1.17) 0.97 (0.82-1.14) 0.99 (0.78-1.20) 4 0.82 (0.61-1.08) 1.02 (0.85-1.20) 0.99 (0.76-1.23) 5 (highest) 0.81 (0.60-1.06) 1.05 (0.87-1.24) 1.07 (0.83-1.32) P trend 0.069 0.508 0.810 RR (95% CI)= rate ratio (95% confidence interval) RR were adjusted for gender, grade, family affluence, geographic location and group perceptions of safety *p value for test of interactions
91
Chapter 5 General Discussion
5.1 Summary of Key Findings
The purpose of this thesis was to investigate associations between characteristics
of school and neighbourhood environments and physical activity participation among
Canadian youth in grades 6 through 10. In the first manuscript I observed that aspects of
the school recreational environment are modestly positively related to adolescents’
physical activity at school, particularly activity that occurs during free-time. The
cumulative effect of school recreational features exerted a stronger effect than any single
feature. These findings suggest that provision of recreational opportunities at school may
promote physical activity among students.
Results from the second manuscript revealed that individual and peer perceptions
of neighbourhood safety were modestly associated with adolescents’ physical activity
outside of school. Individuals’ perceptions of safety were important for boys and girls of
all ages in both rural and urban areas. Peer perceptions were important for younger youth
(those in grade 6), perhaps reflective of an increased tendency of younger youth to be
socially and spontaneously active outdoors. Increased availability of parks and
recreational facilities neither prevented nor promoted physical activity.
5.2 Limitations of the Thesis
Both manuscripts were subject to some common limitations. First, both used a
cross-sectional study design that did not permit a full exploration of temporality. It is
plausible that schools might provide more opportunities to accommodate the interests of a
92
more active student population rather than the provision of opportunities influencing
student activity. In the second analysis, it was possible that students’ physical activity
outdoors could influence their perceptions, rather than perceptions influencing behaviour.
Second, the analyses were limited to some degree by methodological challenges.
Significant interactions were detected in each manuscript and therefore associations were
explored within subgroups. Subsamples were smaller than the overall sample size; as
such, subgroup analyses may have been underpowered. It was also not possible to
consider multiple significant interactions simultaneously. In addition, no statistical
adjustments were made for multiple comparisons; as such it is possible that some
statistically significant associations may have occurred simply due to chance.
The second analyses presented in manuscript 2 were subject to additional
limitations. First, only availability of parks and facilities was investigated; other aspects
such as accessibility and quality of these facilities may be important factors to consider.
Second, it would have been ideal to measure residential neighbourhoods using buffers
constructed around individuals’ homes; this was not possible since the HBSC is restricted
from collecting information on student home addresses for reasons of confidentiality. It is
possible that through use of a 5 km buffer around schools, neighbourhood characteristics
may have been ascribed to students who in fact do not live within these radii. Finally, no
standard method exists for assessment of neighbourhood environments. Thus, it was
unclear which type of buffer should be used (radial versus street network buffers) and
what radial distance around schools would be appropriate in capturing the residential
neighbourhood of schools.
93
5.3 Strengths of the Thesis
Manuscript 1 is the first study to explore the individual and combined importance
of physical education policies, recreational opportunities (e.g. sports programming), and
facilities on physical activity participation at school within a large national sample. No
studies to date have examined the effects of school recreational sports and policies on
student engagement in physical activity. The second study (manuscript 2) is the first to
examine the relative importance of perceptions of safety and availability of facilities on
participation in physical activity among both boys and girls.
The thesis is also unique in its consideration of the broad Canadian context. To
date, the effects of school characteristics have only been explored in rural Alberta.
Although many studies of the effects of neighbourhood characteristics have been
conducted in the United States and around the world, no Canadian studies of this topic
exist.
The use of multilevel modeling in the statistical analyses was an additional
methodological strength of this study, as it has a number of advantages. This modelling
approach does not assume that observations are independent. Given that the HBSC survey
uses a clustered sampling frame to select participants and that students within schools are
likely to be more similar than students between schools, intraclass correlation is
expected1. It would therefore be erroneous to assume independence. Second, multilevel
analyses do not require that individual-level data be aggregated to the school-level or that
school-level data be disaggregated to the individual1. Statistical issues arise with both of
these methods: aggregating data to the school-level results in loss of statistical power by
94
using fewer units of observation, whereas disaggregating treats higher-level information
as though it involved independent observations for each student, leading to overestimates
of significance1. Multilevel modelling is more conservative than traditional regression but
more liberal than an ecological approach. Third, hierarchical analyses allow cross-level
interactions to be explored1.
Finally, this analysis takes advantage of a large nationally representative sample
of Canadian youth. It is generally assumed to be largely generalizable to Canada. Since
adolescent physical activity rates, educational systems, and potentially neighbourhood
environments may be similar across the United States and Europe, the findings of these
studies may be largely generalizable to other industrialized countries.
5.4 Statistical Power
Due to the number of subgroup analyses explored in these manuscripts, power
calculations were not performed for each subsample of students under study. Instead, the
power of each sample in detecting a rate ratio of 1.2 was estimated. There is no standard
method for calculating power in a multi-level analysis, hence power was estimated based
on a classical power calculation adjusted for the design effect associated with the HBSC
physical activity questions. The design effect estimates how the clustered nature of the
survey data affects the standard errors of parameter estimates2. Snijders2 states that “the
required sample size for a multilevel design will be given by the sample size that would
be required for a simple random sample design, multiplied by the design effect.” Power
calculations for first manuscript (Chapter 3) use an effective sample size of 5445,
obtained by dividing the total sample size (n=7638) by the design effect for the HBSC
95
physical activity measures (deff=1.40)3. Power calculations for the second manuscript
(Chapter 4) use an effective sample size of 6510 under the same assumption about
clustering.
Given that class-time and free-time physical activity have a prevalence of 55%
and 49%, respectively, the analyses in the first manuscript had between 85%-100%
power to detect rate ratios of 1.2 at a 0.05 level of significance (Appendix Table E). The
smallest effects detectable using the entire sample ranged from 1.07 to 1.18. Based on
the prevalence of physical activity outside of school (36%), the analyses in the second
manuscript had 100% power to detect rate ratios of 1.2 at a 0.05 level of significance.
The smallest detectable effect based on the entire sample size was 1.10 (Appendix Table
E).
5.5 Future Research Directions
Few existing studies have investigated the effects of the school environments on
students’ physical activity. Further research is warranted. Temporality of the
relationships between the school environment and physical activity should be explored.
Research that examines how school environments influence younger children’s physical
activity is lacking. In addition, future studies should investigate characteristics of
physical education classes that promote class-time physical activity.
Study of neighbourhood characteristics as determinants of physical activity is a
newly emerging field. As such, there is a lack of consistency in how neighbourhoods are
measured. Measurement of physical activity varies considerably and it is unclear what
levels of physical activity are optimal. Development of a standard approach to
96
measurement of the built environment and physical activity in youth would improve
comparability between studies.
Future studies should consider the effects of different aspects of neighbourhood
safety on youth physical activity, in particular the importance of perceptions of social and
physical dangers. It is important to understand the extent to which perceptions match the
objective environment in order to inform population-based interventions. Consideration
of the accessibility, affordability, and quality of public recreational spaces is also
required.
5.6 Public Health and Policy Implications
Although the effects of school environments and perceptions of safety on physical
activity were modest, school and neighbourhood environment are ubiquitous; taken
together with their high prevalence, these exposures may be important in influencing
physical activity behaviours. Changes to the school and neighbourhood environment, in
terms of better and increased school recreational opportunities and increased
neighbourhood safety, could improve physical activity rates among adolescents. Not
only would increased physical activity participation translate into immediate health
benefits for youth, but it may also reduce the future incidence of physical inactivity-
related chronic diseases.
The results of manuscript 1 revealed that high levels of recreational support at
schools might promote physical activity among young people. This could not only
inform educational policies for intramural sports and extracurricular activity, but also
97
support funding of these opportunities. In addition, this research could support funding
improvements to school gymnasia and sport fields.
Interventions aimed at improving the safety of neighbourhoods, along with those
aimed at increasing individuals’ perceptions of safety, could potentially be effective in
promoting outdoor physical activity among children and adolescents. Such interventions
might involve promoting social interaction among community members or more tangible
improvements to neighbourhoods, such as an increased police presence, safer facilities,
traffic calming measures, and physical improvements to roads.
5.7 References
(1) Hox JJ. Applied Multilevel Analysis. http://www geocities
com/joophox/publist/amaboek pdf 1995
(2) Snijders T. Power and sample size in multilevel modelling. In: Everitt BS, Howell
DC, editors. Encyclopedia of Statistics in Behavioural Science. Volume 3. Wiley;
2005. p. 1570-3.
(3) Roberts C, Alexander L, Currie D, Haug E, Komkov A, Tynjala J, et al. Health
Behaviour in School-Aged Children Protocol for 2005/06 Survey. Section 2,
Scientific rationales for focus areas: Physical Activity. 2005.
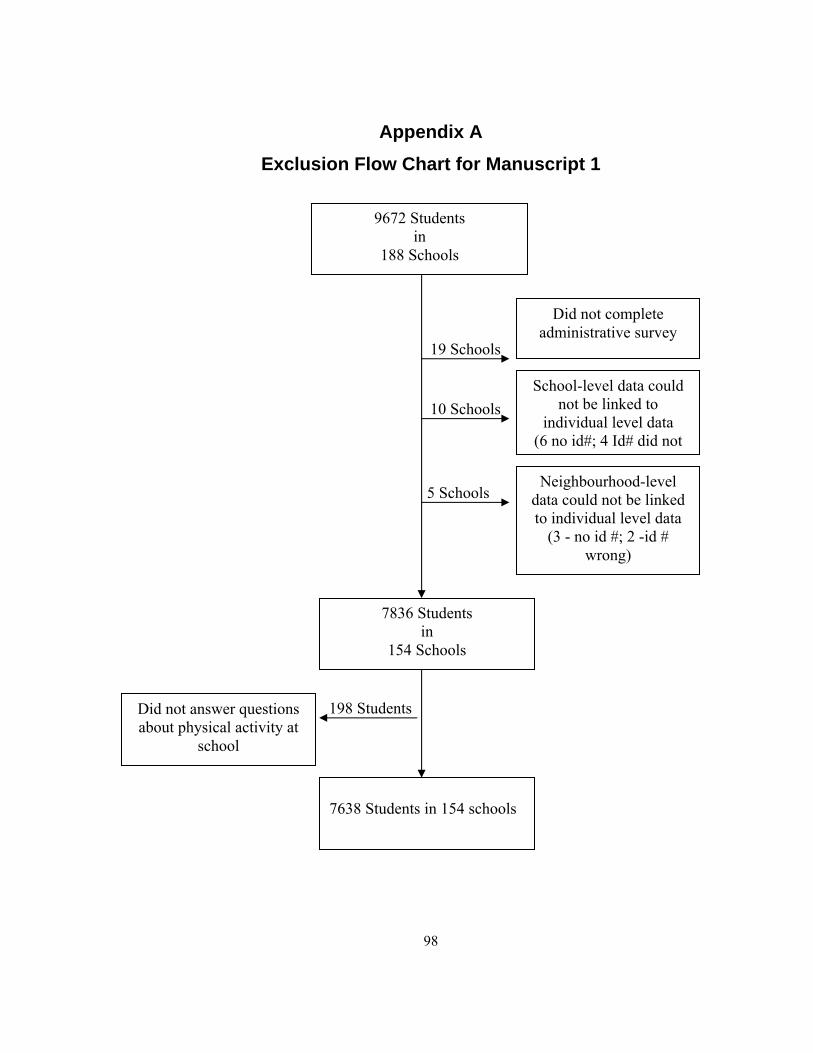
98
19 Schools
10 Schools
5 Schools
198 Students
Appendix A Exclusion Flow Chart for Manuscript 1
9672 Students in
188 Schools
Did not complete administrative survey
School-level data could not be linked to
individual level data (6 no id#; 4 Id# did not
Neighbourhood-level data could not be linked to individual level data
(3 - no id #; 2 -id # wrong)
7836 Students in
154 Schools
7638 Students in 154 schools
Did not answer questions about physical activity at
school
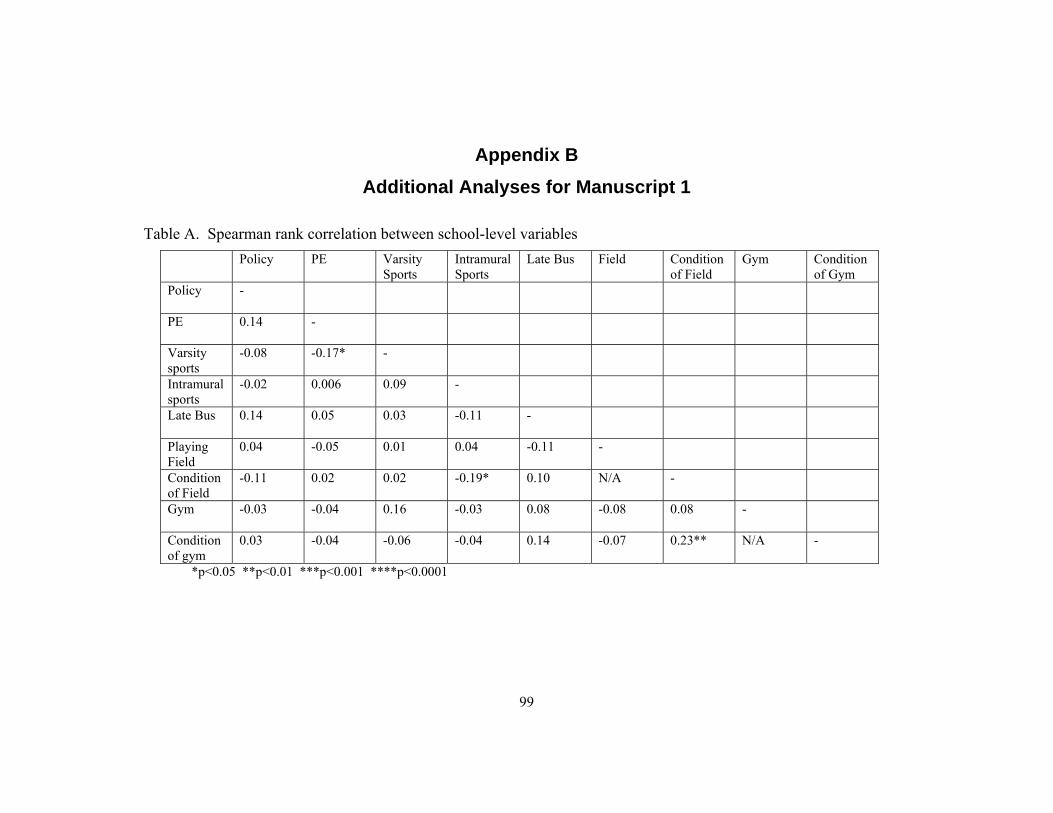
99
Appendix B Additional Analyses for Manuscript 1
Table A. Spearman rank correlation between school-level variables Policy PE Varsity
Sports Intramural Sports
Late Bus Field Condition of Field
Gym Condition of Gym
Policy
-
PE
0.14 -
Varsity sports
-0.08 -0.17* -
Intramural sports
-0.02 0.006 0.09 -
Late Bus
0.14 0.05 0.03 -0.11 -
Playing Field
0.04 -0.05 0.01 0.04 -0.11 -
Condition of Field
-0.11 0.02 0.02 -0.19* 0.10 N/A -
Gym
-0.03 -0.04 0.16 -0.03 0.08 -0.08 0.08 -
Condition of gym
0.03 -0.04 -0.06 -0.04 0.14 -0.07 0.23** N/A -
*p<0.05 **p<0.01 ***p<0.001 ****p<0.0001
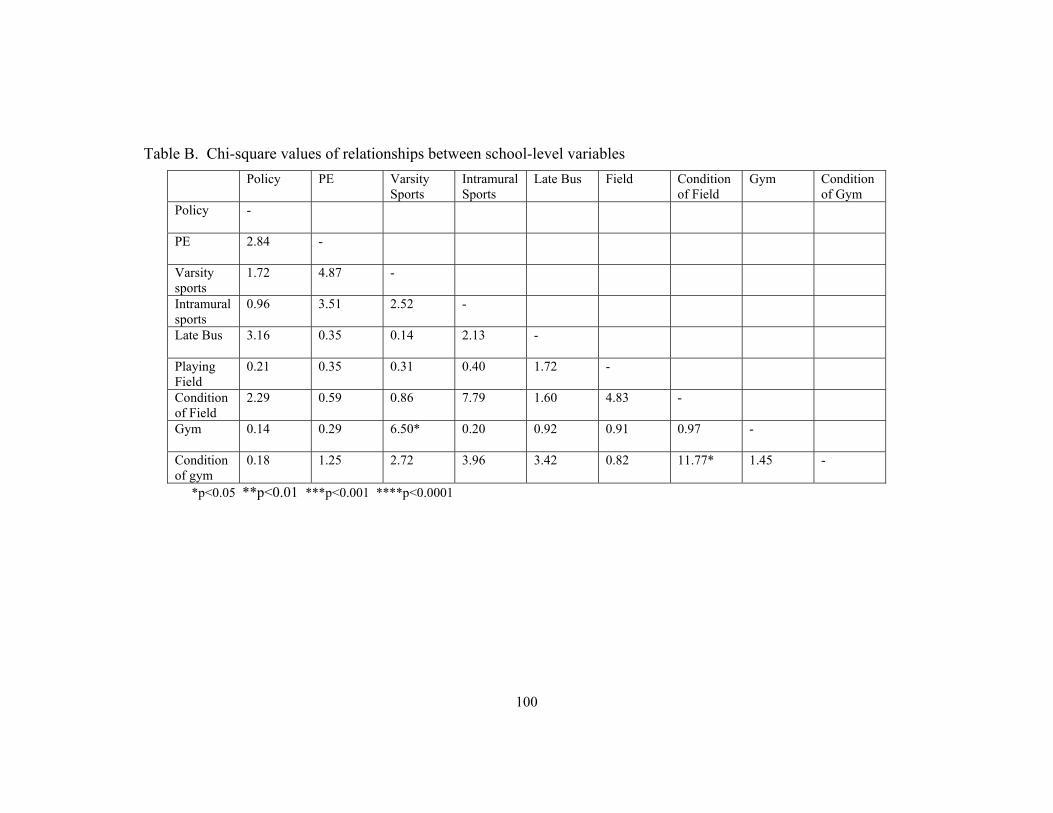
100
Table B. Chi-square values of relationships between school-level variables Policy PE Varsity
Sports Intramural Sports
Late Bus Field Condition of Field
Gym Condition of Gym
Policy
-
PE
2.84 -
Varsity sports
1.72 4.87 -
Intramural sports
0.96 3.51 2.52 -
Late Bus
3.16 0.35 0.14 2.13 -
Playing Field
0.21 0.35 0.31 0.40 1.72 -
Condition of Field
2.29 0.59 0.86 7.79 1.60 4.83 -
Gym
0.14 0.29 6.50* 0.20 0.92 0.91 0.97 -
Condition of gym
0.18 1.25 2.72 3.96 3.42 0.82 11.77* 1.45 -
*p<0.05 **p<0.01 ***p<0.001 ****p<0.0001

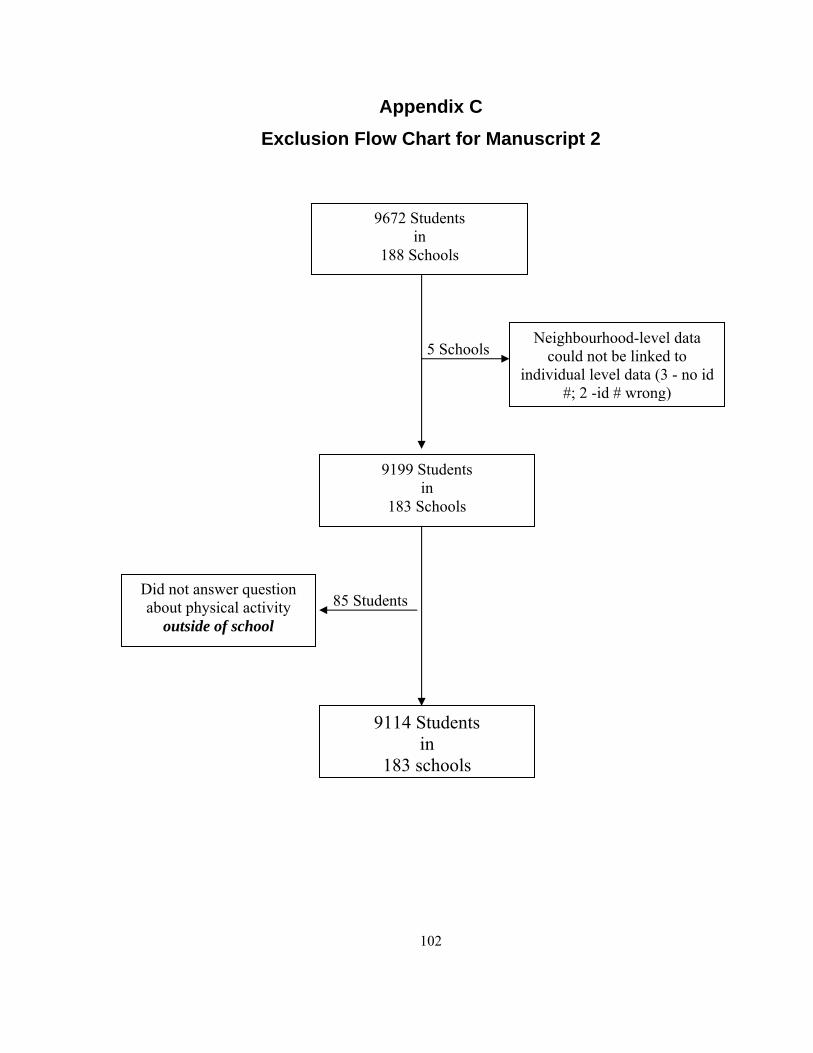
102
5 Schools
85 Students
Appendix C Exclusion Flow Chart for Manuscript 2
9672 Students in
188 Schools
Neighbourhood-level data could not be linked to
individual level data (3 - no id #; 2 -id # wrong)
9199 Students in
183 Schools
9114 Students in
183 schools
Did not answer question about physical activity
outside of school
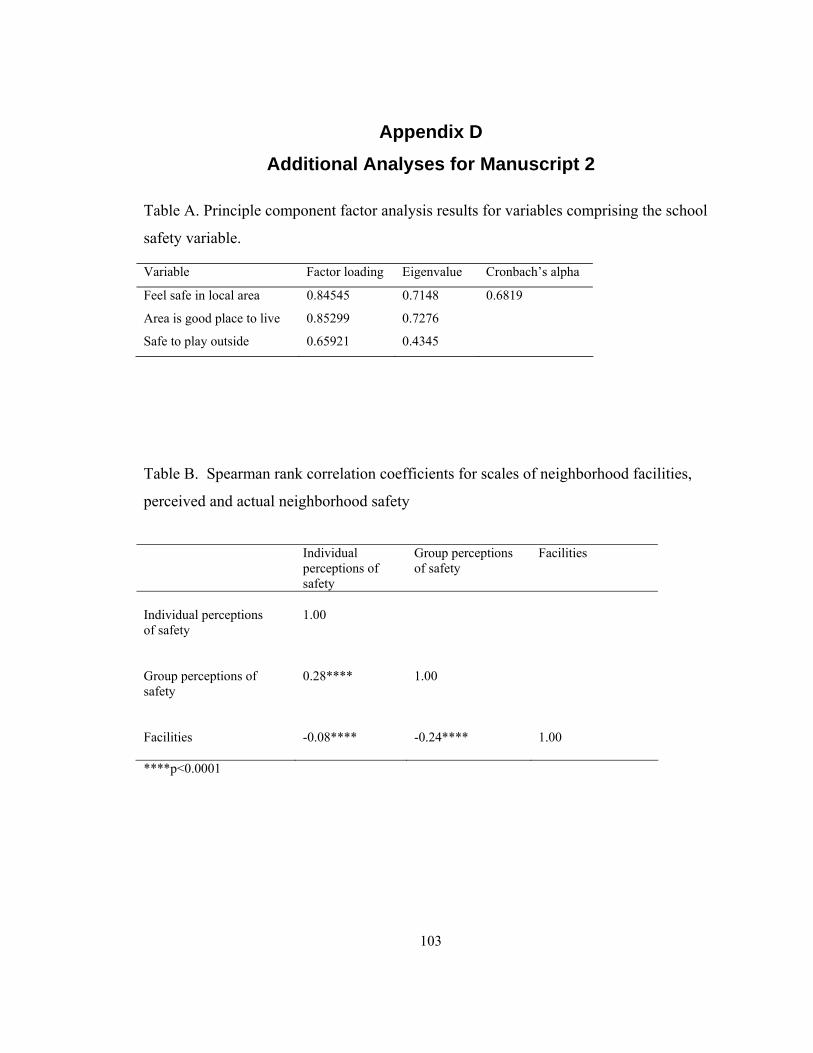
103
Appendix D Additional Analyses for Manuscript 2
Table A. Principle component factor analysis results for variables comprising the school
safety variable.
Table B. Spearman rank correlation coefficients for scales of neighborhood facilities,
perceived and actual neighborhood safety
Individual perceptions of safety
Group perceptions of safety
Facilities
Individual perceptions of safety
1.00
Group perceptions of safety
0.28****
1.00
Facilities
-0.08****
-0.24****
1.00
****p<0.0001
Variable Factor loading Eigenvalue Cronbach’s alpha
Feel safe in local area 0.84545 0.7148 0.6819
Area is good place to live 0.85299 0.7276
Safe to play outside 0.65921 0.4345
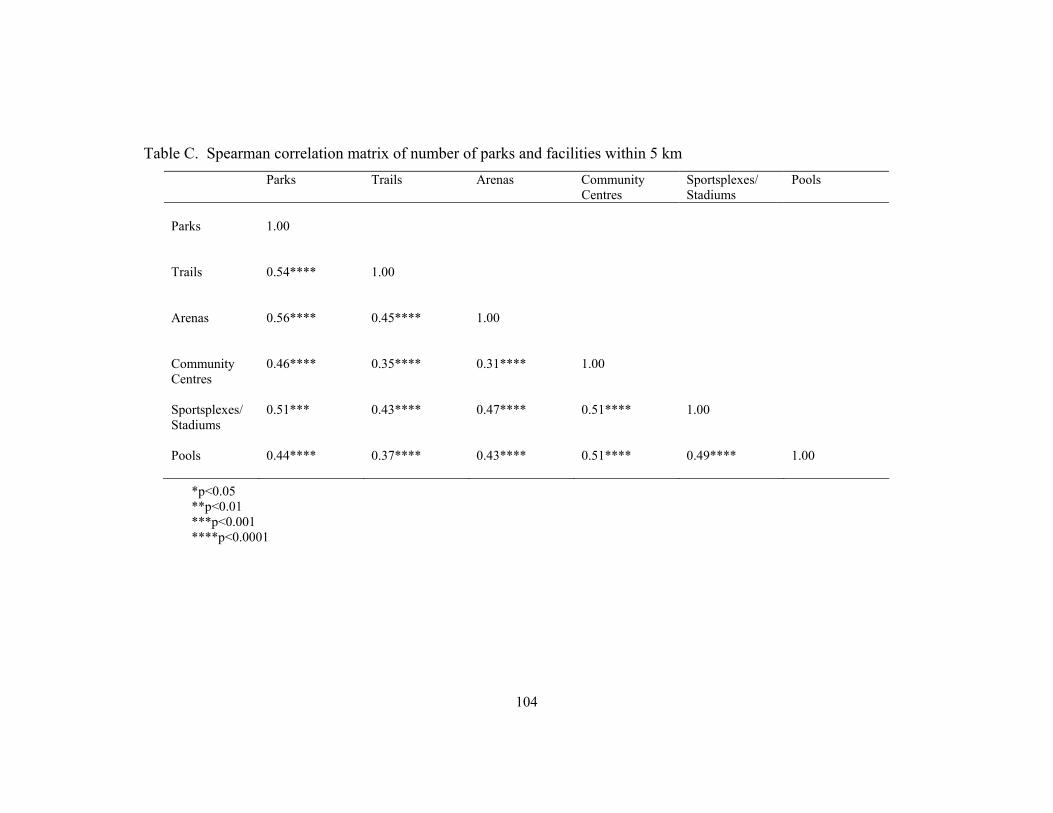
104
Table C. Spearman correlation matrix of number of parks and facilities within 5 km
*p<0.05 **p<0.01 ***p<0.001 ****p<0.0001
Parks Trails Arenas Community Centres
Sportsplexes/ Stadiums
Pools
Parks
1.00
Trails
0.54**** 1.00
Arenas
0.56**** 0.45**** 1.00
Community Centres
0.46**** 0.35**** 0.31**** 1.00
Sportsplexes/ Stadiums
0.51*** 0.43**** 0.47**** 0.51**** 1.00
Pools
0.44****
0.37****
0.43**** 0.51****
0.49****
1.00
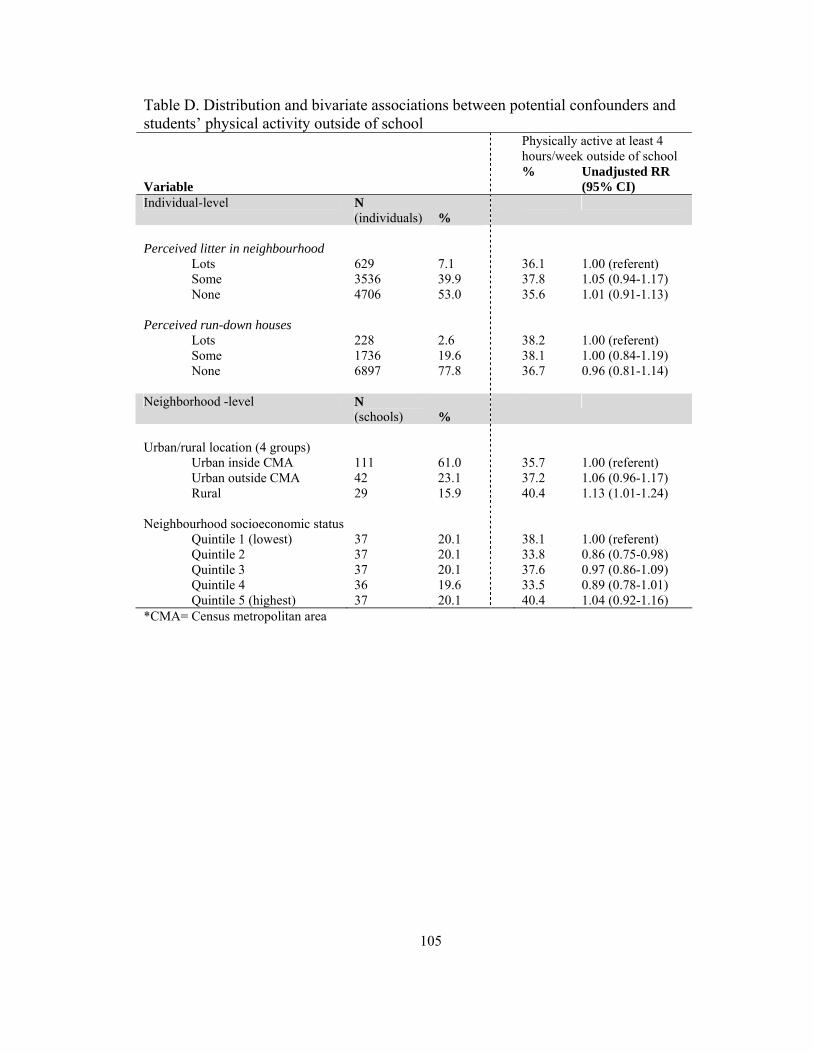
105
Table D. Distribution and bivariate associations between potential confounders and students’ physical activity outside of school
Physically active at least 4
hours/week outside of school
Variable % Unadjusted RR
(95% CI) Individual-level N
(individuals) %
Perceived litter in neighbourhood Lots 629 7.1 36.1 1.00 (referent) Some 3536 39.9 37.8 1.05 (0.94-1.17) None 4706 53.0 35.6 1.01 (0.91-1.13) Perceived run-down houses Lots 228 2.6 38.2 1.00 (referent) Some 1736 19.6 38.1 1.00 (0.84-1.19) None 6897 77.8 36.7 0.96 (0.81-1.14) Neighborhood -level N
(schools) %
Urban/rural location (4 groups) Urban inside CMA 111 61.0 35.7 1.00 (referent) Urban outside CMA 42 23.1 37.2 1.06 (0.96-1.17) Rural 29 15.9 40.4 1.13 (1.01-1.24) Neighbourhood socioeconomic status Quintile 1 (lowest) 37 20.1 38.1 1.00 (referent) Quintile 2 37 20.1 33.8 0.86 (0.75-0.98) Quintile 3 37 20.1 37.6 0.97 (0.86-1.09) Quintile 4 36 19.6 33.5 0.89 (0.78-1.01) Quintile 5 (highest) 37 20.1 40.4 1.04 (0.92-1.16) *CMA= Census metropolitan area
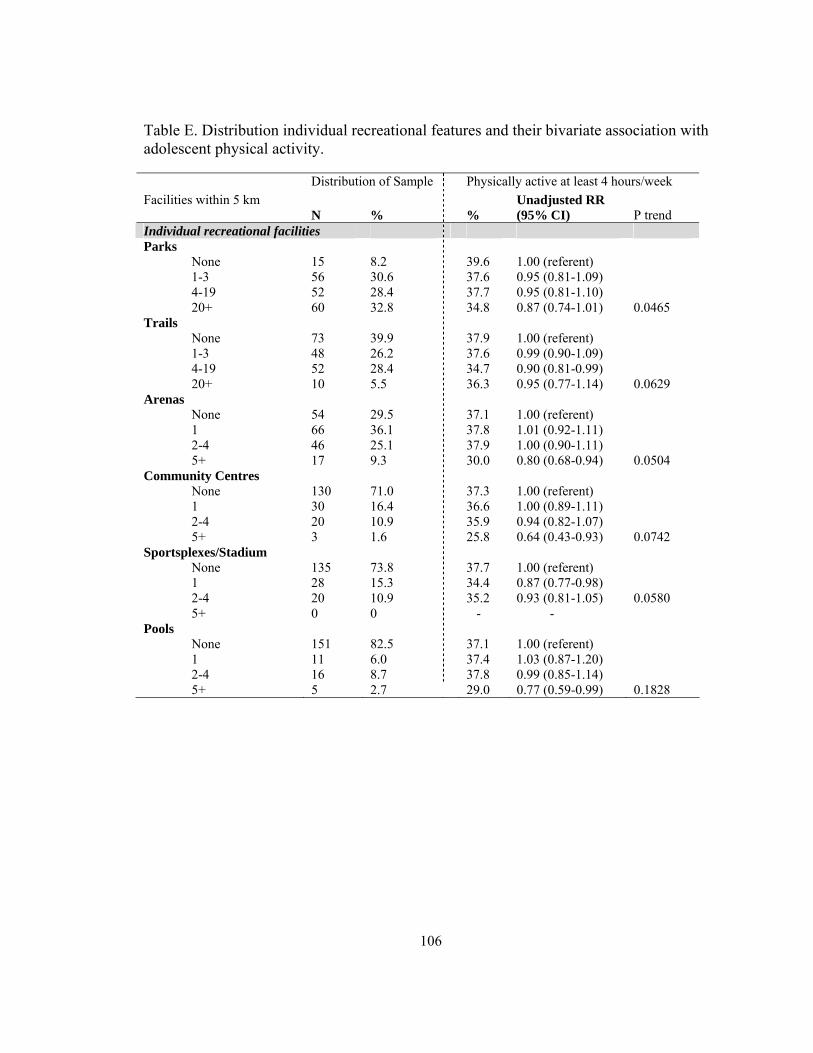
106
Table E. Distribution individual recreational features and their bivariate association with adolescent physical activity. Distribution of Sample Physically active at least 4 hours/week Facilities within 5 km
N % % Unadjusted RR (95% CI) P trend
Individual recreational facilities Parks None 15 8.2 39.6 1.00 (referent) 1-3 56 30.6 37.6 0.95 (0.81-1.09) 4-19 52 28.4 37.7 0.95 (0.81-1.10) 20+ 60 32.8 34.8 0.87 (0.74-1.01) 0.0465 Trails None 73 39.9 37.9 1.00 (referent) 1-3 48 26.2 37.6 0.99 (0.90-1.09) 4-19 52 28.4 34.7 0.90 (0.81-0.99) 20+ 10 5.5 36.3 0.95 (0.77-1.14) 0.0629 Arenas None 54 29.5 37.1 1.00 (referent) 1 66 36.1 37.8 1.01 (0.92-1.11) 2-4 46 25.1 37.9 1.00 (0.90-1.11) 5+ 17 9.3 30.0 0.80 (0.68-0.94) 0.0504 Community Centres None 130 71.0 37.3 1.00 (referent) 1 30 16.4 36.6 1.00 (0.89-1.11) 2-4 20 10.9 35.9 0.94 (0.82-1.07) 5+ 3 1.6 25.8 0.64 (0.43-0.93) 0.0742 Sportsplexes/Stadium None 135 73.8 37.7 1.00 (referent) 1 28 15.3 34.4 0.87 (0.77-0.98) 2-4 20 10.9 35.2 0.93 (0.81-1.05) 0.0580 5+ 0 0 - - Pools None 151 82.5 37.1 1.00 (referent) 1 11 6.0 37.4 1.03 (0.87-1.20) 2-4 16 8.7 37.8 0.99 (0.85-1.14) 5+ 5 2.7 29.0 0.77 (0.59-0.99) 0.1828
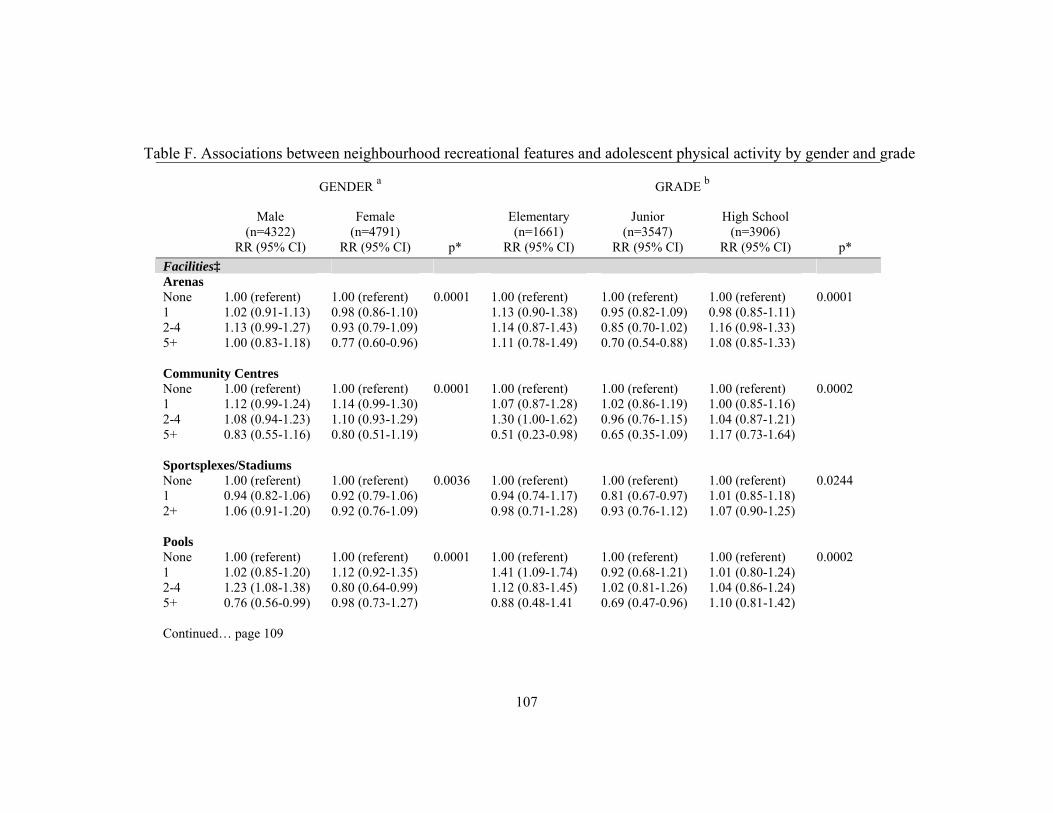
107
Table F. Associations between neighbourhood recreational features and adolescent physical activity by gender and grade
GENDER a GRADE b
Male (n=4322)
Female (n=4791)
Elementary (n=1661)
Junior (n=3547)
High School (n=3906)
RR (95% CI) RR (95% CI) p* RR (95% CI) RR (95% CI) RR (95% CI) p* Facilities‡ Arenas None 1.00 (referent) 1.00 (referent) 0.0001 1.00 (referent) 1.00 (referent) 1.00 (referent) 0.0001 1 1.02 (0.91-1.13) 0.98 (0.86-1.10) 1.13 (0.90-1.38) 0.95 (0.82-1.09) 0.98 (0.85-1.11) 2-4 1.13 (0.99-1.27) 0.93 (0.79-1.09) 1.14 (0.87-1.43) 0.85 (0.70-1.02) 1.16 (0.98-1.33) 5+ 1.00 (0.83-1.18) 0.77 (0.60-0.96) 1.11 (0.78-1.49) 0.70 (0.54-0.88) 1.08 (0.85-1.33) Community Centres None 1.00 (referent) 1.00 (referent) 0.0001 1.00 (referent) 1.00 (referent) 1.00 (referent) 0.0002 1 1.12 (0.99-1.24) 1.14 (0.99-1.30) 1.07 (0.87-1.28) 1.02 (0.86-1.19) 1.00 (0.85-1.16) 2-4 1.08 (0.94-1.23) 1.10 (0.93-1.29) 1.30 (1.00-1.62) 0.96 (0.76-1.15) 1.04 (0.87-1.21) 5+ 0.83 (0.55-1.16) 0.80 (0.51-1.19) 0.51 (0.23-0.98) 0.65 (0.35-1.09) 1.17 (0.73-1.64) Sportsplexes/Stadiums None 1.00 (referent) 1.00 (referent) 0.0036 1.00 (referent) 1.00 (referent) 1.00 (referent) 0.0244 1 0.94 (0.82-1.06) 0.92 (0.79-1.06) 0.94 (0.74-1.17) 0.81 (0.67-0.97) 1.01 (0.85-1.18) 2+ 1.06 (0.91-1.20) 0.92 (0.76-1.09) 0.98 (0.71-1.28) 0.93 (0.76-1.12) 1.07 (0.90-1.25) Pools None 1.00 (referent) 1.00 (referent) 0.0001 1.00 (referent) 1.00 (referent) 1.00 (referent) 0.0002 1 1.02 (0.85-1.20) 1.12 (0.92-1.35) 1.41 (1.09-1.74) 0.92 (0.68-1.21) 1.01 (0.80-1.24) 2-4 1.23 (1.08-1.38) 0.80 (0.64-0.99) 1.12 (0.83-1.45) 1.02 (0.81-1.26) 1.04 (0.86-1.24) 5+ 0.76 (0.56-0.99) 0.98 (0.73-1.27) 0.88 (0.48-1.41 0.69 (0.47-0.96) 1.10 (0.81-1.42) Continued… page 109
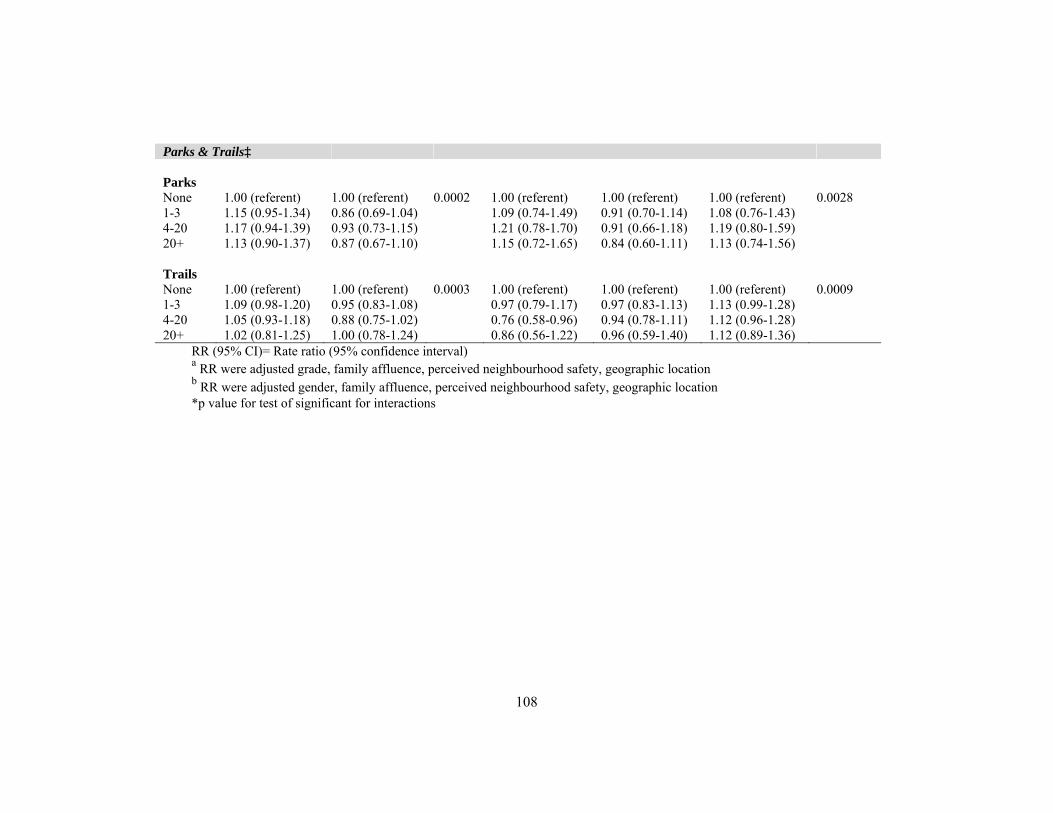
108
Parks & Trails‡ Parks None 1.00 (referent) 1.00 (referent) 0.0002 1.00 (referent) 1.00 (referent) 1.00 (referent) 0.0028 1-3 1.15 (0.95-1.34) 0.86 (0.69-1.04) 1.09 (0.74-1.49) 0.91 (0.70-1.14) 1.08 (0.76-1.43) 4-20 1.17 (0.94-1.39) 0.93 (0.73-1.15) 1.21 (0.78-1.70) 0.91 (0.66-1.18) 1.19 (0.80-1.59) 20+ 1.13 (0.90-1.37) 0.87 (0.67-1.10) 1.15 (0.72-1.65) 0.84 (0.60-1.11) 1.13 (0.74-1.56) Trails None 1.00 (referent) 1.00 (referent) 0.0003 1.00 (referent) 1.00 (referent) 1.00 (referent) 0.0009 1-3 1.09 (0.98-1.20) 0.95 (0.83-1.08) 0.97 (0.79-1.17) 0.97 (0.83-1.13) 1.13 (0.99-1.28) 4-20 1.05 (0.93-1.18) 0.88 (0.75-1.02) 0.76 (0.58-0.96) 0.94 (0.78-1.11) 1.12 (0.96-1.28) 20+ 1.02 (0.81-1.25) 1.00 (0.78-1.24) 0.86 (0.56-1.22) 0.96 (0.59-1.40) 1.12 (0.89-1.36)
RR (95% CI)= Rate ratio (95% confidence interval) a RR were adjusted grade, family affluence, perceived neighbourhood safety, geographic location b RR were adjusted gender, family affluence, perceived neighbourhood safety, geographic location *p value for test of significant for interactions
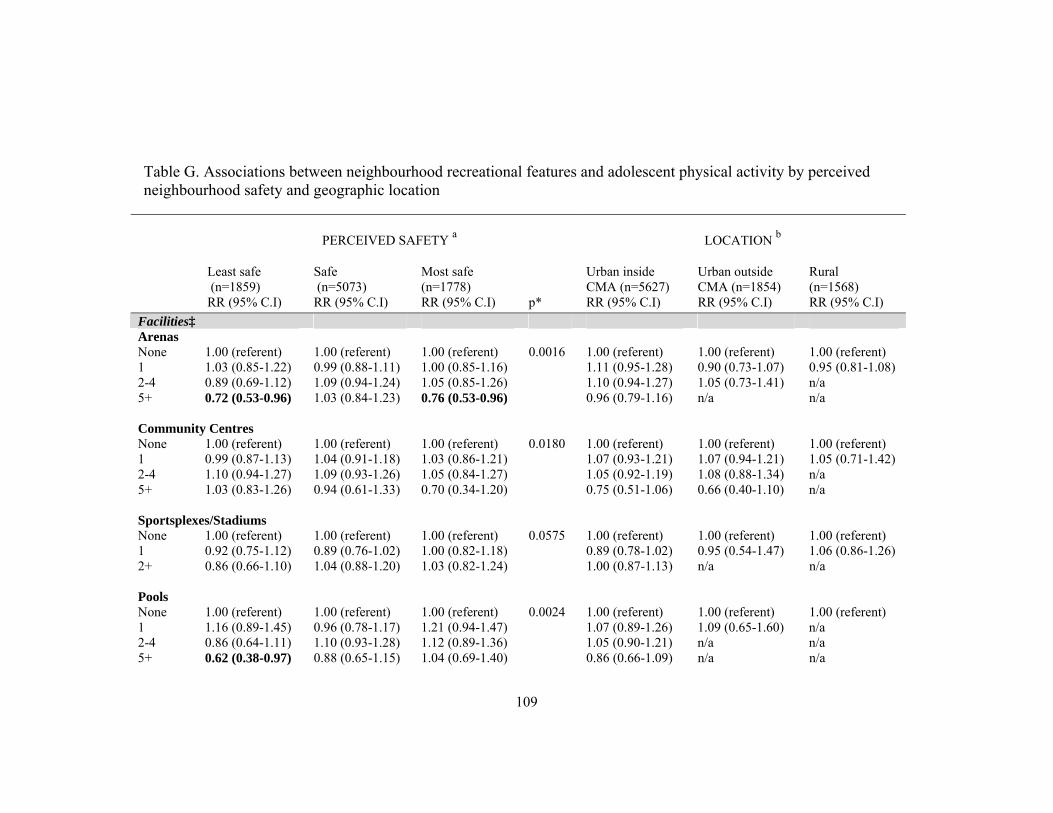
109
Table G. Associations between neighbourhood recreational features and adolescent physical activity by perceived neighbourhood safety and geographic location
PERCEIVED SAFETY a
LOCATION b
Least safe (n=1859)
Safe (n=5073)
Most safe (n=1778)
Urban inside CMA (n=5627)
Urban outside CMA (n=1854)
Rural (n=1568)
RR (95% C.I) RR (95% C.I) RR (95% C.I) p* RR (95% C.I) RR (95% C.I) RR (95% C.I) Facilities‡ Arenas None 1.00 (referent) 1.00 (referent) 1.00 (referent) 0.0016 1.00 (referent) 1.00 (referent) 1.00 (referent) 1 1.03 (0.85-1.22) 0.99 (0.88-1.11) 1.00 (0.85-1.16) 1.11 (0.95-1.28) 0.90 (0.73-1.07) 0.95 (0.81-1.08) 2-4 0.89 (0.69-1.12) 1.09 (0.94-1.24) 1.05 (0.85-1.26) 1.10 (0.94-1.27) 1.05 (0.73-1.41) n/a 5+ 0.72 (0.53-0.96) 1.03 (0.84-1.23) 0.76 (0.53-0.96) 0.96 (0.79-1.16) n/a n/a Community Centres None 1.00 (referent) 1.00 (referent) 1.00 (referent) 0.0180 1.00 (referent) 1.00 (referent) 1.00 (referent) 1 0.99 (0.87-1.13) 1.04 (0.91-1.18) 1.03 (0.86-1.21) 1.07 (0.93-1.21) 1.07 (0.94-1.21) 1.05 (0.71-1.42) 2-4 1.10 (0.94-1.27) 1.09 (0.93-1.26) 1.05 (0.84-1.27) 1.05 (0.92-1.19) 1.08 (0.88-1.34) n/a 5+ 1.03 (0.83-1.26) 0.94 (0.61-1.33) 0.70 (0.34-1.20) 0.75 (0.51-1.06) 0.66 (0.40-1.10) n/a Sportsplexes/Stadiums None 1.00 (referent) 1.00 (referent) 1.00 (referent) 0.0575 1.00 (referent) 1.00 (referent) 1.00 (referent) 1 0.92 (0.75-1.12) 0.89 (0.76-1.02) 1.00 (0.82-1.18) 0.89 (0.78-1.02) 0.95 (0.54-1.47) 1.06 (0.86-1.26) 2+ 0.86 (0.66-1.10) 1.04 (0.88-1.20) 1.03 (0.82-1.24) 1.00 (0.87-1.13) n/a n/a Pools None 1.00 (referent) 1.00 (referent) 1.00 (referent) 0.0024 1.00 (referent) 1.00 (referent) 1.00 (referent) 1 1.16 (0.89-1.45) 0.96 (0.78-1.17) 1.21 (0.94-1.47) 1.07 (0.89-1.26) 1.09 (0.65-1.60) n/a 2-4 0.86 (0.64-1.11) 1.10 (0.93-1.28) 1.12 (0.89-1.36) 1.05 (0.90-1.21) n/a n/a 5+ 0.62 (0.38-0.97) 0.88 (0.65-1.15) 1.04 (0.69-1.40) 0.86 (0.66-1.09) n/a n/a
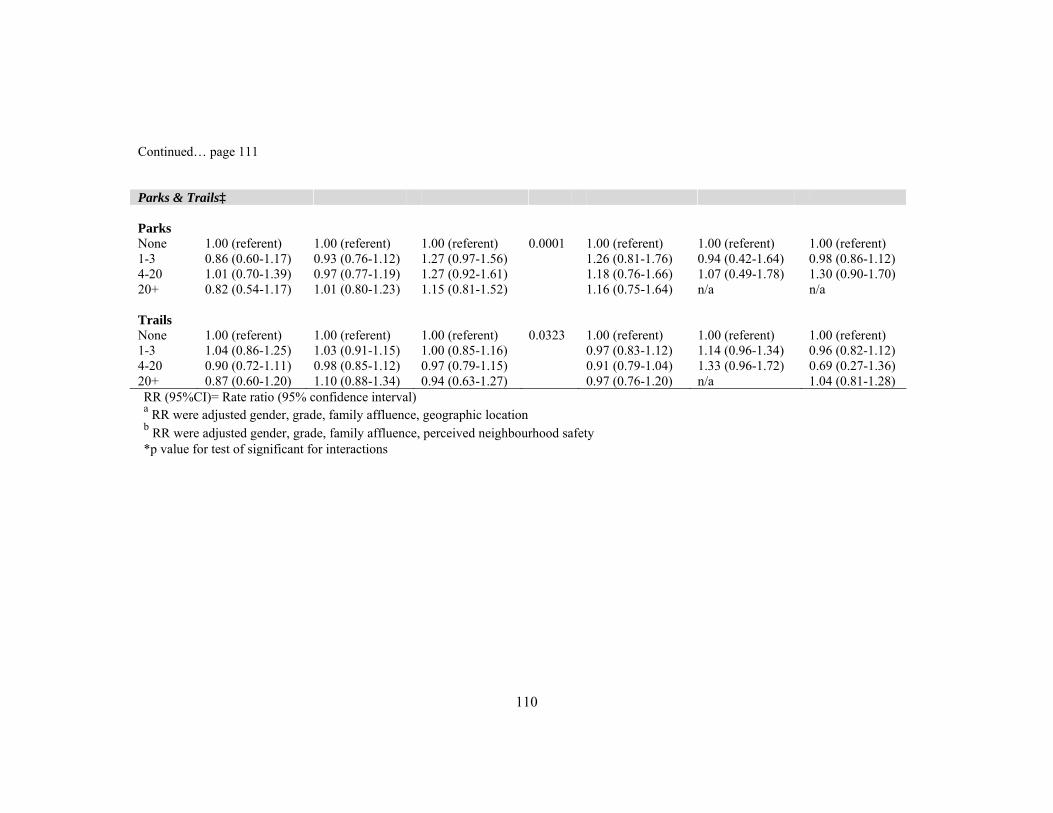
110
Continued… page 111 Parks & Trails‡ Parks None 1.00 (referent) 1.00 (referent) 1.00 (referent) 0.0001 1.00 (referent) 1.00 (referent) 1.00 (referent) 1-3 0.86 (0.60-1.17) 0.93 (0.76-1.12) 1.27 (0.97-1.56) 1.26 (0.81-1.76) 0.94 (0.42-1.64) 0.98 (0.86-1.12) 4-20 1.01 (0.70-1.39) 0.97 (0.77-1.19) 1.27 (0.92-1.61) 1.18 (0.76-1.66) 1.07 (0.49-1.78) 1.30 (0.90-1.70) 20+ 0.82 (0.54-1.17) 1.01 (0.80-1.23) 1.15 (0.81-1.52) 1.16 (0.75-1.64) n/a n/a Trails None 1.00 (referent) 1.00 (referent) 1.00 (referent) 0.0323 1.00 (referent) 1.00 (referent) 1.00 (referent) 1-3 1.04 (0.86-1.25) 1.03 (0.91-1.15) 1.00 (0.85-1.16) 0.97 (0.83-1.12) 1.14 (0.96-1.34) 0.96 (0.82-1.12) 4-20 0.90 (0.72-1.11) 0.98 (0.85-1.12) 0.97 (0.79-1.15) 0.91 (0.79-1.04) 1.33 (0.96-1.72) 0.69 (0.27-1.36) 20+ 0.87 (0.60-1.20) 1.10 (0.88-1.34) 0.94 (0.63-1.27) 0.97 (0.76-1.20) n/a 1.04 (0.81-1.28) RR (95%CI)= Rate ratio (95% confidence interval) a RR were adjusted gender, grade, family affluence, geographic location b RR were adjusted gender, grade, family affluence, perceived neighbourhood safety *p value for test of significant for interactions
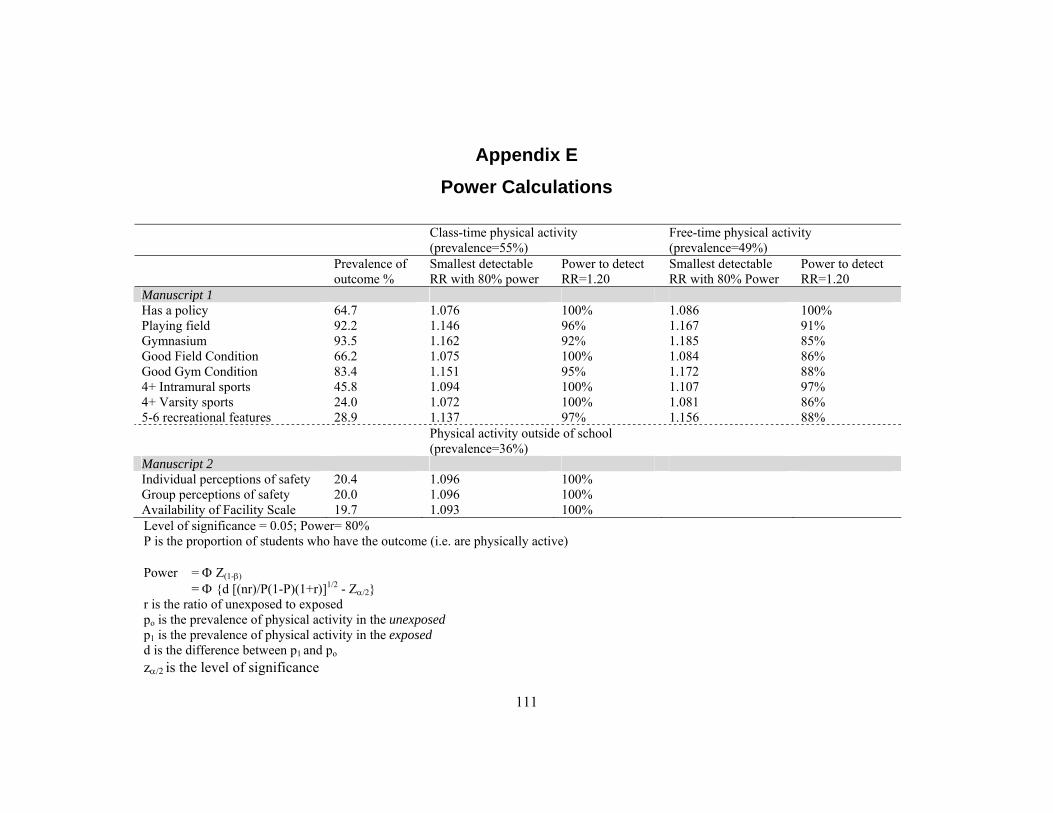
111
Appendix E Power Calculations
Class-time physical activity (prevalence=55%)
Free-time physical activity (prevalence=49%)
Prevalence of outcome %
Smallest detectable RR with 80% power
Power to detect RR=1.20
Smallest detectable RR with 80% Power
Power to detect RR=1.20
Manuscript 1 Has a policy 64.7 1.076 100% 1.086 100% Playing field 92.2 1.146 96% 1.167 91% Gymnasium 93.5 1.162 92% 1.185 85% Good Field Condition 66.2 1.075 100% 1.084 86% Good Gym Condition 83.4 1.151 95% 1.172 88% 4+ Intramural sports 45.8 1.094 100% 1.107 97% 4+ Varsity sports 24.0 1.072 100% 1.081 86% 5-6 recreational features 28.9 1.137 97% 1.156 88% Physical activity outside of school
(prevalence=36%)
Manuscript 2 Individual perceptions of safety 20.4 1.096 100% Group perceptions of safety 20.0 1.096 100% Availability of Facility Scale 19.7 1.093 100% Level of significance = 0.05; Power= 80% P is the proportion of students who have the outcome (i.e. are physically active)
Power = Φ Z(1-β)
= Φ {d [(nr)/P(1-P)(1+r)]1/2 - Zα/2} r is the ratio of unexposed to exposed po is the prevalence of physical activity in the unexposed p1 is the prevalence of physical activity in the exposed d is the difference between p1 and po
zα/2 is the level of significance
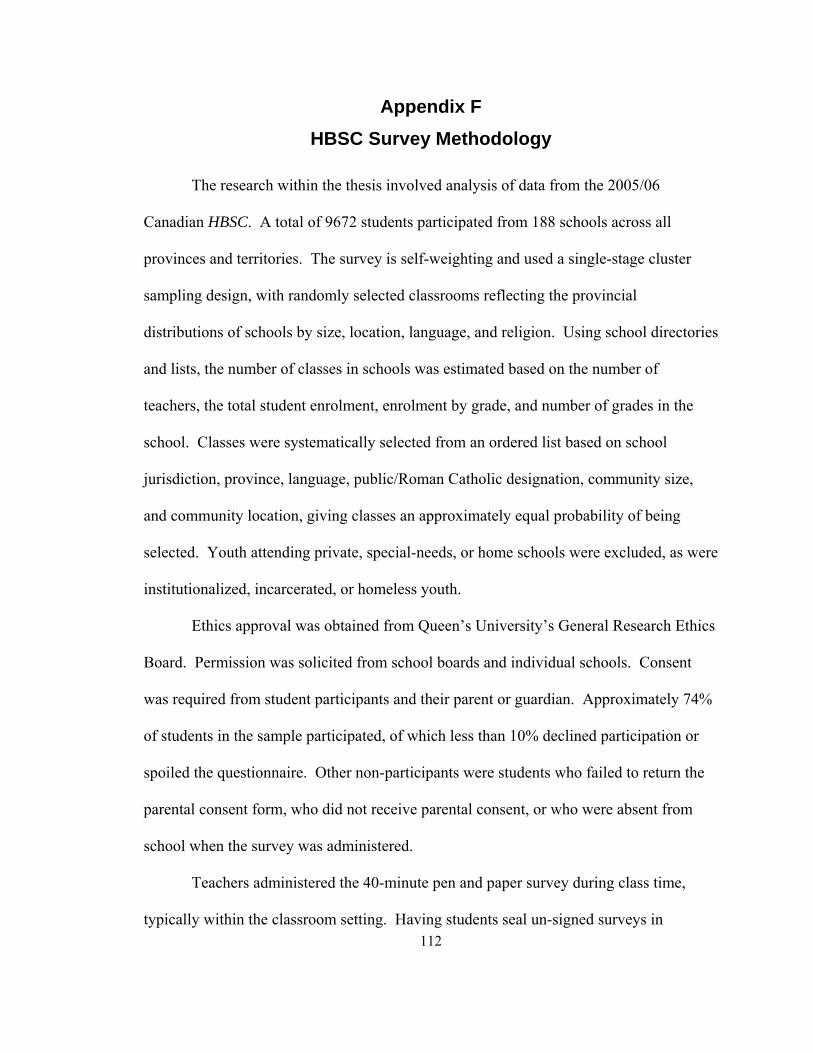
112
Appendix F HBSC Survey Methodology
The research within the thesis involved analysis of data from the 2005/06
Canadian HBSC. A total of 9672 students participated from 188 schools across all
provinces and territories. The survey is self-weighting and used a single-stage cluster
sampling design, with randomly selected classrooms reflecting the provincial
distributions of schools by size, location, language, and religion. Using school directories
and lists, the number of classes in schools was estimated based on the number of
teachers, the total student enrolment, enrolment by grade, and number of grades in the
school. Classes were systematically selected from an ordered list based on school
jurisdiction, province, language, public/Roman Catholic designation, community size,
and community location, giving classes an approximately equal probability of being
selected. Youth attending private, special-needs, or home schools were excluded, as were
institutionalized, incarcerated, or homeless youth.
Ethics approval was obtained from Queen’s University’s General Research Ethics
Board. Permission was solicited from school boards and individual schools. Consent
was required from student participants and their parent or guardian. Approximately 74%
of students in the sample participated, of which less than 10% declined participation or
spoiled the questionnaire. Other non-participants were students who failed to return the
parental consent form, who did not receive parental consent, or who were absent from
school when the survey was administered.
Teachers administered the 40-minute pen and paper survey during class time,
typically within the classroom setting. Having students seal un-signed surveys in
113
envelopes ensured anonymity. Student responses may have been influenced by, for
example, communication between students during administration of the survey, student
interpretation of the question, or lack of privacy while completing the survey.
Reference
Boyce WF, King MA, Roche J. Healthy settings for young people in Canada. Health Behaviour
in School-Aged Children, Public Health Agency of Canada. 2007