Embed Size (px)
Citation preview
1
Title: Origin and hysteresis of Li compositional spatio-dynamics within battery primary
particles
Authors: Jongwoo Lim#1,2, Yiyang Li#1, Daan Hein Alsem3, Hongyun So4, Sang Chul Lee1, Peng Bai5, Daniel A. Cogswell5, Xuzhao Liu1, Norman Jin1, Young-sang Yu6, Norman J. Salmon3, David A. Shapiro6, Martin Z. Bazant1,5,7,8, Tolek Tyliszczak6, William C. Chueh*1,2
Affiliations: 1 Department of Materials Science and Engineering, Stanford University, Stanford, CA 94305, USA. 2 Stanford Institute for Materials & Energy Sciences, SLAC National Accelerator Laboratory, Menlo Park, CA 94025, USA. 3 Hummingbird Scientific, Lacey, WA 98516, USA. 4 Department of Aeronautics and Astronautics, Stanford University, Stanford, CA 94305, USA. 5 Department of Chemical Engineering, Massachusetts Institute of Technology, Cambridge, MA 02139, USA. 6 Advanced Light Source, Lawrence Berkeley National Laboratory, Berkeley, CA 94720, USA. 7 Department of Mathematics, Massachusetts Institute of Technology, Cambridge, MA 02139, USA. 8 SUNCAT Interfacial Science and Catalysis, Stanford University, Stanford, CA 94305, USA
# These authors contributed equally to this work * Corresponding Author, Email: [email protected]
Abstract: The kinetics and uniformity of ion insertion reactions at the solid/liquid interface govern
the rate capability and lifetime, respectively, of electrochemical devices such as Li-ion batteries.
We develop an operando X-ray microscopy platform that maps the dynamics of the Li composition
and insertion rate in LiXFePO4, and show that nanoscale spatial variations in rate and in
composition control the lithiation pathway at the sub-particle length scale. Specifically, spatial
variations in the insertion rate constant lead to the formation of nonuniform domains, and the
composition dependence of the rate constant amplifies nonuniformities during delithiation but
suppresses them during lithiation, and moreover stabilizes the solid solution during lithiation. This
coupling of lithium composition and surface reaction rates controls the kinetics and uniformity
during electrochemical ion insertion.
One Sentence Summary: X-ray microscopy reveals the nanoscale evolution of composition and
reaction rate inside a Li-ion battery during cycling
Main Text: The insertion of a guest ion into the host crystal is the fundamental reaction
underpinning insertion electrochemistry and has been applied to store energy (1), tune catalysts
(2), and switch optoelectronic properties (3). In Li-ion batteries, for example, Li ions from the
2
liquid electrolyte insert into solid host particles in the electrode. Nanoscale intraparticle
electrochemical inhomogeneities in phase and in composition are responsible for mechanical strain
and fracture which decrease the reversibility of the reaction (4). Moreover, these nonuniformities
make it difficult to correlate current-voltage measurements to microscopic ion insertion
mechanisms. Simultaneously quantifying nonuniform nanoscale reaction kinetics and the
underlying material composition at the solid-liquid interface holds the key to improving device
performance.
A gold standard material for investigating ion insertion reactions is LiXFePO4 (0<X<1), which
separates into two phases at equilibrium (5). Recent studies using in situ X-ray diffraction observed
a continuous distribution of lattice constants at high rates of (de)lithiation (6–9). This finding
supports the hypothesis that phase separation is suppressed during (de)lithiation and replaced with
a solid solution crystallographic insertion pathway (10), consistent with theoretical predictions (11,
12). Precise quantification of the Li composition (X) is difficult because the lattice constant change
convolves information from both Li composition and mechanical strain (8). Whereas
heterogeneous current distributions between particles have been studied (7, 13, 14), there exists
little understanding of how compositional nonuniformities evolve within individual particles.
Diffuse interfaces have been proposed from diffraction patterns (7), but it is unclear where they
occur or how they develop over time. Even less understood is the effect of interfacial reactivity
on the single-particle lithiation pathway, which has been explored using models (11, 15) but not
probed experimentally.
In LiXFePO4, an insertion reaction changes X as well as the valence of Fe (13). Thus, tracking
the spatial and temporal evolution of the Fe oxidation state reveals both the composition and the
nanoscale insertion rate. Scanning electrochemical microscopy provides quantitative current-
voltage measurement but is insensitive to the Li composition (16). Redox-sensitive liquid
microscopy techniques such as transmission hard X-ray microscopy (17–19), fluorescence soft X-
ray microscopy (20), and transmission electron microscopy (TEM) (21) have been employed to
track Li transport with single-particle sensitivity (7, 20, 21), or within agglomerates (17, 19) in
insertion electrodes. However, tracking the spatial evolution of lithiation within the same particles
under multiple electrochemical conditions in liquid has not been realized due to insufficient
spatial/temporal resolution, high beam-induced damage, and/or low absorption contrast.

3
Additionally, while three-dimensional X-ray microscopies have revealed significant insights on
morphology, strain, and dislocation of single particles (22–24), quantitative measurement of the
local insertion rate remains elusive.
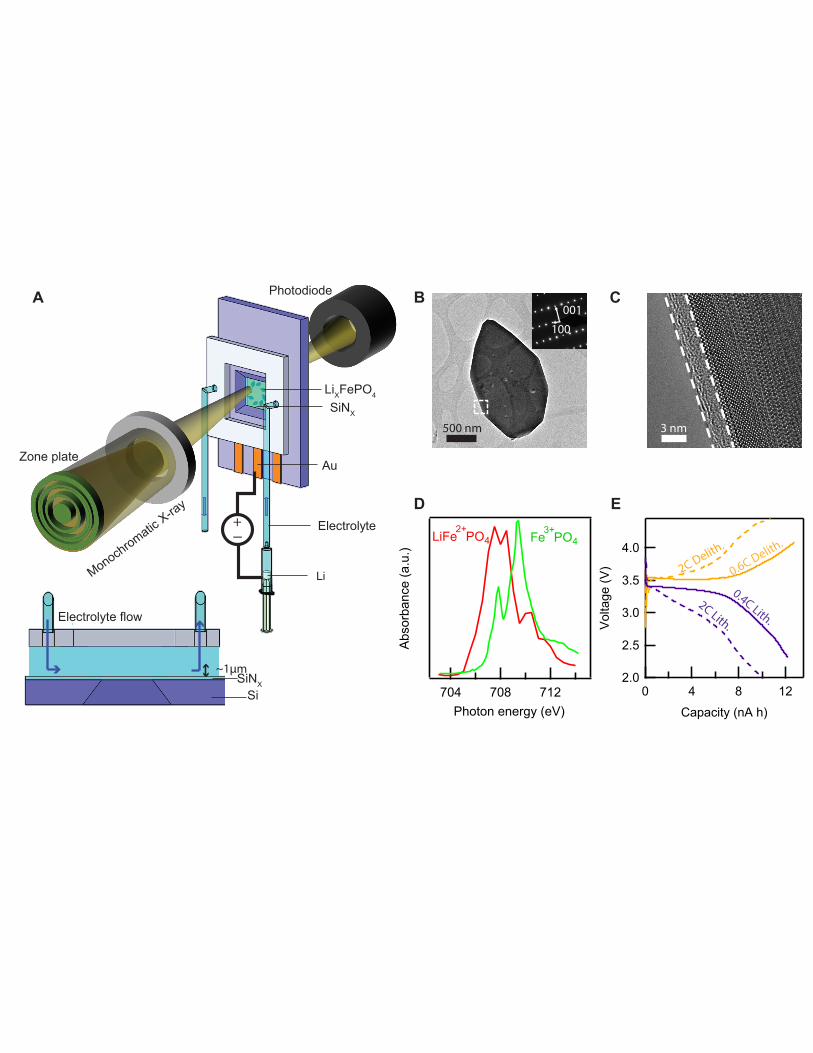
We develop synchrotron-based liquid scanning transmission X-ray microscopy (STXM) to
probe the spatio-temporal evolution of the Li composition and insertion rate within primary
particles (Fig. 1A). Using a microfluidic electrochemical cell, we image the Li composition of ~30
single-crystalline, carbon-coated LiXFePO4 particles (Fig. 1B,C) using soft X-rays while they
delithiate (charge) and lithiate (discharge) in an organic liquid electrolyte. This platelet particle
morphology has been used in fundamental studies of LiXFePO4 (20, 25–27). The particles’ [010]
crystallographic axis, which is the fast Li diffusion direction (28), lies parallel to the X-ray beam.
We utilize operando STXM to track the change in the Fe oxidation state that accompanies lithiation
at the Advanced Light Source STXM beam line 11.0.2.2 and at 5.3.2.1 (29). By raster-scanning
LiXFePO4 platelet particles (~1 µm wide and 150 nm thick, specific capacity: ~150 mAh g-1, Fig.
S1-3) with a 50 nm X-ray probe, we acquire the nanoscale X-ray absorption spectra at the Fe L3
edge (Fig. 1D), from which the local Li composition (X) is quantified (13). Spectral analysis
confirms that the composition of solid solution and phase-separating LiXFePO4 can be determined
through a linear combination fit of the end-member states (Fig. S4-6), consistent with previous
work (13, 20, 30).
The battery particles are housed in a multi-model microfluidic electrochemical cell
(Hummingbird Scientific), also used for liquid TEM (21, 31). The liquid electrochemical cell
consists of two sandwiched Si membrane chips, with 75-nm-thick SiNx windows and
fluoropolymer O-rings for imaging and sealing, respectively. The electrolyte (1.0 M LiClO4 in
tetraethylene glycol dimethyl ether) flows from the liquid inlet to the outlet, passing through the
~1 µm gap between the chips (Fig. 1A). The thin spacing minimizes attenuation of soft X-rays,
and the flow of electrolyte minimizes interaction between the sample and the beam. The working
electrode consists of a single layer of LiXFePO4 platelet particles dispersed on a 1.2 × 1.7 mm Au
current collector (Fig. S7), which was evaporated on one of the SiNx membranes. By using a single
layer of particles with an electrode porosity > 90%, we minimize tortuosity and transport losses at
the electrode level. Low active material loading in this dilute electrode yields current density on
the order of 0.1 µA cm-2 when normalized against the projected area of the current collector. This
is approximately 3 orders of magnitude less than typical porous electrodes. Finite element analysis
4
confirms that the electrolyte salt concentration and potential do not deviate from open-circuit
values by more than 0.04 M and 2 mV, respectively, in the chip during cycling at C/5 and 0.2 M
and 15 mV at 2C (Fig. S8). The microfluidic cell has negligible capacitance or stray reactions
(Fig. S9) and employs a Li foil counter electrode (Fig. 1A). As a result, we observe the expected
voltage plateau at ~ 3.4 V (Fig. 1E) and stable capacity (Fig. S10) over multiple cycles despite a
low active material loading. At low rates, the electrochemical profile of the microfluidic cell is
similar to that of a LiXFePO4 electrode cycled in a coin cell (Fig. S3). At high rates, the profile
deviates somewhat from that of coin cells. We hypothesize these deviations arise from to
delamination of certain particles at higher rates; our analyses were conducted on particles that are
not delaminated.
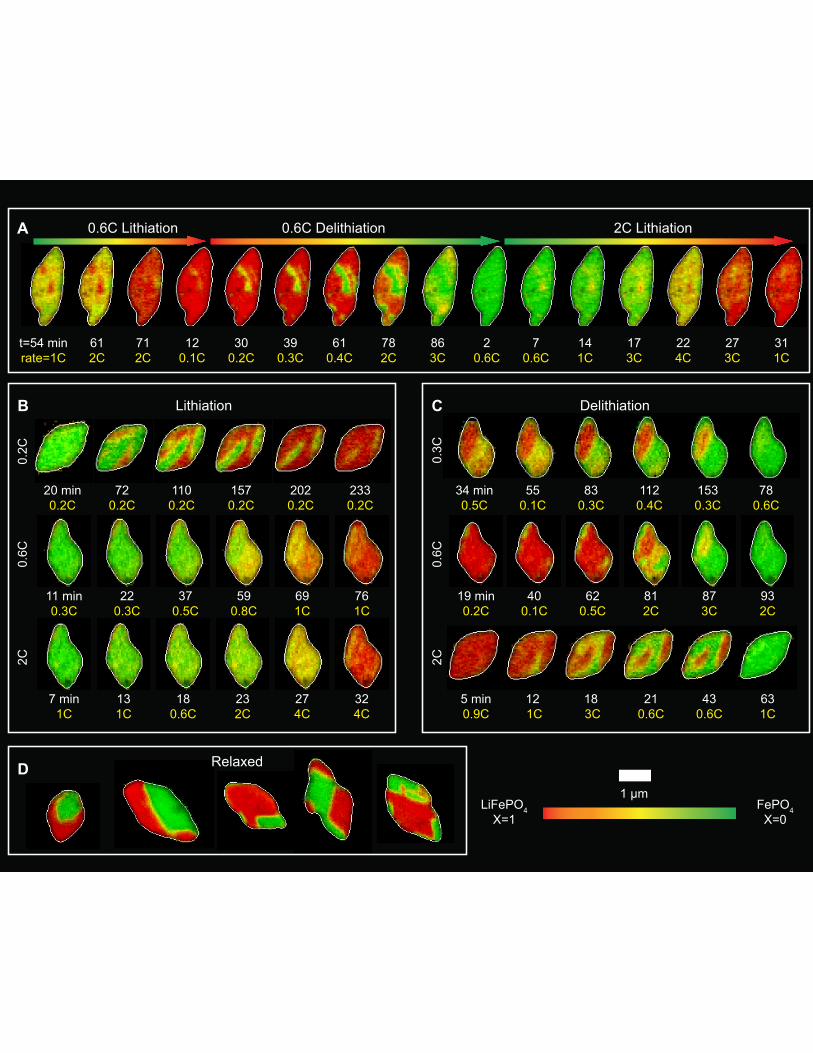
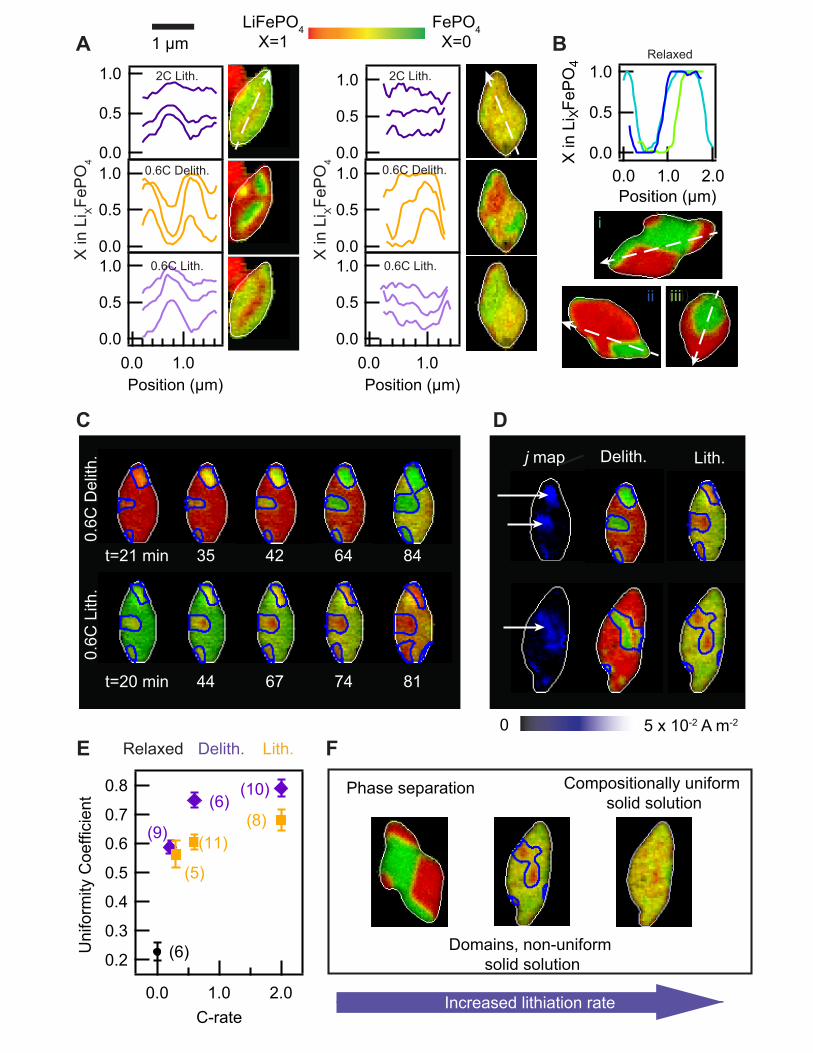
Figure 2A shows operando spectroimaging of a typical particle undergoing multiple
delithiation and lithiation cycles. The hue represents the Li composition (green: X=0; red: X=1).
This result confirms that the particles successfully (de)lithiated electrochemically even after
repeated exposure to the X-ray beam, reflecting the low X-ray dose (Fig. S11) and high
electrochemical fidelity. We track several particles (de)lithiate at 0.2C, 0.3C, 0.6C and 2C (Fig.
2A-C), where C indicates the rate it takes to (de)lithiate the entire electrode in 1 h. The Li
composition averaged over each particle (determined spectroscopically) tracks the mean
composition of the electrode (determined electrochemically) (Fig. S12). This implies that nearly
all particles are active, consistent with previous reports on this particle morphology (20). We
compute the single-particle C-rate in Fig. 2A-C and confirm that increasing the global current
increases the rate of (de)lithiation of individual particles. When lithiated at a high rate of 2C, the
operando Li composition maps (Fig. 2B, movie S1) show that the particles intercalate uniformly.
In other words, there exists little variation in composition across each particle, and the composition
changes continuously over time from X=0 to X=1, as also quantified using line cuts (Fig. 3A). We
interpret this as a solid-solution behavior. X-ray diffraction of the (020) reflection reveals
significant intensity between the Li-rich and Li-poor phases, suggesting that phase separation
along [010] – the direction parallel to the X-ray beam – is unlikely to explain the uniformly varying
Li composition. (Fig. S13) This finding is consistent with the high elastic strain energy penalty of
phase separation in that direction for our particle size (15, 32).
5
We also conducted an ex situ experiment by mapping the Li composition in half-delithiated
particles cycled at 1C and subsequently relaxed for ~12 h (Fig. 2D). These particles show sharp
phase boundaries between Li-rich and Li-poor regions. The phase boundaries follow the facets of
the particle, consistent with an elastically-driven process. The line cuts of X within a relaxed
particle (Fig. 3B) clearly show that the Li composition is binary, where X=0 or X=1 for nearly
every pixel. These observations, similar to previous ex situ studies (25, 26) and theoretical
calculations (15, 27), confirm that phase separation under the influence of elastic strain dominates
the equilibrium Li distribution.
A surprising observation for intermediate C-rates (0.2–0.6C) during lithiation and all rates
during delithiation is that regions of fast Li ion (de)insertion and slow (de)insertion are visible (Fig.
2B,C, movie S2). Fast regions (de)lithiate preferentially while the remainder of the particle lags
behind. We term these regions “domains” because their Li composition is not binary, but rather
varies continuously during cycling, as evident in the line cuts (Fig. 3A). This is a visualization of
the compositionally nonuniform solid solution pathway, where there exist many solid solution
domains in a single particle. At rates of 0.6C and higher, the electrochemical domains are largely
circular or ellipsoidal, without being oriented with respect to the facets. At rates of 0.2 and 0.3C,
the domain shapes contain both faceted and ellipsoidal features.
In contrast to standard phase separation models which incorporate moving phase boundaries
(5), intercalation waves (33), or domino cascades (34), we observe the fast domains (35) do not
grow significantly in size. Rather, lithiation is accompanied by continuously changing the Li
composition within each domain, with two or more concurrent solid solution processes (Fig. 3C).
Our results show that the presence of both Li-rich and Li-poor regions within a single particle do
not necessarily lead to moving phase boundaries. The slow growth of these domains can be
explained because gradient energies, as modeled by Cahn-Hilliard-based reaction kinetics (36),
slightly favor the (de)insertion of Li at domain boundaries (11).
We quantify the local current density within individual particles, calculated by evaluating the
pixel-wise difference in X between sequential frames (35). Since LiXFePO4 is a one-dimensional
Li conductor (28), a change in X is attributed to ion insertion at the solid/liquid interface
perpendicular to the ion conduction channels. Figure 3D maps the current density of several
particles and shows domains of higher current density relative to the rest of the particle. the same

6
domains are fast under both lithiation and delithiation, thus confirming that the domain structures
do not arise from random nucleation sites or spinodal decomposition. We rule out spatial variations
in solid Li diffusion in the [010] direction as the origin of domain structures as the characteristic
solid Li diffusion time in LiXFePO4 along the 150-nm-thick [010] direction is ~1 ms for X=0 and
~10 ms for X=1 (28), which are both much faster than total (de)lithiation times of 0.5 to 5 h. We
conclude that spatial variations in the insertion reaction kinetics at the solid/liquid interface give
rise to these domain structures. The surfaces of the fast domains are more reactive for all Li
compositions (Fig. S16). In this text, we use “heterogeneity” to describe spatial variations in
reaction rates, and “nonuniformity” to describe spatial variations in composition. Possible origins
for these reaction heterogeneities include inhomogeneous strain (24), variations in carbon coating,
and surface defects induced by cycling (18).
We quantify the degree of intraparticle composition uniformity by analyzing the standard
deviation of X in each particle at every recorded frame (Fig. 3E and S14). Our statistical analysis
confirms that higher cycling rates reduce the variations in composition within a particle, resulting
in more uniform intercalation (higher uniformity coefficient). Moreover, delithiation is
significantly less uniform than lithiation. The statistical analysis and direct imaging of the same
particle under different cycling rates show that LiXFePO4 exhibits (1) fully lithiated and delithiated
regions (i.e. phase separation) when relaxed for an extended period of time, (2) compositionally
nonuniform solid solution (i.e. domains) at intermediate rates, and (3) domain-free,
compositionally uniform solid-solution at high rates (summarized in Fig. 3F). In other words, the
difference in the Li composition between Li-rich and Li-poor domains diminishes at higher rates
of cycling, where the high applied overpotential stabilizes the uniform compositions for the same
reasons that solid solution is stable with faster cycling (6, 8, 9, 11, 15). Consistent with this physical
picture, restarting delithation on a relaxed, phase-separated particle brings the particle into a solid
solution, and a solid solution particle phase separates over time when it is idle (Fig. S15).
To understand the intrinsic ion-insertion rate constant as a function of the Li composition, we
identify a set of actively (de)intercalating pixels with approximately uniform composition in each
particle at low cycling rates, and then spectroscopically measure the current density for that set of
pixels. The chosen set of pixels lies within a single domain and intercalates uniformly. Because
there is a disagreement regarding the quantitative relationship of current and overpotential between
7
Butler-Volmer and Marcus kinetics (37), we limit our analysis to overpotentials <120 mV. In this
regime, the reaction models converge, and we use a linear relationship between current and voltage
to extract the exchange current density (j0) and quantify the reaction kinetics (35)(Fig. S16-18).
By measuring the nanoscale j0 at the sub-particle level, our results show that the reaction rate
depends strongly on X, the local Li composition (Fig. 4A): j0 is low for Li-poor and Li-rich end
members, likely due to low concentrations of Li ions and vacancies, respectively (36, 38, 39). The
magnitude of j0 varies non-monotonically with Li composition, and, interestingly, peaks at a
composition of ~Li0.25FePO4. For the particles measured, j0 peaks between 6 × 10⁻³ and 1 × 10⁻² A
m-2. This composition-dependent j0 reflects the defect chemistry of LiXFePO4 (38) whereby X
modulates not only bulk thermodynamics and transport but also the surface kinetics of ion insertion.
The skewed j0–X relationship is in contrast to Newman’s model (39), which is symmetric about
X=0.5. A skewed j0–X curve was first proposed by Bazant using a general phase-field theory of
chemical kinetics based on nonequilibrium thermodynamics (36). Following Bai, Cogswell, and
Bazant (11, 15), we conduct a linear stability analysis of the model and confirm that such a skewed
j0-X curve is a necessary condition to suppress phase separation above a critical lithiation current
(Fig. S19). In contrast, the theory predicts that the solid solution pathway is linearly unstable for a
j0 curve symmetric about X=0.5 for all lithiation rates, although diffuse interfaces, or quasi-solid
solutions, may still form.
The strong spatial and compositional dependence of j0 within individual particles explains why
domains persist more during delithiation than during lithiation. If the shape of the j0-X curve is
invariant between domains within a particle (Fig. S16), the fast domains must consistently exhibit
a higher j0 for any X (Fig. 4B). During delithiation from X=1, the rate accelerates from X=1 to
X~0.25 (Fig. 4B). This positive feedback amplifies the difference in the reaction rate between slow
and fast domains: j0 for the fast domain (which has a lower X) is much larger than j0 for the slow
domain (Fig. 4C). On the other hand, during lithiation from X=0, the fast domain initially
accelerates from X=0 to X~0.25 , but decelerates once it passes X~0.25, when j0 starts to decrease
with greater X. Because X is higher for the faster domain, this negative feedback diminishes the
difference in reaction rate between the two domains (Fig. 4D). The acceleration regime during
delithiation is about three times larger than in lithiation, and quantitatively explains why
delithiation is less uniform than lithiation. Thus, whereas high rates of lithiation yield nearly

8
uniform compositions and current densities, similar rates of delithiation are highly nonuniform
(Figs. 2C, 3A, 3E). This skewed relationship may also describe some of the observed asymmetries
in the voltage profile between charge and discharge. other factors, like an asymmetric charge
transfer coefficient (13), may also contribute to the observed hysteresis.
In summary, we developed an electrochemical liquid spectroimaging platform that quantifies
nanoscale ion insertion kinetics in highly heterogeneous materials. By simultaneously mapping
the Li composition and the insertion rate with high spatial and temporal resolution, we track the
evolution of compositionally nonuniform solid-solution domains during (de)lithiation of LiXFePO4.
We show that spatial heterogeneities in reaction rates account for the domains, and the skewed j0-
X relationship amplifies reaction heterogeneities during delithiation but suppresses them during
lithiation, consistent with theoretical predictions (11, 15, 36). These results highlight the crucial
role of surface reaction rate for lithiation, and have implications for electrode engineering and
battery management. Higher rates of lithiation suppress compositional nonuniformities within
particles and minimize mechanical stress and have been shown to improve cyclability (4).
However, the same statement is not true for delithiation, where reaction heterogeneities manifest
in compositional nonuniformities. Beyond batteries, our work highlights the importance of
composition on ion-insertion kinetics, which affects a broad class of electrochemical materials.
References and Notes:
1. M. S. Whittiangham, Ultimate Limits to Intercalation Reactions for Lithium Batteries. Chem. Rev. 114, 11414–11443 (2014).
2. H. Wang et al., Electrochemical tuning of vertically aligned MoS2 nanofilms and its application in improving hydrogen evolution reaction. Proc. Natl. Acad. Sci. U. S. A. 110, 19701–19706 (2013).
3. A. Llordés, G. Garcia, J. Gazquez, D. J. Milliron, Tunable near-infrared and visible-light transmittance in nanocrystal-in-glass composites. Nature. 500, 323–327 (2013).
4. W. H. Woodford, W. C. Carter, Y.-M. Chiang, Design criteria for electrochemical shock resistant battery electrodes. Energy Environ. Sci. 5, 8014–8024 (2012).
5. A. K. Padhi, K. S. Nanjundaswamy, J. B. Goodenough, Phospho-olivines as Positive-Electrode Materials for Rechargeable Lithium Batteries. J. Electrochem. Soc. 144, 1188–1194 (1997).
6. X. Zhang et al., Rate-induced solubility and suppression of the first-order phase transition
9
in olivine LiFePO4. Nano Lett. 14, 2279–2285 (2014).
7. X. Zhang et al., Direct view on the phase evolution in individual LiFePO4 nanoparticles during Li-ion battery cycling. Nat. Commun. 6, 8333 (2015).
8. H. Liu et al., Capturing metastable structures during high-rate cycling of LiFePO4 nanoparticle electrodes. Science. 344, 1252817 (2014).
9. M. Hess, T. Sasaki, C. Villevieille, P. Novák, Combined operando X-ray diffraction–electrochemical impedance spectroscopy detecting solid solution reactions of LiFePO4 in batteries. Nat. Commun. 6, 8169 (2015).
10. J. Niu et al., In situ observation of random solid solution zone in LiFePO4 electrode. Nano Lett. 14, 4005–4010 (2014).
11. P. Bai, D. A. Cogswell, M. Z. Bazant, Suppression of Phase Separation in LiFePO4 Nanoparticles During Battery Discharge. Nano Lett. 11, 4890–4896 (2011).
12. R. Malik, F. Zhou, G. Ceder, Kinetics of non-equilibrium lithium incorporation in LiFePO4. Nat. Mater. 10, 587–590 (2011).
13. Y. Li et al., Current-induced transition from particle-by-particle to concurrent intercalation in phase-separating battery electrodes. Nat. Mater. 13, 1149–1156 (2014).
14. W. Dreyer et al., The thermodynamic origin of hysteresis in insertion batteries. Nat. Mater. 9, 448–453 (2010).
15. D. A. Cogswell, M. Z. Bazant, Coherency strain and the kinetics of phase separation in LiFePO4 nanoparticles. ACS Nano. 6, 2215–2225 (2012).
16. Y. Takahashi et al., Nanoscale visualization of redox activity at lithium-ion battery cathodes. Nat. Commun. 5, 5450 (2014).
17. J. Wang, Y. K. Chen-Wiegart, J. Wang, In operando tracking phase transformation evolution of lithium iron phosphate with hard X-ray microscopy. Nat. Commun. 5, 4570 (2014).
18. Y.-S. Yu et al., Nonequilibrium Pathways during Electrochemical Phase Transformations in Single Crystals Revealed by Dynamic Chemical Imaging at Nanoscale Resolution. Adv. Energy Mater. 5, 1402040 (2014).
19. J. Nelson Weker, Y. Li, R. Shanmugam, W. Lai, W. C. Chueh, Tracking Non-Uniform Mesoscale Transport in LiFePO4 Agglomerates During Electrochemical Cycling. ChemElectroChem. 2, 1576–1581 (2015).
20. Y. Li et al., Dichotomy in the Lithiation Pathway of Ellipsoidal and Platelet LiFePO4 Particles Revealed through Nanoscale Operando State-of-Charge Imaging. Adv. Funct. Mater. 25, 3677–3687 (2015).
10
21. M. E. Holtz et al., Nanoscale imaging of lithium ion distribution during in situ operation of battery electrode and electrolyte. Nano Lett. 14, 1453–1459 (2014).
22. M. Ebner, F. Marone, M. Stampanoni, V. Wood, Visualization and quantification of electrochemical and mechanical degradation in Li ion batteries. Science. 342, 716–720 (2013).
23. J. N. Weker et al., In situ nanotomography and operando transmission X-ray microscopy of micron-sized Ge particles. Energy Environ. Sci. 7, 2771-2777 (2014).
24. A. Ulvestad et al., Topological defect dynamics in operando battery nanoparticles. Science. 348, 1344–1347 (2015).
25. D. A. Shapiro et al., Chemical composition mapping with nanometre resolution by soft X-ray microscopy. Nat. Photonics. 8, 765–769 (2014).
26. U. Boesenberg et al., Mesoscale Phase Distribution in Single Particles of LiFePO4 following Lithium Deintercalation. Chem. Mater. 25, 1664–1672 (2013).
27. D. A. Cogswell, M. Z. Bazant, Theory of Coherent Nucleation in Phase-Separating Nanoparticles. Nano Lett. 13, 3036–3041 (2013).
28. D. Morgan, A. Van der Ven, G. Ceder, Li Conductivity in LixMPO4 (M = Mn, Fe, Co, Ni) Olivine Materials. Electrochem. Solid-State Lett. 7, A30–A32 (2004).
29. H. Bluhm et al., Soft X-ray microscopy and spectroscopy at the molecular environmental science beamline at the Advanced Light Source. J. Electron Spectros. Relat. Phenomena. 150, 86–104 (2006).
30. X. Liu et al., Phase transformation and lithiation effect on electronic structure of LixFePO4: an in-depth study by soft X-ray and simulations. J. Am. Chem. Soc. 134, 13708–13715 (2012).
31. M. Gu et al., Demonstration of an electrochemical liquid cell for operando transmission electron microscopy observation of the lithiation/delithiation behavior of Si nanowire battery anodes. Nano Lett. 13, 6106–6112 (2013).
32. A. Abdellahi, O. Akyildiz, R. Malik, K. Thornton, G. Ceder, Particle-size and morphology dependence of the preferred interface orientation in LiFePO4 nano-particles. J. Mater. Chem. A. 2, 15437–15447 (2014).
33. G. K. Singh, G. Ceder, M. Z. Bazant, Intercalation dynamics in rechargeable battery materials: General theory and phase-transformation waves in LiFePO4. Electrochim. Acta. 53, 7599–7613 (2008).
34. C. Delmas, M. Maccario, L. Croguennec, F. Le Cras, F. Weill, Lithium deintercalation in LiFePO4 nanoparticles via a domino-cascade model. Nat. Mater. 7, 665–671 (2008).
11
35. See supplementary materials and methods on Science Online.
36. M. Z. Bazant, Theory of Chemical Kinetics and Charge Transfer based on Nonequilibrium Thermodynamics. Acc. Chem. Res. 46, 1144–1160 (2013).
37. P. Bai, M. Z. Bazant, Charge transfer kinetics at the solid-solid interface in porous electrodes. Nat. Commun. 5, 3585 (2014).
38. J. Maier, R. Amin, Defect Chemistry of LiFePO4. J. Electrochem. Soc. 155, A339–A344 (2008).
39. K. E. Thomas, R. M. Darling, J. Newman, Advances in Lithium-Ion Batteries (Kluwer Academic/Plenum Publisheres, New York, 2002).
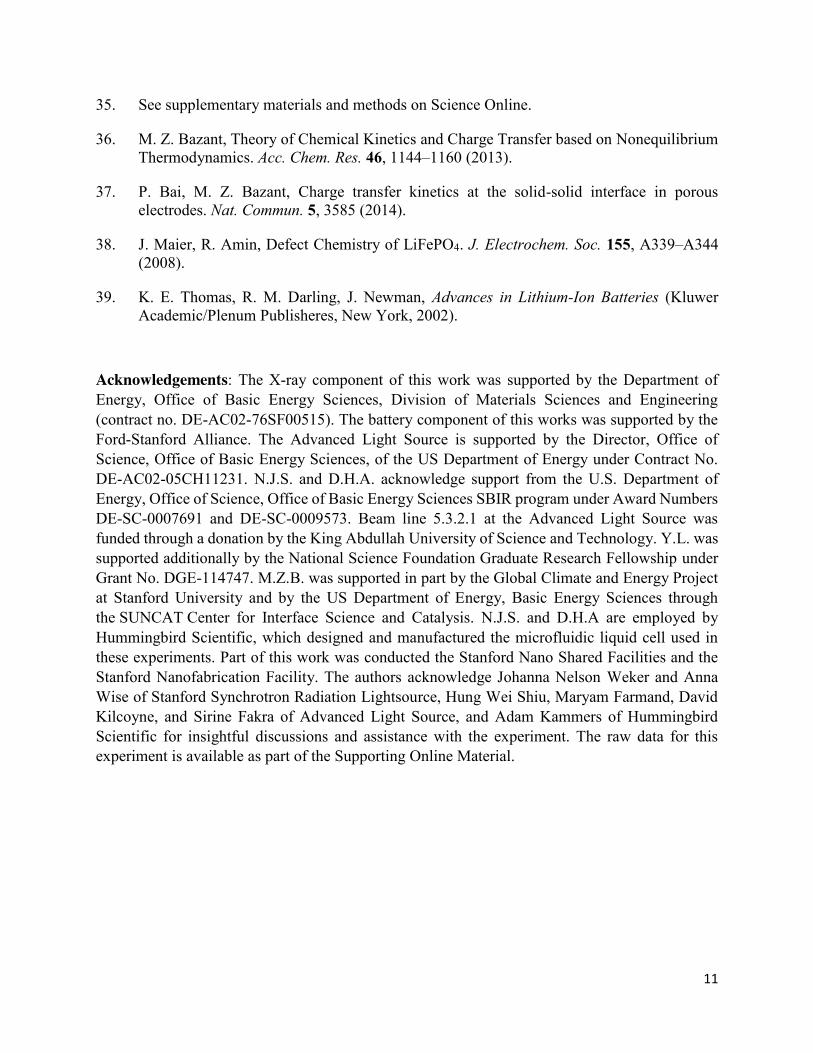
Acknowledgements: The X-ray component of this work was supported by the Department of Energy, Office of Basic Energy Sciences, Division of Materials Sciences and Engineering (contract no. DE-AC02-76SF00515). The battery component of this works was supported by the Ford-Stanford Alliance. The Advanced Light Source is supported by the Director, Office of Science, Office of Basic Energy Sciences, of the US Department of Energy under Contract No. DE-AC02-05CH11231. N.J.S. and D.H.A. acknowledge support from the U.S. Department of Energy, Office of Science, Office of Basic Energy Sciences SBIR program under Award Numbers DE-SC-0007691 and DE-SC-0009573. Beam line 5.3.2.1 at the Advanced Light Source was funded through a donation by the King Abdullah University of Science and Technology. Y.L. was supported additionally by the National Science Foundation Graduate Research Fellowship under Grant No. DGE-114747. M.Z.B. was supported in part by the Global Climate and Energy Project at Stanford University and by the US Department of Energy, Basic Energy Sciences through the SUNCAT Center for Interface Science and Catalysis. N.J.S. and D.H.A are employed by Hummingbird Scientific, which designed and manufactured the microfluidic liquid cell used in these experiments. Part of this work was conducted the Stanford Nano Shared Facilities and the Stanford Nanofabrication Facility. The authors acknowledge Johanna Nelson Weker and Anna Wise of Stanford Synchrotron Radiation Lightsource, Hung Wei Shiu, Maryam Farmand, David Kilcoyne, and Sirine Fakra of Advanced Light Source, and Adam Kammers of Hummingbird Scientific for insightful discussions and assistance with the experiment. The raw data for this experiment is available as part of the Supporting Online Material.
12
Figure Captions
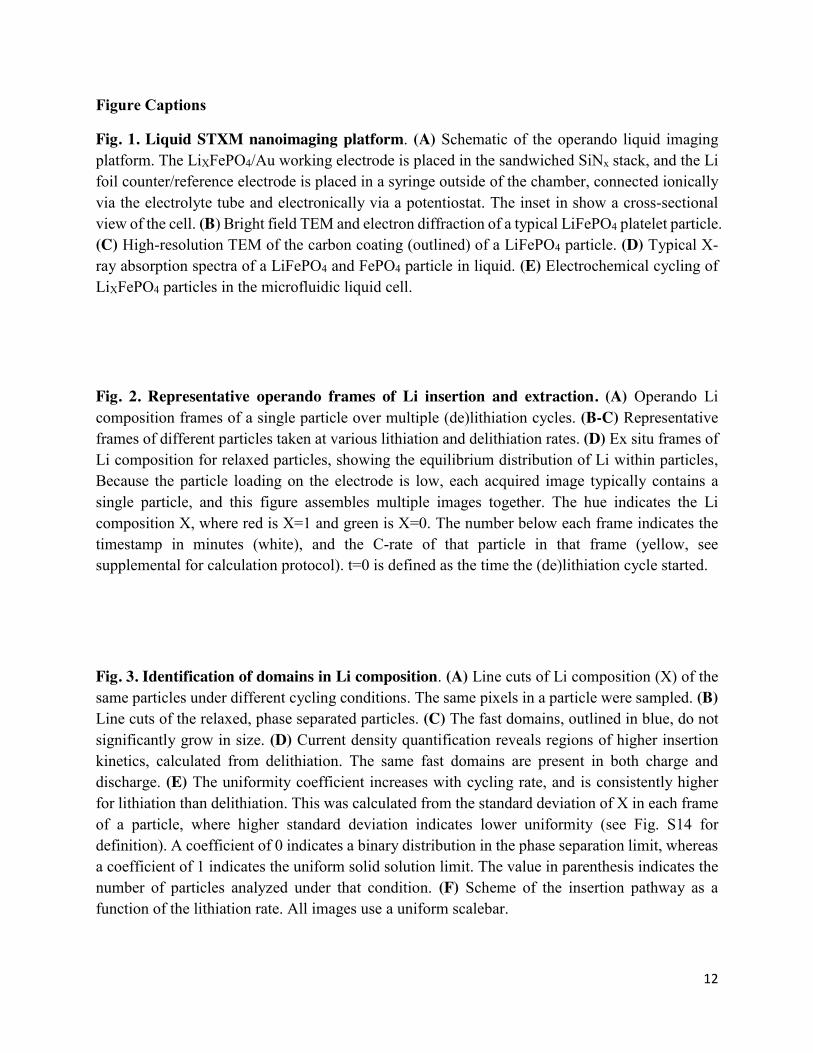
Fig. 1. Liquid STXM nanoimaging platform. (A) Schematic of the operando liquid imaging platform. The LiXFePO4/Au working electrode is placed in the sandwiched SiNx stack, and the Li foil counter/reference electrode is placed in a syringe outside of the chamber, connected ionically via the electrolyte tube and electronically via a potentiostat. The inset in show a cross-sectional view of the cell. (B) Bright field TEM and electron diffraction of a typical LiFePO4 platelet particle. (C) High-resolution TEM of the carbon coating (outlined) of a LiFePO4 particle. (D) Typical X-ray absorption spectra of a LiFePO4 and FePO4 particle in liquid. (E) Electrochemical cycling of LiXFePO4 particles in the microfluidic liquid cell.
Fig. 2. Representative operando frames of Li insertion and extraction. (A) Operando Li composition frames of a single particle over multiple (de)lithiation cycles. (B-C) Representative frames of different particles taken at various lithiation and delithiation rates. (D) Ex situ frames of Li composition for relaxed particles, showing the equilibrium distribution of Li within particles, Because the particle loading on the electrode is low, each acquired image typically contains a single particle, and this figure assembles multiple images together. The hue indicates the Li composition X, where red is X=1 and green is X=0. The number below each frame indicates the timestamp in minutes (white), and the C-rate of that particle in that frame (yellow, see supplemental for calculation protocol). t=0 is defined as the time the (de)lithiation cycle started.
Fig. 3. Identification of domains in Li composition. (A) Line cuts of Li composition (X) of the same particles under different cycling conditions. The same pixels in a particle were sampled. (B) Line cuts of the relaxed, phase separated particles. (C) The fast domains, outlined in blue, do not significantly grow in size. (D) Current density quantification reveals regions of higher insertion kinetics, calculated from delithiation. The same fast domains are present in both charge and discharge. (E) The uniformity coefficient increases with cycling rate, and is consistently higher for lithiation than delithiation. This was calculated from the standard deviation of X in each frame of a particle, where higher standard deviation indicates lower uniformity (see Fig. S14 for definition). A coefficient of 0 indicates a binary distribution in the phase separation limit, whereas a coefficient of 1 indicates the uniform solid solution limit. The value in parenthesis indicates the number of particles analyzed under that condition. (F) Scheme of the insertion pathway as a function of the lithiation rate. All images use a uniform scalebar.

13
Fig. 4. Quantifying the insertion kinetics and exchange current density. (A) The measured exchange current density (j0) varies non-monotonically with the Li composition X. Solid line is a guide to the eye; k0
is around 1 × 10⁻² A m-2. See supplementary text for error calculation. Each marker in each color represents a different particle. The dashed lines show the shifted j0-X curve due to uncertainty arising from the fact that the specific capacity of the particles is less than the theoretical capacity. (B) Because the skewed j0 peaks at X~0.25, j0 for the fast domains is several times larger than j0 for the slow domains during delithiation, but the two quantities are comparable during lithiation. (C) During delithiation from X=1 to X=0, the fast domains have lower X, which amplifies the difference in current density between the two domains. (D) Upon lithiation from X=0 to X=1, the fast domains have higher X, reducing difference in the current density.
Supplementary Materials:
Materials & Methods
Supplementary Text
Figs. S1-S19
Captions for Movies S1 to S2
References (40-49)
Movies S1-S2
Archive of all image data
4.0
3.5
3.0
2.5
2.0
Voltage (
V)
12840
Capacity (nA h)
A
+−
Electrolyte
Li
LiXFePO
4
AuZone plate
Photodiode
SiNX
AuLiXFePO
4
B C
[002]
500 nm 3 nm
001
100
D E
2C Delith.
0.6C Delith.
0.4C Lith.2C Lith.
Monoch
rom
atic X
-ray
Absorb
ance (
a.u
.)
712708704
Photon energy (eV)
LiFe2+
PO4 Fe3+
PO4
Electrolyte flow
SiNX
Si
~1μm
t=54 min
rate=1C
61
2C
12
0.1C
71
2C
30
0.2C
39
0.3C
61
0.4C
78
2C
86
3C
2
0.6C
7
0.6C
14
1C
17
3C
22
4C
27
3C
31
1C
0.6C Lithiation 0.6C Delithiation 2C Lithiation
Lithiation Delithiation
A
CB
0.3
C0.6
C2C
0.2
C0.6
C2C
55
0.1C
34 min
0.5C
83
0.3C
112
0.4C
153
0.3C
78
0.6C
40
0.1C
19 min
0.2C
62
0.5C
81
2C
87
3C
93
2C
12
1C
5 min
0.9C
18
3C
21
0.6C
43
0.6C
63
1C
LiFePO4
X=1
FePO4
X=0
D Relaxed
1 µm
72
0.2C
20 min
0.2C
110
0.2C
157
0.2C
202
0.2C
233
0.2C
22
0.3C
11 min
0.3C
37
0.5C
59
0.8C
69
1C
76
1C
13
1C
7 min
1C
18
0.6C
23
2C
27
4C
32
4C
1.0
0.5
0.0
1.0
0.5
0.0
1.0
0.5
0.0
1.00.0
Position (µm)
1.0
0.5
0.0
1.0
0.5
0.0
1.00.0
Position (µm)
1.0
0.5
0.0
1.0
0.5
0.0X in
Li X
Fe
PO
4
2.01.00.0
Position (µm)
2C Lith.
0.6C Delith.
0.6C Lith.
2C Lith.
0.6C Delith.
0.6C Lith.
1 µm
0.6
C D
elith
.0
.6C
Lith
.
t=20 min 44 817467
t=21 min 35 846442
0.6
C D
elith
.
Relaxed Delith. Lith.
j map Delith. Lith.
0 5 x 10⁻² A m-2
A B
C D
E F
Increased lithiation rate
Phase separation
Domains, non-uniform
solid solution
Compositionally uniform
solid solution
X in
Li X
Fe
PO
4
X in
Li X
Fe
PO
4
LiFePO4
X=1
FePO4
X=0
0.8
0.7
0.6
0.5
0.4
0.3
0.2
Un
ifo
rmity C
oe
ffic
ien
t
2.01.00.0
C-rate
(6)
(9)
(10)
(11)
(8)
(5)
(6)
(iii)iiiii
i
Relaxed

j 0
1.00.80.60.40.20.0X in LiXFePO4
Delithiation (charge)
Li compositionLow
High
Lithiation (discharge)
X=1
X=0
Current density
Li composition
Current density
Slow domain
Fast domain
1 µm
j0,fast lith
j0,slowlith
j0,fast delith
j0,slowdelith
1.0
0.8
0.6
0.4
0.2
0.0
f(X)
1.00.80.60.40.20.0X in LiXFePO4
A
DC
B
Lithiation
Delithiation
j0=k0 f(X)
1
Supplementary Materials for
Origin and hysteresis of Li compositional spatio-dynamics within battery primary particles
Jongwoo Lim, Yiyang Li, Daan Hein Alsem, Hongyun So, Sang Chul Lee, Peng Bai, Daniel A. Cogswell,
Xuzhao Liu, Norman Jin, Young-sang Yu, Norman J. Salmon, David A. Shapiro, Martin Z. Bazant, Tolek Tyliszczak, William C. Chueh*
*Corresponding author. Email: [email protected]
This PDF file includes:
Materials and Methods
Supplementary Text
Figs. S1 to S19
Captions for Movies S1 to S2
Full References List
Other Supplementary Materials for this manuscript includes the following:
Movies S1 to S2
Databases S1 as zipped archive

2
Materials and Methods Synthesis of LiFePO4
LiFePO4 platelet particles were synthesized using a solvothermal method with a mixed water and polyethylene glycol solvent, modified slightly from previous reports (20, 40). Care was taken to ensure that the FeSO4 precursor is not exposed to dissolved oxygen in water. All precursors were purchased from Sigma-Aldrich. 6 mL of 1M H3PO4(aq) was mixed with 24 mL of polyethylene glycol 400. Afterwards, 18 mL of 1M LiOH(aq) was added to create the creamy-white Li3PO4 precipitate. This mixture was bubbled with dry N2 for ~16 h with a flow rate of ~50 mL/min to remove dissolved oxygen. 6 mmol of FeSO4 ·7 H2O was dried under vacuum in a Schlenk line for ~16 h, while 12 mL of H2O was also bubbled under dry N2 for ~16 h with a flow rate of ~50 mL/min. Next, the deoxygenated H2O was transferred to the dried FeSO4 powder, and stirred for about 10 minutes, creating a lime-green solution. The FeSO4 solution was transferred to the Li3PO4 suspension without oxygen exposure, and the entire mixture was transferred to a 100 mL teflon lined autoclave. The autoclave was heated to 140º C for 1 h, then to 210º C for 17 h. This procedure yields micron-sized LiFePO4 platelet particles.
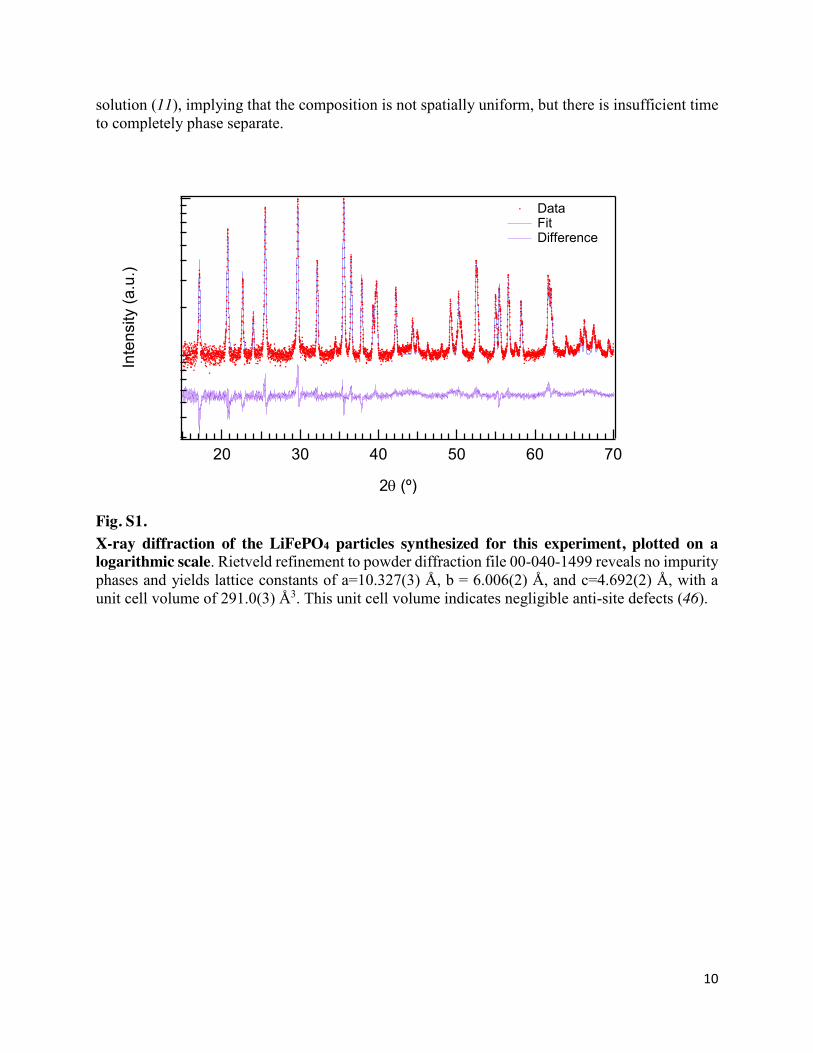
The white LiFePO4 particles were centrifuged 3 times with deionized water. Next, it was mixed with sucrose at a ratio of 5:1 (LiFePO4:sucrose) without breaking the primary particles. This sample was heated to 600º C for 5 hr in a tube furnace under flowing Ar to yield the carbon-coated LiFePO4. Powder X-ray diffraction confirms that this is single-phase (Fig. S1), and transmission electron microscopy (TEM) confirms that each particle is single-crystalline (Fig. 1B,C). Inductively-coupled plasma, optical emission spectrometry gave a Li:Fe:P ratio of 1.01:1.00:0.98 (+/- 0.04).
The electrochemical performance of particles was tested in standard CR2016 coin cells. The electrode film contains the carbon-coated LiFePO4 platelet particles, carbon particles, and polyvinylidene fluoride (PVDF) as a binder. First, PVDF was dissolved in N-methyl-pyrrolidinone. Afterwards, Timcal C65 carbon black and carbon-coated LiFePO4 were mixed into the suspension and stirred for ~ 24 h. The composition of the solids is 74 wt% LiFePO4, 20 wt% carbon black, and 6 wt% PVDF. The mass ratio of the liquid to solid is 5:1. The suspension was cast onto carbon-coated Al foil using a doctor blade with a nominal gap of 15 µm, and dried under vacuum at 90º C for ~ 12 hr. Next, coin cells were assembled in an Ar glove box using a 1 cm diameter LiFePO4 electrode, 2 Celgard separators, and a 12-mm diameter Li metal counter electrode (Alfa Aesar). The electrolyte was 1 M LiClO4 dissolved in a 1:1 (wt/wt) mixture of ethylene carbonate (EC) and dimethyl carbonate (DMC), or 1 M LiClO4 in tetraethylene glycol dimethyl ether (TEGDME). The specific capacity is ~150 mAh g-1 at a rate of C/10 (Fig. S2,3).
Relaxed particles
After cycling an electrode in a coin cell (electrolyte: 1M LiClO4 in EC:DMC) for 4 formation cycles at a rate of C/10, we delithiated the electrode at a rate of 1C for 30 minutes, to a nominal state of charge of 50%. The coin cells were rapdily disassembled in an Ar glovebox (~ 4 min), and rinsed with excess DMC. Next, we dispersed the cycled particles onto lacey carbon TEM grids, and imaged the Li composition using scanning transmission X-ray microscopy (STXM) at beam line 5.3.2.2 at the Advanced Light Source. The particles were imaged ~ 12 h after disassembly. The quantification was conducted by fitting a linear combination of fully-lithiated and fully-delithiated reference spectra to the X-ray absorption spectra of each pixel, following previous work (13).
3
Liquid STXM nanoimaging platform:
Chip fabrication: The Si/SiNx chips used for the working electrode were fabricated via a standard photolithography technique. 4-inch diameter, 200-µm-thick wafers were cleaned using the RCA method, consisting of 10 min in NH4OH/H2O2 at 50°C, 10 min of HCl/H2O2 at 70°C, and 1 min of diluted HF (50:1). 75-nm-thick SiNx was grown on the wafers using low-pressure chemical vapor deposition. Next, photolithography was used to define the X-ray transparent SiNx window on the backside of wafers, and reactive ion etching (RIE) was used to remove the exposed nitride layers (SF6/O2 =100/10). After removing photoresist in acetone, the exposed silicon was etched through in 30% KOH bath at 80°C to create suspended SiNx window on the frontside (30 × 750 μm). Each chip is ~ 6 mm long and 5 mm wide.
A second photolithography process was used to define the metal current collector pads (Fig. S7A). 5 nm/20 nm Ti/Au was deposited by e-beam evaporator and unwanted metal was lift-off in a Remover PG bath (Microchem). A 75-nm-thick SiNx passivation layer was grown by plasma-enhanced chemical vapor deposition on top of the metal layer. This passivation layer protects the exposed Ti adhesion layer at the edges of the Au current collector from reacting with the electrolyte. The working electrode was defined by another photolithography step, and the passivation layer was removed by RIE process to expose the metal current collectors. The individual chips were cut using a wafer dicing saw, and cleaned in acetone, isopropanol, methanol, and deionized water, consecutively. After being dried in a stream of dry Ar, each chip was treated in O2 plasma (100 mtorr O2, 100 W, 2 min). The spacer chip design is identical to the one from ref (41).
Particle loading: A single layer of between ~10,000 and 50,000 particles was dispersed on
the working electrode. The dimension of the working electrode is 1.2 × 1.7 mm, of which about 30 × 750 μm contain the X-ray transparent SiNx window for imaging. To disperse the particles, we first sonicated them in isopropanol alcohol ~30 mins, and then dropcast or spincoated them on the working electrode chip. Aggregated particle regions are stamped repeatedly by polydimethlysiloxane (PDMS) for removal, leaving behind a single layer of isolated particles (Fig. S7B).
To estimate the capacity, we charged the electrodes in the microfluidic cell to 4.0 V at a constant current between 1 and 3 nA, then discharged to 2.5 V at the same current. The particles in the electrode have a capacity ranging from 1 nAh to 10 nAh. The global C-rates are calculated from applied current and this measured capacity. After computing the capacity, we lithiated and delithiated the electrode at different rates during imaging, starting with low rates and ending with higher rates. The current density employed minimizes concentration and potential gradients in the electrolyte (Fig. S8). The capacity of our particles in the microfluidic cell is much higher than the blank electrode without particles (Fig. S9), and is also stable over multiple cycles (Fig. S10).
PEEK tubing: A 50-cm long polyetheyer ether ketone (PEEK) tube connects the working
electrode (LiFePO4/Au) and the counter electrode (Li foil in a polypropylene syringe with a copper tab for current collection). The tube was filled with 1.0 M LiClO4 in TEGDME electrolyte. TEGDME was chosen as the solvent because its lower density (~1.0 g cm-3 vs. ~1.3 g cm-3 for EC) minimizes the absorption of soft X-rays.
The resistance of the electrolyte through the PEEK tube was quantified by applying several current pulses and measuring the voltage response. The resistance is typically about 100 MΩ. This results in an Ohmic loss of 100 mV for a 1 nA current. This Ohmic loss was corrected in all voltage
4
plots and overpotential calculations. All electrochemical measuremetns were conducted using a Biologic SP240 potentiostat with an ultra low current module. X-ray imaging
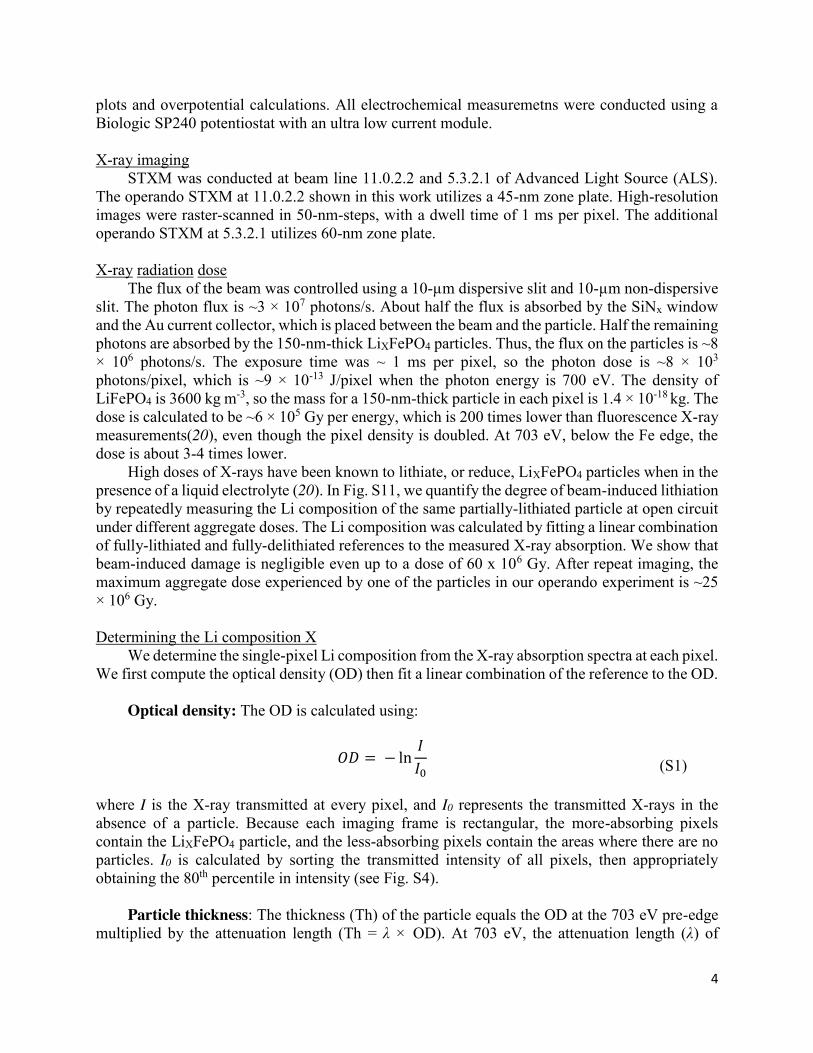
STXM was conducted at beam line 11.0.2.2 and 5.3.2.1 of Advanced Light Source (ALS). The operando STXM at 11.0.2.2 shown in this work utilizes a 45-nm zone plate. High-resolution images were raster-scanned in 50-nm-steps, with a dwell time of 1 ms per pixel. The additional operando STXM at 5.3.2.1 utilizes 60-nm zone plate.
X-ray radiation dose
The flux of the beam was controlled using a 10-µm dispersive slit and 10-µm non-dispersive slit. The photon flux is ~3 × 10⁷ photons/s. About half the flux is absorbed by the SiNx window and the Au current collector, which is placed between the beam and the particle. Half the remaining photons are absorbed by the 150-nm-thick LiXFePO4 particles. Thus, the flux on the particles is ~8 × 10⁶ photons/s. The exposure time was ~ 1 ms per pixel, so the photon dose is ~8 × 10³ photons/pixel, which is ~9 × 10-13 J/pixel when the photon energy is 700 eV. The density of LiFePO4 is 3600 kg m-3, so the mass for a 150-nm-thick particle in each pixel is 1.4 × 10⁻¹⁸ kg. The dose is calculated to be ~6 × 10⁵ Gy per energy, which is 200 times lower than fluorescence X-ray measurements(20), even though the pixel density is doubled. At 703 eV, below the Fe edge, the dose is about 3-4 times lower.
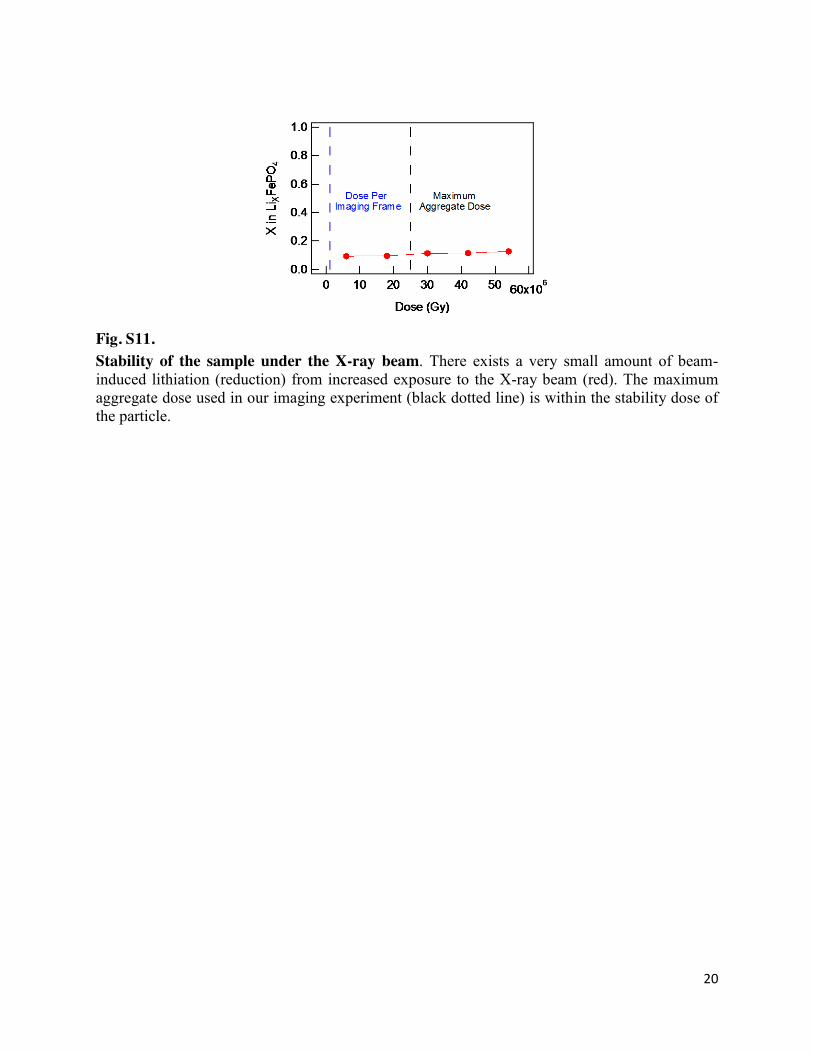
High doses of X-rays have been known to lithiate, or reduce, LiXFePO4 particles when in the presence of a liquid electrolyte (20). In Fig. S11, we quantify the degree of beam-induced lithiation by repeatedly measuring the Li composition of the same partially-lithiated particle at open circuit under different aggregate doses. The Li composition was calculated by fitting a linear combination of fully-lithiated and fully-delithiated references to the measured X-ray absorption. We show that beam-induced damage is negligible even up to a dose of 60 x 106 Gy. After repeat imaging, the maximum aggregate dose experienced by one of the particles in our operando experiment is ~25 × 106 Gy. Determining the Li composition X
We determine the single-pixel Li composition from the X-ray absorption spectra at each pixel. We first compute the optical density (OD) then fit a linear combination of the reference to the OD.
Optical density: The OD is calculated using: 𝑂𝐷 = − ln
𝐼𝐼0
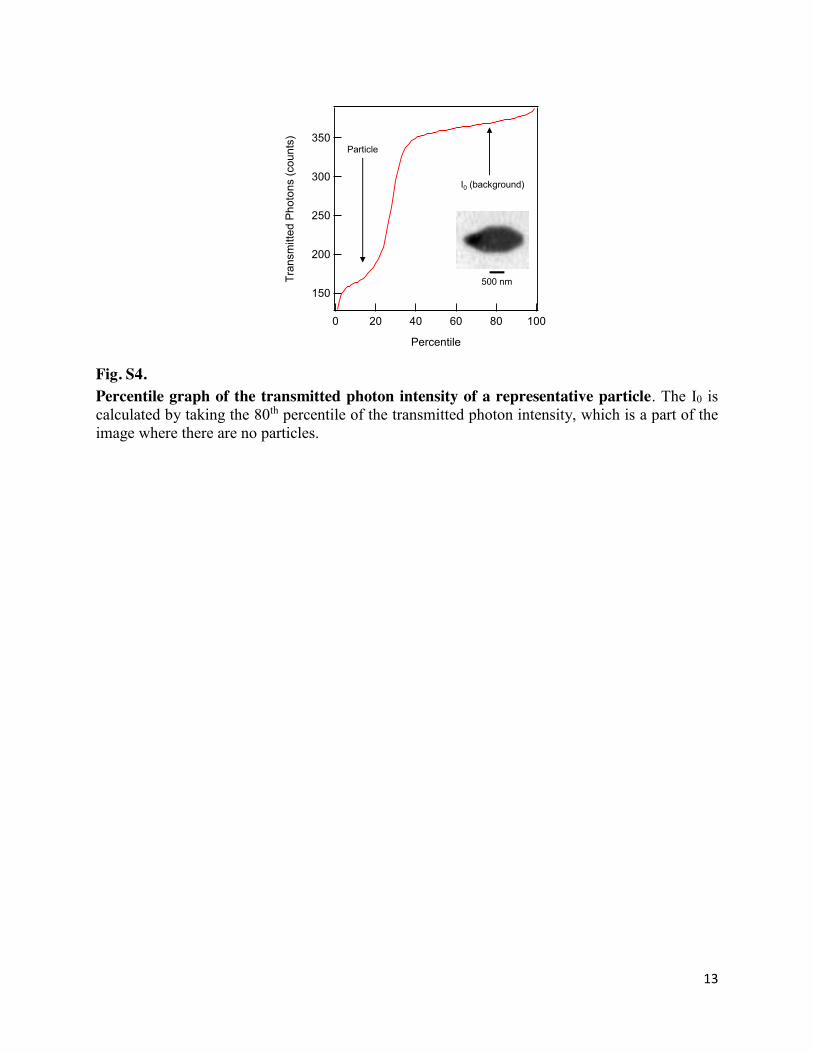
(S1) where I is the X-ray transmitted at every pixel, and I0 represents the transmitted X-rays in the absence of a particle. Because each imaging frame is rectangular, the more-absorbing pixels contain the LiXFePO4 particle, and the less-absorbing pixels contain the areas where there are no particles. I0 is calculated by sorting the transmitted intensity of all pixels, then appropriately obtaining the 80th percentile in intensity (see Fig. S4).
Particle thickness: The thickness (Th) of the particle equals the OD at the 703 eV pre-edge multiplied by the attenuation length (Th = λ × OD). At 703 eV, the attenuation length (λ) of
5
LiFePO4 was calculated to be 434 nm (42, 43), so the average particle thickness is about 150 nm for an OD of 0.3.
Reference spectra: The X=0 reference was taken from the X-ray absorption spectra of a
particle when the electrode is held at 4 V; the X=1 reference was taken from the same particle at 2 V. Due to high chemical contrast between the LiFePO4 and FePO4 phase at the Fe L3 edge (Fig. 1D), the OD at three energies is sufficient to precisely determine the Li composition. We used 703 eV, 706 eV, and 713 eV: 703 eV is the pre-edge absorption, and 706 eV and 713 eV are energies of significant contrast between the LiFePO4 and FePO4 phases. We subtract the optical density at 703 eV from the optical density of the other energies, and record the four variables:
LFP707: Mean optical density of the lithiated particle at 706 eV LFP712: Mean optical density of the lithiated particle at 713 eV FP707: Mean optical density of the delithiated particle at 706 eV FP712: Mean optical density of the delithiated particle at 713 eV
Image processing
Image alignment: All imaged frames for the same particle were aligned using the Lucas-Kanade algorithm (44), creating a stack of OD images for every particle. Images for the same particle taken at different times and cycling conditions were also aligned.
Determining the Li composition at each pixel: The composition is determined by solving the following matrix equation, consistent with previous work (20):
[𝑆706
𝑆713] = [𝐿𝐹𝑃706 𝐹𝑃706
𝐿𝐹𝑃713 𝐹𝑃713] [𝑎
𝑏] (S2)
Here, S707 and S712 are the optical densities of each pixel at 706 and 713 eV, minus the OD at 703 eV. a and b represent the LiFePO4 and FePO4 statefractions. To solve the Li composition (X in LiXFePO4), we used the following equation:
𝑋 =
𝑎𝑎 + 𝑏
(S3)
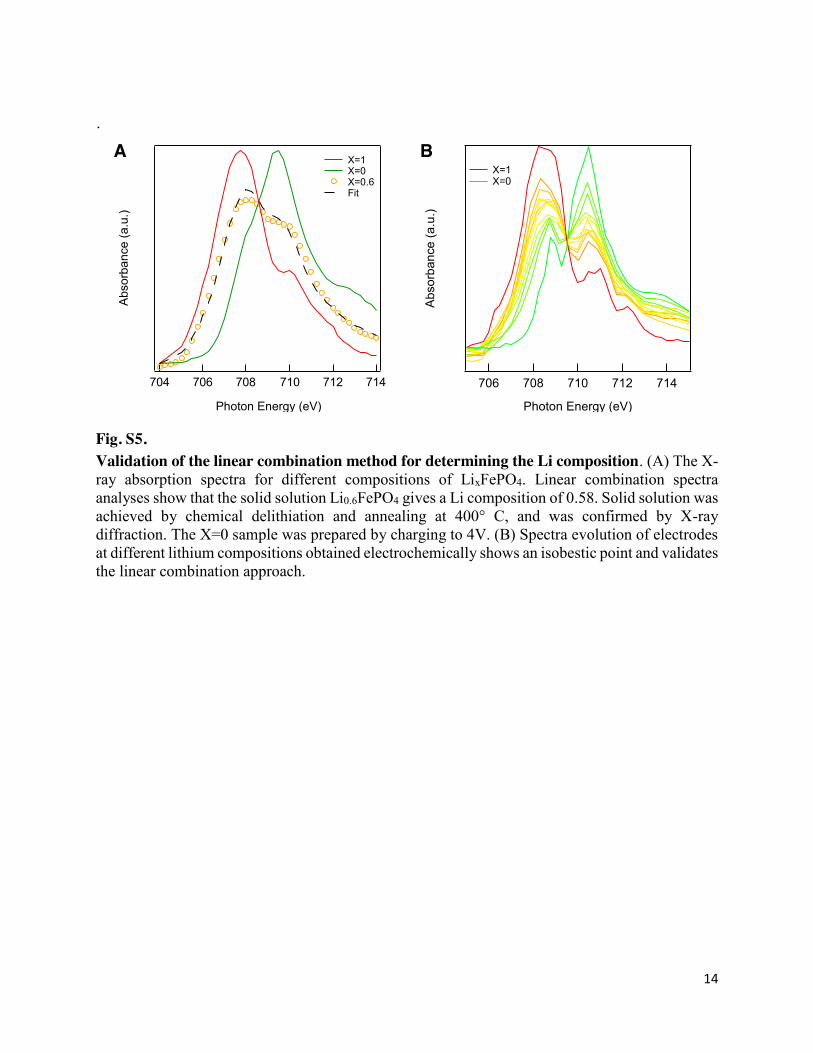
In all images, the hue represents the Li composition X, where red indicate X=1 and green indicate X=0. The brightness equals a+b. To verify that the references are fully-lithiated and fully-delithiated, we calculate the Li concentration of the particle (Figs. S5, 6). Indeed, the X values are uniform with the particle. The spectra are also consistent with previous work (13), including those with materials prepared by chemical (de)lithiation (25, 45).
Movies: The movies were constructed from frames of Li composition. To improve the
viewability, the movies were linearly interpolated between consecutive frames of Li composition map. The interpolation created 1 frame every minute from the 7 experimentally-acquired frames.
Error estimation of X: To calculate the error from signal-to-noise in X, we apply Eq. S2 to
the reference images to determine the local composition. Next, we calculate the standard deviation of X from the variation between pixels, which is about 0.06. Thus, the 95% confidence for our
6
single-pixel measurement is ± 0.12 of the measured value. Since each particle contains ~500 pixels, and the error scales by n-0.5 of the number of observations, the 95% confidence interval for a single-particle composition measurement is ± 0.005 of the measured value. A typical domain contains about 100 pixels, so the 95% confidence interval for the domain composition is about ± 0.01 of the measured mean.
Line cuts: The line cuts in Fig. 3(A,B) sample X along the lines drawn on the particle.
Because the images were aligned, we sample the same line along the particle under every cycling condition. The line cuts were not averaged spatially.
We estimate the additional errors based on two possibilities: lithiated (X=1) or delithiated (X=0) reference samples are not completely lithiated (X=0.89) or delithiated (X=0.11). Each case will shrink our X value from right or left by 11%.
Supplementary Text Image analysis
Identifying particles: We filtered out pixels whose a+b value (i.e., normalized single-pixel thickness) is less than 50% of the maximum a+b of the frame. Since the platelet particles have largely uniform thickness, this ensures that pixels which do not contain any particles are filtered out and not analyzed. The white outlines in Figs. 2 and 3 identify the mathematically-defined boundaries.
Identifying fast domains: In Fig. 3(C,D), we identify the fast and slow domains within a
particle. To determine the threshold for these domains, we first smooth the composition X of each frame by utilizing a Gaussian filter with a standard deviation of one pixel. Next, we sort the pixels of a particle in a frame by their X values, identify the 95th and 5th percentile with regards to the composition, and record them as X95 and X5. The threshold between the fast and slow domains is given by
𝑋𝑡ℎ𝑟𝑒𝑠 =
𝑋95 + 𝑋5
2
(S4)
During delithiation, the fast domains are the pixels where X<Xthres. During lithiation, the fast domains are the pixels where X>Xthres. The blue lines highlight the boundary between the fast and slow domains, which are also areas where X=Xthres.
Li composition uniformity coefficient: We determine the composition uniformity
coefficient of a particle (Fig. 3E) by calculating the pixel-wise standard deviation of X as a function of the mean X of that particle. We next calculate the standard deviation of the two limits as a function of the mean X. In the compositionally uniform limit, where every pixel has the same X, the uniformity coefficient is defined as 1. In the binary distribution limit, where every pixel is either X=0 or X=1, the uniformity coefficient is defined as 0. Figure S14 shows the standard deviation of a representative particle, and the two limits.
The uniformity coefficient of a particle at a given cycling rate is calculated by fitting a linear combination of the two limits to the calculated standard deviation of the particle. The average
7
composition uniformity coefficient for every particle cycled at a certain rate is plotted in Fig. 3E. The error bars represent one standard error of the uniformity coefficient between all the particles (de)lithiated at the same rate.
Current density: To compute the current density, we first calculate the C-rate for each
pixel in a particle, using: 𝐶𝑟𝑎𝑡𝑒 = Δ𝑋/Δ𝑡
(S5) where Δ𝑋 is the change in composition and Δ𝑡 is the time elapsed between sequential frames in hours. We then average the Crate of the pixels to obtain the single-particle C-rate. To obtain the current density, we use the following expression from the single-particle C-rate:
𝑗 = 𝑒𝜌𝑠𝐶𝑟𝑎𝑡𝑒
3600 𝑇ℎ2
(S6) Here, 𝑒 is the elementary charge, 𝜌𝑠 the volume concentration of Li sites in LiFePO4 (1.38 × 1028 m-3)(5, 13) and 𝑇ℎ the particle thickness as obtained from the optical density. The factor of 2 result from two reaction sites in a particle (top and bottom surface), and the factor of 3600 converts the C-rate from hours to seconds.
Exchange current density: Because it is unclear to what extent the equilibrium voltage
changes with the composition, we use the mean voltage between the lithiation and delithiation plateaus at low C-rates to calculate the equilibrium voltage. The overpotential 𝜂 is defined as the difference between the measured voltage (after the Ohmic correction for electrolyte transport) and the equilibrium voltage. To prevent delamination and thus preserve the electrochemical fidelity, these electrodes were not cycled at high rates prior to quantifying the exchange current density.
Because the relationship between current and voltage in LiXFePO4 is not well known, especially at high overpotential regime, we limited our analysis to low 𝜂 (<120 mV) when it is appropriate to use a linear approximation. Here, we calculate the exchange current density j0 from j using:
𝑗 = 𝑗0𝑒𝜂
𝑘𝐵𝑇
(S7)
where 𝑒 is the elementary charge, 𝑘𝐵 the Boltzmann constant, and 𝑇 the temperature. To calculate f(X), the normalized exchange current density, we fit the maximum value of the experimentally-obtained j0 to the following function: 𝑗0(𝑋) = 3𝑘0(1 − 𝑋)√𝑋(1 − 𝑋), where k0 is the fitting parameter to be obtained. The √𝑋(1 − 𝑋) term accounts for the activity of Li atoms and vacancies in the particle, consistent with porous battery electrode models. The (1 − 𝑋) is a simple expression to capture the asymmetric dependence of 𝑗0 on X (Fig. 4A) The factor or 3 was chosen to improve readability by making the maxima of 𝑗0 equal to 𝑘0. After obtaining the fitting parameter k0, we arrive at f(x) in Fig. 4A, which is given by:
𝑓(𝑋) =𝑗0
𝑘0
(S8)
8
We note that it is possible that the bottom surface facing the current collector is inactive due to electrolyte transport limitations. This would double the absolute value of the calculated exchange current density, but not the shape of the j0-X curve (Fig. 4A). Additionally, because the obtained specific capacity for the particles (150 mAh g-1) is less than the theoretical capacity (170 mAh g-1),there is some uncertainty in the quantification of the Li composition. The uncertainty is shown in Fig. 4A.
We conduct two sensitivity analyses to ensure robustness. Fig. S17A assume a Butler-Volmer relationship between current and voltage, and qualitatively observe the same trends:
𝑗 = 𝑗0 exp [
𝑒𝛼𝜂𝑘𝐵𝑇
] − 𝑗0 exp [−𝑒(1 − 𝛼)𝜂
𝑘𝐵𝑇]
(S9)
Here, 𝛼 is the charge transfer coefficient and assumed to be 0.5. The next sensitivity analysis uses a regular solution model to obtain the equilibrium voltage
profile as a function of X (36). Here, the overpotential equals the applied voltage minus the equilibrium voltage, and Eq. S7 is used to calculate the exchange current density. The equilibrium voltage is given as:
𝑉𝑒𝑞(𝑋) = 𝑉0 − Ω(1 − 2𝑋) +𝑘𝐵𝑇
𝑒ln
𝑋1 − 𝑋
(S10)
Here, 𝑉0 is the voltage calculated from the mean of the charge and discharge plateaus. We use a regular solution parameter Ω of 3 𝑘𝐵𝑇
𝑒, which correspond to a voltage gap of ~22 mV. This is
somewhat lower than previous predictions that yield a voltage gap of 76 mV (11, 13, 15), but we experimentally observe a voltage gap of ~25 mV (Fig. S18). Figure S17B plots the j0–X curve assuming this model for the equilibrium voltage.
Error estimation of the exchange current density: The fractional error in the exchange
current density is calculated from the spread of the exchange current density within each particle. It equals two times the standard error (95% confidence interval) in the calculated pixel-wise.
Reaction-limited spinodal decomposition
Linear stability analysis of the phase field model: To determine whether the compositionally uniform solid solution is stable, we conduct a linear stability analysis of the phase field model of LiFePO4 upon lithiation. A short summary of the derivation is given here, and the full details are in ref. (11). The lithiation stability boundary of the solid solution is the critical current where the single-particle voltage as a function of composition shifts from monotonically decreasing (i.e., stable solid solution) to one where it curves up in lithiation (Figs. 4-5 in ref. (11)). To conduct the stability analysis, we apply a uniform X across a particle and apply a constant current, then examine the growth of small perturbations in X as a function of position z and time t:
𝑋perturbed(𝑧, 𝑡) = 𝑋 + 𝑡1𝑍
∫𝑑𝑋𝑑𝑡
𝑑𝑧𝑍
0+ exp(𝑖𝑘𝑧) exp(𝑠𝑡)
(S11)
Here, X is the uniform Li composition, representing the solid solution state. The second term is the time t multiplied by a non-dimensionalized average current expression, in which Z is the length of the particle. The third term is the perturbation, where k is the wavenumber, z is the spatial
9
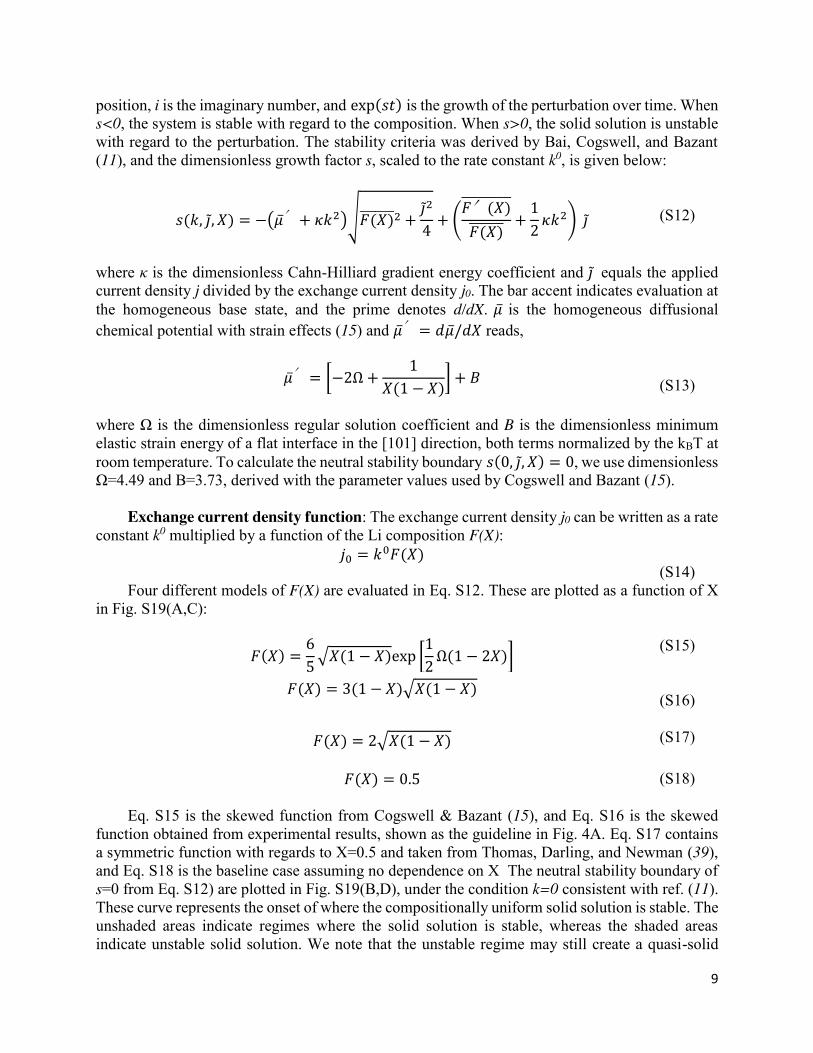
position, i is the imaginary number, and exp(𝑠𝑡) is the growth of the perturbation over time. When s<0, the system is stable with regard to the composition. When s>0, the solid solution is unstable with regard to the perturbation. The stability criteria was derived by Bai, Cogswell, and Bazant (11), and the dimensionless growth factor s, scaled to the rate constant k0, is given below:
𝑠(𝑘, 𝑗, 𝑋) = −(′ + 𝜅𝑘2)√𝐹(𝑋) 2 +𝑗2
4+ (
𝐹′(𝑋)
𝐹(𝑋) +12
𝜅𝑘2) 𝑗
(S12)
where κ is the dimensionless Cahn-Hilliard gradient energy coefficient and 𝑗 equals the applied current density j divided by the exchange current density j0. The bar accent indicates evaluation at the homogeneous base state, and the prime denotes d/dX. is the homogeneous diffusional chemical potential with strain effects (15) and ′ = 𝑑/𝑑𝑋 reads,
′ = [−2Ω +
1𝑋(1 − 𝑋)
] + 𝐵
(S13) where Ω is the dimensionless regular solution coefficient and B is the dimensionless minimum elastic strain energy of a flat interface in the [101] direction, both terms normalized by the kBT at room temperature. To calculate the neutral stability boundary 𝑠(0, 𝑗, 𝑋) = 0, we use dimensionless Ω=4.49 and B=3.73, derived with the parameter values used by Cogswell and Bazant (15).
Exchange current density function: The exchange current density j0 can be written as a rate constant k0 multiplied by a function of the Li composition F(X):
𝑗0 = 𝑘0𝐹(𝑋) (S14)
Four different models of F(X) are evaluated in Eq. S12. These are plotted as a function of X in Fig. S19(A,C):
𝐹(𝑋) =65 √𝑋(1 − 𝑋)exp [
12
Ω(1 − 2𝑋)]
(S15)
𝐹(𝑋) = 3(1 − 𝑋)√𝑋(1 − 𝑋) (S16)
𝐹(𝑋) = 2√𝑋(1 − 𝑋)
(S17)
𝐹(𝑋) = 0.5
(S18)
Eq. S15 is the skewed function from Cogswell & Bazant (15), and Eq. S16 is the skewed
function obtained from experimental results, shown as the guideline in Fig. 4A. Eq. S17 contains a symmetric function with regards to X=0.5 and taken from Thomas, Darling, and Newman (39), and Eq. S18 is the baseline case assuming no dependence on X The neutral stability boundary of s=0 from Eq. S12) are plotted in Fig. S19(B,D), under the condition k=0 consistent with ref. (11). These curve represents the onset of where the compositionally uniform solid solution is stable. The unshaded areas indicate regimes where the solid solution is stable, whereas the shaded areas indicate unstable solid solution. We note that the unstable regime may still create a quasi-solid
10
solution (11), implying that the composition is not spatially uniform, but there is insufficient time to completely phase separate.
Fig. S1. X-ray diffraction of the LiFePO4 particles synthesized for this experiment, plotted on a logarithmic scale. Rietveld refinement to powder diffraction file 00-040-1499 reveals no impurity phases and yields lattice constants of a=10.327(3) Å, b = 6.006(2) Å, and c=4.692(2) Å, with a unit cell volume of 291.0(3) Å3. This unit cell volume indicates negligible anti-site defects (46).
Inte
nsity
(a.u
.)
706050403020
2T(º)
Data Fit Difference

11
Fig. S2. Electrochemical cycling of the LiFePO4 platelet particles used in this experiment. This electrode was cycled in a coin cell with 1.0 M LiClO4 in EC:DMC.

12
Fig. S3. Electrochemical profile of the particles in a 1.0 M LiClO4 in TEGDME electrolyte. The charge capacity is somewhat higher than the discharge capacity, consistent with previous observations by Srinvasan and Newman (47). We propose that the hysteresis in the voltage is connected to the rate- and direction-dependent heterogeneity observed at the single-particle level in this work.
13
Fig. S4. Percentile graph of the transmitted photon intensity of a representative particle. The I0 is calculated by taking the 80th percentile of the transmitted photon intensity, which is a part of the image where there are no particles.
350
300
250
200
150Tr
ansm
itted
Pho
tons
(cou
nts)
100806040200
Percentile
500 nm
Particle
I0 (background)
14
.
Fig. S5. Validation of the linear combination method for determining the Li composition. (A) The X-ray absorption spectra for different compositions of LixFePO4. Linear combination spectra analyses show that the solid solution Li0.6FePO4 gives a Li composition of 0.58. Solid solution was achieved by chemical delithiation and annealing at 400° C, and was confirmed by X-ray diffraction. The X=0 sample was prepared by charging to 4V. (B) Spectra evolution of electrodes at different lithium compositions obtained electrochemically shows an isobestic point and validates the linear combination approach.
Abs
orba
nce
(a.u
.)
714712710708706
Photon Energy (eV)
X=1 X=0
Abs
orba
nce
(a.u
.)
714712710708706704
Photon Energy (eV)
X=1 X=0 X=0.6 Fit
A B
15
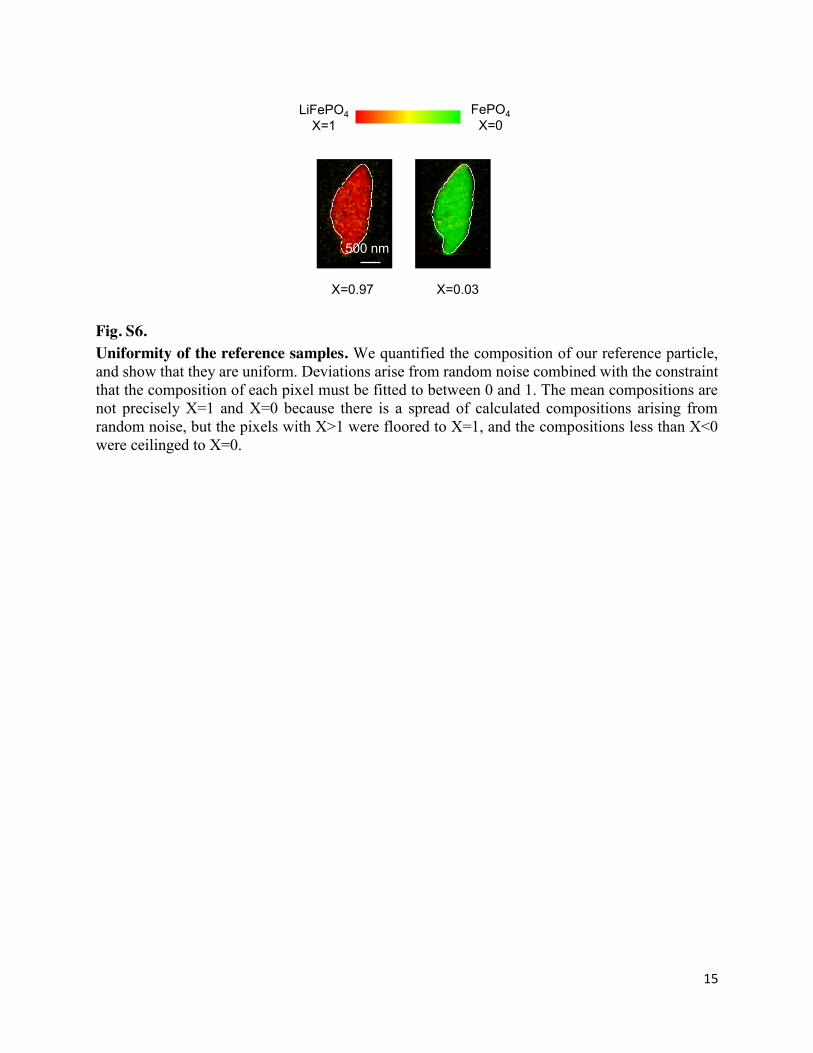
Fig. S6. Uniformity of the reference samples. We quantified the composition of our reference particle, and show that they are uniform. Deviations arise from random noise combined with the constraint that the composition of each pixel must be fitted to between 0 and 1. The mean compositions are not precisely X=1 and X=0 because there is a spread of calculated compositions arising from random noise, but the pixels with X>1 were floored to X=1, and the compositions less than X<0 were ceilinged to X=0.
X=0.97 X=0.03
500 nm
LiFePO4X=1
FePO4X=0
16
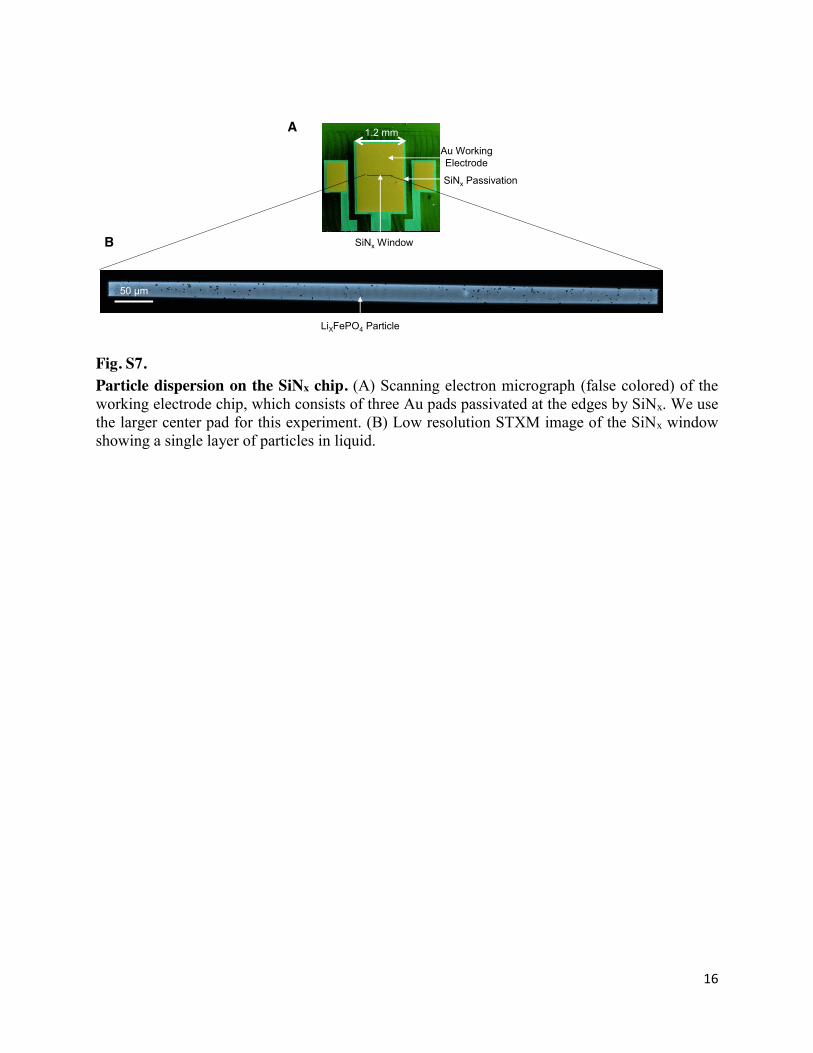
Fig. S7. Particle dispersion on the SiNx chip. (A) Scanning electron micrograph (false colored) of the working electrode chip, which consists of three Au pads passivated at the edges by SiNx. We use the larger center pad for this experiment. (B) Low resolution STXM image of the SiNx window showing a single layer of particles in liquid.
50 µm
1.2 mm
Au Working Electrode
SiNx Window
SiNx Passivation
A
B
LiXFePO4 Particle
17
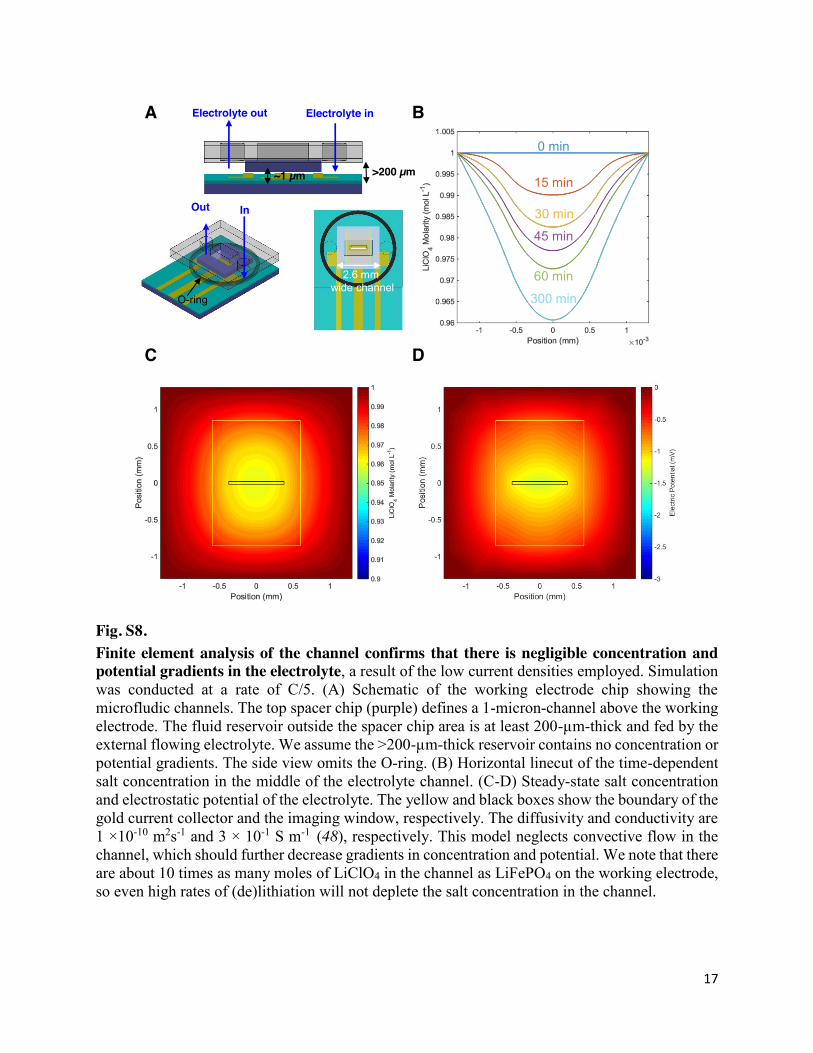
Fig. S8. Finite element analysis of the channel confirms that there is negligible concentration and potential gradients in the electrolyte, a result of the low current densities employed. Simulation was conducted at a rate of C/5. (A) Schematic of the working electrode chip showing the microfludic channels. The top spacer chip (purple) defines a 1-micron-channel above the working electrode. The fluid reservoir outside the spacer chip area is at least 200-µm-thick and fed by the external flowing electrolyte. We assume the >200-µm-thick reservoir contains no concentration or potential gradients. The side view omits the O-ring. (B) Horizontal linecut of the time-dependent salt concentration in the middle of the electrolyte channel. (C-D) Steady-state salt concentration and electrostatic potential of the electrolyte. The yellow and black boxes show the boundary of the gold current collector and the imaging window, respectively. The diffusivity and conductivity are 1 ×10⁻¹⁰ m2s-1 and 3 × 10⁻¹ S m-1 (48), respectively. This model neglects convective flow in the channel, which should further decrease gradients in concentration and potential. We note that there are about 10 times as many moles of LiClO4 in the channel as LiFePO4 on the working electrode, so even high rates of (de)lithiation will not deplete the salt concentration in the channel.
A B
0 min
15 min
30 min
45 min
60 min
300 min
C D
~1 µm >200 µm
Electrolyte inElectrolyte out
2.6 mm wide channel
InOut
O-ring
18
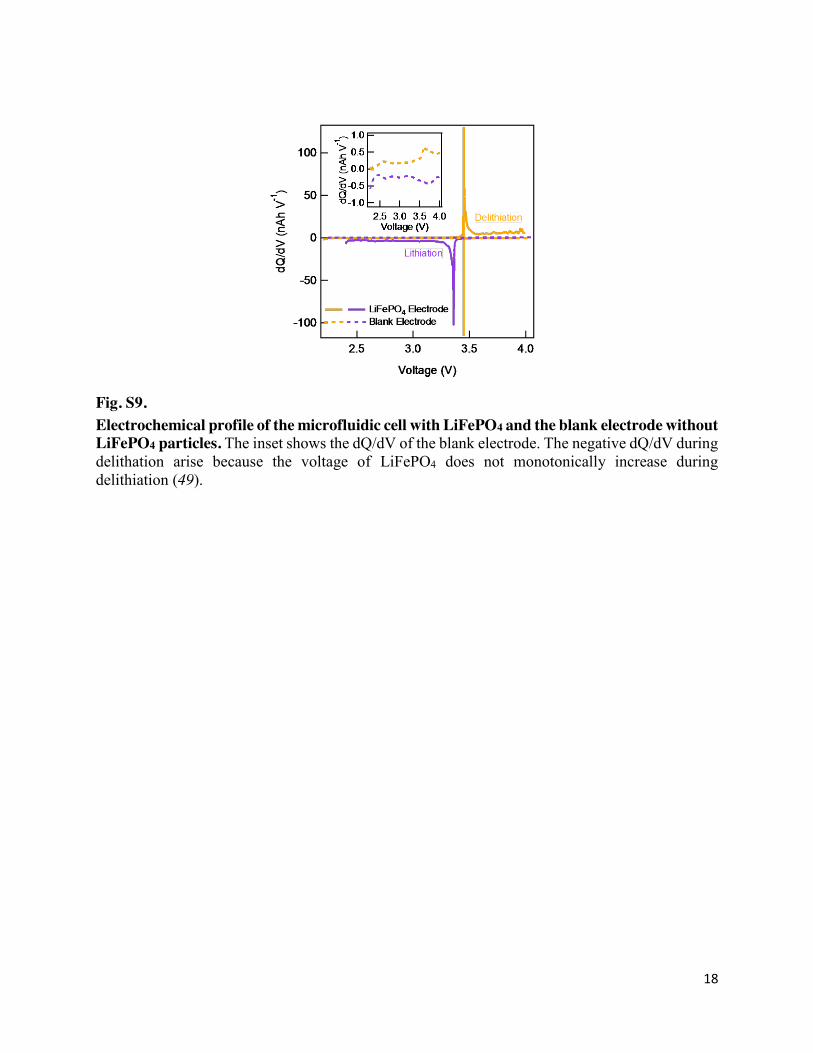
Fig. S9. Electrochemical profile of the microfluidic cell with LiFePO4 and the blank electrode without LiFePO4 particles. The inset shows the dQ/dV of the blank electrode. The negative dQ/dV during delithation arise because the voltage of LiFePO4 does not monotonically increase during delithiation (49).
19
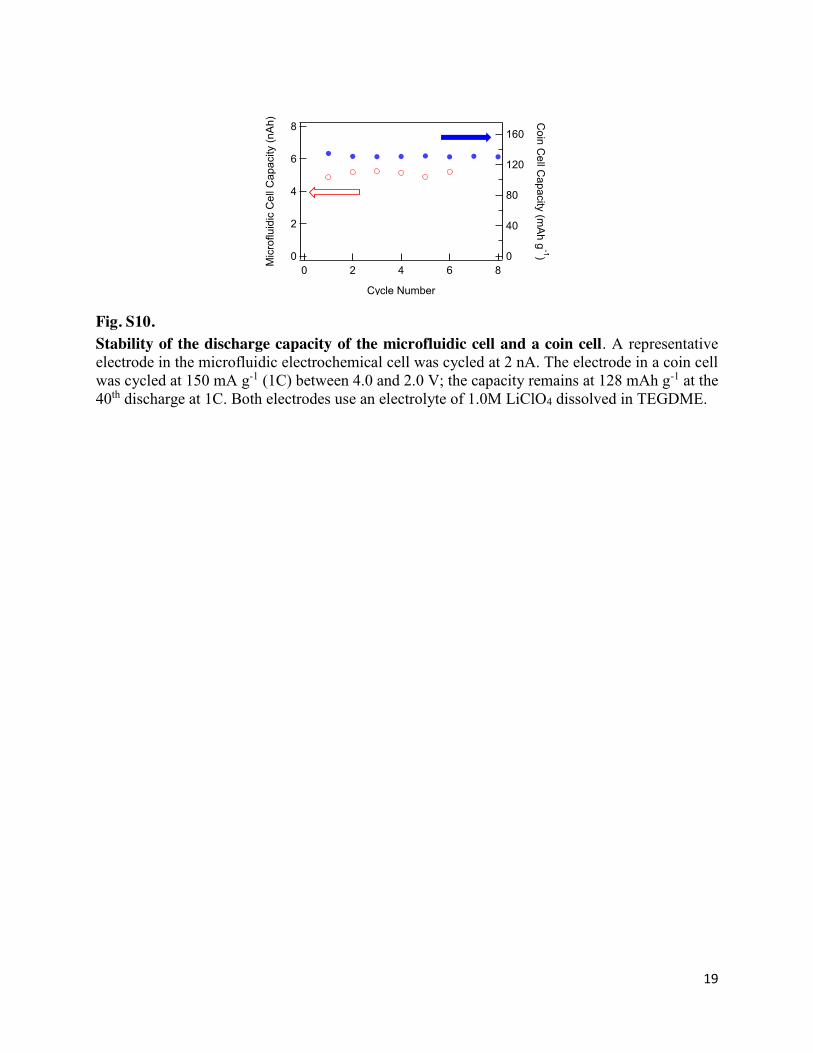
Fig. S10. Stability of the discharge capacity of the microfluidic cell and a coin cell. A representative electrode in the microfluidic electrochemical cell was cycled at 2 nA. The electrode in a coin cell was cycled at 150 mA g-1 (1C) between 4.0 and 2.0 V; the capacity remains at 128 mAh g-1 at the 40th discharge at 1C. Both electrodes use an electrolyte of 1.0M LiClO4 dissolved in TEGDME.
8
6
4
2
0Mic
roflu
idic
Cel
l Cap
acity
(nA
h)86420
Cycle Number
160
120
80
40
0C
oin Cell C
apacity (mA
h g-1)
20
Fig. S11. Stability of the sample under the X-ray beam. There exists a very small amount of beam-induced lithiation (reduction) from increased exposure to the X-ray beam (red). The maximum aggregate dose used in our imaging experiment (black dotted line) is within the stability dose of the particle.

21
Fig. S12. The Li compositions X of representative particles track the global Li composition. This shows all particles intercalate concurrently. Each point represents one imaged frame, and the error in each single-particle X measurement is about 0.01. Purple is lithiation and orange is delithiation. The circle markers are 0.2C (lithiation) or 0.3C (delithiation), the triangle markers are 0.6C, and the square markers are 2C. The scatter is large because the non-monotonic chemical potential of LiFePO4 accelerates the (de)lithiation rate of particles once they have (de)lithiated past the transformation barrier (13, 14), so certain particles complete (de)lithiation much faster than others.
22
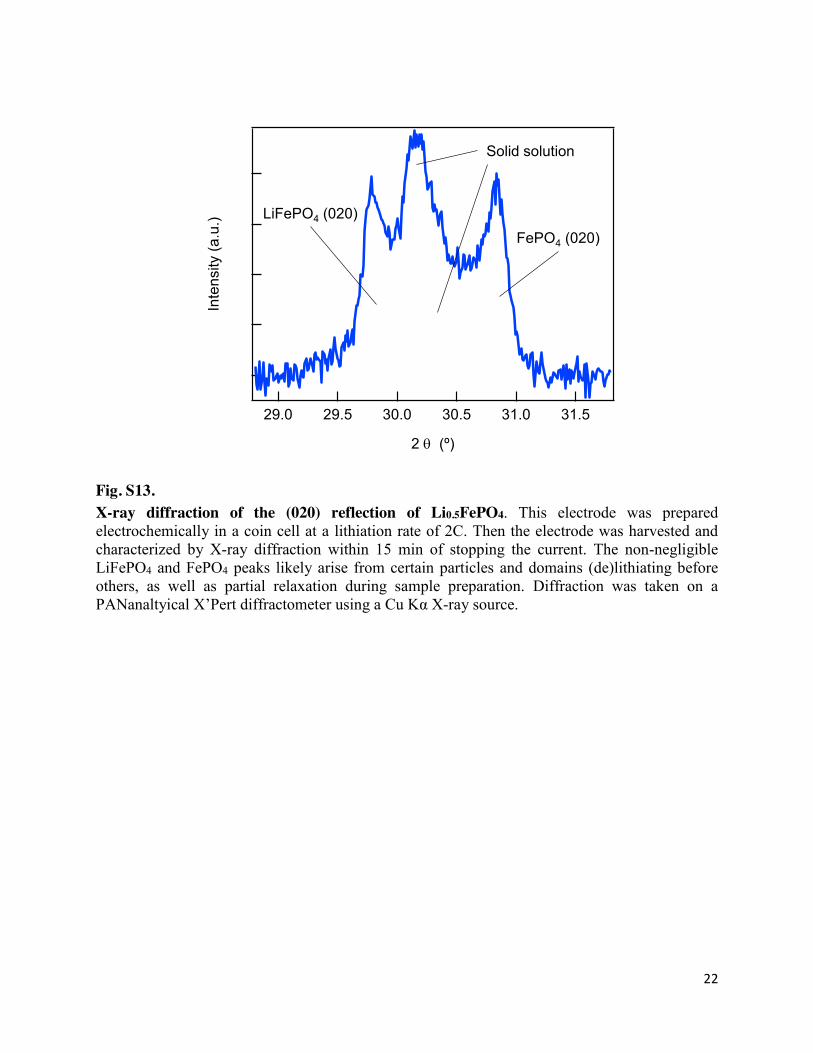
Fig. S13. X-ray diffraction of the (020) reflection of Li0.5FePO4. This electrode was prepared electrochemically in a coin cell at a lithiation rate of 2C. Then the electrode was harvested and characterized by X-ray diffraction within 15 min of stopping the current. The non-negligible LiFePO4 and FePO4 peaks likely arise from certain particles and domains (de)lithiating before others, as well as partial relaxation during sample preparation. Diffraction was taken on a PANanaltyical X’Pert diffractometer using a Cu Kα X-ray source.
Inte
nsity
(a.u
.)
31.531.030.530.029.529.0
2 T (º)
LiFePO4 (020)FePO4 (020)
Solid solution
23
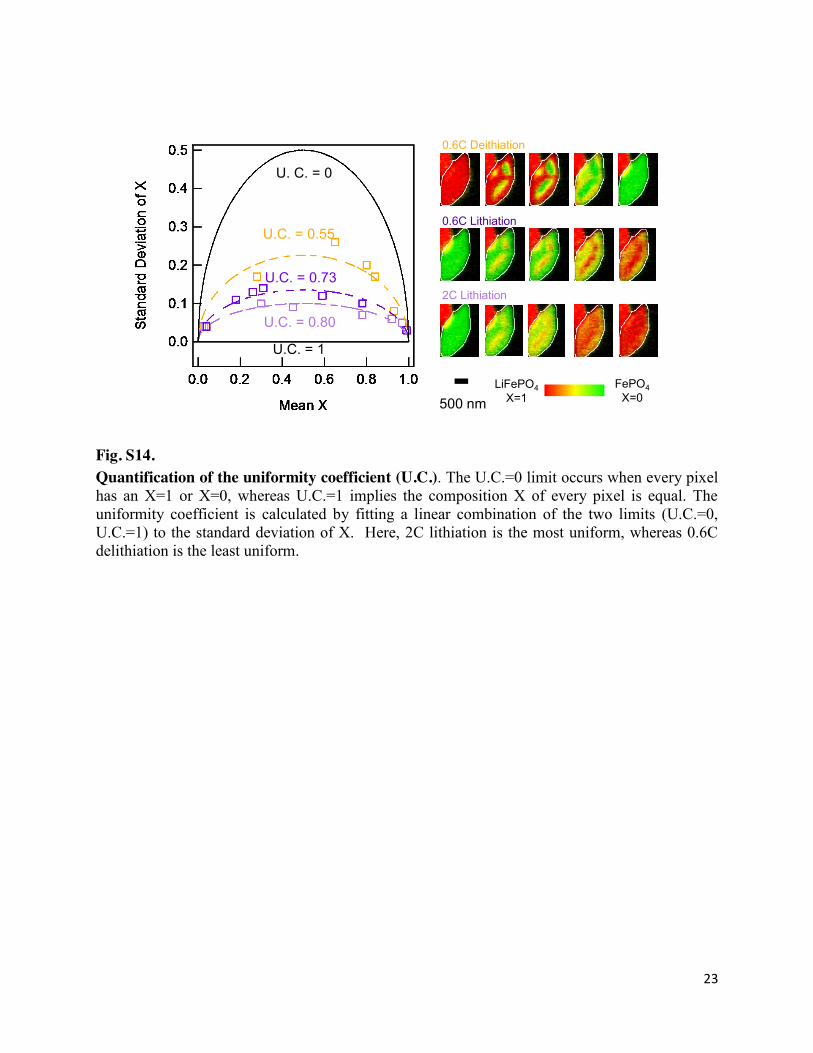
Fig. S14. Quantification of the uniformity coefficient (U.C.). The U.C.=0 limit occurs when every pixel has an X=1 or X=0, whereas U.C.=1 implies the composition X of every pixel is equal. The uniformity coefficient is calculated by fitting a linear combination of the two limits (U.C.=0, U.C.=1) to the standard deviation of X. Here, 2C lithiation is the most uniform, whereas 0.6C delithiation is the least uniform.
U.C. = 1
U. C. = 0
U.C. = 0.55
U.C. = 0.80
U.C. = 0.736541317 732C Lithiation
0.6C Lithiation
0.6C Deithiation
X=1 X=0500 nmLiXFePO4LiFePO4
X=1FePO4
X=0

24
Fig. S15. Frames of particles during and after relaxation. (A) An electrochemically-idle particle begins to phase separate over time. Minor changes in average Li composition arise likely because this particle exchanges lithium with other particles (14). Fig. S11 shows that particle composition quantification yields consistent values after repeated imaging, ruling out experimental drift. (B) Further delithiation of a relaxed, phase-separated particle brings it into a solid solution.
time=3 min
X=0.81
10 min
X=0.78
21 min
X=0.67
28 min
X=0.55
32 min
X=0.33
40 min
X=0.09
500 nm
time = 0 min
X=0.57
30 min
X=0.57
120 min
X=0.54
500 nm
X=0.48
330 minA
B
LiFePO4X=1
FePO4X=0
25
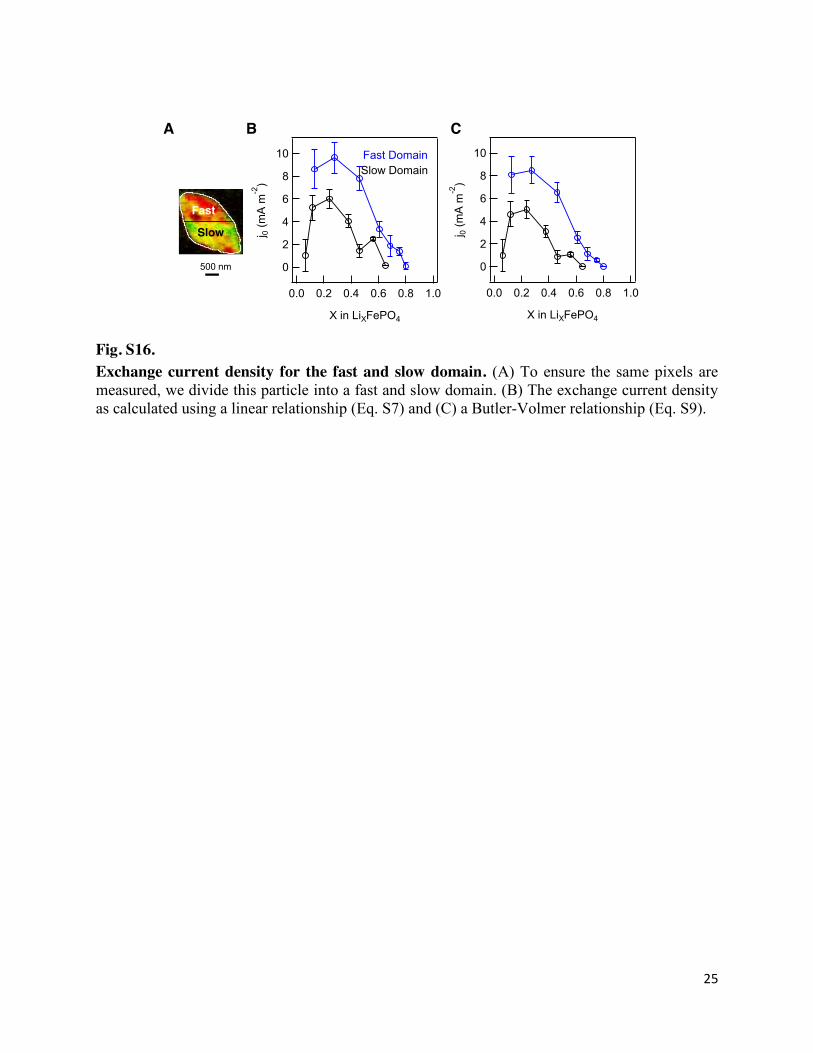
Fig. S16. Exchange current density for the fast and slow domain. (A) To ensure the same pixels are measured, we divide this particle into a fast and slow domain. (B) The exchange current density as calculated using a linear relationship (Eq. S7) and (C) a Butler-Volmer relationship (Eq. S9).
10
8
6
4
2
0j 0
(mA
m-2
)
1.00.80.60.40.20.0
X in LiXFePO4
10
8
6
4
2
0
j 0 (m
A m
-2)
1.00.80.60.40.20.0
X in LiXFePO4
B C
Fast
Slow
500 nm
Fast DomainSlow Domain
A
26
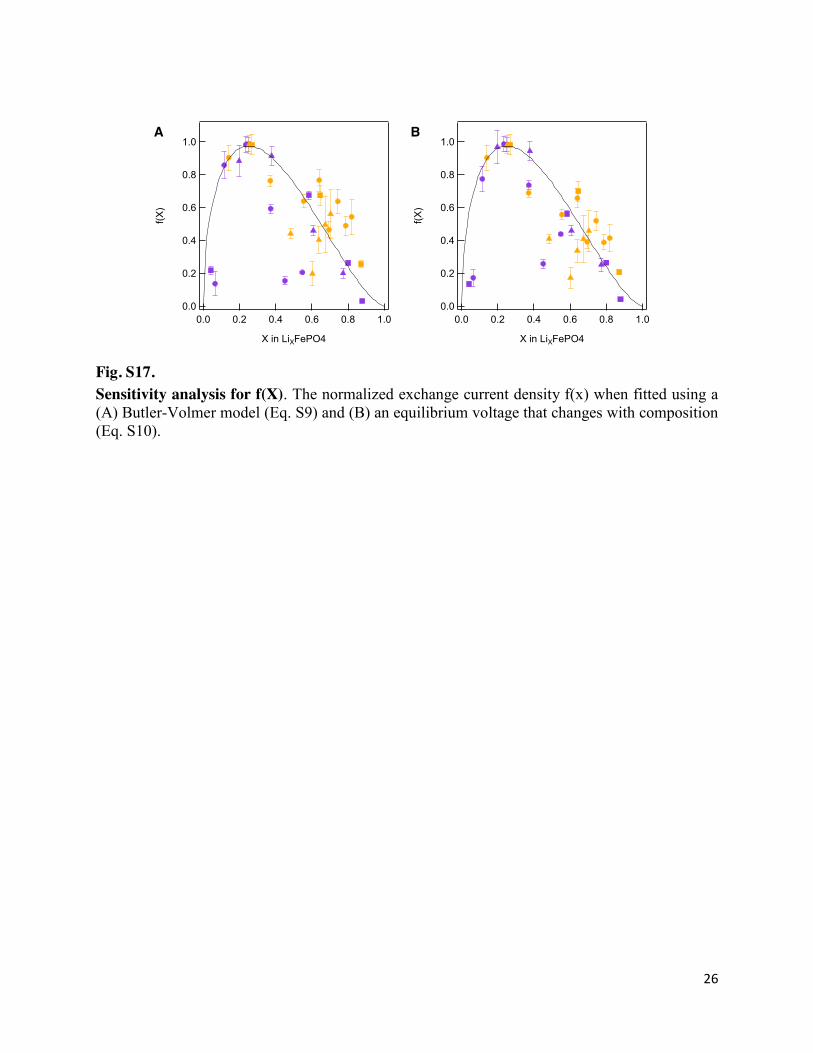
Fig. S17. Sensitivity analysis for f(X). The normalized exchange current density f(x) when fitted using a (A) Butler-Volmer model (Eq. S9) and (B) an equilibrium voltage that changes with composition (Eq. S10).
1.0
0.8
0.6
0.4
0.2
0.0
f(X)
1.00.80.60.40.20.0
X in LiXFePO4
1.0
0.8
0.6
0.4
0.2
0.0
f(X)
1.00.80.60.40.20.0
X in LiXFePO4
A B
27
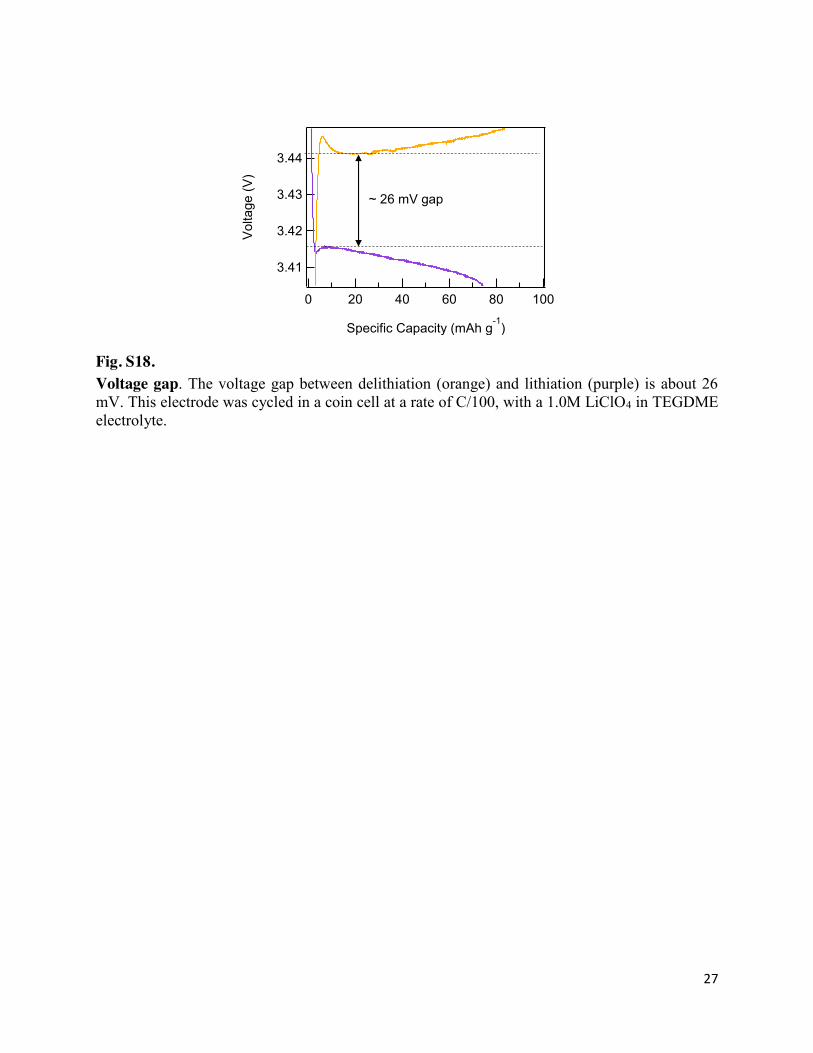
Fig. S18. Voltage gap. The voltage gap between delithiation (orange) and lithiation (purple) is about 26 mV. This electrode was cycled in a coin cell at a rate of C/100, with a 1.0M LiClO4 in TEGDME electrolyte.
3.44
3.43
3.42
3.41V
olta
ge (V
)
100806040200
Specific Capacity (mAh g-1
)
~ 26 mV gap

28
Fig. S19. Linear stability analysis of various j0 functions (A,B) Linear stability analysis of two skewed j0–X curves shows that the uniform composition solid solution is stable at increased cycling rate, for all values of X. The teal function is Eq. S15, and the purple function is Eq. S16. (C,D) When the j0–X curve is symmetric about X=0.5, the solid solution is linearly unstable for certain value of X even at high cycling rates. The pink function is Eq. S16, and the peach function is Eq. S18 All functions (except the peach one) were normalized for readability. This analysis shows that a skewed j0 function is necessary to achieve a stable solid solution with a spatially uniform composition. We note that, even if the solid solution is linearly unstable, a quasi-solid solution with nonuniform composition, and possibly diffuse interfaces, may still be possible.
Stable
Unstable
StableStable Unstable
A B
𝑗0 = 𝑘0𝐹(𝑋)
C D
𝑗0 = 𝑘0𝐹(𝑋)
29
Movie S1 Evolution of Li composition for particles during lithiation at a rate of 2C. The hue represents the Li composition X, where red indicate X=1 and green indicate X=0. The brightness represents thickness of material, the same as as in Fig. 2. The position of each particle (outlined in white) relative to each other, and the dashed line indicates divisions. The composition of each pixel was linearly interpolated time-wise to create the movie, such that 1 min=1 frame.
Movie S2 Evolution of Li composition for particles during delithiation at a rate of 0.6C. All legends have the same meaning as Movie S1.
Full Reference List 1. M. S. Whittiangham, Ultimate Limits to Intercalation Reactions for Lithium Batteries.
Chem. Rev. 114, 11414–11443 (2014).
2. H. Wang et al., Electrochemical tuning of vertically aligned MoS2 nanofilms and its application in improving hydrogen evolution reaction. Proc. Natl. Acad. Sci. U. S. A. 110, 19701–19706 (2013).
3. A. Llordés, G. Garcia, J. Gazquez, D. J. Milliron, Tunable near-infrared and visible-light transmittance in nanocrystal-in-glass composites. Nature. 500, 323–327 (2013).
4. W. H. Woodford, W. C. Carter, Y.-M. Chiang, Design criteria for electrochemical shock resistant battery electrodes. Energy Environ. Sci. 5, 8014–8024 (2012).
5. A. K. Padhi, K. S. Nanjundaswamy, J. B. Goodenough, Phospho-olivines as Positive-Electrode Materials for Rechargeable Lithium Batteries. J. Electrochem. Soc. 144, 1188–1194 (1997).
6. X. Zhang et al., Rate-induced solubility and suppression of the first-order phase transition in olivine LiFePO4. Nano Lett. 14, 2279–2285 (2014).
7. X. Zhang et al., Direct view on the phase evolution in individual LiFePO4 nanoparticles during Li-ion battery cycling. Nat. Commun. 6, 8333 (2015).
8. H. Liu et al., Capturing metastable structures during high-rate cycling of LiFePO4 nanoparticle electrodes. Science. 344, 1252817 (2014).
9. M. Hess, T. Sasaki, C. Villevieille, P. Novák, Combined operando X-ray diffraction–electrochemical impedance spectroscopy detecting solid solution reactions of LiFePO4 in batteries. Nat. Commun. 6, 8169 (2015).
10. J. Niu et al., In situ observation of random solid solution zone in LiFePO4 electrode. Nano Lett. 14, 4005–4010 (2014).
11. P. Bai, D. A. Cogswell, M. Z. Bazant, Suppression of Phase Separation in LiFePO4
30
Nanoparticles During Battery Discharge. Nano Lett. 11, 4890–4896 (2011).
12. R. Malik, F. Zhou, G. Ceder, Kinetics of non-equilibrium lithium incorporation in LiFePO4. Nat. Mater. 10, 587–590 (2011).
13. Y. Li et al., Current-induced transition from particle-by-particle to concurrent intercalation in phase-separating battery electrodes. Nat. Mater. 13, 1149–1156 (2014).
14. W. Dreyer et al., The thermodynamic origin of hysteresis in insertion batteries. Nat. Mater. 9, 448–453 (2010).
15. D. A. Cogswell, M. Z. Bazant, Coherency strain and the kinetics of phase separation in LiFePO4 nanoparticles. ACS Nano. 6, 2215–2225 (2012).
16. Y. Takahashi et al., Nanoscale visualization of redox activity at lithium-ion battery cathodes. Nat. Commun. 5, 5450 (2014).
17. J. Wang, Y. K. Chen-Wiegart, J. Wang, In operando tracking phase transformation evolution of lithium iron phosphate with hard X-ray microscopy. Nat. Commun. 5, 4570 (2014).
18. Y.-S. Yu et al., Nonequilibrium Pathways during Electrochemical Phase Transformations in Single Crystals Revealed by Dynamic Chemical Imaging at Nanoscale Resolution. Adv. Energy Mater. 5, 1402040 (2014).
19. J. Nelson Weker, Y. Li, R. Shanmugam, W. Lai, W. C. Chueh, Tracking Non-Uniform Mesoscale Transport in LiFePO4 Agglomerates During Electrochemical Cycling. ChemElectroChem. 2, 1576–1581 (2015).
20. Y. Li et al., Dichotomy in the Lithiation Pathway of Ellipsoidal and Platelet LiFePO4 Particles Revealed through Nanoscale Operando State-of-Charge Imaging. Adv. Funct. Mater. 25, 3677–3687 (2015).
21. M. E. Holtz et al., Nanoscale imaging of lithium ion distribution during in situ operation of battery electrode and electrolyte. Nano Lett. 14, 1453–1459 (2014).
22. M. Ebner, F. Marone, M. Stampanoni, V. Wood, Visualization and quantification of electrochemical and mechanical degradation in Li ion batteries. Science. 342, 716–720 (2013).
23. J. N. Weker et al., In situ nanotomography and operando transmission X-ray microscopy of micron-sized Ge particles. Energy Environ. Sci. 7, 2771-2777 (2014).
24. A. Ulvestad et al., Topological defect dynamics in operando battery nanoparticles. Science. 348, 1344–1347 (2015).
25. D. A. Shapiro et al., Chemical composition mapping with nanometre resolution by soft X-ray microscopy. Nat. Photonics. 8, 765–769 (2014).
31
26. U. Boesenberg et al., Mesoscale Phase Distribution in Single Particles of LiFePO4 following Lithium Deintercalation. Chem. Mater. 25, 1664–1672 (2013).
27. D. A. Cogswell, M. Z. Bazant, Theory of Coherent Nucleation in Phase-Separating Nanoparticles. Nano Lett. 13, 3036–3041 (2013).
28. D. Morgan, A. Van der Ven, G. Ceder, Li Conductivity in LixMPO4 (M = Mn, Fe, Co, Ni) Olivine Materials. Electrochem. Solid-State Lett. 7, A30–A32 (2004).
29. H. Bluhm et al., Soft X-ray microscopy and spectroscopy at the molecular environmental science beamline at the Advanced Light Source. J. Electron Spectros. Relat. Phenomena. 150, 86–104 (2006).
30. X. Liu et al., Phase transformation and lithiation effect on electronic structure of LixFePO4: an in-depth study by soft X-ray and simulations. J. Am. Chem. Soc. 134, 13708–13715 (2012).
31. M. Gu et al., Demonstration of an electrochemical liquid cell for operando transmission electron microscopy observation of the lithiation/delithiation behavior of Si nanowire battery anodes. Nano Lett. 13, 6106–6112 (2013).
32. A. Abdellahi, O. Akyildiz, R. Malik, K. Thornton, G. Ceder, Particle-size and morphology dependence of the preferred interface orientation in LiFePO4 nano-particles. J. Mater. Chem. A. 2, 15437–15447 (2014).
33. G. K. Singh, G. Ceder, M. Z. Bazant, Intercalation dynamics in rechargeable battery materials: General theory and phase-transformation waves in LiFePO4. Electrochim. Acta. 53, 7599–7613 (2008).
34. C. Delmas, M. Maccario, L. Croguennec, F. Le Cras, F. Weill, Lithium deintercalation in LiFePO4 nanoparticles via a domino-cascade model. Nat. Mater. 7, 665–671 (2008).
35. See supplementary materials and methods on Science Online.
36. M. Z. Bazant, Theory of Chemical Kinetics and Charge Transfer based on Nonequilibrium Thermodynamics. Acc. Chem. Res. 46, 1144–1160 (2013).
37. P. Bai, M. Z. Bazant, Charge transfer kinetics at the solid-solid interface in porous electrodes. Nat. Commun. 5, 3585 (2014).
38. J. Maier, R. Amin, Defect Chemistry of LiFePO4. J. Electrochem. Soc. 155, A339–A344 (2008).
39. K. E. Thomas, R. M. Darling, J. Newman, Advances in Lithium-Ion Batteries (Kluwer Academic/Plenum Publisheres, New York, 2002).
40. S. Yang, X. Zhou, J. Zhang, Z. Liu, Morphology-controlled solvothermal synthesis of LiFePO4 as a cathode material for lithium-ion batteries. J. Mater. Chem. 20, 8086-8091
32
(2010).
41. R. R. Unocic et al., Direct Visualization of Solid Electrolyte Interphase Formation in Lithium-Ion Batteries with In Situ Electrochemical Transmission Electron Microscopy. Microsc. Microanal. 20, 1029–1037 (2014).
42. E. M. Gullikson, X-Ray Interactions With Matter (2010).
43. B. L. Henke, E. M. Gullikson, J. C. Davis, X-Ray Interactions: Photoabsorption, Scattering, Transmission, and Reflection at E = 50-30,000 eV, Z = 1-92. At. Data Nucl. Data Tables. 54 (1993), pp. 181–342.
44. B. D. Lucas, T. Kanade, An Iterative Image Registration Technique with an Application to Stereo Vision. Proc. Imaging Underst. Work., 121-130 (1981).
45. Y.-S. Yu et al., Dependence on Crystal Size of the Nanoscale Chemical Phase Distribution and Fracture in LixFePO4. Nano Lett. 15, 4282–4288 (2015).
46. J. Chen, J. Graetz, A study of anti-site defects in hydrothermally prepared LiFePO4 by in-situ X-ray diffraction. Appl. Mater. Interfaces. 3, 1380–1384 (2011).
47. V. Srinivasan, J. Newman, Existence of Path-Dependence in the LiFePO4 Electrode. Electrochem. Solid-State Lett. 9, A110-A114 (2006).
48. H. S. Kim, C. S. Jeong, Electrochemical properties of binary electrolytes for lithium-sulfur batteries. Bull. Korean Chem. Soc. 32, 3682–3686 (2011).
49. T. Sasaki, Y. Ukyo, P. Novak, Memory effect in a lithium-ion battery. Nat. Mater. 12, 569–575 (2013).