Embed Size (px)
Citation preview

Title Page
Design of a Specimen Geometry for the Tensile Testing of Small Samples
by
Ruochen Dong
B. S. in Engineering, Anhui University of Technology, 2017
Submitted to the Graduate Faculty of
Swanson School of Engineering in partial fulfillment
of the requirements for the degree of
Master of Science in Mechanical Engineering
University of Pittsburgh
2019

ii
Committee Membership Page
UNIVERSITY OF PITTSBURGH
SWANSON SCHOOL OF ENGINEERING
This thesis was presented
by
Ruochen Dong
It was defended on
April 3, 2019
and approved by
Patrick Smolinski, PhD, Associate Professor, Department of Mechanical Engineering and Materials Science
William Slaughter, PhD, Associate Professor
Department of Mechanical Engineering and Materials Science
Qing-Ming Wang PhD, Professor Department of Mechanical Engineering and Materials Science
Thesis Advisor: Patrick Smolinski, PhD, Associate Professor

iii
Copyright © by Ruochen Dong
2019

iv
Design of a Specimen Geometry for the Tensile Testing of Small Samples
Ruochen Dong, M.S
University of Pittsburgh, 2019
The mechanical properties of biological tissues is important for different areas of research.
However, due to the size of the tissue, only small tissue samples can be obtained. For this reason,
this study focused on the development of a small tissue sample geometry for tensile testing. A
sample geometry was designed based on ISO standard 527 and a cutting die was made by additive
manufacturing machine. The performance of the die was assessed by testing with poultry tissue.
Finally, a finite element model has been analyzed to study the stress distribution of the gage area
of the specimen.
v
Table of Contents
Preface ........................................................................................................................................... ix
1.0 Introduction ............................................................................................................................. 1
2.0 Background ............................................................................................................................. 2
2.1 Study of mechanical properties of soft tissue ............................................................... 2
2.2 Motivation ....................................................................................................................... 8
2.3 Mechanics of shoulder joint ........................................................................................... 8
2.4 Study of the glenohumeral ligament ........................................................................... 10
3.0 Methods .................................................................................................................................. 14
3.1 Test machine and clamps ............................................................................................. 14
3.2 Test specimen geometry ............................................................................................... 18
3.3 Sample preparation ...................................................................................................... 23
4.0 Finite element analysis .......................................................................................................... 24
5.0 Results .................................................................................................................................... 26
5.1 Contour plot of finite element analysis ....................................................................... 27
5.2 Path plot of finite element analysis ............................................................................. 29
5.2.1 Stress path plot of σxx ........................................................................................ 30
5.2.2 Stress path plot of σyy ........................................................................................ 32
5.2.3 Shear stress path plot ........................................................................................ 34
6.0 Discussion............................................................................................................................... 36
Appendix A Dimensions of each standards .............................................................................. 37
Bibliography ................................................................................................................................ 39

vi
List of Tables
Table 1 The dimensions of different tensile specimen geometry ................................................. 22
Table 2 Different sizes of E8/E8M geometry ............................................................................... 37
Table 3 Different sizes of ISO 527 geometry ............................................................................... 37
Table 4 Different sizes of D638 type 5 geometry ......................................................................... 38
Table 5 Different sizes of D638 type 4 geometry ......................................................................... 38

vii
List of Figures
Figure 1 Relationship between stress and strain in a viscoelastic material .................................... 4
Figure 2 The structure of the shoulder joint.................................................................................... 9
Figure 3 Testing protocol [22] ...................................................................................................... 12
Figure 4 Structure of DMA Q800[25] .......................................................................................... 15
Figure 5 Dimension of mounted clamp in machine ...................................................................... 16
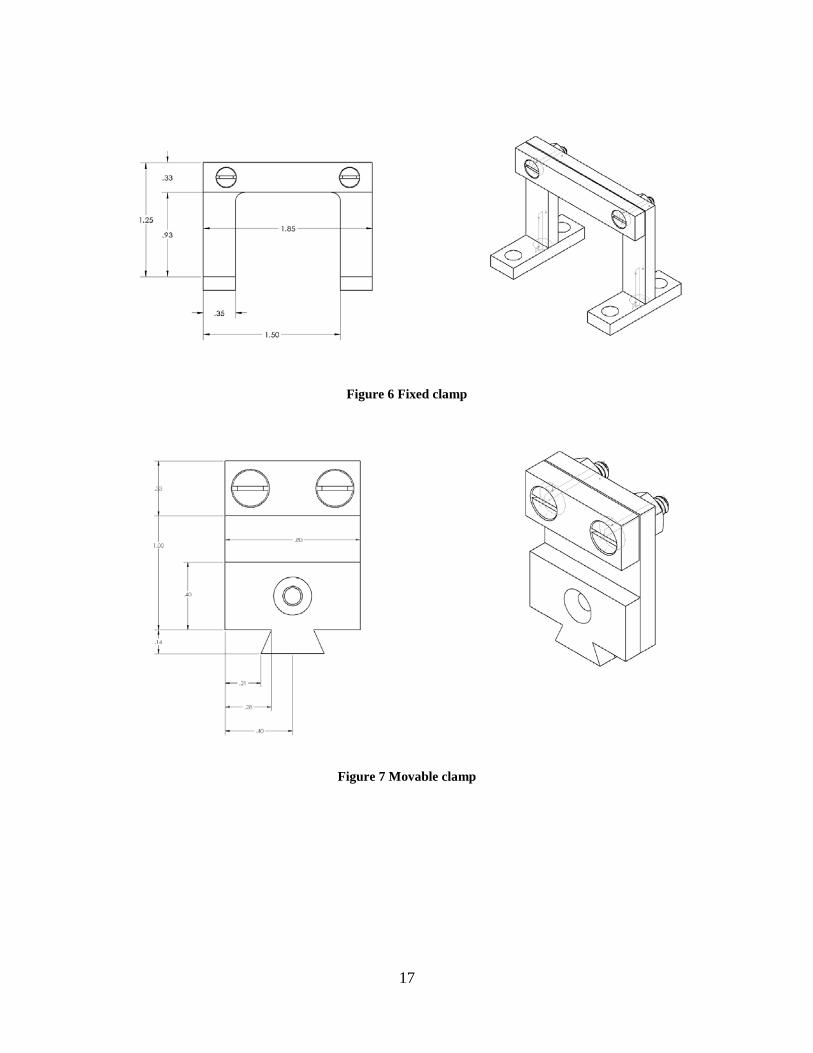
Figure 6 Fixed clamp .................................................................................................................... 17
Figure 7 Movable clamp ............................................................................................................... 17
Figure 8 Tension clamp ................................................................................................................ 18
Figure 9 Type 5 of ASTM A638................................................................................................... 20
Figure 10 Type 4 of ASTM A638................................................................................................. 20
Figure 11 ASTM E8...................................................................................................................... 21
Figure 12 ISO 527 ......................................................................................................................... 21
Figure 13 Cutting die .................................................................................................................... 22
Figure 14 Sample cut from chicken tendon .................................................................................. 23
Figure 15 Samples cut from chicken skin ..................................................................................... 23
Figure 16 Finite element model of the specimen .......................................................................... 25
Figure 17 Finite element result showing the deformed shape with undeformed edge ................. 26
Figure 18 σxx distribution .............................................................................................................. 27
Figure 19 σyy distribution .............................................................................................................. 28
Figure 20 σxy distribution .............................................................................................................. 28
Figure 21 Position of top, middle and bottom location of the stress plots.................................... 29
viii
Figure 22 Top path of σxx .............................................................................................................. 30
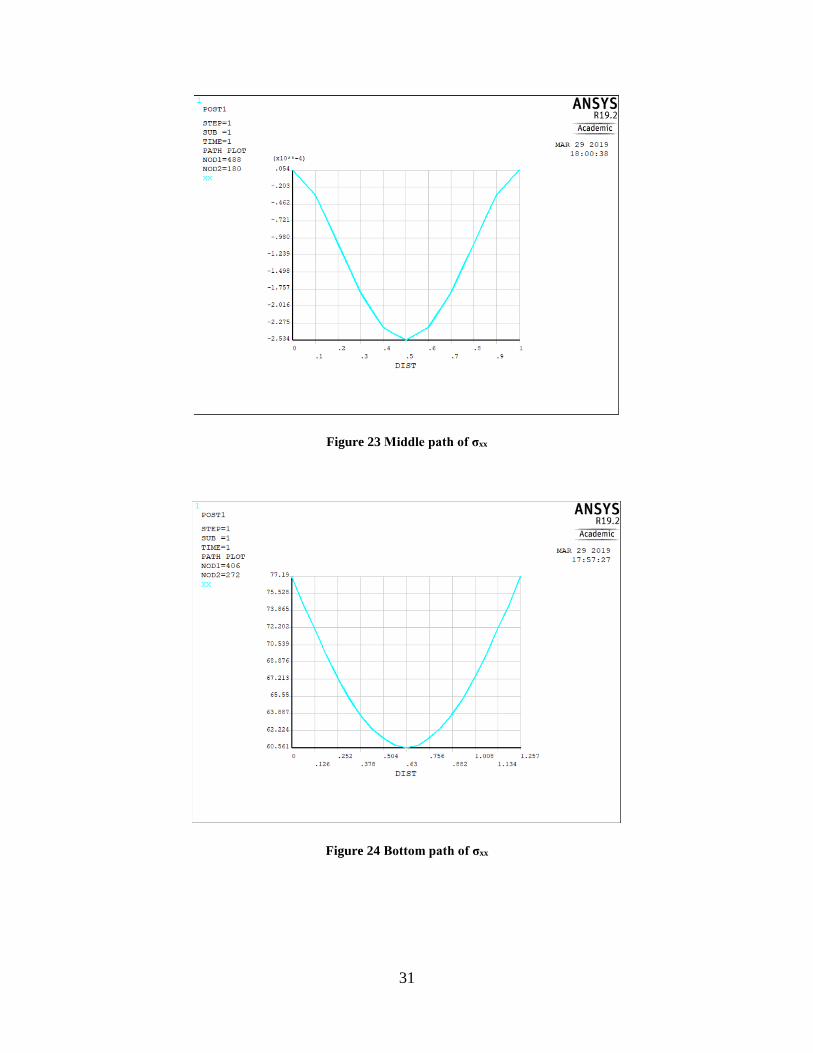
Figure 23 Middle path of σxx ........................................................................................................ 31
Figure 24 Bottom path of σxx ........................................................................................................ 31
Figure 25 Top path of σyy .............................................................................................................. 32
Figure 26 Middle path of σyy ........................................................................................................ 32
Figure 27 Bottom path of σyy ........................................................................................................ 33
Figure 28 Top path of σxy .............................................................................................................. 34
Figure 29 Middle path of σxy ........................................................................................................ 34
Figure 30 Bottom path of σxy ........................................................................................................ 35

ix
Preface
First of all, I would like to extend my sincere to Dr. Patrick Smolinski for his willingness
to be my research advisor. I have always looked up to him and have learnt a lot from him and his
work within the short duration of my Master’s degree program and finite element analysis class. I
would also like to thank the University of Pittsburgh for providing me with excellent coursework
and research facilities for my research work. Additionally, I would like to thank my friends Jingyi
Liu who helped me with my thesis tables and figures and Chris Spicer who helped with making
the punch and clamp.
Finally, my special thanks to Dr. William Slaughter and Dr. Qingming Wang for taking
out the time to be on my Masters committee at such a short notice and providing me with valuable
feedback.
All in all, it’s a unique experience for me not only study abroad, but also follow many
excellent professors. It will motivate me to pursue my dream.

1
1.0 Introduction
The mechanism of the living body had been a focus of study in human history and many
scientists have made significant contributions to it. Schack August Steenberg Krogh won The
Nobel Prize in Physiology or Medicine for his discovery of the capillary motor regulating
mechanism in 1920 and Archibald Vivian Hill also won the Nobel prize for his discovery relating
to the production of heat in the muscle. As Fung’s definition, biomechanics is mechanics of
biology[1]. Biomechanics is a branch of biophysics that applies quantitative principles and
methods to the study of mechanical problems in living organisms. The research of biomechanics
ranges widely and one of the most important fields is biosolid mechanics which study the
mechanical behaviors of soft tissue materials in living organisms.

2
2.0 Background
“Tensile testing is a fundamental mechanical test used to determine the Young’s modulus
of elasticity and other tensile properties”[2]. Nowadays, there is an increasingly time patients are
waiting for various suitable donate organ transplantations to treat failing or injured organs. Thus,
an alternative is regenerative medicine which is trying to create material to restore damaged
tissues. Therefore, it’s necessary for the substitute materials to mimic the mechanics properties of
the real soft tissue [3-4]. Mechanical properties can be obtained from testing which can include
tensile test, compression test, three-point bending test and so on. However, there are many
difficulties in tissue testing since the material is wet, slippery and soft, thus difficult to grip when
applying loads. Additionally, the shape of test specimens is important since it is desired to get the
true mechanical properties. On the other hand, the size of each specimen depends on the source of
the test material. Thus, there are benefits to making the sample size as small as possible.
Study of mechanical properties of soft tissue
Many pieces of research focus on different soft tissues with different external factors and
different internal factors and thus will have different results. Tensile testing may focus on stiffness,
ultimate tensile strength, failure strength or maximum elongation. External factors can be time,
temperature, strain rate, or other factors. Additionally, soft tissues can exhibit significant
viscoelastic behavior, which is a significant property of biomaterials. One viscoelastic property is
the loss factor tanδ which provides information on the relationship between the elastic and

3
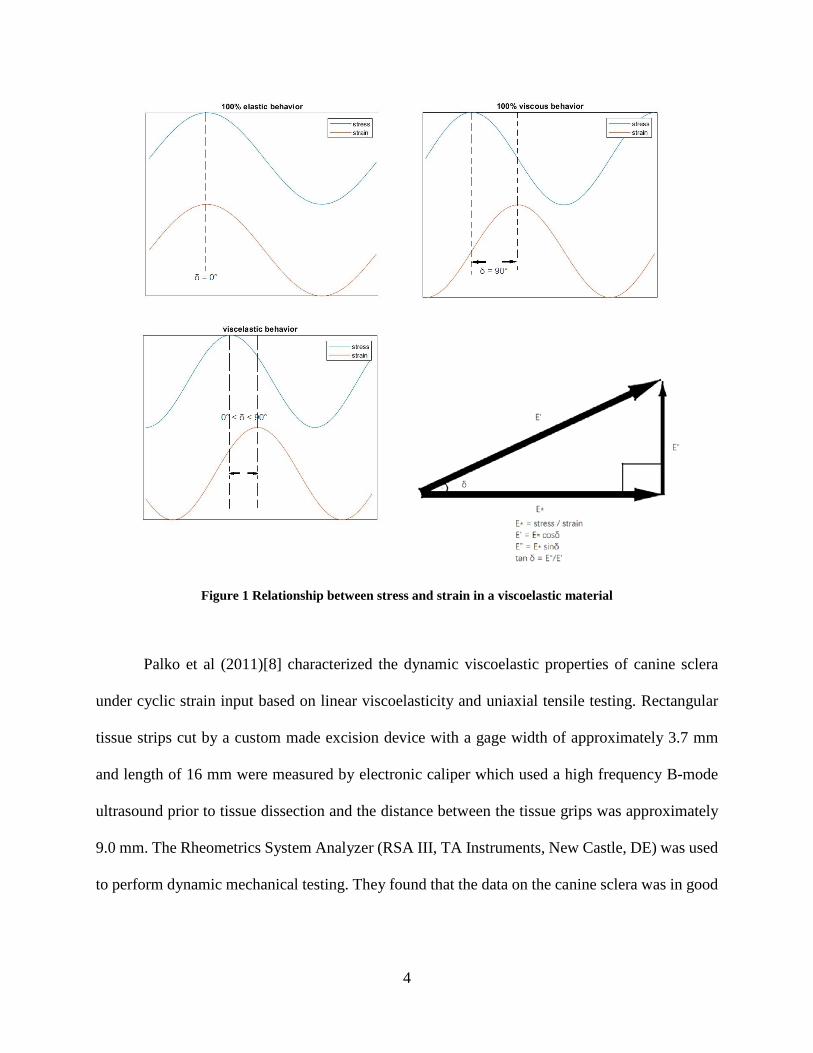
inelastic components. δ is phase lag between stress and strain’s periodic wave (figure 1) and can
determine the relationship between complex modulus(E*) and loss or storage modulus(E”) as
shown in the figure 1. If δ equals to 0 or 90 degree, the material is elastic or viscous, respectively.
Moreover, the material should be viscoelasticity if δ is larger than 0 and less than 90 degrees.
The objectives of most tissue research are viscoelastic and nearly incompressible materials.
Therefore, the uniaxial tensile methodology is commonly applied in testing that uses a suitably
shaped strip of specimen that is gripped at both ends by clamps and stretched while the load and
extension are recorded [5-7].
4
Figure 1 Relationship between stress and strain in a viscoelastic material
Palko et al (2011)[8] characterized the dynamic viscoelastic properties of canine sclera
under cyclic strain input based on linear viscoelasticity and uniaxial tensile testing. Rectangular
tissue strips cut by a custom made excision device with a gage width of approximately 3.7 mm
and length of 16 mm were measured by electronic caliper which used a high frequency B-mode
ultrasound prior to tissue dissection and the distance between the tissue grips was approximately
9.0 mm. The Rheometrics System Analyzer (RSA III, TA Instruments, New Castle, DE) was used
to perform dynamic mechanical testing. They found that the data on the canine sclera was in good

5
agreement to the reported data on human sclera. In this study, little information is given on the
grip method and clamp.
Oskui et al (2016)[9] focused on the dynamic tensile properties of the bovine periodontal
ligament which has a non-linear strain-stress response. They confirmed that the properties are the
function of loading frequency and preload. Additionally, the loading profile was chosen to be
“force-controlled” rather than “displacement-controlled” in this study. The sample was bar-shaped
parallel to the direction of mechanical testing with 4×8 mm dimensions and 2mm thickness which
was measured by an optical microscope. A dynamic testing apparatus (TTDMA, Triton
Technology, UK) was used to perform tensile test and a linear variable differential transformer
(LVDT) was used to measure displacement. Apparatus clamps were used to hold the bone and
tooth components and there is no other information about the clamp and gripping method. Finally,
this study used a generalized Maxwell model that can capture the dependence of sample’s
viscoelastic behavior that was previously expressed by Gutierrez-Lemini (2014)[10] and Zhang
and Gan (2014)[11]. The experimental results showed that the proposed model can be used in
future finite element analysis and captured the viscoelastic behavior dependence on preload
magnitudes.
Myers et al (2010)[12] tested both tensile and compression properties of soft tissue –
human cervical tissue which is related to spontaneous preterm birth. They focused on the
anisotropy effects by cutting tissue samples with three orthogonal axes and hypothesized that
collagen orientation would influence the cervical tissue mechanical response. Additionally, a one-
dimensional time-dependent rheological model was adopted to compare the samples with different
6
obstetric backgrounds, different anatomy sites and different loading direction. During the tension
test, the dimension of the strip was approximately 2mm thick and had a 10mm gauge length. A
universal material testing machine (Zwick Z2.5/TS1S, U1m, Germany) was used to performing
mechanical test and all samples were bathed in PBS [13]. A video extensometer (Qimaging Retiga
1300 charge-couple device camera, 200 mm f/4 Nikon lens) and the CORRELATED
SOLUTIONS VIC-2D version 4.4.0 software were used for capturing the transverse specimen
deformation and lateral or axial stretch data. India ink were adopted to pattern the specimen and
then stainless-steel tension grips with silicon carbide sandpaper and ethyl cyanoacrylate were used
for gripping the sample. As a result, this study becomes a pioneer about characterizing the
anisotropic nature of cervical tissue.
In vitro force-controlled method was adopted to perform the experiment by Boyce et al
(2007)[14] which was similar to Oskui et al (2016)[9]. Bovine cornea has been tested to find out
the viscoelastic response. Specifically, the loading can be divided into two types: cycled ramp test
and multi-stress-rate cycles and a creep test which includes a range of hold stresses. The specimen
size was 1.15-1.30mm thick and 7mm wide. The length ran from limbus and limbus and the gauge
length is 8 mm. A servohydraulic load frame with pneumatically clamping serrated soft tissue
grips and recirculated ophthalmic balanced saline solution bath was used to perform the tensile
testing and immerse the tensile specimen and grips. This study compares the experimental results
with a quasi-linear viscoelastic model and found that they were similar only when the stresses were
low, and durations were moderate. Finally, the results of this study show significant non-linearity
of bovine cornea and support the other studies of the stiffness of the tissue.

7
Huang et al (2009)[15] have studied the effect of temperature on the viscoelastic properties
of the human supraspinatus tendon in tension. The specimen they used is a rectangular shape with
the dimensions of 6.5 mm wide, 20 mm long and 1.5 mm thick which was cut by a sledge
microtome (Leica Instruments, Nussloch, Germany) and measured by a stereomicroscope and a
digital micrometer (Akizuki et al., 1986)[16]. The experiment was performed by a servo-hydraulic
MTS machine (Model 858 Bionix, Eden Prairie, MN, USA) and adopted a static stress-relaxation
method. Additionally, in order to prevent the specimen slippage, 400 grit sandpaper were applied
to the clamp. Sub-failure material and viscoelasticity properties with quantified temperature were
discussed in this study and thus give data that temperature effects should be considered as an
important factor during the test.
Carlos et al (2005)[17] did three different tests of the human medial collateral ligament
tissue which include a longitudinal test, a transverse test and a shear test and quantify the strain-
and frequency-dependent viscoelastic behavior. The initial dimension of the medial collateral
ligament test specimen before preconditioning was 12.9 mm long, 2.3 mm wide and 1.5 mm thick.
A digital camera (Pulnix TM-1040, 1024x 1024x30 fps. Sunnyvale, CA) and frame-grabber
(Bitflow Roadrunner, Woburn, MA) were used to record two black contrast makers which adhered
to the longitudinal and transverse directions and a linear variable differential transformer (LVDT)
(Schaevitz, Hampton, VA) was used to monitor the elongation. To prepare the specimen, hardened
steel punches were adopted to harvest the test specimens. The results of this experiment indicated
that the tissue is more effective at dissipating energy with higher frequencies at fasting loading
rates.
8
Motivation
However, in the last few years, there has been interest in the study of shoulder joint which
made up of the humerus, collarbone and scapula, in which there are a lot of ligaments, muscles
and soft tissues. However, when compared with other joints, the shoulder joint is even more fragile
because necessity of the arm motion in all direction, thus there is very little bone support in the
joint and soft tissue controls much of the motion. For this reason, the shoulder can get injured due
to excessive force or non-standard movement.
Mechanics of shoulder joint
“The shoulder joint is one of the most mobile in the body, at the expense of stability.”[18]
The bones of the shoulder joint are composed of the humerus, the scapula and the clavicle. The
scapula and clavicle are located at the top of the chest and many upper back and shoulder muscles
are to attach the scapula in the upper back and the clavicle in the upper thorax to the chest and
spine. This provides a platform for arm and shoulder movement. The shoulder joint is a ball and
socket joint consisting of the humeral head and the joint socket (glenoid), which forms the bony
articulation. This joint has the most motion of any joint in the body. The upward movement of the
humerus is blocked by the condyles of the clavicle and shoulder blades, as well as the ligaments
and rotator cuffs. The downward, forward, and backward movement of the humerus is limited by
the position of the humeral head in the labrum of the glenoid, which is an annular band of
fibrocartilage that wraps around the edge of the socket to add concavity. The humerus is fixed by

9
many of ligaments and tendons which include glenohumeral ligament along the labrum. These
ligaments and tendons form the rotator cuff.
If the muscle or ligament, or any of the soft tissues are injured, then scapula will lose
control and then the shoulder joint may have impingement syndrome or other damage. The
ligaments, especially the glenohumeral ligament, play a key role in stabilizing the bony structures.
The anatomy of shoulder joint is shown in the figure 2. The glenohumeral ligament connects the
humerus with the glenoid fossa and is main structure in maintaining the stability and preventing
dislocation.
Figure 2 The structure of the shoulder joint A-Coracoacromial ligament B-Coracohumeral ligament C-
Glenohumeral ligaments[18]

10
Study of the glenohumeral ligament
Among early studies, Bigliani et al (1992)[19] discussed the properties of the inferior
glenohumeral ligament, especially the tensile property, and the influence of the tissue structure.
Since the torsion of the shoulder is limited by the flexibility of the ligament, the scale of the
external torsion is limited by the stiffness of the inferior glenohumeral ligament and the tightness
of the upper part of the capsular ligament. It is necessary to add an abduction angle to the inferior
glenohumeral ligament when studying the tensile properties of the tissue. Therefore, this study had
divided the inferior glenohumeral ligament into three parts with different angles. In this study, the
author investigates the properties of elongation rate, failure stresses and failure strains, failure
modes and tensile modulus and the stress-strain relationship. The dimension of specimens used
were measured by a Bausch and Lomb stereo-zoom microscope, adapted with an Olympus
precision X-Y translation stage, Leitz electrooptical micrometer coupled to a Microcode digital
micrometer. The mean length, width and thickness are nearly 40mm, 12mm and 2mm,
respectively. During tensile testing, video dimensional analysis was used to track the changes in
gauge section length electronically. Finally, this study found a great influence of the degree to
which capsular stretching can take place in the production of traumatic glenohumeral instability.
Ticker et al (1996)[20] analyzed the geometric and strain-rate dependent properties of the
inferior glenohumeral ligament (IGHL). The sacral ligament is the most important static factor for
stabilizing the shoulder joint. In this experiment, a materials testing machine and 3D software were
used to analyze the length changes of the ligament and grip-to-grip displacements during normal
human shoulder abduction. The mean dimension of these samples is 43mm in length, 1.9 mm in
thickness, and 13.6mm in width. The results of the study have significance for the clinical
treatment of shoulder joint disease. The IGHL is not in a state of tension during the initial stages

11
of outreach and becomes tenser as the angle of outreach increases. Therefore, this study only
focused on the IGHL at its maximum length and its position on the surface of the humeral head at
this time.
In addition, Lee et al (1999)[21] focused on the structural properties of the glenoid with or
without anterior band of the inferior glenohumeral ligament with and without humerus complex.
Both a younger group and an older group were introduced for the process of evaluating the
biomechanical properties with age. The purpose of this study was to compare bio-mechanical
properties of the glenoid with or without anterior band of the inferior glenohumeral ligament with
and without humerus complex in the apprehension position by different age groups. Tensile testing
was conducted by adopting a video digitizing system. The maximum and the minimum of the
sample width was 29.7mm and 22.3mm and the thickness of all was above 3mm. An axial testing
machine (Instron Co., Canton, MA, USA) was used to perform the dynamic test and a custom
shoulder jig and a video digitizing system (VDS) is used to measure the strain. The results were
divided into three main parts, namely, geometric properties, failure characteristics, and bio-
mechanical properties. It was found that as to the structural properties, the older group has more
volume and cross-area than the younger group. The results of this article stated that for these
individuals who are very young, disruption of the complex usually can be found at the glenoid
insertion site, but for older individuals, disruption has a great chance to take place at the
midsubstance region. Overall, this article finds the conclusion that as to the structural properties
and the material characteristics of the inferior glenohumeral ligament, the younger group is
significantly different with the older group and the younger group is more superior.
Pollock et al. (2000)[22] looked at the effect of repetitive subfailure strains on the inferior
glenohumeral ligament. This experiment was divided into three groups with the only difference

12
between each group being the number of cycles of subfailure strain after applied a 1.5-N preload
to establish its initial length. A servo-hydraulic and axial/torsional testing system (MTS Systems
Corporation, Minneapolis, Minn) was used performed the test. It was noted that when gripping the
samples, the sample need to be carefully aligned in the testing apparatus with the uniaxial tensile
loading direction conforming to the predominant fiber orientation. Finally, specimens were in a
lax state for 15 minutes and conditioned for 30 cycles of L1 strain. Then, after maintained in a lax
state for an additional 45 minutes, the samples were conditioned for another 30 cycles of L1 strain,
thus giving seven loading segments like shown in figure 3. Overall, this article demonstrates the
hypnosis that cumulative injury such as repeated subfailure strain of IGHL will lead to irreversible
damage.
Figure 3 Testing protocol [22]
Finally, based on the based on the previous studies of the glenohumeral ligament, it is easy
to find that there are still some gaps in the current research. For example, there is a need to study
the mechanical properties of small tissue samples from different regions of the rotator cuff.

13
Therefore, in my study, the goal is to investigate materials and methods for testing small tissue
samples.

14
3.0 Methods
Test machine and clamps
This study is designed to use the DMA Q800 testing machine (DMA, Q800, TA
Instruments) (Figure 5) which is a dynamic mechanical analyzer that induces either oscillatory
deformation, oscillatory force, static deformation or static force to produce a stress response of the
materials. In a tensile test, the sample are to be placed between a fixed clamp and a movable clamp
while a measured force is applied in by a displacement of the moving clamp. An optical encoder
is used to measure the clamp displacement which has a maximum value of 25 mm. According to
the DMA theory, optical encoders provide 1 nanometer resolution of displacement which based
on the diffraction patterns of light which shows in figure below. Some of necessary equations used
here are the definition of strain and stress and the simplest of stress/strain law , Hooke’s law, which
is shown below. In these equations, ΔL and A are the change length of the gauge length and cross-
sectional area of gauge area, respectively, rather than the total displacement of the cross-head
which may include specimen slip. By St. Venant’s Principle, which means when far enough away
from the load's point of application, it can be assume the stress is uniform for equivalent loads,
only the gauge length area needs to be analyzed. Thus, it is only necessary to determine the
elongation of gauge length. Finally, the applied force and deflection can be translated into strain-
stress curve which can extract a variety of tensile properties[23]-[24].

15
Figure 4 Structure of DMA Q800[25]
𝜀𝜀𝑥𝑥 = 𝛥𝛥𝛥𝛥
𝐿𝐿 (1)
𝜎𝜎𝑥𝑥 = 𝐹𝐹𝐴𝐴 (2)
𝜎𝜎𝑥𝑥 =E 𝜀𝜀𝑥𝑥 (3)
εx——strain in the x direction
ΔL——displacement
𝜎𝜎𝑥𝑥——stress in the x direction
A ——cross-section area
E ——elasticity modulus

16
The DMA Q800 has many types of fixtures which can allow different loading such as
dual/single cantilever, 3-point bending, shear sandwich, compression, tension, and submersible
clamps. One of the goals of this study was to design a set of clamps that could be used for tensile
testing. However, the clamp should be designed for the testing of small tissue samples. The
dimension of custom-designed tension clamp is shown in figure 5 and the finished clamp is shown
in figure 8. The round washer attached to the movable clamp are used to connect the movable grip
with the movable bar support and the total travel length is 25 mm. The vital thing that during the
design is concerning the distance between the movable grip and stationary grip which related to
the length of the specimen and the travel length of the movable support. The specific designed
clamp dimensions are shown in figure 6 which is fixed clamp and figure 7 which is movable clamp.
Figure 5 Dimension of mounted clamp in machine
17
Figure 6 Fixed clamp
Figure 7 Movable clamp

18
Figure 8 Tension clamp
Test specimen geometry
Many reasons can lead to sample buckling during tension testing such as non-uniform
loading or non-axial loading. If the sample buckles or is non-uniformly strained during loading,
this will lead to errors in the measurement of properties. To prevent this, it is necessary to use a
specimen shape which will have a region of uniform tension. For this reason, most tensile specimen
shapes use an hourglass shape, sometimes known as a dog bone, with a standardized geometry.
While there are standardized shapes are for larger specimens, however, this study wanted to use
the smallest possible specimen, so part of this study was to design specimen test geometry and
fabricate a die to cut this shape.

19
In designing a specimen shape for this study, the first thing is to review current standardized
shapes. The most common of the mechanical tests is tensile test and is described in detail in many
standards. A dog bone or dumbbell type specimen is machined or punched out and the specimen
can be made from a sheet or plate of metal or plastic. The American Society for Testing and
Materials (ASTM) and the International Organization for Standardization (ISO) have some
different standards for tensile specimens and these will be reviewed. The most significant
differences between each standard are applicable materials and standard dimensions and most have
nearly the same shape - a dumbbell shape. This geometry allows the specimen to be gripped and
loaded without failure in the gripping region, while having deformation and failure confined to a
narrow central gauge section [26]. These different grips will be compared in selecting geometry
for the shape of the small test specimen.
The ASTM D638 geometry [27], which is mainly used to test the tensile properties of
plastic materials, is applicable for test samples of any thickness up to 14 mm and no less than 1
mm. There are five sizes of the geometry that used for different thicknesses. Because the desired
specimen size is small, type 5 (figure 9) and type 4 (figure 10), which are used for thin plastic
materials, will be considered. However, a short coming of this model is that the test region is short
when compared with the grip section and thus the relative specimen length is large. Table 1 and
table 2 in appendix A show the dimension of this standard.

20
Figure 9 Type 5 of ASTM A638
Figure 10 Type 4 of ASTM A638
The dimensions of specimens ASTM A370[28] and ASTM E8[29] are very close. E8/E8M
and A370 are primarily used for metallic materials and steels. In this model, the cross-sectional
area at the center of the sample is the smallest to ensure that fracture occurs within the gauge
length. The shape of this model is given in figure 11 and has a long grip area so that the overall
specimen length is relatively long. This is a disadvantage to having a small specimen size as
desired for this study. Table 1 summarizes the dimensions of some of the standard test specimen
geometries and table 3 in appendix A has gathered the full dimension of each standard.

21
Figure 11 ASTM E8
ISO 527[30] is another standard that gives tensile sample geometry (Figure 12). This
geometry is typically used for rigid and semi-rigid thermoplastics moldings, extrusion and cast
materials. Because of the small grip region, the relative length of the geometry is smaller and
therefore may be suitable for small tissue samples. The dimension can be seen in table 1 and
appendix table 4.
Figure 12 ISO 527
There many other standards that specify dimensions of tensile samples. Some of these are
ISO 37 which is applicable for rubber, vulcanized or thermoplastic, ASTM D412 for vulcanized
rubber and thermoplastic elastomers and other additional standard tests used for film like ASTM
D88-10, JIS K7172 and others. Since it is desired to have a small soft tissue, the standard geometry
will be scaled down to widths of 1 mm, 2 mm and 3 mm which shows in appendix A. Appendix

22
A shows the E8, ISO 527 and D638 standards suggested sizes after scaling down. The part of
compared table 1 and the cutting die which made by additive manufacturing machine are showing
in figure 13. In this study, the shape of the specimen were based on ISO 527 because the gauge
section is long enough to analysis and grip section is large enough to avoid slippery with the
friction of sandpaper. Additionally, when comparing 1 mm, 2 mm, and 3 mm width of ISO 527
shape, it is suitable for experiment to adopt 1 mm width because of the small geometry of
glenohumeral ligament.
Table 1 The dimensions of different tensile specimen geometry
E8/E8M ISO 527
D638 type 5 type 4
G-gauge length 4.17 5.00 2.40 G-gauge length 4.17 W-width 1.00 1.00 1.00 W-width 1.00 R-radius of fillet 1.00 6.00 3.99 R-radius of fillet 2.33 L-overall length 16.67 15.00 19.97 L-overall length 19.17 A-length of reduced parallel section
5.33 6.00 3.00 A-length of reduced parallel section
5.50
B-length of grip section 5.00 1.70 5.99 B-length of grip
section 4.17
C-width of grip section 1.67 2.00 3.00 C-width of grip
section 3.17
RO-outer radius 4.17
Figure 13 Cutting die

23
Sample preparation
Chicken skin and leg tendon were used to test the performance of the punch. During cutting
the samples, the punch is used to cut the chicken skin and tendon in order to prepare the tensile
strip. However, when consider the multilayer of the skin and the viscoelasticity of the tendon, it
was difficult to cut the sample only with the use of the punch. Thus, a shape precision knife and
blades are important auxiliary means. The punch was first been put down on the tissue to leave an
outline of the tensile strip shape and then the knife was cutting along with the outline. The cut
tissue samples are shown in figure 14 and 15.
Figure 14 Sample cut from chicken tendon
Figure 15 Samples cut from chicken skin

24
4.0 Finite element analysis
Finite element analysis is a widely used numerical method which can solved complex
structure problems accurately. It divides a complex structure into many smaller pieces that can be
solved easier and finally obtain the overall solution.
The two-dimensional model of the designed tensile sample geometry, with the dimensions
given in table 1 -- ISO 527, which is the same like the punch and the specimen shape, is shown in
figure 14. In this case, the material is a linear elastic isotropic solid and the Poisson’s ratio and
elasticity modulus are 0.49 and 3×10^4 psi, respectively, and the length of each element edge is
0.1. The displacement of the top griped section is zero in x-direction and y-direction. However,
the displacement of the bottom gripped section is zero in x-direction and has a 5% elongation of
the total length which is 0.75 mm in y-direction. For simulating the real experiment, there are must
some area which have been gripped. Thus, it is assumed that the clamps have gripped half of the
grip area without any slippage during elongation and the boundary conditions and the material
properties are the same. The finite element model of the specimen is shown in figure 16.

25
Figure 16 Finite element model of the specimen

26
5.0 Results
After setting the boundary conditions, the deformed shape shows in figure 17 and the black
dotted line in this figure is undeformed shape edge. It is obvious that the model has been stretching.
Figure 17 Finite element result showing the deformed shape with undeformed edge

27
Contour plot of finite element analysis
The figures shows below are stress distributions for σxx, σyy and shear stress. All the figures
are nodal solution which is more precise than the element solution. It can be easily seen that the
stress distributions in gauge length area are nearly become uniform in all direction because of the
Saint Venant's Principle which means the external force only influence the stress distribution near
the force area. Like the problem in this model, the gauge area is far enough from the gripped area
which is also applied force in y-direction. Thus, the maximum stress σyy occurred at the gripped
area and the stress becomes uniform when getting far from the gripped area. The stress distribution
of σxx is small because we only applied the force in y-direction. Additionally, all of the loads are
vertical to the bottom surface. Thus, in this situation, the normal stress is much larger and more
significant in analyzing the solid instead of shear stress. Thus, we only need to consider the normal
stress which means σxx and σyy, especially σyy.
Figure 18 σxx distribution

28
Figure 19 σyy distribution
Figure 20 σxy distribution
29
Path plot of finite element analysis
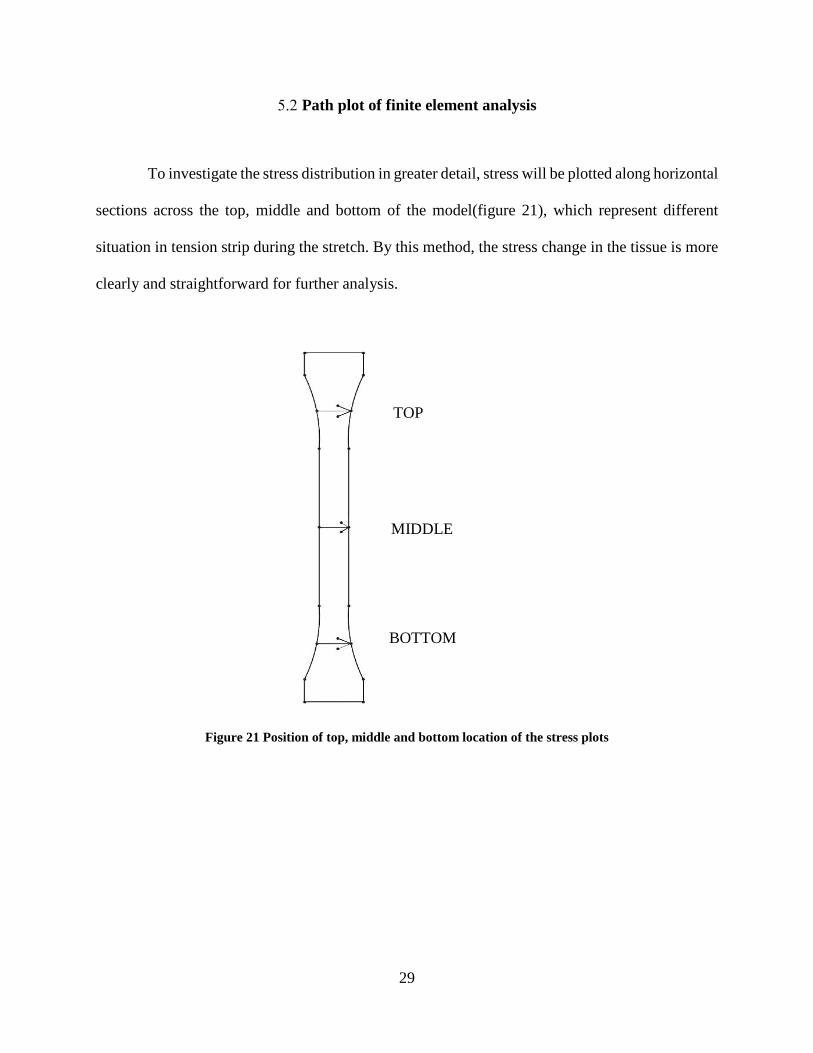
To investigate the stress distribution in greater detail, stress will be plotted along horizontal
sections across the top, middle and bottom of the model(figure 21), which represent different
situation in tension strip during the stretch. By this method, the stress change in the tissue is more
clearly and straightforward for further analysis.
Figure 21 Position of top, middle and bottom location of the stress plots
BOTTOM
MIDDLE
TOP

30
5.2.1 Stress path plot of σxx
From the figures showed above, two cases are nearly the same no matter the trend and the
data, and the trends agree with the trend in contour plot. However, the path plot of the middle of
the tissue is different from the contour plot which is uniform. There are three reasons. First, after
looking carefully of the data in the diagram, the differences of maximum value and minimum value
in in figure 23 are small when compared with the differences in figure 22 and 24. Second, the
gauge length is not long enough for the stress to become uniform.in Saint Venant’s principle, an
important condition is the distance is long enough away from the force area. And finally, the
direction of the applied force is different with x-direction.
Figure 22 Top path of σxx
31
Figure 23 Middle path of σxx
Figure 24 Bottom path of σxx

32
5.2.2 Stress path plot of σyy
Figure 25 Top path of σyy
Figure 26 Middle path of σyy
33
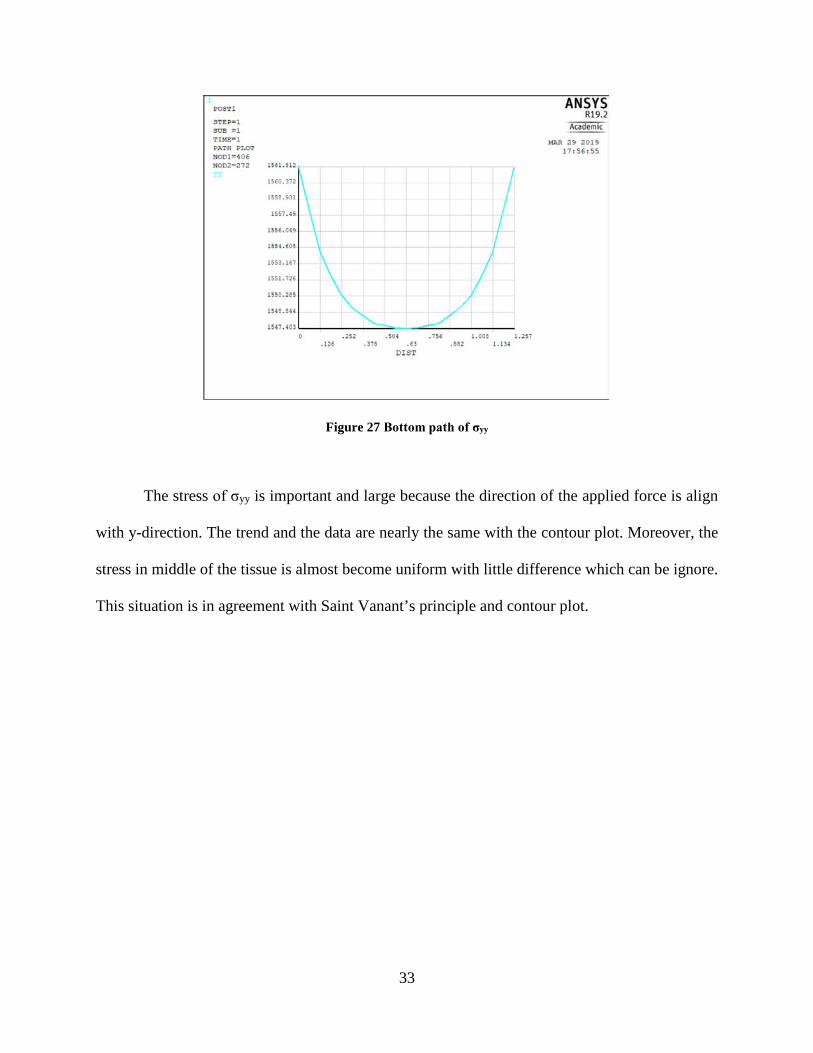
Figure 27 Bottom path of σyy
The stress of σyy is important and large because the direction of the applied force is align
with y-direction. The trend and the data are nearly the same with the contour plot. Moreover, the
stress in middle of the tissue is almost become uniform with little difference which can be ignore.
This situation is in agreement with Saint Vanant’s principle and contour plot.
34
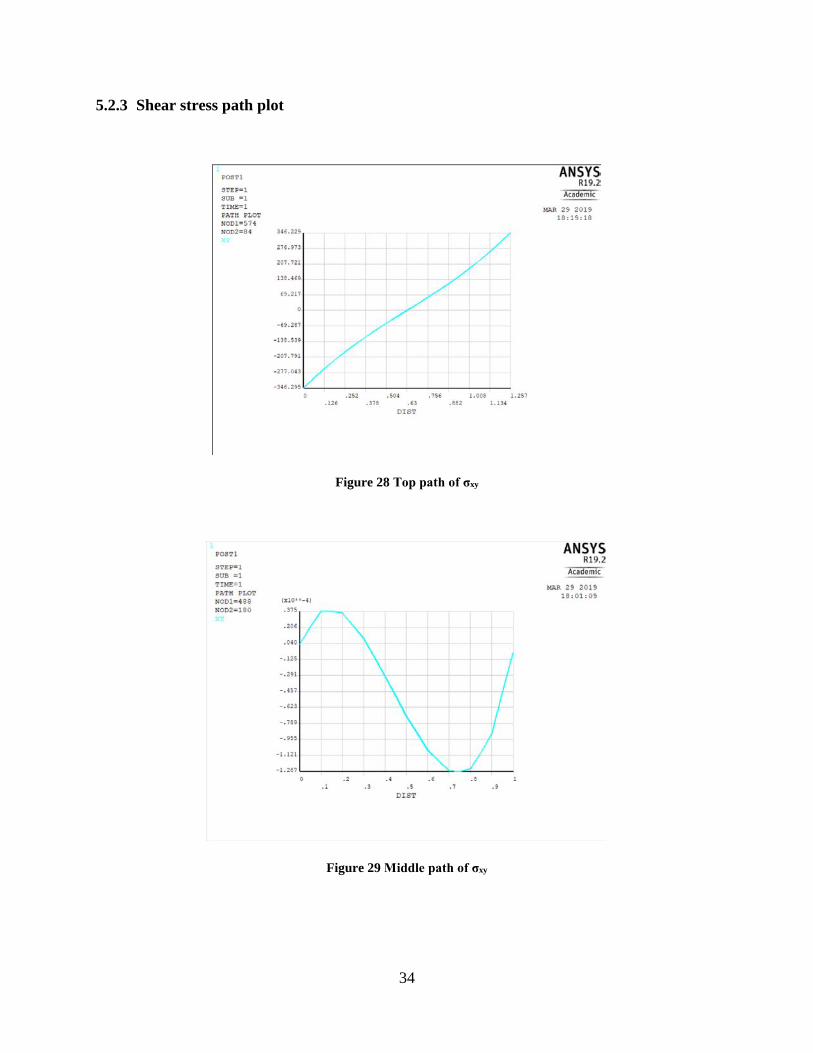
5.2.3 Shear stress path plot
Figure 28 Top path of σxy
Figure 29 Middle path of σxy

35
Figure 30 Bottom path of σxy
The shear stress in the middle section (figure 29) is very small and skew symmetric which
can be ignore. This data proves that the shear stress in this situation is less significant. In other
figures which near the grip section, the shear stress is large. Additionally, from what can be seeing
above, figure 28 and 30 is also skew symmetric, so as to figure 29. Therefore, the shear stress in
the tissue is nearly skew symmetric which is the same as what can be seen in the contour plot.

36
6.0 Discussion
The stress analysis for the glenohumeral ligament in shoulder joint was explored using
finite element analysis and the specimen was cutting from the shoulder joint by adopt a standard
custom-made punch. Additionally, a custom-made clamp was also been designed for further
experiment.
During cutting samples, the main issue and the initial difficulty came from the fact that it
was skin that being punched out first. Because the multilayer of the skin, it is difficult to cut a
precise standard size of the tension trip. Thus, we tried on the tendon and ligament which is much
easier to punched out. Even still, the samples from both skin or ligament is turned out to be shapely
enough to be test with the help of a more precision knife. Going forward, the punch method will
work well.
Therefore, An axisymmetric finite element model of the glenohumeral ligament strip was
constructed in terms of the known geometries and material properties. The properties of the tissue
were chosen to be linear elastic based on properties available in the literature. The results in chapter
5 proves that the ISO 527 standard geometry can be used in the further experiment. Additionally,
the dumbbell shape of tension strip is necessary for the experiment because this shape decrease
the influence of slippery, shape and the unequal force applied on the tissue.
Finally, because of the lack of the materials constants, one limitation of the model is the
linear elastic properties used for the tissue. Experimental characterizations of the material
constants for the glenohumeral ligament would be very advantageous in using finite element
analysis, and moreover, can prove the results of the finite element analysis.

37
Appendix A Dimensions of each standards
When design the clamps, many standard was taken into account and scale down with 1
mm, 2 mm and 3 mm width of gauge length. The dimensions were shown in table 2 to 5.
Table 2 Different sizes of E8/E8M geometry
E8/E8M(mm) G-gauge length 4.17 8.33 12.50 W-width 1.00 2.00 3.00 R-radius of fillet 1.00 2.00 3.00 L-overall length 16.67 33.33 50.00 A-length of reduced parallel section 5.33 10.67 16.00 B-length of grip section 5.00 10.00 15.00 C-width of grip section 1.67 3.33 5.00
Table 3 Different sizes of ISO 527 geometry
ISO 527-2(mm) G-gauge length 5.00 10.00 15.00 W-width 1.00 2.00 3.00 R-radius of fillet 6.00 12.00 18.00 L-overall length 15.00 30.00 45.00 A-length of reduced parallel section 6.00 12.00 18.00 B-length of grip section 1.70 3.40 5.10 C-width of grip section 2.00 4.00 6.00

38
Table 4 Different sizes of D638 type 5 geometry
D638(mm)
type 5
G-gauge length 2.40 4.79 7.19
W-width 1.00 2.00 3.00
R-radius of fillet 3.99 7.99 11.98
L-overall length 19.97 39.94 59.91
A-length of reduced parallel section 3.00 5.99 8.99
B-length of grip section 5.99 11.98 17.97
C-width of grip section 3.00 5.99 8.99
Table 5 Different sizes of D638 type 4 geometry
type 4
G-gauge length 4.17 8.33 12.50
W-width 1.00 2.00 3.00
R-radius of fillet 2.33 4.67 7.00
L-overall length 19.17 38.33 57.50
A-length of reduced parallel section 5.50 11.00 16.50
B-length of grip section 4.17 8.33 12.50
C-width of grip section 3.17 6.33 9.50
RO-outer radius 4.17 8.33 12.50

39
Bibliography
[1] M.M. Verver, J. van Hoof, C.W.J. Oomens, J.S.H.M. Wismans & F.P.T. Baaijens (2004) A Finite Element Model of the Human Buttocks for Prediction of Seat Pressure Distributions, Computer Methods in Biomechanics and Biomedical Engineering, 7:4, 193-203, DOI: 10.1080/10255840410001727832
[2] M. Komljenović, Mechanical strength and Young's modulus of alkali-activated cement-based binders, Editor(s): F. Pacheco-Torgal, J.A. Labrincha, C. Leonelli, A. Palomo, P. Chindaprasirt, Handbook of Alkali-Activated Cements, Mortars and Concretes, Woodhead Publishing, 2015, Pages 171-215, ISBN 9781782422761,
[3] Chan BP, Leong KW. Scaffolding in tissue engineering: general approaches and tissue-specific considerations. Eur Spine J. 2008;17:467–479.
[4] Nimeskern L, van Osch GJ, Müller R, Stok KS. Quantitative evaluation of mechanical properties in tissue-engineered auricular cartilage. Tissue Eng Part B Rev. 2014;20:17–27.
[5] Ní Annaidh A, Bruyère K, Destrade M, Gilchrist MD, Otténio M. Characterization of the anisotropic mechanical properties of excised human skin. J Mech Behav Biomed Mater. 2012;5:139–148.
[6] Ottenio M, Tran D, Ní Annaidh A, Gilchrist MD, Bruyère K. Strain rate and anisotropy effects on the tensile failure characteristics of human skin. J Mech Behav Biomed Mater. 2015;41:241–250.
[7] Hussain SH, Limthongkul B, Humphreys TR. The biomechanical properties of the skin. Dermatol Surg. 2013;39:193–203.
[8] Joel R. Palko, Xueliang Pan, Jun Liu, Dynamic testing of regional viscoelastic behavior of canine sclera, Experimental Eye Research, Volume 93, Issue 6, 2011, Pages 825-832, ISSN 0014-4835.
[9] Iman Z. Oskui, Ata Hashemi, Dynamic tensile properties of bovine periodontal ligament: A nonlinear viscoelastic model, Journal of Biomechanics, Volume 49, Issue 5, 2016, Pages 756-764, ISSN 0021-9290.
[10] Gutierrez-Lemini, D., 2014. Engineering viscoelasticity. Springer, New York, pp. 93-112
[11] Zhang, X., Gan, R.Z., 2014. Dynamic properties of human stapedial annular ligament measured with frequency-temperature superposition. J. Biomecha. Eng. 136, 081004
40
[12] Myers KM, Socrate S, Paskaleva A, House M. A Study of the Anisotropy and Tension/Compression Behavior of Human Cervical Tissue. ASME. J Biomech Eng. 2010;132(2):021003-021003-15. doi:10.1115/1.3197847.
[13] Myers, K. M., Socrate, S., Tzeranis, D., and House, M. D., 2009, “Changes in the Biochemical Constituents and Morphologic Appearance of the Human Cervical Stroma During Pregnancy,” Eur. J. Obstet. Gynecol. Reprod. Biol., 144, pp. S82–S89.
[14] Boyce, B. L. , Jones, R. E. , Nguyen, T. D. , & Grazier, J. M. . (2007). Stress-controlled viscoelastic tensile response of bovine cornea. Journal of Biomechanics, 40(11), 2367-2376.,
[15] Huang, C. Y. , Wang, V. M. , Flatow, E. L. , & Mow, V. C. . (2009). Temperature-dependent viscoelastic properties of the human supraspinatus tendon. Journal of Biomechanics, 42(4), 546-549.
[16] Akizuki, S., mow., Muller, F., Pita, J.C., Howell, D.S., manicourt, D.H., 1986. Tensile properties of knee joint cartilage. I. influence of ionic conditions, weight bearing and fibrillation on the tensile modulus. Journal of Orthopaedic Reseach 4, 379-392.
[17] Bonifasilista, C. , Lake, S. P. , Small, M. S. , & Weiss, J. A. . (2010). Viscoelastic properties of the human medial collateral ligament under longitudinal, transverse and shear loading. Journal of Orthopaedic Research, 23(1), 67-76.
[18] https://teachmeanatomy.info/upper-limb/joints/shoulder/
[19] Bigliani, L. U. , Pollock, R. G. , Soslowsky, L. J. , Flatow, E. L. , Pawluk, R. J. , & Mow, V. C. . (1992). Tensile properties of the inferior glenohumeral ligament. Journal of Orthopaedic Research, 10(2), 187-197.
[20] Ticker, J. B. , Bigliani, L. U. , Soslowsky, L. J. , Pawluk, R. J. , Flatow, E. L. , & Mow, V. C. . (1996). Inferior glenohumeral ligament: geometric and strain-rate dependent properties *. J Shoulder Elbow Surg, 5(4), 269-279.
[21] Lee, T. Q. , Dettling, J. , Sandusky, M. D. , & Mcmahon, P. J. . (1999). Age related biomechanical properties of the glenoid-anterior band of the inferior glenohumeral ligament-humerus complex. Clinical Biomechanics, 14(7), 471-476.
[22] Pollock, R. G. , Wang, V. M. , Bucchieri, J. S. , Cohen, N. P. , Huang, C. Y. , & Pawluk, R. J. , et al. (2000). Effects of repetitive subfailure strains on the mechanical behavior of the inferior glenohumeral ligament. Journal of Shoulder & Elbow Surgery, 9(5), 427-435.
[23] McKeen, & Laurence, W. . (2014). The effect of long term thermal exposure on plastics and elastomers || introduction to the physical, mechanical, and thermal properties of plastics and elastomers. 43-71.
[24] Mckeen, L. W. . (2014). 1 – introduction to plastics, polymers, and their properties. Effect of Temperature & Other Factors on Plastics & Elastomers, 1-45.

41
[25] http://www.tainstruments.com.cn/q800/ The brochure of DMA Q800
[26] Spiegelberg, S. . (2009). Characterization of physical, chemical, and mechanical properties of uhmwpe-chapter 12. Uhmwpe Handbook, 355-368.
[27] Standard Test Method for Tensile Properties of Plastics. ASTM international, ASTM D638-14. ASTM international, 100 Barr Harbour Dr. P.O. box C-700 West Conshohocken, Pennsylvania United States.
[28] Standard Test Methods and Definitions for Mechanical Testing of Steel Products. ASTM international, A370-17a. ASTM international, 100 Barr Harbour Dr. P.O. box C-700 West Conshohocken, Pennsylvania United States.
[29] Standard Test Methods for Tension Testing of Metallic Materials. ASTM international, ASTM E8/E8M-16a. ASTM international, 100 Barr Harbour Dr. P.O. box C-700 West Conshohocken, Pennsylvania United States.
[30] ISO 572. Textile machinery and accessories -- Shuttles for pirn changing automatic looms – Dimensions. 1976
![Pre-Heat Treatment of Gas Atomized Al 2024 Powder and its ...m044wp804/fulltext.pdfStandard ASTM E8/E8M-16a tensile specimen geometry [2][4] . All dimensions are in inches..... 25](https://img.pdfslide.net/doc/110x75/5fdddccbb487030dbd6da616/pre-heat-treatment-of-gas-atomized-al-2024-powder-and-its-m044wp804fulltextpdf.jpg)