Embed Size (px)
Citation preview

Title: Prediction of Pneumonia 30-Day Readmissions: A Single-Center Attempt to Increase
Model Performance.
Author List: Jeffrey F. Mather, MS; Gilbert J. Fortunato, MBA; Jenifer L. Ash, APRN, MPH;
Michael J. Davis, MBA, Ajay Kumar, MD, MRCP, FACP, SFHM.
Institutional Affiliation: From the Department of Research Administration, Data Management:
Mr. Mather and Mr. Fortunato; Nursing Administration: Ms. Ash and Mr. Davis; and from the
Division of Hospital Medicine, Dr. Kumar, Hartford Hospital, Hartford, Connecticut.
Location of Study: Hartford Hospital
Funding Support: None
Corresponding To: Jeffrey F. Mather, 80 Seymour Street, Department of Research
Administration, Hartford, Connecticut, 06106. E-mail: [email protected].
Conflicts of Interest: None for any of the authors listed.
RESPIRATORY CARE Paper in Press. Published on August 13, 2013 as DOI: 10.4187/respcare.02563
Epub ahead of print papers have been peer-reviewed and accepted for publication but are posted before being copy edited and proofread, and as a result, may differ substantially when published in final version in the online and print editions of RESPIRATORY CARE.
Copyright (C) 2013 Daedalus Enterprises

Abstract
Background: Existing models developed to predict 30 days readmissions for pneumonia lack discriminative ability. This study is an attempt to increase model performance with the addition of variables found of benefit in other studies.
Methods: From 133,368 admissions to a tertiary-care hospital from Jan 2009 to March 2012, the study cohort consisted of 956 index admissions for pneumonia using the CMS definition. We collected variables previously reported to be associated with 30-day all-cause readmission, including vital signs, comorbidities, laboratory values, demographics, socio-economic indicators, and indicators of hospital utilization. Separate logistic regression models were developed to identify the predictors of all-cause hospital readmission 30 days after discharge from the index pneumonia admission for pneumonia-related readmissions, and for pneumonia-unrelated readmissions.
Result: Of the 965 index admissions for pneumonia, 148 (15.5%) patients were readmitted within 30 days. Variables in the multivariate-model significantly associated with 30-day all cause readmission include male gender (odds ratio (OR)=1.59, 95% confidence interval(CI) = 1.03-2.45), 3 or more previous admissions (OR=1.84, 95% CI = 1.22-2.78), chronic lung disease (OR=1.63, 95% CI = 1.07-2.48), cancer (OR=2.18, 95% CI = 1.24-3.84), median income <= $43,000 (OR=1.82, 95% CI = 1.18-2.81), history of anxiety or depression (OR=1.62, 95% CI = 1.04-2.52) and hematocrit < 30% (OR=1.86, 95% CI = 1.07-3.22). The model performance as measured by the c-statistic was 0.71 (0.66-0.75), with minimal optimism according to bootstrap re-sampling (optimism corrected c-statistic = 0.67).
Conclusions: The addition of variables to measure socio-economic status (SES), health-care utilization significantly improved model performance when compared to the model using CMS variables alone.
RESPIRATORY CARE Paper in Press. Published on August 13, 2013 as DOI: 10.4187/respcare.02563
Epub ahead of print papers have been peer-reviewed and accepted for publication but are posted before being copy edited and proofread, and as a result, may differ substantially when published in final version in the online and print editions of RESPIRATORY CARE.
Copyright (C) 2013 Daedalus Enterprises

Introduction
Reduction in pneumonia related readmission has been identified as a marker for quality care.
CMS Readmission Reduction Program1 has challenged hospital and health care delivery model
in US to uncover novel ways to reduce readmission rates and maximize reimbursement by the
CMS. Over 2,000 hospitals have been levied penalties varying from 0.01% to 1% of their
Medicare revenue in fiscal year 2013 for subpar readmission rates for heart failure, pneumonia,
and heart attack, totaling approximately $280 million in penalties paid back to Medicare. With a
substantial increase in the level of penalties in the next two years to 2 percent in fiscal year
2014 and to 3% in fiscal year 2015, it becomes readily apparent why there is added incentive to
develop predictive algorithms to define which patients are at highest risk for readmission.
Despite this need to identify patients at risk for readmission, the applicability of available models
is circumspect. A recent systematic review 2 of 26 models uncovered the following: most
models perform poorly, including the 3 CMS models (pneumonia, heart failure and myocardial
infarction); only one clinical model successfully met the goals set forth for clinical application
and had what is considered acceptable discriminative ability when detecting readmission for
heart failure3; the successful addition of social or functional variables offer opportunities for
improvement in model performance4, 5.
There are few readmission models centered on Pneumonia 30 day readmissions 6-12 and only a
few reported on discriminative ability 6, 11, 12. In this single-center, retrospective analysis, our
intention is to leverage variables shown to be significant in previously reported predictive
models and supplement the CMS medical record model6 with additional variables shown to be
of benefit in other models in an effort to produce a model that could by potentially used to
identify patients at high-risk for readmission pre-discharge.
RESPIRATORY CARE Paper in Press. Published on August 13, 2013 as DOI: 10.4187/respcare.02563
Epub ahead of print papers have been peer-reviewed and accepted for publication but are posted before being copy edited and proofread, and as a result, may differ substantially when published in final version in the online and print editions of RESPIRATORY CARE.
Copyright (C) 2013 Daedalus Enterprises

Materials and Methods:
Setting and Design
This retrospective, observational study was carried out at Hartford Hospital, an 800-bed
teaching hospital in Hartford Connecticut. The Hartford Hospital Institutional Review Board for
(Assurance #FWA000000601) approved the study and certified that it met the criteria for a
waiver of the requirement to obtain informed consent.
Study Sample
The patient population used in this analysis was derived from an electronic database collected
at Hartford Hospital.
The CMS definition6, 12 for inclusion in the study cohort for index admissions for Pneumonia:
Briefly, Medicare patients (enrolled in fee-for-service Medicare Parts A and B) who were
admitted to Hartford Hospital from January 2009 to March 2012 with principal diagnosis of
pneumonia (International Classification of Diseases, 9th Revision, Clinical Modification codes
480.XX, 481, 482.XX, 483.X, 485, 486, 487.0) as potential index pneumonia admissions.
Patients less than 65 year of age, who died in the hospital, were transferred to another acute
care facility, or where data was incomplete, were excluded. In addition, if a patient was
admitted more than once over a 30 day period, only the first admission was counted as an index
admission.
Outcomes
The primary outcome was 30-day all-cause readmission12. Hospital administrative data sources
were used to assess readmissions. A pneumonia-related readmission was defined using the
CMS 13, 14 definitions as follows: 1. pneumonia (480.XX, 481, 482.XX, 483.X, 485, 486, 487.0) as
a primary diagnosis regardless of secondary diagnosis, or 2. septicemia (038.0-038.99) or
RESPIRATORY CARE Paper in Press. Published on August 13, 2013 as DOI: 10.4187/respcare.02563
Epub ahead of print papers have been peer-reviewed and accepted for publication but are posted before being copy edited and proofread, and as a result, may differ substantially when published in final version in the online and print editions of RESPIRATORY CARE.
Copyright (C) 2013 Daedalus Enterprises

respiratory failure (518.81 or 518.84) as a primary diagnosis with a secondary diagnosis of
pneumonia.
Variable Selection
The selection of candidate variables was based on the CMS-developed Hierarchical Condition
Category (HCC) clinical classification system selection algorithm as described6 and used the 35
variables in the final CMS medical record model. Twenty six of the CMS variables are listed in
Table 2 (see column CMS). The nine remaining variables were defined as missing (yes/No) for
the following: sodium, glucose, hematocrit, Creatinine, WBC, BUN, heart rate, systolic blood
pressure, and respiratory rate. Briefly, using the HCC algorithm, the >15,000 ICD-9 diagnosis
codes are mapped to one of 189 clinically coherent condition categories (CCs). Of the 189, 35
were selected as potentially related to readmission outcome based on: 1) review of a list of
variables used for validating the National Quality Forum approved pneumonia mortality
measure; 2) reviewing a list of variables from the National Pneumonia Project set; and 3),
variables chosen based on a systematic review of the literature. For each patient, the presence
of the condition was assessed from the secondary diagnosis at the index admission.
The laboratory and vital signs were extracted from the hospital electronic health record,
where the first value after admission was used. Age, gender, diagnosis, readmission from a
skilled nursing facility (SNF), marital status, prior admission, and length of stay (LOS) were
extracted from administrative registries.
Additional variables used, not present in the CMS model, included: marital status, LOS,
anxiety/depression (as coded by the CCs as described previously), the number of
hospitalizations prior to the index admission was used as a measure of health care utilization,
and defined as: a cutoff of 3 or more hospitalizations, 3 years prior to the index admission for
RESPIRATORY CARE Paper in Press. Published on August 13, 2013 as DOI: 10.4187/respcare.02563
Epub ahead of print papers have been peer-reviewed and accepted for publication but are posted before being copy edited and proofread, and as a result, may differ substantially when published in final version in the online and print editions of RESPIRATORY CARE.
Copyright (C) 2013 Daedalus Enterprises

pneumonia, Year 2000 Census data15 was used to obtain data on median household income for
Connecticut zip codes and used as a measure of socio-economic status.
Statistical Analysis
Descriptive statistics included frequency tables, mean, SDs, and median. The chi-square test
was used to compare categorical variables and the Student t test or nonparametric Wilcoxon
test were used for continuous variables in univariate analysis. When converting continuous
data to binary variables (Number of visits prior to the index visit, Median Income), we used a
receiver operating curve (ROC) to estimate the optimum combination of sensitivity and
specificity to arrive at an endpoint16. Differences between AUC’s were detected as described17
We used multivariate logistic regression analyses to identify baseline patient characteristics that
were independently associated with all-cause 30-day readmission. All predictors that were
statistically significant at P<0.15 in univariate analysis were entered logistic regression model.
We repeated the logistic regression procedure as described in separate models using: 1. only
significant CMS medical record model6 variables with an endpoint of all-cause 30-day
readmission, 2. All significant univariate predictors with pneumonia-related 30-day readmissions
as the outcome variable, and 3. All significant univariate predictors with pneumonia-unrelated
30-day readmissions as the outcome variable.
The predictive accuracy of the multivariate models was determined by calculating the area
under the receiver operating curve (ROC or c-statistic) 17, and calculated observed readmission
rates in the lowest and highest deciles on the basis of predicted readmission probabilities. The
method as described by Hanley and McNeil17 was used to test for significant differences
between ROC’s. Overall model performance was measured using Nagelkerke’s R2, a measure
of explained variance 18 and the Hosmer–Lemeshow19 test.
RESPIRATORY CARE Paper in Press. Published on August 13, 2013 as DOI: 10.4187/respcare.02563
Epub ahead of print papers have been peer-reviewed and accepted for publication but are posted before being copy edited and proofread, and as a result, may differ substantially when published in final version in the online and print editions of RESPIRATORY CARE.
Copyright (C) 2013 Daedalus Enterprises

In order to ensure that the model’s predictions are generalizable, it is important to evaluate the
performance of the model more realistically than simply by calculating its accuracy on the
training sample.
To do this, we used bootstrapping as an internal validation technique.20 Briefly, this method
involves drawing repeated samples from the original sample with some randomly excluded,
others included more than once, resulting in a bootstrap sample. This procedure was repeated
200 times, resulting in an average c-statistic for the bootstrap sample. This is then subtracted
from the c-statistic developed from the original sample. The result is termed the optimism of the
apparent performance of the model on the training data set. The observed performance is
moderated by subtracting the degree of optimism from the apparent performance. One of the
benefits of bootstrapping is that it allows all of the available patient data to be included in the
data set. It has been shown to estimate model performance more accurately than other
approaches such as those that involve setting aside data for a separate validation sample.
All effects were considered significant at p<0.05. All statistical analyses were performed using
SPSS (SPSS Inc. Released 2007. SPSS for Windows, Version 16.0. Chicago, SPSS Inc.) with
the exception of bootstrapping, where STATA was used (StataCorp. 2009. Stata Statistical
Software: Release 11. College Station, TX: StataCorp LP).
Results
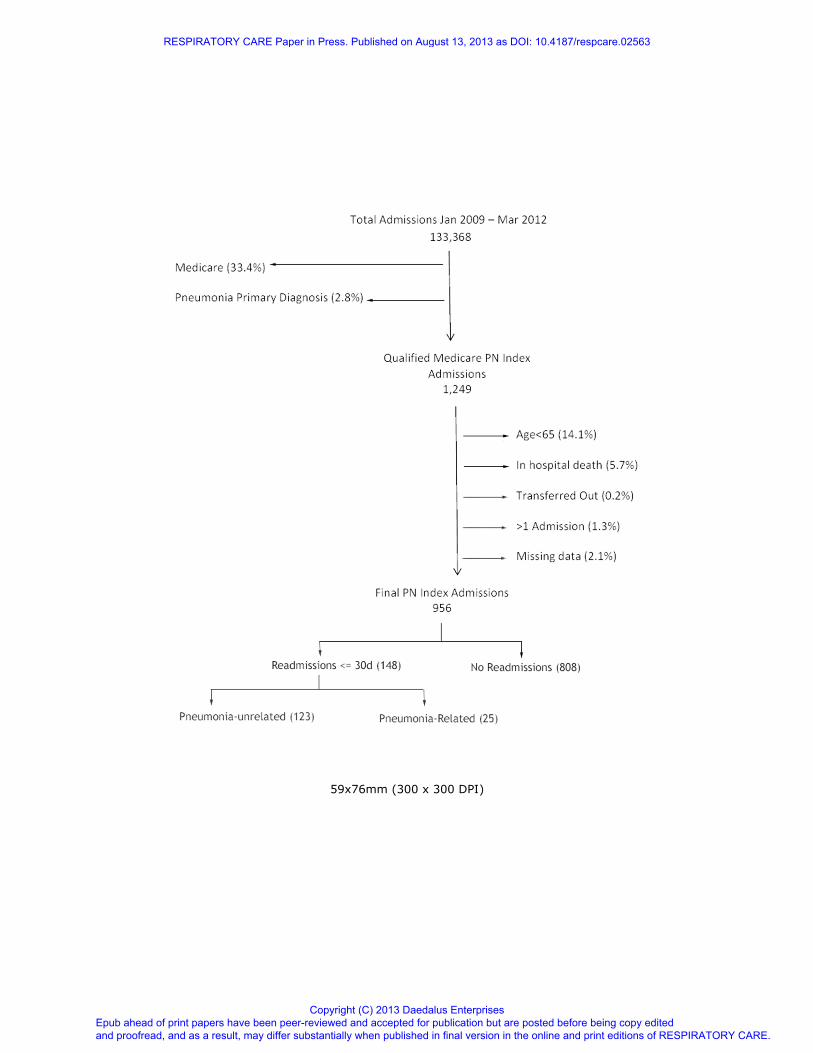
A total of 1,249 inpatients met the CMS inclusion criteria12 for a pneumonia index admission. Of
the 1,249 cases, CMS exclusion criteria eliminated the following: 14.1% < 65 years of age,
5.7% inpatient deaths, 0.2% were transferred to another acute care facility, 1.3% had >1
admission in the 30-day readmission period, and 2.1% were eliminated due to missing data.
This resulted in a final population of 956 (Figure 1), of which 148 were readmitted within 30
days, for an unadjusted readmission rate of 15.5% (Figure 2). As shown, the readmission rate
was uniformly distributed over the 30-day period. Pneumonia-related hospital readmissions
RESPIRATORY CARE Paper in Press. Published on August 13, 2013 as DOI: 10.4187/respcare.02563
Epub ahead of print papers have been peer-reviewed and accepted for publication but are posted before being copy edited and proofread, and as a result, may differ substantially when published in final version in the online and print editions of RESPIRATORY CARE.
Copyright (C) 2013 Daedalus Enterprises
accounted for 16.9 % of total 30 day readmissions (Table 1). Five (20%) of the patients
readmitted for pneumonia related causes died in the hospital and 13 (52%) were transferred to
a skilled nursing facility. The most frequent diagnosis for pneumonia-unrelated readmissions
included food/vomit pneumonitis, congestive heart failure, and cardio-respiratory failure and
shock.
Variables Statistically Associated with All-Cause 30-Day Readmission
Table 2 provides the univariate analysis of all study subjects with comparisons between
readmitted and non-readmitted patients. As shown, there were significant differences in LOS,
discharge to a skilled nursing facility, 3 or more previous admissions, median income <=
$43,000, chronic lung disease, renal disease, cancer, creatinine greater or equal to 2.5 mg/dL,
hematocrit less than 30% and history of anxiety or depression.
When defining readmissions as pneumonia-related (Table 3.), 3 or more previous
admissions, cancer, hematocrit less than 30% and WBC 6-12 showed statistically significant
differences. When the outcome is defined as Pneumonia-unrelated, in accord with all
readmissions, there were significant differences in LOS, 3 or more previous admissions,
median income <= $43,000, chronic lung disease, renal disease, creatinine greater or equal to
2.5 mg/dL and hematocrit less than 30%.
Pneumonia-related readmissions included a higher percent with a history of cancer
(36.0% and 12.2%, p<.01), and a lower percent with heart failure (20.0% and 48.0%, p=.01) and
white blood cell count 6-12 b/µL (28.0% and 54.9%, p=.01), when compared to pneumonia-
unrelated 30-day readmissions.
Multivariate analysis
As shown in Table 4, variables significantly associated with a risk for 30-day all-cause
readmission include male gender, 3 or more previous admissions, chronic lung disease,
RESPIRATORY CARE Paper in Press. Published on August 13, 2013 as DOI: 10.4187/respcare.02563
Epub ahead of print papers have been peer-reviewed and accepted for publication but are posted before being copy edited and proofread, and as a result, may differ substantially when published in final version in the online and print editions of RESPIRATORY CARE.
Copyright (C) 2013 Daedalus Enterprises

cancer, median income <= $43,000, history of anxiety or depression and hematocrit < 30%. In
the logistic regression model using pneumonia-related readmissions as the dependent variable,
factors associated with a higher risk of readmission include 3 or more previous admissions,
cancer, and history of anxiety or depression. The model using pneumonia unrelated
readmissions included median income <= $43,000, 3 or more previous admissions, Chronic
Lung Disease, and Heart rate >=125 as significant risk factors.
Model Performance
As shown in table 5, the logistic regression model showed reasonable discrimination (c-
statistic 0.71 (0.66 – 0.75)). Validation, by means of 300 bootstrap samples resulted in an
optimism-corrected c-statistic of 0.67. The predicted readmission rates ranged from 7.5% in the
lowest to 43.0% in the highest predicted decile and the model was well calibrated as the
Hosmer-Lemeshow goodness of fit statistic was X2 = 5.92, p= 0.656. The model predicting
pneumonia-unrelated readmission gave a Hosmer-Lemeshow goodness of fit statistic of X2 =
2.47, p= 0.963 and demonstrated fair discrimination (c-statistic .68 (0.64 – 0.73)), however, the
models predictive ability was less as the observed readmission rate ranged from 3.3% in the
lowest predicted decile to only 36.6% in the highest. When predicting pneumonia-related
readmission, the model, likewise, was well calibrated with Hosmer-Lemeshow goodness of fit
statistic was X2 = 3.44, p= 0.904. The model demonstrated poor to fair discrimination (c-statistic
0.65 (0.60 – 0.70)), and the models predictive ability was also poor, with the observed
readmission rate ranging from only 9.1% in the lowest predicted decile to only 34.0% in the
highest.
Looking at the relative contribution of each risk factor’s predictive ability in the
multivariable model for all cause 30-day readmissions (Figure 3) we calculate low income and
high hospital utilization account for nearly 40% of the variance in the model.
RESPIRATORY CARE Paper in Press. Published on August 13, 2013 as DOI: 10.4187/respcare.02563
Epub ahead of print papers have been peer-reviewed and accepted for publication but are posted before being copy edited and proofread, and as a result, may differ substantially when published in final version in the online and print editions of RESPIRATORY CARE.
Copyright (C) 2013 Daedalus Enterprises

We compared our model to a model that used only factors used in the CMS medical
record sample (excludes LOS, Marital Status, Health Care Utilization and Socio-economic
status, and a measure of anxiety/depression) and found a significant improvement in the c-
statistic (Figure 4.), 0.71 vs. 0.67, z=2.14, p=0.03.
Discussion:
We present an in-patient 30-day risk-adjusted all-cause readmission model for pneumonia
patients that can be used in performance measurement and quality improvement at a similar
tertiary care hospital. We included 956 patients hospitalized for pneumonia who showed a 30-
day readmission rate of 15.5%. Our model identified seven variables as significant risk factors
for pneumonia 30-day all cause readmissions. Some these factors offer confirmation of
previous findings, and other are newly reported. In addition, three significant risk factors
associated were revealed in the pneumonia-related 30-day readmission model and four risk
factors were associated with pneumonia-unrelated readmissions. The measure of hospital
utilization was significant regardless of the model outcome.
We chose to select baseline variables for univariate analysis from the CMS Medical Record risk
adjusted model for pneumonia readmissions6 as we were using a similar patient population with
identical inclusion/exclusion criteria, were measuring the same outcome, and because of the
robustness of the CMS Medical Record risk dataset (47,429 patients). Despite the size of the
population and the number of variables initially screened for use, the CMS models perform
poorly2, demonstrating that there is substantial variance not accounted for by the CMS models.
The reason for the lack of discrimination becomes clear if you consider the multitude of factors
influencing the likelihood of readmission after hospital discharge.9, 10, 22-24 that are not included in
the CMS model. With the inclusion of some of these variables in our model, we were able to
increase the discriminatory ability of the model significantly over the CMS model.
RESPIRATORY CARE Paper in Press. Published on August 13, 2013 as DOI: 10.4187/respcare.02563
Epub ahead of print papers have been peer-reviewed and accepted for publication but are posted before being copy edited and proofread, and as a result, may differ substantially when published in final version in the online and print editions of RESPIRATORY CARE.
Copyright (C) 2013 Daedalus Enterprises

Our finding of prior health care utilization as a significant risk factor is in agreement with
others 25-30 and it remained significant across all three models (all readmissions, PN related, or
PH-unrelated). Risk factors of prior health care utilization (e.g., prior hospitalizations and
emergency room visits) are likely surrogates of patients with unstable or more severe disease
states. Our inclusion of history of anxiety or depression was based on evidence provided by
others, where the mental component score of the SF-36 was determined as a significant
multivariate predictor of non-elective readmissions 28.
Our finding of lower income is in agreement with others who have shown socio-
economic status (SES) indicators as predictors of higher readmission rates. Billings4 studied
the effect of household income on hospital readmission for the non-Medicare population in New
York City and discovered admission rates to be higher for the low-income population than for
the high-income population. Amarasingham 3 found median income as a significant univariate
predictor of heart failure readmission, with borderline significance and Philbin et al 31 showed
that income is significantly associated with increased readmission in heart failure.
On the contrary, Arbaje et al 10 failed to include lower income as a significant multivariate
predictor of 60-day non-elective readmissions; however, the study lacked power to detect
differences in readmission in the designated levels of income. They acknowledged that if the
readmission rate had been higher, then low income may have had significant associations with
early readmission.
A systemic review of risk prediction models for readmission concludes that the vast
majority, including the three CMS models (Heart Failure, AMI, and pneumonia) performed
poorly in predicting which patients were at high or low risk for readmission 2. Indeed, only a
handful reported a c-statistic above 0.7. Their finding showed that most models were limited to
medical comorbidity, prior healthcare utilization, and basic sociodemographic data. Only a few
considered variables such as functional status, overall health, social determinants of health
(income, employment, SES, access to care, social support) or illness severity in their models.
RESPIRATORY CARE Paper in Press. Published on August 13, 2013 as DOI: 10.4187/respcare.02563
Epub ahead of print papers have been peer-reviewed and accepted for publication but are posted before being copy edited and proofread, and as a result, may differ substantially when published in final version in the online and print editions of RESPIRATORY CARE.
Copyright (C) 2013 Daedalus Enterprises

Two of the studies3, 5 that did include these variables in their models demonstrated increased
predictive ability.
An important limitation to this study was that it was conducted in a single, inner-city
tertiary care hospital, as such, its external validity may suffer in that it is limited to the
geographic area and practice type. However, many of the variables shown as significant risk-
factors in other studies with varied environments were replicated as significant variables in this
study. A further limitation is the census file used for median income was from the year 2000,
thus, there is the recognition that regional changes in income may have occurred in the last
decade. Finally, the power of the multivariate analysis is limited when segmenting the outcome
as pneumonia related/unrelated, though we did not observe large parameter estimates or
standard errors which can be diagnostic of too few events relative to variables.
Conclusion
We successfully produced a model that could by potentially be used to identify patients at high-
risk for readmission pre-discharge. We sought to build on previously published predictive
models for pneumonia readmission, many of which displayed relatively weak performance with
an attempt to enhance the predictive ability with the addition of variables related to marital
status, prior hospitalizations, median income, diagnosis of anxiety or depression, and index
hospital length of stay. Of these additions, prior hospitalization, median income, and
depression/anxiety were all significant predictors in the all-cause readmission model and made
substantial contributions to model performance.
Despite the significant improvement over previously published models of pneumonia 30
day readmission6, there is much need for improvement as the maximum predictive ability
remains inadequate. It is apparent that much of the influence on the risk of readmission lies
outside of the hospital. Factors such as, confirmed and timely post discharge visit to the
patients primary care provider, medication and diet compliance, social support, health literacy,
RESPIRATORY CARE Paper in Press. Published on August 13, 2013 as DOI: 10.4187/respcare.02563
Epub ahead of print papers have been peer-reviewed and accepted for publication but are posted before being copy edited and proofread, and as a result, may differ substantially when published in final version in the online and print editions of RESPIRATORY CARE.
Copyright (C) 2013 Daedalus Enterprises

communication between providers may all be significant contributors to a predictive algorithm
for readmission. Further research is needed to develop a more comprehensive model that
incorporates potential influential variables such as these.
Acknowledgements
Author contributions: Mr. Mather, Mr. Davis, Ms. Ash contributed to the conception and
design of the study. Mr. Fortunato and Mr. Mather contributed to the data retrieval, cleaning,
and validation. Mr. Mather contributed to the analysis. Mr. Mather and Dr. Kumar contributed to
the interpretation of the data. Mr. Mather and Dr. Kumar contributed to writing the article. Mr.
Davis, Ms. Ash, Mr. Fortunato and Dr. Kumar contributed to proofing and revising the article. All
authors approved the final version of the article.
Financial/nonfinancial Disclosures: The authors report no conflicts of interest.
RESPIRATORY CARE Paper in Press. Published on August 13, 2013 as DOI: 10.4187/respcare.02563
Epub ahead of print papers have been peer-reviewed and accepted for publication but are posted before being copy edited and proofread, and as a result, may differ substantially when published in final version in the online and print editions of RESPIRATORY CARE.
Copyright (C) 2013 Daedalus Enterprises

References
1. The Patient Protection and Affordable Care Act. Public Law 111–148. United States
Government Printing Office. http://www.gpo.gov/fdsys/pkg/PLAW-111publ148/pdf/PLAW-
111publ148.pdf. Accessed October 30, 2012.
2. Kansagara D, Englander H, Salanitro A, Kagen D, Theobald C, Freeman M, Kripalani S.
Risk Prediction Models for Hospital Readmission: A Systematic Review, JAMA.
2011;306(15):1688-1698.
3. Amarasingham R, Moore BJ, Tabak YP, Drazner MH, Clark CA, Zhang S, et al. An
automated model to identify heart failure patients at risk for 30-day readmission or death using
electronic medical record data. Med Care 2010;48(11):981-988.
4. Billings J, Zeitel L, Lukomnik J, Blank AE, Newman L. Impact of socioeconomic status on
hospital use in New York City. Health Aff1993;12(1):162–173.
5. Coleman EA, Min SJ, Chomiak A, Kramer AM. Posthospital care transitions: patterns,
complications, and risk identification. Health Serv Res 2004;39(5):1449-1465.
6. Lindenauer, PK, Normand, ST, Drye EE, Lin Z, Goodrich-K, Desai M, et al. Development,
Validation, and Results of a Measure of 30-Day Readmission Following Hospitalization for
Pneumonia. J Hosp Med 2011;6(3):142-150.
7. Capelastegui A, España PP, Bilbao A, Martinez-Vazquez M, Gorordo I, Oribe M, et al.
Pneumonia: criteria for patient instability on hospital discharge. Chest 2008;134(3):595-600.
8. El Solh AA, Brewer T, Okada M, Bashir O, Gough M. Indicators of recurrent hospitalization
for pneumonia in the elderly. J Am Geriatr Soc 2004;52(12): 2010-5.
9. Jasti H, Mortensen EM, Obrosky DS, Kapoor WN, Fine MJ. Causes and risk factors for
rehospitalization of patients hospitalized with community-acquired pneumonia. Clin Infect Dis
2008;46(4):550-556.
RESPIRATORY CARE Paper in Press. Published on August 13, 2013 as DOI: 10.4187/respcare.02563
Epub ahead of print papers have been peer-reviewed and accepted for publication but are posted before being copy edited and proofread, and as a result, may differ substantially when published in final version in the online and print editions of RESPIRATORY CARE.
Copyright (C) 2013 Daedalus Enterprises
10 Arbaje AI, Wolff JL, Yu Q, Powe NR, Anderson GF, Boult C. Postdischarge environmental
and socioeconomic factors and the likelihood of early hospital readmission among community-
dwelling Medicare beneficiaries. Gerontologist 2008;48:495-504.
11. Capelastegui A, España Yandiola PP, Quintana JM, Bilbao A, Diez R, et al. Predictors of
short-term rehospitalization following discharge of patients hospitalized with community-
acquired pneumonia. Chest 2009;136(4):1079-85.
12 Krumholz HM, Normand S-LT, Keenan PS, Desai, MM, Lin, Z, Drye, EE, et al. Hospital 30-
day pneumonia readmission measure: methodology, June 9, 2008.
http://www.qualitynet.org/dcs/ContentServer?c=Page&pagename=QnetPublic%2FPage%2FQn
etTier3&cid=1219069855841. Accessed September, 1 2012.
13. Pneumonia, 1992-2002. Medicare Quality Monitoring System (MQMS) Report.Cambridge,
MA: Mathematica Policy Research, August 2004, Robert Schmitz. Document No. PR04-
104a. http://www.mathematica-mpr.com/publications/PDFs/mqmspneumonia.pdf. Accessed
September 1, 2012.
14. Pneumonia, 1992-2002. Appendix B: Detailed Tables, Appendix C: ICD-9 Codes for
Pneumonia Cohorts. Medicare Quality Monitoring System (MQMS) Report. Cambridge, MA:
Mathematica Policy Research, August 2004, Robert Schmitz. Document No. PR04-
104b. http://www.mathematica-mpr.com/publications/PDFs/mqmspneumoniaapp.pdf.
Accessed September 1, 2012.
15. U.S. Census Bureau. American Fact Finder.
http://factfinder2.census.gov/faces/nav/jsf/pages/index.xhtml. Accessed August 15, 2012.
16. Zou, KH, O’Malley, AJ, Mauri, L. Receiver-Operating Cahracteristic Analysis for Evaluating
Diagnostic Tests and Predictive Models. Circulation 2007;115(5):654-657.
17. Hanley JA, McNeil BJ. The meaning and use of the area under a receiver operating
characteristic (ROC) curve. Radiology 1982;143(1):29-36.
RESPIRATORY CARE Paper in Press. Published on August 13, 2013 as DOI: 10.4187/respcare.02563
Epub ahead of print papers have been peer-reviewed and accepted for publication but are posted before being copy edited and proofread, and as a result, may differ substantially when published in final version in the online and print editions of RESPIRATORY CARE.
Copyright (C) 2013 Daedalus Enterprises
18. Nagelkerke NJ. A note on a general definition of the coefficient of determination. Biometrika
1991;78(3):691-692.
19. Hosmer DW, Hosmer T, Le Cessie S, Lemeshow S. A comparison of goodness-of-fit tests
for the logistic regression model. Stat Med 1997;16(9):965-980.
20. Efron B, Tibshirani R. An introduction to the bootstrap. In: Monographs on statistics and
applied probability. New York:Chapman and Hall; 1993:436.
21. Steyerberg EW, Harrell FE Jr, Borsboom GJJM, Eijkemans, MJC, Vergouwe, Y, Habbema,
JDF. Internal validation of predictive models: efficiency of some procedures for logistic
regression analysis. J Clin Epidemiol 2001; 54(8):774–81.
22. Axon RN, Williams MV. Hospital readmission as an accountability measure.
JAMA 2011;305(5):504-505.
23. Hernandez, AF, Curtis LH. Minding the gap between efforts to reduce readmissions and
disparities. JAMA 2011;305(7):715-716.
24. Ross JS, Mulvey GK, Stauffer B, Patlolla V, Bernheim SM, Keenan PS, Krumholz HM.
Statistical models and patient predictors of readmission for heart failure: a systematic review.
Arch Intern Med 2008;168(13):1371-1386.
25. Jencks SF, Williams MV, Coleman EA. Rehospitalizations among patients in the Medicare
fee-for-service program. N Engl J Med 2009; 360(14):1418-28.
26. Palacio C, Alexandraki I, House J, , Mooradian AD. A comparative study of unscheduled
hospital readmissions in a resident-staffed teaching service and a hospitalist-based service.
South Med J 2009;102(2):145-9.
27. Smith DM, Giobbie-Hurder A, Weinberger M, Oddone EZ, Henderson WG, Asch DA, et al.
Predicting non-elective hospital readmissions: a multi-site study. Department of Veterans Affairs
Cooperative Study Group on Primary Care and Readmissions. J Clin Epidemiol
2000;53(11):1113-8.
RESPIRATORY CARE Paper in Press. Published on August 13, 2013 as DOI: 10.4187/respcare.02563
Epub ahead of print papers have been peer-reviewed and accepted for publication but are posted before being copy edited and proofread, and as a result, may differ substantially when published in final version in the online and print editions of RESPIRATORY CARE.
Copyright (C) 2013 Daedalus Enterprises

28. Smith DM, Norton JA, McDonald CJ. Non-elective readmissions of medical patients. J
Chron Dis 1985;38(3):213–24.
29. Burns R, Nichols LO. Factors predicting readmission of older general medicine patients. J
Gen Intern Med 1991;6(5):389-93.
30. Reed RL, Pearlman RA, Buchner DM. Risk factors for early unplanned hospital readmission
in the elderly. J Gen Intern Med 1991;6(3):223-8.
31. Philbin EF, Dec GW, Jenkins PL, DiSalvo TG. Socioeconomic status as an independent
risk factor for hospital readmission for heart failure. Am J Cardiol 2001;87(12):1367-71.
RESPIRATORY CARE Paper in Press. Published on August 13, 2013 as DOI: 10.4187/respcare.02563
Epub ahead of print papers have been peer-reviewed and accepted for publication but are posted before being copy edited and proofread, and as a result, may differ substantially when published in final version in the online and print editions of RESPIRATORY CARE.
Copyright (C) 2013 Daedalus Enterprises

FIGURE 1. Pneumonia admissions included in measure calculation.
RESPIRATORY CARE Paper in Press. Published on August 13, 2013 as DOI: 10.4187/respcare.02563
Epub ahead of print papers have been peer-reviewed and accepted for publication but are posted before being copy edited and proofread, and as a result, may differ substantially when published in final version in the online and print editions of RESPIRATORY CARE.
Copyright (C) 2013 Daedalus Enterprises

FIGURE 2. Kaplan-Meier curve of 30-day hospital readmission.
RESPIRATORY CARE Paper in Press. Published on August 13, 2013 as DOI: 10.4187/respcare.02563
Epub ahead of print papers have been peer-reviewed and accepted for publication but are posted before being copy edited and proofread, and as a result, may differ substantially when published in final version in the online and print editions of RESPIRATORY CARE.
Copyright (C) 2013 Daedalus Enterprises

FIGURE 3. Relative contribution of risk-factors for Pneumonia 30-day readmission prediction
model. SNF indicates readmission from a skilled nursing facility; HCT, hematocrit; LOS, Length
of stay; CR, creatinine.
RESPIRATORY CARE Paper in Press. Published on August 13, 2013 as DOI: 10.4187/respcare.02563
Epub ahead of print papers have been peer-reviewed and accepted for publication but are posted before being copy edited and proofread, and as a result, may differ substantially when published in final version in the online and print editions of RESPIRATORY CARE.
Copyright (C) 2013 Daedalus Enterprises

FIGURE 4. Area under the ROC curve. The area under the receiver operating characteristic
curve (ROC) demonstrates significantly better discrimination using the all significant univariate
predictors (HH model) when compared to using the CMS Medical Record model6 variables
alone. The diagonal line represents an AUC = 0.5, or no discrimination.
RESPIRATORY CARE Paper in Press. Published on August 13, 2013 as DOI: 10.4187/respcare.02563
Epub ahead of print papers have been peer-reviewed and accepted for publication but are posted before being copy edited and proofread, and as a result, may differ substantially when published in final version in the online and print editions of RESPIRATORY CARE.
Copyright (C) 2013 Daedalus Enterprises

Table 1. Pneumonia 30 Day Readmission Diagnosis
Count Percent
Pneumonia related
Pneumonia - primary 19 76.0%
Septicemia - pneumonia 5 20.0%
Respiratory Failure - pneumonia 1 4.0%
Total 25 16.9%
Pneumonia unrelated*
Aspiration and Specified Bacterial Pneumonias (Food/vomit pneumonitis) 13 10.6%
Congestive Heart Failure 12 9.8%
Cardio-Respiratory Failure and Shock 11 8.9%
Chronic Obstructive Pulmonary Disease 8 6.5%
Renal Failure 7 5.7%
Other Infectious Diseases 6 4.9%
Septicemia/Shock 6 4.9%
Lung, Upper Digestive Tract, and Other Severe Cancers 4 3.3%
Urinary Tract Infection 4 3.3%
Hip Fracture/Dislocation 3 2.4%
Other Gastrointestinal Disorders 3 2.4%
Central Nervous System Infection 2 1.6%
Disorders of Fluid/Electrolyte/Acid-Base Balance 2 1.6%
Major Complications of Medical Care and Trauma 2 1.6%
Other Heart Rhythm and Conduction Disorders 2 1.6%
Vascular Disease 2 1.6%
Acute Myocardial Infarction 1 0.8%
Breast, Prostate, Colorectal and Other Cancers and Tumors 1 0.8%
Chronic Ulcer of Skin, Except Decubitus 1 0.8%
Dementia/Cerebral Degeneration 1 0.8%
Diabetes with Acute Complications 1 0.8%
Diabetes with Neurologic or Other Specified Manifestation 1 0.8%
Dialysis Status 1 0.8%
Disorders of Immunity 1 0.8%
Fibrosis of Lung and Other Chronic Lung Disorders 1 0.8%
Intestinal Obstruction/Perforation 1 0.8%
Lymphatic, Head and Neck, Brain, and Other Major Cancers 1 0.8%
Other Circulatory Disease 1 0.8%
Other Psychiatric Disorders 1 0.8%
Other Significant Endocrine and Metabolic Disorders 1 0.8%
Pleural Effusion/Pneumothorax 1 0.8%
Seizure Disorders and Convulsions 1 0.8%
Vascular Disease with Complications 1 0.8%
Other 19 15.4%
Total 123 83.1%
*Primary ICD-9 diagnosis on 30 day readmission.
RESPIRATORY CARE Paper in Press. Published on August 13, 2013 as DOI: 10.4187/respcare.02563
Epub ahead of print papers have been peer-reviewed and accepted for publication but are posted before being copy edited and proofread, and as a result, may differ substantially when published in final version in the online and print editions of RESPIRATORY CARE.
Copyright (C) 2013 Daedalus Enterprises

For Peer Review
Table 2. Univariate Predictors of 30-Day Readmission for Pneumonia
Study Sample = 956
Not Readmitted
n=808 Readmitted
n=148 p
value Population %* CMS†
Patient Demographics
Age (years > 65)
15.7 ± 8.5 14.5 ± 8.4 0.12 15.5 ± 8.5 15.2 ±
7.9
Length of Stay (LOS)
5.3 ± 4.0 6.2 ± 4.9 0.03 5.4 ± 4.2
Sex (Male) 42.1% 49.3% 0.10 43.2% 46.2%
Nursing Home Resident 41.3% 52.0% 0.02 43.0% 17.7%
Marital Status 0.13
Divorced 10.5% 9.5% 10.4%
Married 36.0% 33.8% 35.0%
Single 11.5% 14.9% 12.0%
Widowed 41.6% 39.9% 41.3%
Separated 0.4% 2.0% 60.0%
Health Care Utilization
>= 3 Previous Admissions 47.0% 68.2% <0.01 50.3%
Socio-economic status
Median Income <=$43,000 18.9% 30.8% <0.01 20.7%
Comorbidities
Diabetes mellitus 33.4% 39.2% 0.17 34.3% 20.9%
History of heart Failure 35.5% 43.2% 0.07 36.7% 29.0%
Coronary Artery Disease 44.1% 50.0% 0.18 45.0% 39.6%
Chronic Lung Disease 44.9% 57.4% 0.01 46.9% 42.2%
Liver Disease .0% .0% .0% 1.0%
Renal Disease 15.2% 27.7% 0.00 17.2% 8.5%
Splenectomy .2% .0% 0.54 .2% .4%
Dementia/Alzheimer's Disease 25.5% 21.6% 0.32 24.9% 16.4%
Cancer 10.0% 16.2% 0.03 9.4% 6.8%
Alcohol/Drug Abuse 6.8% 10.1% 0.15 7.3% 3.4%
Immunosuppressive Therapy 22.3% 29.7% 0.05 23.4% 15.0%
Major psychiatric disorders 4.5% 8.1% 0.06 5.0% 18.0%
Pleural Effusion/Pneumothorax 6.8% 10.1% 0.15 7.3% 21.2%
Anxiety/Depression 19.6% 27.0% 0.04 20.7%
Vital Signs
SBP<90 mmHg 1.0% .7% 0.72 .9% 2.9%
HR>=125/min 2.4% 4.1% 0.23 2.6% 7.7%
RR>=30/min
3.8% 3.4% 0.79 3.8% 16.4%
Labs
NA<130 mol/L 7.0% 6.8% 0.94 7.0% 4.8%
BUN>=30 mg/dL 24.7% 27.2% 0.52 25.1% 23.3%
CR>=2.5 mg/dL 5.5% 10.9% 0.01 6.3% 4.7%
HCT<30% 8.6% 17.0% <0.01 9.9% 7.8%
GLU>=250 mg/dL 5.7% 6.1% 0.85 5.8% 5.2%
WBC6-12 b/µL 50.1% 50.3% 0.52 50.2% 38.0%
WBC>12 b/µL 40.5% 36.7% 0.96 39.9% 41.4%
Values are shown as percent or mean ± standard deviation
Abbreviations:SBP, Systolic Blood Pressure; HR, Heart Rate; RR, Respiratory Rate; NA, Sodium; BUN, Blood Urea Nitrogen; CR, Creatinine; HCT, Hematocrit; Glu, Glucose * entire population
† CMS6
values for comparison. Not shown are values for missing (yes/No) for the following: sodium, glucose, hematocrit, Creatinine, WBC, BUN, heart rate, systolic blood pressure, and respiratory rate, as the maximum missing for any of these 9 variables was 8 and all were insignificant.
Comorbidities used in the model were represented by CC groupings as follows: Diabetes Mellitus (CC 15-20, 119-120); History of Heart Failure (CC 80); Coronary Artery Disease (CC 83-86, 104-106); Chronic Lung Disease (CC 108-09, 115); Liver Disease (CC 25-30); History of Renal Disease (CC 129-131); Dementia/Alzheimer’s disease (CC 49-50); Cancer/Neoplastic disease (CC 7-14); Alcohol/Drug Abuse (CC 51-53); Major psychiatric disorders (CC 54-56); pleural effusion (CC 114); Anxiety/Depression (CC 58-59). Splenectomy was defined using an ICD-9 procedure coding of 41.5. Immunosuppressive therapy was defined as medication usage using Healthcare Common Procedure Coding System (HCPCS) codes for the following: Azathioprine, Cyclophosphamide, Cyclosporine, Daclizumab, Methotrexate, Methylprednisolone, Mycophenolate mofetil, Sirolimus, or Tacrolimus.
RESPIRATORY CARE Paper in Press. Published on August 13, 2013 as DOI: 10.4187/respcare.02563
Epub ahead of print papers have been peer-reviewed and accepted for publication but are posted before being copy edited and proofread, and as a result, may differ substantially when published in final version in the online and print editions of RESPIRATORY CARE.
Copyright (C) 2013 Daedalus Enterprises

For Peer Review
Table 3. Univariate Predictors of 30-Day Readmission for Pneumonia Related and Pneumonia Unrelated Readmissions
Pneumonia Related Pneumonia Unrelated
Not Readmitted
n=931 Readmitted
n=25 p value Not Readmitted
n=833 Readmitted
n=123 p value
Patient Demographics Age (yrs > 65) 15.6(8.5) 13.9(9.8) 0.34 15.6(8.5) 14.6(8.4) 0.22
Length of Stay (LOS) 5.4(4.1) 6.6(5.4) 0.17 5.3(4.1) 6.1(4.8) 0.04 Sex (Male) 43.1% 48.0% 0.62 42.3% 49.6% 0.13
Nursing Home Resident 42.5% 60.0% 0.08 41.9% 50.4% 0.08 Marital Status 0.28 0.30
Divorced 12.1% 8.0% 11.4% 7.8% Married 35.7% 36.0% 36.0% 16.3%
Single 10.3% 12.0% 10.6% 33.3% Widowed 41.4% 40.0% 41.5% 8.9%
Separated .5% 4.0% .5% 39.8% >= 3 Previous
Admissions 49.6% 76.0% 0.01 47.9% 66.7% 0.00
Median Income
<=$43,000 20.3% 36.0% 0.06 19.4% 29.8% 0.01
Comorbidities
Diabete mellitus 34.4% 32.0% 0.81 33.4% 40.7% 0.11 History of heart Failure 37.2% 20.0% 0.79 35.1% 48.0% 0.06
Coronary Artery Disease 44.7% 56.0% 0.26 44.4% 48.8% 0.36 Chronic Lung Disease 47.0% 40.0% 0.49 44.8% 61.0% 0.00
Liver Disease .0% .0% .0% .0% Renal Disease 17.1% 20.0% 0.70 15.4% 29.3% 0.00
Splenectomy .2% .0% 0.82 .2% .0% 0.59 Dementia/Alzheimer's
Disease 25.1% 16.0% 0.30 25.2% 22.8% 0.56
Cancer 10.3% 36.0% 0.00 10.8% 12.2% 0.65
Alcohol/Drug Abuse 7.4% 4.0% 0.52 6.7% 11.4% 0.06 Immunosuppressive
Therapy 23.1% 36.0% 0.13 22.7% 28.5% 0.16
Major psychiatric
disorders 5.0% 4.0% 0.81 4.4% 8.9% 0.03
Pleural
Effusion/Pneumothorax 7.3% 8.0% 0.89 6.8% 10.6% 0.14
Anxiety/Depression 20.3% 36.0% 0.06 20.0% 25.2% 0.19
Vital Signs SBP<90 mmHg 1.0% .0% 0.62 1.0% .8% 0.87
HR>=125/min 2.7% .0% 0.41 2.3% 4.9% 0.09 RR>=30/min 3.9% .0% 0.31 3.7% 4.1% 0.85
Labs NA<130 mol/L 7.0% 4.0% 0.56 6.8% 7.3% 0.85
BUN>=30 mg/dL 25.0% 28.0% 0.73 24.8% 27.0% 0.59 CR>=2.5 mg/dL 6.3% 8.0% 0.73 5.6% 11.5% 0.01
HCT<30% 9.5% 24.0% 0.02 9.1% 15.6% 0.03 GLU>=250 mg/dL 5.9% .0% 0.21 5.6% 7.4% 0.42
WBC6-12 b/µL 50.8% 28.0% 0.03 49.5% 54.9% 0.26 WBC>12 b/µL 39.6% 52.0% 0.22 40.9% 33.6% 0.13
Values are shown as percent or mean(standard deviation) Abbreviations:SBP, Systolic Blood Pressure; HR, Heart Rate; RR, Respiratory Rate; NA, Sodium; BUN, Blood Urea Nitrogen; CR, Creatinine; HCT, Hematocrit; Glu, Glucose
RESPIRATORY CARE Paper in Press. Published on August 13, 2013 as DOI: 10.4187/respcare.02563
Epub ahead of print papers have been peer-reviewed and accepted for publication but are posted before being copy edited and proofread, and as a result, may differ substantially when published in final version in the online and print editions of RESPIRATORY CARE.
Copyright (C) 2013 Daedalus Enterprises
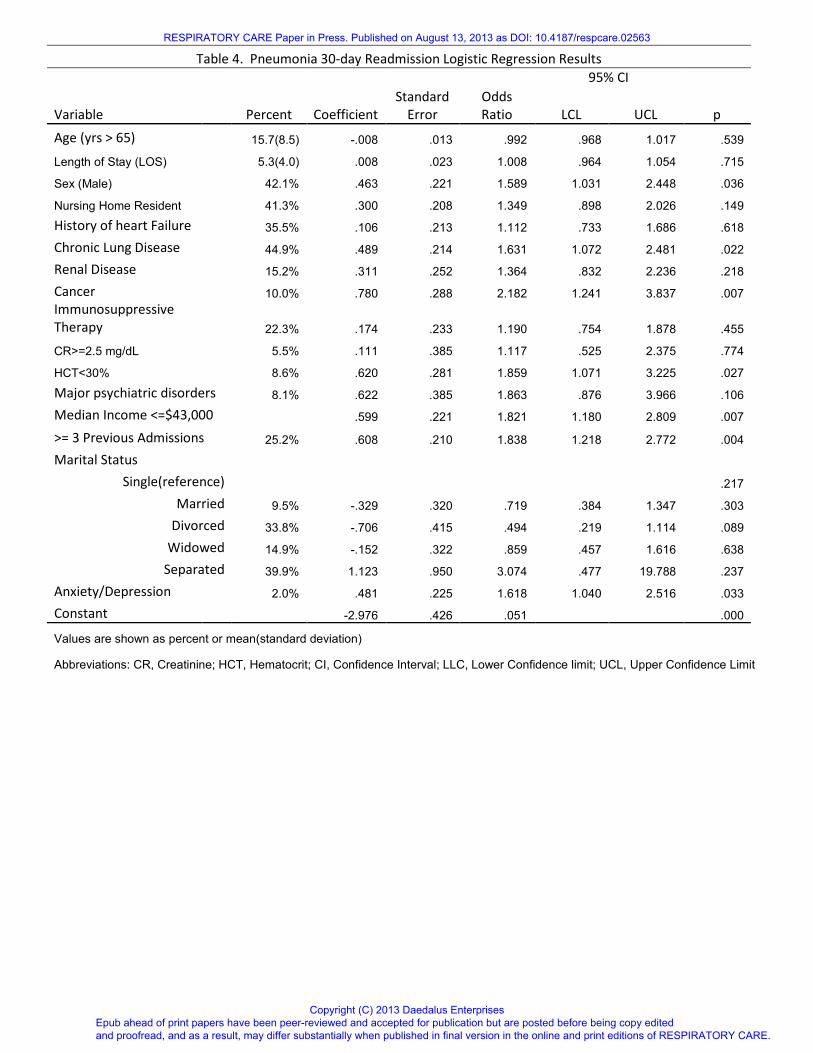
Table 4. Pneumonia 30-day Readmission Logistic Regression Results
Standard
Error
95% CI
Variable Percent Coefficient
Odds
Ratio LCL UCL p
Age (yrs > 65) 15.7(8.5) -.008 .013 .992 .968 1.017 .539 Length of Stay (LOS) 5.3(4.0) .008 .023 1.008 .964 1.054 .715 Sex (Male) 42.1% .463 .221 1.589 1.031 2.448 .036
Nursing Home Resident 41.3% .300 .208 1.349 .898 2.026 .149
History of heart Failure 35.5% .106 .213 1.112 .733 1.686 .618
Chronic Lung Disease 44.9% .489 .214 1.631 1.072 2.481 .022
Renal Disease 15.2% .311 .252 1.364 .832 2.236 .218
Cancer 10.0% .780 .288 2.182 1.241 3.837 .007
Immunosuppressive
Therapy 22.3% .174 .233 1.190 .754 1.878 .455
CR>=2.5 mg/dL 5.5% .111 .385 1.117 .525 2.375 .774
HCT<30% 8.6% .620 .281 1.859 1.071 3.225 .027
Major psychiatric disorders 8.1% .622 .385 1.863 .876 3.966 .106
Median Income <=$43,000 .599 .221 1.821 1.180 2.809 .007
>= 3 Previous Admissions 25.2% .608 .210 1.838 1.218 2.772 .004
Marital Status
Single(reference) .217
Married 9.5% -.329 .320 .719 .384 1.347 .303
Divorced 33.8% -.706 .415 .494 .219 1.114 .089
Widowed 14.9% -.152 .322 .859 .457 1.616 .638
Separated 39.9% 1.123 .950 3.074 .477 19.788 .237
Anxiety/Depression 2.0% .481 .225 1.618 1.040 2.516 .033
Constant -2.976 .426 .051 .000
Values are shown as percent or mean(standard deviation)
Abbreviations: CR, Creatinine; HCT, Hematocrit; CI, Confidence Interval; LLC, Lower Confidence limit; UCL, Upper Confidence Limit
RESPIRATORY CARE Paper in Press. Published on August 13, 2013 as DOI: 10.4187/respcare.02563
Epub ahead of print papers have been peer-reviewed and accepted for publication but are posted before being copy edited and proofread, and as a result, may differ substantially when published in final version in the online and print editions of RESPIRATORY CARE.
Copyright (C) 2013 Daedalus Enterprises

Table 5. Model Performance
Model Discrimination
Predictors Readmission Type n Predictive Ability (Lowest Decile - Highest Decile) AUC † R2*
All significant All Cause 956 7.5% - 43.0% 0.71(0.66 - 0.75) 0.13
All significant PN-unrelated 956 3.3% - 36.6% 0.68(0.64 - 0.73) 0.11
All significant PN-related 956 9.1% - 34.0% 0.65(0.59 - 0.70) 0.16
CMS Medical Record Model Variables only‡ All Cause 956 4.2% - 35.1% 0.67(0.62 - 0.72) 0.08
*Nagelkerke R Square18
† AUC (Area under the curve) shown with 95% confidence interval.
‡ Lindenauer et al6
RESPIRATORY CARE Paper in Press. Published on August 13, 2013 as DOI: 10.4187/respcare.02563
Epub ahead of print papers have been peer-reviewed and accepted for publication but are posted before being copy edited and proofread, and as a result, may differ substantially when published in final version in the online and print editions of RESPIRATORY CARE.
Copyright (C) 2013 Daedalus Enterprises
For Peer Review
59x76mm (300 x 300 DPI)
RESPIRATORY CARE Paper in Press. Published on August 13, 2013 as DOI: 10.4187/respcare.02563
Epub ahead of print papers have been peer-reviewed and accepted for publication but are posted before being copy edited and proofread, and as a result, may differ substantially when published in final version in the online and print editions of RESPIRATORY CARE.
Copyright (C) 2013 Daedalus Enterprises

58x60mm (300 x 300 DPI)
RESPIRATORY CARE Paper in Press. Published on August 13, 2013 as DOI: 10.4187/respcare.02563
Epub ahead of print papers have been peer-reviewed and accepted for publication but are posted before being copy edited and proofread, and as a result, may differ substantially when published in final version in the online and print editions of RESPIRATORY CARE.
Copyright (C) 2013 Daedalus Enterprises

114x43mm (300 x 300 DPI)
RESPIRATORY CARE Paper in Press. Published on August 13, 2013 as DOI: 10.4187/respcare.02563
Epub ahead of print papers have been peer-reviewed and accepted for publication but are posted before being copy edited and proofread, and as a result, may differ substantially when published in final version in the online and print editions of RESPIRATORY CARE.
Copyright (C) 2013 Daedalus Enterprises

79x61mm (300 x 300 DPI)
RESPIRATORY CARE Paper in Press. Published on August 13, 2013 as DOI: 10.4187/respcare.02563
Epub ahead of print papers have been peer-reviewed and accepted for publication but are posted before being copy edited and proofread, and as a result, may differ substantially when published in final version in the online and print editions of RESPIRATORY CARE.
Copyright (C) 2013 Daedalus Enterprises