Embed Size (px)
Citation preview
NARC Agron-4
1
TITLE: Winter Wheat, Spring Wheat, Spring Barley and Safflower Variety Performance Evaluations Under Chemical Fallow Conditions On-Station at Northern Agricultural Research Center, Havre, Montana. 2002-2011.
PROJECT LEADER: Peggy F. Lamb, Research Associate, Havre PROJECT PERSONNEL: Phil L. Bruckner, Breeder/Geneticist (WW), Bozeman Luther E. Talbert, Breeder/Geneticist (SW), Bozeman Joyce L. Eckhoff, Breeder/Agronomist (DURUM), Sidney Jerald W. Bergman, Breeder/Agronomist (SAFF), Sidney Jim E. Berg, Research Associate (WW), Bozeman Susan P. Lanning, Research Associate (SW), Bozeman Debbie Kunda, Research Assistant III (DURUM), Sidney
Chuck Flynn, Research Chemist (SAFF), Sidney Eleri Haney, Research Assistant, Havre Content: This report is intended to serve as a popularized 2011 summary of “primary” on-going cereal and oilseed crop variety investigations traditionally conducted on-station by Agronomy at Northern Agricultural Research Center. These data represent approximately 16 percent of NARC-Agronomy’s total research project effort on-station at Havre. The remaining 84 percent of the research not reported here includes cultivar and product evaluation associated with larger nurseries featuring early generation or other unnamed experimental materials not of general interest to the public; and/or experimental seed treatment, fungicide and insecticide evaluations. Long-term data summaries reported here are limited to the most recent ten years, largely due to need for report brevity and the fact that most varieties have approximately a 10-year life span before they are replaced in common use with newer materials having superior production characteristics. However, variety performance data has been continuously collected and maintained at the Havre station for 96 years beginning in 1916. Collection of sawfly stem cutting data was added beginning in 2003. Detailed data pertaining to multiple performance characters, along with associated climatic and management inputs are presented for 2011. Abridged, multi-year summaries for each cereal trial are limited to three crop characters (yield, test weight and sawfly rating) while the safflower summary is limited to two crop characters (yield and oil content). Individuals desiring detailed data for other than the current year may contact the research center or refer to previous editions of this report for the year(s) of interest. 2011 Data: It should be noted that 2011 data tables in this report represent varietal performance for a single crop year at a single location only, and thus cannot be considered representative of performance expected when differing conditions due to location, year and management are imposed. Therefore, by itself, such 2011 data shall not constitute in any form a recommendation for or against any entry or practice included. Multi-Year Summary Data: Use of a “Comparable Average” provides a mechanism for “estimating” the performance of varieties over a period of time longer than that for which actual data is available for them. This is accomplished by comparing the performance of a “variety of interest” for the years it was actually tested with that of a designated long-term “check” or reference variety grown in the same trial in the same years. The performance of the variety is then expressed as a percent of the check variety’s performance. This actual percentage or index is then applied to the actual long-term performance of the check to estimate the performance of the variety of interest had it been grown over the same long term. The reliability of comparable average figures improves with increasing years of actual evaluation. For this reason, no entries with less than three years actual data have been included in long-term summaries.
NARC Agron-4
2
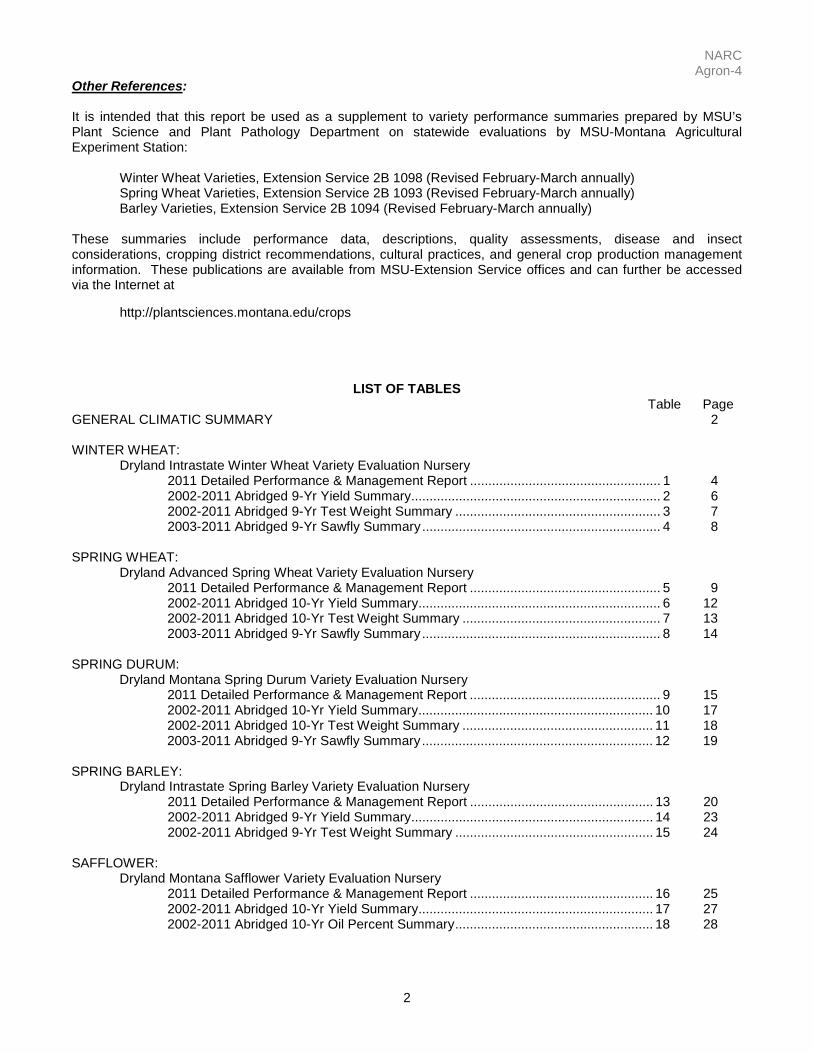
Other References: It is intended that this report be used as a supplement to variety performance summaries prepared by MSU’s Plant Science and Plant Pathology Department on statewide evaluations by MSU-Montana Agricultural Experiment Station: Winter Wheat Varieties, Extension Service 2B 1098 (Revised February-March annually) Spring Wheat Varieties, Extension Service 2B 1093 (Revised February-March annually) Barley Varieties, Extension Service 2B 1094 (Revised February-March annually) These summaries include performance data, descriptions, quality assessments, disease and insect considerations, cropping district recommendations, cultural practices, and general crop production management information. These publications are available from MSU-Extension Service offices and can further be accessed via the Internet at http://plantsciences.montana.edu/crops
LIST OF TABLES Table Page GENERAL CLIMATIC SUMMARY 2 WINTER WHEAT: Dryland Intrastate Winter Wheat Variety Evaluation Nursery 2011 Detailed Performance & Management Report .................................................... 1 4 2002-2011 Abridged 9-Yr Yield Summary .................................................................... 2 6 2002-2011 Abridged 9-Yr Test Weight Summary ........................................................ 3 7 2003-2011 Abridged 9-Yr Sawfly Summary ................................................................. 4 8 SPRING WHEAT: Dryland Advanced Spring Wheat Variety Evaluation Nursery 2011 Detailed Performance & Management Report .................................................... 5 9 2002-2011 Abridged 10-Yr Yield Summary .................................................................. 6 12 2002-2011 Abridged 10-Yr Test Weight Summary ...................................................... 7 13 2003-2011 Abridged 9-Yr Sawfly Summary ................................................................. 8 14 SPRING DURUM: Dryland Montana Spring Durum Variety Evaluation Nursery 2011 Detailed Performance & Management Report .................................................... 9 15 2002-2011 Abridged 10-Yr Yield Summary ................................................................ 10 17 2002-2011 Abridged 10-Yr Test Weight Summary .................................................... 11 18 2003-2011 Abridged 9-Yr Sawfly Summary ............................................................... 12 19 SPRING BARLEY: Dryland Intrastate Spring Barley Variety Evaluation Nursery 2011 Detailed Performance & Management Report .................................................. 13 20 2002-2011 Abridged 9-Yr Yield Summary .................................................................. 14 23 2002-2011 Abridged 9-Yr Test Weight Summary ...................................................... 15 24 SAFFLOWER: Dryland Montana Safflower Variety Evaluation Nursery 2011 Detailed Performance & Management Report .................................................. 16 25 2002-2011 Abridged 10-Yr Yield Summary ................................................................ 17 27 2002-2011 Abridged 10-Yr Oil Percent Summary ...................................................... 18 28
NARC Agron-4
3
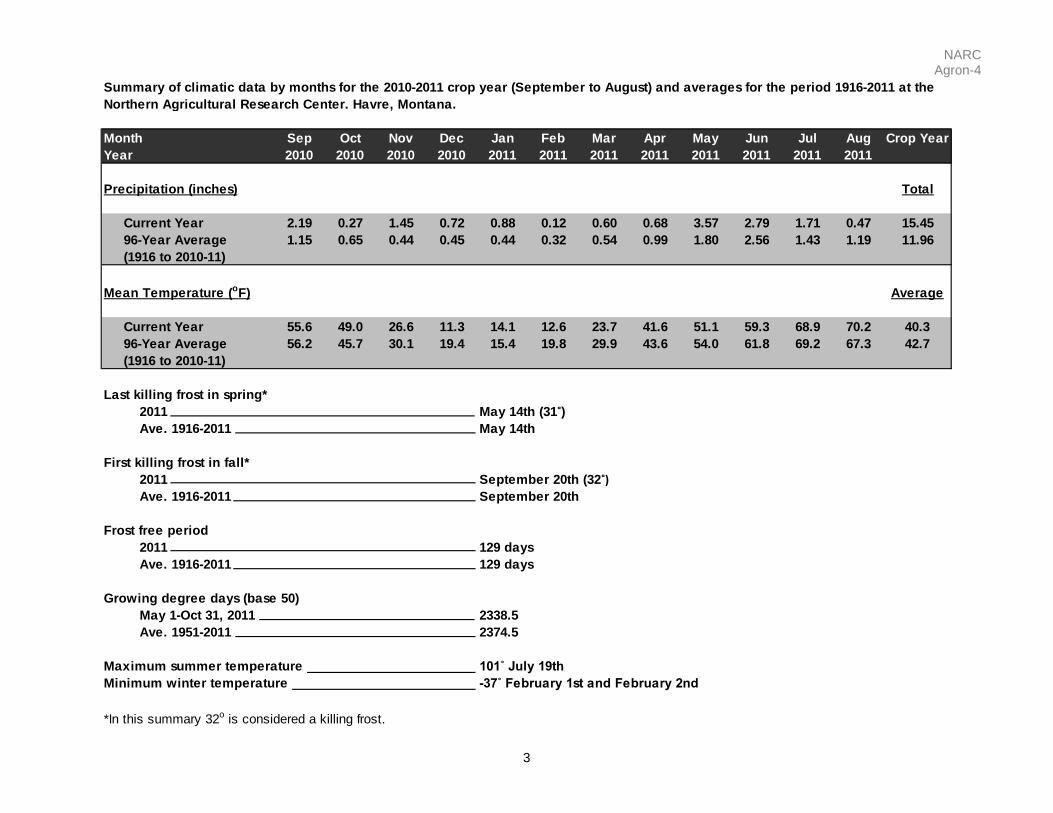
Month Sep Oct Nov Dec Jan Feb Mar Apr May Jun Jul Aug Crop YearYear 2010 2010 2010 2010 2011 2011 2011 2011 2011 2011 2011 2011
Precipitation (inches) Total
Current Year 2.19 0.27 1.45 0.72 0.88 0.12 0.60 0.68 3.57 2.79 1.71 0.47 15.45 96-Year Average 1.15 0.65 0.44 0.45 0.44 0.32 0.54 0.99 1.80 2.56 1.43 1.19 11.96 (1916 to 2010-11)
Mean Temperature (oF) Average
Current Year 55.6 49.0 26.6 11.3 14.1 12.6 23.7 41.6 51.1 59.3 68.9 70.2 40.3 96-Year Average 56.2 45.7 30.1 19.4 15.4 19.8 29.9 43.6 54.0 61.8 69.2 67.3 42.7 (1916 to 2010-11)
Last killing frost in spring*2011 May 14th (31˚)Ave. 1916-2011 May 14th
First killing frost in fall*2011 September 20th (32˚)Ave. 1916-2011 September 20th
Frost free period2011 129 daysAve. 1916-2011 129 days
Growing degree days (base 50)May 1-Oct 31, 2011 2338.5Ave. 1951-2011 2374.5
Maximum summer temperature 101˚ July 19thMinimum winter temperature -37˚ February 1st and February 2nd
*In this summary 32o is considered a killing frost.
Summary of climatic data by months for the 2010-2011 crop year (September to August) and averages for the period 1916-2011 at the Northern Agricultural Research Center. Havre, Montana.
NARC Agron-4
4
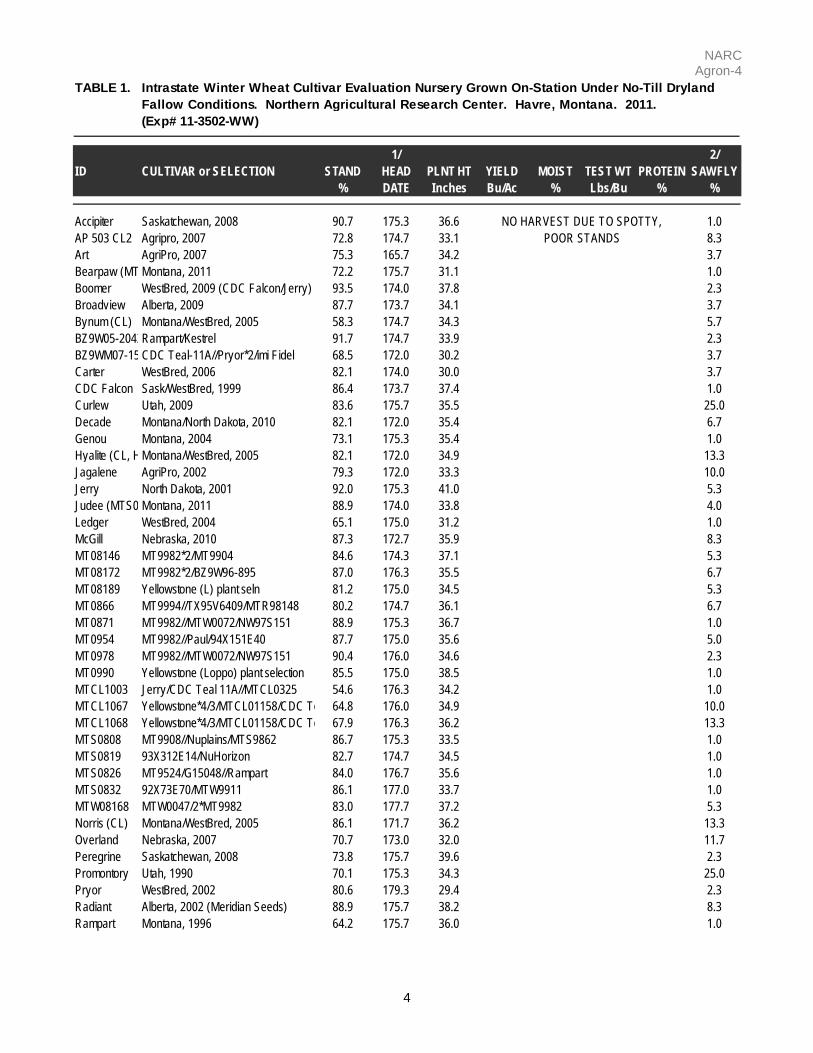
TABLE 1.
(Exp# 11-3502-WW)
1/ 2/ID CULTIVAR or SELECTION STAND HEAD PLNT HT YIELD MOIST TEST WT PROTEIN SAWFLY
% DATE Inches Bu/Ac % Lbs/Bu % %
Accipiter Saskatchewan, 2008 90.7 175.3 36.6 1.0AP 503 CL2 Agripro, 2007 72.8 174.7 33.1 8.3Art AgriPro, 2007 75.3 165.7 34.2 3.7Bearpaw (MT Montana, 2011 72.2 175.7 31.1 1.0Boomer WestBred, 2009 (CDC Falcon/Jerry) 93.5 174.0 37.8 2.3Broadview Alberta, 2009 87.7 173.7 34.1 3.7Bynum (CL) Montana/WestBred, 2005 58.3 174.7 34.3 5.7BZ9W05-2043Rampart/Kestrel 91.7 174.7 33.9 2.3BZ9WM07-15 CDC Teal-11A//Pryor*2/imi Fidel 68.5 172.0 30.2 3.7Carter WestBred, 2006 82.1 174.0 30.0 3.7CDC Falcon Sask/WestBred, 1999 86.4 173.7 37.4 1.0Curlew Utah, 2009 83.6 175.7 35.5 25.0Decade Montana/North Dakota, 2010 82.1 172.0 35.4 6.7Genou Montana, 2004 73.1 175.3 35.4 1.0Hyalite (CL, HMontana/WestBred, 2005 82.1 172.0 34.9 13.3Jagalene AgriPro, 2002 79.3 172.0 33.3 10.0Jerry North Dakota, 2001 92.0 175.3 41.0 5.3Judee (MTS0 Montana, 2011 88.9 174.0 33.8 4.0Ledger WestBred, 2004 65.1 175.0 31.2 1.0McGill Nebraska, 2010 87.3 172.7 35.9 8.3MT08146 MT9982*2/MT9904 84.6 174.3 37.1 5.3MT08172 MT9982*2/BZ9W96-895 87.0 176.3 35.5 6.7MT08189 Yellowstone (L) plant seln 81.2 175.0 34.5 5.3MT0866 MT9994//TX95V6409/MTR98148 80.2 174.7 36.1 6.7MT0871 MT9982//MTW0072/NW97S151 88.9 175.3 36.7 1.0MT0954 MT9982//Paul/94X151E40 87.7 175.0 35.6 5.0MT0978 MT9982//MTW0072/NW97S151 90.4 176.0 34.6 2.3MT0990 Yellowstone (Loppo) plant selection 85.5 175.0 38.5 1.0MTCL1003 Jerry/CDC Teal 11A//MTCL0325 54.6 176.3 34.2 1.0MTCL1067 Yellowstone*4/3/MTCL01158/CDC Te 64.8 176.0 34.9 10.0MTCL1068 Yellowstone*4/3/MTCL01158/CDC Te 67.9 176.3 36.2 13.3MTS0808 MT9908//Nuplains/MTS9862 86.7 175.3 33.5 1.0MTS0819 93X312E14/NuHorizon 82.7 174.7 34.5 1.0MTS0826 MT9524/G15048//Rampart 84.0 176.7 35.6 1.0MTS0832 92X73E70/MTW9911 86.1 177.0 33.7 1.0MTW08168 MTW0047/2*MT9982 83.0 177.7 37.2 5.3Norris (CL) Montana/WestBred, 2005 86.1 171.7 36.2 13.3Overland Nebraska, 2007 70.7 173.0 32.0 11.7Peregrine Saskatchewan, 2008 73.8 175.7 39.6 2.3Promontory Utah, 1990 70.1 175.3 34.3 25.0Pryor WestBred, 2002 80.6 179.3 29.4 2.3Radiant Alberta, 2002 (Meridian Seeds) 88.9 175.7 38.2 8.3Rampart Montana, 1996 64.2 175.7 36.0 1.0
Intrastate Winter Wheat Cultivar Evaluation Nursery Grown On-Station Under No-Till Dryland Fallow Conditions. Northern Agricultural Research Center. Havre, Montana. 2011.
NO HARVEST DUE TO SPOTTY,POOR STANDS
NARC Agron-4
5
TABLE 1.Continued
(Exp# 11-3502-WW)
1/ 2/ID CULTIVAR or SELECTION STAND HEAD PLNT HT YIELD MOIST TEST WT PROTEIN SAWFLY
% DATE Inches Bu/Ac % Lbs/Bu % %
Robidoux Nebraska, 2010 57.7 174.3 33.1 10.0Settler CL Nebraska (SD, WY), 2008 87.0 169.7 33.5 13.3SY Wolf (BC0 Syngenta (AgriPro), 2010 74.7 173.7 33.0 6.7Wahoo Nebraska, 2001 71.6 174.7 32.0 7.0WB-Matlock (CA9W07-817) WestBred, 2010 97.5 173.0 38.7 5.3Yellowstone Montana 2005 88.3 176.0 35.0 5.3
EXPERIMENTAL MEANS 80.0 174.5 34.9 5.9LSD (0.05) 18.9 3.1 4.6 6.6C.V.% 14.6 1.1 8.1 68.5P-VALUE (Entries) 0.0 <0.0001 0.0005 <0.0001
1/ No. of Days from January 1 (174 = June 23).2/ Sawfly rating is reported as the percentage of cut stems.
Intrastate Winter Wheat Cultivar Evaluation Nursery Grown On-Station Under No-Till Dryland Fallow Conditions. Northern Agricultural Research Center. Havre, Montana. 2011.
NO HARVEST DUE TO SPOTTY,POOR STANDS
Field B-1-4 SaltHaz(MMHOS/cm) 6-24 0.35 Dry Surf Soil (in.) @ Plnt'g 0.50Quarter NE S (ppm) 0-24 7 2" Soil Temp (oF) @ Plnt'g 71Section 32 Zn (ppm) 0-6 0.70 4" Soil Temp (oF) @ Plnt'g 68Tow nship 32N Fe (ppm) 0-6 7.70 Fertilizer Formulation Gran.BlendRange 15E Mn (ppm) 0-6 5.81 Fertilizer Placement Bnd at PlntgLatitude N48 29.450' Cu (ppm) 0-6 1.11 Fert. Rate (lbs/ac) N 70Longitude W109 48.025' CEC 0-6 18.80 Fert. Rate (lbs/ac) P2O5 40Soil Series Telstad Loam Soil Texture 0-6 n/a Fert. Rate (lbs/ac) K2O 25pH 0-6 8.10 Soil Texture 6-24 n/a Herbicide App. Date 5/17Org.Matter (%) 0-6 1.30 Soil Texture 24-36 n/a Herbicide Product Brox- MN (lbs/ac) 0-6 7.5 Soil Texture 36-48 n/a Herbicide Rate (/ac) 24 ozN (lbs/ac) 6-24 6.5 Init PAW (in.) 0-6" 1.05 Precip (in.) Plnt'g-Harvest n/aN (lbs/ac) 24-36 13 Init PAW (in.) 6-24" 4.23 Precip (>.1) Plnt'g-Harvest n/aN (lbs/ac) 36-48 5 Init PAW (in.) 24-36" 2.72 Harvest Date no harvestN (lbs/ac) 0-48 32 Init PAW (in.) 36-48" 1.66 Rooting Depth (in.) n/aP (ppm) Olsen 0-6 24 Init PAW (in.) 0-48" 9.66 Post PAW (in.) 0-6" n/aK (ppm) 0-6 284 Cropping System NT-ChmFlw Post PAW (in.) 6-24" n/aCa (ppm) 2909 Previous Crop Fdn SB Post PAW (in.) 24-36" n/aMg (ppm) 0-6 420 Planting Date 9/28 Post PAW (in.) 36-48" n/aNa (ppm) 0-6 17 Planting Depth (in.) 1.25 Post PAW (in.) 0-48" n/aSaltHaz(MMHOS/cm)0-6 0.45 Moist Soil Depth @ Plnt'g 48+ Precip (>.1) Hvst-Post n/a
Site Resource & Management Data: (Exp# 11-3502-WW)
NARC Agron-4
6
TABLE 2.
No. AVE. % 9-YRof for of COMP.
YEARS YEARS CHECK AVE.2/ VARIETY or SELECTION TESTED 2002 2003 2004 2005 2006 2007 2008 2009 2010 2011 TESTED YIELD YIELD
3/ 4/ 5/
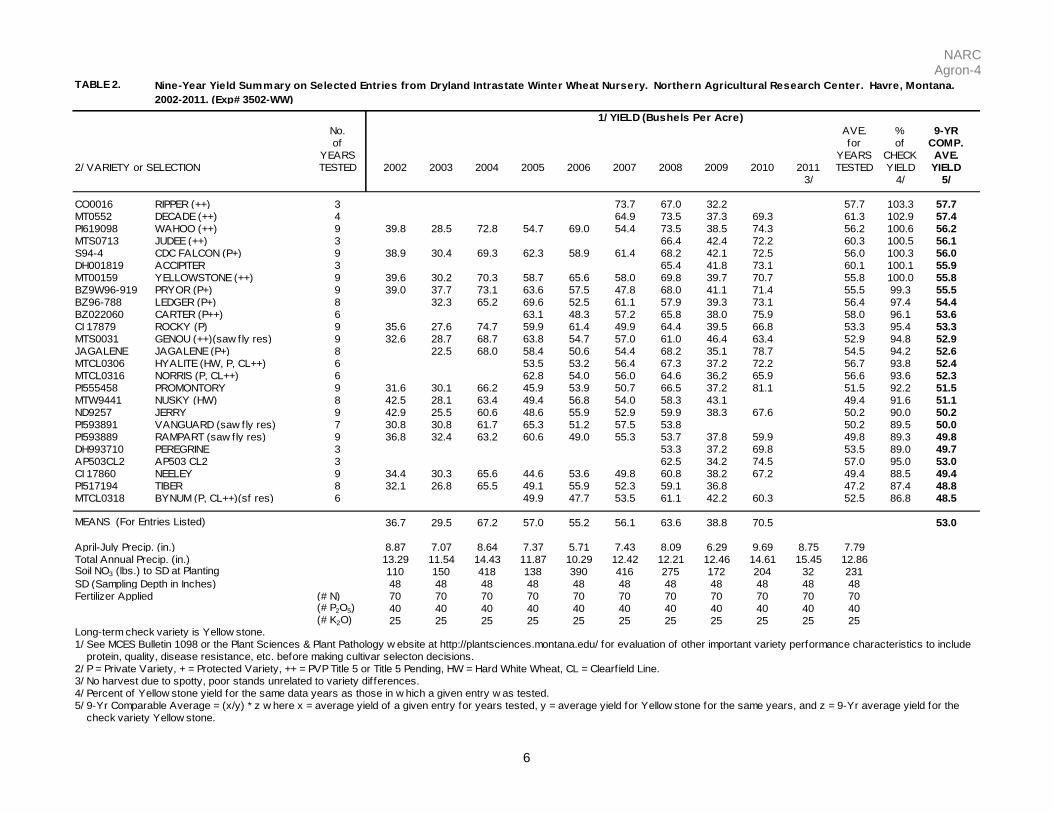
CO0016 RIPPER (++) 3 73.7 67.0 32.2 57.7 103.3 57.7MT0552 DECADE (++) 4 64.9 73.5 37.3 69.3 61.3 102.9 57.4PI619098 WAHOO (++) 9 39.8 28.5 72.8 54.7 69.0 54.4 73.5 38.5 74.3 56.2 100.6 56.2MTS0713 JUDEE (++) 3 66.4 42.4 72.2 60.3 100.5 56.1S94-4 CDC FALCON (P+) 9 38.9 30.4 69.3 62.3 58.9 61.4 68.2 42.1 72.5 56.0 100.3 56.0DH001819 ACCIPITER 3 65.4 41.8 73.1 60.1 100.1 55.9MT00159 YELLOWSTONE (++) 9 39.6 30.2 70.3 58.7 65.6 58.0 69.8 39.7 70.7 55.8 100.0 55.8BZ9W96-919 PRYOR (P+) 9 39.0 37.7 73.1 63.6 57.5 47.8 68.0 41.1 71.4 55.5 99.3 55.5BZ96-788 LEDGER (P+) 8 32.3 65.2 69.6 52.5 61.1 57.9 39.3 73.1 56.4 97.4 54.4BZ022060 CARTER (P++) 6 63.1 48.3 57.2 65.8 38.0 75.9 58.0 96.1 53.6CI 17879 ROCKY (P) 9 35.6 27.6 74.7 59.9 61.4 49.9 64.4 39.5 66.8 53.3 95.4 53.3MTS0031 GENOU (++)(saw fly res) 9 32.6 28.7 68.7 63.8 54.7 57.0 61.0 46.4 63.4 52.9 94.8 52.9JAGALENE JAGALENE (P+) 8 22.5 68.0 58.4 50.6 54.4 68.2 35.1 78.7 54.5 94.2 52.6MTCL0306 HYALITE (HW, P, CL++) 6 53.5 53.2 56.4 67.3 37.2 72.2 56.7 93.8 52.4MTCL0316 NORRIS (P, CL++) 6 62.8 54.0 56.0 64.6 36.2 65.9 56.6 93.6 52.3PI555458 PROMONTORY 9 31.6 30.1 66.2 45.9 53.9 50.7 66.5 37.2 81.1 51.5 92.2 51.5MTW9441 NUSKY (HW) 8 42.5 28.1 63.4 49.4 56.8 54.0 58.3 43.1 49.4 91.6 51.1ND9257 JERRY 9 42.9 25.5 60.6 48.6 55.9 52.9 59.9 38.3 67.6 50.2 90.0 50.2PI593891 VANGUARD (saw fly res) 7 30.8 30.8 61.7 65.3 51.2 57.5 53.8 50.2 89.5 50.0PI593889 RAMPART (saw fly res) 9 36.8 32.4 63.2 60.6 49.0 55.3 53.7 37.8 59.9 49.8 89.3 49.8DH993710 PEREGRINE 3 53.3 37.2 69.8 53.5 89.0 49.7AP503CL2 AP503 CL2 3 62.5 34.2 74.5 57.0 95.0 53.0CI 17860 NEELEY 9 34.4 30.3 65.6 44.6 53.6 49.8 60.8 38.2 67.2 49.4 88.5 49.4PI517194 TIBER 8 32.1 26.8 65.5 49.1 55.9 52.3 59.1 36.8 47.2 87.4 48.8MTCL0318 BYNUM (P, CL++)(sf res) 6 49.9 47.7 53.5 61.1 42.2 60.3 52.5 86.8 48.5
36.7 29.5 67.2 57.0 55.2 56.1 63.6 38.8 70.5 53.0
April-July Precip. (in.) 8.87 7.07 8.64 7.37 5.71 7.43 8.09 6.29 9.69 8.75 7.79Total Annual Precip. (in.) 13.29 11.54 14.43 11.87 10.29 12.42 12.21 12.46 14.61 15.45 12.86Soil NO3 (lbs.) to SD at Planting 110 150 418 138 390 416 275 172 204 32 231SD (Sampling Depth in Inches) 48 48 48 48 48 48 48 48 48 48 48Fertilizer Applied (# N) 70 70 70 70 70 70 70 70 70 70 70
(# P2O5) 40 40 40 40 40 40 40 40 40 40 40(# K2O) 25 25 25 25 25 25 25 25 25 25 25
Long-term check variety is Yellow stone.1/ See MCES Bulletin 1098 or the Plant Sciences & Plant Pathology w ebsite at http://plantsciences.montana.edu/ for evaluation of other important variety performance characteristics to include protein, quality, disease resistance, etc. before making cultivar selecton decisions.2/ P = Private Variety, + = Protected Variety, ++ = PVP Title 5 or Title 5 Pending, HW = Hard White Wheat, CL = Clearf ield Line.3/ No harvest due to spotty, poor stands unrelated to variety differences.4/ Percent of Yellow stone yield for the same data years as those in w hich a given entry w as tested.5/ 9-Yr Comparable Average = (x/y) * z w here x = average yield of a given entry for years tested, y = average yield for Yellow stone for the same years, and z = 9-Yr average yield for the check variety Yellow stone.
Nine-Year Yield Summary on Selected Entries from Dryland Intrastate Winter Wheat Nursery. Northern Agricultural Research Center. Havre, Montana. 2002-2011. (Exp# 3502-WW)
1/ YIELD (Bushels Per Acre)
MEANS (For Entries Listed)
NARC Agron-4
7
TABLE 3.
No. AVE. % 9-YRof for of COMP.
YEARS YEARS CHECK AVE.2/ VARIETY or SELECTION TESTED 2002 2003 2004 2005 2006 2007 2008 2009 2010 2011 TESTED TEST WTTEST WT
3/ 4/ 5/
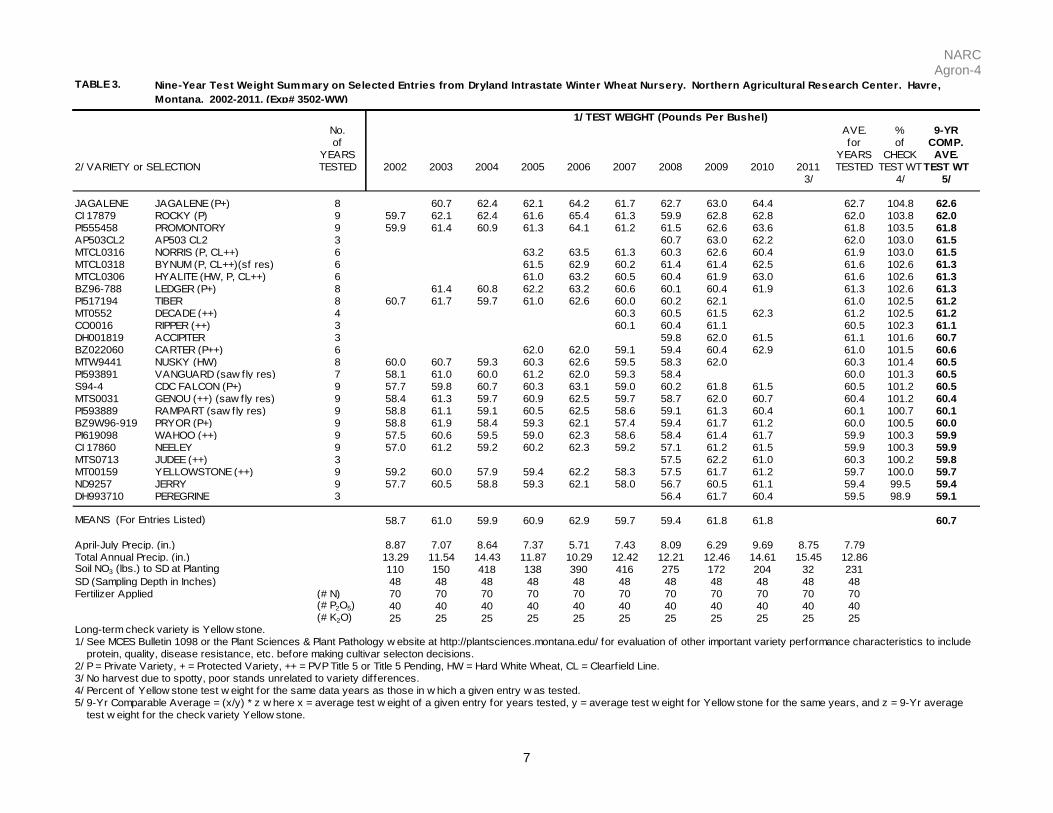
JAGALENE JAGALENE (P+) 8 60.7 62.4 62.1 64.2 61.7 62.7 63.0 64.4 62.7 104.8 62.6CI 17879 ROCKY (P) 9 59.7 62.1 62.4 61.6 65.4 61.3 59.9 62.8 62.8 62.0 103.8 62.0PI555458 PROMONTORY 9 59.9 61.4 60.9 61.3 64.1 61.2 61.5 62.6 63.6 61.8 103.5 61.8AP503CL2 AP503 CL2 3 60.7 63.0 62.2 62.0 103.0 61.5MTCL0316 NORRIS (P, CL++) 6 63.2 63.5 61.3 60.3 62.6 60.4 61.9 103.0 61.5MTCL0318 BYNUM (P, CL++)(sf res) 6 61.5 62.9 60.2 61.4 61.4 62.5 61.6 102.6 61.3MTCL0306 HYALITE (HW, P, CL++) 6 61.0 63.2 60.5 60.4 61.9 63.0 61.6 102.6 61.3BZ96-788 LEDGER (P+) 8 61.4 60.8 62.2 63.2 60.6 60.1 60.4 61.9 61.3 102.6 61.3PI517194 TIBER 8 60.7 61.7 59.7 61.0 62.6 60.0 60.2 62.1 61.0 102.5 61.2MT0552 DECADE (++) 4 60.3 60.5 61.5 62.3 61.2 102.5 61.2CO0016 RIPPER (++) 3 60.1 60.4 61.1 60.5 102.3 61.1DH001819 ACCIPITER 3 59.8 62.0 61.5 61.1 101.6 60.7BZ022060 CARTER (P++) 6 62.0 62.0 59.1 59.4 60.4 62.9 61.0 101.5 60.6MTW9441 NUSKY (HW) 8 60.0 60.7 59.3 60.3 62.6 59.5 58.3 62.0 60.3 101.4 60.5PI593891 VANGUARD (saw fly res) 7 58.1 61.0 60.0 61.2 62.0 59.3 58.4 60.0 101.3 60.5S94-4 CDC FALCON (P+) 9 57.7 59.8 60.7 60.3 63.1 59.0 60.2 61.8 61.5 60.5 101.2 60.5MTS0031 GENOU (++) (saw fly res) 9 58.4 61.3 59.7 60.9 62.5 59.7 58.7 62.0 60.7 60.4 101.2 60.4PI593889 RAMPART (saw fly res) 9 58.8 61.1 59.1 60.5 62.5 58.6 59.1 61.3 60.4 60.1 100.7 60.1BZ9W96-919 PRYOR (P+) 9 58.8 61.9 58.4 59.3 62.1 57.4 59.4 61.7 61.2 60.0 100.5 60.0PI619098 WAHOO (++) 9 57.5 60.6 59.5 59.0 62.3 58.6 58.4 61.4 61.7 59.9 100.3 59.9CI 17860 NEELEY 9 57.0 61.2 59.2 60.2 62.3 59.2 57.1 61.2 61.5 59.9 100.3 59.9MTS0713 JUDEE (++) 3 57.5 62.2 61.0 60.3 100.2 59.8MT00159 YELLOWSTONE (++) 9 59.2 60.0 57.9 59.4 62.2 58.3 57.5 61.7 61.2 59.7 100.0 59.7ND9257 JERRY 9 57.7 60.5 58.8 59.3 62.1 58.0 56.7 60.5 61.1 59.4 99.5 59.4DH993710 PEREGRINE 3 56.4 61.7 60.4 59.5 98.9 59.1
58.7 61.0 59.9 60.9 62.9 59.7 59.4 61.8 61.8 60.7
April-July Precip. (in.) 8.87 7.07 8.64 7.37 5.71 7.43 8.09 6.29 9.69 8.75 7.79Total Annual Precip. (in.) 13.29 11.54 14.43 11.87 10.29 12.42 12.21 12.46 14.61 15.45 12.86Soil NO3 (lbs.) to SD at Planting 110 150 418 138 390 416 275 172 204 32 231SD (Sampling Depth in Inches) 48 48 48 48 48 48 48 48 48 48 48Fertilizer Applied (# N) 70 70 70 70 70 70 70 70 70 70 70
(# P2O5) 40 40 40 40 40 40 40 40 40 40 40(# K2O) 25 25 25 25 25 25 25 25 25 25 25
Long-term check variety is Yellow stone.1/ See MCES Bulletin 1098 or the Plant Sciences & Plant Pathology w ebsite at http://plantsciences.montana.edu/ for evaluation of other important variety performance characteristics to include protein, quality, disease resistance, etc. before making cultivar selecton decisions.2/ P = Private Variety, + = Protected Variety, ++ = PVP Title 5 or Title 5 Pending, HW = Hard White Wheat, CL = Clearf ield Line.3/ No harvest due to spotty, poor stands unrelated to variety differences.4/ Percent of Yellow stone test w eight for the same data years as those in w hich a given entry w as tested.5/ 9-Yr Comparable Average = (x/y) * z w here x = average test w eight of a given entry for years tested, y = average test w eight for Yellow stone for the same years, and z = 9-Yr average test w eight for the check variety Yellow stone.
Nine-Year Test Weight Summary on Selected Entries from Dryland Intrastate Winter Wheat Nursery. Northern Agricultural Research Center. Havre, Montana. 2002-2011. (Exp# 3502-WW)
1/ TEST WEIGHT (Pounds Per Bushel)
MEANS (For Entries Listed)
NARC Agron-4
8
TABLE 4.
No. AVE. % 9-YRof for of COMP.
YEARS YEARS CHECK AVE.2/ VARIETY or SELECTION TESTED 2003 2004 2005 2006 2007 2008 2009 2010 2011 TESTED SAWFLY SAWFLY
3/ 4/
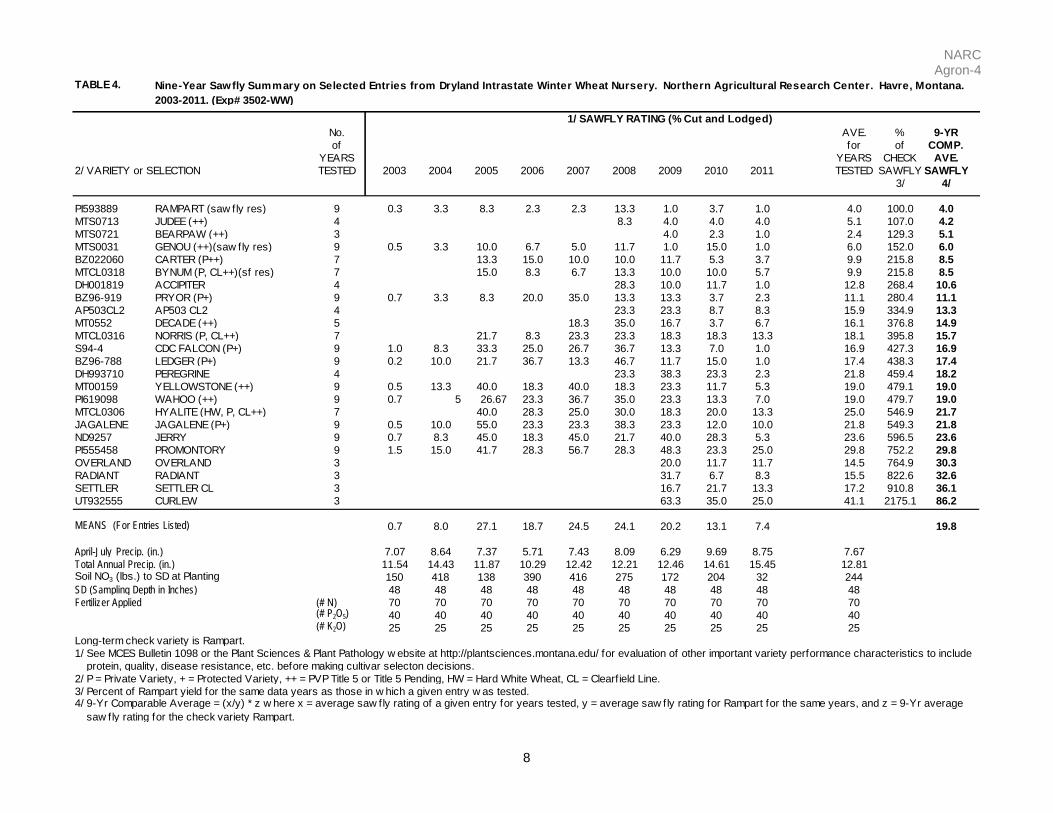
PI593889 RAMPART (saw fly res) 9 0.3 3.3 8.3 2.3 2.3 13.3 1.0 3.7 1.0 4.0 100.0 4.0MTS0713 JUDEE (++) 4 8.3 4.0 4.0 4.0 5.1 107.0 4.2MTS0721 BEARPAW (++) 3 4.0 2.3 1.0 2.4 129.3 5.1MTS0031 GENOU (++)(saw fly res) 9 0.5 3.3 10.0 6.7 5.0 11.7 1.0 15.0 1.0 6.0 152.0 6.0BZ022060 CARTER (P++) 7 13.3 15.0 10.0 10.0 11.7 5.3 3.7 9.9 215.8 8.5MTCL0318 BYNUM (P, CL++)(sf res) 7 15.0 8.3 6.7 13.3 10.0 10.0 5.7 9.9 215.8 8.5DH001819 ACCIPITER 4 28.3 10.0 11.7 1.0 12.8 268.4 10.6BZ96-919 PRYOR (P+) 9 0.7 3.3 8.3 20.0 35.0 13.3 13.3 3.7 2.3 11.1 280.4 11.1AP503CL2 AP503 CL2 4 23.3 23.3 8.7 8.3 15.9 334.9 13.3MT0552 DECADE (++) 5 18.3 35.0 16.7 3.7 6.7 16.1 376.8 14.9MTCL0316 NORRIS (P, CL++) 7 21.7 8.3 23.3 23.3 18.3 18.3 13.3 18.1 395.8 15.7S94-4 CDC FALCON (P+) 9 1.0 8.3 33.3 25.0 26.7 36.7 13.3 7.0 1.0 16.9 427.3 16.9BZ96-788 LEDGER (P+) 9 0.2 10.0 21.7 36.7 13.3 46.7 11.7 15.0 1.0 17.4 438.3 17.4DH993710 PEREGRINE 4 23.3 38.3 23.3 2.3 21.8 459.4 18.2MT00159 YELLOWSTONE (++) 9 0.5 13.3 40.0 18.3 40.0 18.3 23.3 11.7 5.3 19.0 479.1 19.0PI619098 WAHOO (++) 9 0.7 5 26.67 23.3 36.7 35.0 23.3 13.3 7.0 19.0 479.7 19.0MTCL0306 HYALITE (HW, P, CL++) 7 40.0 28.3 25.0 30.0 18.3 20.0 13.3 25.0 546.9 21.7JAGALENE JAGALENE (P+) 9 0.5 10.0 55.0 23.3 23.3 38.3 23.3 12.0 10.0 21.8 549.3 21.8ND9257 JERRY 9 0.7 8.3 45.0 18.3 45.0 21.7 40.0 28.3 5.3 23.6 596.5 23.6PI555458 PROMONTORY 9 1.5 15.0 41.7 28.3 56.7 28.3 48.3 23.3 25.0 29.8 752.2 29.8OVERLAND OVERLAND 3 20.0 11.7 11.7 14.5 764.9 30.3RADIANT RADIANT 3 31.7 6.7 8.3 15.5 822.6 32.6SETTLER SETTLER CL 3 16.7 21.7 13.3 17.2 910.8 36.1UT932555 CURLEW 3 63.3 35.0 25.0 41.1 2175.1 86.2
0.7 8.0 27.1 18.7 24.5 24.1 20.2 13.1 7.4 19.8
April-July Precip. (in.) 7.07 8.64 7.37 5.71 7.43 8.09 6.29 9.69 8.75 7.67Total Annual Precip. (in.) 11.54 14.43 11.87 10.29 12.42 12.21 12.46 14.61 15.45 12.81Soil NO3 (lbs.) to SD at Planting 150 418 138 390 416 275 172 204 32 244SD (Sampling Depth in Inches) 48 48 48 48 48 48 48 48 48 48Fertilizer Applied (# N) 70 70 70 70 70 70 70 70 70 70
(# P2O5) 40 40 40 40 40 40 40 40 40 40(# K2O) 25 25 25 25 25 25 25 25 25 25
Long-term check variety is Rampart.1/ See MCES Bulletin 1098 or the Plant Sciences & Plant Pathology w ebsite at http://plantsciences.montana.edu/ for evaluation of other important variety performance characteristics to include protein, quality, disease resistance, etc. before making cultivar selecton decisions.2/ P = Private Variety, + = Protected Variety, ++ = PVP Title 5 or Title 5 Pending, HW = Hard White Wheat, CL = Clearf ield Line.3/ Percent of Rampart yield for the same data years as those in w hich a given entry w as tested.4/ 9-Yr Comparable Average = (x/y) * z w here x = average saw fly rating of a given entry for years tested, y = average saw fly rating for Rampart for the same years, and z = 9-Yr average saw fly rating for the check variety Rampart.
Nine-Year Sawfly Summary on Selected Entries from Dryland Intrastate Winter Wheat Nursery. Northern Agricultural Research Center. Havre, Montana. 2003-2011. (Exp# 3502-WW)
1/ SAWFLY RATING (% Cut and Lodged)
MEANS (For Entries Listed)
NARC Agron-4
9
TABLE 5.
(Exp# 11-3102-SW)
1/ 2/ 3/ 4/ID CULTIVAR or SELECTION STAND HEAD PLNT HT YIELD MOIST TEST WT PROTEIN SAWFLY
% DATE Inches Bu/Ac % Lbs/Bu % %
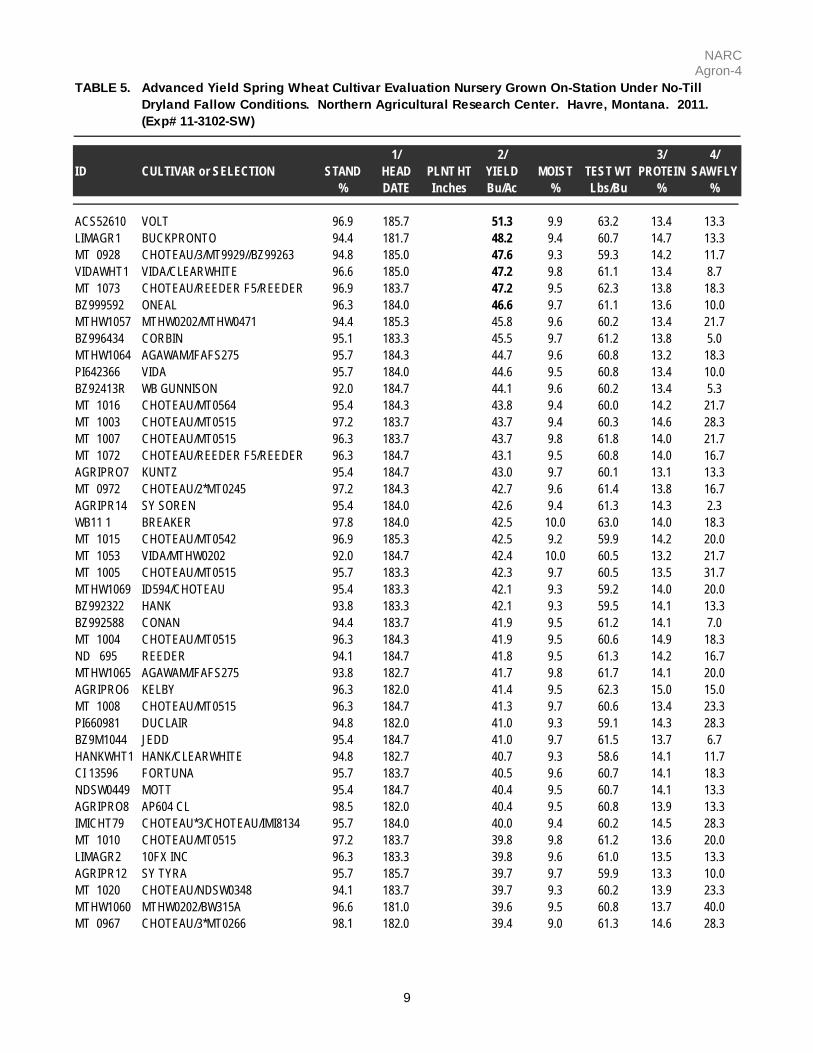
ACS52610 VOLT 96.9 185.7 51.3 9.9 63.2 13.4 13.3LIMAGR1 BUCKPRONTO 94.4 181.7 48.2 9.4 60.7 14.7 13.3MT 0928 CHOTEAU/3/MT9929//BZ99263 94.8 185.0 47.6 9.3 59.3 14.2 11.7VIDAWHT1 VIDA/CLEARWHITE 96.6 185.0 47.2 9.8 61.1 13.4 8.7MT 1073 CHOTEAU/REEDER F5/REEDER 96.9 183.7 47.2 9.5 62.3 13.8 18.3BZ999592 ONEAL 96.3 184.0 46.6 9.7 61.1 13.6 10.0MTHW1057 MTHW0202/MTHW0471 94.4 185.3 45.8 9.6 60.2 13.4 21.7BZ996434 CORBIN 95.1 183.3 45.5 9.7 61.2 13.8 5.0MTHW1064 AGAWAM/IFAFS275 95.7 184.3 44.7 9.6 60.8 13.2 18.3PI642366 VIDA 95.7 184.0 44.6 9.5 60.8 13.4 10.0BZ92413R WB GUNNISON 92.0 184.7 44.1 9.6 60.2 13.4 5.3MT 1016 CHOTEAU/MT0564 95.4 184.3 43.8 9.4 60.0 14.2 21.7MT 1003 CHOTEAU/MT0515 97.2 183.7 43.7 9.4 60.3 14.6 28.3MT 1007 CHOTEAU/MT0515 96.3 183.7 43.7 9.8 61.8 14.0 21.7MT 1072 CHOTEAU/REEDER F5/REEDER 96.3 184.7 43.1 9.5 60.8 14.0 16.7AGRIPRO7 KUNTZ 95.4 184.7 43.0 9.7 60.1 13.1 13.3MT 0972 CHOTEAU/2*MT0245 97.2 184.3 42.7 9.6 61.4 13.8 16.7AGRIPR14 SY SOREN 95.4 184.0 42.6 9.4 61.3 14.3 2.3WB11 1 BREAKER 97.8 184.0 42.5 10.0 63.0 14.0 18.3MT 1015 CHOTEAU/MT0542 96.9 185.3 42.5 9.2 59.9 14.2 20.0MT 1053 VIDA/MTHW0202 92.0 184.7 42.4 10.0 60.5 13.2 21.7MT 1005 CHOTEAU/MT0515 95.7 183.3 42.3 9.7 60.5 13.5 31.7MTHW1069 ID594/CHOTEAU 95.4 183.3 42.1 9.3 59.2 14.0 20.0BZ992322 HANK 93.8 183.3 42.1 9.3 59.5 14.1 13.3BZ992588 CONAN 94.4 183.7 41.9 9.5 61.2 14.1 7.0MT 1004 CHOTEAU/MT0515 96.3 184.3 41.9 9.5 60.6 14.9 18.3ND 695 REEDER 94.1 184.7 41.8 9.5 61.3 14.2 16.7MTHW1065 AGAWAM/IFAFS275 93.8 182.7 41.7 9.8 61.7 14.1 20.0AGRIPRO6 KELBY 96.3 182.0 41.4 9.5 62.3 15.0 15.0MT 1008 CHOTEAU/MT0515 96.3 184.7 41.3 9.7 60.6 13.4 23.3PI660981 DUCLAIR 94.8 182.0 41.0 9.3 59.1 14.3 28.3BZ9M1044 JEDD 95.4 184.7 41.0 9.7 61.5 13.7 6.7HANKWHT1 HANK/CLEARWHITE 94.8 182.7 40.7 9.3 58.6 14.1 11.7CI 13596 FORTUNA 95.7 183.7 40.5 9.6 60.7 14.1 18.3NDSW0449 MOTT 95.4 184.7 40.4 9.5 60.7 14.1 13.3AGRIPRO8 AP604 CL 98.5 182.0 40.4 9.5 60.8 13.9 13.3IMICHT79 CHOTEAU*3/CHOTEAU/IMI8134 95.7 184.0 40.0 9.4 60.2 14.5 28.3MT 1010 CHOTEAU/MT0515 97.2 183.7 39.8 9.8 61.2 13.6 20.0LIMAGR2 10FX INC 96.3 183.3 39.8 9.6 61.0 13.5 13.3AGRIPR12 SY TYRA 95.7 185.7 39.7 9.7 59.9 13.3 10.0MT 1020 CHOTEAU/NDSW0348 94.1 183.7 39.7 9.3 60.2 13.9 23.3MTHW1060 MTHW0202/BW315A 96.6 181.0 39.6 9.5 60.8 13.7 40.0MT 0967 CHOTEAU/3*MT0266 98.1 182.0 39.4 9.0 61.3 14.6 28.3
Advanced Yield Spring Wheat Cultivar Evaluation Nursery Grown On-Station Under No-Till Dryland Fallow Conditions. Northern Agricultural Research Center. Havre, Montana. 2011.
NARC Agron-4
10
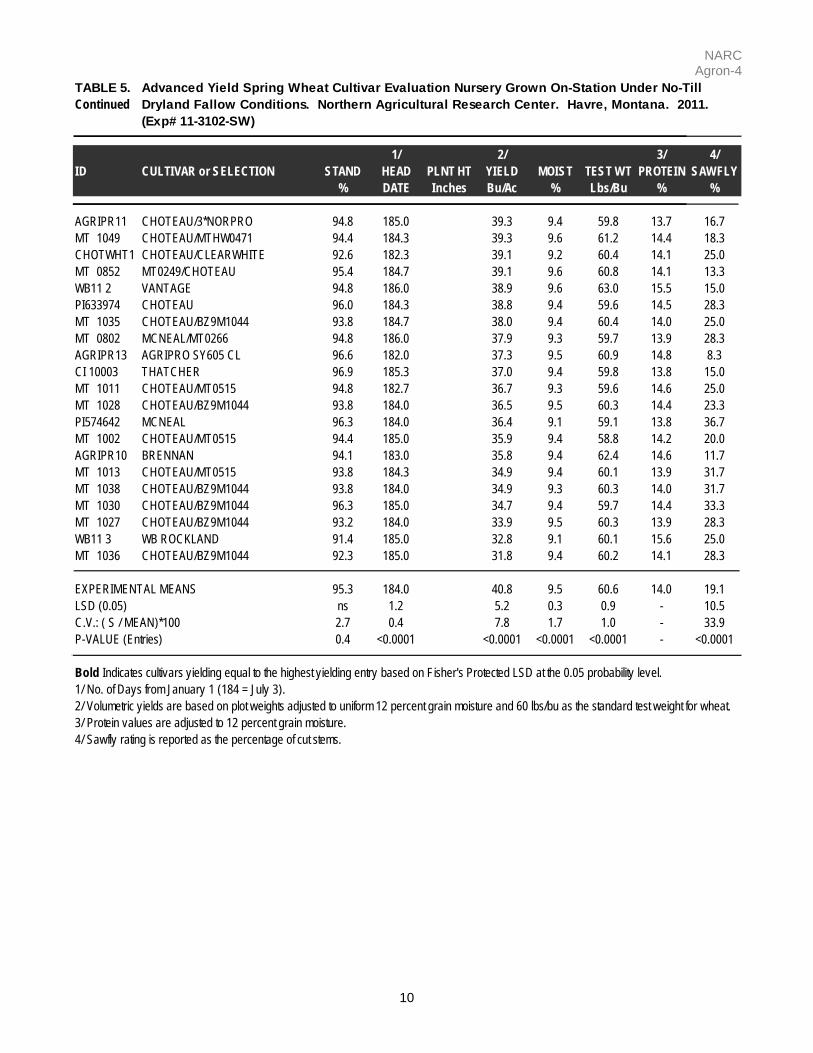
TABLE 5.Continued
(Exp# 11-3102-SW)
1/ 2/ 3/ 4/ID CULTIVAR or SELECTION STAND HEAD PLNT HT YIELD MOIST TEST WT PROTEIN SAWFLY
% DATE Inches Bu/Ac % Lbs/Bu % %
AGRIPR11 CHOTEAU/3*NORPRO 94.8 185.0 39.3 9.4 59.8 13.7 16.7MT 1049 CHOTEAU/MTHW0471 94.4 184.3 39.3 9.6 61.2 14.4 18.3CHOTWHT1 CHOTEAU/CLEARWHITE 92.6 182.3 39.1 9.2 60.4 14.1 25.0MT 0852 MT0249/CHOTEAU 95.4 184.7 39.1 9.6 60.8 14.1 13.3WB11 2 VANTAGE 94.8 186.0 38.9 9.6 63.0 15.5 15.0PI633974 CHOTEAU 96.0 184.3 38.8 9.4 59.6 14.5 28.3MT 1035 CHOTEAU/BZ9M1044 93.8 184.7 38.0 9.4 60.4 14.0 25.0MT 0802 MCNEAL/MT0266 94.8 186.0 37.9 9.3 59.7 13.9 28.3AGRIPR13 AGRIPRO SY605 CL 96.6 182.0 37.3 9.5 60.9 14.8 8.3CI 10003 THATCHER 96.9 185.3 37.0 9.4 59.8 13.8 15.0MT 1011 CHOTEAU/MT0515 94.8 182.7 36.7 9.3 59.6 14.6 25.0MT 1028 CHOTEAU/BZ9M1044 93.8 184.0 36.5 9.5 60.3 14.4 23.3PI574642 MCNEAL 96.3 184.0 36.4 9.1 59.1 13.8 36.7MT 1002 CHOTEAU/MT0515 94.4 185.0 35.9 9.4 58.8 14.2 20.0AGRIPR10 BRENNAN 94.1 183.0 35.8 9.4 62.4 14.6 11.7MT 1013 CHOTEAU/MT0515 93.8 184.3 34.9 9.4 60.1 13.9 31.7MT 1038 CHOTEAU/BZ9M1044 93.8 184.0 34.9 9.3 60.3 14.0 31.7MT 1030 CHOTEAU/BZ9M1044 96.3 185.0 34.7 9.4 59.7 14.4 33.3MT 1027 CHOTEAU/BZ9M1044 93.2 184.0 33.9 9.5 60.3 13.9 28.3WB11 3 WB ROCKLAND 91.4 185.0 32.8 9.1 60.1 15.6 25.0MT 1036 CHOTEAU/BZ9M1044 92.3 185.0 31.8 9.4 60.2 14.1 28.3
95.3 184.0 40.8 9.5 60.6 14.0 19.1LSD (0.05) ns 1.2 5.2 0.3 0.9 - 10.5C.V.: ( S / MEAN)*100 2.7 0.4 7.8 1.7 1.0 - 33.9P-VALUE (Entries) 0.4 <0.0001 <0.0001 <0.0001 <0.0001 - <0.0001
Bold Indicates cultivars yielding equal to the highest yielding entry based on Fisher's Protected LSD at the 0.05 probability level.1/ No. of Days from January 1 (184 = July 3).2/ Volumetric yields are based on plot weights adjusted to uniform 12 percent grain moisture and 60 lbs/bu as the standard test weight for wheat.3/ Protein values are adjusted to 12 percent grain moisture.4/ Sawfly rating is reported as the percentage of cut stems.
Advanced Yield Spring Wheat Cultivar Evaluation Nursery Grown On-Station Under No-Till Dryland Fallow Conditions. Northern Agricultural Research Center. Havre, Montana. 2011.
EXPERIMENTAL MEANS
NARC Agron-4
11
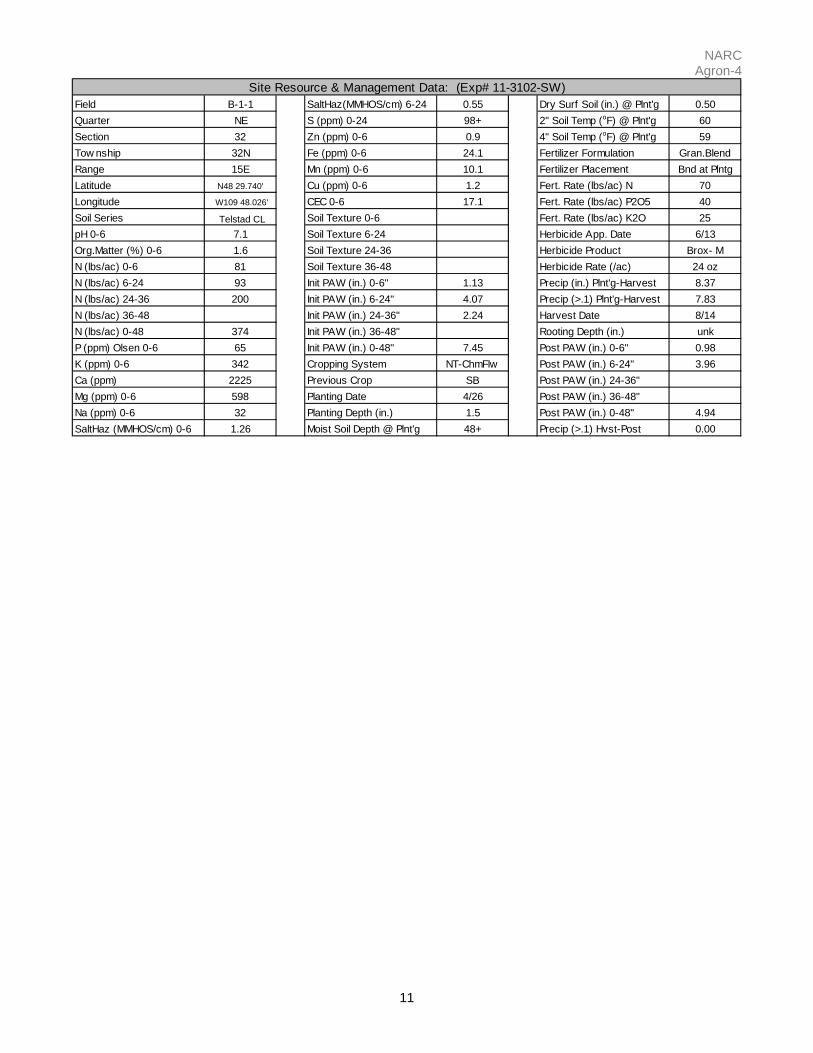
Field B-1-1 SaltHaz(MMHOS/cm) 6-24 0.55 Dry Surf Soil (in.) @ Plnt'g 0.50Quarter NE S (ppm) 0-24 98+ 2" Soil Temp (oF) @ Plnt'g 60Section 32 Zn (ppm) 0-6 0.9 4" Soil Temp (oF) @ Plnt'g 59Tow nship 32N Fe (ppm) 0-6 24.1 Fertilizer Formulation Gran.BlendRange 15E Mn (ppm) 0-6 10.1 Fertilizer Placement Bnd at PlntgLatitude N48 29.740' Cu (ppm) 0-6 1.2 Fert. Rate (lbs/ac) N 70Longitude W109 48.026' CEC 0-6 17.1 Fert. Rate (lbs/ac) P2O5 40Soil Series Telstad CL Soil Texture 0-6 Fert. Rate (lbs/ac) K2O 25pH 0-6 7.1 Soil Texture 6-24 Herbicide App. Date 6/13Org.Matter (%) 0-6 1.6 Soil Texture 24-36 Herbicide Product Brox- MN (lbs/ac) 0-6 81 Soil Texture 36-48 Herbicide Rate (/ac) 24 ozN (lbs/ac) 6-24 93 Init PAW (in.) 0-6" 1.13 Precip (in.) Plnt'g-Harvest 8.37N (lbs/ac) 24-36 200 Init PAW (in.) 6-24" 4.07 Precip (>.1) Plnt'g-Harvest 7.83N (lbs/ac) 36-48 Init PAW (in.) 24-36" 2.24 Harvest Date 8/14N (lbs/ac) 0-48 374 Init PAW (in.) 36-48" Rooting Depth (in.) unkP (ppm) Olsen 0-6 65 Init PAW (in.) 0-48" 7.45 Post PAW (in.) 0-6" 0.98K (ppm) 0-6 342 Cropping System NT-ChmFlw Post PAW (in.) 6-24" 3.96Ca (ppm) 2225 Previous Crop SB Post PAW (in.) 24-36"Mg (ppm) 0-6 598 Planting Date 4/26 Post PAW (in.) 36-48"Na (ppm) 0-6 32 Planting Depth (in.) 1.5 Post PAW (in.) 0-48" 4.94SaltHaz (MMHOS/cm) 0-6 1.26 Moist Soil Depth @ Plnt'g 48+ Precip (>.1) Hvst-Post 0.00
Site Resource & Management Data: (Exp# 11-3102-SW)
NARC Agron-4
12
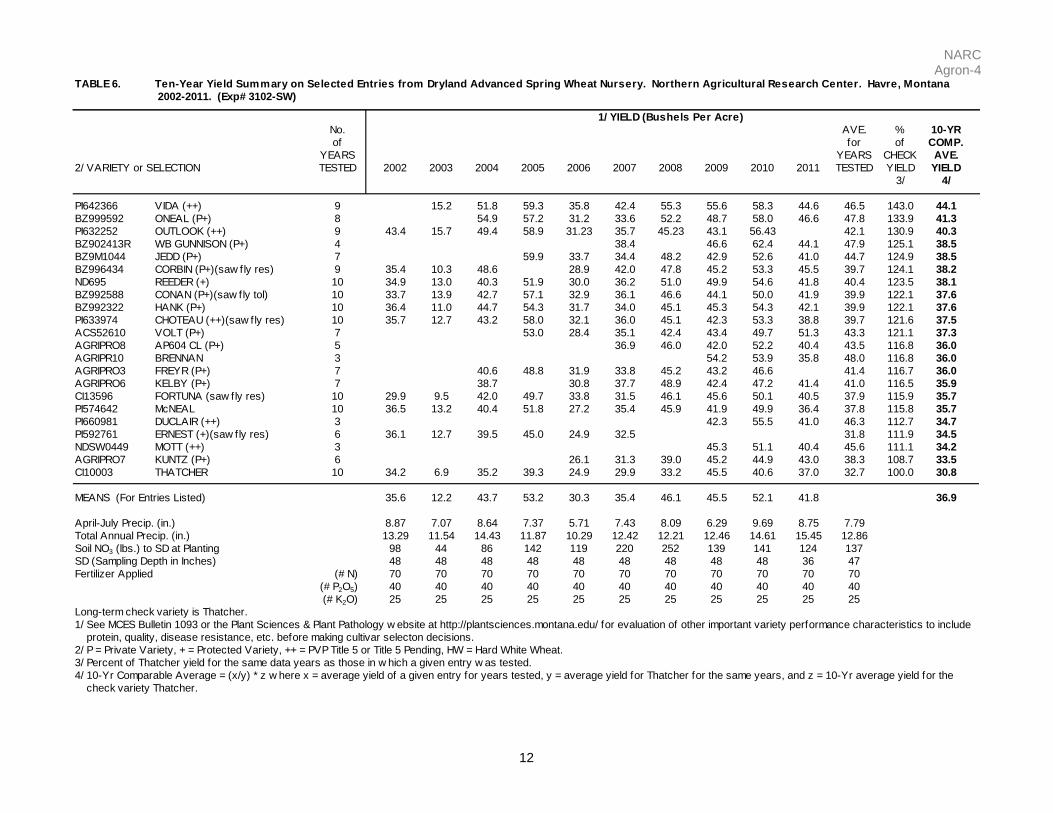
TABLE 6. 2002-2011. (Exp# 3102-SW)
No. AVE. % 10-YRof for of COMP.
YEARS YEARS CHECK AVE.2/ VARIETY or SELECTION TESTED 2002 2003 2004 2005 2006 2007 2008 2009 2010 2011 TESTED YIELD YIELD
3/ 4/
PI642366 VIDA (++) 9 15.2 51.8 59.3 35.8 42.4 55.3 55.6 58.3 44.6 46.5 143.0 44.1BZ999592 ONEAL (P+) 8 54.9 57.2 31.2 33.6 52.2 48.7 58.0 46.6 47.8 133.9 41.3PI632252 OUTLOOK (++) 9 43.4 15.7 49.4 58.9 31.23 35.7 45.23 43.1 56.43 42.1 130.9 40.3BZ902413R WB GUNNISON (P+) 4 38.4 46.6 62.4 44.1 47.9 125.1 38.5BZ9M1044 JEDD (P+) 7 59.9 33.7 34.4 48.2 42.9 52.6 41.0 44.7 124.9 38.5BZ996434 CORBIN (P+)(saw fly res) 9 35.4 10.3 48.6 28.9 42.0 47.8 45.2 53.3 45.5 39.7 124.1 38.2ND695 REEDER (+) 10 34.9 13.0 40.3 51.9 30.0 36.2 51.0 49.9 54.6 41.8 40.4 123.5 38.1BZ992588 CONAN (P+)(saw fly tol) 10 33.7 13.9 42.7 57.1 32.9 36.1 46.6 44.1 50.0 41.9 39.9 122.1 37.6BZ992322 HANK (P+) 10 36.4 11.0 44.7 54.3 31.7 34.0 45.1 45.3 54.3 42.1 39.9 122.1 37.6PI633974 CHOTEAU (++)(saw fly res) 10 35.7 12.7 43.2 58.0 32.1 36.0 45.1 42.3 53.3 38.8 39.7 121.6 37.5ACS52610 VOLT (P+) 7 53.0 28.4 35.1 42.4 43.4 49.7 51.3 43.3 121.1 37.3AGRIPRO8 AP604 CL (P+) 5 36.9 46.0 42.0 52.2 40.4 43.5 116.8 36.0AGRIPR10 BRENNAN 3 54.2 53.9 35.8 48.0 116.8 36.0AGRIPRO3 FREYR (P+) 7 40.6 48.8 31.9 33.8 45.2 43.2 46.6 41.4 116.7 36.0AGRIPRO6 KELBY (P+) 7 38.7 30.8 37.7 48.9 42.4 47.2 41.4 41.0 116.5 35.9CI13596 FORTUNA (saw fly res) 10 29.9 9.5 42.0 49.7 33.8 31.5 46.1 45.6 50.1 40.5 37.9 115.9 35.7PI574642 McNEAL 10 36.5 13.2 40.4 51.8 27.2 35.4 45.9 41.9 49.9 36.4 37.8 115.8 35.7PI660981 DUCLAIR (++) 3 42.3 55.5 41.0 46.3 112.7 34.7PI592761 ERNEST (+)(saw fly res) 6 36.1 12.7 39.5 45.0 24.9 32.5 31.8 111.9 34.5NDSW0449 MOTT (++) 3 45.3 51.1 40.4 45.6 111.1 34.2AGRIPRO7 KUNTZ (P+) 6 26.1 31.3 39.0 45.2 44.9 43.0 38.3 108.7 33.5CI10003 THATCHER 10 34.2 6.9 35.2 39.3 24.9 29.9 33.2 45.5 40.6 37.0 32.7 100.0 30.8
35.6 12.2 43.7 53.2 30.3 35.4 46.1 45.5 52.1 41.8 36.9
April-July Precip. (in.) 8.87 7.07 8.64 7.37 5.71 7.43 8.09 6.29 9.69 8.75 7.79Total Annual Precip. (in.) 13.29 11.54 14.43 11.87 10.29 12.42 12.21 12.46 14.61 15.45 12.86Soil NO3 (lbs.) to SD at Planting 98 44 86 142 119 220 252 139 141 124 137SD (Sampling Depth in Inches) 48 48 48 48 48 48 48 48 48 36 47Fertilizer Applied (# N) 70 70 70 70 70 70 70 70 70 70 70
(# P2O5) 40 40 40 40 40 40 40 40 40 40 40(# K2O) 25 25 25 25 25 25 25 25 25 25 25
Long-term check variety is Thatcher.1/ See MCES Bulletin 1093 or the Plant Sciences & Plant Pathology w ebsite at http://plantsciences.montana.edu/ for evaluation of other important variety performance characteristics to include protein, quality, disease resistance, etc. before making cultivar selecton decisions.2/ P = Private Variety, + = Protected Variety, ++ = PVP Title 5 or Title 5 Pending, HW = Hard White Wheat.3/ Percent of Thatcher yield for the same data years as those in w hich a given entry w as tested.4/ 10-Yr Comparable Average = (x/y) * z w here x = average yield of a given entry for years tested, y = average yield for Thatcher for the same years, and z = 10-Yr average yield for the check variety Thatcher.
Ten-Year Yield Summary on Selected Entries from Dryland Advanced Spring Wheat Nursery. Northern Agricultural Research Center. Havre, Montana
1/ YIELD (Bushels Per Acre)
MEANS (For Entries Listed)

NARC Agron-4
13
TABLE 7.
No. AVE. % 10-YRof for of COMP.
YEARS YEARS CHECK AVE.2/ VARIETY or SELECTION TESTED 2002 2003 2004 2005 2006 2007 2008 2009 2010 2011 TESTED TEST WTTEST WT
3/ 4/
AGRIPRO6 KELBY (P+) 7 60.0 57.2 59.2 59.6 59.5 58.2 62.3 59.4 107.6 59.3PI592761 ERNEST (+)(saw fly res) 6 60.0 56.8 59.4 56.9 54.5 57.3 57.5 107.2 59.1BZ992588 CONAN (P+) (saw fly tol) 10 61.1 56.6 59.9 59.4 54.6 57.5 58.6 59.8 58.5 61.2 58.7 106.6 58.7ACS52610 VOLT (P+) 7 60.1 56.4 57.5 59.1 59.8 58.0 63.2 59.2 106.5 58.7BZ996434 CORBIN (P+)(saw fly res) 9 60.9 57.7 60.1 54.7 57.6 57.0 59.9 57.2 61.2 58.5 106.3 58.6AGRIPRO3 FREYR (P+) 7 61.0 58.8 55.1 57.1 56.9 59.4 57.8 58.0 106.1 58.5CI13596 FORTUNA (saw fly res) 10 59.2 56.8 59.2 59.2 56.0 56.8 58.8 59.4 57.7 60.7 58.4 105.9 58.4ND695 REEDER (+) 10 60.6 57.4 58.9 58.6 53.6 56.8 58.2 60.0 57.8 61.3 58.3 105.8 58.3BZ999592 ONEAL (P+) 8 60.5 58.8 54.1 56.0 57.8 60.6 58.9 61.1 58.5 105.7 58.3BZ9M1044 JEDD (P+) 7 59.9 55.5 58.1 57.9 59.7 57.4 61.5 58.6 105.5 58.1BZ902413(R) WB GUNNISON (P+) 6 54.3 57.4 59.0 60.2 59.5 60.2 58.4 105.3 58.0PI642366 VIDA (++) 9 55.9 58.6 57.8 52.0 55.8 58.6 58.8 57.7 60.8 57.3 104.7 57.7AGRIPRO8 AP604 CL (P+) 5 57.9 58.6 59.9 57.6 60.8 59.0 104.6 57.6PI633974 CHOTEAU (+)(saw fly res) 10 60.2 57.8 59.5 58.7 52.8 55.7 56.3 57.9 56.5 59.6 57.5 104.3 57.5PI632252 OUTLOOK (++) 9 59.9 54.3 57.6 58.0 51.3 55.3 57.0 59.2 56.4 56.6 103.6 57.1AGRIPR10 BRENNAN 3 59.3 58.4 62.4 60.0 103.4 57.0BZ992322 HANK (P+) 10 59.6 56.5 58.3 55.2 53.7 54.9 56.2 58.8 55.4 59.5 56.8 103.1 56.8AGRIPRO7 KUNTZ (P+) 6 55.3 56.3 55.7 58.4 56.7 60.1 57.1 102.9 56.7PI574642 McNEAL 10 60.1 54.0 57.0 57.3 52.7 54.5 56.0 58.5 57.4 59.1 56.7 102.8 56.7NDSW0449 MOTT (++) 3 58.0 56.4 60.7 58.3 100.5 55.4PI660981 DUCLAIR (++) 3 57.8 57.3 59.1 58.1 100.0 55.1CI10003 THATCHER 10 58.3 50.3 53.8 55.8 51.1 52.5 55.1 58.9 55.5 59.8 55.1 100.0 55.1
60.0 55.8 58.8 58.2 54.2 56.5 57.6 59.2 57.4 60.8 57.6
April-July Precip. (in.) 8.87 7.07 8.64 7.37 5.71 7.43 8.09 6.29 9.69 8.75 7.79Total Annual Precip. (in.) 13.29 11.54 14.43 11.87 10.29 12.42 12.21 12.46 14.61 15.45 12.86Soil NO3 (lbs.) to SD at Planting 98 44 86 142 119 220 252 139 141 124 137SD (Sampling Depth in Inches) 48 48 48 48 48 48 48 48 48 36 47Fertilizer Applied (# N) 70 70 70 70 70 70 70 70 70 70 70
(# P2O5) 40 40 40 40 40 40 40 40 40 40 40(# K2O) 25 25 25 25 25 25 25 25 25 25 25
Long-term check variety is Thatcher.1/ See MCES Bulletin 1093 or the Plant Sciences & Plant Pathology w ebsite at http://plantsciences.montana.edu/ for evaluation of other important variety performance characteristics to include protein, quality, disease resistance, etc. before making cultivar selecton decisions.2/ P = Private Variety, + = Protected Variety, ++ = PVP Title 5 or Title 5 Pending, HW = Hard White Wheat.3/ Percent of Thatcher test w eight for the same data years as those in w hich a given entry w as tested.4/ 10-Yr Comparable Average = (x/y) * z w here x = average test w eight of a given entry for years tested, y = average test w eight for Thatcher for the same years, and z = 10-Yr average test w eight for the check variety Thatcher.
Ten-Year Test Weight Summary on Selected Entries from Dryland Advanced Spring Wheat Nursery. Northern Agricultural Research Center. Havre, Montana. 2002-2011. (Exp# 3102-SW)
1/ TEST WEIGHT (Pounds Per Bushel)
MEANS (For Entries Listed)
NARC Agron-4
14
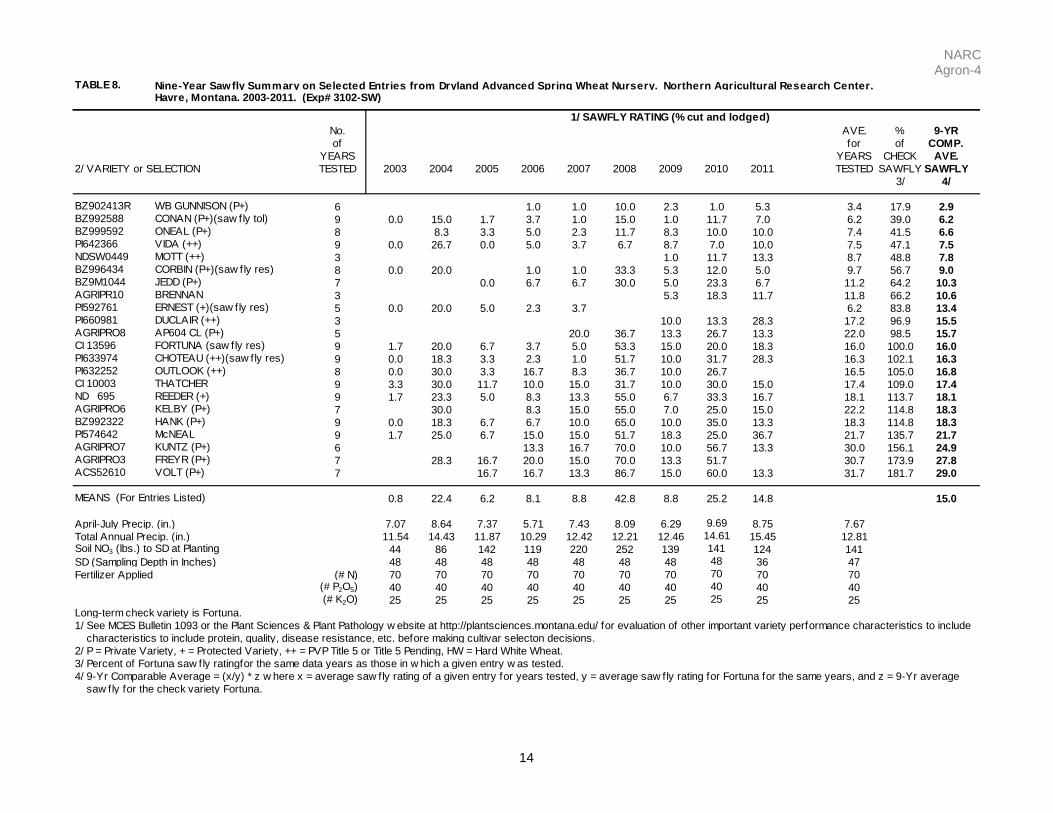
TABLE 8.Havre, Montana. 2003-2011. (Exp# 3102-SW)
No. AVE. % 9-YRof for of COMP.
YEARS YEARS CHECK AVE.2/ VARIETY or SELECTION TESTED 2003 2004 2005 2006 2007 2008 2009 2010 2011 TESTED SAWFLY SAWFLY
3/ 4/
BZ902413R WB GUNNISON (P+) 6 1.0 1.0 10.0 2.3 1.0 5.3 3.4 17.9 2.9BZ992588 CONAN (P+)(saw fly tol) 9 0.0 15.0 1.7 3.7 1.0 15.0 1.0 11.7 7.0 6.2 39.0 6.2BZ999592 ONEAL (P+) 8 8.3 3.3 5.0 2.3 11.7 8.3 10.0 10.0 7.4 41.5 6.6PI642366 VIDA (++) 9 0.0 26.7 0.0 5.0 3.7 6.7 8.7 7.0 10.0 7.5 47.1 7.5NDSW0449 MOTT (++) 3 1.0 11.7 13.3 8.7 48.8 7.8BZ996434 CORBIN (P+)(saw fly res) 8 0.0 20.0 1.0 1.0 33.3 5.3 12.0 5.0 9.7 56.7 9.0BZ9M1044 JEDD (P+) 7 0.0 6.7 6.7 30.0 5.0 23.3 6.7 11.2 64.2 10.3AGRIPR10 BRENNAN 3 5.3 18.3 11.7 11.8 66.2 10.6PI592761 ERNEST (+)(saw fly res) 5 0.0 20.0 5.0 2.3 3.7 6.2 83.8 13.4PI660981 DUCLAIR (++) 3 10.0 13.3 28.3 17.2 96.9 15.5AGRIPRO8 AP604 CL (P+) 5 20.0 36.7 13.3 26.7 13.3 22.0 98.5 15.7CI 13596 FORTUNA (saw fly res) 9 1.7 20.0 6.7 3.7 5.0 53.3 15.0 20.0 18.3 16.0 100.0 16.0PI633974 CHOTEAU (++)(saw fly res) 9 0.0 18.3 3.3 2.3 1.0 51.7 10.0 31.7 28.3 16.3 102.1 16.3PI632252 OUTLOOK (++) 8 0.0 30.0 3.3 16.7 8.3 36.7 10.0 26.7 16.5 105.0 16.8CI 10003 THATCHER 9 3.3 30.0 11.7 10.0 15.0 31.7 10.0 30.0 15.0 17.4 109.0 17.4ND 695 REEDER (+) 9 1.7 23.3 5.0 8.3 13.3 55.0 6.7 33.3 16.7 18.1 113.7 18.1AGRIPRO6 KELBY (P+) 7 30.0 8.3 15.0 55.0 7.0 25.0 15.0 22.2 114.8 18.3BZ992322 HANK (P+) 9 0.0 18.3 6.7 6.7 10.0 65.0 10.0 35.0 13.3 18.3 114.8 18.3PI574642 McNEAL 9 1.7 25.0 6.7 15.0 15.0 51.7 18.3 25.0 36.7 21.7 135.7 21.7AGRIPRO7 KUNTZ (P+) 6 13.3 16.7 70.0 10.0 56.7 13.3 30.0 156.1 24.9AGRIPRO3 FREYR (P+) 7 28.3 16.7 20.0 15.0 70.0 13.3 51.7 30.7 173.9 27.8ACS52610 VOLT (P+) 7 16.7 16.7 13.3 86.7 15.0 60.0 13.3 31.7 181.7 29.0
0.8 22.4 6.2 8.1 8.8 42.8 8.8 25.2 14.8 15.0
April-July Precip. (in.) 7.07 8.64 7.37 5.71 7.43 8.09 6.29 9.69 8.75 7.67Total Annual Precip. (in.) 11.54 14.43 11.87 10.29 12.42 12.21 12.46 14.61 15.45 12.81Soil NO3 (lbs.) to SD at Planting 44 86 142 119 220 252 139 141 124 141SD (Sampling Depth in Inches) 48 48 48 48 48 48 48 48 36 47Fertilizer Applied (# N) 70 70 70 70 70 70 70 70 70 70
(# P2O5) 40 40 40 40 40 40 40 40 40 40(# K2O) 25 25 25 25 25 25 25 25 25 25
Long-term check variety is Fortuna.1/ See MCES Bulletin 1093 or the Plant Sciences & Plant Pathology w ebsite at http://plantsciences.montana.edu/ for evaluation of other important variety performance characteristics to include characteristics to include protein, quality, disease resistance, etc. before making cultivar selecton decisions.2/ P = Private Variety, + = Protected Variety, ++ = PVP Title 5 or Title 5 Pending, HW = Hard White Wheat.3/ Percent of Fortuna saw fly ratingfor the same data years as those in w hich a given entry w as tested.4/ 9-Yr Comparable Average = (x/y) * z w here x = average saw fly rating of a given entry for years tested, y = average saw fly rating for Fortuna for the same years, and z = 9-Yr average saw fly for the check variety Fortuna.
Nine-Year Sawfly Summary on Selected Entries from Dryland Advanced Spring Wheat Nursery. Northern Agricultural Research Center.
1/ SAWFLY RATING (% cut and lodged)
MEANS (For Entries Listed)
NARC Agron-4
15
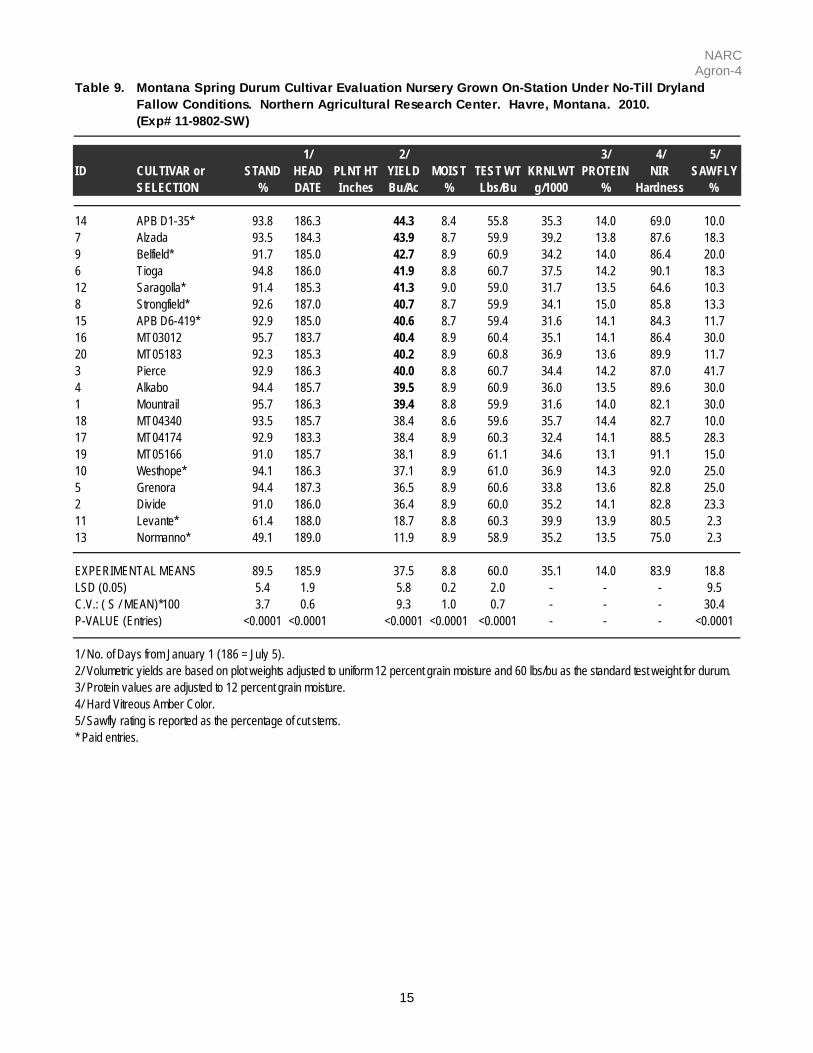
Table 9.
(Exp# 11-9802-SW)
1/ 2/ 3/ 4/ 5/ID CULTIVAR or STAND HEAD PLNT HT YIELD MOIST TEST WT KRNLWT PROTEIN NIR SAWFLY
SELECTION % DATE Inches Bu/Ac % Lbs/Bu g/1000 % Hardness %
14 APB D1-35* 93.8 186.3 44.3 8.4 55.8 35.3 14.0 69.0 10.07 Alzada 93.5 184.3 43.9 8.7 59.9 39.2 13.8 87.6 18.39 Belfield* 91.7 185.0 42.7 8.9 60.9 34.2 14.0 86.4 20.06 Tioga 94.8 186.0 41.9 8.8 60.7 37.5 14.2 90.1 18.312 Saragolla* 91.4 185.3 41.3 9.0 59.0 31.7 13.5 64.6 10.38 Strongfield* 92.6 187.0 40.7 8.7 59.9 34.1 15.0 85.8 13.315 APB D6-419* 92.9 185.0 40.6 8.7 59.4 31.6 14.1 84.3 11.716 MT03012 95.7 183.7 40.4 8.9 60.4 35.1 14.1 86.4 30.020 MT05183 92.3 185.3 40.2 8.9 60.8 36.9 13.6 89.9 11.73 Pierce 92.9 186.3 40.0 8.8 60.7 34.4 14.2 87.0 41.74 Alkabo 94.4 185.7 39.5 8.9 60.9 36.0 13.5 89.6 30.01 Mountrail 95.7 186.3 39.4 8.8 59.9 31.6 14.0 82.1 30.018 MT04340 93.5 185.7 38.4 8.6 59.6 35.7 14.4 82.7 10.017 MT04174 92.9 183.3 38.4 8.9 60.3 32.4 14.1 88.5 28.319 MT05166 91.0 185.7 38.1 8.9 61.1 34.6 13.1 91.1 15.010 Westhope* 94.1 186.3 37.1 8.9 61.0 36.9 14.3 92.0 25.05 Grenora 94.4 187.3 36.5 8.9 60.6 33.8 13.6 82.8 25.02 Divide 91.0 186.0 36.4 8.9 60.0 35.2 14.1 82.8 23.311 Levante* 61.4 188.0 18.7 8.8 60.3 39.9 13.9 80.5 2.313 Normanno* 49.1 189.0 11.9 8.9 58.9 35.2 13.5 75.0 2.3
EXPERIMENTAL MEANS 89.5 185.9 37.5 8.8 60.0 35.1 14.0 83.9 18.8LSD (0.05) 5.4 1.9 5.8 0.2 2.0 - - - 9.5C.V.: ( S / MEAN)*100 3.7 0.6 9.3 1.0 0.7 - - - 30.4P-VALUE (Entries) <0.0001 <0.0001 <0.0001 <0.0001 <0.0001 - - - <0.0001
1/ No. of Days from January 1 (186 = July 5).2/ Volumetric yields are based on plot weights adjusted to uniform 12 percent grain moisture and 60 lbs/bu as the standard test weight for durum.3/ Protein values are adjusted to 12 percent grain moisture.4/ Hard Vitreous Amber Color.5/ Sawfly rating is reported as the percentage of cut stems.* Paid entries.
Montana Spring Durum Cultivar Evaluation Nursery Grown On-Station Under No-Till Dryland Fallow Conditions. Northern Agricultural Research Center. Havre, Montana. 2010.

NARC Agron-4
16
Field B-1-2 SaltHaz(MMHOS/cm) 6-24 0.45 Dry Surf Soil (in.) @ Plnt'g 0.5Quarter NE S (ppm) 0-24 16 2" Soil Temp (oF) @ Plnt'g 56Section 32 Zn (ppm) 0-6 0.78 4" Soil Temp (oF) @ Plnt'g 52Tow nship 32N Fe (ppm) 0-6 16.9 Fertilizer Formulation Gran.BlendRange 15E Mn (ppm) 0-6 10.83 Fertilizer Placement Bnd at PlntgLatitude N48 29.630' Cu (ppm) 0-6 1.26 Fert. Rate (lbs/ac) N 70Longitude W109 48.025' CEC 0-6 16.7 Fert. Rate (lbs/ac) P2O5 40Soil Series Telstad Loam Soil Texture 0-6 n/a Fert. Rate (lbs/ac) K2O 25pH 0-6 7 Soil Texture 6-24 n/a Herbicide App. Date 6/13Org.Matter (%) 0-6 1.4 Soil Texture 24-36 n/a Herbicide Product Brox- MN (lbs/ac) 0-6 50 Soil Texture 36-48 n/a Herbicide Rate (/ac) 24 ozN (lbs/ac) 6-24 30 Init PAW (in.) 0-6" 1.05 Precip (in.) Plnt'g-Harvest 8.37N (lbs/ac) 24-36 44 Init PAW (in.) 6-24" 3.61 Precip (>.1) Plnt'g-Harvest 7.83N (lbs/ac) 36-48 Init PAW (in.) 24-36" 2.30 Harvest Date 8/17N (lbs/ac) 0-48 124 Init PAW (in.) 36-48" Rooting Depth (in.) 36"P (ppm) Olsen 0-6 31 Init PAW (in.) 0-48" 6.95 Post PAW (in.) 0-6" 0.62K (ppm) 0-6 292 Cropping System NT-ChmFlw Post PAW (in.) 6-24" 3.68Ca (ppm) 2145 Previous Crop Oilseed Post PAW (in.) 24-36" 2.35Mg (ppm) 0-6 620 Planting Date 4/27 Post PAW (in.) 36-48"Na (ppm) 0-6 23 Planting Depth (in.) 1.5 Post PAW (in.) 0-48" 6.66SaltHaz (MMHOS/cm) 0-6 0.47 Moist Soil Depth @ Plnt'g 48+ Precip (>.1) Hvst-Post 0.08
Site Resource & Management Data: (Exp# 11-9802-SW)
NARC Agron-4
17
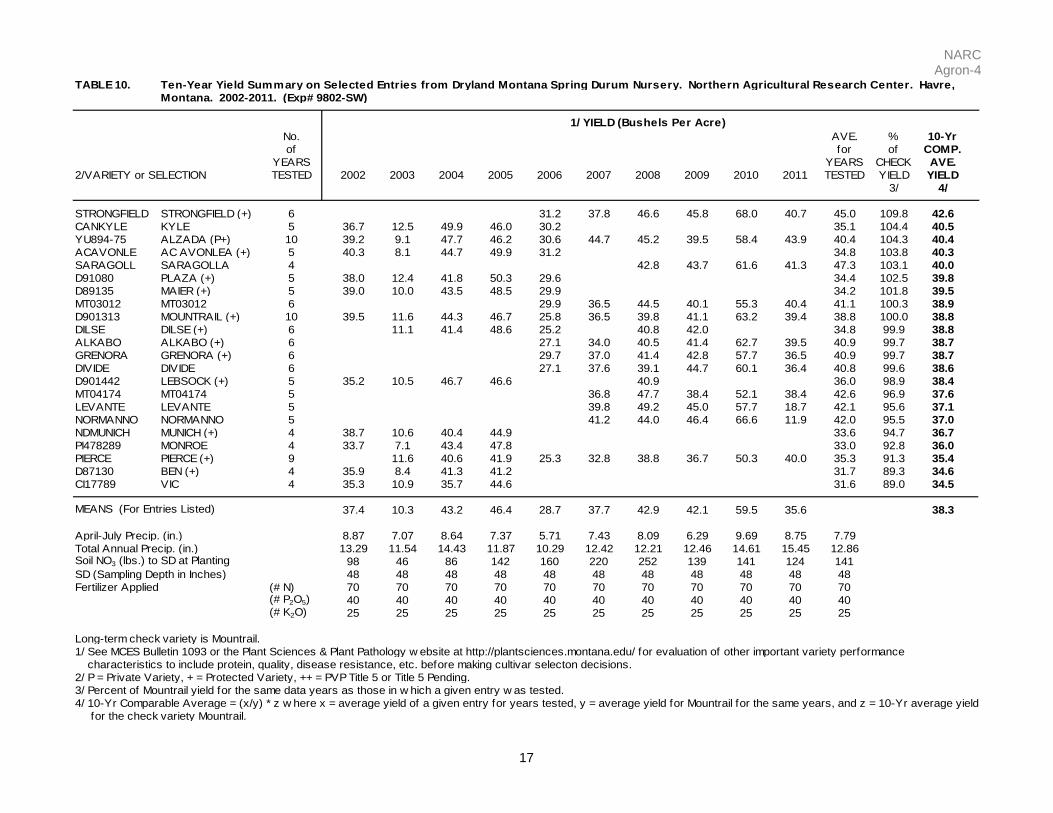
TABLE 10.Montana. 2002-2011. (Exp# 9802-SW)
No. AVE. % 10-Yrof for of COMP.
YEARS YEARS CHECK AVE.2/VARIETY or SELECTION TESTED 2002 2003 2004 2005 2006 2007 2008 2009 2010 2011 TESTED YIELD YIELD
3/ 4/
STRONGFIELD STRONGFIELD (+) 6 31.2 37.8 46.6 45.8 68.0 40.7 45.0 109.8 42.6CANKYLE KYLE 5 36.7 12.5 49.9 46.0 30.2 35.1 104.4 40.5YU894-75 ALZADA (P+) 10 39.2 9.1 47.7 46.2 30.6 44.7 45.2 39.5 58.4 43.9 40.4 104.3 40.4ACAVONLE AC AVONLEA (+) 5 40.3 8.1 44.7 49.9 31.2 34.8 103.8 40.3SARAGOLL SARAGOLLA 4 42.8 43.7 61.6 41.3 47.3 103.1 40.0D91080 PLAZA (+) 5 38.0 12.4 41.8 50.3 29.6 34.4 102.5 39.8D89135 MAIER (+) 5 39.0 10.0 43.5 48.5 29.9 34.2 101.8 39.5MT03012 MT03012 6 29.9 36.5 44.5 40.1 55.3 40.4 41.1 100.3 38.9D901313 MOUNTRAIL (+) 10 39.5 11.6 44.3 46.7 25.8 36.5 39.8 41.1 63.2 39.4 38.8 100.0 38.8DILSE DILSE (+) 6 11.1 41.4 48.6 25.2 40.8 42.0 34.8 99.9 38.8ALKABO ALKABO (+) 6 27.1 34.0 40.5 41.4 62.7 39.5 40.9 99.7 38.7GRENORA GRENORA (+) 6 29.7 37.0 41.4 42.8 57.7 36.5 40.9 99.7 38.7DIVIDE DIVIDE 6 27.1 37.6 39.1 44.7 60.1 36.4 40.8 99.6 38.6D901442 LEBSOCK (+) 5 35.2 10.5 46.7 46.6 40.9 36.0 98.9 38.4MT04174 MT04174 5 36.8 47.7 38.4 52.1 38.4 42.6 96.9 37.6LEVANTE LEVANTE 5 39.8 49.2 45.0 57.7 18.7 42.1 95.6 37.1NORMANNO NORMANNO 5 41.2 44.0 46.4 66.6 11.9 42.0 95.5 37.0NDMUNICH MUNICH (+) 4 38.7 10.6 40.4 44.9 33.6 94.7 36.7PI478289 MONROE 4 33.7 7.1 43.4 47.8 33.0 92.8 36.0PIERCE PIERCE (+) 9 11.6 40.6 41.9 25.3 32.8 38.8 36.7 50.3 40.0 35.3 91.3 35.4D87130 BEN (+) 4 35.9 8.4 41.3 41.2 31.7 89.3 34.6CI17789 VIC 4 35.3 10.9 35.7 44.6 31.6 89.0 34.5
37.4 10.3 43.2 46.4 28.7 37.7 42.9 42.1 59.5 35.6 38.3
April-July Precip. (in.) 8.87 7.07 8.64 7.37 5.71 7.43 8.09 6.29 9.69 8.75 7.79Total Annual Precip. (in.) 13.29 11.54 14.43 11.87 10.29 12.42 12.21 12.46 14.61 15.45 12.86Soil NO3 (lbs.) to SD at Planting 98 46 86 142 160 220 252 139 141 124 141SD (Sampling Depth in Inches) 48 48 48 48 48 48 48 48 48 48 48Fertilizer Applied (# N) 70 70 70 70 70 70 70 70 70 70 70
(# P2O5) 40 40 40 40 40 40 40 40 40 40 40(# K2O) 25 25 25 25 25 25 25 25 25 25 25
Long-term check variety is Mountrail.1/ See MCES Bulletin 1093 or the Plant Sciences & Plant Pathology w ebsite at http://plantsciences.montana.edu/ for evaluation of other important variety performance characteristics to include protein, quality, disease resistance, etc. before making cultivar selecton decisions.2/ P = Private Variety, + = Protected Variety, ++ = PVP Title 5 or Title 5 Pending.3/ Percent of Mountrail yield for the same data years as those in w hich a given entry w as tested.4/ 10-Yr Comparable Average = (x/y) * z w here x = average yield of a given entry for years tested, y = average yield for Mountrail for the same years, and z = 10-Yr average yield for the check variety Mountrail.
Ten-Year Yield Summary on Selected Entries from Dryland Montana Spring Durum Nursery. Northern Agricultural Research Center. Havre,
1/ YIELD (Bushels Per Acre)
MEANS (For Entries Listed)
NARC Agron-4
18
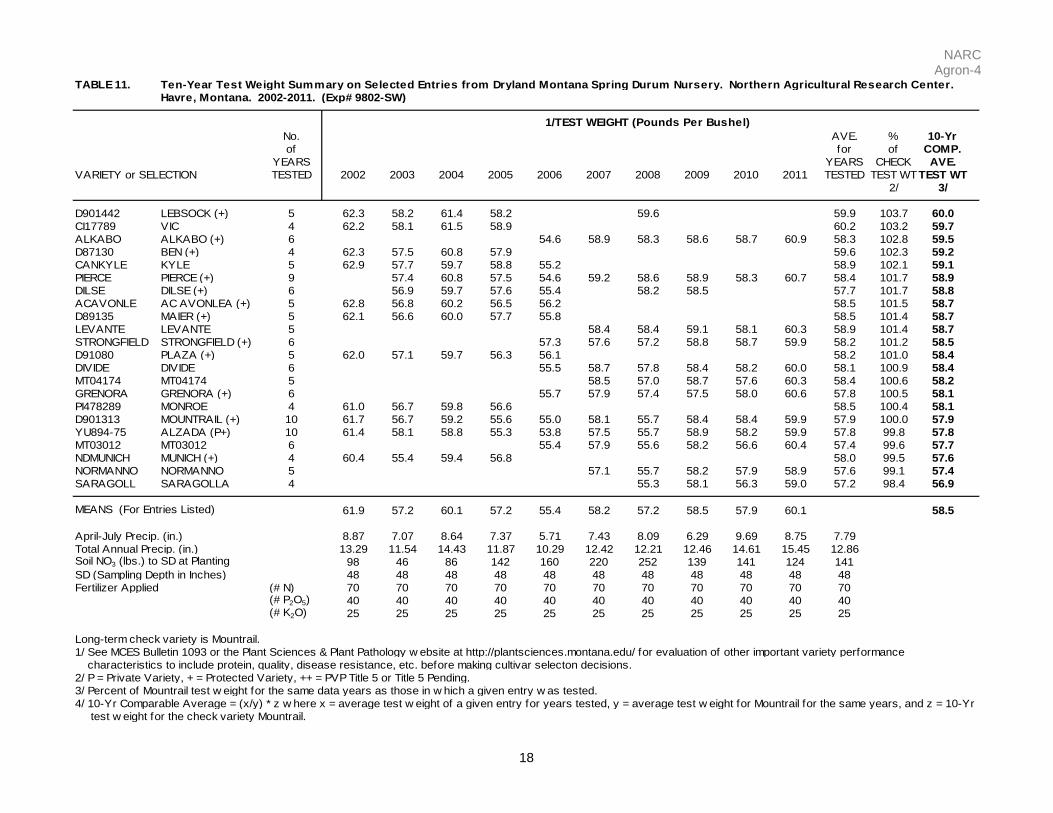
TABLE 11.Havre, Montana. 2002-2011. (Exp# 9802-SW)
No. AVE. % 10-Yrof for of COMP.
YEARS YEARS CHECK AVE.VARIETY or SELECTION TESTED 2002 2003 2004 2005 2006 2007 2008 2009 2010 2011 TESTED TEST WTTEST WT
2/ 3/
D901442 LEBSOCK (+) 5 62.3 58.2 61.4 58.2 59.6 59.9 103.7 60.0CI17789 VIC 4 62.2 58.1 61.5 58.9 60.2 103.2 59.7ALKABO ALKABO (+) 6 54.6 58.9 58.3 58.6 58.7 60.9 58.3 102.8 59.5D87130 BEN (+) 4 62.3 57.5 60.8 57.9 59.6 102.3 59.2CANKYLE KYLE 5 62.9 57.7 59.7 58.8 55.2 58.9 102.1 59.1PIERCE PIERCE (+) 9 57.4 60.8 57.5 54.6 59.2 58.6 58.9 58.3 60.7 58.4 101.7 58.9DILSE DILSE (+) 6 56.9 59.7 57.6 55.4 58.2 58.5 57.7 101.7 58.8ACAVONLE AC AVONLEA (+) 5 62.8 56.8 60.2 56.5 56.2 58.5 101.5 58.7D89135 MAIER (+) 5 62.1 56.6 60.0 57.7 55.8 58.5 101.4 58.7LEVANTE LEVANTE 5 58.4 58.4 59.1 58.1 60.3 58.9 101.4 58.7STRONGFIELD STRONGFIELD (+) 6 57.3 57.6 57.2 58.8 58.7 59.9 58.2 101.2 58.5D91080 PLAZA (+) 5 62.0 57.1 59.7 56.3 56.1 58.2 101.0 58.4DIVIDE DIVIDE 6 55.5 58.7 57.8 58.4 58.2 60.0 58.1 100.9 58.4MT04174 MT04174 5 58.5 57.0 58.7 57.6 60.3 58.4 100.6 58.2GRENORA GRENORA (+) 6 55.7 57.9 57.4 57.5 58.0 60.6 57.8 100.5 58.1PI478289 MONROE 4 61.0 56.7 59.8 56.6 58.5 100.4 58.1D901313 MOUNTRAIL (+) 10 61.7 56.7 59.2 55.6 55.0 58.1 55.7 58.4 58.4 59.9 57.9 100.0 57.9YU894-75 ALZADA (P+) 10 61.4 58.1 58.8 55.3 53.8 57.5 55.7 58.9 58.2 59.9 57.8 99.8 57.8MT03012 MT03012 6 55.4 57.9 55.6 58.2 56.6 60.4 57.4 99.6 57.7NDMUNICH MUNICH (+) 4 60.4 55.4 59.4 56.8 58.0 99.5 57.6NORMANNO NORMANNO 5 57.1 55.7 58.2 57.9 58.9 57.6 99.1 57.4SARAGOLL SARAGOLLA 4 55.3 58.1 56.3 59.0 57.2 98.4 56.9
61.9 57.2 60.1 57.2 55.4 58.2 57.2 58.5 57.9 60.1 58.5
April-July Precip. (in.) 8.87 7.07 8.64 7.37 5.71 7.43 8.09 6.29 9.69 8.75 7.79Total Annual Precip. (in.) 13.29 11.54 14.43 11.87 10.29 12.42 12.21 12.46 14.61 15.45 12.86Soil NO3 (lbs.) to SD at Planting 98 46 86 142 160 220 252 139 141 124 141SD (Sampling Depth in Inches) 48 48 48 48 48 48 48 48 48 48 48Fertilizer Applied (# N) 70 70 70 70 70 70 70 70 70 70 70
(# P2O5) 40 40 40 40 40 40 40 40 40 40 40(# K2O) 25 25 25 25 25 25 25 25 25 25 25
Long-term check variety is Mountrail.1/ See MCES Bulletin 1093 or the Plant Sciences & Plant Pathology w ebsite at http://plantsciences.montana.edu/ for evaluation of other important variety performance characteristics to include protein, quality, disease resistance, etc. before making cultivar selecton decisions.2/ P = Private Variety, + = Protected Variety, ++ = PVP Title 5 or Title 5 Pending.3/ Percent of Mountrail test w eight for the same data years as those in w hich a given entry w as tested.4/ 10-Yr Comparable Average = (x/y) * z w here x = average test w eight of a given entry for years tested, y = average test w eight for Mountrail for the same years, and z = 10-Yr test w eight for the check variety Mountrail.
Ten-Year Test Weight Summary on Selected Entries from Dryland Montana Spring Durum Nursery. Northern Agricultural Research Center.
1/TEST WEIGHT (Pounds Per Bushel)
MEANS (For Entries Listed)
NARC Agron-4
19
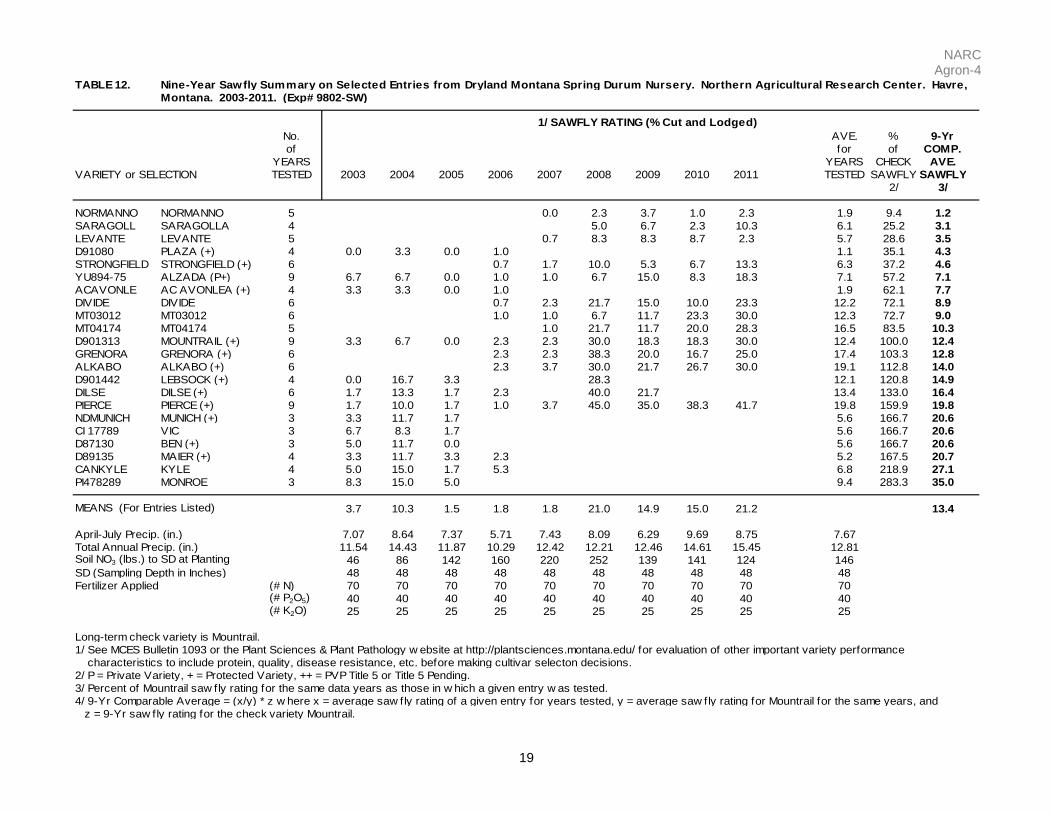
TABLE 12. Nine-Year Sawfly Summary on Selected Entries from Dryland Montana Spring Durum Nursery. Northern Agricultural Research Center. Havre, Montana. 2003-2011. (Exp# 9802-SW)
No. AVE. % 9-Yrof for of COMP.
YEARS YEARS CHECK AVE.VARIETY or SELECTION TESTED 2003 2004 2005 2006 2007 2008 2009 2010 2011 TESTED SAWFLY SAWFLY
2/ 3/
NORMANNO NORMANNO 5 0.0 2.3 3.7 1.0 2.3 1.9 9.4 1.2SARAGOLL SARAGOLLA 4 5.0 6.7 2.3 10.3 6.1 25.2 3.1LEVANTE LEVANTE 5 0.7 8.3 8.3 8.7 2.3 5.7 28.6 3.5D91080 PLAZA (+) 4 0.0 3.3 0.0 1.0 1.1 35.1 4.3STRONGFIELD STRONGFIELD (+) 6 0.7 1.7 10.0 5.3 6.7 13.3 6.3 37.2 4.6YU894-75 ALZADA (P+) 9 6.7 6.7 0.0 1.0 1.0 6.7 15.0 8.3 18.3 7.1 57.2 7.1ACAVONLE AC AVONLEA (+) 4 3.3 3.3 0.0 1.0 1.9 62.1 7.7DIVIDE DIVIDE 6 0.7 2.3 21.7 15.0 10.0 23.3 12.2 72.1 8.9MT03012 MT03012 6 1.0 1.0 6.7 11.7 23.3 30.0 12.3 72.7 9.0MT04174 MT04174 5 1.0 21.7 11.7 20.0 28.3 16.5 83.5 10.3D901313 MOUNTRAIL (+) 9 3.3 6.7 0.0 2.3 2.3 30.0 18.3 18.3 30.0 12.4 100.0 12.4GRENORA GRENORA (+) 6 2.3 2.3 38.3 20.0 16.7 25.0 17.4 103.3 12.8ALKABO ALKABO (+) 6 2.3 3.7 30.0 21.7 26.7 30.0 19.1 112.8 14.0D901442 LEBSOCK (+) 4 0.0 16.7 3.3 28.3 12.1 120.8 14.9DILSE DILSE (+) 6 1.7 13.3 1.7 2.3 40.0 21.7 13.4 133.0 16.4PIERCE PIERCE (+) 9 1.7 10.0 1.7 1.0 3.7 45.0 35.0 38.3 41.7 19.8 159.9 19.8NDMUNICH MUNICH (+) 3 3.3 11.7 1.7 5.6 166.7 20.6CI 17789 VIC 3 6.7 8.3 1.7 5.6 166.7 20.6D87130 BEN (+) 3 5.0 11.7 0.0 5.6 166.7 20.6D89135 MAIER (+) 4 3.3 11.7 3.3 2.3 5.2 167.5 20.7CANKYLE KYLE 4 5.0 15.0 1.7 5.3 6.8 218.9 27.1PI478289 MONROE 3 8.3 15.0 5.0 9.4 283.3 35.0
3.7 10.3 1.5 1.8 1.8 21.0 14.9 15.0 21.2 13.4
April-July Precip. (in.) 7.07 8.64 7.37 5.71 7.43 8.09 6.29 9.69 8.75 7.67Total Annual Precip. (in.) 11.54 14.43 11.87 10.29 12.42 12.21 12.46 14.61 15.45 12.81Soil NO3 (lbs.) to SD at Planting 46 86 142 160 220 252 139 141 124 146SD (Sampling Depth in Inches) 48 48 48 48 48 48 48 48 48 48Fertilizer Applied (# N) 70 70 70 70 70 70 70 70 70 70
(# P2O5) 40 40 40 40 40 40 40 40 40 40(# K2O) 25 25 25 25 25 25 25 25 25 25
Long-term check variety is Mountrail.1/ See MCES Bulletin 1093 or the Plant Sciences & Plant Pathology w ebsite at http://plantsciences.montana.edu/ for evaluation of other important variety performance characteristics to include protein, quality, disease resistance, etc. before making cultivar selecton decisions.2/ P = Private Variety, + = Protected Variety, ++ = PVP Title 5 or Title 5 Pending.3/ Percent of Mountrail saw fly rating for the same data years as those in w hich a given entry w as tested.4/ 9-Yr Comparable Average = (x/y) * z w here x = average saw fly rating of a given entry for years tested, y = average saw fly rating for Mountrail for the same years, and z = 9-Yr saw fly rating for the check variety Mountrail.
1/ SAWFLY RATING (% Cut and Lodged)
MEANS (For Entries Listed)
NARC Agron-4
20
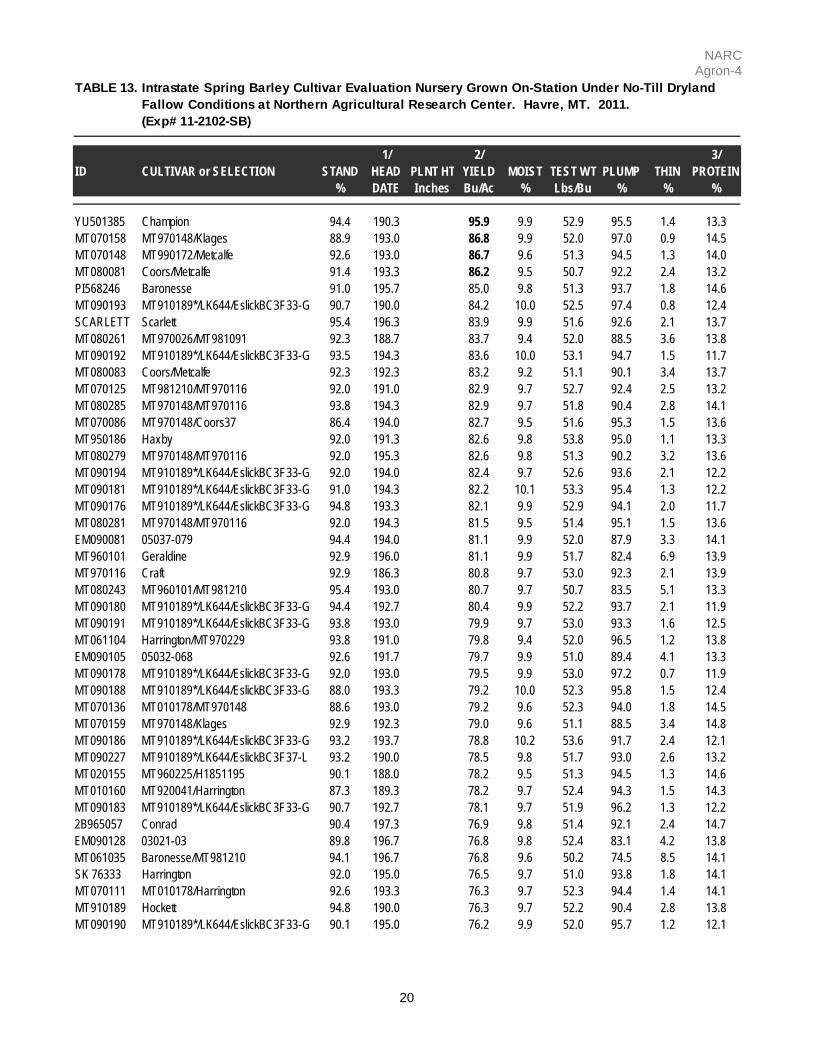
TABLE 13.
(Exp# 11-2102-SB)
1/ 2/ 3/ID CULTIVAR or SELECTION STAND HEAD PLNT HT YIELD MOIST TEST WT PLUMP THIN PROTEIN
% DATE Inches Bu/Ac % Lbs/Bu % % %
YU501385 Champion 94.4 190.3 95.9 9.9 52.9 95.5 1.4 13.3MT070158 MT970148/Klages 88.9 193.0 86.8 9.9 52.0 97.0 0.9 14.5MT070148 MT990172/Metcalfe 92.6 193.0 86.7 9.6 51.3 94.5 1.3 14.0MT080081 Coors/Metcalfe 91.4 193.3 86.2 9.5 50.7 92.2 2.4 13.2PI568246 Baronesse 91.0 195.7 85.0 9.8 51.3 93.7 1.8 14.6MT090193 MT910189*/LK644/EslickBC3F33-G 90.7 190.0 84.2 10.0 52.5 97.4 0.8 12.4SCARLETT Scarlett 95.4 196.3 83.9 9.9 51.6 92.6 2.1 13.7MT080261 MT970026/MT981091 92.3 188.7 83.7 9.4 52.0 88.5 3.6 13.8MT090192 MT910189*/LK644/EslickBC3F33-G 93.5 194.3 83.6 10.0 53.1 94.7 1.5 11.7MT080083 Coors/Metcalfe 92.3 192.3 83.2 9.2 51.1 90.1 3.4 13.7MT070125 MT981210/MT970116 92.0 191.0 82.9 9.7 52.7 92.4 2.5 13.2MT080285 MT970148/MT970116 93.8 194.3 82.9 9.7 51.8 90.4 2.8 14.1MT070086 MT970148/Coors37 86.4 194.0 82.7 9.5 51.6 95.3 1.5 13.6MT950186 Haxby 92.0 191.3 82.6 9.8 53.8 95.0 1.1 13.3MT080279 MT970148/MT970116 92.0 195.3 82.6 9.8 51.3 90.2 3.2 13.6MT090194 MT910189*/LK644/EslickBC3F33-G 92.0 194.0 82.4 9.7 52.6 93.6 2.1 12.2MT090181 MT910189*/LK644/EslickBC3F33-G 91.0 194.3 82.2 10.1 53.3 95.4 1.3 12.2MT090176 MT910189*/LK644/EslickBC3F33-G 94.8 193.3 82.1 9.9 52.9 94.1 2.0 11.7MT080281 MT970148/MT970116 92.0 194.3 81.5 9.5 51.4 95.1 1.5 13.6EM090081 05037-079 94.4 194.0 81.1 9.9 52.0 87.9 3.3 14.1MT960101 Geraldine 92.9 196.0 81.1 9.9 51.7 82.4 6.9 13.9MT970116 Craft 92.9 186.3 80.8 9.7 53.0 92.3 2.1 13.9MT080243 MT960101/MT981210 95.4 193.0 80.7 9.7 50.7 83.5 5.1 13.3MT090180 MT910189*/LK644/EslickBC3F33-G 94.4 192.7 80.4 9.9 52.2 93.7 2.1 11.9MT090191 MT910189*/LK644/EslickBC3F33-G 93.8 193.0 79.9 9.7 53.0 93.3 1.6 12.5MT061104 Harrington/MT970229 93.8 191.0 79.8 9.4 52.0 96.5 1.2 13.8EM090105 05032-068 92.6 191.7 79.7 9.9 51.0 89.4 4.1 13.3MT090178 MT910189*/LK644/EslickBC3F33-G 92.0 193.0 79.5 9.9 53.0 97.2 0.7 11.9MT090188 MT910189*/LK644/EslickBC3F33-G 88.0 193.3 79.2 10.0 52.3 95.8 1.5 12.4MT070136 MT010178/MT970148 88.6 193.0 79.2 9.6 52.3 94.0 1.8 14.5MT070159 MT970148/Klages 92.9 192.3 79.0 9.6 51.1 88.5 3.4 14.8MT090186 MT910189*/LK644/EslickBC3F33-G 93.2 193.7 78.8 10.2 53.6 91.7 2.4 12.1MT090227 MT910189*/LK644/EslickBC3F37-L 93.2 190.0 78.5 9.8 51.7 93.0 2.6 13.2MT020155 MT960225/H1851195 90.1 188.0 78.2 9.5 51.3 94.5 1.3 14.6MT010160 MT920041/Harrington 87.3 189.3 78.2 9.7 52.4 94.3 1.5 14.3MT090183 MT910189*/LK644/EslickBC3F33-G 90.7 192.7 78.1 9.7 51.9 96.2 1.3 12.22B965057 Conrad 90.4 197.3 76.9 9.8 51.4 92.1 2.4 14.7EM090128 03021-03 89.8 196.7 76.8 9.8 52.4 83.1 4.2 13.8MT061035 Baronesse/MT981210 94.1 196.7 76.8 9.6 50.2 74.5 8.5 14.1SK 76333 Harrington 92.0 195.0 76.5 9.7 51.0 93.8 1.8 14.1MT070111 MT010178/Harrington 92.6 193.3 76.3 9.7 52.3 94.4 1.4 14.1MT910189 Hockett 94.8 190.0 76.3 9.7 52.2 90.4 2.8 13.8MT090190 MT910189*/LK644/EslickBC3F33-G 90.1 195.0 76.2 9.9 52.0 95.7 1.2 12.1
Intrastate Spring Barley Cultivar Evaluation Nursery Grown On-Station Under No-Till Dryland Fallow Conditions at Northern Agricultural Research Center. Havre, MT. 2011.
NARC Agron-4
21
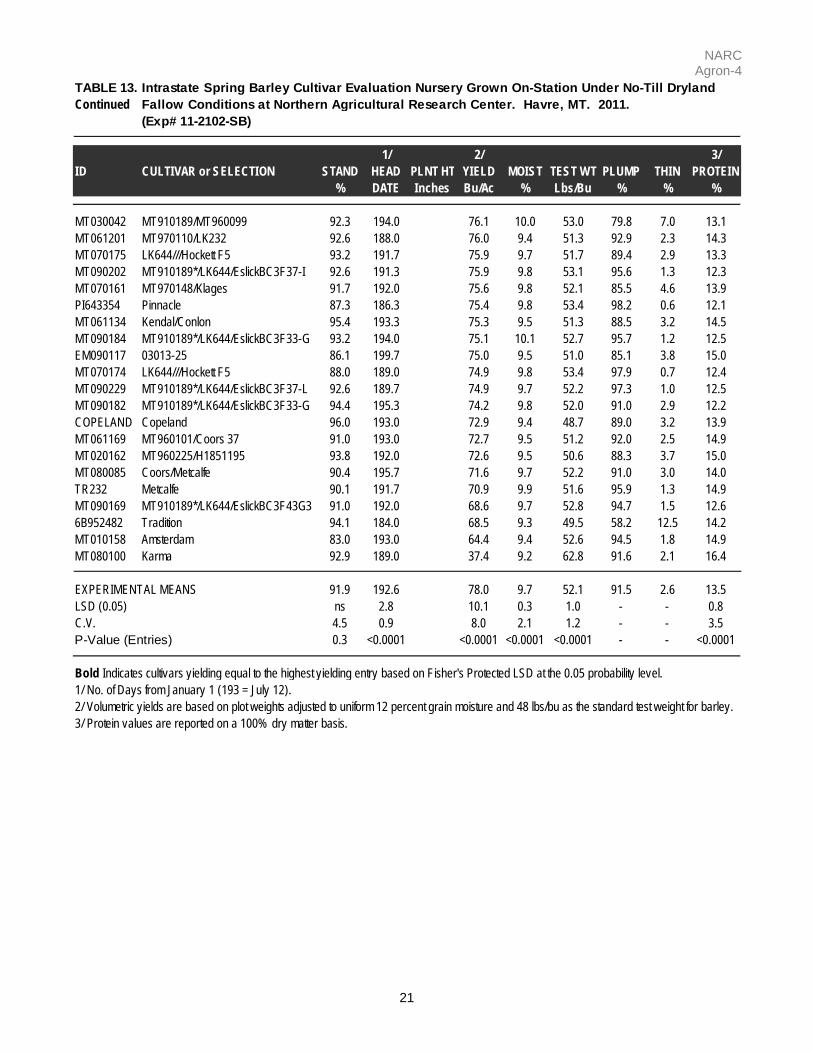
TABLE 13.Continued
(Exp# 11-2102-SB)
1/ 2/ 3/ID CULTIVAR or SELECTION STAND HEAD PLNT HT YIELD MOIST TEST WT PLUMP THIN PROTEIN
% DATE Inches Bu/Ac % Lbs/Bu % % %
MT030042 MT910189/MT960099 92.3 194.0 76.1 10.0 53.0 79.8 7.0 13.1MT061201 MT970110/LK232 92.6 188.0 76.0 9.4 51.3 92.9 2.3 14.3MT070175 LK644///Hockett F5 93.2 191.7 75.9 9.7 51.7 89.4 2.9 13.3MT090202 MT910189*/LK644/EslickBC3F37-I 92.6 191.3 75.9 9.8 53.1 95.6 1.3 12.3MT070161 MT970148/Klages 91.7 192.0 75.6 9.8 52.1 85.5 4.6 13.9PI643354 Pinnacle 87.3 186.3 75.4 9.8 53.4 98.2 0.6 12.1MT061134 Kendal/Conlon 95.4 193.3 75.3 9.5 51.3 88.5 3.2 14.5MT090184 MT910189*/LK644/EslickBC3F33-G 93.2 194.0 75.1 10.1 52.7 95.7 1.2 12.5EM090117 03013-25 86.1 199.7 75.0 9.5 51.0 85.1 3.8 15.0MT070174 LK644///Hockett F5 88.0 189.0 74.9 9.8 53.4 97.9 0.7 12.4MT090229 MT910189*/LK644/EslickBC3F37-L 92.6 189.7 74.9 9.7 52.2 97.3 1.0 12.5MT090182 MT910189*/LK644/EslickBC3F33-G 94.4 195.3 74.2 9.8 52.0 91.0 2.9 12.2COPELAND Copeland 96.0 193.0 72.9 9.4 48.7 89.0 3.2 13.9MT061169 MT960101/Coors 37 91.0 193.0 72.7 9.5 51.2 92.0 2.5 14.9MT020162 MT960225/H1851195 93.8 192.0 72.6 9.5 50.6 88.3 3.7 15.0MT080085 Coors/Metcalfe 90.4 195.7 71.6 9.7 52.2 91.0 3.0 14.0TR232 Metcalfe 90.1 191.7 70.9 9.9 51.6 95.9 1.3 14.9MT090169 MT910189*/LK644/EslickBC3F43G3 91.0 192.0 68.6 9.7 52.8 94.7 1.5 12.66B952482 Tradition 94.1 184.0 68.5 9.3 49.5 58.2 12.5 14.2MT010158 Amsterdam 83.0 193.0 64.4 9.4 52.6 94.5 1.8 14.9MT080100 Karma 92.9 189.0 37.4 9.2 62.8 91.6 2.1 16.4
91.9 192.6 78.0 9.7 52.1 91.5 2.6 13.5ns 2.8 10.1 0.3 1.0 - - 0.84.5 0.9 8.0 2.1 1.2 - - 3.5
P-Value (Entries) 0.3 <0.0001 <0.0001 <0.0001 <0.0001 - - <0.0001
Bold Indicates cultivars yielding equal to the highest yielding entry based on Fisher's Protected LSD at the 0.05 probability level.1/ No. of Days from January 1 (193 = July 12).2/ Volumetric yields are based on plot weights adjusted to uniform 12 percent grain moisture and 48 lbs/bu as the standard test weight for barley.3/ Protein values are reported on a 100% dry matter basis.
Intrastate Spring Barley Cultivar Evaluation Nursery Grown On-Station Under No-Till Dryland Fallow Conditions at Northern Agricultural Research Center. Havre, MT. 2011.
EXPERIMENTAL MEANSLSD (0.05)C.V.
NARC Agron-4
22
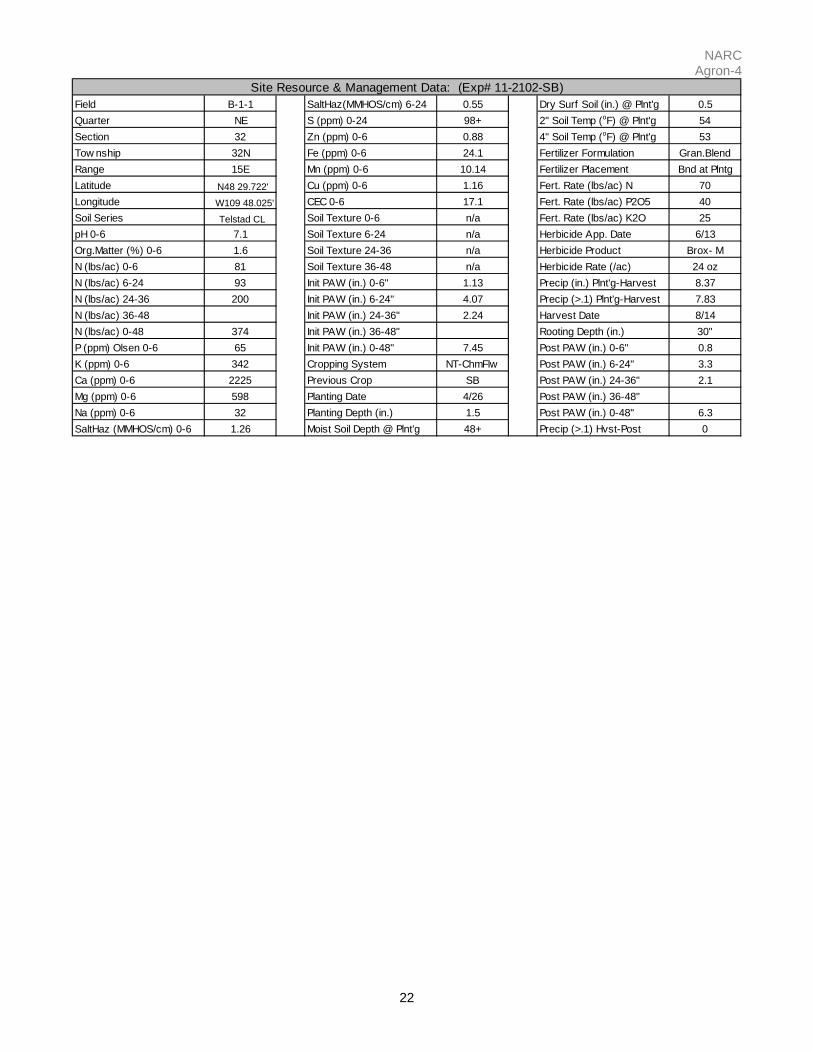
Field B-1-1 SaltHaz(MMHOS/cm) 6-24 0.55 Dry Surf Soil (in.) @ Plnt'g 0.5Quarter NE S (ppm) 0-24 98+ 2" Soil Temp (oF) @ Plnt'g 54Section 32 Zn (ppm) 0-6 0.88 4" Soil Temp (oF) @ Plnt'g 53Tow nship 32N Fe (ppm) 0-6 24.1 Fertilizer Formulation Gran.BlendRange 15E Mn (ppm) 0-6 10.14 Fertilizer Placement Bnd at PlntgLatitude N48 29.722' Cu (ppm) 0-6 1.16 Fert. Rate (lbs/ac) N 70Longitude W109 48.025' CEC 0-6 17.1 Fert. Rate (lbs/ac) P2O5 40Soil Series Telstad CL Soil Texture 0-6 n/a Fert. Rate (lbs/ac) K2O 25pH 0-6 7.1 Soil Texture 6-24 n/a Herbicide App. Date 6/13Org.Matter (%) 0-6 1.6 Soil Texture 24-36 n/a Herbicide Product Brox- MN (lbs/ac) 0-6 81 Soil Texture 36-48 n/a Herbicide Rate (/ac) 24 ozN (lbs/ac) 6-24 93 Init PAW (in.) 0-6" 1.13 Precip (in.) Plnt'g-Harvest 8.37N (lbs/ac) 24-36 200 Init PAW (in.) 6-24" 4.07 Precip (>.1) Plnt'g-Harvest 7.83N (lbs/ac) 36-48 Init PAW (in.) 24-36" 2.24 Harvest Date 8/14N (lbs/ac) 0-48 374 Init PAW (in.) 36-48" Rooting Depth (in.) 30"P (ppm) Olsen 0-6 65 Init PAW (in.) 0-48" 7.45 Post PAW (in.) 0-6" 0.8K (ppm) 0-6 342 Cropping System NT-ChmFlw Post PAW (in.) 6-24" 3.3Ca (ppm) 0-6 2225 Previous Crop SB Post PAW (in.) 24-36" 2.1Mg (ppm) 0-6 598 Planting Date 4/26 Post PAW (in.) 36-48"Na (ppm) 0-6 32 Planting Depth (in.) 1.5 Post PAW (in.) 0-48" 6.3SaltHaz (MMHOS/cm) 0-6 1.26 Moist Soil Depth @ Plnt'g 48+ Precip (>.1) Hvst-Post 0
Site Resource & Management Data: (Exp# 11-2102-SB)
NARC Agron-4
23
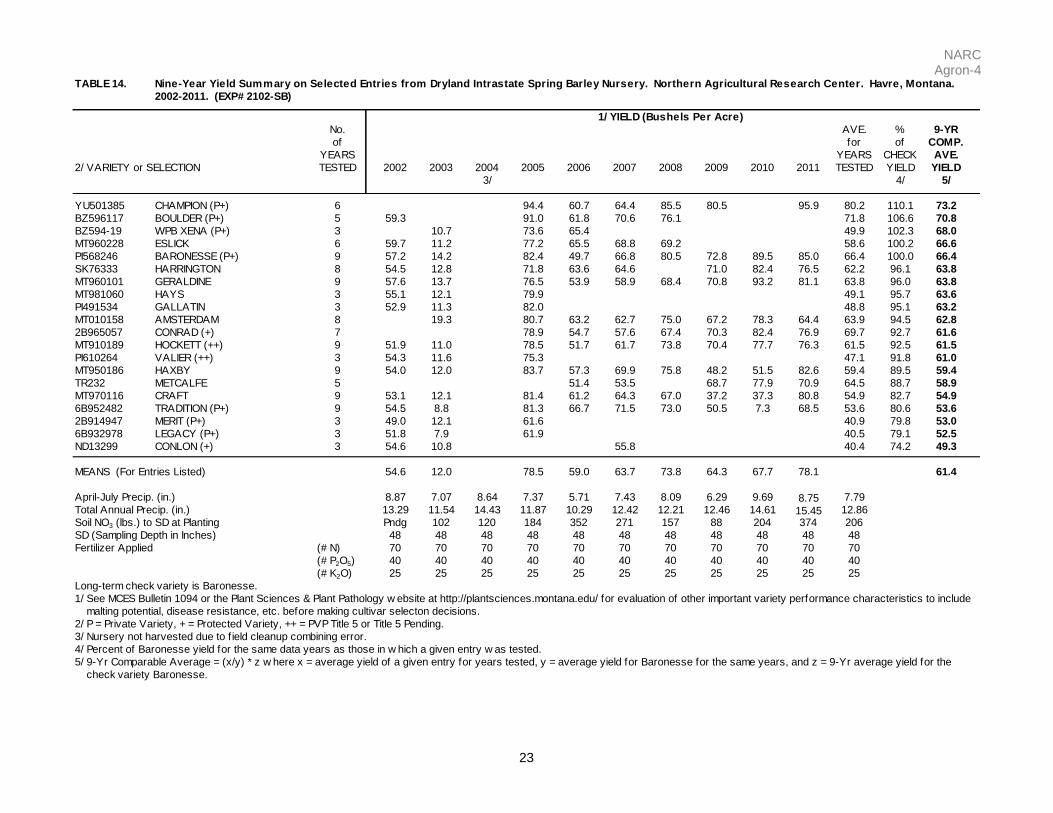
TABLE 14.2002-2011. (EXP# 2102-SB)
No. AVE. % 9-YRof for of COMP.
YEARS YEARS CHECK AVE.2/ VARIETY or SELECTION TESTED 2002 2003 2004 2005 2006 2007 2008 2009 2010 2011 TESTED YIELD YIELD
3/ 4/ 5/
YU501385 CHAMPION (P+) 6 94.4 60.7 64.4 85.5 80.5 95.9 80.2 110.1 73.2BZ596117 BOULDER (P+) 5 59.3 91.0 61.8 70.6 76.1 71.8 106.6 70.8BZ594-19 WPB XENA (P+) 3 10.7 73.6 65.4 49.9 102.3 68.0MT960228 ESLICK 6 59.7 11.2 77.2 65.5 68.8 69.2 58.6 100.2 66.6PI568246 BARONESSE (P+) 9 57.2 14.2 82.4 49.7 66.8 80.5 72.8 89.5 85.0 66.4 100.0 66.4SK76333 HARRINGTON 8 54.5 12.8 71.8 63.6 64.6 71.0 82.4 76.5 62.2 96.1 63.8MT960101 GERALDINE 9 57.6 13.7 76.5 53.9 58.9 68.4 70.8 93.2 81.1 63.8 96.0 63.8MT981060 HAYS 3 55.1 12.1 79.9 49.1 95.7 63.6PI491534 GALLATIN 3 52.9 11.3 82.0 48.8 95.1 63.2MT010158 AMSTERDAM 8 19.3 80.7 63.2 62.7 75.0 67.2 78.3 64.4 63.9 94.5 62.82B965057 CONRAD (+) 7 78.9 54.7 57.6 67.4 70.3 82.4 76.9 69.7 92.7 61.6MT910189 HOCKETT (++) 9 51.9 11.0 78.5 51.7 61.7 73.8 70.4 77.7 76.3 61.5 92.5 61.5PI610264 VALIER (++) 3 54.3 11.6 75.3 47.1 91.8 61.0MT950186 HAXBY 9 54.0 12.0 83.7 57.3 69.9 75.8 48.2 51.5 82.6 59.4 89.5 59.4TR232 METCALFE 5 51.4 53.5 68.7 77.9 70.9 64.5 88.7 58.9MT970116 CRAFT 9 53.1 12.1 81.4 61.2 64.3 67.0 37.2 37.3 80.8 54.9 82.7 54.96B952482 TRADITION (P+) 9 54.5 8.8 81.3 66.7 71.5 73.0 50.5 7.3 68.5 53.6 80.6 53.62B914947 MERIT (P+) 3 49.0 12.1 61.6 40.9 79.8 53.06B932978 LEGACY (P+) 3 51.8 7.9 61.9 40.5 79.1 52.5ND13299 CONLON (+) 3 54.6 10.8 55.8 40.4 74.2 49.3
54.6 12.0 78.5 59.0 63.7 73.8 64.3 67.7 78.1 61.4
April-July Precip. (in.) 8.87 7.07 8.64 7.37 5.71 7.43 8.09 6.29 9.69 8.75 7.79Total Annual Precip. (in.) 13.29 11.54 14.43 11.87 10.29 12.42 12.21 12.46 14.61 15.45 12.86Soil NO3 (lbs.) to SD at Planting Pndg 102 120 184 352 271 157 88 204 374 206SD (Sampling Depth in Inches) 48 48 48 48 48 48 48 48 48 48 48Fertilizer Applied (# N) 70 70 70 70 70 70 70 70 70 70 70
(# P2O5) 40 40 40 40 40 40 40 40 40 40 40(# K2O) 25 25 25 25 25 25 25 25 25 25 25
Long-term check variety is Baronesse.1/ See MCES Bulletin 1094 or the Plant Sciences & Plant Pathology w ebsite at http://plantsciences.montana.edu/ for evaluation of other important variety performance characteristics to include malting potential, disease resistance, etc. before making cultivar selecton decisions.2/ P = Private Variety, + = Protected Variety, ++ = PVP Title 5 or Title 5 Pending.3/ Nursery not harvested due to f ield cleanup combining error.4/ Percent of Baronesse yield for the same data years as those in w hich a given entry w as tested.5/ 9-Yr Comparable Average = (x/y) * z w here x = average yield of a given entry for years tested, y = average yield for Baronesse for the same years, and z = 9-Yr average yield for the check variety Baronesse.
Nine-Year Yield Summary on Selected Entries from Dryland Intrastate Spring Barley Nursery. Northern Agricultural Research Center. Havre, Montana.
1/ YIELD (Bushels Per Acre)
MEANS (For Entries Listed)

NARC Agron-4
24
TABLE 15.
No. AVE. % 9-YRof for of COMP.
YEARS YEARS CHECK AVE.2/ VARIETY or SELECTION TESTED 2002 2003 2004 2005 2006 2007 2008 2009 2010 2011 TESTED TEST WTTEST WT
3/ 4/ 5/
YU501385 CHAMPION (P+) 6 50.9 48.4 50.3 52.7 51.7 52.9 51.1 105.7 51.0MT950186 HAXBY 9 50.4 49.1 50.9 48.7 50.7 52.9 52.0 50.6 53.8 51.0 105.6 51.0BZ596117 BOULDER (P+) 5 49.2 50.8 48.7 49.3 51.9 50.0 105.1 50.8MT970116 CRAFT 9 50.5 48.8 50.7 48.8 50.0 51.5 51.5 50.6 53.0 50.6 104.8 50.6ND13299 CONLON (+) 3 48.5 49.7 48.2 48.8 104.2 50.3MT910189 HOCKETT (++) 9 49.7 49.3 48.0 47.5 49.9 52.0 51.2 51.2 52.2 50.1 103.8 50.1MT010158 AMSTERDAM 8 48.9 50.9 46.9 49.6 50.7 50.6 50.0 52.6 50.0 103.8 50.1PI491534 GALLATIN 3 48.5 47.7 48.6 48.3 103.0 49.7PI610264 VALIER (++) 3 49.8 46.8 46.9 47.8 102.0 49.2MT960228 ESLICK 6 49.6 46.3 47.1 46.1 48.9 50.1 48.0 101.5 49.0MT960101 GERALDINE 9 49.1 47.1 46.1 45.0 47.3 49.9 50.4 49.2 51.7 48.4 100.3 48.4BZ594-19 WPB XENA (P+) 3 45.8 45.6 45.1 45.5 100.2 48.4TR232 METCALFE 5 45.3 48.2 50.7 48.4 51.6 48.8 100.1 48.3PI568246 BARONESSE (P+) 9 48.9 46.0 45.8 44.5 48.7 49.9 50.1 49.4 51.3 48.3 100.0 48.32B965057 CONRAD (+) 7 47.1 45.7 47.4 49.4 49.4 49.1 51.4 48.5 100.0 48.3SK76333 HARRINGTON 8 48.4 45.5 44.9 44.6 47.2 49.8 49.2 51.0 47.6 99.0 47.86B952482 TRADITION (P+) 9 46.8 45.1 46.7 46.4 47.0 49.2 48.6 48.0 49.5 47.5 98.3 47.56B932978 LEGACY (P+) 3 45.2 45.9 43.3 44.8 95.5 46.12B914947 MERIT (P+) 3 47.3 44.4 41.4 44.4 94.6 45.7MT981060 HAYS 3 45.3 43.0 44.1 44.1 94.1 45.5
48.5 46.8 47.2 46.5 48.8 50.9 50.5 49.6 51.9 48.8
April-July Precip. (in.) 8.87 7.07 8.64 7.37 5.71 7.43 8.09 6.29 9.69 8.75 7.40Total Annual Precip. (in.) 13.29 11.54 14.43 11.87 10.29 12.42 12.21 12.46 14.61 15.45 12.20Soil NO3 (lbs.) to SD at Planting Pndg 102 120 184 352 271 157 88 204 374 185SD (Sampling Depth in Inches) 48 48 48 48 48 48 48 48 48 48 48Fertilizer Applied (# N) 70 70 70 70 70 70 70 70 70 70 70
(# P2O5) 40 40 40 40 40 40 40 40 40 40 40(# K2O) 25 25 25 25 25 25 25 25 25 25 25
Long-term check variety is Baronesse.1/ See MCES Bulletin 1094 or the Plant Sciences & Plant Pathology w ebsite at http://plantsciences.montana.edu/ for evaluation of other important variety performance characteristics to include malting potential, disease resistance, etc. before making cultivar selecton decisions.2/ P = Private Variety, + = Protected Variety, ++ = PVP Title 5 or Title 5 Pending.3/ Nursery not harvested due to f ield cleanup combining error.4/ Percent of Baronesse test w eight for the same data years as those in w hich a given entry w as tested.5/ 9-Yr Comparable Average = (x/y) * z w here x = average test w eight of a given entry for years tested, y = average test w eight for Baronesse for the same years, and z = 9-Yr average test w eight for the check variety Baronesse.
Nine-Year Test Weight Summary on Selected Entries from Dryland Intrastate Spring Barley Nursery. Northern Agricultural Research Center. Havre,Montana. 2002-2011. (EXP# 2102-SB)
1/ TEST WEIGHT (Pounds Per Bushel)
MEANS (For Entries Listed)
NARC Agron-4
25
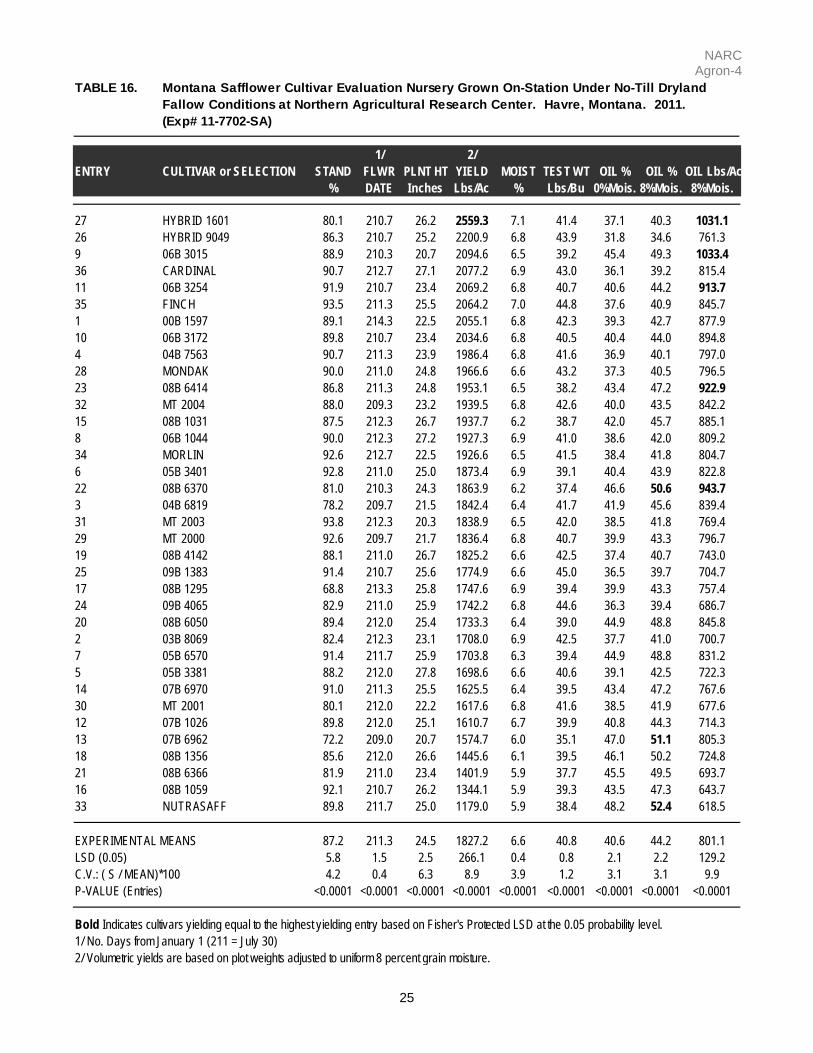
TABLE 16.
(Exp# 11-7702-SA)
1/ 2/ ENTRY CULTIVAR or SELECTION STAND FLWR PLNT HT YIELD MOIST TEST WT OIL % OIL % OIL Lbs/Ac
% DATE Inches Lbs/Ac % Lbs/Bu 0%Mois. 8%Mois. 8%Mois.
27 HYBRID 1601 80.1 210.7 26.2 2559.3 7.1 41.4 37.1 40.3 1031.126 HYBRID 9049 86.3 210.7 25.2 2200.9 6.8 43.9 31.8 34.6 761.39 06B 3015 88.9 210.3 20.7 2094.6 6.5 39.2 45.4 49.3 1033.436 CARDINAL 90.7 212.7 27.1 2077.2 6.9 43.0 36.1 39.2 815.411 06B 3254 91.9 210.7 23.4 2069.2 6.8 40.7 40.6 44.2 913.735 FINCH 93.5 211.3 25.5 2064.2 7.0 44.8 37.6 40.9 845.71 00B 1597 89.1 214.3 22.5 2055.1 6.8 42.3 39.3 42.7 877.910 06B 3172 89.8 210.7 23.4 2034.6 6.8 40.5 40.4 44.0 894.84 04B 7563 90.7 211.3 23.9 1986.4 6.8 41.6 36.9 40.1 797.028 MONDAK 90.0 211.0 24.8 1966.6 6.6 43.2 37.3 40.5 796.523 08B 6414 86.8 211.3 24.8 1953.1 6.5 38.2 43.4 47.2 922.932 MT 2004 88.0 209.3 23.2 1939.5 6.8 42.6 40.0 43.5 842.215 08B 1031 87.5 212.3 26.7 1937.7 6.2 38.7 42.0 45.7 885.18 06B 1044 90.0 212.3 27.2 1927.3 6.9 41.0 38.6 42.0 809.234 MORLIN 92.6 212.7 22.5 1926.6 6.5 41.5 38.4 41.8 804.76 05B 3401 92.8 211.0 25.0 1873.4 6.9 39.1 40.4 43.9 822.822 08B 6370 81.0 210.3 24.3 1863.9 6.2 37.4 46.6 50.6 943.73 04B 6819 78.2 209.7 21.5 1842.4 6.4 41.7 41.9 45.6 839.431 MT 2003 93.8 212.3 20.3 1838.9 6.5 42.0 38.5 41.8 769.429 MT 2000 92.6 209.7 21.7 1836.4 6.8 40.7 39.9 43.3 796.719 08B 4142 88.1 211.0 26.7 1825.2 6.6 42.5 37.4 40.7 743.025 09B 1383 91.4 210.7 25.6 1774.9 6.6 45.0 36.5 39.7 704.717 08B 1295 68.8 213.3 25.8 1747.6 6.9 39.4 39.9 43.3 757.424 09B 4065 82.9 211.0 25.9 1742.2 6.8 44.6 36.3 39.4 686.720 08B 6050 89.4 212.0 25.4 1733.3 6.4 39.0 44.9 48.8 845.82 03B 8069 82.4 212.3 23.1 1708.0 6.9 42.5 37.7 41.0 700.77 05B 6570 91.4 211.7 25.9 1703.8 6.3 39.4 44.9 48.8 831.25 05B 3381 88.2 212.0 27.8 1698.6 6.6 40.6 39.1 42.5 722.314 07B 6970 91.0 211.3 25.5 1625.5 6.4 39.5 43.4 47.2 767.630 MT 2001 80.1 212.0 22.2 1617.6 6.8 41.6 38.5 41.9 677.612 07B 1026 89.8 212.0 25.1 1610.7 6.7 39.9 40.8 44.3 714.313 07B 6962 72.2 209.0 20.7 1574.7 6.0 35.1 47.0 51.1 805.318 08B 1356 85.6 212.0 26.6 1445.6 6.1 39.5 46.1 50.2 724.821 08B 6366 81.9 211.0 23.4 1401.9 5.9 37.7 45.5 49.5 693.716 08B 1059 92.1 210.7 26.2 1344.1 5.9 39.3 43.5 47.3 643.733 NUTRASAFF 89.8 211.7 25.0 1179.0 5.9 38.4 48.2 52.4 618.5
87.2 211.3 24.5 1827.2 6.6 40.8 40.6 44.2 801.1LSD (0.05) 5.8 1.5 2.5 266.1 0.4 0.8 2.1 2.2 129.2C.V.: ( S / MEAN)*100 4.2 0.4 6.3 8.9 3.9 1.2 3.1 3.1 9.9P-VALUE (Entries) <0.0001 <0.0001 <0.0001 <0.0001 <0.0001 <0.0001 <0.0001 <0.0001 <0.0001
Bold Indicates cultivars yielding equal to the highest yielding entry based on Fisher's Protected LSD at the 0.05 probability level.1/ No. Days from January 1 (211 = July 30)2/ Volumetric yields are based on plot weights adjusted to uniform 8 percent grain moisture.
Montana Safflower Cultivar Evaluation Nursery Grown On-Station Under No-Till Dryland Fallow Conditions at Northern Agricultural Research Center. Havre, Montana. 2011.
EXPERIMENTAL MEANS
NARC Agron-4
26
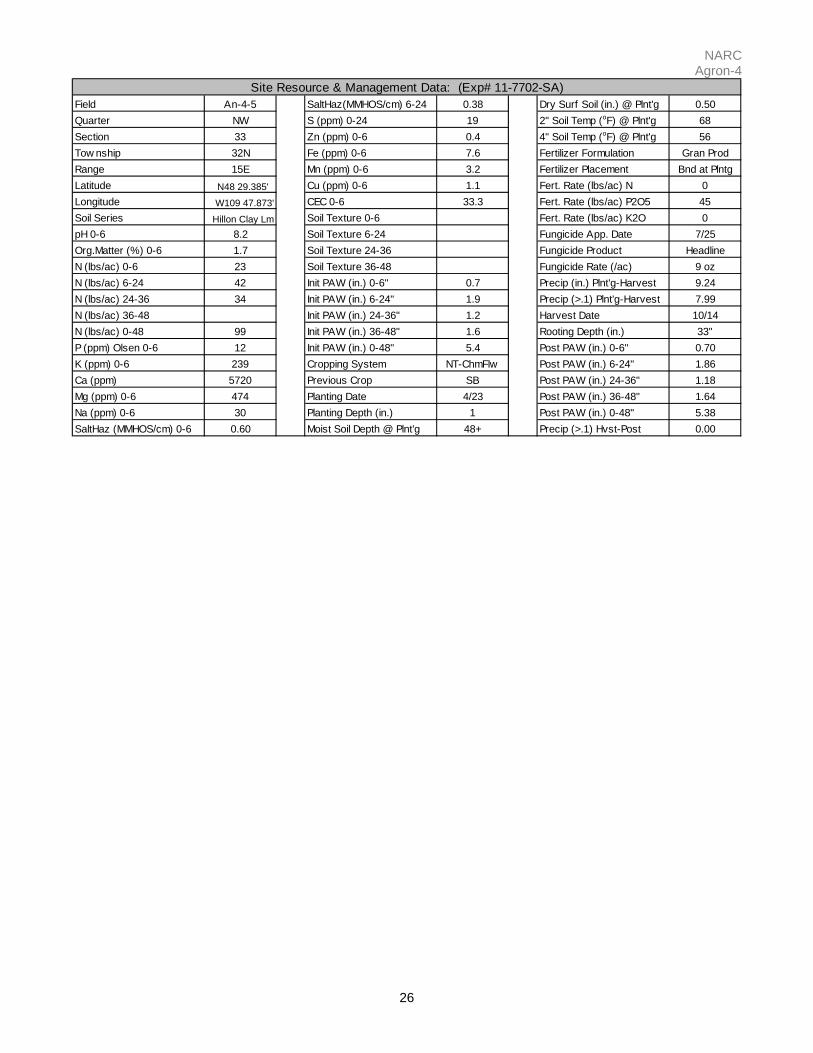
Field An-4-5 SaltHaz(MMHOS/cm) 6-24 0.38 Dry Surf Soil (in.) @ Plnt'g 0.50Quarter NW S (ppm) 0-24 19 2" Soil Temp (oF) @ Plnt'g 68Section 33 Zn (ppm) 0-6 0.4 4" Soil Temp (oF) @ Plnt'g 56Tow nship 32N Fe (ppm) 0-6 7.6 Fertilizer Formulation Gran ProdRange 15E Mn (ppm) 0-6 3.2 Fertilizer Placement Bnd at PlntgLatitude N48 29.385' Cu (ppm) 0-6 1.1 Fert. Rate (lbs/ac) N 0Longitude W109 47.873' CEC 0-6 33.3 Fert. Rate (lbs/ac) P2O5 45Soil Series Hillon Clay Lm Soil Texture 0-6 Fert. Rate (lbs/ac) K2O 0pH 0-6 8.2 Soil Texture 6-24 Fungicide App. Date 7/25Org.Matter (%) 0-6 1.7 Soil Texture 24-36 Fungicide Product HeadlineN (lbs/ac) 0-6 23 Soil Texture 36-48 Fungicide Rate (/ac) 9 ozN (lbs/ac) 6-24 42 Init PAW (in.) 0-6" 0.7 Precip (in.) Plnt'g-Harvest 9.24N (lbs/ac) 24-36 34 Init PAW (in.) 6-24" 1.9 Precip (>.1) Plnt'g-Harvest 7.99N (lbs/ac) 36-48 Init PAW (in.) 24-36" 1.2 Harvest Date 10/14N (lbs/ac) 0-48 99 Init PAW (in.) 36-48" 1.6 Rooting Depth (in.) 33"P (ppm) Olsen 0-6 12 Init PAW (in.) 0-48" 5.4 Post PAW (in.) 0-6" 0.70K (ppm) 0-6 239 Cropping System NT-ChmFlw Post PAW (in.) 6-24" 1.86Ca (ppm) 5720 Previous Crop SB Post PAW (in.) 24-36" 1.18Mg (ppm) 0-6 474 Planting Date 4/23 Post PAW (in.) 36-48" 1.64Na (ppm) 0-6 30 Planting Depth (in.) 1 Post PAW (in.) 0-48" 5.38SaltHaz (MMHOS/cm) 0-6 0.60 Moist Soil Depth @ Plnt'g 48+ Precip (>.1) Hvst-Post 0.00
Site Resource & Management Data: (Exp# 11-7702-SA)
NARC Agron-4
27
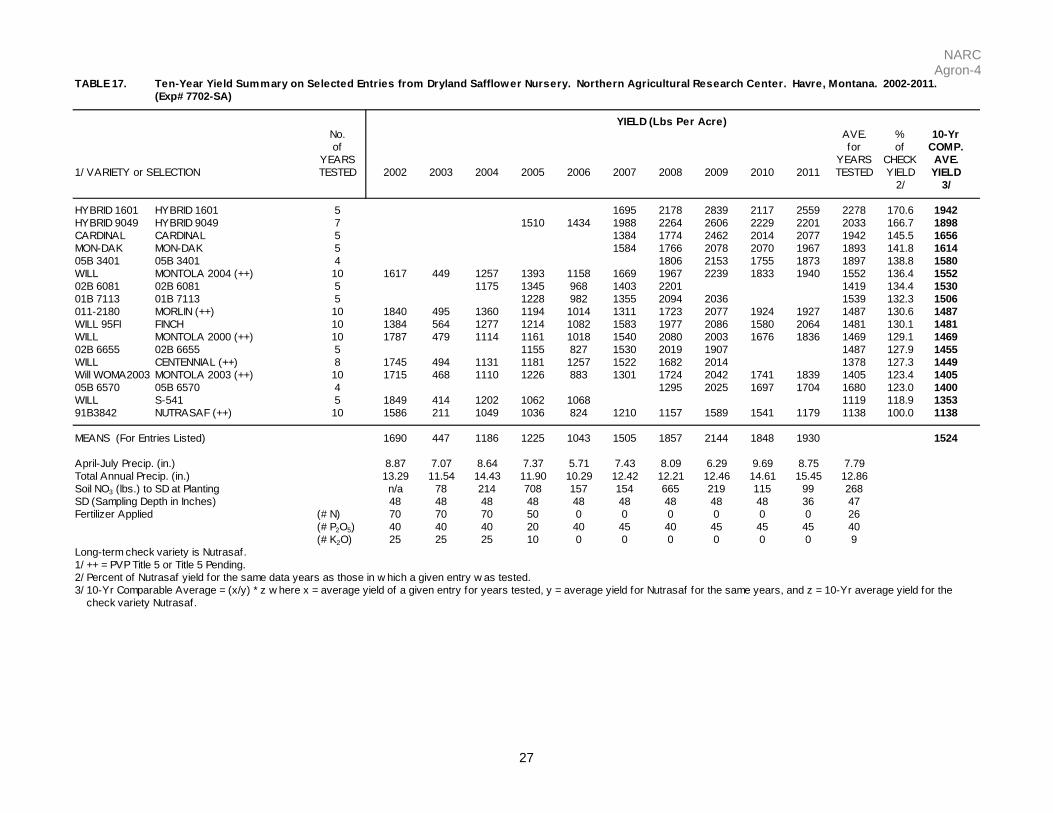
TABLE 17.(Exp# 7702-SA)
No. AVE. % 10-Yrof for of COMP.
YEARS YEARS CHECK AVE.1/ VARIETY or SELECTION TESTED 2002 2003 2004 2005 2006 2007 2008 2009 2010 2011 TESTED YIELD YIELD
2/ 3/
HYBRID 1601 HYBRID 1601 5 1695 2178 2839 2117 2559 2278 170.6 1942HYBRID 9049 HYBRID 9049 7 1510 1434 1988 2264 2606 2229 2201 2033 166.7 1898CARDINAL CARDINAL 5 1384 1774 2462 2014 2077 1942 145.5 1656MON-DAK MON-DAK 5 1584 1766 2078 2070 1967 1893 141.8 161405B 3401 05B 3401 4 1806 2153 1755 1873 1897 138.8 1580WILL MONTOLA 2004 (++) 10 1617 449 1257 1393 1158 1669 1967 2239 1833 1940 1552 136.4 155202B 6081 02B 6081 5 1175 1345 968 1403 2201 1419 134.4 153001B 7113 01B 7113 5 1228 982 1355 2094 2036 1539 132.3 1506011-2180 MORLIN (++) 10 1840 495 1360 1194 1014 1311 1723 2077 1924 1927 1487 130.6 1487WILL 95FI FINCH 10 1384 564 1277 1214 1082 1583 1977 2086 1580 2064 1481 130.1 1481WILL MONTOLA 2000 (++) 10 1787 479 1114 1161 1018 1540 2080 2003 1676 1836 1469 129.1 146902B 6655 02B 6655 5 1155 827 1530 2019 1907 1487 127.9 1455WILL CENTENNIAL (++) 8 1745 494 1131 1181 1257 1522 1682 2014 1378 127.3 1449Will WOMA2003 MONTOLA 2003 (++) 10 1715 468 1110 1226 883 1301 1724 2042 1741 1839 1405 123.4 140505B 6570 05B 6570 4 1295 2025 1697 1704 1680 123.0 1400WILL S-541 5 1849 414 1202 1062 1068 1119 118.9 135391B3842 NUTRASAF (++) 10 1586 211 1049 1036 824 1210 1157 1589 1541 1179 1138 100.0 1138
1690 447 1186 1225 1043 1505 1857 2144 1848 1930 1524
April-July Precip. (in.) 8.87 7.07 8.64 7.37 5.71 7.43 8.09 6.29 9.69 8.75 7.79Total Annual Precip. (in.) 13.29 11.54 14.43 11.90 10.29 12.42 12.21 12.46 14.61 15.45 12.86Soil NO3 (lbs.) to SD at Planting n/a 78 214 708 157 154 665 219 115 99 268SD (Sampling Depth in Inches) 48 48 48 48 48 48 48 48 48 36 47Fertilizer Applied (# N) 70 70 70 50 0 0 0 0 0 0 26
(# P2O5) 40 40 40 20 40 45 40 45 45 45 40(# K2O) 25 25 25 10 0 0 0 0 0 0 9
Long-term check variety is Nutrasaf.1/ ++ = PVP Title 5 or Title 5 Pending.2/ Percent of Nutrasaf yield for the same data years as those in w hich a given entry w as tested.3/ 10-Yr Comparable Average = (x/y) * z w here x = average yield of a given entry for years tested, y = average yield for Nutrasaf for the same years, and z = 10-Yr average yield for the check variety Nutrasaf.
Ten-Year Yield Summary on Selected Entries from Dryland Safflower Nursery. Northern Agricultural Research Center. Havre, Montana. 2002-2011.
YIELD (Lbs Per Acre)
MEANS (For Entries Listed)
NARC Agron-4
28
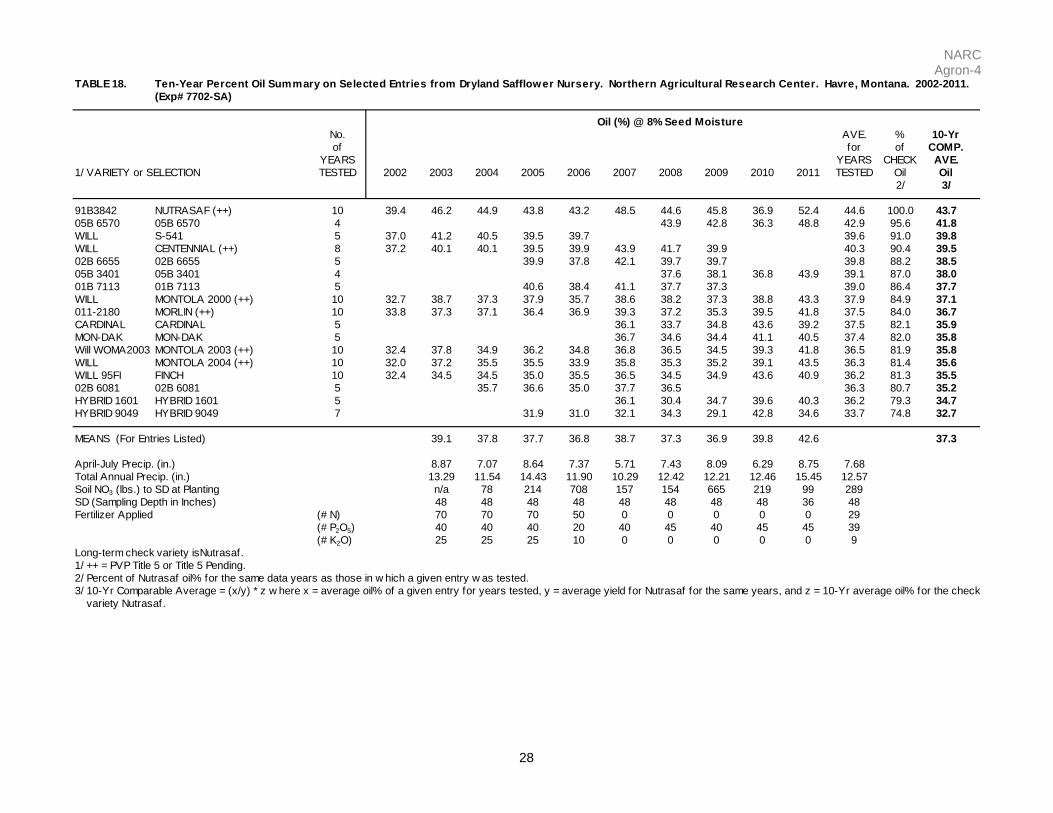
TABLE 18.(Exp# 7702-SA)
No. AVE. % 10-Yrof for of COMP.
YEARS YEARS CHECK AVE.1/ VARIETY or SELECTION TESTED 2002 2003 2004 2005 2006 2007 2008 2009 2010 2011 TESTED Oil Oil
2/ 3/
91B3842 NUTRASAF (++) 10 39.4 46.2 44.9 43.8 43.2 48.5 44.6 45.8 36.9 52.4 44.6 100.0 43.705B 6570 05B 6570 4 43.9 42.8 36.3 48.8 42.9 95.6 41.8WILL S-541 5 37.0 41.2 40.5 39.5 39.7 39.6 91.0 39.8WILL CENTENNIAL (++) 8 37.2 40.1 40.1 39.5 39.9 43.9 41.7 39.9 40.3 90.4 39.502B 6655 02B 6655 5 39.9 37.8 42.1 39.7 39.7 39.8 88.2 38.505B 3401 05B 3401 4 37.6 38.1 36.8 43.9 39.1 87.0 38.001B 7113 01B 7113 5 40.6 38.4 41.1 37.7 37.3 39.0 86.4 37.7WILL MONTOLA 2000 (++) 10 32.7 38.7 37.3 37.9 35.7 38.6 38.2 37.3 38.8 43.3 37.9 84.9 37.1011-2180 MORLIN (++) 10 33.8 37.3 37.1 36.4 36.9 39.3 37.2 35.3 39.5 41.8 37.5 84.0 36.7CARDINAL CARDINAL 5 36.1 33.7 34.8 43.6 39.2 37.5 82.1 35.9MON-DAK MON-DAK 5 36.7 34.6 34.4 41.1 40.5 37.4 82.0 35.8Will WOMA2003 MONTOLA 2003 (++) 10 32.4 37.8 34.9 36.2 34.8 36.8 36.5 34.5 39.3 41.8 36.5 81.9 35.8WILL MONTOLA 2004 (++) 10 32.0 37.2 35.5 35.5 33.9 35.8 35.3 35.2 39.1 43.5 36.3 81.4 35.6WILL 95FI FINCH 10 32.4 34.5 34.5 35.0 35.5 36.5 34.5 34.9 43.6 40.9 36.2 81.3 35.502B 6081 02B 6081 5 35.7 36.6 35.0 37.7 36.5 36.3 80.7 35.2HYBRID 1601 HYBRID 1601 5 36.1 30.4 34.7 39.6 40.3 36.2 79.3 34.7HYBRID 9049 HYBRID 9049 7 31.9 31.0 32.1 34.3 29.1 42.8 34.6 33.7 74.8 32.7
39.1 37.8 37.7 36.8 38.7 37.3 36.9 39.8 42.6 37.3
April-July Precip. (in.) 8.87 7.07 8.64 7.37 5.71 7.43 8.09 6.29 8.75 7.68Total Annual Precip. (in.) 13.29 11.54 14.43 11.90 10.29 12.42 12.21 12.46 15.45 12.57Soil NO3 (lbs.) to SD at Planting n/a 78 214 708 157 154 665 219 99 289SD (Sampling Depth in Inches) 48 48 48 48 48 48 48 48 36 48Fertilizer Applied (# N) 70 70 70 50 0 0 0 0 0 29
(# P2O5) 40 40 40 20 40 45 40 45 45 39(# K2O) 25 25 25 10 0 0 0 0 0 9
Long-term check variety isNutrasaf.1/ ++ = PVP Title 5 or Title 5 Pending.2/ Percent of Nutrasaf oil% for the same data years as those in w hich a given entry w as tested.3/ 10-Yr Comparable Average = (x/y) * z w here x = average oil% of a given entry for years tested, y = average yield for Nutrasaf for the same years, and z = 10-Yr average oil% for the check variety Nutrasaf.
Ten-Year Percent Oil Summary on Selected Entries from Dryland Safflower Nursery. Northern Agricultural Research Center. Havre, Montana. 2002-2011.
Oil (%) @ 8% Seed Moisture
MEANS (For Entries Listed)


![Narc Ppt Zelenak[1]](https://img.pdfslide.net/doc/110x75/55a3335b1a28ab86618b46fc/narc-ppt-zelenak1.jpg)