Embed Size (px)
Citation preview

AN ABSTRACT OF THE DISSERTATION OF Lijoy K. Mathew for the degree of Doctor of Philosophy in Toxicology presented on October 29, 2007. Title: Unraveling Tissue Regeneration Using Chemical Genetics. Abstract approved: Robert L. Tanguay The emerging field of regenerative medicine is mainly approached by two
different aspects. First is the use of stem cell based models to generate a suite of
differentiated cells for therapeutic applications and the alternative approach is to utilize
the non-mammalian models that have the inherent capacity to regenerate their body
parts. Zebrafish caudal fin regeneration is a well established research system to
understand the basic principles of tissue regeneration. We combined a toxicological, a
chemical genetic and a candidate gene approach to define the molecular signaling
pathways important for regeneration. TCDD, an aryl hydrocarbon receptor (AHR) ligand
was used as a chemical probe to impair regeneration and we identified that AHR2 and
ARNT1 are the in vivo molecular partners for TCDD-mediated inhibition of regeneration.
We further performed a global genomic analysis in the regenerating fin tissue after
TCDD exposure to identify the downstream target genes modulated by AHR activation.
Functional grouping of the differentially expressed genes by TCDD revealed
misexpression of Wnt signaling genes as well as Wnt target genes, suggestive of a cross
talk between AHR and Wnt signaling pathways. We hypothesized that, mis-expression
of R-Spondin1, a TCDD-induced gene as well as a novel ligand for Wnt co-receptor
LRP6 was responsible for the differential expression of the Wnt target genes. Partial
antisense repression of R-Spondin1 or LRP6 prevented the inhibition of regeneration by
TCDD, indicating that mis-induction of R-Spondin1 which mediates through LRP6 is
absolutely required for TCDD-mediated inhibitory effect on fin regeneration.
Understanding the advantages of chemicals to probe tissue regeneration, we developed a
rapid throughput regeneration assay to identify additional small molecules that modulated
regeneration. Glucocorticoids were identified as inhibitors of regeneration and we
demonstrated that glucocorticoid receptor activation is absolutely required for mediating
the inhibition of regeneration. We further illustrated that, signaling from exogenous
glucocorticoids impairs blastema formation and limits regenerative capability in
vertebrates through an acute inflammation-independent mechanism and also report that,
neutrophils and macrophages are not required for fin regeneration. Finally, we performed
a comparative global genomic analysis between different zebrafish regeneration models
and identified raldh2, a rate limiting enzyme for retinoic acid (RA) synthesis as a
candidate gene across the distinct regeneration models. We demonstrated that, in addition
to the well established role of RA signaling during the later phase of regenerative
outgrowth, this signaling pathway is also critical for the initiation of regeneration,
suggesting a dual phase of RA signaling during fin regeneration. Collectively, our results
obtained through different experimental approaches suggest that, epimorphic
regeneration is completed by a well orchestrated process of multiple molecular signaling
events.

© Copyright by Lijoy K Mathew October 29, 2007
All Rights Reserved
Unraveling Tissue Regeneration Using Chemical Genetics
by
Lijoy K. Mathew
A DISSERTATION
submitted to
Oregon State University
in partial fulfillment of the requirement for the
degree of
Doctor of Philosophy
Presented October 29, 2007 Commencement June 2008

Doctor of Philosophy dissertation of Lijoy K. Mathew presented on October 29, 2007
APPROVED Major Professor, representing Toxicology Head of the Department of Environmental and Molecular Toxicology Dean of the Graduate School I understand that my dissertation will become part of the permanent collection of Oregon State University libraries. My signature below authorizes release of my dissertation to any reader upon request.
Lijoy K. Mathew, Author
ACKNOWLEDGEMENTS
I would like to thank a lot of people who helped me and guided me through the different
phases of my graduate studies. Firstly, I have to express my deepest gratitude to my
major advisor, Dr. Robert Tanguay who gave me an opportunity to join his lab in a very
special situation. I had a great experience working with him and I have to thank him for
providing the best guidance and support that helped in both academic as well as my
personal development. I also wanted to thank Dr. Eric Andreasen, who supported me
during the initial phase of my graduate studies and who also had the patience for teaching
me various laboratory techniques. Jane LaDu has to be thanked her for all the help she
provided at all technical as well as the non-technical levels. Sumitra Sengupta helped me
with a lot of experiments and I would like to thank her for all her support. I wanted to
thank all my committee members, namely, Dr. David Williams, Dr. Nancy Kerkvliet, Dr.
Mark Leid and Dr. Jerry Heidel for serving in my graduate committee, helping me with
the fellowship grants and guiding me throughout my graduate studies. I also wanted to
thank Laura Young and Jessica Perry for helping with various experiments. My sincere
thanks to everybody in the Department of Environmental and Molecular Toxicology for
all the support. American Heart Association (AHA) provided pre-doctoral fellowship
during my final year of graduate school and I have to thank AHA for the support. Most
importantly, I wanted to thank my parents, my brother, my other family members and
friends and very specially, my wife Usha who has been a great support for me all through
my studies and my son Jacob. Finally, I wanted to dedicate my thesis to my parents, who
spend their life teaching us and encouraging us to lead a good life by all means.
CONTRIBUTION OF AUTHORS This dissertation is a collective effort of many collaborators from different universities
and fellow members in Tanguay laboratory. In Chapter 1, Dr. Eric Andreasen provided
intellectual contribution as well as helped with the preparation of the manuscript. In
Chapter 2, Sumitra Sengupta performed certain exposure studies as well as in situ
hybridization experiments. Dr. Eric Andreasen assisted me with the microarray analysis
and quantitative-PCR experiments. Jane LaDu provided technical support for this project
including assistance with morpholinos microinjections and animal care. In Chapter 3,
Sumitra Sengupta worked with the screening of small molecule library and in situ
hybridization experiments. Dr. Randall Peterson provided us the 2000-member small
molecule library for rapid throughput regeneration assay. Dr. Eric Andreasen contributed
intellectually and Dr. Atsushi Kawakami provided us with the reagents required for in
situ hybridization experiments. Dr. Christiane V. Löhr conducted the histo-pathological
analysis. Catherine A. Loynes and Dr. Stephen A. Renshaw provided the transgenic fish
line (Tg(BACmpo:gfp)i114 ) and helped with the neutrophil and macrophage migration
assays. In Chapter 4, Sumitra Sengupta and Jessica Perry assisted with in situ
hybridization experiments. Jane LaDu contributed technically regarding various
microinjections and also supported with the fish care. Dr. Eric Andreasen assisted with
the microarray analysis and also helped with the preparation of the manuscript. Most
importantly, the work for this dissertation is the result of a group effort from all the past
and present members of Tanguay laboratory who provided direct and indirect
contributions.
TABLE OF CONTENTS
Page
Chapter 1: Introduction………………………………………………………………..1 Zebrafish Regeneration……………………………………………………1 Molecular Signaling During Zebrafish Caudal Fin Regeneration………...3 Early Life Stage Fin Regeneration Model………………………………...4 Chemical Genetics and Regeneration……………………………………..5 References…………………………………………………………………7 Chapter 2: AHR Activation Inhibits Regenerative Growth………………………….10 Abstract…………………………………………………………………..11 Introduction………………………………………………………………12 Materials and Methods…………………………………………………...14 Results……………………………………………………………………17 Discussion………………………………………………………………..23 References………………………………………………………………..28 Acknowledgments………………………………………………………..31 Chapter 3: Crosstalk between AHR and Wnt Signaling Impairs Tissue
Regeneration………………......................................................................45 Abstract…………………………………………………………………..46 Introduction………………………………………………………………47 Materials and Methods…………………………………………………...48 Results……………………………………………………………………52
TABLE OF CONTENTS (Continued)
Page
Discussion………………………………………………………………..58 References………………………………………………………………..63 Acknowledgments………………………………………………………..67 Chapter 4: Unraveling Tissue Regeneration Pathways Using Chemical Genetics…..89 Abstract…………………………………………………………………..90 Introduction………………………………………………………………91
Materials and Methods…………………………………………………...93
Results and Discussion……..……………………………………………97 Conclusions……………………………………………………………..104 References……………………………………………...……………….105 Acknowledgments………………………………………………………108 Chapter 5: Comparative Genomic Profiling Reveals Common Regenerative
Pathways………………………………………………………………..124
Abstract…………………………………………………………………125 Introduction……………………………………………………………..126 Materials and Methods………………………………………………….128 Results…………………………………………………………………..133 Discussion………………………………………………………………142 References………………………………………………………………147 Acknowledgments………………………………………………………151 Chapter 6: Conclusions……………………………………………………….…….183
LIST OF FIGURES
Figure Page
2-1 TCDD inhibits the regeneration of zebrafish fin primordia……………...……....32 2-2 The suppression of fin regeneration by TCDD is specific to the regenerating tissue…………….……………………………………...………….33 2-3 TCDD preferentially affects the regenerating fin………….………………….....34 2-4 Identification of AHR pathway members in the regenerating zebrafish fin tissue by RT-PCR……………………….…………………………………...36 2-5 Whole mount immunolocalization of zfCYP1A………….……………………...37 2-6 Activation of AHR2 by BNF inhibits fin regeneration similarly to TCDD……..38 2-7 Fin regeneration occurs in zfahr2 morpholino injected embryos in the presence of TCDD…………………………….………………………….39 2-8 Role of zfARNT members in the inhibition of fin regeneration by TCDD….…..40 2-9 Inhibitory effect on the process of fin regeneration by TCDD and FGFR1 inhibitor is different………………………….……………………...42 3-1 Experimental Design of Larval Microarray Analysis……….…………………...68 3-2 Heat map and pie graph depicting altered genes by TCDD exposure in the regenerating fin…………………………….……………………69 3-3 Validation of TCDD modulated genes by qRT-PCR in the larval regenerating fin tissue…………….……………………………………………...70 3-3 Partial antisense repression of R-Spondin1 restores the regenerative ability in the presence of TCDD………………………………….……………...72 3-4 LRP6 is required for TCDD to mediate inhibition of regeneration………….…..74 3-5 GSK3 inhibitor BIO impairs regeneration……….………………………………76 3-6 Sox9b homozygous mutants are not defective of regenerative outgrowth….…...78 3-7 Proposed model of mechanism………….……………………………………….79
LIST OF FIGURES (Continued)
Figure Page
3S-1 Comparative toxicogenomic analysis……………………………………………81 4-1 Network of molecular signaling during regeneration.………………………….109 4-2 Rapid screening for inhibitors of larval fin regeneration……….………………110 4-3 Glucocorticoids inhibit regeneration………….………………………………...111 4-4 Expression of GR primary target genes are induced by Beclomethasone……...113 4-5 Activation of GR is required for inhibition of regeneration by Beclomethasone………………………………………………………………...114 4-6 Beclomethasone specifically impact early stages of regeneration…….………..116 4-7 Wound healing and blastema formation is affected by Beclomethasone….…...117 4-8 Proliferation of cells is impacted by Beclomethasone at different regenerative stages…………………….………………………………………..119 4-9 Neutrophils and Macrophages are not critical for regeneration…….…………..121 4S-1 Beclomethasone induced the global gene expression of GR primary target genes…….……………………………………………………………….123 5-1 Comparative genomic analysis during zebrafish regeneration……….…….......152 5-2 In situ localization of raldh2 in the larval and adult regenerating fin tissue…...154 5-3 Inhibition of RA signaling impairs fin regeneration with impaired wound epithelium and blastema formation…….…………...…………………..156 5-4 Raldh2 expression during fin regeneration is controlled by Wnt Signaling…....158 5-5 Expression of raldh2 is dependent on the phosphorylation of ERK1/2 during fin regeneration…………………….…………………………..160 5-6 Activin-βA Signaling regulates raldh2 expression during regeneration…….….162 5-7 Proposed model of essential molecular pathways controlling fin regeneration..164 5S-1 Fin Morphogenesis…….………………………………………………………..166
LIST OF FIGURES (Continued)
Figure Page
5S-2. Validation of selected genes by quantitative real time PCR (qRT-PCR)………167 5S-3. Inhibition of RA signaling impacts cell proliferation during larval fin regeneration………………………………………………………………....168
LIST OF TABLES
Table Page
2-1 Oligonucleotides used for PCR………….……………………………………….44 3-1 Wnt signaling pathway members and target genes altered by TCDD
exposure in the two fin regeneration models…………………………………….80
3S-1 Genes Enhanced at Least 1.7 Fold by TCDD Exposure in Larval regenerating fins………………………………………………………………….82
3S-2 Genes Repressed at Least 1.7 Fold by TCDD in Regenerating Fins of Larvae….84 3S-3 Transcripts enhanced at least 1.7 fold by TCDD exposure in
regenerating fins of larvae and adults……………………………………………86
3S-4 Transcripts repressed at least 1.7 fold by TCDD exposure in regenerating fins of larvae and adults……………………………………………87
3S-5 Oligonucleotides used for qRT-PCR…………………………………………….88 5S-1 List of selected genes that were at least 2.5 fold differentially abundant at
any regenerating time point when compared to 0dpa during larval fin regeneration……………………………………………………………………..170
5S-2 Summary of the pattern of gene regulation between adult and larval fin regeneration…………………………………………………………………176 5S-3 Selected genes that were commonly expressed between larval and adult
fin regeneration………………………….………………………….…………..177
5S-4 Summary of the pattern of gene regulation between larval fin and adult heart regeneration……………………………………………………………….179
5S-5 Selected genes that were commonly expressed between larval and adult heart regeneration………………………………………………………………180
5S-6 List of selected genes commonly present between larval fin, adult fin and adult heart regeneration systems………………………………………………..181
5S-7 List of gene specific primers used for qRT-PCR and cloning of raldh2 for probe synthesis…………………………………………………………...…182
Unraveling Tissue Regeneration Using Chemical Genetics
Chapter 1. Introduction
The systematic functioning of all the organ systems in a human body is important
as an injury or disease to a tissue/organ could lead to reduced quality of life or even
fatality. Numerous disease conditions could be significantly improved if therapies that
encourage tissue regeneration were available. The field of regenerative medicine is aimed
at developing strategies to restore individual cell types, complex tissues, or structures that
are lost or damaged. Most adult tissues and organs, especially in mammals, have lost
their potential for further growth and differentiation. As a result, injury to a tissue or
organ usually results in permanent damage (from scarring to disability). However, some
non mammalian vertebrate animal models including salamanders, newts and zebrafish
have retained the ability to regenerate their tissues, organs and appendages (Akimenko et
al., 2003; Brockes et al., 2001; Poss et al., 2003). Since comparative genomics indicate
significant genetic conservation between mammals and lower vertebrates, what are the
molecular differences that permit tissue regeneration in the non mammalian models, and
conversely make mammalian tissues recalcitrant to regeneration? By understanding the
molecular and genetic pathways that coordinately function to accomplish regeneration in
these “lower” animals, we will be in a stronger position to begin to understand why
mammals fail to respond to tissue injury with a regenerative mechanism.
Zebrafish Regeneration
Zebrafish have the remarkable capability to regenerate their body parts including
fins, optic nerve, scales, heart and spinal cord (Poss et al., 2003). Adult caudal fin
regeneration is the most well-studied model for dissecting the molecular signaling that
controls regenerative growth and angiogenesis (Bayliss et al., 2006; Poss et al., 2003).
2
This process is referred to as epimorphic regeneration. Epimorphic regeneration involves
the reprogramming and migration of cells that differentiate and restore a tissue to its
original form (reviewed in (Brockes and Kumar, 2005). Adult fin regeneration has been
studied in a number of teleost fishes, including goldfish (Morgan, 1902; Santamaria et al.,
1992; Santamaria et al., 1996), trout (Alonso et al., 2000), tilapia (Kemp and Park, 1970;
Santamaria et al., 1992) and minnows (Geraudie and Singer, 1977; Morgan, 1900),
indicating that regenerative growth is functionally similar in various fish species. In
recent years, the emergence of the zebrafish model has reinvigorated the field of adult fin
regeneration (Akimenko et al., 2003; Geraudie et al., 1995; Katogi et al., 2004; Lee et al.,
2005; Mari-Beffa et al., 1996; Nechiporuk and Keating, 2002; Santamaria et al., 1996;
Stoick-Cooper et al., 2007; Whitehead et al., 2005).
In zebrafish, the adult caudal fin consists of 18 bony rays attached to the skeleton
by ligaments. Each ray, referred to as a lepidotrichia is comprised of two hemirays. The
hemirays consist of repeating segments joined by ligaments. The area between the
hemirays of a lepidotrichia contains blood vessels, nerves and mesenchymal cells. The fin
grows by successive addition of hemiray segments to the most distal segment. After
partial amputation of the caudal fin, an apical epithelial wound cap (AEC) forms over the
clot at the amputation site within 12 hours post amputation (hpa). The AEC cells are
derived from non-proliferating local epithelial cells that migrate laterally over the wound.
Once the epithelial cap is formed, mesenchymal cells proliferate and migrate from sites
beneath the wound plane and accumulate under the epithelial cap forming a structure
called the blastema within 48 hpa. The precise origin of blastemal cells is currently
unknown, but the body of evidence supports the conclusion that blastemal cells are
derived by a process of de-differentiation from adult mesenchymal cells at the plane of
amputation. The possibility remains that blastema cells could arise from a population of
quiescent stem cells, which can rapidly proliferate following amputation (reviewed in
(Akimenko et al., 2003). There is little experimental data in adult zebrafish for the
presence of such stem cells, however it has been demonstrated that melanocytes originate
from a population of stem cells which differentiate and migrate to the regenerating fin
tissue (Rawls and Johnson, 2001). Although interesting, it is unlikely that these migrating
melanocytes give rise to the other cell types required for regeneration as cellular
3
proliferation data is more consistent with the hypothesis that blastemal cells originate
from the connective tissue between the hemirays which heavily incorporates BrdU as
early 24 hpa (Poleo et al., 2001). The blastemal cells proliferate and re-differentiate,
replacing the amputated tissues which are infused with nerves and blood vessels in a
process called regenerative outgrowth. Regenerative outgrowth begins at 2 days post
amputation (dpa) until the regenerative event is complete at about 14 dpa.
There is also growing evidence in zebrafish to suggest that heart regeneration has
a high degree of commonality with fin regeneration with respect to the order of events
which occur after a surgical wound. Both tissues regenerate through the blastema
formation followed by proliferation of cells to complete outgrowth (Lepilina et al., 2006;
Poss et al., 2003; Poss et al., 2002b; Raya et al., 2004; Raya et al., 2003). Gene
expression of msxB and msxC encoding homeo-domain containing transcription factors
were upregulated in regenerating zebrafish hearts as early as 3 dpa (Raya et al., 2003) and
in regenerating fin blastema at 1dpa (Akimenko et al., 1995). Additionally, the expression
pattern of notch1b and deltaC, members of the Notch signaling pathway, are induced
very early after heart amputation as well as in the regenerating fin blastema (Raya et al.,
2003). None of the four genes described above were detected in the non-amputated fin or
heart tissue, indicating that the re-induction of these genes was specific to the
regenerating tissue. Additionally, the nightcap zebrafish mutant harboring a temperature
sensitive mutation in the Mps1 gene, a kinase required for the mitotic checkpoint, failed
to regenerate both heart and fin tissue (Poss et al., 2003; Poss et al., 2002a). The nbl
zebrafish mutant having a missense mutation in hsp60 failed to regenerate the fin as well
as the heart. These studies underscores the mechanistic similarities between the two
regeneration models (Makino et al., 2005).
Molecular Signaling During Zebrafish Caudal Fin Regeneration
The caudal fin regeneration is a well orchestrated process and is tightly controlled
by multiple molecular signaling pathways in a spatio-temporal manner. Some of the
earliest work in zebrafish has demonstrated an essential role of retinoic acid (RA)
signaling in regeneration (Ferretti and Geraudie, 1995). Exposure to RA itself affects
4
regeneration by impacting the size of the wound epidermis thereby impinging on re-
patterning within the blastema (Ferretti and Geraudie, 1995) in addition to inducing
apoptosis in the AEC (Geraudie and Ferretti, 1997). One of the most well studied
signaling pathways during zebrafish regeneration is Fibroblast growth factor (Fgf)
signaling. This signaling pathway is absolutely critical for adult zebrafish fin and heart
regeneration and this has been demonstrated using Fgfr 1 inhibitor (SU5402) as well as
the transgenic line (hsp70:dn-fgfr1 ) that expresses the dominant negative Fgfr1 protein
upon heat shock (Lee et al., 2005; Lepilina et al., 2006; Poss et al., 2000b). A genetic
zebrafish mutant study revealed that fgf20a is absolutely required for the initiation and
formation of blastema (Whitehead et al., 2005) and referred fgf20a as an initiator of
regeneration. Recent studies illustrate that a proper balance of Wnt/β-catenin signaling is
to be critical for the formation and proliferation of blastema cells that is required for
complete regeneration (Kawakami et al., 2006; Stoick-Cooper et al., 2007). Moreover, it
has also been established that fgf20a expression is controlled by Wnt/β-catenin signaling,
suggesting that Wnt/β-catenin signaling acts upstream of Fgf signaling (Stoick-Cooper et
al., 2007; Whitehead et al., 2005). Activin-βA(actβA) signaling is also reported to have
functional role during regeneration and is important for the cell migration during wound
healing and blastemal proliferation (Jazwinska et al., 2007). Even though major progress
has been made in the identification of some of the essential molecular pathways for
regeneration such as RA, Fgf, Wnt and actβA signaling, most would agree that we are
still at the early stages of pathway discovery (Jazwinska et al., 2007; Kawakami et al.,
2006; Poss et al., 2003; Poss et al., 2000a; Poss et al., 2000b; Stoick-Cooper et al., 2007;
Whitehead et al., 2005).
Early Life Stage Fin Regeneration Model
Although adult zebrafish regeneration models have proven useful, many of the
molecular and genetic tools that are useful for embryonic and larval studies are not easily
applied to adult stage animals (Poss et al., 2003). Recent results indicate that these
technical barriers may be overcome by using an early life stage regeneration model.
Specifically, two-day-old zebrafish larvae completely regenerate their fin primordia
5
within three days following amputation (Kawakami et al., 2004; Mathew et al., 2006;
Nakatani et al., 2007). The possibility of evaluating fin regeneration during this
experimentally tractable life stage is enticing. It is recognized that the structure of the
adult and larval fins are significantly different, however there is increasing evidence that
there are remarkable similarities at the cellular and molecular level between adult and
larval regeneration(Kawakami et al., 2004; Nakatani et al., 2007). Morphologically, the
larval fin regenerates by a process that resembles that of the adult. A wound epithelium
covers a pool of highly proliferating blastema-like cells as in adult regeneration
(Kawakami et al., 2004). Also not surprisingly, similar to the adults, chemical inhibition
of FGFR1 abrogates fin regeneration (Kawakami et al., 2004; Mathew et al., 2006). Since
this life stage is inherently amenable to molecular and genetic manipulations such as
transient and stable transgenics, genetic mutant screens and chemical genetics, this model
offers a powerful new way to identify novel regulators of tissue regeneration.
Chemical Genetics and Regeneration
The use of small chemicals is an enormously powerful tool to help discover
unknown players in biological processes. For instance, chemicals that inhibit protein
function are useful for the identification of the key molecular target. To identify the
principal molecular signaling pathways that control regeneration, chemical probes could
be used to modulate regeneration. The underlying premise is that if a chemical inhibits or
modulates an essential molecular target, then regeneration will be impacted and the
identification of the target will help to unravel regenerative mechanisms. Previously it
has been demonstrated that aryl hydrocarbon receptor (AHR) activation by TCDD
impairs caudal fin regeneration in zebrafish (Andreasen et al., 2007; Andreasen et al.,
2006; Zodrow and Tanguay, 2003). The AHR is a ligand activated, basic helix-loop-helix
transcription factor and is a member of the PAS domain family of genes [reviewed in (Gu
et al., 2000)]. The AHR signal transduction pathway in fish is similar to that in mammals,
with the exception that fish have two or more AHR genes while mammals have only one
[reviewed in (Hahn et al., 1997; Tanguay et al., 2003)]. Zebrafish and mammals also
have two dimerization partners for AHR, AHR nuclear translocator proteins 1 and 2
(ARNT1, ARNT2), both of which can support AHR signaling (Prasch et al., 2004; Prasch
6
et al., 2006; Tanguay et al., 2000). Studying the inhibition of fin regeneration
phenomenon by TCDD will provide more insight into the molecular mechanisms of AHR
biology as well as greater understanding about tissue regeneration. We anticipated that, if
one chemical could be used to identify important molecular signaling pathways required
for regeneration, an unbiased chemical genetic approach will also lead to the
identification of novel regenerative pathways.
Currently there are numerous gaps in our understanding of the complex
regenerative pathways and interactions that mediate the different stages of regeneration.
By thoroughly taking advantage of the early life stage zebrafish model, we will begin to
dissect signaling events by mainly three approaches:
1. A toxicological approach to interfere a normal regeneration process and then to
identify the molecular pathways affected by the AHR ligand, TCDD (Chapter 2
&3).
2. An unbiased chemical genetic approach to unravel novel regenerative pathways
(Chapter 4).
3. A candidate gene approach with the utility of global genomic analysis to identify
common molecular signaling between different regeneration platforms (Chapter 5).

7
References Akimenko MA, Johnson SL, Westerfield M and Ekker M (1995) Differential induction of
four msx homeobox genes during fin development and regeneration in zebrafish. Development 121:347-57.
Akimenko MA, Mari-Beffa M, Becerra J and Geraudie J (2003) Old questions, new tools, and some answers to the mystery of fin regeneration. Dev Dyn 226:190-201.
Alonso M, Tabata YA, Rigolino MG and Tsukamoto RY (2000) Effect of induced triploidy on fin regeneration of juvenile rainbow trout, Oncorhynchus mykiss. J Exp Zool 287:493-502.
Andreasen EA, Mathew LK, Lohr CV, Hasson R and Tanguay RL (2007) Aryl hydrocarbon receptor activation impairs extracellular matrix remodeling during zebra fish fin regeneration. Toxicol Sci 95:215-26.
Andreasen EA, Mathew LK and Tanguay RL (2006) Regenerative Growth is Impacted by TCDD: Gene Expression Analysis Reveals Extracellular Matrix Modulation. Toxicol Sci 92:254-269.
Bayliss PE, Bellavance KL, Whitehead GG, Abrams JM, Aegerter S, Robbins HS, Cowan DB, Keating MT, O'Reilly T, Wood JM, Roberts TM and Chan J (2006) Chemical modulation of receptor signaling inhibits regenerative angiogenesis in adult zebrafish. Nat Chem Biol 2:265-73.
Brockes JP and Kumar A (2005) Appendage regeneration in adult vertebrates and implications for regenerative medicine. Science 310:1919-23.
Brockes JP, Kumar A and Velloso CP (2001) Regeneration as an evolutionary variable. J Anat 199:3-11.
Ferretti P and Geraudie J (1995) Retinoic acid-induced cell death in the wound epidermis of regenerating zebrafish fins. Dev Dyn 202:271-83.
Geraudie J and Ferretti P (1997) Correlation between RA-induced apoptosis and patterning defects in regenerating fins and limbs. Int J Dev Biol 41:529-32.
Geraudie J, Monnot MJ, Brulfert A and Ferretti P (1995) Caudal fin regeneration in wild type and long-fin mutant zebrafish is affected by retinoic acid. Int J Dev Biol 39:373-81.
Geraudie J and Singer M (1977) Relation between nerve fiber number and pectoral fin regeneration in the teleost. J Exp Zool 199:1-8.
Gu YZ, Hogenesch JB and Bradfield CA (2000) The PAS superfamily: sensors of environmental and developmental signals. Annu Rev Pharmacol Toxicol 40:519-61.
Hahn ME, Karchner SI, Shapiro MA and Perera SA (1997) Molecular evolution of two vertebrate aryl hydrocarbon (dioxin) receptors (AHR1 and AHR2) and the PAS family. Proc Natl Acad Sci U S A 94:13743-8.
Jazwinska A, Badakov R and Keating MT (2007) Activin-betaA Signaling Is Required for Zebrafish Fin Regeneration. Curr Biol.
Katogi R, Nakatani Y, Shin-i T, Kohara Y, Inohaya K and Kudo A (2004) Large-scale analysis of the genes involved in fin regeneration and blastema formation in the medaka, Oryzias latipes. Mech Dev 121:861-72.
8
Kawakami A, Fukazawa T and Takeda H (2004) Early fin primordia of zebrafish larvae regenerate by a similar growth control mechanism with adult regeneration. Dev Dyn 231:693-9.
Kawakami Y, Rodriguez Esteban C, Raya M, Kawakami H, Martí M, Dubova I and Izpisua Belmonte JC (2006) Wnt/-catenin signaling regulates vertebrate limb regeneration. Genes and Dev Dec 2006; 20: 3232 - 3237 ; doi:10.1101/gad.1475106.
Kemp NE and Park JH (1970) Regeneration of lepidotrichia and actinotrichia in the tailfin of the teleost Tilapia mossambica. Dev Biol 22:321-42.
Lee Y, Grill S, Sanchez A, Murphy-Ryan M and Poss KD (2005) Fgf signaling instructs position-dependent growth rate during zebrafish fin regeneration. Development.
Lepilina A, Coon AN, Kikuchi K, Holdway JE, Roberts RW, Burns CG and Poss KD (2006) A dynamic epicardial injury response supports progenitor cell activity during zebrafish heart regeneration. Cell 127:607-19.
Makino S, Whitehead GG, Lien CL, Kim S, Jhawar P, Kono A, Kawata Y and Keating MT (2005) Heat-shock protein 60 is required for blastema formation and maintenance during regeneration. Proc Natl Acad Sci U S A.
Mari-Beffa M, Santanaria JA, Fernandez-Llebrez P and Becerra J (1996) Histochemically defined cell states during tail fin regeneration in telost fishes. Differentiation 60:139-149.
Mathew LK, Andreasen EA and Tanguay RL (2006) Aryl hydrocarbon receptor activation inhibits regenerative growth. Mol Pharmacol 69:257-65.
Morgan TH (1900) Regeneration in teleosts. Arch Entw Org 10:120-131. Morgan TH (1902) Further experiments on the regeneration of the tail fins of fishes. Arch
Entw MEch 14:539-561. Nakatani Y, Kawakami A and Kudo A (2007) Cellular and molecular processes of
regeneration, with special emphasis on fish fins. Dev Growth Differ 49:145-54. Nechiporuk A and Keating MT (2002) A proliferation gradient between proximal and
msxb-expressing distal blastema directs zebrafish fin regeneration. Development 129:2607-17.
Poleo G, Brown CW, Laforest L and Akimenko MA (2001) Cell proliferation and movement during early fin regeneration in zebrafish. Dev Dyn 221:380-90.
Poss KD, Keating MT and Nechiporuk A (2003) Tales of regeneration in zebrafish. Dev Dyn 226:202-210.
Poss KD, Nechiporuk A, Hillam AM, Johnson SL and Keating MT (2002a) Mps1 defines a proximal blastemal proliferative compartment essential for zebrafish fin regeneration. Development 129:5141-9.
Poss KD, Shen J and Keating MT (2000a) Induction of lef1 during zebrafish fin regeneration. Dev Dyn 219:282-6.
Poss KD, Shen J, Nechiporuk A, McMahon G, Thisse B, Thisse C and Keating MT (2000b) Roles for Fgf signaling during zebrafish fin regeneration. Dev Biol 222:347-58.
Poss KD, Wilson LG and Keating MT (2002b) Heart regeneration in zebrafish. Science 298:2188-90.
Prasch AL, Heideman W and Peterson RE (2004) ARNT2 is not required for TCDD developmental toxicity in zebrafish. Toxicol Sci 82:250-8.
9
Prasch AL, Tanguay RL, Mehta V, Heideman W and Peterson RE (2006) Identification of zebrafish ARNT1 homologs: 2,3,7,8-tetrachlorodibenzo-p-dioxin toxicity in the developing zebrafish requires ARNT1. Mol Pharmacol 69:776-87.
Rawls JF and Johnson SL (2001) Requirements for the kit receptor tyrosine kinase during regeneration of zebrafish fin melanocytes. Development 128:1943-9.
Raya A, Consiglio A, Kawakami Y, Rodriguez-Esteban C and Izpisua-Belmonte JC (2004) The zebrafish as a model of heart regeneration. Cloning Stem Cells 6:345-51.
Raya A, Koth CM, Buscher D, Kawakami Y, Itoh T, Raya RM, Sternik G, Tsai HJ, Rodriguez-Esteban C and Izpisua-Belmonte JC (2003) Activation of Notch signaling pathway precedes heart regeneration in zebrafish. Proc Natl Acad Sci U S A 100 Suppl 1:11889-95.
Santamaria JA, Mari-Beffa M and Becerra J (1992) Interactions of the lepidotrichial matrix components during tail fin regeneration in teleosts. Differentiation 49:143-50.
Santamaria JA, Mari-Beffa M, Santos-Ruiz L and Becerra J (1996) Incorporation of bromodeoxyuridine in regenerating fin tissue of the goldfish Carassius auratus. J Exp Zool 275:300-7.
Stoick-Cooper CL, Weidinger G, Riehle KJ, Hubbert C, Major MB, Fausto N and Moon RT (2007) Distinct Wnt signaling pathways have opposing roles in appendage regeneration. Development 134:479-89.
Tanguay RL, Andreasen E, Heideman W and Peterson RE (2000) Identification and expression of alternatively spliced aryl hydrocarbon nuclear translocator 2 (ARNT2) cDNAs from zebrafish with distinct functions. Biochim Biophys Acta 1494:117-28.
Tanguay RL, Andreasen EA, Walker MK and Peterson RE (2003) Dioxin toxicity and aryl hydrocarbon receptor signaling in fish, in Dioxins and Health (Schecter A ed) pp 603-628, Plenum Press, New York.
Whitehead GG, Makino S, Lien CL and Keating MT (2005) fgf20 is essential for initiating zebrafish fin regeneration. Science 310:1957-60.
Zodrow JM and Tanguay RL (2003) 2,3,7,8-tetrachlorodibenzo-p-dioxin inhibits zebrafish caudal fin regeneration. Toxicol Sci 76:151-161.
10
Chapter 2. AHR Activation Inhibits Regenerative Growth
Lijoy K, Mathew, Eric A, Andreasen, and Robert L. Tanguay
Department of Environmental and Molecular Toxicology, Marine and Freshwater
Biomedical Sciences Center, Environmental Health Sciences Center,
Oregon State University, Corvallis, OR, 97331
Reprinted with permission of the American Society for Pharmacology and Experimental Therapeutics. All rights reserved.
11
Abstract
There is considerable literature supporting the conclusion that inappropriate
activation of the aryl hydrocarbon receptor (AHR) alters cellular signaling. We have
previously established that fin regeneration is specifically inhibited by TCDD in adult
zebrafish and have used this in vivo end point to evaluate interactions between AHR and
growth controlling pathways. Because there are experimental limitations in studying
regeneration in adult animals, we have developed a larval model to evaluate the effect of
AHR activation on tissue regeneration. Two day old zebrafish regenerate their amputated
caudal fins within 3 days. Here we demonstrate that TCDD specifically blocks
regenerative growth in larvae. The AHR pathway in zebrafish is considerably more
complex than in mammals, with at least three zebrafish AHR genes (zfAHR1a, zfAHR1b
and zfAHR2), and two ARNT genes (zfARNT1 and zfARNT2). Although it was
presumed that the block in regeneration was mediated by AHR activation, it had not been
experimentally demonstrated. Using antisense morpholinos and mutant fish lines, we
report that zfAHR2 and zfARNT1 are the in vivo dimerization partners that are required
for inhibition of regeneration by TCDD. Several pathways including FGF signaling are
essential for fin regeneration. Even though impaired FGF signaling and TCDD exposure
both inhibit fin regeneration, their morphometric response are distinct suggesting that the
mechanisms of impairment are different. With the plethora of molecular and genetic
techniques that can be applied to larval stage embryos, this in vivo regeneration system
can be further exploited to understand cross talk between AHR and other signaling
pathways.
12
Introduction
2,3,7,8-Tetrachlorodibenzo-p-dioxin (TCDD), an ubiquitous environmental
contaminant causes a wide variety of toxicities including reproductive and developmental
toxicity, immunotoxicity, cardiotoxicity, teratogenicity and neurotoxicity at low exposure
levels. TCDD elicits toxicity by acting as a ligand for the aryl hydrocarbon receptor
(AHR), [reviewed in (Schmidt and Bradfield, 1996)]. The AHR pathway has been
studied in various disparate vertebrates including several species of fish. The AHR signal
transduction pathway in fish species is akin to that of mammals except fish possess at
least two AHR genes while the mammals have only one. AHR isoforms are designated as
AHR1, and AHR2 (Hahn et al., 1997). zfAHR1a, zfAHR1b and zfAHR2 have been
identified in zebrafish (Andreasen et al., 2002a; Karchner et al., 2005; Tanguay et al.,
1999). In vivo antisense knockdown studies in zebrafish embryos have established that
zfAHR2, and not zfAHR1, mediates the multiple end points of TCDD developmental
toxicity in zebrafish (Prasch et al., 2003). Four splice variants of zfARNT2 denoted as
zfARNT2a, b, c, x have been cloned and characterized (Tanguay et al., 2000; Wang,
2000). In vitro molecular and biochemical studies suggest that zfARNT2b functionally
heterodimerizes with zfAHR2 to enhance the dioxin response element (DRE) driven
transcription in the presence of TCDD (Tanguay et al., 1999; Tanguay et al., 2000).
However, neither morpholino knockdown of zfARNT2 in zebrafish embryo, nor
zebrafish ARNT2 mutants (zfarnt2–/– ) prevented TCDD mediated developmental toxicity
(Prasch et al., 2004). This contradiction led to further investigation and identification of
zebrafish ARNT1. Functional characterization by morpholino approach delineated that
zfARNT1 is the functional heterodimer of zfAHR2 in zebrafish (Prasch et al., In Press).
Although AHR-driven transcriptional regulation has been extensively studied, the
mechanism by which TCDD causes toxicity is not fully understood. The development of
in vivo models to explore the complexity of AHR signal transduction is essential. Adult
zebrafish have the remarkable capacity to regenerate their caudal fins completely within
fourteen days after amputation (Geraudie et al., 1995) and it was previously demonstrated
that TCDD inhibits this complex process (Zodrow and Tanguay, 2003). Recently it was
13
reported that the caudal fin primordia of zebrafish larvae are also capable of tissue
regeneration in a process remarkably similar to that observed in adults (Kawakami et al.,
2004). In the larval fin, within 10 min of amputation, epithelial cells surrounding the
amputation plane begin migrate over the wound site. These epithelial cells accumulate to
form a compact wound epithelium by 24 hours post amputation (hpa). Actively
proliferating mesenchymal cells denoted as blastema cells are evident in the area adjacent
to the amputation plane by 24-48 hpa. After blastema formation, both the adult and larval
regenerating fins exhibit a common cell proliferation profile with the proliferation
starting at the distal area (posterior to the amputation plane). The distal-most cells do not
proliferate during the late phase of repair; instead, drastic cell proliferation occurs in the
proximal (anterior to the amputation plane) region. In addition to the similar regenerative
events between adults and larvae, fibroblast growth factor (FGF) signaling is necessary
during fin regeneration suggesting a common regenerative molecular mechanism
(Kawakami et al., 2004; Poss et al., 2000b).
Studies in adult fin regeneration were limited by barriers in molecular and genetic
techniques which motivated us to develop a larval model to evaluate the consequence of
AHR activation on early life stage regeneration. The objectives of this study were to first
determine whether TCDD impairs larval fin regeneration, and then to determine which
AHR pathway members mediate the response. Our observations demonstrate that TCDD
specifically impedes larval fin regeneration. Activation of the AHR pathway was
confirmed by immunohistochemical localization of induced cytochrome P4501A
(zfCYP1A), a well studied AHR responsive gene. Antisense knockdown and mutant
zebrafish lines demonstrate that zfAHR2 and zARNT1 are both required for the TCDD
dependent block in regenerative growth. We also demonstrate that the inhibitory effects
of TCDD exposure and FGF receptor antagonism on regeneration are distinct. In addition
to the inherent advantages of zebrafish (i.e. rapid development and fecundity) the larval
zebrafish model allows the use of many additional molecular and genetic techniques,
such as transient and stable transgenics, mutant screens and antisense gene repression.
Thus the larval zebrafish is an outstanding model to unravel tissue regeneration
mechanisms.
14
Materials and Methods
Zebrafish lines and embryos
Fertilized AB strain embryos (University of Oregon, Eugene, OR) were used for
all the experiments. zfarnt2–/– mutants (ARNT2 hi1715) in the TAB-14 background
(Tubingen/AB cross no.14) was a gift of Nancy Hopkins (Center for Cancer Research
and Department of Biology, Massachusetts Institute of Technology, Cambridge, MA). All
embryos were raised in our laboratory according to standard procedures. Each
experimental group consisted of 12 larvae.
Amputation of zebrafish larval fin primordia and chemical exposure
Embryos were dechorionated and anesthetized with 0.008% 3-amino benzoic acid
ethylester (tricaine) in fish water. At 48 hours post fertilization (hpf), larvae were placed
on an agar plate and the caudal fin primordia was amputated with a surgical razor blade
just posterior to the notochord and transferred to a 24 well plate containing chemical free
fish water. 2,3,7,8-Tetrachlorodibenzo-p-dioxin (TCDD)(>99% pure) was purchased
from Chemsyn (Lenexa, KS); β-naphthoflavone (BNF, >99% pure) was obtained from
Acros Organics (Morris Plains, NJ) and α-naphthoflavone (ANF) from Sigma, (St.Louis,
MO). The amputated larvae (48 hpf) were exposed to vehicle (0.3% DMSO) or TCDD in
vehicle (0.5 ng/mL of fish water) in a 24 well plate for 1 hr. After incubation, the
embryos were rinsed multiple times and allowed to develop for 3 days in vehicle/TCDD-
free water at 270C. Since BNF and ANF (both 0.3 μg/mL) were not soluble in DMSO,
these ligands were dissolved in dimethyl formamide (DMF). ANF and BNF exposures
were conducted in 24 well plates for 24 hours, followed by multiple rinses in water.
After exposure to ANF and BNF, the larvae were reared for 3 days at 270C in ANF and
BNF free water. The FGFR1 inhibitor (SU5402) was purchased from Calbiohem
(SanDiego, CA). The amputated larvae were exposed to SU5402 at a final concentration
of 5μM for 1 day, followed by multiple rinses with fish water.
15
Reverse Transcription Polymerase Chain Reaction (RT-PCR)
The caudal fin primordia of 48 hpf larvae were amputated and the animals were
exposed to vehicle or TCDD in vehicle (0.5 ng/mL of fish water) for 1 h. After multiple
rinses in TCDD free water, the embryos were reared at 270C. Regenerating fins were
surgically amputated again at 3 dpa just posterior to the notochord. The amputated
regenerating fins were directly immersed into TRI reagent (Molecular Research
Laboratories, Cincinnati, OH) and RNA was isolated as previously described (Tanguay et
al., 1999). Reverse transcription (RT) reactions were carried out using 100 ng of total
RNA, 500 ng Oligo dT12-18 primer, 1mM dNTPs. The mixture was heated up to 65°C for
5 min and quick chilled on ice. The 20 µl reaction contained 1X First Strand Buffer (50
mM Tris-HCl (pH 8.3), 75 mM KCl, 3 mM MgCl2), 0.01 M DTT, 40 units of
RNaseOUT, and 200 units of SuperScript™ II Reverse Transcriptase (Invitrogen,
Carlsbad, California). This reaction was incubated at 42°C for 50 min, followed by
inactivation at 70°C for 15 min. Each 50 µl PCR reaction contained a 2 µl aliquot of
cDNA as the template, 0.2 mM each dNTPs, 10X PCR Buffer, 1 mM MgSO4, 0.2 µM
forward and reverse primers for either AHR1, AHR2, ARNT1, ARNT2b/c, CYP1A, or β-
actin ( Table 1) and 1.0 unit of KOD Hot Start DNA polymerase (Novagen, San Diego,
CA). The reactions were run in a PTC-100 Peltier thermal cycler (MJ Research, South
San Francisco, CA) at the following conditions: 94°C for 20 s; 58°C for 30 s, 72°C for 80
s, for a total of 35 cycles. The PCR products were resolved by electrophoresis through a
2% agarose gel and visualized by ethidium bromide staining.
Morpholinos
Zebrafish aryl hydrocarbon receptor 2 morpholino (zfahr2-MO) (Gene Tools,
Corvallis, OR) targeted the translation start site beginning 4 bp upstream of the AUG
codon to 18 bp downstream of the sequence. The sequence of the zfahr2-MO was
5'TGTACCGATACCCGCCGACATGGTT3' and the 3' end was fluorescein tagged to
assess microinjection success. Morpholinos were diluted to 2.8 mM in 1X Danieau’s
solution (58 mM NaCl, 0.7 mM KCl, 0.4 mM MgSO4, 0.6 mM Ca(NO3)2, 5 mM HEPES,
pH 7.6) as described (Nasevicius and Ekker, 2000). Zebrafish aryl hydrocarbon receptor
nuclear translocator 1 morpholino (zfarnt1-MO)
16
(5'CTCTTACCTCAGTTACAATTTATA3') overlapped the translation start site of
zfARNT1 mRNA, starting 4 bp upstream of the AUG start codon to 17 bp downstream of
the sequence. The morpholinos were diluted to 1.5 mM in 1x Danieau’s solution prior to
microinjection. A standard control morpholino (Gene Tools, Corvallis, OR)
(5'CTCTTACCTCAGTTACAATTTATA 3') was used as a control morpholino (Control-
MO). The embryos were injected at the 1–2 cell stage with approximately 1-3 nl of the
appropriate morpholino solution. Embryos were screened for fluorescence at 24 hpf to
reveal successful injection. The caudal fin of selected embryos were amputated and
exposed to TCDD or vehicle for 1 hour at 48 hpf. The morpholino injected embryos
(morphants) were raised for 3 days following amputation and the regeneration of fin
tissue was observed.
Genotyping of zfarnt2 mutants
Embryonic DNA was extracted from individual embryos in extraction buffer
(0.01 M Tris, 2 mM EDTA, 0.2% Triton-X, 0.2 mg/ml Proteinase-K) incubated at 55°C
for 2.5 h. The extract was heated at 100°C for 10 min before centrifugation and the
supernatant was used as the DNA template for PCR. The primers used were zfARNT2F1,
zfARNT2R1 and TranspoR. zfARNT2F1 and zfARNT2R1 flank the knockout viral
insertion and TranspoR lies within the transposon insert. zfARNT2F1and zfARNT2R1
were designed to distinguish zfarnt2–/– mutants from wild type (WT) and from
heterozygous (HET) larvae, while zfARNT2F1 and TranspoR were used to distinguish
WT from HET larvae. PCR was performed to amplify the appropriate sequence using
KOD Hot Start DNA polymerase and the PCR products were examined by gel
electrophoresis and ethidium bromide staining.
Whole mount immunolocalization of zfCYP1A and α-acetylated tubulin
The distribution of zfCYP1A protein in zebrafish larval fin tissue was assessed
using the monoclonal antibody, C107 (mouse anti-CYP1A, 1:500; Biosense Laboratories,
Bergen, Norway). Monoclonal antibodies generated against acetylated tubulin (mouse
anti-AT, 1:1000; Sigma, St. Louis) label most axons and major peripheral processes in
the developing embryo. On 3 dpa, TCDD exposed and control larvae were fixed
17
overnight in 4% paraformaldehyde in phosphate-buffered saline (PBS) and washed in
PBS + 0.1% Tween-20 (PBST). The larvae were permeablized with 0.005% trypsin (4°C)
in PBS on ice for 5 minutes, rinsed in PBST and postfixed in 4% paraformaldehyde.
Permeablized larvae were blocked in 10% normal goat serum (NGS) in PBS + 0.5%
Triton X-100 (PBSTx) for an hour at 22°C and incubated with the primary antibody
overnight at 4°C in 1% NGS- PBSTx. Following 4x 30 min washes in PBST, the larvae
were incubated with a secondary antibody (1:1000)(Alexa-546 conjugated goat anti
mouse; Molecular Probes, Eugene, OR) for 5 h at 22°C. The larvae were then washed 4x
for 30 min in PBST and visualized by epifluorescence microscopy.
Statistical Analysis
Each experiment comprised of 12 larvae per group. The larvae were exposed to
vehicle or chemical with 2 larvae in each well. Significant difference in the area and
length between the control and TCDD exposed animals was assessed by Students t-test
(p<0.05) using SigmaStat 2.03 software.
Results
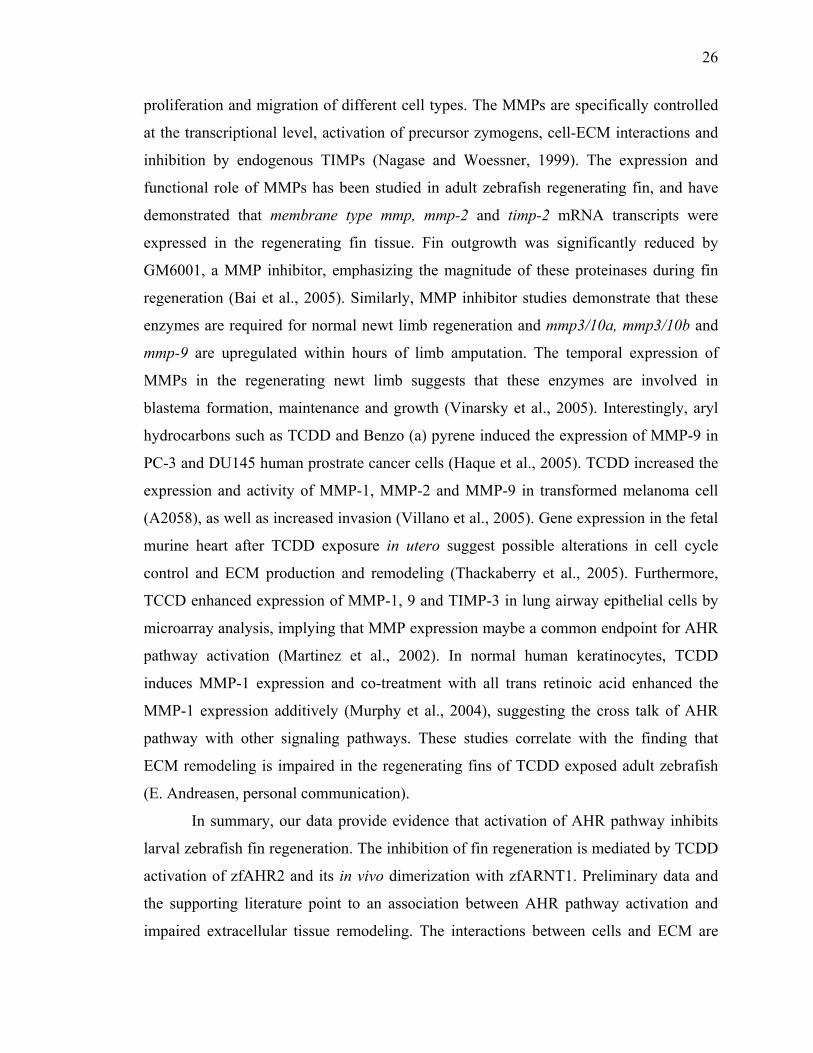
TCDD Inhibits Larval Zebrafish Caudal Fin Regeneration
Larval zebrafish caudal fin primordia have the remarkable ability to regenerate by
a mechanism similar to that observed in adult fin regeneration (Kawakami et al., 2004).
These studies were designed to determine if AHR activation would impact larval fin
regeneration similar to adult zebrafish (Zodrow and Tanguay, 2003). The caudal fin
primordia of the 48 hpf larvae were partially amputated just posterior to the notochord
(Fig. 1). A range of TCDD concentrations was used (0.01 ng to 1 ng/mL) to determine
the sublethal concentration that inhibits fin regeneration (data not shown). From these
initial dose response studies, 0.5 ng/mL of TCDD was determined as the most effective
concentration that impairs fin regeneration without causing mortality prior to 120 hpf,
and was used for all of the described studies. The amputated larvae were exposed to
18
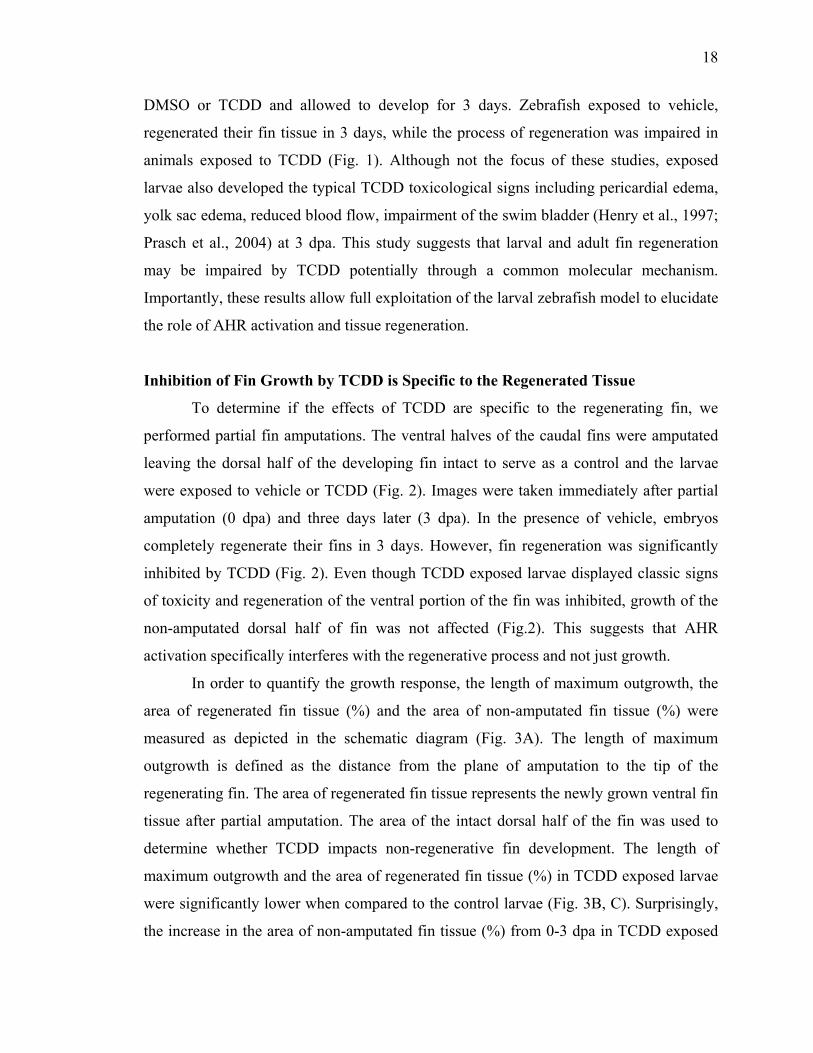
DMSO or TCDD and allowed to develop for 3 days. Zebrafish exposed to vehicle,
regenerated their fin tissue in 3 days, while the process of regeneration was impaired in
animals exposed to TCDD (Fig. 1). Although not the focus of these studies, exposed
larvae also developed the typical TCDD toxicological signs including pericardial edema,
yolk sac edema, reduced blood flow, impairment of the swim bladder (Henry et al., 1997;
Prasch et al., 2004) at 3 dpa. This study suggests that larval and adult fin regeneration
may be impaired by TCDD potentially through a common molecular mechanism.
Importantly, these results allow full exploitation of the larval zebrafish model to elucidate
the role of AHR activation and tissue regeneration.
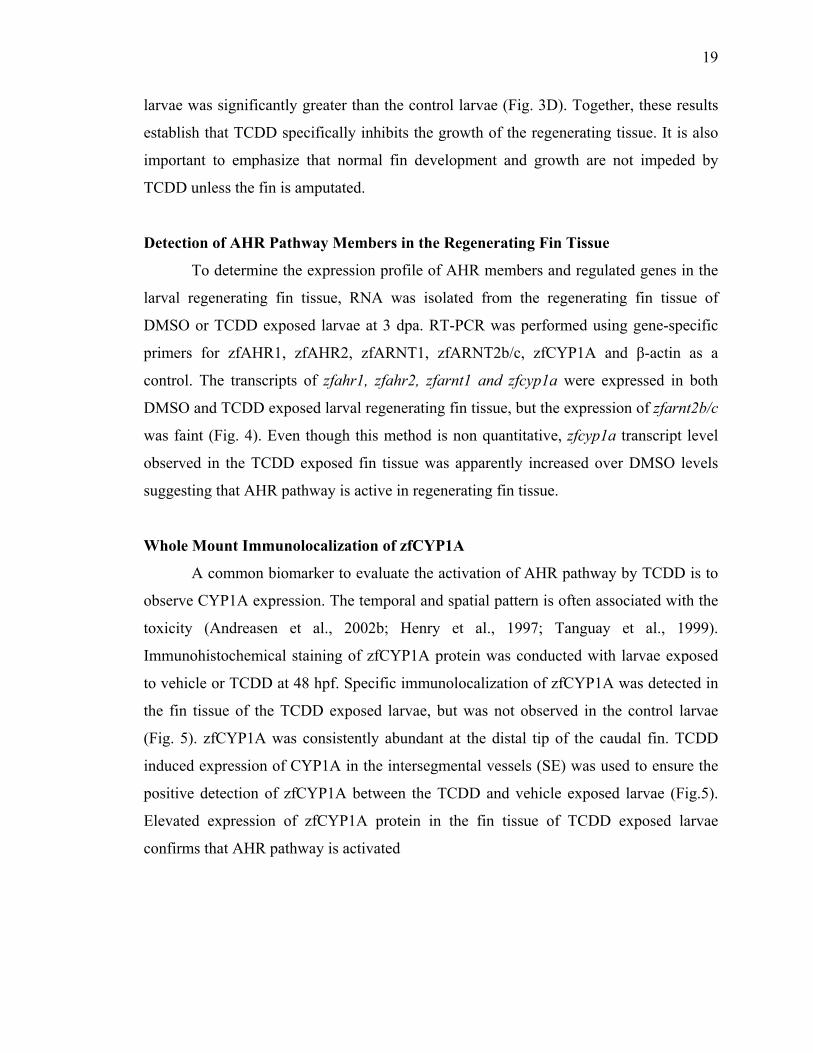
Inhibition of Fin Growth by TCDD is Specific to the Regenerated Tissue
To determine if the effects of TCDD are specific to the regenerating fin, we
performed partial fin amputations. The ventral halves of the caudal fins were amputated
leaving the dorsal half of the developing fin intact to serve as a control and the larvae
were exposed to vehicle or TCDD (Fig. 2). Images were taken immediately after partial
amputation (0 dpa) and three days later (3 dpa). In the presence of vehicle, embryos
completely regenerate their fins in 3 days. However, fin regeneration was significantly
inhibited by TCDD (Fig. 2). Even though TCDD exposed larvae displayed classic signs
of toxicity and regeneration of the ventral portion of the fin was inhibited, growth of the
non-amputated dorsal half of fin was not affected (Fig.2). This suggests that AHR
activation specifically interferes with the regenerative process and not just growth.
In order to quantify the growth response, the length of maximum outgrowth, the
area of regenerated fin tissue (%) and the area of non-amputated fin tissue (%) were
measured as depicted in the schematic diagram (Fig. 3A). The length of maximum
outgrowth is defined as the distance from the plane of amputation to the tip of the
regenerating fin. The area of regenerated fin tissue represents the newly grown ventral fin
tissue after partial amputation. The area of the intact dorsal half of the fin was used to
determine whether TCDD impacts non-regenerative fin development. The length of
maximum outgrowth and the area of regenerated fin tissue (%) in TCDD exposed larvae
were significantly lower when compared to the control larvae (Fig. 3B, C). Surprisingly,
the increase in the area of non-amputated fin tissue (%) from 0-3 dpa in TCDD exposed
19
larvae was significantly greater than the control larvae (Fig. 3D). Together, these results
establish that TCDD specifically inhibits the growth of the regenerating tissue. It is also
important to emphasize that normal fin development and growth are not impeded by
TCDD unless the fin is amputated.
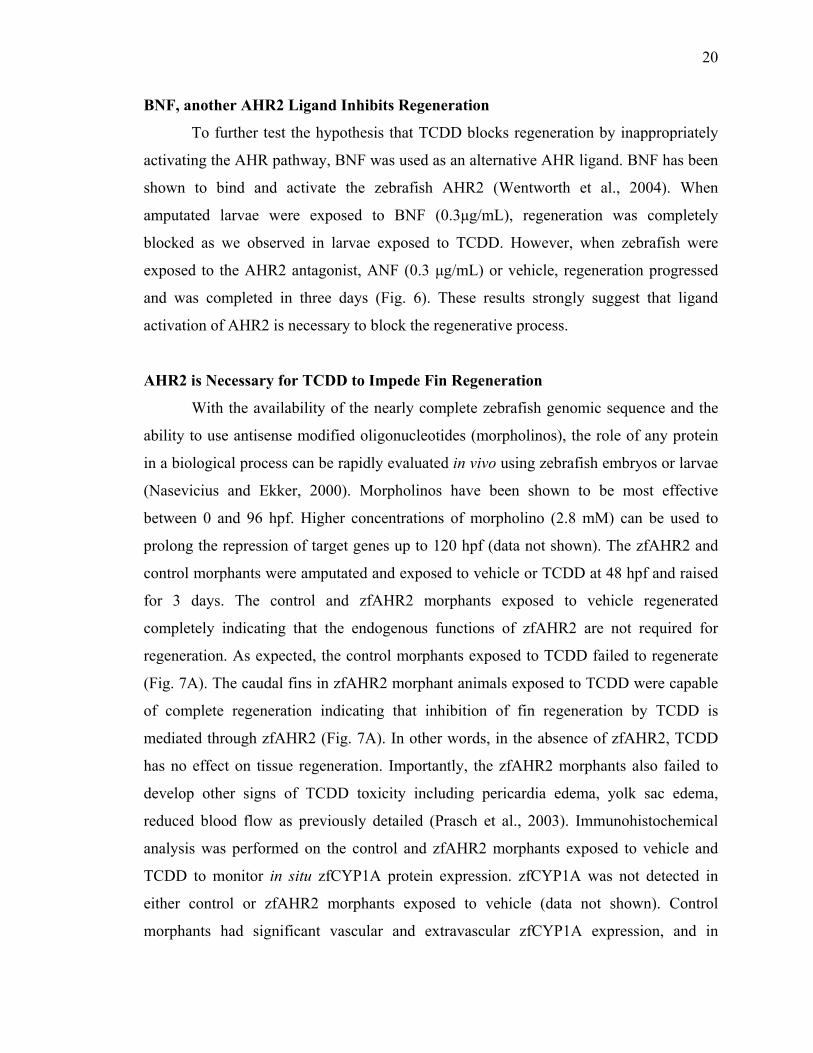
Detection of AHR Pathway Members in the Regenerating Fin Tissue
To determine the expression profile of AHR members and regulated genes in the
larval regenerating fin tissue, RNA was isolated from the regenerating fin tissue of
DMSO or TCDD exposed larvae at 3 dpa. RT-PCR was performed using gene-specific
primers for zfAHR1, zfAHR2, zfARNT1, zfARNT2b/c, zfCYP1A and β-actin as a
control. The transcripts of zfahr1, zfahr2, zfarnt1 and zfcyp1a were expressed in both
DMSO and TCDD exposed larval regenerating fin tissue, but the expression of zfarnt2b/c
was faint (Fig. 4). Even though this method is non quantitative, zfcyp1a transcript level
observed in the TCDD exposed fin tissue was apparently increased over DMSO levels
suggesting that AHR pathway is active in regenerating fin tissue.
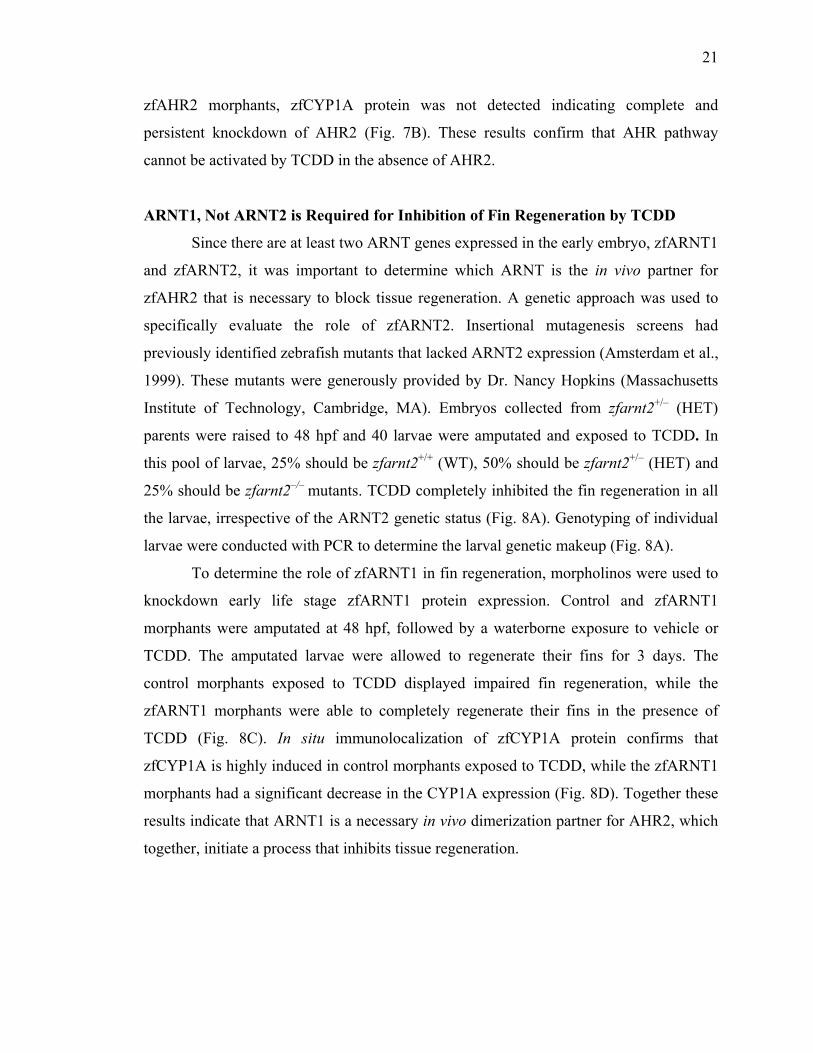
Whole Mount Immunolocalization of zfCYP1A
A common biomarker to evaluate the activation of AHR pathway by TCDD is to
observe CYP1A expression. The temporal and spatial pattern is often associated with the
toxicity (Andreasen et al., 2002b; Henry et al., 1997; Tanguay et al., 1999).
Immunohistochemical staining of zfCYP1A protein was conducted with larvae exposed
to vehicle or TCDD at 48 hpf. Specific immunolocalization of zfCYP1A was detected in
the fin tissue of the TCDD exposed larvae, but was not observed in the control larvae
(Fig. 5). zfCYP1A was consistently abundant at the distal tip of the caudal fin. TCDD
induced expression of CYP1A in the intersegmental vessels (SE) was used to ensure the
positive detection of zfCYP1A between the TCDD and vehicle exposed larvae (Fig.5).
Elevated expression of zfCYP1A protein in the fin tissue of TCDD exposed larvae
confirms that AHR pathway is activated
20
BNF, another AHR2 Ligand Inhibits Regeneration
To further test the hypothesis that TCDD blocks regeneration by inappropriately
activating the AHR pathway, BNF was used as an alternative AHR ligand. BNF has been
shown to bind and activate the zebrafish AHR2 (Wentworth et al., 2004). When
amputated larvae were exposed to BNF (0.3μg/mL), regeneration was completely
blocked as we observed in larvae exposed to TCDD. However, when zebrafish were
exposed to the AHR2 antagonist, ANF (0.3 μg/mL) or vehicle, regeneration progressed
and was completed in three days (Fig. 6). These results strongly suggest that ligand
activation of AHR2 is necessary to block the regenerative process.
AHR2 is Necessary for TCDD to Impede Fin Regeneration
With the availability of the nearly complete zebrafish genomic sequence and the
ability to use antisense modified oligonucleotides (morpholinos), the role of any protein
in a biological process can be rapidly evaluated in vivo using zebrafish embryos or larvae
(Nasevicius and Ekker, 2000). Morpholinos have been shown to be most effective
between 0 and 96 hpf. Higher concentrations of morpholino (2.8 mM) can be used to
prolong the repression of target genes up to 120 hpf (data not shown). The zfAHR2 and
control morphants were amputated and exposed to vehicle or TCDD at 48 hpf and raised
for 3 days. The control and zfAHR2 morphants exposed to vehicle regenerated
completely indicating that the endogenous functions of zfAHR2 are not required for
regeneration. As expected, the control morphants exposed to TCDD failed to regenerate
(Fig. 7A). The caudal fins in zfAHR2 morphant animals exposed to TCDD were capable
of complete regeneration indicating that inhibition of fin regeneration by TCDD is
mediated through zfAHR2 (Fig. 7A). In other words, in the absence of zfAHR2, TCDD
has no effect on tissue regeneration. Importantly, the zfAHR2 morphants also failed to
develop other signs of TCDD toxicity including pericardia edema, yolk sac edema,
reduced blood flow as previously detailed (Prasch et al., 2003). Immunohistochemical
analysis was performed on the control and zfAHR2 morphants exposed to vehicle and
TCDD to monitor in situ zfCYP1A protein expression. zfCYP1A was not detected in
either control or zfAHR2 morphants exposed to vehicle (data not shown). Control
morphants had significant vascular and extravascular zfCYP1A expression, and in
21
zfAHR2 morphants, zfCYP1A protein was not detected indicating complete and
persistent knockdown of AHR2 (Fig. 7B). These results confirm that AHR pathway
cannot be activated by TCDD in the absence of AHR2.
ARNT1, Not ARNT2 is Required for Inhibition of Fin Regeneration by TCDD
Since there are at least two ARNT genes expressed in the early embryo, zfARNT1
and zfARNT2, it was important to determine which ARNT is the in vivo partner for
zfAHR2 that is necessary to block tissue regeneration. A genetic approach was used to
specifically evaluate the role of zfARNT2. Insertional mutagenesis screens had
previously identified zebrafish mutants that lacked ARNT2 expression (Amsterdam et al.,
1999). These mutants were generously provided by Dr. Nancy Hopkins (Massachusetts
Institute of Technology, Cambridge, MA). Embryos collected from zfarnt2+/– (HET)
parents were raised to 48 hpf and 40 larvae were amputated and exposed to TCDD. In
this pool of larvae, 25% should be zfarnt2+/+ (WT), 50% should be zfarnt2+/– (HET) and
25% should be zfarnt2–/– mutants. TCDD completely inhibited the fin regeneration in all
the larvae, irrespective of the ARNT2 genetic status (Fig. 8A). Genotyping of individual
larvae were conducted with PCR to determine the larval genetic makeup (Fig. 8A).
To determine the role of zfARNT1 in fin regeneration, morpholinos were used to
knockdown early life stage zfARNT1 protein expression. Control and zfARNT1
morphants were amputated at 48 hpf, followed by a waterborne exposure to vehicle or
TCDD. The amputated larvae were allowed to regenerate their fins for 3 days. The
control morphants exposed to TCDD displayed impaired fin regeneration, while the
zfARNT1 morphants were able to completely regenerate their fins in the presence of
TCDD (Fig. 8C). In situ immunolocalization of zfCYP1A protein confirms that
zfCYP1A is highly induced in control morphants exposed to TCDD, while the zfARNT1
morphants had a significant decrease in the CYP1A expression (Fig. 8D). Together these
results indicate that ARNT1 is a necessary in vivo dimerization partner for AHR2, which
together, initiate a process that inhibits tissue regeneration.
22
Morphometrically, TCDD and FGFR1-mediated inhibition of fin regeneration are different
It is clear that AHR activation impairs or interferes with signaling pathways
required for tissue regeneration, but these downstream targets remain unknown. To begin
to understand the underlying cellular responses, the effects of TCDD were compared to
the effects of another chemical known to impact regeneration. Inhibition of fibroblast
growth factor receptor 1 (FGFR1) by a lipophilic drug (SU5402) has been shown to
inhibit both adult and larval fin regeneration (Kawakami et al., 2004; Poss et al., 2000b).
At the gross level, SU5402 inhibited fin regeneration, but to a lesser extent than TCDD
(Fig. 9A, B). Importantly, over the course of the regeneration period (3 days), SU5402
had a significant reduction in the overall embryonic and larval growth, whereas TCDD
had no measurable effect on overall growth during this developmental window (data not
shown). During regeneration, neuronal axons and their peripheral processes grow and
extend into the newly formed tissue (Tanguay, unpublished observation). The growth and
pathfinding of these structures can be used to assess tissue reorganization. In situ
immunolocalization using an α-acetylated tubulin antibody is a convenient way to label
the axons and their peripheral processes. In the control larvae, the peripheral processes
branch off the axonal trunks and fan out into the regenerate. After 3 days, a complex, but
ordered network of branches is formed in the new tissue (Fig. 9C). In the TCDD exposed
animals, the peripheral processes consistently extended toward the amputation plane, and
then made lateral turns, nearly perpendicular to the plane of amputation. Importantly, the
branches continued to extend in the presence of TCDD, but the pathfinding is altered.
These observations are consistent with the concept that that TCDD impairs the ability of
the neuronal processes to migrate directly into the tissue (Fig. 9C, D). Further illustration
of this point is revealed when only the ventral half of the fin is amputated (Fig. 9E).
TCDD consistently lead to an altered neuronal growth pattern where the new processes in
the partially amputated fin continued to grow, but made lateral turns in the absence of
sufficient new tissue to accommodate their length. These results suggest that, in TCDD
exposed larvae, the peripheral processes in the regenerating fin maybe incapable of
growing straight due to a physical barrier or improper growth factor signaling. The
neuronal response in SU5402 exposed larvae was noticeably different. The pathfinding of
the neuronal branches was not affected. The processes reached the end of the new tissue
23
and had a branching pattern indistinguishable from that in control animals (Fig.9E).
Taken together, these results suggest that the inhibition of regeneration mediated by
TCDD and FGFR1 inhibitor is different.
Discussion
Regeneration of tissue is a well orchestrated process where the injured or lost
structure is completely replaced. In both adult and larval zebrafish, an epithelial wound
covering is formed within 12hpa and this response does not involve cell proliferation
(Nechiporuk and Keating, 2002; Santamaria et al., 1996). Wound closure is followed by
the development of blastema and the wound epidermis is hypothesized to be a source of
growth factors that stimulate and regulate the formation of the blastema. In adult
zebrafish, fibroblast growth factors (FGFs) present in the wound epidermis interacts with
the mesenchymal FGFR1. FFGR1 inhibitor studies suggest that active FGF signaling is
required for the formation of blastema and regenerative outgrowth (Poss et al., 2000b).
The differential expression of mps1, shh, lef1, wnt3a, wnt5, RAR-γ and msx homeobox
genes illustrates the complexity of signaling pathways during the regeneration process
(Akimenko et al., 1995; Poss et al., 2000a; Poss et al., 2000b; White et al., 1994). During
regenerative outgrowth, cell proliferation propagates from distal zone to the proximal
zone of fin primordia with intense proliferation occurring in the proximal region during
the late phase of repair (Kawakami et al., 2004; Nechiporuk and Keating, 2002). In
larvae, fin regeneration is completed in 3-5 days by controlled cellular proliferation and
migration. It has been established that TCDD impairs the outgrowth phase of
regeneration (Zodrow and Tanguay, 2003). Although it had been presumed that the block
in regeneration is mediated by TCDD binding and activation of AHR signaling pathway,
it had not been experimentally demonstrated.
In mammals, studies have demonstrated that Ahr null mice develop hepatic
defects and have reduced liver size implicating a role of AHR in normal liver growth and
development (Lahvis et al., 2000 ; Schmidt and Bradfield, 1996). The underlying deficit
24
appears to be a congenital vascular defect, failure of ductus venosus closure (Walisser et
al., 2004). In addition to this endogenous developmental role, functional AHR is required
to mediate TCDD toxicity (Gonzalez and Fernandez-Salguero, 1998; Mimura et al.,
1999). Both zfAHR1 and zfAHR2 were present in the regenerating fin of vehicle and
TCDD exposed larvae (Fig. 4). Previous studies have reported that zfAHR1 does not
mediate TCDD toxicity as it does not bind to AHR ligands and has a very limited tissue
distribution (Andreasen et al., 2002a). Knockdown of zfAHR2 by antisense morpholinos
revealed that zfAHR2 mediates the endpoints of TCDD dependent developmental
toxicity (Prasch et al., 2003). zfAHR2 morphants regenerated the fin tissue completely in
the presence of TCDD confirming that AHR2 is necessary for TCDD to block fin
regeneration. Recently, a third AHR gene was identified in zebrafish which is located
adjacent to the AHR2 gene in the zebrafish genome. This duplicated gene was designated
as AHR1b. In vitro studies indicate that AHR1b has AHR-like properties (Karchner et al.,
2005). The AHR2 morpholino studies demonstrate that AHR1b cannot play a role in
mediating the well-studied in vivo responses to TCDD. The endogenous role for AHR1b
remains to be identified.
In mammals, ARNT1 is the functional dimerization partner for AHR mediating
many endpoints of TCDD toxicity (Schmidt and Bradfield, 1996). arnt2 knockout mice
die within 24h of birth and have impaired hypothalamic development, confirming its
function during normal development (Hosoya et al., 2001). In zebrafish, four splice
variants of zfARNT2 have been characterized and zfARNT2b has been demonstrated to
be transcriptionally active with zfAHR2 in vitro (Tanguay et al., 2000). Unexpectedly,
antisense repression of ARNT2 did not impact embryonic responses to TCDD. Similar
results were obtained in zebrafish arnt2 mutants. Collectively, these results confirm that
zfARNT2 is not the in vivo partner of zfAHR2 mediating the developmental toxicity by
TCDD (Prasch et al., 2004). zfARNT1 was recently characterized in zebrafish (Prasch et
al., In Press). In regenerating larval fin, zfARNT1 was highly abundant in both vehicle
and TCDD exposed larvae, while the expression of zfARNT2 was low. Fin regeneration
in ARNT2-/- was impaired when exposed to TCDD, while the zfARNT1 morphants
completely regenerated, confirming that zfANRT1 is the heterodimer of zfAHR2.
Since TCDD inhibits adult zebrafish fin regeneration when dosed on either 0, 1, 2,
25
3, or 4 dpa, this suggests that TCDD interferes with multiple stages of regeneration
(Zodrow and Tanguay, 2003). Similar results were found in larvae. When larvae were
exposed to TCDD at 1 dpa, fin regeneration was also impaired (data not shown).
Importantly, since wound healing and blastema formation occur in the first day,
regenerative outgrowth may be the TCDD target.
Pharmacologic inhibition of FGFR1 inhibits blastema formation as well as
outgrowth indicating that FGF signaling is required during fin regeneration (Kawakami et
al., 2004; Poss et al., 2000b). Although FGFR1 inhibitor effectively reduced regenerative
outgrowth, overall embryonic growth was also affected. Both FGFR1 inhibitor and
TCDD impaired fin regeneration, but the tissue response to these chemicals was different.
Using neuronal outgrowth as a marker, TCDD led to a significant disorganization of
peripheral processes. Since matrix degradation and turnover are important in wound
healing, tissue remodeling, tissue repair and inflammation, one possibility is that the
extracellular matrix (ECM) metabolism is affected by TCDD. Matrix metalloproteinases
(MMPs) are considered to be primarily responsible for the turnover of ECM. These
proteolytic enzymes play a major role during development and morphogenesis. Improper
regulation of these proteinases may result in pathologies such as arthritis, cancer,
atherosclerosis, aneurysms, tissue ulcers and fibrosis (Visse and Nagase, 2003). It has
also been reported that, after CNS injury, the optic nerve astrocytes are stimulated by
regenerating axons by secreting active MMP and down regulating tissue inhibitors of
metalloproteinases (TIMPs), resulting in the degradation of scar tissue creating a
permissive growth environment (Ahmed et al., 2005). Tenascin-R, a glycoprotein
deposited into the ECM acts as a repellant guidance molecule in boundaries during
normal growth and regeneration of optical axons (Becker et al., 2004), clearly
demonstrating that ECM components play critical roles in axonal guidance. We therefore
propose that if matrix remodeling is impaired by TCDD, the neuronal growth cone may
be unable to traverse through the matrix, resulting in abnormal pathfinding.
ECM is a dynamic environment that plays a crucial role in regulating cellular
functions during normal and pathological remodeling processes such as embryonic
development, tissue repair, inflammation, tumor invasion, and metastasis. ECM
macromolecules are critical for creating a conducive cellular milieu for proper
26
proliferation and migration of different cell types. The MMPs are specifically controlled
at the transcriptional level, activation of precursor zymogens, cell-ECM interactions and
inhibition by endogenous TIMPs (Nagase and Woessner, 1999). The expression and
functional role of MMPs has been studied in adult zebrafish regenerating fin, and have
demonstrated that membrane type mmp, mmp-2 and timp-2 mRNA transcripts were
expressed in the regenerating fin tissue. Fin outgrowth was significantly reduced by
GM6001, a MMP inhibitor, emphasizing the magnitude of these proteinases during fin
regeneration (Bai et al., 2005). Similarly, MMP inhibitor studies demonstrate that these
enzymes are required for normal newt limb regeneration and mmp3/10a, mmp3/10b and
mmp-9 are upregulated within hours of limb amputation. The temporal expression of
MMPs in the regenerating newt limb suggests that these enzymes are involved in
blastema formation, maintenance and growth (Vinarsky et al., 2005). Interestingly, aryl
hydrocarbons such as TCDD and Benzo (a) pyrene induced the expression of MMP-9 in
PC-3 and DU145 human prostrate cancer cells (Haque et al., 2005). TCDD increased the
expression and activity of MMP-1, MMP-2 and MMP-9 in transformed melanoma cell
(A2058), as well as increased invasion (Villano et al., 2005). Gene expression in the fetal
murine heart after TCDD exposure in utero suggest possible alterations in cell cycle
control and ECM production and remodeling (Thackaberry et al., 2005). Furthermore,
TCCD enhanced expression of MMP-1, 9 and TIMP-3 in lung airway epithelial cells by
microarray analysis, implying that MMP expression maybe a common endpoint for AHR
pathway activation (Martinez et al., 2002). In normal human keratinocytes, TCDD
induces MMP-1 expression and co-treatment with all trans retinoic acid enhanced the
MMP-1 expression additively (Murphy et al., 2004), suggesting the cross talk of AHR
pathway with other signaling pathways. These studies correlate with the finding that
ECM remodeling is impaired in the regenerating fins of TCDD exposed adult zebrafish
(E. Andreasen, personal communication).
In summary, our data provide evidence that activation of AHR pathway inhibits
larval zebrafish fin regeneration. The inhibition of fin regeneration is mediated by TCDD
activation of zfAHR2 and its in vivo dimerization with zfARNT1. Preliminary data and
the supporting literature point to an association between AHR pathway activation and
impaired extracellular tissue remodeling. The interactions between cells and ECM are

27
tightly controlled by membrane proteins, proteolytic enzymes, cytokines and growth
factors during numerous physiological processes as well as during regeneration.
Inappropriate expression or activity of any of the factors can mediate a variety of
pathologies such as tumor metastasis, cardiovascular disease or toxicity. The larval fin
regeneration model presented herein can be exploited to unravel the cross talk between
AHR activated and other critical signaling pathways.
28
References
Ahmed Z, Dent RG, Leadbeater WE, Smith C, Berry M and Logan A (2005) Matrix metalloproteases: degradation of the inhibitory environment of the transected optic nerve and the scar by regenerating axons. Mol Cell Neurosci 28:64-78.
Akimenko MA, Johnson SL, Westerfield M and Ekker M (1995) Differential induction of four msx homeobox genes during fin development and regeneration in zebrafish. Development 121:347-57.
Amsterdam A, Burgess S, Golling G, Chen W, Sun Z, Townsend K, Farrington S, Haldi M and Hopkins N (1999) A large-scale insertional mutagenesis screen in zebrafish. Genes Dev 13:2713-2724.
Andreasen EA, Hahn ME, Heideman W, Peterson RE and Tanguay RL (2002a) The zebrafish (Danio rerio) aryl hydrocarbon receptor type 1 (zfAHR1) is a novel vertebrate receptor. Mol Pharmacol 62:234-249.
Andreasen EA, Spitsbergen JM, Tanguay RL, Stegeman JJ, Heideman W and Peterson RE (2002b) Tissue-specific expression of AHR2, ARNT2, and CYP1A in zebrafish embryos and larvae: effects of developmental stage and 2,3,7,8-tetrachlorodibenzo-p-dioxin exposure. Tox Sci 68:403-419.
Bai S, Thummel R, Godwin AR, Nagase H, Itoh Y, Li L, Evans R, McDermott J, Seiki M and Sarras MP, Jr. (2005) Matrix metalloproteinase expression and function during fin regeneration in zebrafish: analysis of MT1-MMP, MMP2 and TIMP2. Matrix Biol 24:247-60.
Becker CG, Schweitzer J, Feldner J, Schachner M and Becker T (2004) Tenascin-R as a repellent guidance molecule for newly growing and regenerating optic axons in adult zebrafish. Mol Cell Neurosci 26:376-89.
Geraudie J, Monnot MJ, Brulfert A and Ferretti P (1995) Caudal fin regeneration in wild type and long-fin mutant zebrafish is affected by retinoic acid. Int J Dev Biol 39:373-81.
Gonzalez FJ and Fernandez-Salguero P (1998) The aryl hydrocarbon receptor: studies using the AHR-null mice. Drug Metab Dispos 26:1194-8.
Hahn ME, Karchner SI, Shapiro MA and Perera SA (1997) Molecular evolution of two vertebrate aryl hydrocarbon (dioxin) receptors (AHR1 and AHR2) and the PAS family. Proc Natl Acad Sci U S A 94:13743-8.
Haque M, Francis J and Sehgal I (2005) Aryl hydrocarbon exposure induces expression of MMP-9 in human prostate cancer cell lines. Cancer Lett 225:159-66.
Henry EC, Kent TA and Gasiewicz TA (1997) DNA binding and transcriptional enhancement by purified TCDD.Ah receptor complex. Arch Biochem Biophys 339:305-14.
Hosoya T, Oda Y, Takahashi S, Morita M, Kawauchi S, Ema M, Yamamoto M and Fujii-Kuriyama Y (2001) Defective development of secretory neurones in the hypothalamus of Arnt2-knockout mice. Genes Cells 6:361-74.
Karchner SI, Franks DG and Hahn ME (2005) AHR1B, a new functional aryl hydrocarbon receptor in zebrafish: tandem arrangement of ahr1b and ahr2 genes. Biochem. J.

29
Kawakami A, Fukazawa T and Takeda H (2004) Early fin primordia of zebrafish larvae regenerate by a similar growth control mechanism with adult regeneration. Dev Dyn 231:693-9.
Lahvis GP, Lindell SL, Thomas RS, McCuskey RS, Murphy C, Glover E, Bentz M, Southard J and Bradfield CA (2000) Portosystemic shunting and persistent fetal vascular structures in aryl hydrocarbon receptor-deficient mice. Proc Natl Acad Sci U S A 97:10442-7.
Martinez JM, Afshari CA, Bushel PR, Masuda A, Takahashi T and Walker NJ (2002) Differential toxicogenomic responses to 2,3,7,8-tetrachlorodibenzo-p-dioxin in malignant and nonmalignant human airway epithelial cells. Toxicol Sci 69:409-23.
Mimura J, Ema M, Sogawa K and Fujii-Kuriyama Y (1999) Identification of a novel mechanism of regulation of Ah (dioxin) receptor function. Genes Dev 13:20-5.
Murphy KA, Villano CM, Dorn R and White LA (2004) Interaction between the aryl hydrocarbon receptor and retinoic acid pathways increases matrix metalloproteinase-1 expression in keratinocytes. J Biol Chem 279:25284-93.
Nagase H and Woessner JF, Jr. (1999) Matrix metalloproteinases. J Biol Chem 274:21491-4.
Nasevicius A and Ekker SC (2000) Effective targeted gene 'knockdown' in zebrafish. Nat Genet 26:216-20.
Nechiporuk A and Keating MT (2002) A proliferation gradient between proximal and msxb-expressing distal blastema directs zebrafish fin regeneration. Development 129:2607-17.
Poss KD, Shen J and Keating MT (2000a) Induction of lef1 during zebrafish fin regeneration. Dev Dyn 219:282-6.
Poss KD, Shen J, Nechiporuk A, McMahon G, Thisse B, Thisse C and Keating MT (2000b) Roles for Fgf signaling during zebrafish fin regeneration. Dev Biol 222:347-58.
Prasch AL, Heideman W and Peterson RE (2004) ARNT2 is not required for TCDD developmental toxicity in zebrafish. Toxicol Sci 82:250-8.
Prasch AL, Tanguay RL, Mehta V, Heideman W and Peterson RE (In Press) Identification of zebrafish ARNT1 homologs: TCDD toxicity in the developing zebrafish requires ARNT1. Mol Pharmacol.
Prasch AL, Teraoka H, Carney SA, Dong W, Hiraga T, Stegeman JJ, Heideman W and Peterson RE (2003) Aryl Hydrocarbon Receptor 2 Mediates 2,3,7,8-Tetrachlorodibenzo-p-dioxin Developmental Toxicity in Zebrafish. Toxicol Sci 76:138-50.
Santamaria JA, Mari-Beffa M, Santos-Ruiz L and Becerra J (1996) Incorporation of bromodeoxyuridine in regenerating fin tissue of the goldfish Carassius auratus. J Exp Zool 275:300-7.
Schmidt JV and Bradfield CA (1996) Ah receptor signaling pathways. Ann Rev Cell Dev Biol 12:55-89.
Tanguay RL, Abnet CC, Heideman W and Peterson RE (1999) Cloning and characterization of the zebrafish (Danio rerio) aryl hydrocarbon receptor. Biochimica Biophys Acta 1444:35-48.
30
Tanguay RL, Andreasen EA, Heideman W and Peterson RE (2000) Identification and expression of alternatively spliced aryl hydrocarbon nuclear translocator2 (ARNT2) cDNAs from zebrafish with distinct functions. Biochimica et Biophysica Acta 1494:117-128.
Thackaberry EA, Jiang Z, Johnson CD, Ramos KS and Walker MK (2005) Toxicogenomic Profile of 2,3,7,8-Tetrachlorodibenzo-p-dioxin in the Murine Fetal Heart: Modulation of Cell Cycle and Extracellular Matrix Genes. Toxicol Sci.
Villano CM, Murphy KA, Akintobi A and White LA (2005) 2,3,7,8-tetrachlorodibenzo-p-dioxin (TCDD) induces matrix metalloproteinase (MMP) expression and invasion in A2058 melanoma cells. Toxicol Appl Pharmacol.
Vinarsky V, Atkinson DL, Stevenson TJ, Keating MT and Odelberg SJ (2005) Normal newt limb regeneration requires matrix metalloproteinase function. Dev Biol 279:86-98.
Visse R and Nagase H (2003) Matrix metalloproteinases and tissue inhibitors of metalloproteinases: structure, function, and biochemistry. Circ Res 92:827-39.
Walisser JA, Bunger MK, Glover E and Bradfield CA (2004) Gestational exposure of Ahr and Arnt hypomorphs to dioxin rescues vascular development. Proc Natl Acad Sci U S A 101:16677-82.
Wang WW, J. Hsu, H. Kong, Z. Hu,C. (2000) Overexpression of a zebrafish ARNT2-like factor represses CYP1A transcription in ZLE cells. Marine Biotechnology 2:376-386.
Wentworth JN, Buzzeo R and Pollenz RS (2004) Functional characterization of aryl hydrocarbon receptor (zfAHR2) localization and degradation in zebrafish (Danio rerio). Biochem Pharmacol 67:1363-72.
White JA, Boffa MB, Jones B and Petkovich M (1994) A zebrafish retinoic acid receptor expressed in the regenerating caudal fin. Development 120:1861-72.
Zodrow JM and Tanguay RL (2003) 2,3,7,8-Tetrachlorodibenzo-p-dioxin inhibits fin regeneration in zebrafish. Toxicological Sciences 76:151-161.

31
Acknowledgments
We thank Dr. Nancy Hopkins for the arnt2 mutants and Fred Tilton, Dr. Stacey Harper
and Dr. Mark Reimers for helpful discussions on the manuscript. This work was
supported in part by NIEHS grants ES10820, ES00210, and ES0385
32
Control
TCDD
0 dpa 3 dpa
Figure 2-1. TCDD inhibits the regeneration of zebrafish fin primordia. The caudal fin primordia of zebrafish larvae (48 hpf) were surgically ablated just posterior to the notochord. Following amputation, larvae were exposed to TCDD (0.5 ng/mL) or vehicle control (DMSO). The fin regeneration images were captured immediately after amputation (0 dpa) on 3 dpa. The dotted line indicates the plane of amputation at 0 dpa.
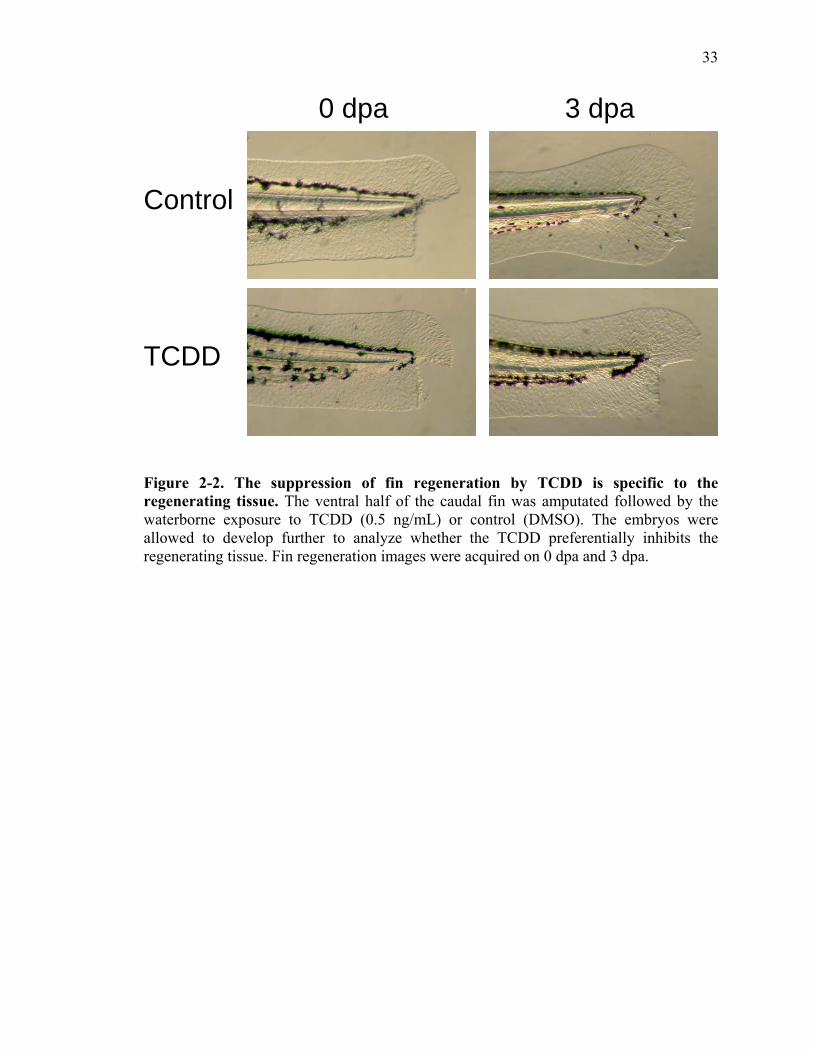
33
Control
TCDD
0 dpa 3 dpa
Figure 2-2. The suppression of fin regeneration by TCDD is specific to the regenerating tissue. The ventral half of the caudal fin was amputated followed by the waterborne exposure to TCDD (0.5 ng/mL) or control (DMSO). The embryos were allowed to develop further to analyze whether the TCDD preferentially inhibits the regenerating tissue. Fin regeneration images were acquired on 0 dpa and 3 dpa.
34
Figure 2-3. TCDD preferentially affects the regenerating fin. (A) The length of maximum outgrowth, the area of regenerated fin tissue and the area of non-amputated fin tissue at 0 and 3 dpa were measured in vehicle and TCDD exposed embryos as described in the schematic diagram. (B) The length of maximum ventral caudal fin outgrowth (1 micron = 1.54 pixels) and (C) the area of regenerated fin tissue (%) in control larvae were significantly greater than the TCDD exposed embryos (P<0.001). (D) The measurement of increase in the area of non-amputated tissue from 0-3 dpa will delineate whether TCDD affects the normal growth of fin tissue. The area of the dorsal half of the caudal fin in TCDD exposed larvae was greater than control larvae (P<0.004). The dotted line indicates the plane of amputation. The respective values represent the mean + SEM (t-test, n =11). All three parameters were measured using the Image Pro-Plus software (Media Cybernetics, Silver Spring, MD).
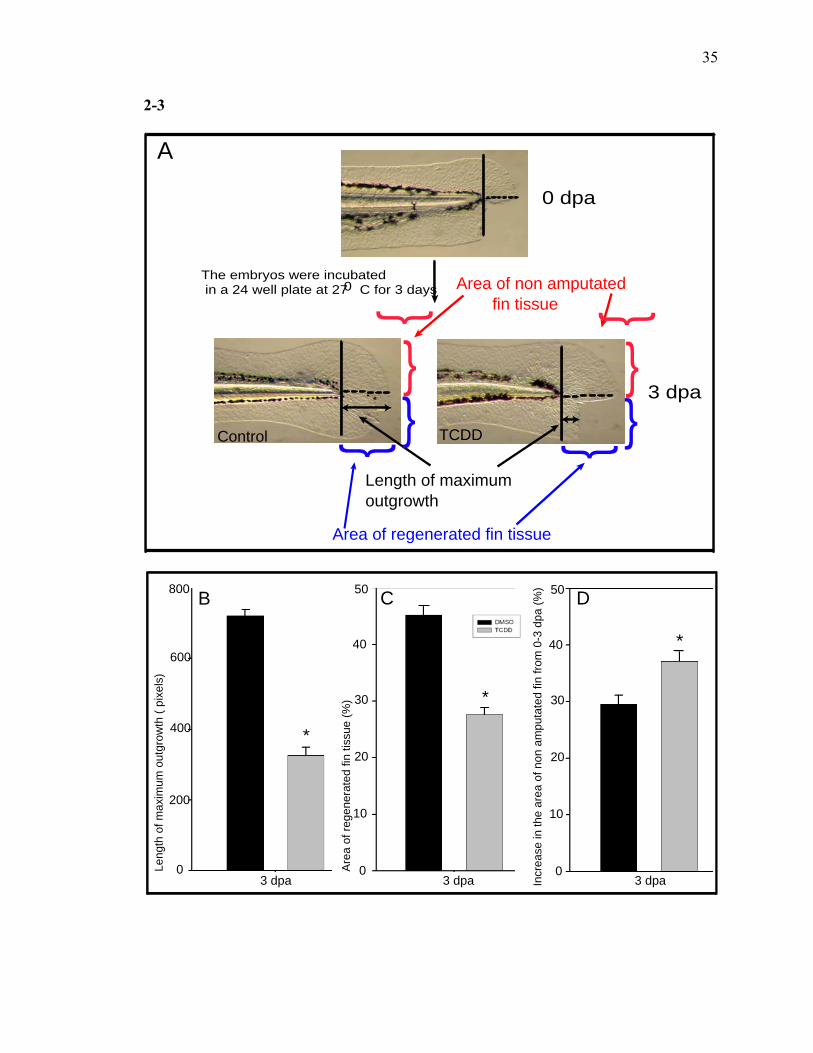
35
2-3
The embryos were incubated in a 24 well plate at 27 C for 3 days 0
Control TCDD
{{{
{
0 dpa
3 dpa
A
Area of non amputatedfin tissue
Length of maximumoutgrowth
Area of regenerated fin tissue
{{{
{
Leng
th o
f max
imum
out
grow
th (
pixe
ls)
Are
a of
rege
nera
ted
fin ti
ssue
(%)
Incr
ease
in th
e ar
ea o
f non
am
puta
ted
fin fr
om 0
-3 d
pa (%
)
0
10
20
30
40
50
0
10
20
30
40
50
0
200
400
600
800 B C D
*
*
*
3 dpa 3 dpa 3 dpa
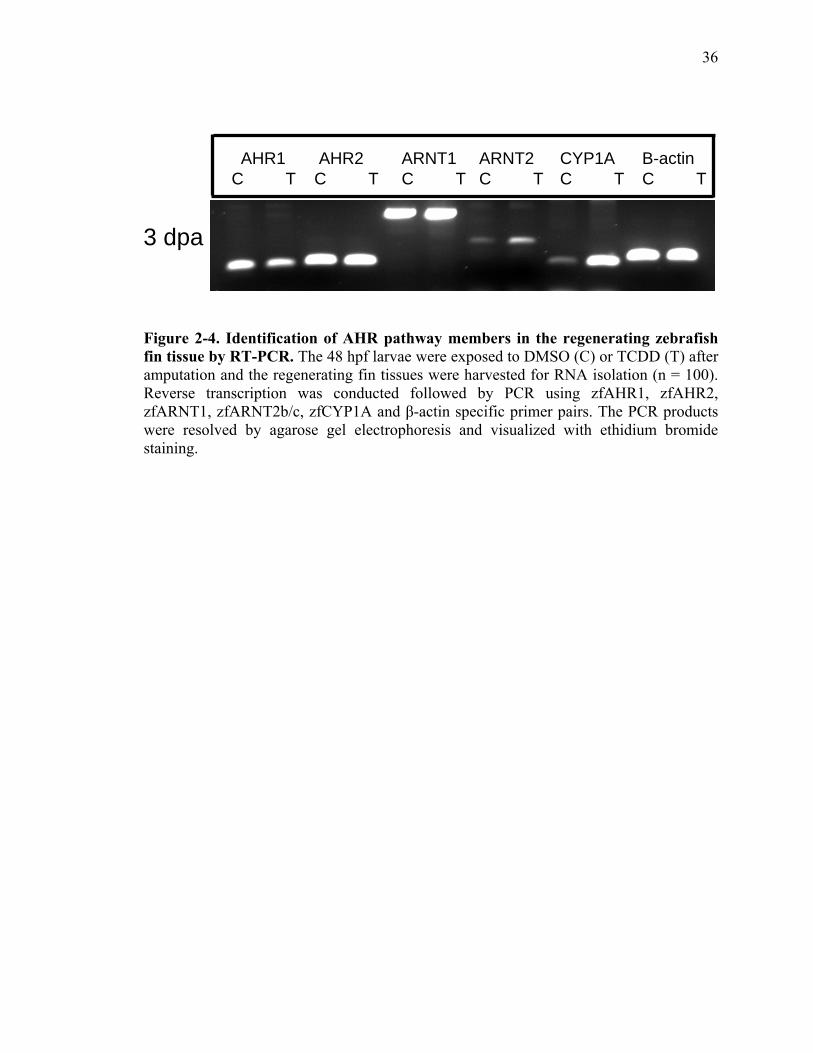
36
3 dpa
AHR1 C T
CYP1AC T
ARNT2 C T
AHR2 C T
ARNT1 C T
B-actinC T
Figure 2-4. Identification of AHR pathway members in the regenerating zebrafish fin tissue by RT-PCR. The 48 hpf larvae were exposed to DMSO (C) or TCDD (T) after amputation and the regenerating fin tissues were harvested for RNA isolation (n = 100). Reverse transcription was conducted followed by PCR using zfAHR1, zfAHR2, zfARNT1, zfARNT2b/c, zfCYP1A and β-actin specific primer pairs. The PCR products were resolved by agarose gel electrophoresis and visualized with ethidium bromide staining.
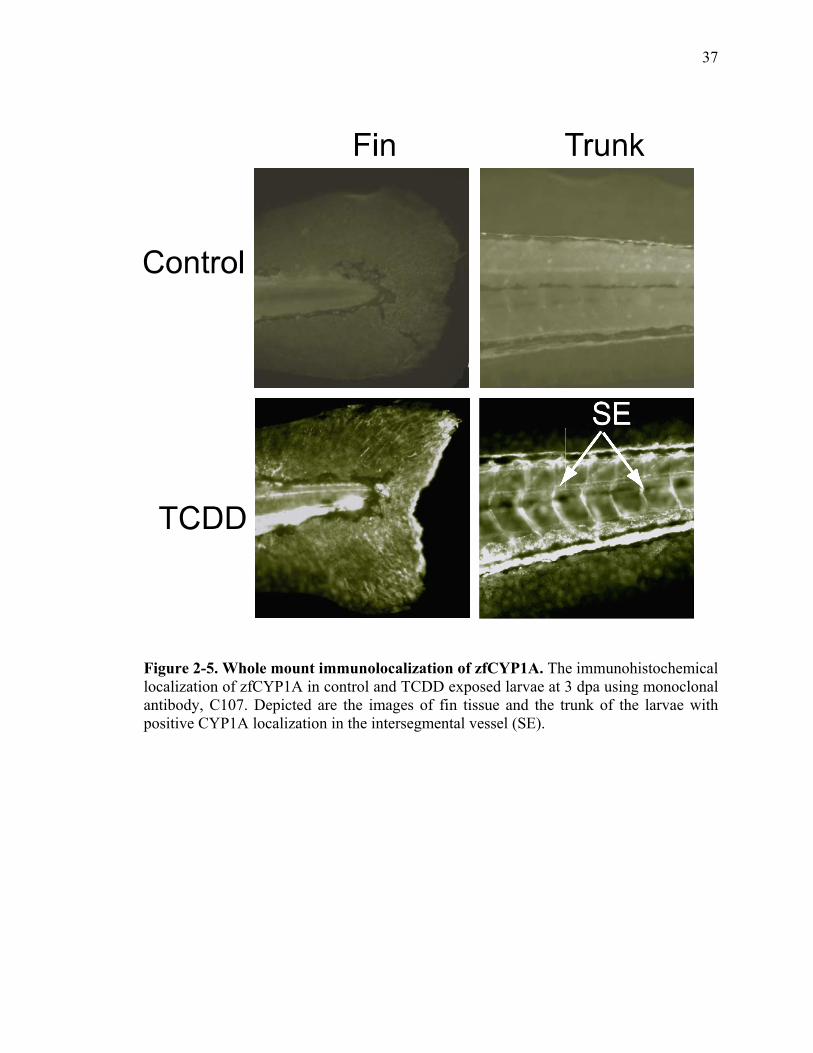
37
Figure 2-5. Whole mount immunolocalization of zfCYP1A. The immunohistochemical localization of zfCYP1A in control and TCDD exposed larvae at 3 dpa using monoclonal antibody, C107. Depicted are the images of fin tissue and the trunk of the larvae with positive CYP1A localization in the intersegmental vessel (SE).
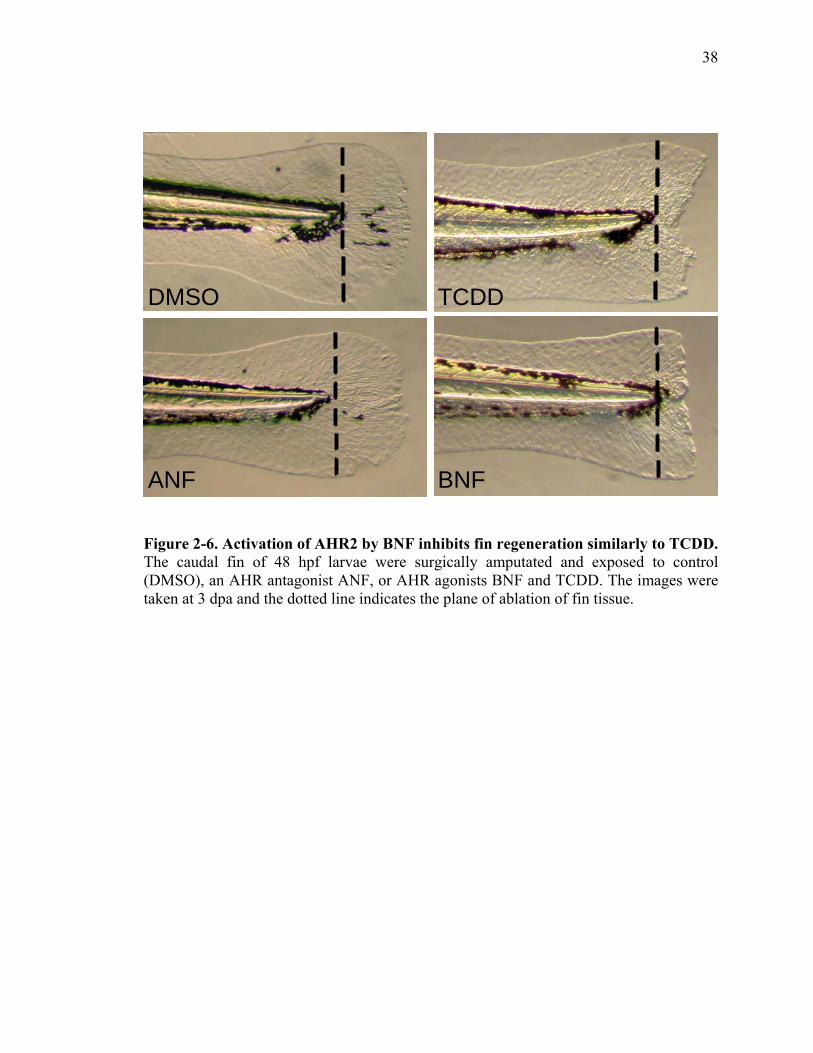
38
DMSO
ANF BNF
TCDD
Figure 2-6. Activation of AHR2 by BNF inhibits fin regeneration similarly to TCDD. The caudal fin of 48 hpf larvae were surgically amputated and exposed to control (DMSO), an AHR antagonist ANF, or AHR agonists BNF and TCDD. The images were taken at 3 dpa and the dotted line indicates the plane of ablation of fin tissue.
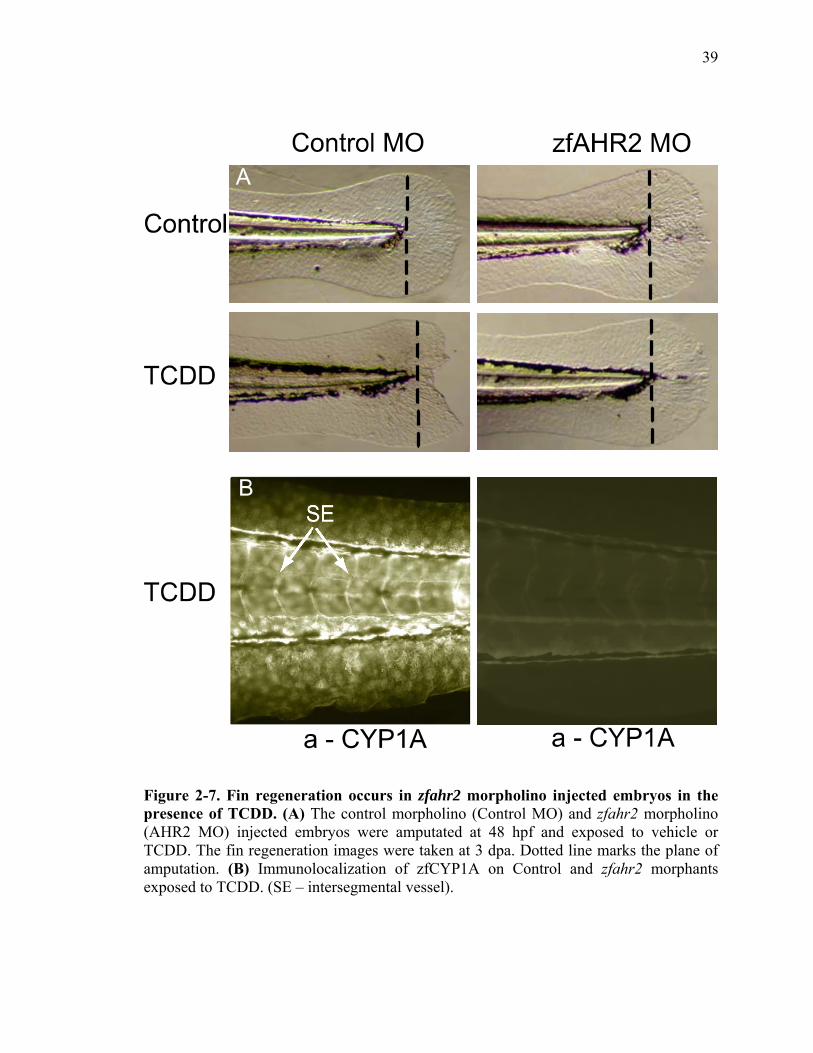
39
Figure 2-7. Fin regeneration occurs in zfahr2 morpholino injected embryos in the presence of TCDD. (A) The control morpholino (Control MO) and zfahr2 morpholino (AHR2 MO) injected embryos were amputated at 48 hpf and exposed to vehicle or TCDD. The fin regeneration images were taken at 3 dpa. Dotted line marks the plane of amputation. (B) Immunolocalization of zfCYP1A on Control and zfahr2 morphants exposed to TCDD. (SE – intersegmental vessel).
40
Figure 2-8. Role of zfARNT members in the inhibition of fin regeneration by TCDD. (A) Heterozygous (HET, zfarnt2+/-) and homozygous zfarnt2–/– mutants were exposed to vehicle or TCDD. The images are of zfarnt2+/– and zfarnt2-/- larvae characterized genotypically by PCR. The images of the mutants exposed to DMSO are not shown. (B) Genotyping the zfarnt2 mutants by PCR. (C) The control (Control MO) and zfarnt1 morphants (ARNT1 MO) were exposed to vehicle or TCDD at 0 dpa. The images were captured at 3 dpa. Images of the control and zfarnt1 morphants exposed to DMSO are not shown. (D) Whole mount immunolocalization of zfCYP1A in control and zfarnt1 morphants exposed to TCDD.
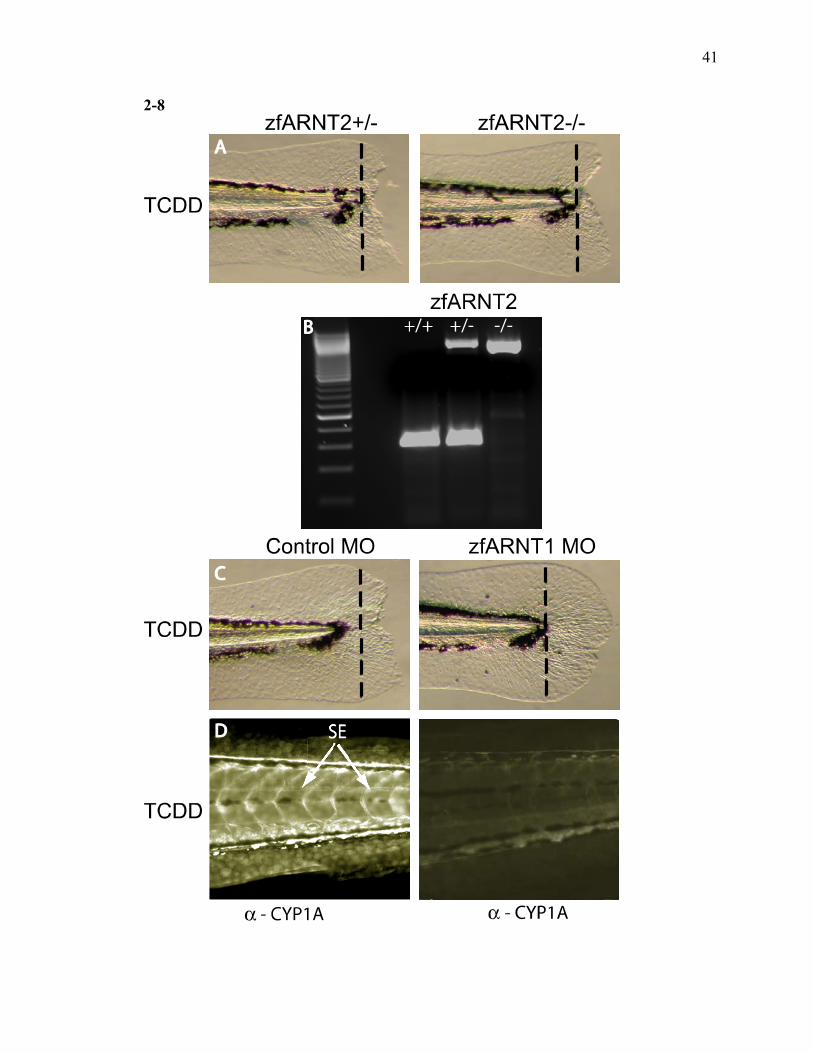
41
2-8

42
Figure 2-9. Inhibitory effect on the process of fin regeneration by TCDD and FGFR1 inhibitor is different. (A, B) The 48 hpf larvae were amputated and exposed to vehicle, TCDD or FGFR1 inhibitor (SU5402). Images of the TCDD and SU5402 exposed larvae were taken at 3 dpa. (C, D, F) Whole mount immunolocalization of acetylated tubulin that stains axons and the peripheral processes of larvae exposed to vehicle, TCDD or FGFR1 inhibitor (SU5402). The arrows indicate the path of diverging peripheral processes (D, E) Immunohistochemical staining was done on TCDD exposed larvae with ventral half cuts to delineate the peripheral processes that are diverging at the site of inhibition of fin regeneration. The arrow on the ventral half cut reveals the deviating path of peripheral processes (D). The images are representative of 12 larvae and the images were inverted.
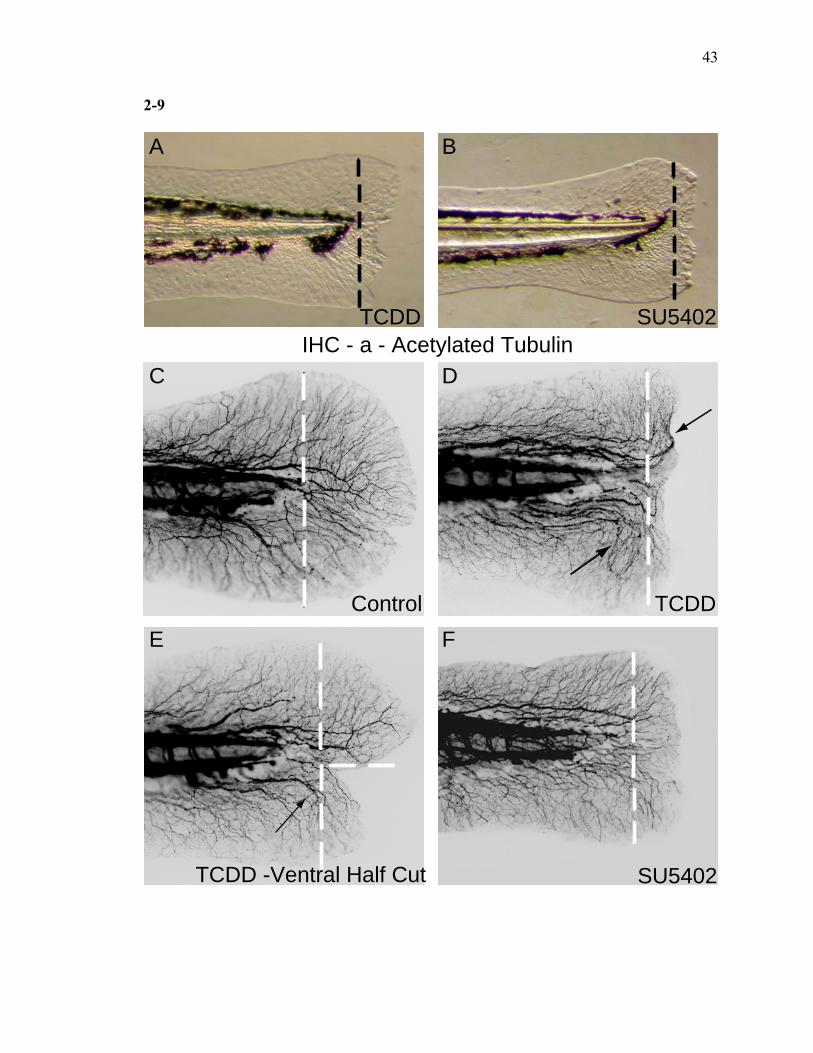
43
2-9
Control TCDD
TCDD SU5402
A B
C D
TCDD -Ventral Half Cut SU5402
IHC - a - Acetylated Tubulin
E F
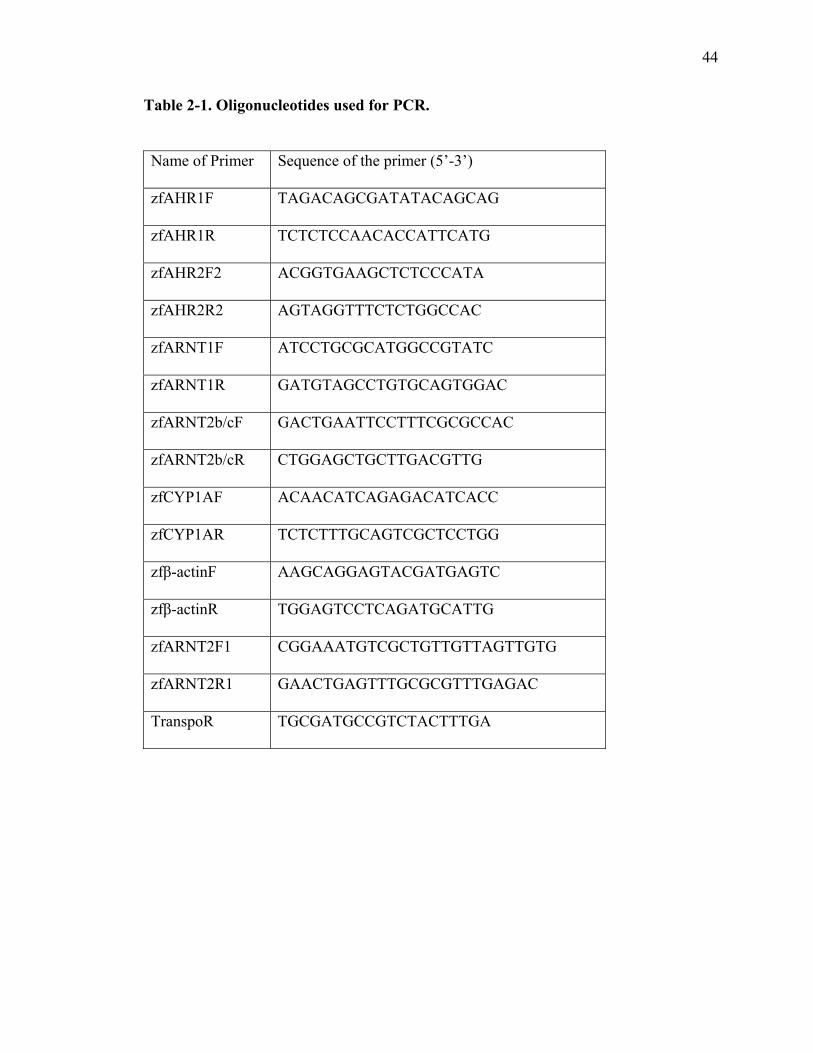
44
Table 2-1. Oligonucleotides used for PCR. Name of Primer Sequence of the primer (5’-3’)
zfAHR1F TAGACAGCGATATACAGCAG
zfAHR1R TCTCTCCAACACCATTCATG
zfAHR2F2 ACGGTGAAGCTCTCCCATA
zfAHR2R2 AGTAGGTTTCTCTGGCCAC
zfARNT1F ATCCTGCGCATGGCCGTATC
zfARNT1R GATGTAGCCTGTGCAGTGGAC
zfARNT2b/cF GACTGAATTCCTTTCGCGCCAC
zfARNT2b/cR CTGGAGCTGCTTGACGTTG
zfCYP1AF ACAACATCAGAGACATCACC
zfCYP1AR TCTCTTTGCAGTCGCTCCTGG
zfβ-actinF AAGCAGGAGTACGATGAGTC
zfβ-actinR TGGAGTCCTCAGATGCATTG
zfARNT2F1 CGGAAATGTCGCTGTTGTTAGTTGTG
zfARNT2R1 GAACTGAGTTTGCGCGTTTGAGAC
TranspoR TGCGATGCCGTCTACTTTGA
45
Crosstalk between AHR and Wnt Signaling Impairs Tissue Regeneration
Lijoy K Mathew, Sumitra S Sengupta, Jane LaDu, Eric A Andreasen, and Robert L
Tanguay.
Department of Environmental and Molecular Toxicology, Environmental Health
Sciences Center, Oregon State University, Corvallis, OR, 97331.
Formatted for Publication in Molecular and Cellular Biology
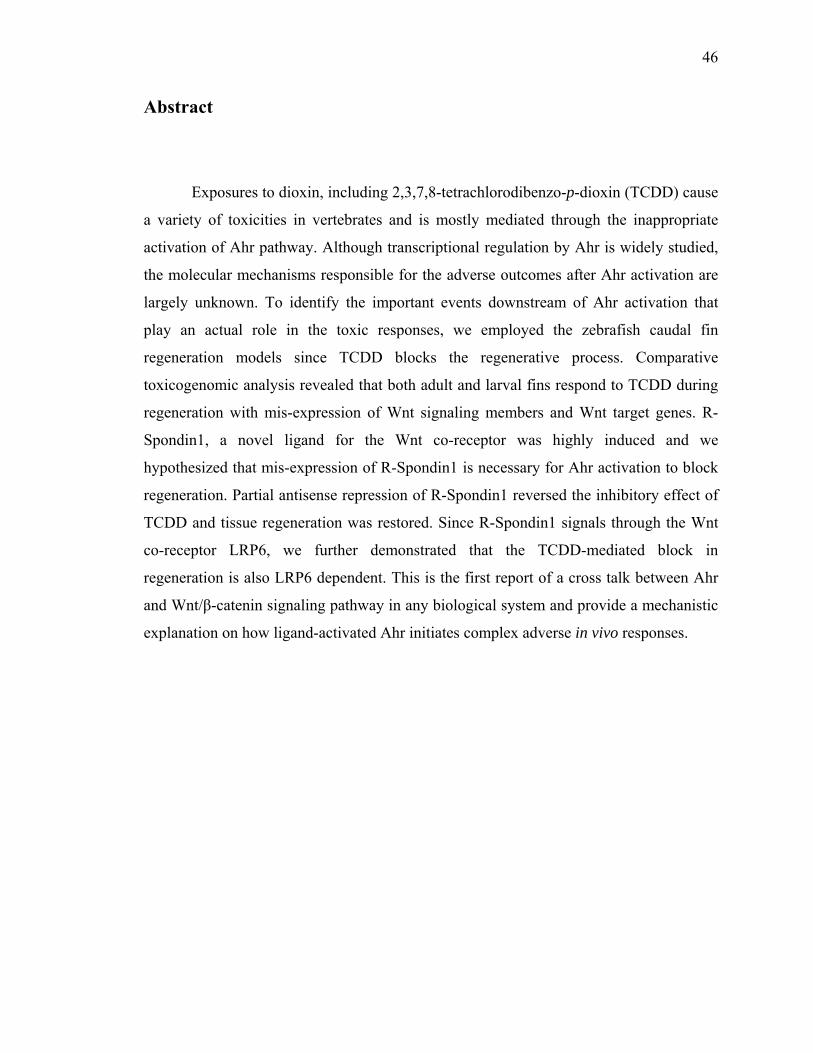
46
Abstract
Exposures to dioxin, including 2,3,7,8-tetrachlorodibenzo-p-dioxin (TCDD) cause
a variety of toxicities in vertebrates and is mostly mediated through the inappropriate
activation of Ahr pathway. Although transcriptional regulation by Ahr is widely studied,
the molecular mechanisms responsible for the adverse outcomes after Ahr activation are
largely unknown. To identify the important events downstream of Ahr activation that
play an actual role in the toxic responses, we employed the zebrafish caudal fin
regeneration models since TCDD blocks the regenerative process. Comparative
toxicogenomic analysis revealed that both adult and larval fins respond to TCDD during
regeneration with mis-expression of Wnt signaling members and Wnt target genes. R-
Spondin1, a novel ligand for the Wnt co-receptor was highly induced and we
hypothesized that mis-expression of R-Spondin1 is necessary for Ahr activation to block
regeneration. Partial antisense repression of R-Spondin1 reversed the inhibitory effect of
TCDD and tissue regeneration was restored. Since R-Spondin1 signals through the Wnt
co-receptor LRP6, we further demonstrated that the TCDD-mediated block in
regeneration is also LRP6 dependent. This is the first report of a cross talk between Ahr
and Wnt/β-catenin signaling pathway in any biological system and provide a mechanistic
explanation on how ligand-activated Ahr initiates complex adverse in vivo responses.
47
Introduction
The aryl hydrocarbon receptor (AHR) is a basic-helix–loop–helix (bHLH)
transcription factor, well known for its ability to bind to environmental contaminants
such as 2,3,7,8-tetrachlorodibenzo-p-dioxin (TCDD)(Burbach et al., 1992; Hankinson,
1994; Henry and Gasiewicz, 1993). The well accepted mechanism of action of TCDD is
that the ligand bound AHR translocates to the nucleus where it binds with its
dimerization partner, Ah receptor nuclear translocator (ARNT). The AHR-ARNT
complex binds to specific enhancer elements resulting in the transactivation of a variety
of genes that induce diverse toxicities including reproductive and developmental toxicity,
immunotoxicity, cardiotoxicity, teratogenicity and neurotoxicity at low exposure levels
[reviewed in (Schmidt and Bradfield, 1996). Even though the transcriptional regulation of
AHR has been widely studied, the molecular mechanisms leading to the manifestation of
toxicities are poorly understood. To understand the complex molecular mechanisms after
AHR activation, an in vivo research model easily amenable to molecular and genetic
manipulation would be very useful.
Zebrafish caudal fin regeneration is a well established research model that has
been utilized to identify the basic principles of tissue regeneration (Akimenko et al.,
2003; Mari-Beffa et al., 1996; Poss et al., 2000b; Santamaria and Becerra, 1991;
Santamaria et al., 1996; Whitehead et al., 2005). Zebrafish regenerate their caudal fins by
a process referred to as epimorphic regeneration (Mescher, 1996; Nakatani et al., 2007;
Poss et al., 2000a; Santamaria and Becerra, 1991; Stoick-Cooper et al., 2007; Whitehead
et al., 2005). Immediately after surgical amputation, epithelial cells begin to migrate over
the injured site forming a wound cap, which is followed by the de-differentiation of cells
proximal to the amputation plane into a cluster of pluripotent cells referred to as blastema
(Nakatani et al., 2007; Santamaria and Becerra, 1991; Santos-Ruiz et al., 2002;
Whitehead et al., 2005). The blastema cells further proliferate and differentiate into the
required cell types to complete the regenerative outgrowth. This complex process is
tightly regulated by multiple signaling pathways, and interference by external stimuli
could modulate the regeneration process leading to defective regeneration. We have
48
previously demonstrated that TCDD (2,3,7,8-Tetrachlorodibenzo-p-dioxin), an Ahr
ligand, inhibits zebrafish fin regeneration at both adult and larval stages (Mathew et al.,
2006; Zodrow and Tanguay, 2003). We also have shown that the inhibition of fin
regeneration mediated by TCDD is Ahr2 and Arnt1 dependent (Mathew et al., 2006).
Therefore, we developed this inhibition of regeneration phenomenon as an in vivo
platform to identify the molecular signaling pathways downstream of Ahr activation.
Through microarray and morphological analysis, we have previously
demonstrated that TCDD affects several components involved in cellular differentiation
and extracellular matrix composition in adult tissue regenerates (Andreasen et al., 2007;
Andreasen et al., 2006). To determine whether the gene expression changes by TCDD are
conserved between the adult and larval fin regeneration models, we performed
microarray analysis using the larval regeneration model. Comparative genomic analysis
revealed that Ahr activation results in the mis-expression of a number of Wnt signaling
genes in both regeneration systems, and we conclusively demonstrate that cross talk
between Ahr and Wnt signaling is responsible for the impairment of fin regeneration.
Additionally, the identification of the molecular pathways affected by Ahr activation
could also reveal essential molecular signaling pathways important for tissue
regeneration.
Materials and Methods
Zebrafish Embryos
Fertilized embryos from AB strain zebrafish (University of Oregon, Eugene, OR)
were used for all the experiments. All embryos were reared in our laboratory according to
standard procedures and each experimental group consisted of 12 larvae (Westerfield,
1995). Sox9b mutant line was a gift from Dr. John H. Postlethwait (University of Oregon,
Eugene, OR).
49
Chemicals
TCDD (>99% pure) was obtained from Chemsyn (Lenexa, KS) and the larval
exposures were done at a concentration of 1ng/mL. BIO (6-bromoindirubin-3'-oxime)
was bought from EMD Biosciences (San Diego, CA) and the larvae were exposed at a
final concentration of 10μM.
Fin RNA Isolation
Caudal fins from two day old embryos (AB strain, Eugene, OR) were amputated
and the animals were exposed to either DMSO (vehicle control) or 0.5ng/mL TCDD
(>99% pure, Chemsyn, Lenexa, KS) in the water for 1 hr (Figure 1). After several rinses
in TCDD free water, the larvae were reared until 2 and 3 days post amputation (dpa)
when their regenerating fin tissue was amputated and collected for RNA analysis. RNA
was extracted from the fin tissue using the RNAqueous Micro kit (Ambion, Austin, TX).
Three groups at each time point and treatment, each comprised of 150 larval fins, were
pooled to make an individual replicate. The quality and quantity of RNA was analyzed by
UV absorbance. The abundance of ribosomal RNA and degree of degradation was
determined in electropherogram patterns using the 2100 Bioanalyzer and RNA 6000
Nano chips (Agilent Technologies, Palo Alto, CA).
Affymetrix Microarray Processing
The microarray processing using the Affymetrix platform was performed by the
Center for Genome Research and Biocomputing at Oregon State University, Corvallis
OR. A total of 100ng of RNA from the larval fin tissue (+/-TCDD) at 2 and 3 dpa were
used to generate biotinylated complementary RNA (cRNA) using the Two-Cycle Target
Labeling kit (Affymetrix, Santa Clara, CA). In short, the different RNA samples were
reverse transcribed using a T7-(dT)24 primer and Superscript II reverse transcriptase
(Invitrogen, Carlsbad, CA) and double stranded cDNA was synthesized. Another round
of double stranded cDNA synthethis was conducted using the previously synthesized
cDNA as the template. Biotinylated cRNA was synthesized from the double stranded
cDNA using T7 RNA polymerase and a biotin-conjugated pseudouridine containing
nucleotide mixture provided in the IVT Labeling Kit (Affymetrix, Santa Clara, CA). The
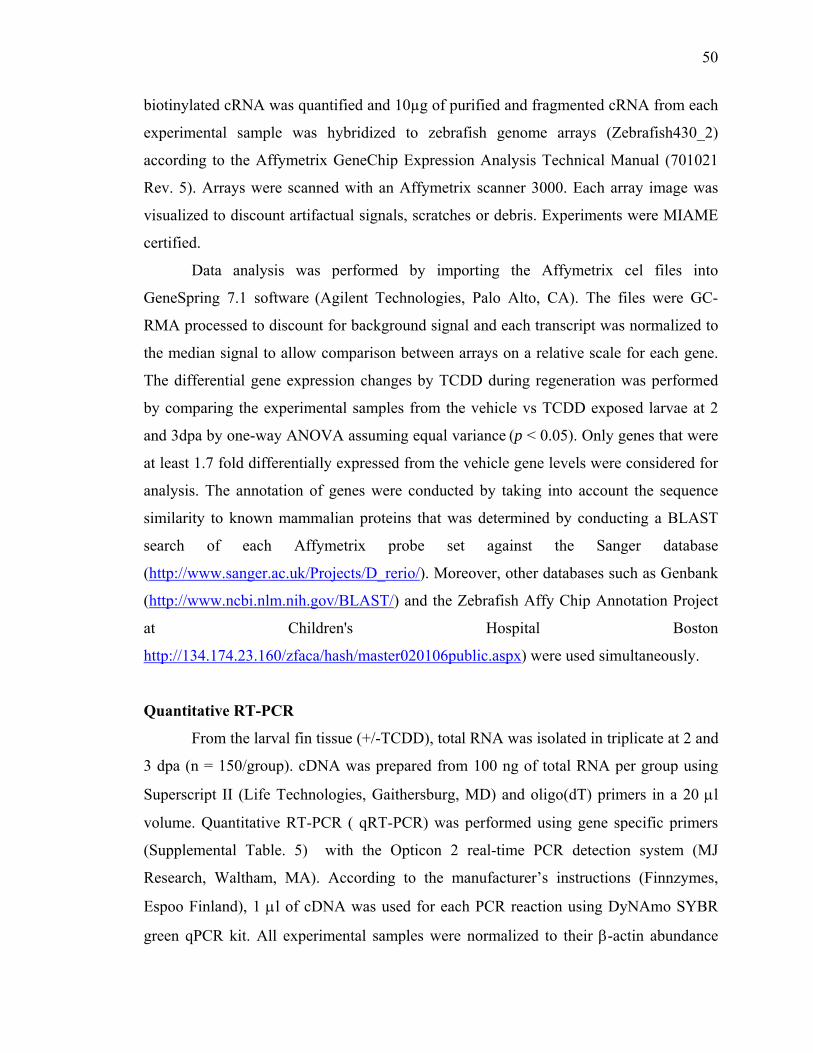
50
biotinylated cRNA was quantified and 10µg of purified and fragmented cRNA from each
experimental sample was hybridized to zebrafish genome arrays (Zebrafish430_2)
according to the Affymetrix GeneChip Expression Analysis Technical Manual (701021
Rev. 5). Arrays were scanned with an Affymetrix scanner 3000. Each array image was
visualized to discount artifactual signals, scratches or debris. Experiments were MIAME
certified.
Data analysis was performed by importing the Affymetrix cel files into
GeneSpring 7.1 software (Agilent Technologies, Palo Alto, CA). The files were GC-
RMA processed to discount for background signal and each transcript was normalized to
the median signal to allow comparison between arrays on a relative scale for each gene.
The differential gene expression changes by TCDD during regeneration was performed
by comparing the experimental samples from the vehicle vs TCDD exposed larvae at 2
and 3dpa by one-way ANOVA assuming equal variance (p < 0.05). Only genes that were
at least 1.7 fold differentially expressed from the vehicle gene levels were considered for
analysis. The annotation of genes were conducted by taking into account the sequence
similarity to known mammalian proteins that was determined by conducting a BLAST
search of each Affymetrix probe set against the Sanger database
(http://www.sanger.ac.uk/Projects/D_rerio/). Moreover, other databases such as Genbank
(http://www.ncbi.nlm.nih.gov/BLAST/) and the Zebrafish Affy Chip Annotation Project
at Children's Hospital Boston
http://134.174.23.160/zfaca/hash/master020106public.aspx) were used simultaneously.
Quantitative RT-PCR
From the larval fin tissue (+/-TCDD), total RNA was isolated in triplicate at 2 and
3 dpa (n = 150/group). cDNA was prepared from 100 ng of total RNA per group using
Superscript II (Life Technologies, Gaithersburg, MD) and oligo(dT) primers in a 20 μl
volume. Quantitative RT-PCR ( qRT-PCR) was performed using gene specific primers
(Supplemental Table. 5) with the Opticon 2 real-time PCR detection system (MJ
Research, Waltham, MA). According to the manufacturer’s instructions (Finnzymes,
Espoo Finland), 1 μl of cDNA was used for each PCR reaction using DyNAmo SYBR
green qPCR kit. All experimental samples were normalized to their β-actin abundance
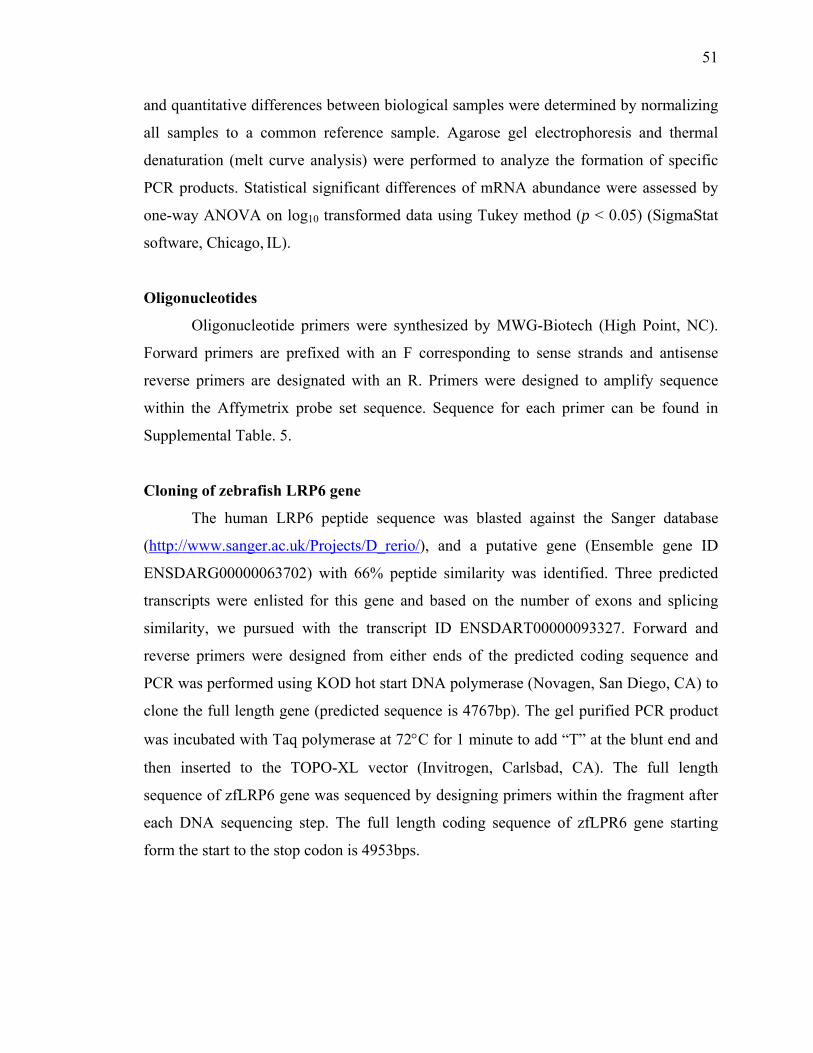
51
and quantitative differences between biological samples were determined by normalizing
all samples to a common reference sample. Agarose gel electrophoresis and thermal
denaturation (melt curve analysis) were performed to analyze the formation of specific
PCR products. Statistical significant differences of mRNA abundance were assessed by
one-way ANOVA on log10 transformed data using Tukey method (p < 0.05) (SigmaStat
software, Chicago, IL).
Oligonucleotides
Oligonucleotide primers were synthesized by MWG-Biotech (High Point, NC).
Forward primers are prefixed with an F corresponding to sense strands and antisense
reverse primers are designated with an R. Primers were designed to amplify sequence
within the Affymetrix probe set sequence. Sequence for each primer can be found in
Supplemental Table. 5.
Cloning of zebrafish LRP6 gene
The human LRP6 peptide sequence was blasted against the Sanger database
(http://www.sanger.ac.uk/Projects/D_rerio/), and a putative gene (Ensemble gene ID
ENSDARG00000063702) with 66% peptide similarity was identified. Three predicted
transcripts were enlisted for this gene and based on the number of exons and splicing
similarity, we pursued with the transcript ID ENSDART00000093327. Forward and
reverse primers were designed from either ends of the predicted coding sequence and
PCR was performed using KOD hot start DNA polymerase (Novagen, San Diego, CA) to
clone the full length gene (predicted sequence is 4767bp). The gel purified PCR product
was incubated with Taq polymerase at 72°C for 1 minute to add “T” at the blunt end and
then inserted to the TOPO-XL vector (Invitrogen, Carlsbad, CA). The full length
sequence of zfLRP6 gene was sequenced by designing primers within the fragment after
each DNA sequencing step. The full length coding sequence of zfLPR6 gene starting
form the start to the stop codon is 4953bps.
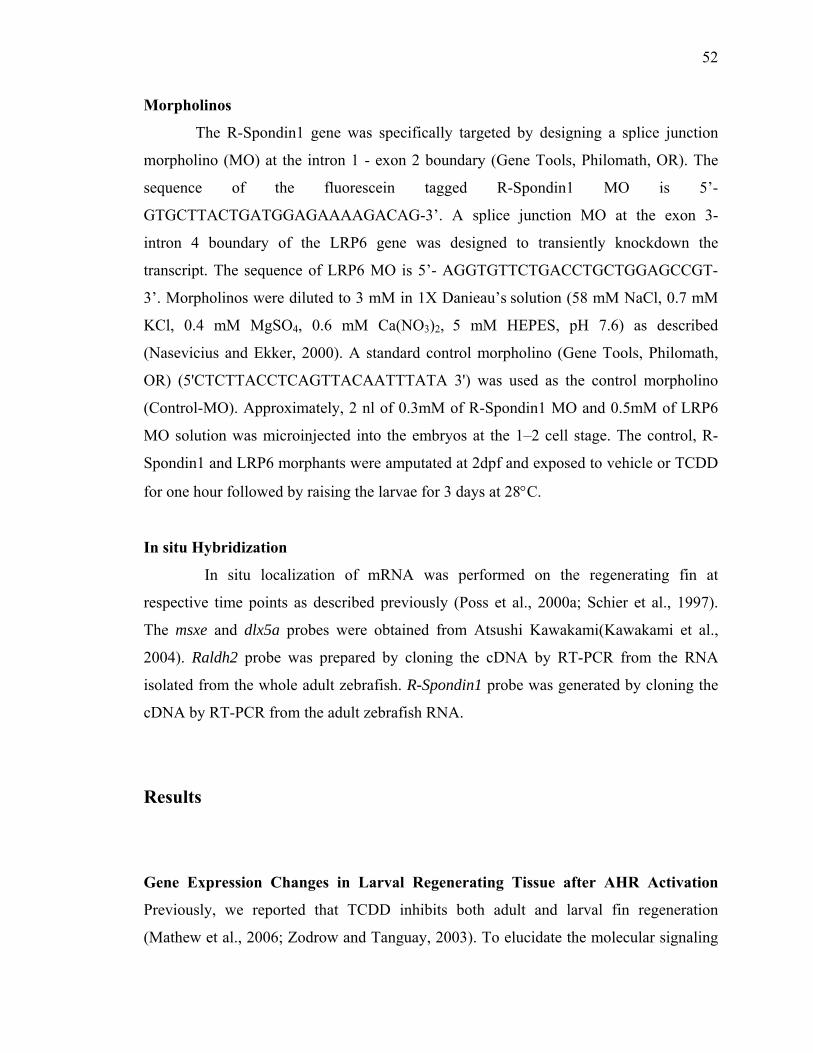
52
Morpholinos
The R-Spondin1 gene was specifically targeted by designing a splice junction
morpholino (MO) at the intron 1 - exon 2 boundary (Gene Tools, Philomath, OR). The
sequence of the fluorescein tagged R-Spondin1 MO is 5’-
GTGCTTACTGATGGAGAAAAGACAG-3’. A splice junction MO at the exon 3-
intron 4 boundary of the LRP6 gene was designed to transiently knockdown the
transcript. The sequence of LRP6 MO is 5’- AGGTGTTCTGACCTGCTGGAGCCGT-
3’. Morpholinos were diluted to 3 mM in 1X Danieau’s solution (58 mM NaCl, 0.7 mM
KCl, 0.4 mM MgSO4, 0.6 mM Ca(NO3)2, 5 mM HEPES, pH 7.6) as described
(Nasevicius and Ekker, 2000). A standard control morpholino (Gene Tools, Philomath,
OR) (5'CTCTTACCTCAGTTACAATTTATA 3') was used as the control morpholino
(Control-MO). Approximately, 2 nl of 0.3mM of R-Spondin1 MO and 0.5mM of LRP6
MO solution was microinjected into the embryos at the 1–2 cell stage. The control, R-
Spondin1 and LRP6 morphants were amputated at 2dpf and exposed to vehicle or TCDD
for one hour followed by raising the larvae for 3 days at 28°C.
In situ Hybridization
In situ localization of mRNA was performed on the regenerating fin at
respective time points as described previously (Poss et al., 2000a; Schier et al., 1997).
The msxe and dlx5a probes were obtained from Atsushi Kawakami(Kawakami et al.,
2004). Raldh2 probe was prepared by cloning the cDNA by RT-PCR from the RNA
isolated from the whole adult zebrafish. R-Spondin1 probe was generated by cloning the
cDNA by RT-PCR from the adult zebrafish RNA.
Results
Gene Expression Changes in Larval Regenerating Tissue after AHR Activation
Previously, we reported that TCDD inhibits both adult and larval fin regeneration
(Mathew et al., 2006; Zodrow and Tanguay, 2003). To elucidate the molecular signaling
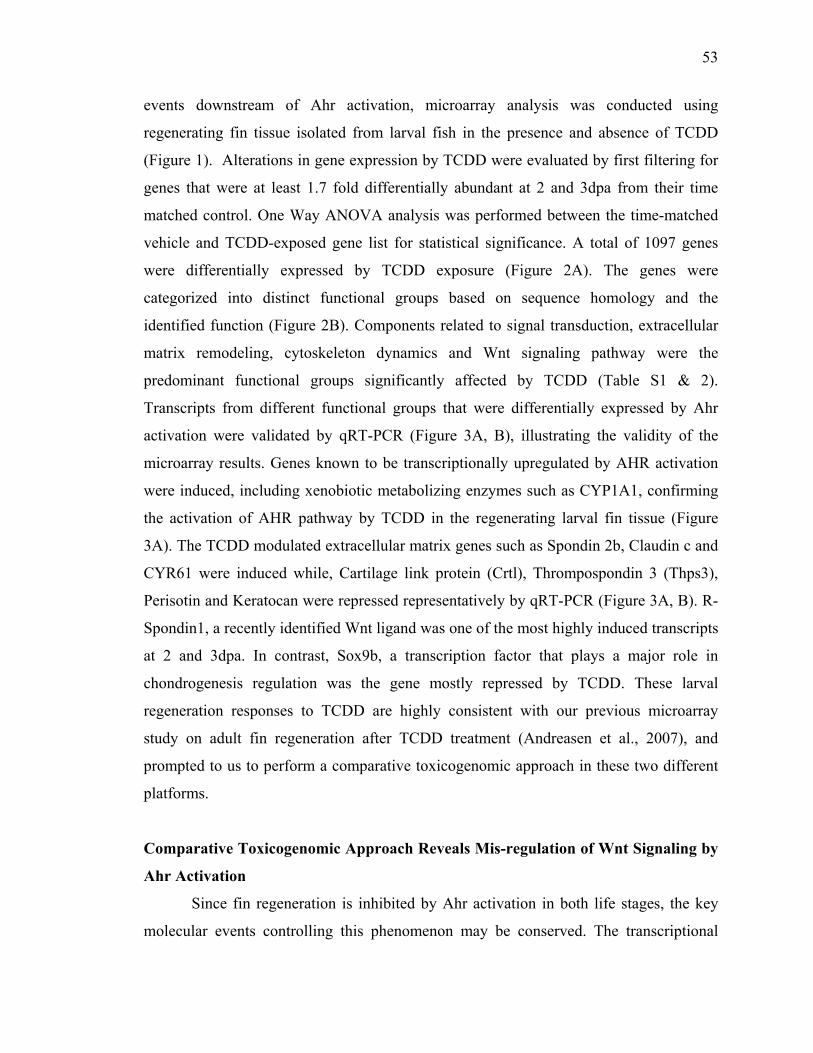
53
events downstream of Ahr activation, microarray analysis was conducted using
regenerating fin tissue isolated from larval fish in the presence and absence of TCDD
(Figure 1). Alterations in gene expression by TCDD were evaluated by first filtering for
genes that were at least 1.7 fold differentially abundant at 2 and 3dpa from their time
matched control. One Way ANOVA analysis was performed between the time-matched
vehicle and TCDD-exposed gene list for statistical significance. A total of 1097 genes
were differentially expressed by TCDD exposure (Figure 2A). The genes were
categorized into distinct functional groups based on sequence homology and the
identified function (Figure 2B). Components related to signal transduction, extracellular
matrix remodeling, cytoskeleton dynamics and Wnt signaling pathway were the
predominant functional groups significantly affected by TCDD (Table S1 & 2).
Transcripts from different functional groups that were differentially expressed by Ahr
activation were validated by qRT-PCR (Figure 3A, B), illustrating the validity of the
microarray results. Genes known to be transcriptionally upregulated by AHR activation
were induced, including xenobiotic metabolizing enzymes such as CYP1A1, confirming
the activation of AHR pathway by TCDD in the regenerating larval fin tissue (Figure
3A). The TCDD modulated extracellular matrix genes such as Spondin 2b, Claudin c and
CYR61 were induced while, Cartilage link protein (Crtl), Thrompospondin 3 (Thps3),
Perisotin and Keratocan were repressed representatively by qRT-PCR (Figure 3A, B). R-
Spondin1, a recently identified Wnt ligand was one of the most highly induced transcripts
at 2 and 3dpa. In contrast, Sox9b, a transcription factor that plays a major role in
chondrogenesis regulation was the gene mostly repressed by TCDD. These larval
regeneration responses to TCDD are highly consistent with our previous microarray
study on adult fin regeneration after TCDD treatment (Andreasen et al., 2007), and
prompted to us to perform a comparative toxicogenomic approach in these two different
platforms.
Comparative Toxicogenomic Approach Reveals Mis-regulation of Wnt Signaling by
Ahr Activation
Since fin regeneration is inhibited by Ahr activation in both life stages, the key
molecular events controlling this phenomenon may be conserved. The transcriptional
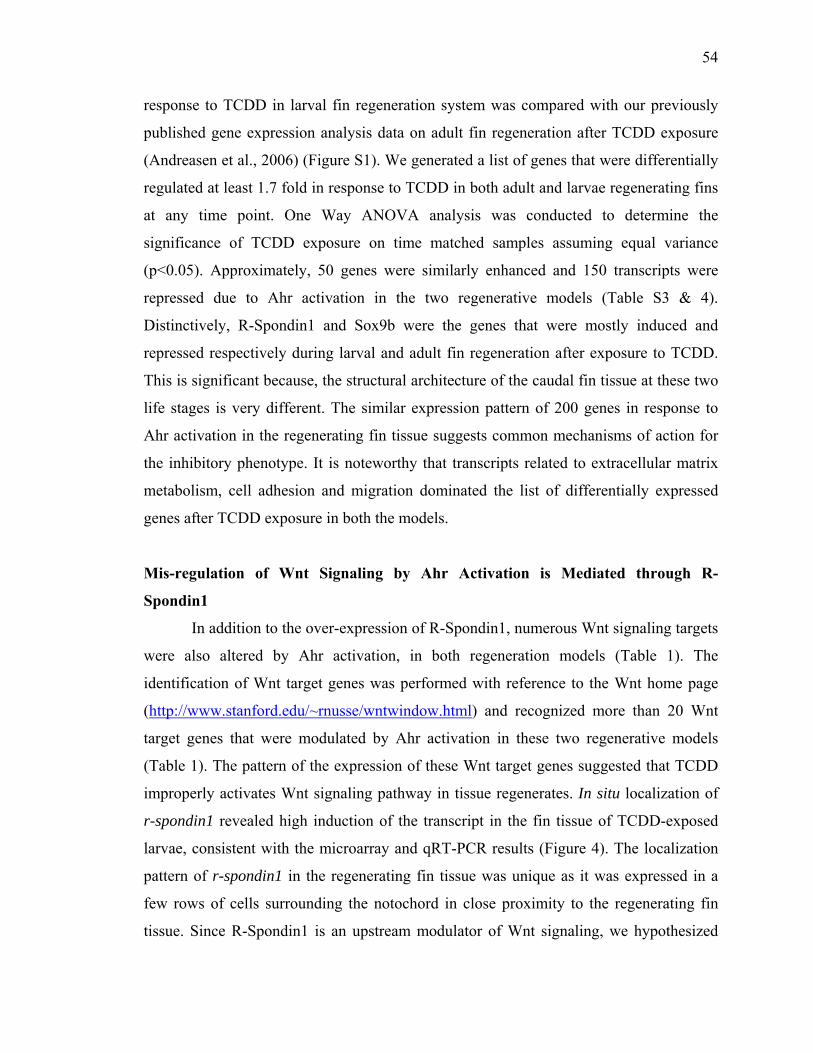
54
response to TCDD in larval fin regeneration system was compared with our previously
published gene expression analysis data on adult fin regeneration after TCDD exposure
(Andreasen et al., 2006) (Figure S1). We generated a list of genes that were differentially
regulated at least 1.7 fold in response to TCDD in both adult and larvae regenerating fins
at any time point. One Way ANOVA analysis was conducted to determine the
significance of TCDD exposure on time matched samples assuming equal variance
(p<0.05). Approximately, 50 genes were similarly enhanced and 150 transcripts were
repressed due to Ahr activation in the two regenerative models (Table S3 & 4).
Distinctively, R-Spondin1 and Sox9b were the genes that were mostly induced and
repressed respectively during larval and adult fin regeneration after exposure to TCDD.
This is significant because, the structural architecture of the caudal fin tissue at these two
life stages is very different. The similar expression pattern of 200 genes in response to
Ahr activation in the regenerating fin tissue suggests common mechanisms of action for
the inhibitory phenotype. It is noteworthy that transcripts related to extracellular matrix
metabolism, cell adhesion and migration dominated the list of differentially expressed
genes after TCDD exposure in both the models.
Mis-regulation of Wnt Signaling by Ahr Activation is Mediated through R-
Spondin1
In addition to the over-expression of R-Spondin1, numerous Wnt signaling targets
were also altered by Ahr activation, in both regeneration models (Table 1). The
identification of Wnt target genes was performed with reference to the Wnt home page
(http://www.stanford.edu/~rnusse/wntwindow.html) and recognized more than 20 Wnt
target genes that were modulated by Ahr activation in these two regenerative models
(Table 1). The pattern of the expression of these Wnt target genes suggested that TCDD
improperly activates Wnt signaling pathway in tissue regenerates. In situ localization of
r-spondin1 revealed high induction of the transcript in the fin tissue of TCDD-exposed
larvae, consistent with the microarray and qRT-PCR results (Figure 4). The localization
pattern of r-spondin1 in the regenerating fin tissue was unique as it was expressed in a
few rows of cells surrounding the notochord in close proximity to the regenerating fin
tissue. Since R-Spondin1 is an upstream modulator of Wnt signaling, we hypothesized
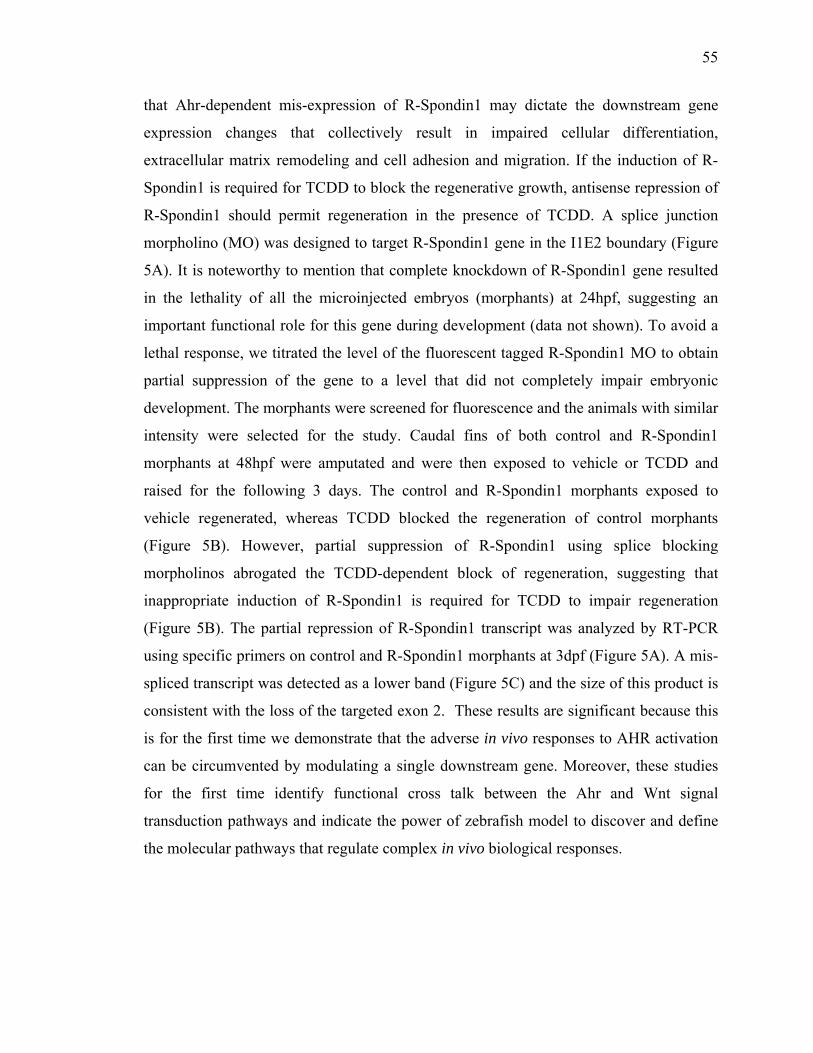
55
that Ahr-dependent mis-expression of R-Spondin1 may dictate the downstream gene
expression changes that collectively result in impaired cellular differentiation,
extracellular matrix remodeling and cell adhesion and migration. If the induction of R-
Spondin1 is required for TCDD to block the regenerative growth, antisense repression of
R-Spondin1 should permit regeneration in the presence of TCDD. A splice junction
morpholino (MO) was designed to target R-Spondin1 gene in the I1E2 boundary (Figure
5A). It is noteworthy to mention that complete knockdown of R-Spondin1 gene resulted
in the lethality of all the microinjected embryos (morphants) at 24hpf, suggesting an
important functional role for this gene during development (data not shown). To avoid a
lethal response, we titrated the level of the fluorescent tagged R-Spondin1 MO to obtain
partial suppression of the gene to a level that did not completely impair embryonic
development. The morphants were screened for fluorescence and the animals with similar
intensity were selected for the study. Caudal fins of both control and R-Spondin1
morphants at 48hpf were amputated and were then exposed to vehicle or TCDD and
raised for the following 3 days. The control and R-Spondin1 morphants exposed to
vehicle regenerated, whereas TCDD blocked the regeneration of control morphants
(Figure 5B). However, partial suppression of R-Spondin1 using splice blocking
morpholinos abrogated the TCDD-dependent block of regeneration, suggesting that
inappropriate induction of R-Spondin1 is required for TCDD to impair regeneration
(Figure 5B). The partial repression of R-Spondin1 transcript was analyzed by RT-PCR
using specific primers on control and R-Spondin1 morphants at 3dpf (Figure 5A). A mis-
spliced transcript was detected as a lower band (Figure 5C) and the size of this product is
consistent with the loss of the targeted exon 2. These results are significant because this
is for the first time we demonstrate that the adverse in vivo responses to AHR activation
can be circumvented by modulating a single downstream gene. Moreover, these studies
for the first time identify functional cross talk between the Ahr and Wnt signal
transduction pathways and indicate the power of zebrafish model to discover and define
the molecular pathways that regulate complex in vivo biological responses.
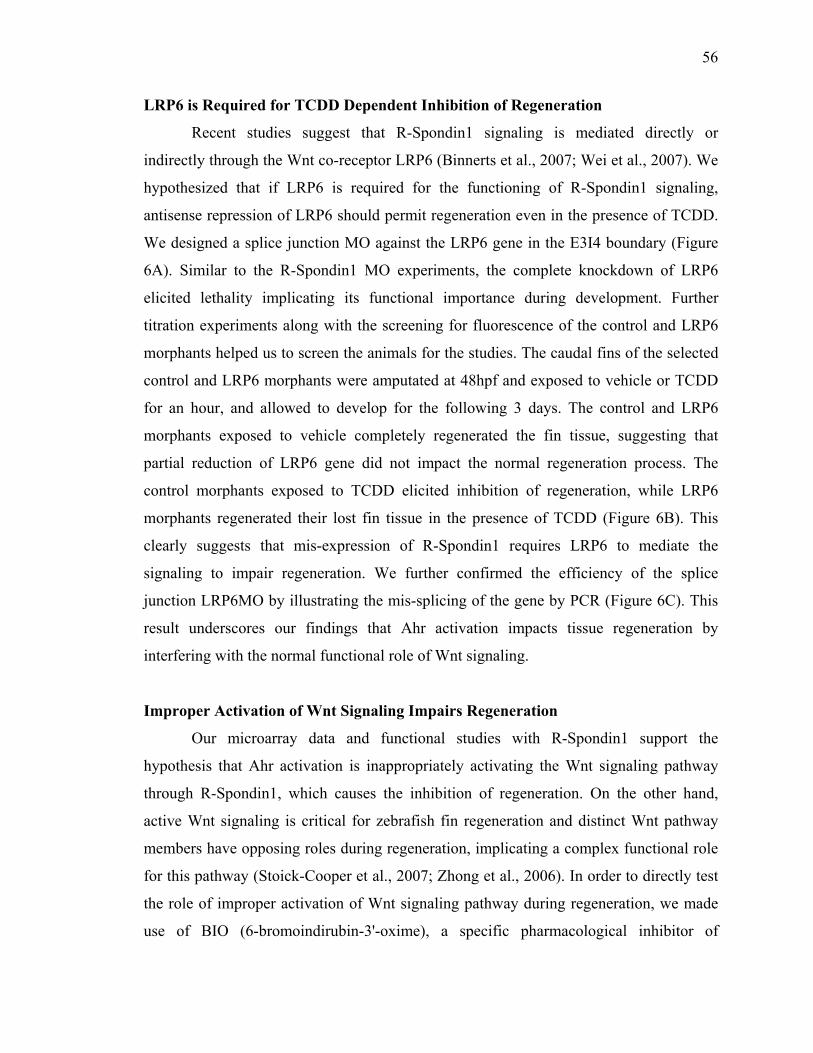
56
LRP6 is Required for TCDD Dependent Inhibition of Regeneration
Recent studies suggest that R-Spondin1 signaling is mediated directly or
indirectly through the Wnt co-receptor LRP6 (Binnerts et al., 2007; Wei et al., 2007). We
hypothesized that if LRP6 is required for the functioning of R-Spondin1 signaling,
antisense repression of LRP6 should permit regeneration even in the presence of TCDD.
We designed a splice junction MO against the LRP6 gene in the E3I4 boundary (Figure
6A). Similar to the R-Spondin1 MO experiments, the complete knockdown of LRP6
elicited lethality implicating its functional importance during development. Further
titration experiments along with the screening for fluorescence of the control and LRP6
morphants helped us to screen the animals for the studies. The caudal fins of the selected
control and LRP6 morphants were amputated at 48hpf and exposed to vehicle or TCDD
for an hour, and allowed to develop for the following 3 days. The control and LRP6
morphants exposed to vehicle completely regenerated the fin tissue, suggesting that
partial reduction of LRP6 gene did not impact the normal regeneration process. The
control morphants exposed to TCDD elicited inhibition of regeneration, while LRP6
morphants regenerated their lost fin tissue in the presence of TCDD (Figure 6B). This
clearly suggests that mis-expression of R-Spondin1 requires LRP6 to mediate the
signaling to impair regeneration. We further confirmed the efficiency of the splice
junction LRP6MO by illustrating the mis-splicing of the gene by PCR (Figure 6C). This
result underscores our findings that Ahr activation impacts tissue regeneration by
interfering with the normal functional role of Wnt signaling.
Improper Activation of Wnt Signaling Impairs Regeneration
Our microarray data and functional studies with R-Spondin1 support the
hypothesis that Ahr activation is inappropriately activating the Wnt signaling pathway
through R-Spondin1, which causes the inhibition of regeneration. On the other hand,
active Wnt signaling is critical for zebrafish fin regeneration and distinct Wnt pathway
members have opposing roles during regeneration, implicating a complex functional role
for this pathway (Stoick-Cooper et al., 2007; Zhong et al., 2006). In order to directly test
the role of improper activation of Wnt signaling pathway during regeneration, we made
use of BIO (6-bromoindirubin-3'-oxime), a specific pharmacological inhibitor of
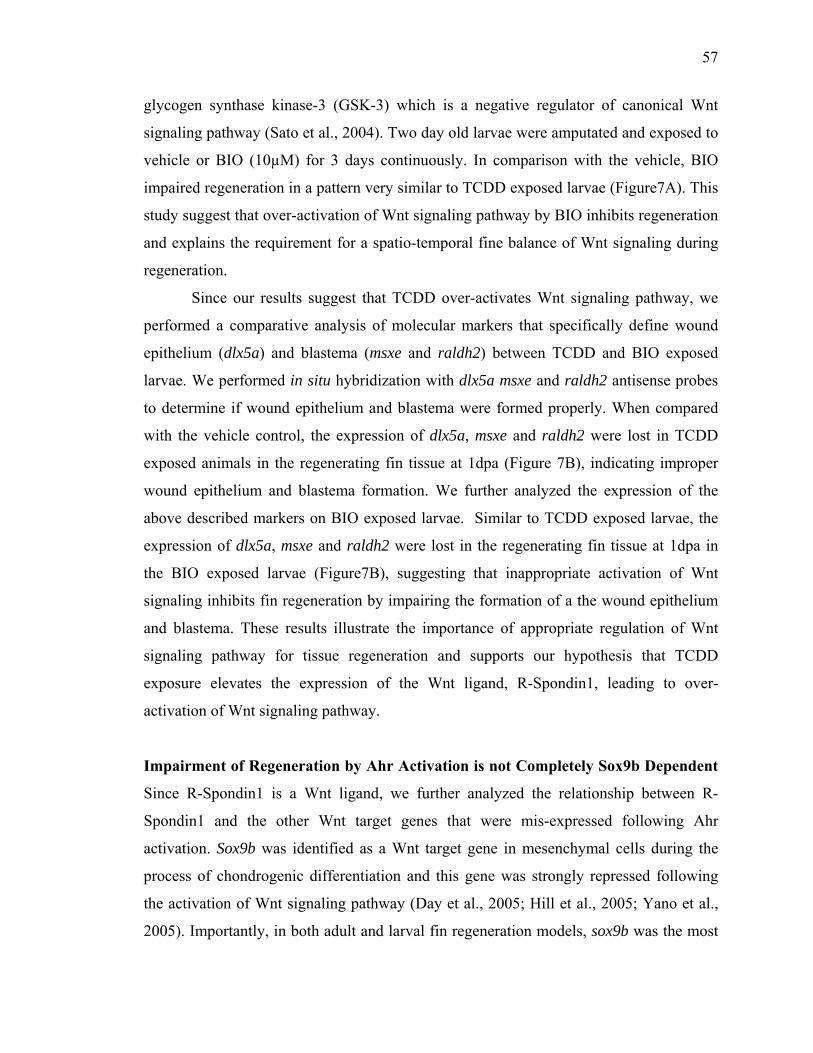
57
glycogen synthase kinase-3 (GSK-3) which is a negative regulator of canonical Wnt
signaling pathway (Sato et al., 2004). Two day old larvae were amputated and exposed to
vehicle or BIO (10µM) for 3 days continuously. In comparison with the vehicle, BIO
impaired regeneration in a pattern very similar to TCDD exposed larvae (Figure7A). This
study suggest that over-activation of Wnt signaling pathway by BIO inhibits regeneration
and explains the requirement for a spatio-temporal fine balance of Wnt signaling during
regeneration.
Since our results suggest that TCDD over-activates Wnt signaling pathway, we
performed a comparative analysis of molecular markers that specifically define wound
epithelium (dlx5a) and blastema (msxe and raldh2) between TCDD and BIO exposed
larvae. We performed in situ hybridization with dlx5a msxe and raldh2 antisense probes
to determine if wound epithelium and blastema were formed properly. When compared
with the vehicle control, the expression of dlx5a, msxe and raldh2 were lost in TCDD
exposed animals in the regenerating fin tissue at 1dpa (Figure 7B), indicating improper
wound epithelium and blastema formation. We further analyzed the expression of the
above described markers on BIO exposed larvae. Similar to TCDD exposed larvae, the
expression of dlx5a, msxe and raldh2 were lost in the regenerating fin tissue at 1dpa in
the BIO exposed larvae (Figure7B), suggesting that inappropriate activation of Wnt
signaling inhibits fin regeneration by impairing the formation of a the wound epithelium
and blastema. These results illustrate the importance of appropriate regulation of Wnt
signaling pathway for tissue regeneration and supports our hypothesis that TCDD
exposure elevates the expression of the Wnt ligand, R-Spondin1, leading to over-
activation of Wnt signaling pathway.
Impairment of Regeneration by Ahr Activation is not Completely Sox9b Dependent
Since R-Spondin1 is a Wnt ligand, we further analyzed the relationship between R-
Spondin1 and the other Wnt target genes that were mis-expressed following Ahr
activation. Sox9b was identified as a Wnt target gene in mesenchymal cells during the
process of chondrogenic differentiation and this gene was strongly repressed following
the activation of Wnt signaling pathway (Day et al., 2005; Hill et al., 2005; Yano et al.,
2005). Importantly, in both adult and larval fin regeneration models, sox9b was the most
58
repressed gene by TCDD and we proposed that the activation of Wnt signaling by AHR
activation through R-Spondin1 is responsible for the repression of sox9b. We performed
functional regeneration studies using sox9b homozygous mutants to determine if the
repression of sox9b itself is enough to impair regeneration. The amputated sox9b mutants
regenerated their fin tissue by 3dpa, but with defective cartilaginous-like support
structures and actinotrichia resulting in a delicate unsupported new tissue (Figure 8).
Since SOX9 is also considered as a master regulator of chondrogenesis (Akiyama et al.,
2002; Bi et al., 1999; Goldring et al., 2006), these results indicate that the reduced
abundance of sox9b by Ahr activation could explain the impairment of cartilage like
structures. Moreover, these results also implicate the involvement of other molecular
factors downstream to R-Spondin1 and parallel to sox9b.
Discussion
Zebrafish caudal fin regeneration is a well established research model to
understand the basic biological mechanisms of the remarkable phenomenon of
regeneration. Similar to the adults, early life stage larvae (2dpf) also completely
regenerate caudal fins following amputation (Kawakami et al., 2004; Mathew et al.,
2006). We have reported that TCDD inhibits both life stages of caudal fin regeneration.
The toxicity studies associated with exposure to halogenated aromatic hydrocarbons such
as TCDD have resulted in the identification of Ahr as an essential ligand activated
transcription factor that mediates most if not all of the toxic effects of TCDD. What
remain mostly unknown are the molecular events downstream of Ahr activation that
elicits adverse tissue specific responses. To address this information gap, we have
exploited TCDD-dependent block in fin regeneration in order to identify the molecular
signaling pathways impacted after Ahr activation (Mathew et al., 2006; Zodrow and
Tanguay, 2003). In addition to the effect of TCDD on zebrafish fin regeneration, a
previous report has demonstrated that treatment of mice with TCDD after partial
hepatectomy resulted in the suppression of liver regeneration (Mitchell et al., 2006).
59
Therefore, since TCDD has a global effect on tissue regeneration, identification of the
signaling pathways that cross talk with Ahr will also provide a better understanding of the
basic regeneration pathways. Global gene expression analysis in the adult fin
regeneration after TCDD exposure suggests that Ahr activation modulates a cluster of
genes involved in cellular differentiation and extracellular matrix metabolism (Andreasen
et al., 2006). To understand whether the larval fin regeneration is also affected by TCDD
at a similar molecular level, we performed microarray analysis in the early life stage
regeneration model after TCDD exposure. Similarly to the adult model, TCDD most
profoundly altered the abundance of transcripts involved in signal transduction,
metabolism and composition of the extracellular matrix during larval fin regeneration.
Comparative analysis performed between the two caudal fin regeneration models
revealed a strong similarity in the pattern of gene expression between these two platforms
in response to TCDD, even with distinct tissue architecture. Antisense repression of R-
Spondin1 resulted in the inability of TCDD to impair regeneration indicating that mis-
induction of this gene was absolutely required for Ahr activation to inhibit regeneration.
R-Spondin family belongs to a new class of secreted proteins including four members (R-
Spondin1-4) and each contains a leading N-terminal signal peptide, two furin-type
cysteine rich domains, one thrombospondin type domain and a C-terminal basic amino
acid rich domain (Kamata et al., 2004; Kazanskaya et al., 2004). R-Spondins have been
identified as novel ligands for the Fdz/LRP receptor complex and induces the β-
catenin/TCF dependent gene activation (Kim et al., 2006). Recent studies suggest that
human R-Spondin1 is a high affinity ligand for LRP6 and binding of this ligand to the
receptor results in the phosphorylation of LRP6 and activation of β-catenin signaling
(Wei et al., 2007). However, another recent study conflicts with the previous report and
suggests that R-Spondin1 does not directly interact with LRP6, but instead prevents the
DKK1/Kremen-mediated internalization of LRP6 thereby facilitating increased LRP6
levels on the cell surface(Binnerts et al., 2007). But both studies acknowledge that LRP6
is required for R-Spondin1 signaling. Even though R-Spondins act through β-catenin
stabilization and may synergize with Wnt proteins, multiple in vitro and in vivo studies in
different species suggest that the effect may not be completely dependent on the
canonical Wnt signaling pathway (Kazanskaya et al., 2004; Nam et al., 2006). In addition
60
to human and mouse, R-Spondins have also been identified in other vertebrates such as
rat, zebrafish, xenopus and chicken.
Since LRP6 is required for R-Spondin1 signaling, we further tested the functional
requirement of LRP6 in the AHR activation mediated inhibition of fin regeneration
phenomenon. We observed that partial suppression of LRP6 is sufficient to prevent the
inhibitory effect of TCDD on fin regeneration. This demonstrates that R-Spondin1
requires LRP6 to mediate its effect and also underscore our hypothesis that Ahr
activation improperly activates the canonical Wnt signaling pathway. These results are
very important as a previous study has reported that increased Wnt/β-catenin signaling
augments adult zebrafish fin regeneration (Stoick-Cooper et al., 2007). However, our
results suggest that over activation of Wnt/β-catenin signaling impairs regeneration. This
leads to a question about the threshold level of the Wnt signaling pathway that is required
for the completion of the regenerative process. To confirm our results that over activation
of Wnt/ β-catenin signaling impairs regeneration, we tested a chemical BIO that is
referred to as a small molecule that activates the Wnt/β-catenin signaling pathway by the
inhibition of GSK-3 (Meijer et al., 2003; Sato et al., 2004; Tseng et al., 2006). BIO
inhibited larval fin regeneration when compared to the vehicle-exposed larvae (Figure
7A), emphasizing our finding that over activation of Wnt/β-catenin signaling impairs
regeneration. Analysis of molecular markers suggests that in both TCDD and BIO
exposed animals, the expression of dlx5a, msxe and raldh2 that defines the wound
epithelium and blastema respectively, were lost (Figure 7B). These results suggest that
over activation Wnt signaling pathway affects the blastema formation by inhibiting the
cellular differentiation process. In support to our speculation, previous studies have
reported that even though Wnt signaling is required for hematopoietic stem cell self-
renewal, constitutive activation of β-catenin signaling caused multilineage differentiation
block impacting the stem cell maintenance (Kirstetter et al., 2006; Scheller et al., 2006).
Another recent study demonstrated that muscle stem cells from aged mice convert from a
myogenic to fibrogenic lineage resulting in tissue fibrosis and the lineage conversion is
associated with activation of canonical Wnt signaling pathway (Brack et al., 2007).
Altogether, these studies support that inappropriate activation of Wnt /β-catenin signaling
impacts the differentiation process during fin regeneration.
61
The functional importance of R-Spondin genes were revealed by two recent
genetic studies that described different mutations of R-Spondins have been associated
with human disease conditions. A rare autosomal recessive condition known as
anonychia is linked to the mutation of R-Spo4 and another recessive syndrome
characterized by XX sex reversal, palmoplantar hyperkeratosis and predisposition to
squamous cell carcinoma is due to the mutation of R-Spondin1(Blaydon et al., 2006;
Parma et al., 2006). Mutation of R-Spondin1 causes the XX sex reversal to male and this
impact is speculated to be due to the induction of SOX9 promoting the testis
development. More clearly, it’s been proposed that R-Spondin1 regulates the expression
of SOX9 and the mutation of R-Spondin1 resulted in the inappropriate induction of
SOX9 levels which indeed resulted in the XX sex reversal (Parma et al., 2006).
Therefore, normal expression of R-Spondin1 will result in the repression of SOX9 which
will lead to the proper development of the female gonads. These human studies are
consistent with our earlier supposition that Ahr-dependent increased expression of R-
Spondin1 directly leads to decreased expression of Sox9b. Moreover, SOX9 is also
reported to be a Wnt target gene (Blache et al., 2004; Hill et al., 2005; Yano et al., 2005)
and hence we propose that the reduced level of Sox9b is caused by the inappropriate
induction of R-Spondin1. In addition to the fact that SOX9 is a Wnt target gene and
regulated by R-Spondin1, SOX9 is a transcription factor as well as a master regulator that
controls chondrogenesis and extracellular matrix composition (ECM) (Akiyama Ddagger
et al., 2005; Bi et al., 1999; Goldring et al., 2006; Lefebvre et al., 1997; Mori-Akiyama et
al., 2003; Murakami et al., 2000; Tsuchiya et al., 2003). Also, sox9b expression in the
basal epidermal cell layer of the distal part of the adult regenerating fin tissue has been
previously reported (Smith et al., 2006). However, sox9b mutants regenerated their fin
tissue with defective chondrogenesis, suggesting that mis-expression of sox9b which is a
regulator of ECM production or cell differentiation could explain the TCDD-dependent
changes in ECM transcript abundance and the observed pathology.
In addition to our report of improper activation of Wnt signaling by Ahr
activation, other studies have demonstrated the interference of AHR with other
developmental signaling pathways. AHR influences TGF-β signaling members in a
ligand dependent or independent manner (Chang et al., 2007; Puga et al., 2005; Thomae
62
et al., 2005). A recent report has illustrated the ligand independent role of AHR in
reversing the proliferative and gene expression phenotype of Ahr-/- fibroblasts by
inhibiting TGF-β signaling (Chang et al., 2007). Also, another in vitro study has
demonstrated that addition of TGFbeta3 into the palate culture model completely
prevented the TCDD-mediated block of palatal fusion (Thomae et al., 2005). However,
our report is the first to demonstrate the complete reversal of an adverse in vivo outcome
of Ahr activation by modulating the expression of a single gene and categorically
establish the functional crosstalk between Ahr and Wnt signaling pathways (Figure 9). It
is noteworthy to mention that mis-regulation of Wnt signaling causes a wide variety of
adverse effects such as developmental defects and cancer and these new findings put
forward the potential role of environmental AHR ligands in the etiology of different
disease conditions. Also, these results demonstrate the absolute requirement of a fine
balance of Wnt signaling for the process of epimorphic regeneration (Figure 9).
Altogether, our studies demonstrate the power of the zebrafish model to dissect the
mechanisms that underlie the in vivo responses to environmental exposures.
63
References
Akimenko MA, Mari-Beffa M, Becerra J and Geraudie J (2003) Old questions, new tools, and some answers to the mystery of fin regeneration. Dev Dyn 226(2):190-201.
Akiyama Ddagger H, Kim Ddagger JE, Nakashima K, Balmes G, Iwai N, Deng JM, Zhang Z, Martin JF, Behringer RR, Nakamura T and de Crombrugghe B (2005) Osteo-chondroprogenitor cells are derived from Sox9 expressing precursors. Proc Natl Acad Sci U S A 102(41):14665-14670.
Akiyama H, Chaboissier MC, Martin JF, Schedl A and de Crombrugghe B (2002) The transcription factor Sox9 has essential roles in successive steps of the chondrocyte differentiation pathway and is required for expression of Sox5 and Sox6. Genes Dev 16(21):2813-2828.
Andreasen EA, Mathew LK, Lohr CV, Hasson R and Tanguay RL (2007) Aryl hydrocarbon receptor activation impairs extracellular matrix remodeling during zebra fish fin regeneration. Toxicol Sci 95(1):215-226.
Andreasen EA, Mathew LK and Tanguay RL (2006) Regenerative Growth is Impacted by TCDD: Gene Expression Analysis Reveals Extracellular Matrix Modulation. Toxicol Sci 92(1):254-269.
Bi W, Deng JM, Zhang Z, Behringer RR and de Crombrugghe B (1999) Sox9 is required for cartilage formation. Nat Genet 22(1):85-89.
Binnerts ME, Kim KA, Bright JM, Patel SM, Tran K, Zhou M, Leung JM, Liu Y, Lomas WE, 3rd, Dixon M, Hazell SA, Wagle M, Nie WS, Tomasevic N, Williams J, Zhan X, Levy MD, Funk WD and Abo A (2007) R-Spondin1 regulates Wnt signaling by inhibiting internalization of LRP6. Proc Natl Acad Sci U S A.
Blache P, van de Wetering M, Duluc I, Domon C, Berta P, Freund JN, Clevers H and Jay P (2004) SOX9 is an intestine crypt transcription factor, is regulated by the Wnt pathway, and represses the CDX2 and MUC2 genes. J Cell Biol 166(1):37-47.
Blaydon DC, Ishii Y, O'Toole E A, Unsworth HC, Teh MT, Ruschendorf F, Sinclair C, Hopsu-Havu VK, Tidman N, Moss C, Watson R, de Berker D, Wajid M, Christiano AM and Kelsell DP (2006) The gene encoding R-spondin 4 (RSPO4), a secreted protein implicated in Wnt signaling, is mutated in inherited anonychia. Nat Genet.
Brack AS, Conboy MJ, Roy S, Lee M, Kuo CJ, Keller C and Rando TA (2007) Increased Wnt signaling during aging alters muscle stem cell fate and increases fibrosis. Science 317(5839):807-810.
Burbach KM, Poland A and Bradfield CA (1992) Cloning of the Ah-receptor cDNA reveals a distinctive ligand-activated transcription factor. Proc Natl Acad Sci U S A 89(17):8185-8189.
Chang X, Fan Y, Karyala S, Schwemberger S, Tomlinson CR, Sartor MA and Puga A (2007) Ligand-independent regulation of transforming growth factor beta1 expression and cell cycle progression by the aryl hydrocarbon receptor. Mol Cell Biol 27(17):6127-6139.
64
Day TF, Guo X, Garrett-Beal L and Yang Y (2005) Wnt/beta-catenin signaling in mesenchymal progenitors controls osteoblast and chondrocyte differentiation during vertebrate skeletogenesis. Dev Cell 8(5):739-750.
Goldring MB, Tsuchimochi K and Ijiri K (2006) The control of chondrogenesis. J Cell Biochem 97(1):33-44.
Hankinson O (1994) The role of the aryl hydrocarbon nuclear receptor protein in aryl hydrocarbon receptor action. TEM 5(6):240-244.
Henry EC and Gasiewicz TA (1993) Transformation of the aryl hydrocarbon receptor to a DNA-binding form is accompanied by release of the 90 kDa heat-shock protein and increased affinity for 2,3,7,8-tetrachlorodibenzo-p-dioxin. Biochem J 294(Pt 1):95-101.
Hill TP, Spater D, Taketo MM, Birchmeier W and Hartmann C (2005) Canonical Wnt/beta-catenin signaling prevents osteoblasts from differentiating into chondrocytes. Dev Cell 8(5):727-738.
Kamata T, Katsube K, Michikawa M, Yamada M, Takada S and Mizusawa H (2004) R-spondin, a novel gene with thrombospondin type 1 domain, was expressed in the dorsal neural tube and affected in Wnts mutants. Biochim Biophys Acta 1676(1):51-62.
Kawakami A, Fukazawa T and Takeda H (2004) Early fin primordia of zebrafish larvae regenerate by a similar growth control mechanism with adult regeneration. Dev Dyn 231(4):693-699.
Kazanskaya O, Glinka A, del Barco Barrantes I, Stannek P, Niehrs C and Wu W (2004) R-Spondin2 is a secreted activator of Wnt/beta-catenin signaling and is required for Xenopus myogenesis. Dev Cell 7(4):525-534.
Kim KA, Zhao J, Andarmani S, Kakitani M, Oshima T, Binnerts ME, Abo A, Tomizuka K and Funk WD (2006) R-Spondin proteins: a novel link to beta-catenin activation. Cell Cycle 5(1):23-26.
Kirstetter P, Anderson K, Porse BT, Jacobsen SE and Nerlov C (2006) Activation of the canonical Wnt pathway leads to loss of hematopoietic stem cell repopulation and multilineage differentiation block. Nat Immunol 7(10):1048-1056.
Lefebvre V, Huang W, Harley VR, Goodfellow PN and de Crombrugghe B (1997) SOX9 is a potent activator of the chondrocyte-specific enhancer of the pro alpha1(II) collagen gene. Mol Cell Biol 17(4):2336-2346.
Mari-Beffa M, Mateos I, Palmqvist P and Becerra J (1996) Cell to cell interactions during teleosts fin regeneration. Int J Dev Biol Suppl 1:179S-180S.
Mathew LK, Andreasen EA and Tanguay RL (2006) Aryl hydrocarbon receptor activation inhibits regenerative growth. Mol Pharmacol 69(1):257-265.
Meijer L, Skaltsounis AL, Magiatis P, Polychronopoulos P, Knockaert M, Leost M, Ryan XP, Vonica CA, Brivanlou A, Dajani R, Crovace C, Tarricone C, Musacchio A, Roe SM, Pearl L and Greengard P (2003) GSK-3-selective inhibitors derived from Tyrian purple indirubins. Chem Biol 10(12):1255-1266.
Mescher AL (1996) The cellular basis of limb regeneration in urodeles. Int J Dev Biol 40(4):785-795.
Mitchell KA, Lockhart CA, Huang G and Elferink CJ (2006) Sustained aryl hydrocarbon receptor activity attenuates liver regeneration. Mol Pharmacol 70(1):163-170.
65
Mori-Akiyama Y, Akiyama H, Rowitch DH and de Crombrugghe B (2003) Sox9 is required for determination of the chondrogenic cell lineage in the cranial neural crest. Proc Natl Acad Sci U S A 100(16):9360-9365.
Murakami S, Lefebvre V and de Crombrugghe B (2000) Potent inhibition of the master chondrogenic factor Sox9 gene by interleukin-1 and tumor necrosis factor-alpha. J Biol Chem 275(5):3687-3692.
Nakatani Y, Kawakami A and Kudo A (2007) Cellular and molecular processes of regeneration, with special emphasis on fish fins. Dev Growth Differ 49(2):145-154.
Nam JS, Turcotte TJ, Smith PF, Choi S and Yoon JK (2006) Mouse cristin/R-spondin family proteins are novel ligands for the Frizzled 8 and LRP6 receptors and activate beta-catenin-dependent gene expression. J Biol Chem 281(19):13247-13257.
Nasevicius A and Ekker SC (2000) Effective targeted gene 'knockdown' in zebrafish. Nat Genet 26(2):216-220.
Parma P, Radi O, Vidal V, Chaboissier MC, Dellambra E, Valentini S, Guerra L, Schedl A and Camerino G (2006) R-spondin1 is essential in sex determination, skin differentiation and malignancy. Nat Genet.
Poss KD, Shen J and Keating MT (2000a) Induction of lef1 during zebrafish fin regeneration. Dev Dyn 219(2):282-286.
Poss KD, Shen J, Nechiporuk A, McMahon G, Thisse B, Thisse C and Keating MT (2000b) Roles for Fgf signaling during zebrafish fin regeneration. Dev Biol 222(2):347-358.
Puga A, Tomlinson CR and Xia Y (2005) Ah receptor signals cross-talk with multiple developmental pathways. Biochem Pharmacol 69(2):199-207.
Santamaria JA and Becerra J (1991) Tail fin regeneration in teleosts: cell-extracellular matrix interaction in blastemal differentiation. J Anat 176:9-21.
Santamaria JA, Mari-Beffa M, Santos-Ruiz L and Becerra J (1996) Incorporation of bromodeoxyuridine in regenerating fin tissue of the goldfish Carassius auratus. J Exp Zool 275(4):300-307.
Santos-Ruiz L, Santamaria JA, Ruiz-Sanchez J and Becerra J (2002) Cell proliferation during blastema formation in the regenerating teleost fin. Dev Dyn 223(2):262-272.
Sato N, Meijer L, Skaltsounis L, Greengard P and Brivanlou AH (2004) Maintenance of pluripotency in human and mouse embryonic stem cells through activation of Wnt signaling by a pharmacological GSK-3-specific inhibitor. Nat Med 10(1):55-63.
Scheller M, Huelsken J, Rosenbauer F, Taketo MM, Birchmeier W, Tenen DG and Leutz A (2006) Hematopoietic stem cell and multilineage defects generated by constitutive beta-catenin activation. Nat Immunol 7(10):1037-1047.
Schier AF, Neuhauss SC, Helde KA, Talbot WS and Driever W (1997) The one-eyed pinhead gene functions in mesoderm and endoderm formation in zebrafish and interacts with no tail. Development 124(2):327-342.
Schmidt JV and Bradfield CA (1996) Ah receptor signaling pathways. Ann Rev Cell Dev Biol 12:55-89.
66
Smith A, Avaron F, Guay D, Padhi BK and Akimenko MA (2006) Inhibition of BMP signaling during zebrafish fin regeneration disrupts fin growth and scleroblasts differentiation and function. Dev Biol 299(2):438-454.
Stoick-Cooper CL, Weidinger G, Riehle KJ, Hubbert C, Major MB, Fausto N and Moon RT (2007) Distinct Wnt signaling pathways have opposing roles in appendage regeneration. Development 134(3):479-489.
Thomae TL, Stevens EA and Bradfield CA (2005) Transforming growth factor-beta3 restores fusion in palatal shelves exposed to 2,3,7,8-tetrachlorodibenzo-p-dioxin. J Biol Chem 280(13):12742-12746.
Tseng AS, Engel FB and Keating MT (2006) The GSK-3 inhibitor BIO promotes proliferation in mammalian cardiomyocytes. Chem Biol 13(9):957-963.
Tsuchiya H, Kitoh H, Sugiura F and Ishiguro N (2003) Chondrogenesis enhanced by overexpression of sox9 gene in mouse bone marrow-derived mesenchymal stem cells. Biochem Biophys Res Commun 301(2):338-343.
Wei Q, Yokota C, Semenov MV, Doble B, Woodgett J and He X (2007) R-spondin1 is a high affinity ligand for LRP6 and induces LRP6 phosphorylation and beta-catenin signaling. J Biol Chem 282(21):15903-15911.
Westerfield, M. (1995) The Zebrafish Book. University of Oregon Press, Eugene, OR. Whitehead GG, Makino S, Lien CL and Keating MT (2005) fgf20 is essential for
initiating zebrafish fin regeneration. Science 310(5756):1957-1960. Yano F, Kugimiya F, Ohba S, Ikeda T, Chikuda H, Ogasawara T, Ogata N, Takato T,
Nakamura K, Kawaguchi H and Chung UI (2005) The canonical Wnt signaling pathway promotes chondrocyte differentiation in a Sox9-dependent manner. Biochem Biophys Res Commun 333(4):1300-1308.
Zhong N, Gersch RP and Hadjiargyrou M (2006) Wnt signaling activation during bone regeneration and the role of Dishevelled in chondrocyte proliferation and differentiation. Bone.
Zodrow JM and Tanguay RL (2003) 2,3,7,8-tetrachlorodibenzo-p-dioxin inhibits zebrafish caudal fin regeneration. Toxicol Sci 76(1):151-161.
67
Acknowledgements
We would like to thank Anne-Marie Girard from the Center for Gene Research and
Biotechnology at Oregon State University for her valuable assistance. We also would like
to thank Dr. John H. Postlethwait (University of Oregon, Eugene, OR) for the sox9b
mutant zebrafish line. This work was supported in part by NIEHS grants ES10820,
ES00210, and ES03850, Oregon Medical Research Foundation grant and predoctoral
fellowship from American Heart Association (LKM).
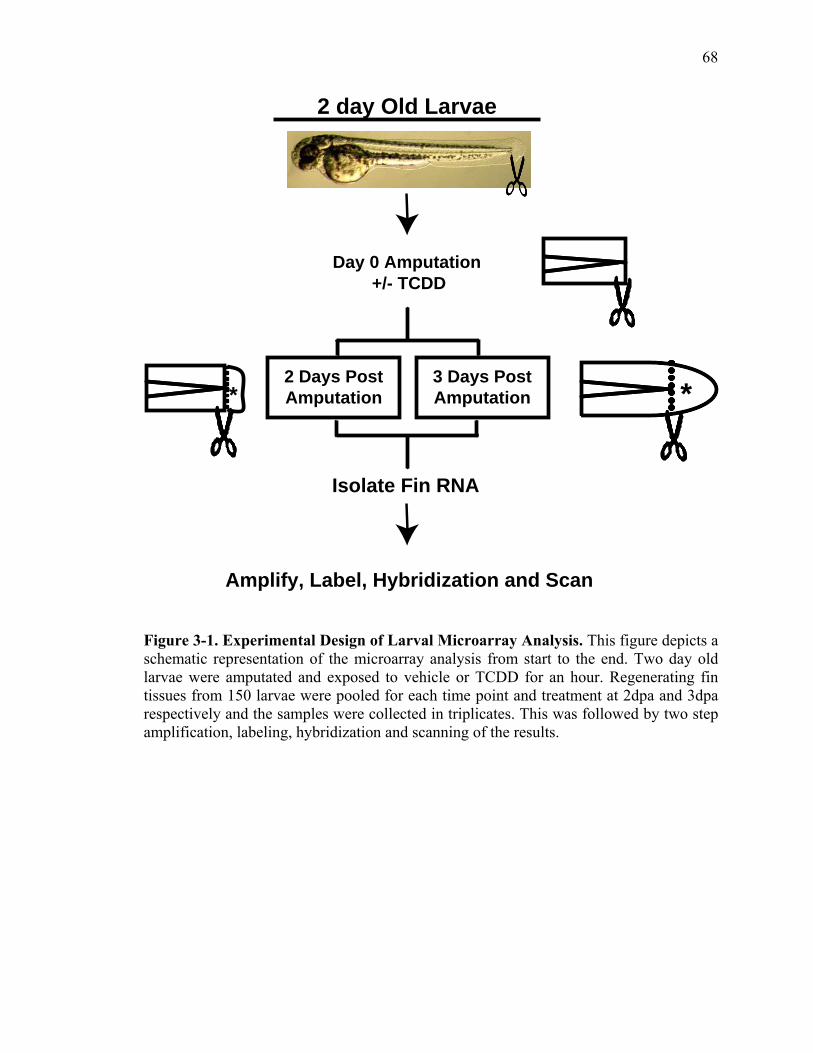
68
Isolate Fin RNA
Amplify, Label, Hybridization and Scan
Day 0 Amputation+/- TCDD
2 Days PostAmputation
3 Days PostAmputation
2 day Old Larvae
**
Figure 3-1. Experimental Design of Larval Microarray Analysis. This figure depicts a schematic representation of the microarray analysis from start to the end. Two day old larvae were amputated and exposed to vehicle or TCDD for an hour. Regenerating fin tissues from 150 larvae were pooled for each time point and treatment at 2dpa and 3dpa respectively and the samples were collected in triplicates. This was followed by two step amplification, labeling, hybridization and scanning of the results.
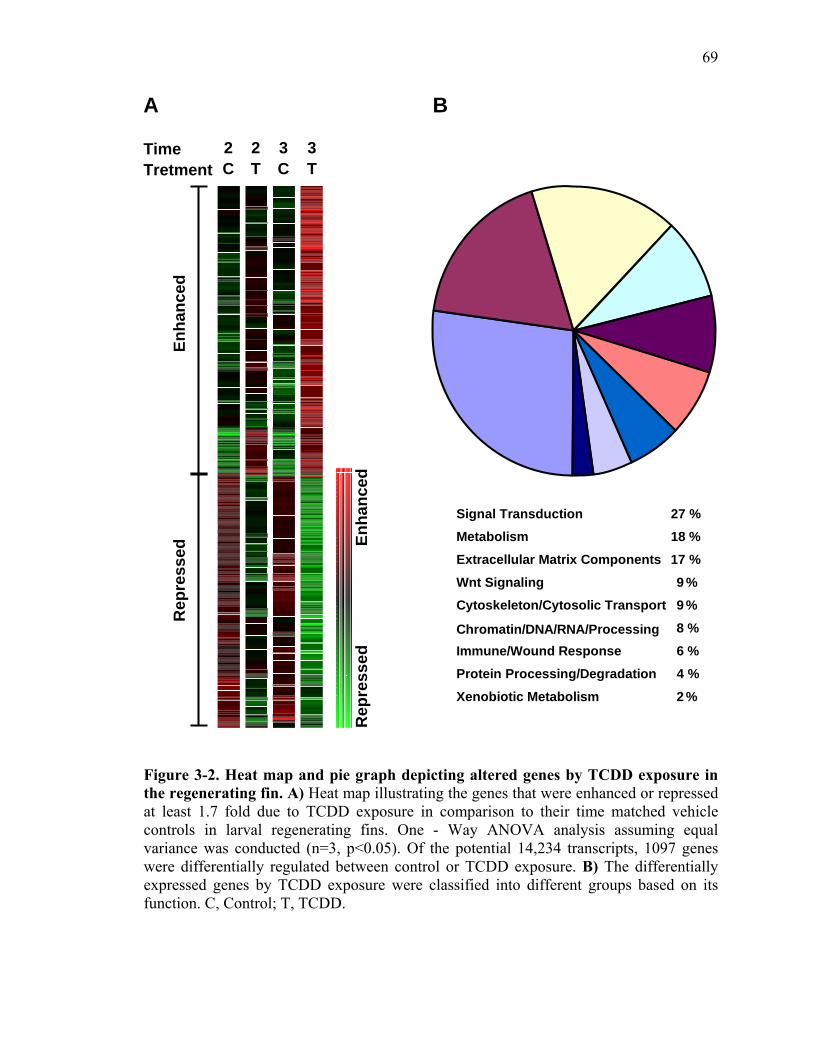
69
Signal Transduction 27 %Metabolism 18 %
Extracellular Matrix Components 17 %
Wnt Signaling 9 %Cytoskeleton/Cytosolic Transport 9 %
Chromatin/DNA/RNA/Processing 8 %
Immune/Wound Response 6 %
Protein Processing/Degradation 4 %
Xenobiotic Metabolism 2 %
Time 2C
2T
3C
3T
Rep
ress
edEn
hanc
ed
Rep
ress
edEn
hanc
ed
Tretment
A B
Figure 3-2. Heat map and pie graph depicting altered genes by TCDD exposure in the regenerating fin. A) Heat map illustrating the genes that were enhanced or repressed at least 1.7 fold due to TCDD exposure in comparison to their time matched vehicle controls in larval regenerating fins. One - Way ANOVA analysis assuming equal variance was conducted (n=3, p<0.05). Of the potential 14,234 transcripts, 1097 genes were differentially regulated between control or TCDD exposure. B) The differentially expressed genes by TCDD exposure were classified into different groups based on its function. C, Control; T, TCDD.

70
Figure 3-3. Validation of TCDD modulated genes by qRT-PCR in the larval regenerating fin tissue. Gene specific primers were used to quantify the differentially expressed genes using quantitative real-time PCR. The expression pattern of selected A) induced genes and B) repressed genes were analyzed by qRT-PCR. Not-amputated refers to time matched larval fins that were not amputated until tissue was collected for mRNA isolation. The abundance of each transcript levels were normalized to β-actin expression. One-was ANOVA analyses were performed separately to determine differences in the expression between amputation state and also if there was an effect of TCDD exposure during regeneration. Each bar represents the mean +/- SEM (n =3). If differences were detected, they were followed by Tukeys test. Asterisk (*) indicates significant difference at the same time in regeneration between vehicle (control) and TCDD exposed larvae (p<0.05). Letters (a, b) signify a difference between time matched uncut fins (not-amputated) and vehicle exposed fins (p<0.05).
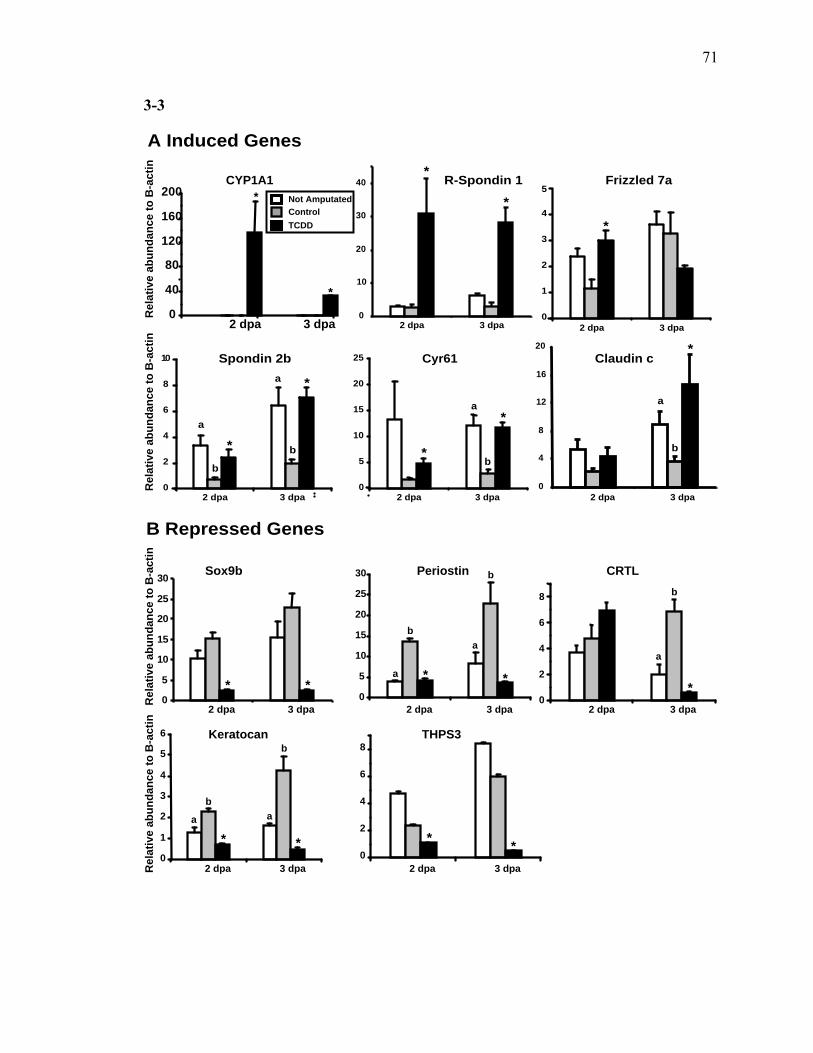
71
3-3
2 dpa 3 dpa0
1
2
3
4
5
*
Frizzled 7aNot AmputatedControlTCDD
CYP1A1
*
0
40
80
120
160
200 *
2 dpa 3 dpa
Rel
ativ
e ab
unda
nce
to B
-act
in
R-Spondin 1
0
10
20
30
40
*
*
2 dpa 3 dpa
Spondin 2b
0
2
4
6
8
10
2 dpa 3 dpa
*
*
a
b
a
b
Rel
ativ
e ab
unda
nce
to B
-act
in
Cyr6125
a
2 dpa 3 dpa
*
*b
0
5
10
15
20
Claudin c
0
4
8
12
16
20
2 dpa 3 dpa
a
b
*
A Induced Genes
B Repressed Genes
Keratocan
0
1
2
3
4
5
6
2 dpa 3 dpa
* *
a
b
a
b
2 dpa 3 dpa0
5
10
15
20
25
30
a
b
*
a
b
*
PeriostinSox9b
2 dpa 3 dpa0
5
10
15
20
25
30
* *
2 dpa 3 dpa0
2
4
6
8
*
a
b
CRTL
THPS3
0
2
4
6
8
2 dpa 3 dpa
**
Rel
ativ
e ab
unda
nce
to B
-act
inR
elat
ive
abun
danc
e to
B-a
ctin
72
Figure 3-4. Partial antisense repression of R-Spondin1 restores the regenerative ability in the presence of TCDD. A) The bold line at the intron-exon (I1-E2) boundary indicates the gene sequence targeted with the R-Spondin1 splice variant MO. To analyze the splice blocking efficiency, forward and reverse primers (arrows at E1 and E3) were designed for RT-PCR. The splice variant MO should result in the loss of E2 to get a smaller misspliced PCR product. B) Control and zf R-Spondin1 morphants were amputated at 2dpf and exposed to vehicle or TCDD. The fin regeneration images were taken at 3 dpa. Dotted line marks the plane of amputation. C) Analysis of R-Spondin1 transcript in control and R-Spondin1 morphants (3 days post fertilization) after qRT-PCR, followed by agarose gel electrophoresis (2%). The lower arrow points to the mispliced R-Spondin1 variant after the loss of the targeted exon. β-actin expression was used as the loading control.
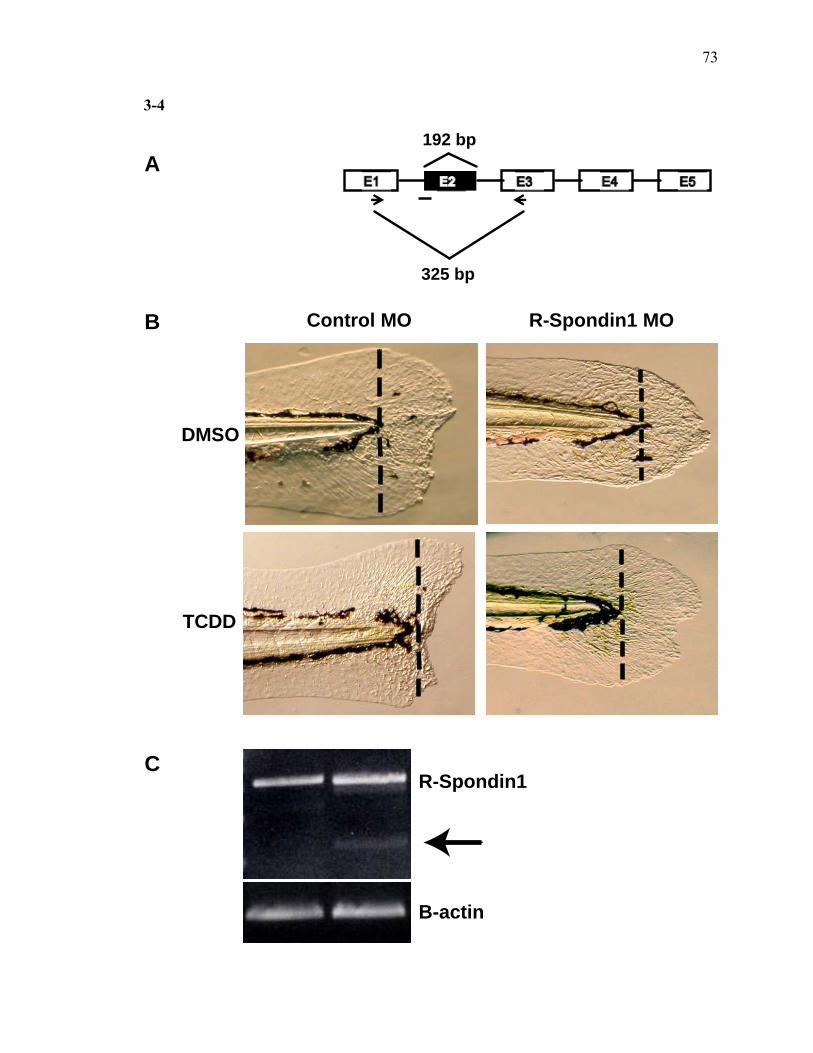
73
3-4
Control MO R-Spondin1 MO
DMSO
TCDD
A
325 bp
192 bp
B
CR-Spondin1
B-actin
74
Figure 3-5. LRP6 is required for TCDD to mediate inhibition of regeneration. A) A splice junction MO was designed to target LRP6 at the intron-exon (E3-I3) and the bold line depicts the targeted sequence. The splice variant MO should result in the loss of E3 to get a smaller misspliced PCR product. B) The control and zf LRP6 morphants were amputated at 2dpf and exposed to vehicle or TCDD. The fin regeneration images were acquired at 3 dpa and the dotted line marks the plane of amputation. C) The splice blocking efficiency was analyzed by RT-PCR with specific forward and reverse primers. The analysis of LRP6 transcript in control and LRP6 morphants (3 days post fertilization) was performed with RT-PCR, followed by agarose gel electrophoresis (2%).Eventhough non-quantitative, a clear reduction of the LRP6 primary transcript was found in the LRP6 morphants. The lower arrow points to the mispliced LRP6 variant after the loss of the targeted exon. β-actin expression was used as the loading control.
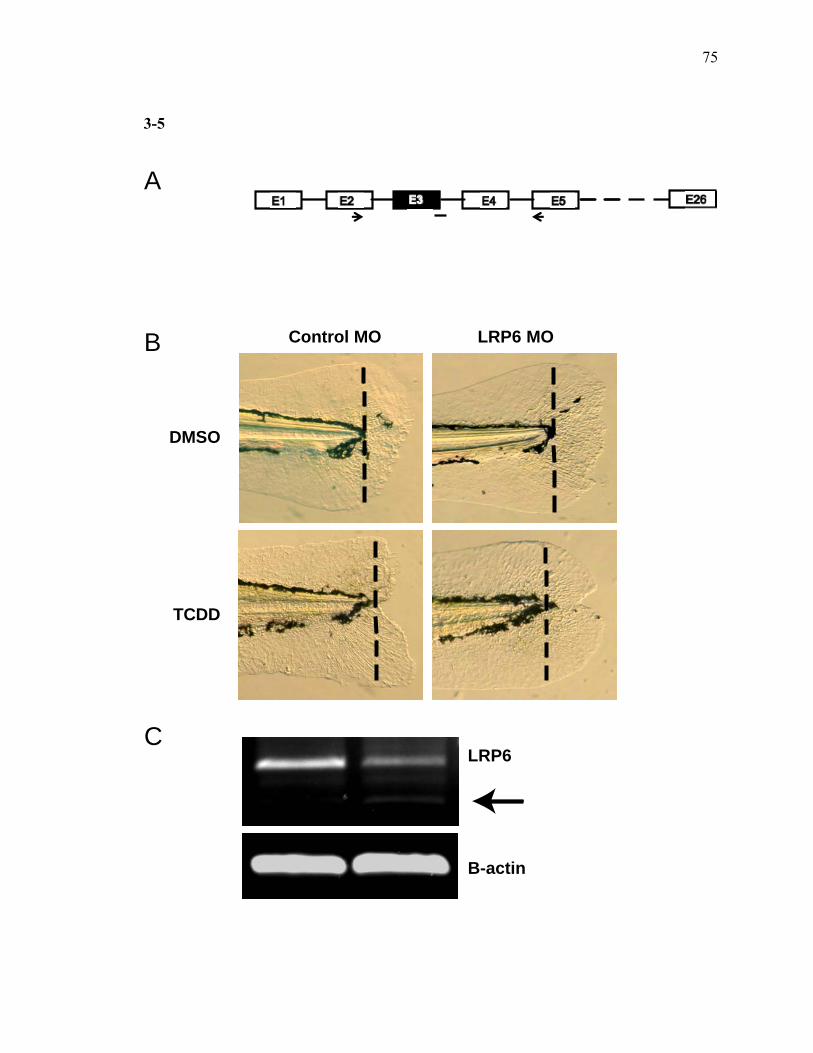
75
3-5
Control MO LRP6 MO
DMSO
TCDD
A
B
CLRP6
B-actin

76
Figure 3-6. GSK3 inhibitor BIO impairs regeneration. A) Two day old larvae were amputated and exposed to vehicle or BIO (6-bromoindirubin-3'-oxime)(GSK3 inhibitor) continuously. The images depicted here are representative images acquired at 3 dpa. B) In situ hybridization with dlx5a, msxe and raldh2 was performed to analyze the integrity of wound healing and blastema formation after exposure to TCDD and BIO at 1dpa. The images are representative of multiple experiments and more than 25 images per treatment.
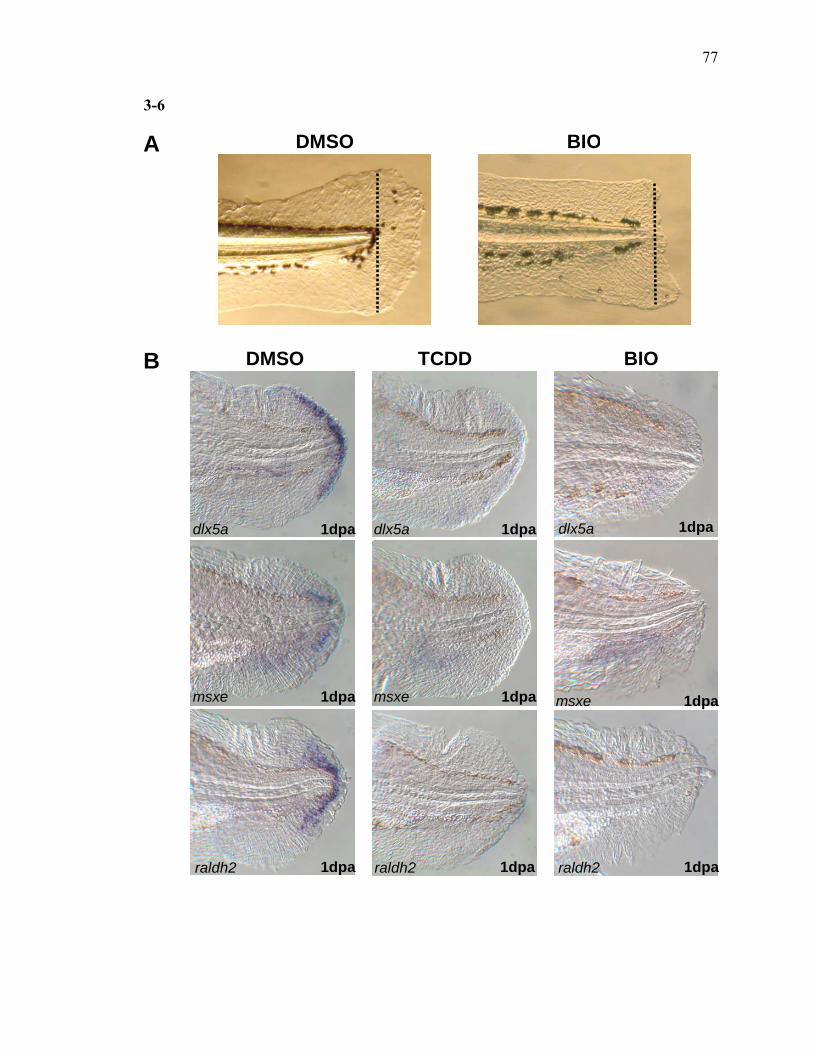
77
3-6
DMSO BIOA
B
1dparaldh2
DMSO TCDD BIO
1dpa
1dpa1dpa
1dpadlx5a dlx5a
msxe msxe
dlx5a 1dpa
1dpamsxe
raldh2 1dpa raldh2 1dpa raldh2 1dpa
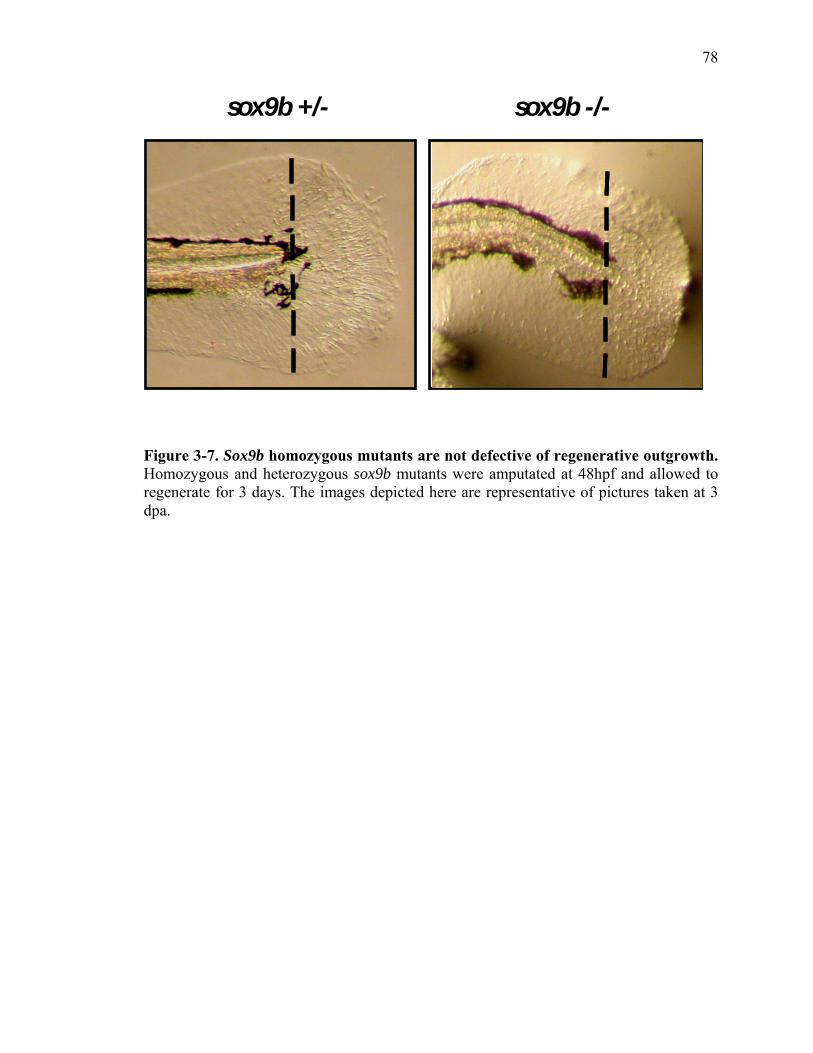
78
sox9b -/-sox9b +/-
Figure 3-7. Sox9b homozygous mutants are not defective of regenerative outgrowth. Homozygous and heterozygous sox9b mutants were amputated at 48hpf and allowed to regenerate for 3 days. The images depicted here are representative of pictures taken at 3 dpa.
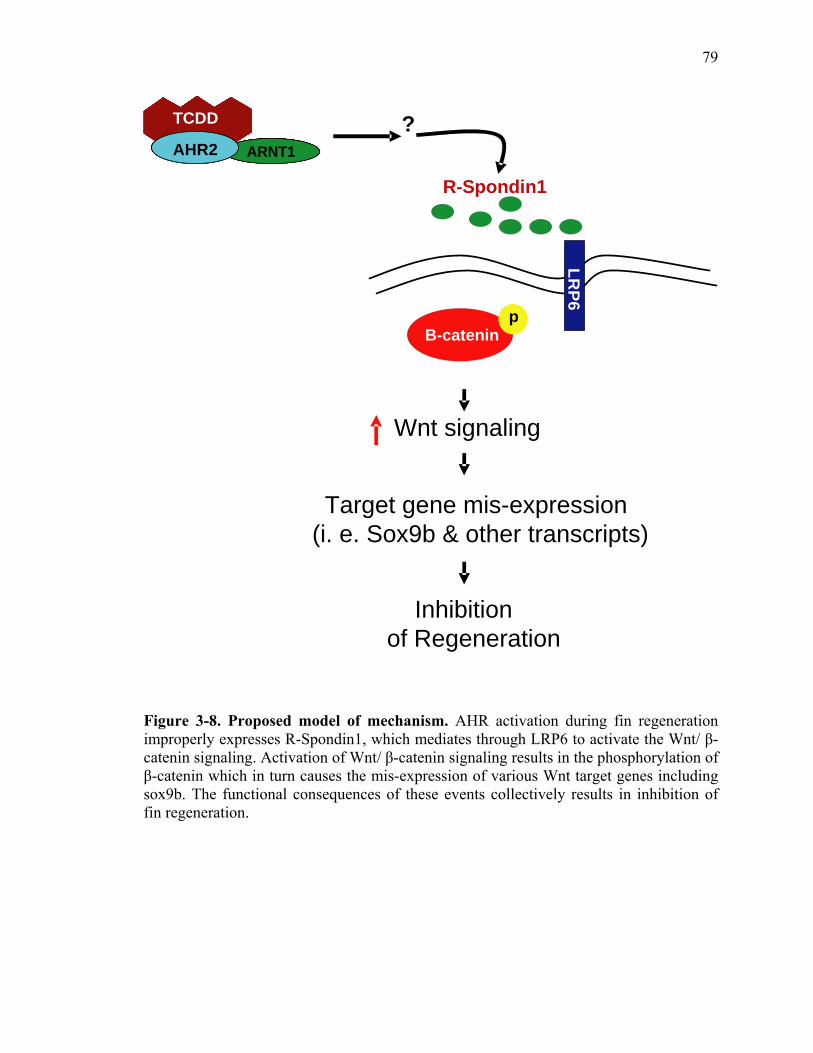
79
TCDD
AHR2 ARNT1
TCDD
AHR2 ARNT1
TCDD
AHR2 ARNT1
TCDD
AHR2 ARNT1
B-catenin
R-Spondin1
?
LRP6
Wnt signaling
Inhibition of Regeneration
p
Target gene mis-expression(i. e. Sox9b & other transcripts)
Figure 3-8. Proposed model of mechanism. AHR activation during fin regeneration improperly expresses R-Spondin1, which mediates through LRP6 to activate the Wnt/ β-catenin signaling. Activation of Wnt/ β-catenin signaling results in the phosphorylation of β-catenin which in turn causes the mis-expression of various Wnt target genes including sox9b. The functional consequences of these events collectively results in inhibition of fin regeneration.
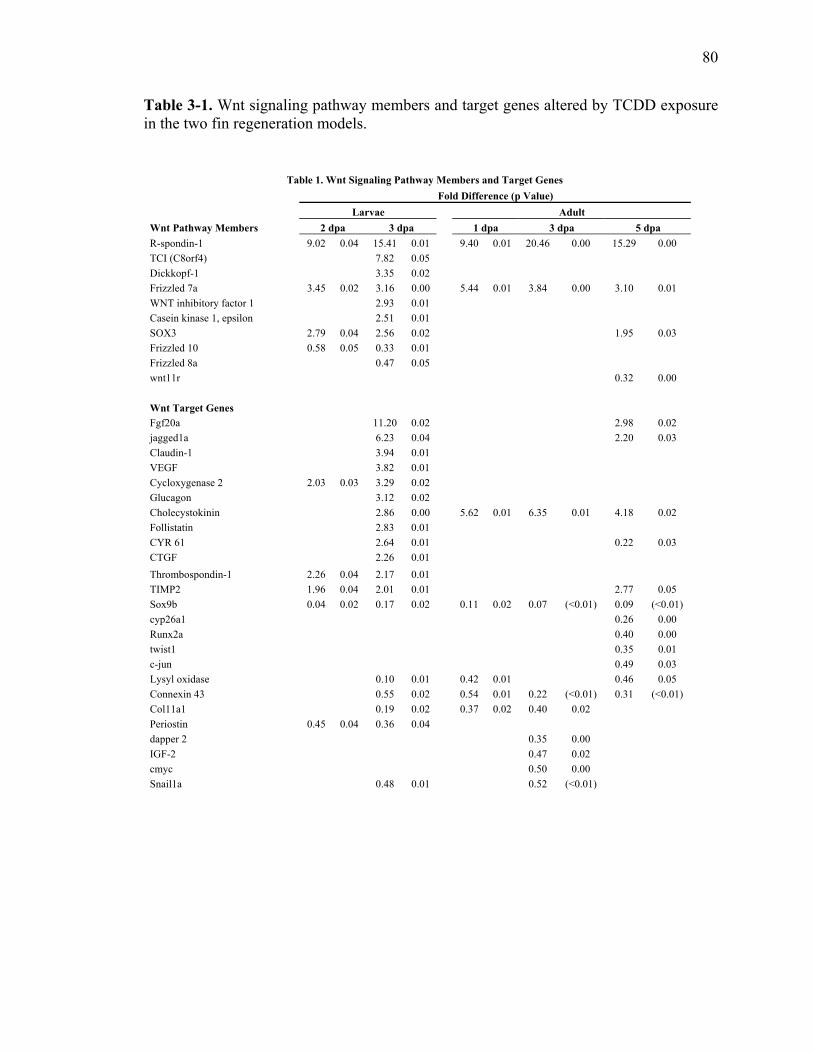
80
Table 3-1. Wnt signaling pathway members and target genes altered by TCDD exposure in the two fin regeneration models.
Table 1. Wnt Signaling Pathway Members and Target Genes Fold Difference (p Value) Larvae Adult Wnt Pathway Members 2 dpa 3 dpa 1 dpa 3 dpa 5 dpa R-spondin-1 9.02 0.04 15.41 0.01 9.40 0.01 20.46 0.00 15.29 0.00 TCI (C8orf4) 7.82 0.05 Dickkopf-1 3.35 0.02 Frizzled 7a 3.45 0.02 3.16 0.00 5.44 0.01 3.84 0.00 3.10 0.01 WNT inhibitory factor 1 2.93 0.01 Casein kinase 1, epsilon 2.51 0.01 SOX3 2.79 0.04 2.56 0.02 1.95 0.03 Frizzled 10 0.58 0.05 0.33 0.01 Frizzled 8a 0.47 0.05 wnt11r 0.32 0.00 Wnt Target Genes Fgf20a 11.20 0.02 2.98 0.02 jagged1a 6.23 0.04 2.20 0.03 Claudin-1 3.94 0.01 VEGF 3.82 0.01 Cycloxygenase 2 2.03 0.03 3.29 0.02 Glucagon 3.12 0.02 Cholecystokinin 2.86 0.00 5.62 0.01 6.35 0.01 4.18 0.02 Follistatin 2.83 0.01 CYR 61 2.64 0.01 0.22 0.03 CTGF 2.26 0.01 Thrombospondin-1 2.26 0.04 2.17 0.01 TIMP2 1.96 0.04 2.01 0.01 2.77 0.05 Sox9b 0.04 0.02 0.17 0.02 0.11 0.02 0.07 (<0.01) 0.09 (<0.01) cyp26a1 0.26 0.00 Runx2a 0.40 0.00 twist1 0.35 0.01 c-jun 0.49 0.03 Lysyl oxidase 0.10 0.01 0.42 0.01 0.46 0.05 Connexin 43 0.55 0.02 0.54 0.01 0.22 (<0.01) 0.31 (<0.01) Col11a1 0.19 0.02 0.37 0.02 0.40 0.02 Periostin 0.45 0.04 0.36 0.04 dapper 2 0.35 0.00 IGF-2 0.47 0.02 cmyc 0.50 0.00 Snail1a 0.48 0.01 0.52 (<0.01)
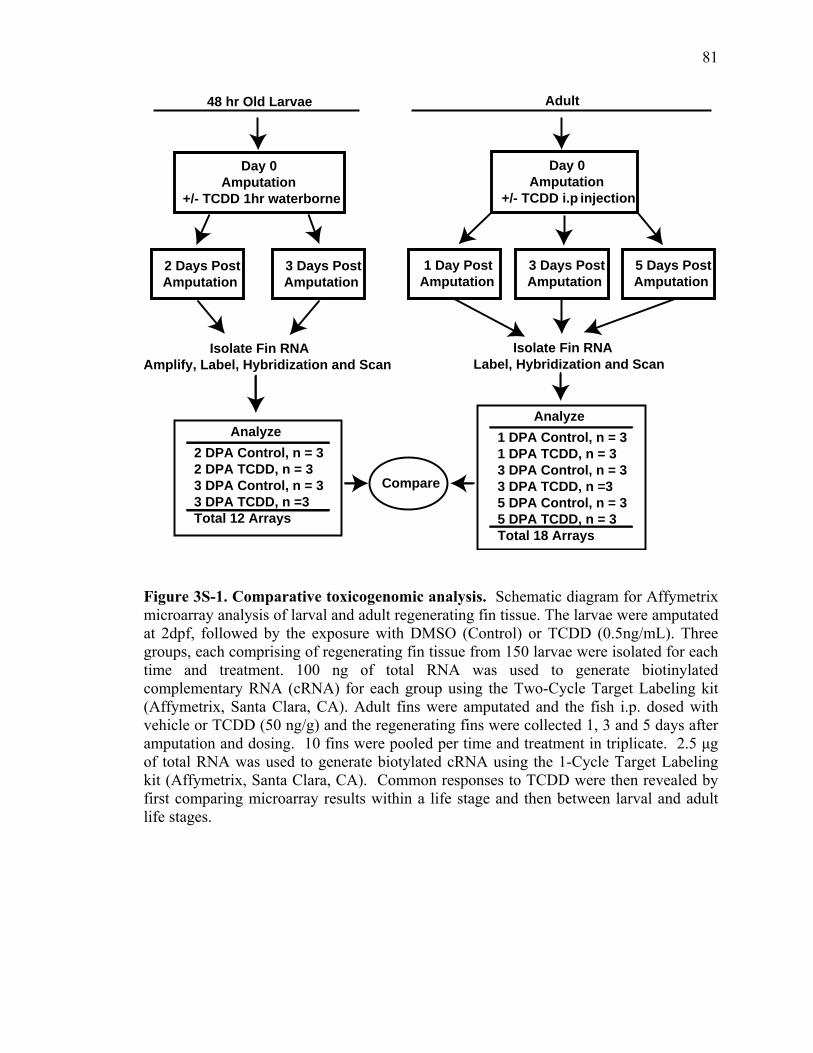
81
Isolate Fin RNAAmplify, Label, Hybridization and Scan
3 Days PostAmputation
2 Days PostAmputation
Day 0Amputation
+/- TCDD 1hr waterborne
48 hr Old Larvae
2 DPA Control, n = 32 DPA TCDD, n = 33 DPA Control, n = 33 DPA TCDD, n =3Total 12 Arrays
Analyze
Day 0Amputation
+/- TCDD i.p injection
5 Days PostAmputation
3 Days PostAmputation
1 Day PostAmputation
Isolate Fin RNALabel, Hybridization and Scan
Adult
1 DPA Control, n = 31 DPA TCDD, n = 33 DPA Control, n = 33 DPA TCDD, n =35 DPA Control, n = 35 DPA TCDD, n = 3Total 18 Arrays
Analyze
Compare
Figure 3S-1. Comparative toxicogenomic analysis. Schematic diagram for Affymetrix microarray analysis of larval and adult regenerating fin tissue. The larvae were amputated at 2dpf, followed by the exposure with DMSO (Control) or TCDD (0.5ng/mL). Three groups, each comprising of regenerating fin tissue from 150 larvae were isolated for each time and treatment. 100 ng of total RNA was used to generate biotinylated complementary RNA (cRNA) for each group using the Two-Cycle Target Labeling kit (Affymetrix, Santa Clara, CA). Adult fins were amputated and the fish i.p. dosed with vehicle or TCDD (50 ng/g) and the regenerating fins were collected 1, 3 and 5 days after amputation and dosing. 10 fins were pooled per time and treatment in triplicate. 2.5 μg of total RNA was used to generate biotylated cRNA using the 1-Cycle Target Labeling kit (Affymetrix, Santa Clara, CA). Common responses to TCDD were then revealed by first comparing microarray results within a life stage and then between larval and adult life stages.
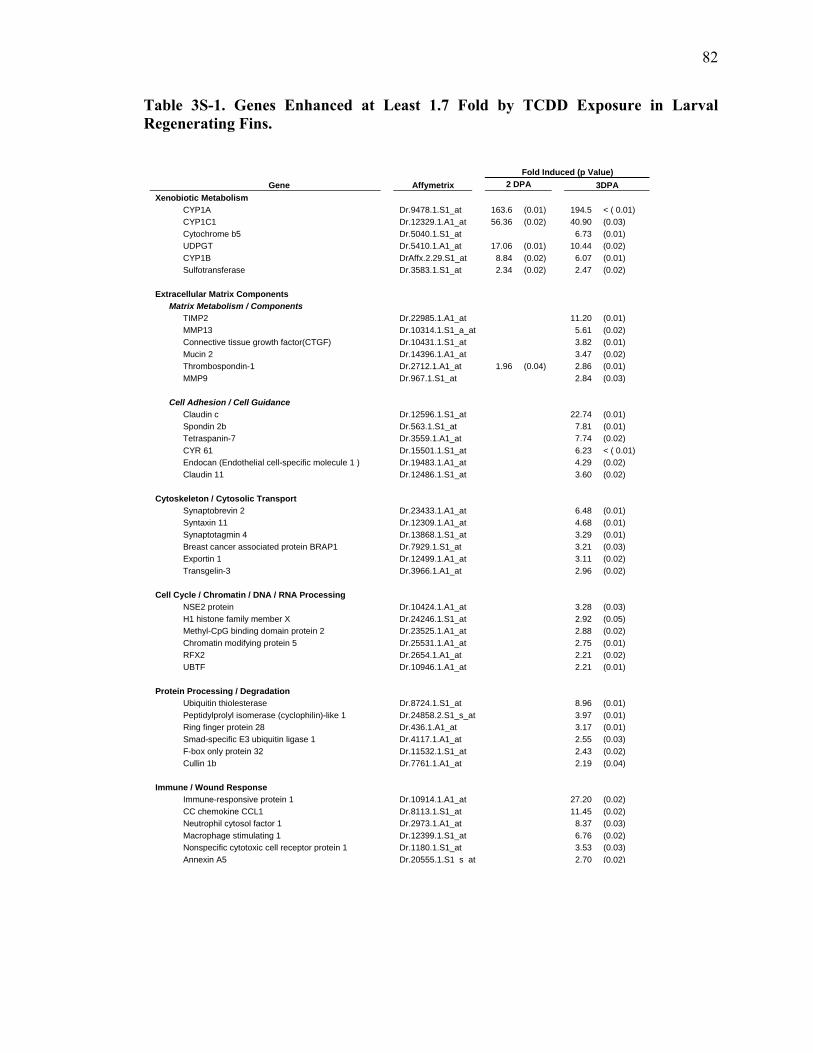
82
Table 3S-1. Genes Enhanced at Least 1.7 Fold by TCDD Exposure in Larval Regenerating Fins.
Fold Induced (p Value) Gene Affymetrix 2 DPA 3DPA Xenobiotic Metabolism CYP1A Dr.9478.1.S1_at 163.6 (0.01) 194.5 < ( 0.01) CYP1C1 Dr.12329.1.A1_at 56.36 (0.02) 40.90 (0.03) Cytochrome b5 Dr.5040.1.S1_at 6.73 (0.01) UDPGT Dr.5410.1.A1_at 17.06 (0.01) 10.44 (0.02) CYP1B DrAffx.2.29.S1_at 8.84 (0.02) 6.07 (0.01) Sulfotransferase Dr.3583.1.S1_at 2.34 (0.02) 2.47 (0.02) Extracellular Matrix Components Matrix Metabolism / Components TIMP2 Dr.22985.1.A1_at 11.20 (0.01) MMP13 Dr.10314.1.S1_a_at 5.61 (0.02) Connective tissue growth factor(CTGF) Dr.10431.1.S1_at 3.82 (0.01) Mucin 2 Dr.14396.1.A1_at 3.47 (0.02) Thrombospondin-1 Dr.2712.1.A1_at 1.96 (0.04) 2.86 (0.01) MMP9 Dr.967.1.S1_at 2.84 (0.03) Cell Adhesion / Cell Guidance Claudin c Dr.12596.1.S1_at 22.74 (0.01) Spondin 2b Dr.563.1.S1_at 7.81 (0.01) Tetraspanin-7 Dr.3559.1.A1_at 7.74 (0.02) CYR 61 Dr.15501.1.S1_at 6.23 < ( 0.01) Endocan (Endothelial cell-specific molecule 1 ) Dr.19483.1.A1_at 4.29 (0.02) Claudin 11 Dr.12486.1.S1_at 3.60 (0.02) Cytoskeleton / Cytosolic Transport Synaptobrevin 2 Dr.23433.1.A1_at 6.48 (0.01) Syntaxin 11 Dr.12309.1.A1_at 4.68 (0.01) Synaptotagmin 4 Dr.13868.1.S1_at 3.29 (0.01) Breast cancer associated protein BRAP1 Dr.7929.1.S1_at 3.21 (0.03) Exportin 1 Dr.12499.1.A1_at 3.11 (0.02) Transgelin-3 Dr.3966.1.A1_at 2.96 (0.02) Cell Cycle / Chromatin / DNA / RNA Processing NSE2 protein Dr.10424.1.A1_at 3.28 (0.03) H1 histone family member X Dr.24246.1.S1_at 2.92 (0.05) Methyl-CpG binding domain protein 2 Dr.23525.1.A1_at 2.88 (0.02) Chromatin modifying protein 5 Dr.25531.1.A1_at 2.75 (0.01) RFX2 Dr.2654.1.A1_at 2.21 (0.02) UBTF Dr.10946.1.A1_at 2.21 (0.01) Protein Processing / Degradation Ubiquitin thiolesterase Dr.8724.1.S1_at 8.96 (0.01) Peptidylprolyl isomerase (cyclophilin)-like 1 Dr.24858.2.S1_s_at 3.97 (0.01) Ring finger protein 28 Dr.436.1.A1_at 3.17 (0.01) Smad-specific E3 ubiquitin ligase 1 Dr.4117.1.A1_at 2.55 (0.03) F-box only protein 32 Dr.11532.1.S1_at 2.43 (0.02) Cullin 1b Dr.7761.1.A1_at 2.19 (0.04) Immune / Wound Response Immune-responsive protein 1 Dr.10914.1.A1_at 27.20 (0.02) CC chemokine CCL1 Dr.8113.1.S1_at 11.45 (0.02) Neutrophil cytosol factor 1 Dr.2973.1.A1_at 8.37 (0.03) Macrophage stimulating 1 Dr.12399.1.S1_at 6.76 (0.02) Nonspecific cytotoxic cell receptor protein 1 Dr.1180.1.S1_at 3.53 (0.03) Annexin A5 Dr.20555.1.S1 s at 2.70 (0.02)
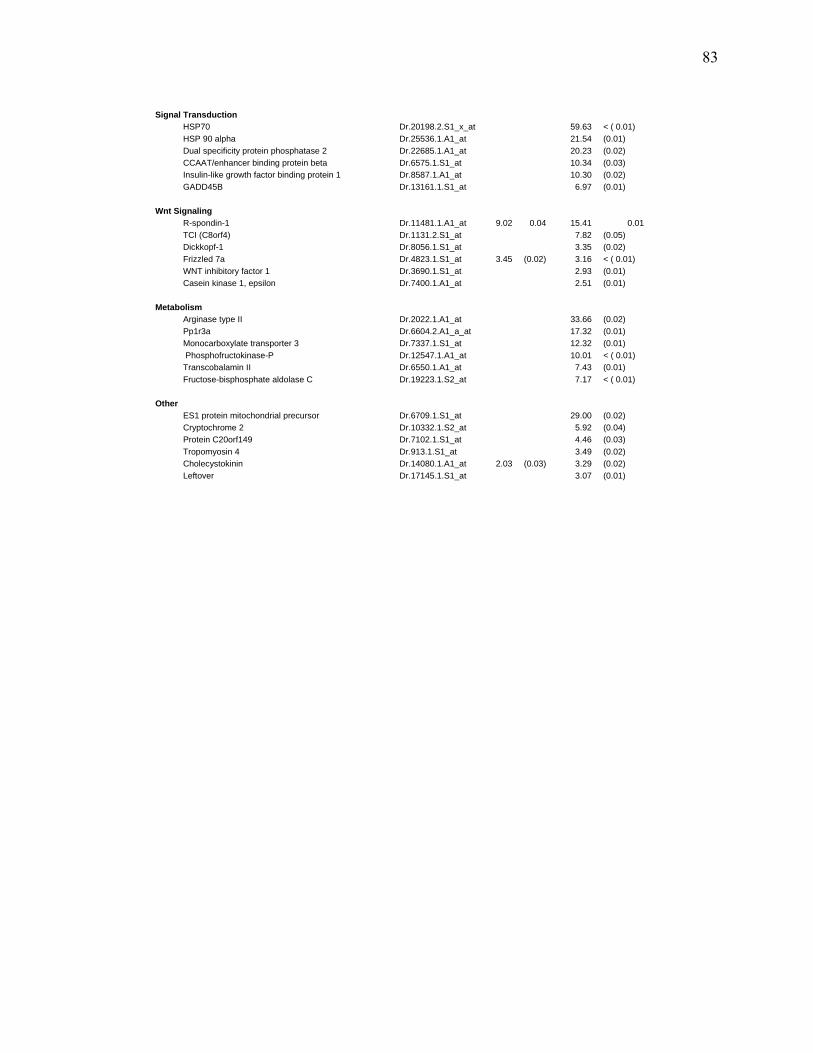
83
Signal Transduction HSP70 Dr.20198.2.S1_x_at 59.63 < ( 0.01) HSP 90 alpha Dr.25536.1.A1_at 21.54 (0.01) Dual specificity protein phosphatase 2 Dr.22685.1.A1_at 20.23 (0.02) CCAAT/enhancer binding protein beta Dr.6575.1.S1_at 10.34 (0.03) Insulin-like growth factor binding protein 1 Dr.8587.1.A1_at 10.30 (0.02) GADD45B Dr.13161.1.S1_at 6.97 (0.01) Wnt Signaling R-spondin-1 Dr.11481.1.A1_at 9.02 0.04 15.41 0.01 TCI (C8orf4) Dr.1131.2.S1_at 7.82 (0.05) Dickkopf-1 Dr.8056.1.S1_at 3.35 (0.02) Frizzled 7a Dr.4823.1.S1_at 3.45 (0.02) 3.16 < ( 0.01) WNT inhibitory factor 1 Dr.3690.1.S1_at 2.93 (0.01) Casein kinase 1, epsilon Dr.7400.1.A1_at 2.51 (0.01) Metabolism Arginase type II Dr.2022.1.A1_at 33.66 (0.02) Pp1r3a Dr.6604.2.A1_a_at 17.32 (0.01) Monocarboxylate transporter 3 Dr.7337.1.S1_at 12.32 (0.01) Phosphofructokinase-P Dr.12547.1.A1_at 10.01 < ( 0.01) Transcobalamin II Dr.6550.1.A1_at 7.43 (0.01) Fructose-bisphosphate aldolase C Dr.19223.1.S2_at 7.17 < ( 0.01) Other ES1 protein mitochondrial precursor Dr.6709.1.S1_at 29.00 (0.02) Cryptochrome 2 Dr.10332.1.S2_at 5.92 (0.04) Protein C20orf149 Dr.7102.1.S1_at 4.46 (0.03) Tropomyosin 4 Dr.913.1.S1_at 3.49 (0.02) Cholecystokinin Dr.14080.1.A1_at 2.03 (0.03) 3.29 (0.02) Leftover Dr.17145.1.S1_at 3.07 (0.01)
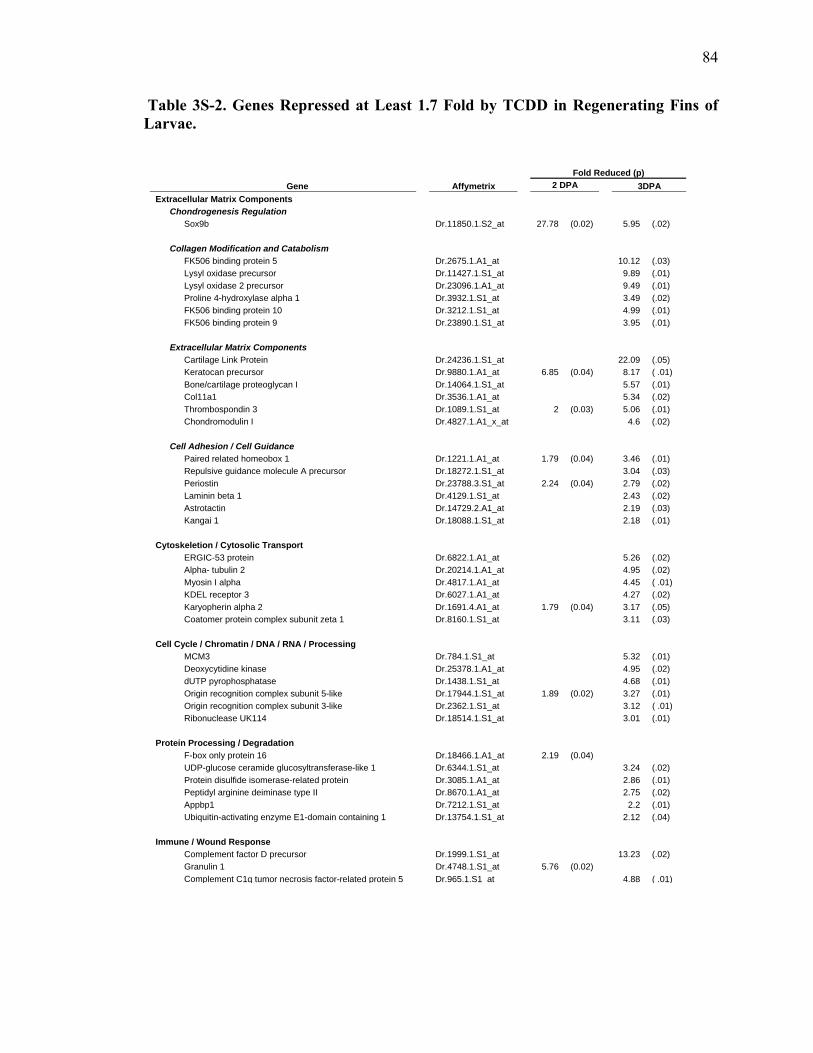
84
Table 3S-2. Genes Repressed at Least 1.7 Fold by TCDD in Regenerating Fins of Larvae.
Fold Reduced (p) Gene Affymetrix 2 DPA 3DPA Extracellular Matrix Components Chondrogenesis Regulation Sox9b Dr.11850.1.S2_at 27.78 (0.02) 5.95 (.02) Collagen Modification and Catabolism FK506 binding protein 5 Dr.2675.1.A1_at 10.12 (.03) Lysyl oxidase precursor Dr.11427.1.S1_at 9.89 (.01) Lysyl oxidase 2 precursor Dr.23096.1.A1_at 9.49 (.01) Proline 4-hydroxylase alpha 1 Dr.3932.1.S1_at 3.49 (.02) FK506 binding protein 10 Dr.3212.1.S1_at 4.99 (.01) FK506 binding protein 9 Dr.23890.1.S1_at 3.95 (.01) Extracellular Matrix Components Cartilage Link Protein Dr.24236.1.S1_at 22.09 (.05) Keratocan precursor Dr.9880.1.A1_at 6.85 (0.04) 8.17 ( .01) Bone/cartilage proteoglycan I Dr.14064.1.S1_at 5.57 (.01) Col11a1 Dr.3536.1.A1_at 5.34 (.02) Thrombospondin 3 Dr.1089.1.S1_at 2 (0.03) 5.06 (.01) Chondromodulin I Dr.4827.1.A1_x_at 4.6 (.02) Cell Adhesion / Cell Guidance Paired related homeobox 1 Dr.1221.1.A1_at 1.79 (0.04) 3.46 (.01) Repulsive guidance molecule A precursor Dr.18272.1.S1_at 3.04 (.03) Periostin Dr.23788.3.S1_at 2.24 (0.04) 2.79 (.02) Laminin beta 1 Dr.4129.1.S1_at 2.43 (.02) Astrotactin Dr.14729.2.A1_at 2.19 (.03) Kangai 1 Dr.18088.1.S1_at 2.18 (.01) Cytoskeletion / Cytosolic Transport ERGIC-53 protein Dr.6822.1.A1_at 5.26 (.02) Alpha- tubulin 2 Dr.20214.1.A1_at 4.95 (.02) Myosin I alpha Dr.4817.1.A1_at 4.45 ( .01) KDEL receptor 3 Dr.6027.1.A1_at 4.27 (.02) Karyopherin alpha 2 Dr.1691.4.A1_at 1.79 (0.04) 3.17 (.05) Coatomer protein complex subunit zeta 1 Dr.8160.1.S1_at 3.11 (.03) Cell Cycle / Chromatin / DNA / RNA / Processing MCM3 Dr.784.1.S1_at 5.32 (.01) Deoxycytidine kinase Dr.25378.1.A1_at 4.95 (.02) dUTP pyrophosphatase Dr.1438.1.S1_at 4.68 (.01) Origin recognition complex subunit 5-like Dr.17944.1.S1_at 1.89 (0.02) 3.27 (.01) Origin recognition complex subunit 3-like Dr.2362.1.S1_at 3.12 ( .01) Ribonuclease UK114 Dr.18514.1.S1_at 3.01 (.01) Protein Processing / Degradation F-box only protein 16 Dr.18466.1.A1_at 2.19 (0.04) UDP-glucose ceramide glucosyltransferase-like 1 Dr.6344.1.S1_at 3.24 (.02) Protein disulfide isomerase-related protein Dr.3085.1.A1_at 2.86 (.01) Peptidyl arginine deiminase type II Dr.8670.1.A1_at 2.75 (.02) Appbp1 Dr.7212.1.S1_at 2.2 (.01) Ubiquitin-activating enzyme E1-domain containing 1 Dr.13754.1.S1_at 2.12 (.04) Immune / Wound Response Complement factor D precursor Dr.1999.1.S1_at 13.23 (.02) Granulin 1 Dr.4748.1.S1_at 5.76 (0.02) Complement C1q tumor necrosis factor-related protein 5 Dr.965.1.S1 at 4.88 ( .01)
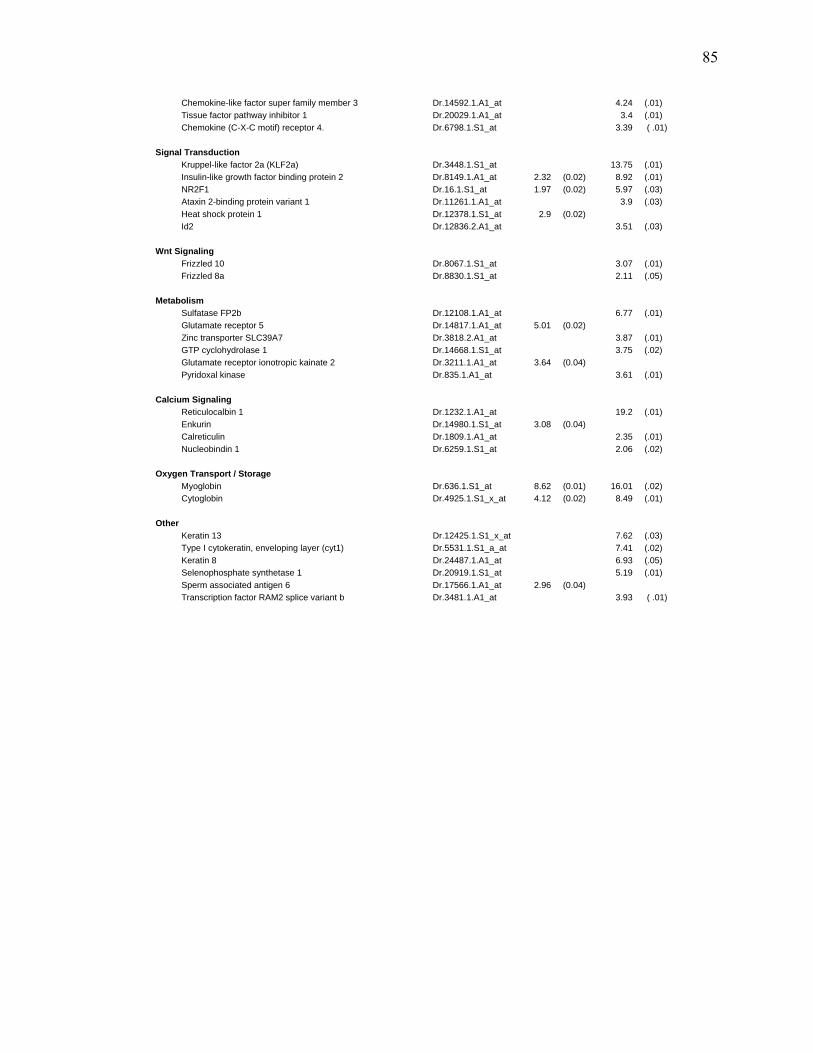
85
Chemokine-like factor super family member 3 Dr.14592.1.A1_at 4.24 (.01) Tissue factor pathway inhibitor 1 Dr.20029.1.A1_at 3.4 (.01) Chemokine (C-X-C motif) receptor 4. Dr.6798.1.S1_at 3.39 ( .01) Signal Transduction Kruppel-like factor 2a (KLF2a) Dr.3448.1.S1_at 13.75 (.01) Insulin-like growth factor binding protein 2 Dr.8149.1.A1_at 2.32 (0.02) 8.92 (.01) NR2F1 Dr.16.1.S1_at 1.97 (0.02) 5.97 (.03) Ataxin 2-binding protein variant 1 Dr.11261.1.A1_at 3.9 (.03) Heat shock protein 1 Dr.12378.1.S1_at 2.9 (0.02) Id2 Dr.12836.2.A1_at 3.51 (.03) Wnt Signaling Frizzled 10 Dr.8067.1.S1_at 3.07 (.01) Frizzled 8a Dr.8830.1.S1_at 2.11 (.05) Metabolism Sulfatase FP2b Dr.12108.1.A1_at 6.77 (.01) Glutamate receptor 5 Dr.14817.1.A1_at 5.01 (0.02) Zinc transporter SLC39A7 Dr.3818.2.A1_at 3.87 (.01) GTP cyclohydrolase 1 Dr.14668.1.S1_at 3.75 (.02) Glutamate receptor ionotropic kainate 2 Dr.3211.1.A1_at 3.64 (0.04) Pyridoxal kinase Dr.835.1.A1_at 3.61 (.01) Calcium Signaling Reticulocalbin 1 Dr.1232.1.A1_at 19.2 (.01) Enkurin Dr.14980.1.S1_at 3.08 (0.04) Calreticulin Dr.1809.1.A1_at 2.35 (.01) Nucleobindin 1 Dr.6259.1.S1_at 2.06 (.02) Oxygen Transport / Storage Myoglobin Dr.636.1.S1_at 8.62 (0.01) 16.01 (.02) Cytoglobin Dr.4925.1.S1_x_at 4.12 (0.02) 8.49 (.01) Other Keratin 13 Dr.12425.1.S1_x_at 7.62 (.03) Type I cytokeratin, enveloping layer (cyt1) Dr.5531.1.S1_a_at 7.41 (.02) Keratin 8 Dr.24487.1.A1_at 6.93 (.05) Selenophosphate synthetase 1 Dr.20919.1.S1_at 5.19 (.01) Sperm associated antigen 6 Dr.17566.1.A1_at 2.96 (0.04) Transcription factor RAM2 splice variant b Dr.3481.1.A1_at 3.93 ( .01)
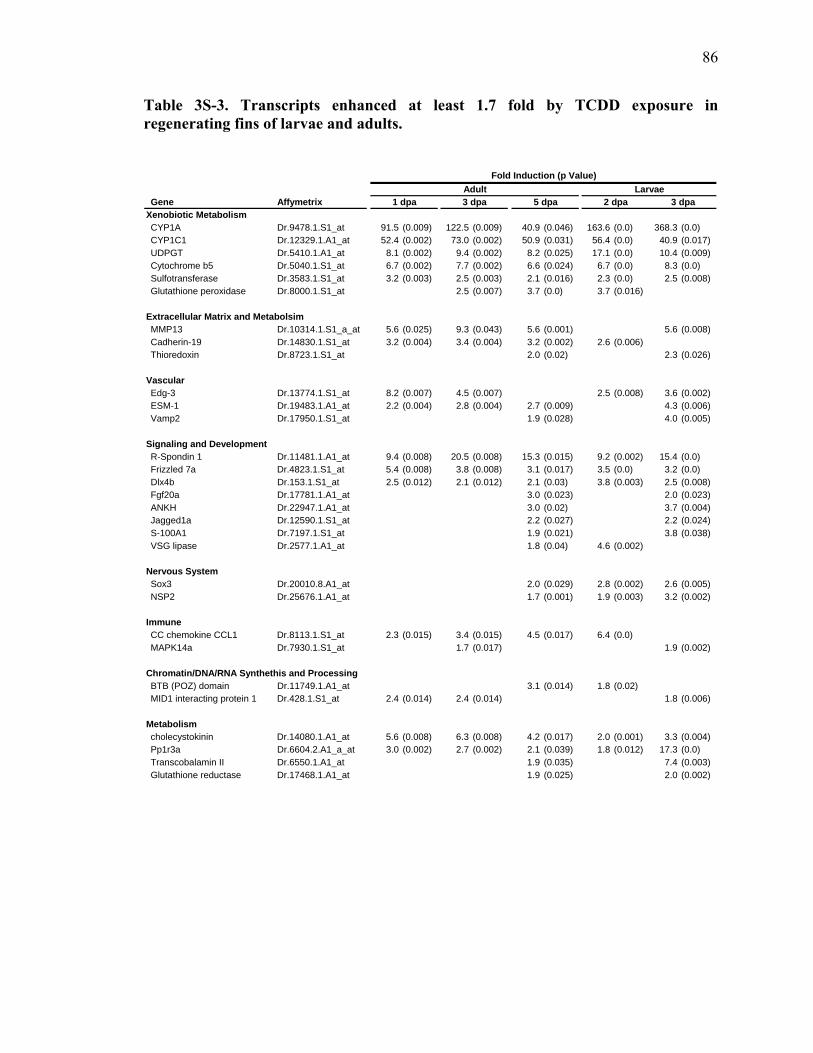
86
Table 3S-3. Transcripts enhanced at least 1.7 fold by TCDD exposure in regenerating fins of larvae and adults.
Gene AffymetrixXenobiotic MetabolismCYP1A Dr.9478.1.S1_at 91.5 (0.009) 122.5 (0.009) 40.9 (0.046) 163.6 (0.0) 368.3 (0.0)CYP1C1 Dr.12329.1.A1_at 52.4 (0.002) 73.0 (0.002) 50.9 (0.031) 56.4 (0.0) 40.9 (0.017)UDPGT Dr.5410.1.A1_at 8.1 (0.002) 9.4 (0.002) 8.2 (0.025) 17.1 (0.0) 10.4 (0.009)Cytochrome b5 Dr.5040.1.S1_at 6.7 (0.002) 7.7 (0.002) 6.6 (0.024) 6.7 (0.0) 8.3 (0.0)Sulfotransferase Dr.3583.1.S1_at 3.2 (0.003) 2.5 (0.003) 2.1 (0.016) 2.3 (0.0) 2.5 (0.008)Glutathione peroxidase Dr.8000.1.S1_at 2.5 (0.007) 3.7 (0.0) 3.7 (0.016)
Extracellular Matrix and MetabolsimMMP13 Dr.10314.1.S1_a_at 5.6 (0.025) 9.3 (0.043) 5.6 (0.001) 5.6 (0.008)Cadherin-19 Dr.14830.1.S1_at 3.2 (0.004) 3.4 (0.004) 3.2 (0.002) 2.6 (0.006)Thioredoxin Dr.8723.1.S1_at 2.0 (0.02) 2.3 (0.026)
Vascular Edg-3 Dr.13774.1.S1_at 8.2 (0.007) 4.5 (0.007) 2.5 (0.008) 3.6 (0.002)ESM-1 Dr.19483.1.A1_at 2.2 (0.004) 2.8 (0.004) 2.7 (0.009) 4.3 (0.006)Vamp2 Dr.17950.1.S1_at 1.9 (0.028) 4.0 (0.005)
Signaling and DevelopmentR-Spondin 1 Dr.11481.1.A1_at 9.4 (0.008) 20.5 (0.008) 15.3 (0.015) 9.2 (0.002) 15.4 (0.0)Frizzled 7a Dr.4823.1.S1_at 5.4 (0.008) 3.8 (0.008) 3.1 (0.017) 3.5 (0.0) 3.2 (0.0)Dlx4b Dr.153.1.S1_at 2.5 (0.012) 2.1 (0.012) 2.1 (0.03) 3.8 (0.003) 2.5 (0.008)Fgf20a Dr.17781.1.A1_at 3.0 (0.023) 2.0 (0.023)ANKH Dr.22947.1.A1_at 3.0 (0.02) 3.7 (0.004)Jagged1a Dr.12590.1.S1_at 2.2 (0.027) 2.2 (0.024)S-100A1 Dr.7197.1.S1_at 1.9 (0.021) 3.8 (0.038)VSG lipase Dr.2577.1.A1_at 1.8 (0.04) 4.6 (0.002)
Nervous SystemSox3 Dr.20010.8.A1_at 2.0 (0.029) 2.8 (0.002) 2.6 (0.005)NSP2 Dr.25676.1.A1_at 1.7 (0.001) 1.9 (0.003) 3.2 (0.002)
ImmuneCC chemokine CCL1 Dr.8113.1.S1_at 2.3 (0.015) 3.4 (0.015) 4.5 (0.017) 6.4 (0.0)MAPK14a Dr.7930.1.S1_at 1.7 (0.017) 1.9 (0.002)
Chromatin/DNA/RNA Synthethis and ProcessingBTB (POZ) domain Dr.11749.1.A1_at 3.1 (0.014) 1.8 (0.02)MID1 interacting protein 1 Dr.428.1.S1_at 2.4 (0.014) 2.4 (0.014) 1.8 (0.006)
Metabolismcholecystokinin Dr.14080.1.A1_at 5.6 (0.008) 6.3 (0.008) 4.2 (0.017) 2.0 (0.001) 3.3 (0.004)Pp1r3a Dr.6604.2.A1_a_at 3.0 (0.002) 2.7 (0.002) 2.1 (0.039) 1.8 (0.012) 17.3 (0.0)Transcobalamin II Dr.6550.1.A1_at 1.9 (0.035) 7.4 (0.003)Glutathione reductase Dr.17468.1.A1_at 1.9 (0.025) 2.0 (0.002)
3 dpa1 dpa 3 dpa 5 dpa 2 dpa
Fold Induction (p Value)Adult Larvae
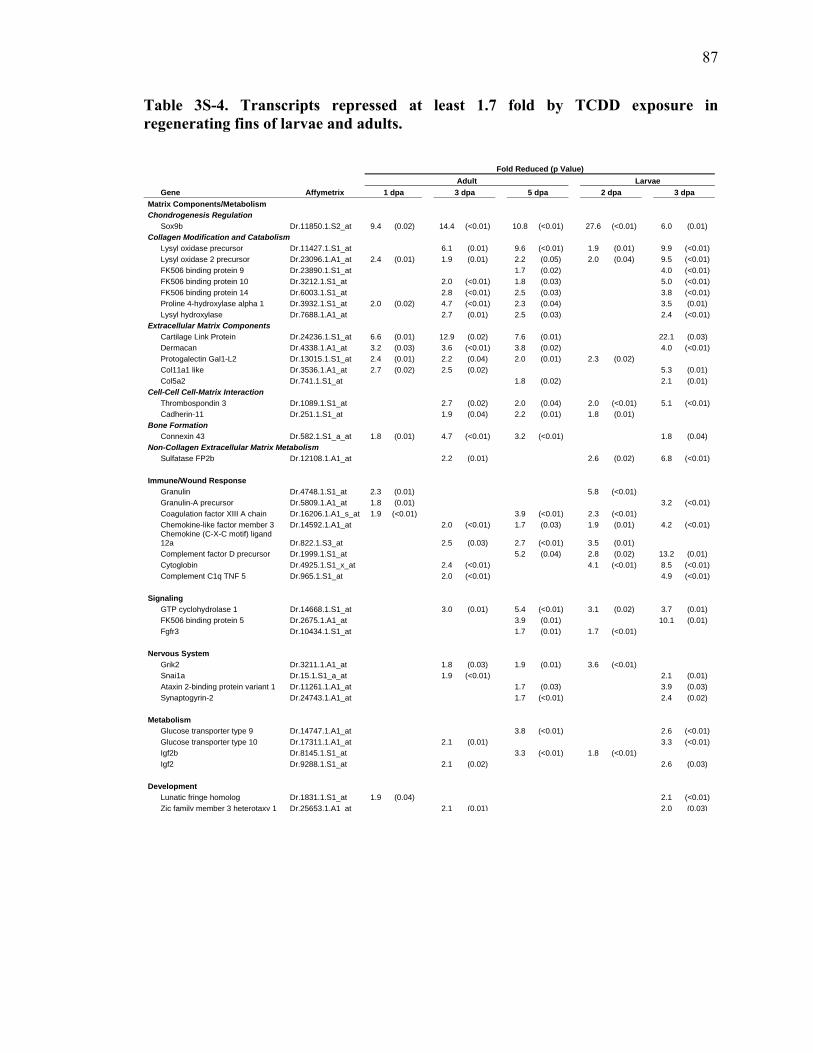
87
Table 3S-4. Transcripts repressed at least 1.7 fold by TCDD exposure in regenerating fins of larvae and adults.
Fold Reduced (p Value) Adult Larvae Gene Affymetrix 1 dpa 3 dpa 5 dpa 2 dpa 3 dpa Matrix Components/Metabolism Chondrogenesis Regulation Sox9b Dr.11850.1.S2_at 9.4 (0.02) 14.4 (<0.01) 10.8 (<0.01) 27.6 (<0.01) 6.0 (0.01) Collagen Modification and Catabolism Lysyl oxidase precursor Dr.11427.1.S1_at 6.1 (0.01) 9.6 (<0.01) 1.9 (0.01) 9.9 (<0.01) Lysyl oxidase 2 precursor Dr.23096.1.A1_at 2.4 (0.01) 1.9 (0.01) 2.2 (0.05) 2.0 (0.04) 9.5 (<0.01) FK506 binding protein 9 Dr.23890.1.S1_at 1.7 (0.02) 4.0 (<0.01) FK506 binding protein 10 Dr.3212.1.S1_at 2.0 (<0.01) 1.8 (0.03) 5.0 (<0.01) FK506 binding protein 14 Dr.6003.1.S1_at 2.8 (<0.01) 2.5 (0.03) 3.8 (<0.01) Proline 4-hydroxylase alpha 1 Dr.3932.1.S1_at 2.0 (0.02) 4.7 (<0.01) 2.3 (0.04) 3.5 (0.01) Lysyl hydroxylase Dr.7688.1.A1_at 2.7 (0.01) 2.5 (0.03) 2.4 (<0.01) Extracellular Matrix Components Cartilage Link Protein Dr.24236.1.S1_at 6.6 (0.01) 12.9 (0.02) 7.6 (0.01) 22.1 (0.03) Dermacan Dr.4338.1.A1_at 3.2 (0.03) 3.6 (<0.01) 3.8 (0.02) 4.0 (<0.01) Protogalectin Gal1-L2 Dr.13015.1.S1_at 2.4 (0.01) 2.2 (0.04) 2.0 (0.01) 2.3 (0.02) Col11a1 like Dr.3536.1.A1_at 2.7 (0.02) 2.5 (0.02) 5.3 (0.01) Col5a2 Dr.741.1.S1_at 1.8 (0.02) 2.1 (0.01)Cell-Cell Cell-Matrix Interaction Thrombospondin 3 Dr.1089.1.S1_at 2.7 (0.02) 2.0 (0.04) 2.0 (<0.01) 5.1 (<0.01) Cadherin-11 Dr.251.1.S1_at 1.9 (0.04) 2.2 (0.01) 1.8 (0.01) Bone Formation Connexin 43 Dr.582.1.S1_a_at 1.8 (0.01) 4.7 (<0.01) 3.2 (<0.01) 1.8 (0.04) Non-Collagen Extracellular Matrix Metabolism Sulfatase FP2b Dr.12108.1.A1_at 2.2 (0.01) 2.6 (0.02) 6.8 (<0.01) Immune/Wound Response Granulin Dr.4748.1.S1_at 2.3 (0.01) 5.8 (<0.01) Granulin-A precursor Dr.5809.1.A1_at 1.8 (0.01) 3.2 (<0.01 Coagulation factor XIII A chain Dr.16206.1.A1_s_at 1.9 (<0.01) 3.9 (<0.01) 2.3 (<0.01) Chemokine-like factor member 3 Dr.14592.1.A1_at 2.0 (<0.01) 1.7 (0.03) 1.9 (0.01) 4.2 (<0.01)
Chemokine (C-X-C motif) ligand 12a Dr.822.1.S3_at 2.5 (0.03) 2.7 (<0.01) 3.5 (0.01)
Complement factor D precursor Dr.1999.1.S1_at 5.2 (0.04) 2.8 (0.02) 13.2 (0.01) Cytoglobin Dr.4925.1.S1_x_at 2.4 (<0.01) 4.1 (<0.01) 8.5 (<0.01) Complement C1q TNF 5 Dr.965.1.S1_at 2.0 (<0.01) 4.9 (<0.01) Signaling GTP cyclohydrolase 1 Dr.14668.1.S1_at 3.0 (0.01) 5.4 (<0.01) 3.1 (0.02) 3.7 (0.01) FK506 binding protein 5 Dr.2675.1.A1_at 3.9 (0.01) 10.1 (0.01) Fgfr3 Dr.10434.1.S1_at 1.7 (0.01) 1.7 (<0.01) Nervous System Grik2 Dr.3211.1.A1_at 1.8 (0.03) 1.9 (0.01) 3.6 (<0.01) Snai1a Dr.15.1.S1_a_at 1.9 (<0.01) 2.1 (0.01) Ataxin 2-binding protein variant 1 Dr.11261.1.A1_at 1.7 (0.03) 3.9 (0.03) Synaptogyrin-2 Dr.24743.1.A1_at 1.7 (<0.01) 2.4 (0.02) Metabolism Glucose transporter type 9 Dr.14747.1.A1_at 3.8 (<0.01) 2.6 (<0.01) Glucose transporter type 10 Dr.17311.1.A1_at 2.1 (0.01) 3.3 (<0.01) Igf2b Dr.8145.1.S1_at 3.3 (<0.01) 1.8 (<0.01) Igf2 Dr.9288.1.S1_at 2.1 (0.02) 2.6 (0.03) Development Lunatic fringe homolog Dr.1831.1.S1_at 1.9 (0.04) 2.1 (<0.01) Zic famil
)
y member 3 heterotaxy 1 Dr.25653.1.A1 at 2.1 (0.01) 2.0 (0.03)
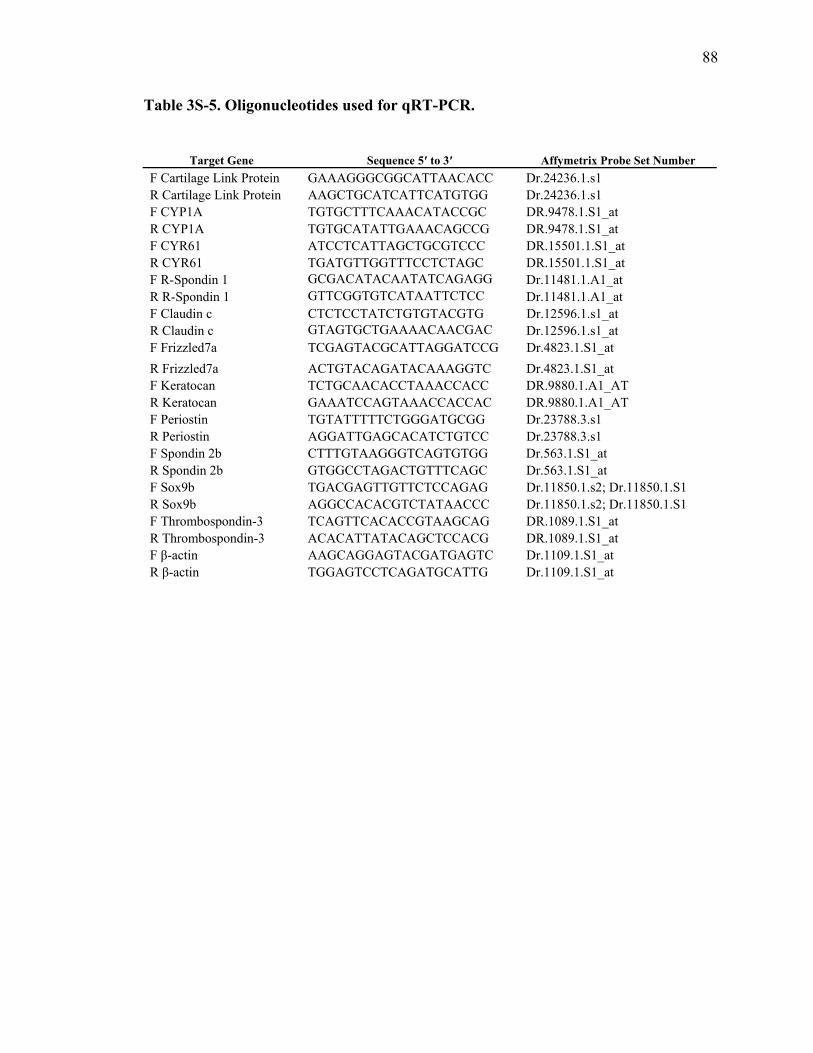
88
Table 3S-5. Oligonucleotides used for qRT-PCR.
Target Gene Sequence 5′ to 3′ Affymetrix Probe Set Number
F Cartilage Link Protein GAAAGGGCGGCATTAACACC Dr.24236.1.s1 R Cartilage Link Protein AAGCTGCATCATTCATGTGG Dr.24236.1.s1 F CYP1A TGTGCTTTCAAACATACCGC DR.9478.1.S1_at R CYP1A TGTGCATATTGAAACAGCCG DR.9478.1.S1_at F CYR61 ATCCTCATTAGCTGCGTCCC DR.15501.1.S1_at R CYR61 TGATGTTGGTTTCCTCTAGC DR.15501.1.S1_at F R-Spondin 1 GCGACATACAATATCAGAGG Dr.11481.1.A1_at R R-Spondin 1 GTTCGGTGTCATAATTCTCC Dr.11481.1.A1_at F Claudin c CTCTCCTATCTGTGTACGTG Dr.12596.1.s1_at R Claudin c GTAGTGCTGAAAACAACGAC Dr.12596.1.s1_at F Frizzled7a TCGAGTACGCATTAGGATCCG Dr.4823.1.S1_at R Frizzled7a ACTGTACAGATACAAAGGTC Dr.4823.1.S1_at F Keratocan TCTGCAACACCTAAACCACC DR.9880.1.A1_AT R Keratocan GAAATCCAGTAAACCACCAC DR.9880.1.A1_AT F Periostin TGTATTTTTCTGGGATGCGG Dr.23788.3.s1 R Periostin AGGATTGAGCACATCTGTCC Dr.23788.3.s1 F Spondin 2b CTTTGTAAGGGTCAGTGTGG Dr.563.1.S1_at R Spondin 2b GTGGCCTAGACTGTTTCAGC Dr.563.1.S1_at F Sox9b TGACGAGTTGTTCTCCAGAG Dr.11850.1.s2; Dr.11850.1.S1 R Sox9b AGGCCACACGTCTATAACCC Dr.11850.1.s2; Dr.11850.1.S1 F Thrombospondin-3 TCAGTTCACACCGTAAGCAG DR.1089.1.S1_at R Thrombospondin-3 ACACATTATACAGCTCCACG DR.1089.1.S1_at F β-actin AAGCAGGAGTACGATGAGTC Dr.1109.1.S1_at R β-actin TGGAGTCCTCAGATGCATTG Dr.1109.1.S1_at
89
Chapter 4. Unraveling Tissue Regeneration Pathways Using Chemical Genetics
Lijoy K. Mathew1,2,3, Sumitra Sengupta1,2,3, Atsushi Kawakami4, Eric, A. Andreasen1,2,3, Christiane V. Löhr1,2,5, Catherine A. Loynes , 6 Stephen A. Renshaw6, Randall T. Peterson7, and Robert L. Tanguay1,2,3*
1Department of Environmental and Molecular Toxicology, 2Environmental Health Sciences Center, 3Marine and Freshwater Biomedical Sciences Center, 5Department of Veterinary Medicine, Oregon State University, Corvallis, OR, 97331, 4Department of Biological Information, Tokyo Institute of Technology, Japan. 5Department of Veterinary Medicine, Oregon State University, Corvallis, OR, 97331. 6MRC Centre Development for Developmental and Biomedical Genetics, University of Sheffield, Western Bank, Sheffield, S10 2TN, UK. 7Developmental Biology Laboratory, Cardiovascular Research Center, Massachusetts General Hospital, Charlestown, MA 02129.
Reprinted with permission of the American Society for Biochemistry and Molecular Biology. All rights reserved.
90
Abstract
Identifying the molecular pathways that are required for regeneration remains one
of the great challenges of regenerative medicine. Although genetic mutations have been
useful for identifying some molecular pathways, small molecule probes of regenerative
pathways might offer some advantages, including the ability to disrupt pathway function
with precise temporal control. However, a vertebrate regeneration model amenable to
rapid throughput small molecule screening is not currently available. We report here the
development of a zebrafish early life stage fin regeneration model and its use in screening
for small molecules that modulate tissue regeneration. By screening 2000 biologically
active small molecules, we identified 17 that specifically inhibited regeneration. These
compounds include a cluster of glucocorticoids, and we demonstrate that transient
activation of the glucocorticoid receptor is sufficient to block regeneration, but only if
activation occurs during a narrow window of time during wound healing/blastema
formation. We further demonstrate that glucocorticoid exposure inhibit blastema
formation. In addition, knockdown of the glucocorticoid receptor restores regenerative
capability to non-regenerative, glucocorticoid-exposed zebrafish. To test whether the
classical anti-inflammatory action of glucocorticoids is responsible for blocking
regeneration, we prevented acute inflammation following amputation by antisense
repression of the Pu.1 gene. Although loss of Pu.1 prevents the inflammatory response by
neutrophils and macrophages, regeneration is not affected. Collectively, these results
indicate that signaling from exogenous glucocorticoids impairs blastema formation and
limits regenerative capability in vertebrates through an acute inflammation-independent
mechanism. These studies demonstrate the feasibility of exploiting chemical genetics to
define the pathways that govern vertebrate regeneration.
91
Introduction
The promise of regenerative medicine is that therapies will be devised to promote
the repair or replacement of damaged or diseased tissues and organs. This emerging field
is approached from two distinct lines of attack. In recent years, stem cell based models
have been developed to generate a suite of differentiated cells for therapeutic
applications. The use of high throughput chemical genetic screening to identify
modulators of stem cell fate offers great promise (Ding and Schultz, 2004). The
alternative approach exploits the inherent regenerative capacity of non-mammalian
models to define the molecular events that permit tissue regeneration (Brockes and
Kumar, 2005). There are several regenerative animal models including salamanders,
newts, zebrafish, hydra and flatworms that are established to evaluate tissue regeneration
(Akimenko et al., 2003; Bader and Oberpriller, 1978; Fujisawa, 2003; Mescher, 1996);
what is currently lacking is the availability of a vertebrate regeneration model that is
amenable to rapid throughput assessments.
Zebrafish have the remarkable capability to regenerate their fins, optic nerve,
scales, heart and spinal cord (Poss et al., 2003). Adult caudal fin regeneration is the most
well-studied model for dissecting the molecular signaling that controls regenerative
growth and angiogenesis (Bayliss et al., 2006; Poss et al., 2003). Comparative genomics
indicate significant genetic conservation between mammals and lower vertebrates, which
begs the question: what are the molecular differences that permit tissue regeneration in
zebrafish, and make mammalian tissues recalcitrant to regeneration? Answers to this
question will provide a path for comparative studies in mammals. Zebrafish recover the
lost caudal fin tissue after amputation through a process of epimorphic regeneration and
this occurs in a stepwise manner with the formation of an epithelial wound cap, followed
by blastema formation and finally the regenerative outgrowth (Akimenko et al., 2003;
Poss et al., 2003) (Fig.1). This complex regenerative process is orchestrated by sequential
interactions between biomolecules and cells in a spatio-temporal manner. Global gene
expression analysis on heart and fin regeneration in adult zebrafish illustrates the
involvement of multiple signaling pathways mediated through the differential expression
92
of hundreds of genes during this remarkable process (Andreasen et al., 2006; Lien et al.,
2006; Schebesta et al., 2006). The identification of the signaling molecules that control
these interactions will offer avenues to rapidly advance the field of regenerative
medicine. The characterization of key regulators such as FGF and Wnt as critical factors
during regeneration emphasizes the likely involvement of multiple signaling pathways in
fin regeneration (Poss et al., 2000b; Stoick-Cooper et al., 2007). This again underscores
the importance of a comprehensive approach to identify the full repertoire of molecular
players required for tissue regeneration. Although adult zebrafish regeneration models
have proven useful, many of the molecular and genetic tools that are useful for
embryonic and larval studies are not easily applied to adult stage animals (Poss et al.,
2003). Recent results indicate that these technical barriers may be overcome by using an
early life stage regeneration model. Specifically, two-day-old zebrafish larvae completely
regenerate their fin primordia within three days following amputation (Kawakami et al.,
2004; Mathew et al., 2006; Nakatani et al., 2007). Since this life stage is inherently
amenable to molecular and genetic manipulations such as transient and stable transgenics,
genetic mutant screens and chemical genetics, this model offers a powerful new way to
identify novel regulators of tissue regeneration.
In vivo high throughput small molecule screening has the potential to target any
biological process (Love et al., 2004; MacRae and Peterson, 2003; Peterson and Fishman,
2004; Peterson et al., 2000; Peterson et al., 2004; Shafizadeh et al., 2004; Zon and
Peterson, 2005); however, this approach has not been applied in a vertebrate regenerative
system. To probe tissue regeneration, an inhibitory screen was developed. The underlying
premise is that if a chemical inhibits or modulates an essential molecular target, then
regeneration will be impacted. The identification of the chemical target will thus help to
reveal underlying molecular pathways that permit tissue regeneration. Previous larval fin
regeneration studies demonstrated the feasibility of this general inhibitory approach;
inhibition of FGFR-1 with SU5402, or activation of the aryl hydrocarbon receptor (AHR)
disrupted tissue regeneration (Kawakami et al., 2004; Mathew et al., 2006; Nakatani et
al., 2007). We report here for the first time an in vivo vertebrate regeneration assay that
employs a rapid small molecule library screening to identify pathways essential for tissue
regeneration. We also demonstrate that this regenerative platform is well suited to
93
identify the molecular targets of small molecules and to define the molecular and cellular
mechanism underlying the chemical response.
Materials and Methods
Screening for Inhibitors of Larval Fin Regeneration
Fertilized eggs were obtained from AB strain zebrafish (University of Oregon,
Eugene, OR) for all the experiments. All embryos were raised in our laboratory according
to standard procedures. Two-day-old embryos were dechorionated and anesthetized with
3-amino benzoic acid ethylester (tricaine). The larvae were laid on an agar plate and the
caudal fin primordia were amputated with a surgical blade just posterior to the notochord.
Two amputated larvae were arrayed per well in 96-well plates containing 50 μL E3
embryo buffer (5 mM NaCl, 0.17 mM KCl, 0.33 mM CaCl2, 0.33 mM MgSO4). The
small molecules (2,000 bioactives from MicroSource Discovery Systems (Gaylordsville,
CT), were added individually to the test wells at a final concentration of 25 µM. The
amputated larvae were incubated for 3 days at 28°C, and at 3 dpa, the larvae were
anesthetized and assessed visually to score regenerative progression. After the primary
screen, Beclomethasone dipropionate (Beclomethasone, Sigma-Aldrich, St.Louis, MO)
was used as a prototype GR agonist. For all functional studies, Beclomethasone was used
at 1 µM final concentration.
Adult Zebrafish Study
Adult male zebrafish (AB strain) were pre-exposed for one day to vehicle or
Beclomethasone with waterborne concentrations ranging from 0.05 - 0.0005mg/L. The
concentration that was used for the study reported here is 0.005mg/L (n=6). After pre-
exposure, the fish were anesthetized, and their caudal fins were surgically amputated. The
fish were transferred back to the tanks and were continuously exposed to vehicle or
Beclomethasone until the end of the study. The exposure solutions were changed daily.
94
Quantitative Real Time PCR
The larvae were amputated at 2dpf and exposed to vehicle or Beclomethasone and
the regenerating fin tissue was specifically isolated at 1dpa. Total RNA was extracted
from the regenerating fin tissue using the RNAqueous Micro kit (Ambion, Austin, TX).
Three groups per treatment, each comprised of 150 larval fins, were pooled to make an
individual replicate. For RNA from whole embryo, the amputated larvae exposed to
vehicle or Beclomethasone at 2dpf were sampled at 3dpf. Total RNA was isolated from
triplicate groups of whole embryos using RNeasy Mini kit (Qiagen, CA) according to
manufacturer’s instructions. Data was quantitatively expressed as the fold change in the
mRNA levels between Beclomethasone-exposed embryos and vehicle-exposed embryos
after normalizing to β-actin abundance. The p values represent the significant difference
of transcript level between groups as calculated using One Way ANOVA and Tukey
method (SigmaStat, Chicago, IL) (Fig. 4A). To quantify GR transcript morpholino
knockdown, RNA was isolated from the control or GR morphants at 2dpf (Fig. 4D). The
transcript levels were normalized to β-actin abundance. The p value represents
significance as determined by One Way ANOVA. For all the experiments, cDNA was
synthesized from 3μg of total RNA per group using Superscript II (Life Technologies,
Gaithersburg, MD) and oligo(dT) primers in a 20 μl volume. Quantitative PCR was
conducted using gene-specific primers with the Opticon-2 real-time PCR detection
system (MJ Research, Waltham, MA). Briefly, 1 μl of cDNA was used for each PCR
reaction in the presence of SYBR Green, using DyNAmo SYBR green qPCR kit
according to the manufacturer’s instructions (Finnzymes, Espoo, Finland). Agarose gel
electrophoresis (Fig. 4C) and thermal denaturation (melt curve analysis) were conducted
to ensure formation of specific products. Primer sequences used were as follows: FKBP5,
5’-CACGTTCACAAACACACTGC-3’, 5’-ATCAAACGAACAAGCGGGTC-3’; GILZ,
5’- CGACTTGTTTATATGGGCTG-3’, 5’-TCTTCAGACACCAACATGCC-3’;
SOX9b, 5’-TGACGAGTTGTTCTCCAGAG-3’, 5’- AGGCCACACGTCTATAACCC-
3’; GR, 5’-CAAATGGGCTAAAGCTCTGC-3’, 5’-TCTTCAACCCATCCTTCGGC-3’.
95
Morpholinos
Antisense repression of GR was performed using splice variant morpholino
(MO) oligonucleotides (Gene Tools, Philomath, OR). A putative zebrafish GR ortholog
was identified (Genbank accession number AB218424). Since there were three predicted
transcripts based on alternative splicing, a MO was designed at an intron-exon boundary
that was conserved between predicted transcripts. The sequence of GR splice variant MO
was 5’-CTGCTTCATGTATTTTAGGGTTCCG-3’. The sequence of PU.1 MO is 5′-
GATATACTGATACTCCATTGGTGGT-3′ (Gene Tools, Philomath, OR). Morpholinos
were diluted to 3 mM in 1X Danieau’s solution (58 mM NaCl, 0.7 mM KCl, 0.4 mM
MgSO4, 0.6 mM Ca(NO3)2, 5 mM HEPES, pH 7.6) as described (Nasevicius and Ekker,
2000). A standard control morpholino (Gene Tools, Philomath, OR)
(5'CTCTTACCTCAGTTACAATTTATA 3') was used as the control morpholino
(Control-MO). Approximately 2 nl of the appropriate MO solution was microinjected
into the embryos at the 1–2 cell stage. The 3’ end of the MOs was fluorescein-tagged to
screen microinjection success at 24hpf. The control and GR morphants at 2dpf were
amputated and exposed to vehicle or Beclomethasone and raised for 3 days at 28°C. The
control and PU.1 morphants were amputated and allowed to grow for 3 days at 28°C.
In situ Hybridization
Whole mount in situ hybridization was conducted on the regenerating fin at
different time points as described previously (Poss et al., 2000a; Schier et al., 1997). The
msxe and dlx5a probes were obtained from Atsushi Kawakami(Kawakami et al., 2004).
The junbl probe is a gift from Atsushi Kawakami (Ishida and Kawakami., manuscript in
preparation).
Brdu Incorporation Analysis by Immunohistochemistry
The amputated larvae that were exposed to vehicle or Beclomethasone were
incubated with Brdu (Roche, Indianapolis, IN) for 6hrs starting from 6hpa or 24hpa. The
larvae were labeled with Brdu (10mM) in a 96-well plate with one larva in each well at
28°C. After 6hrs of incubation with Brdu, the animals were euthanized with tricaine and
fixed in 4% paraformaldehyde (PFA) overnight. The fixed larvae were dehydrated with
96
methanol and then stored in methanol at -20°C. For performing immunohistochemistry,
the larvae were rehydrated using a graded methanol/PBST (phosphate-buffered saline
(PBS) and 0.1% Tween-20) series. The larvae were then treated with Proteinase K
(10µg/Ml) in PBST for 20 minutes at room temperature (RT) and then rinsed several
times with PBST. The larvae were refixed in 4% PFA for 30 minutes and then rinsed
several times in water. This was followed by quick rinses in 2N HCL, then incubated in
2N HCL at RT for an hour and washed with PBST several times. The larvae were then
blocked with 1% normal goat serum in PBST for an hour at RT and then incubated with
anti-Brdu antibody (1:100; G3G4; Developmental Studies Hybridoma Bank, Iowa City,
IA) overnight at 4°C. After 4x for 30 min washes with PBST, the larvae were incubated
with a secondary antibody (1:1000; Alexa-546 conjugated goat anti mouse; Molecular
Probes, Eugene, OR) for 4 hrs at RT. The larvae were then washed 4x for 30 min in
PBST and visualized by epifluorescence microscopy. The Brdu-labeled fluorescent cells
were quantified with the images using ImagePro Plus software program (Media
Cybernetics, Inc., Silver Spring, MD).
Morphologic Characterization by Histological Analysis
The amputated larvae exposed to vehicle or Beclomethasone were euthanized
and fixed in 4% paraformaldehyde at 1dpa. The fixed larvae were post fixed in 1%
osmium tetroxide and embedded in Embed 812-Araldite 502 resin. Semi-thin serial
sections were cut at 1 micrometer, stained with toluidine blue, and analyzed by light
microscopy.
Neutrophil and Macrophage Migration Assay
The Tg(BACmpo:gfp)i114 transgenic line larvae were anaesthetized and amputated
at 3dpf as described above. At the time points indicated, amputated larvae were taken
from predetermined wells and the numbers of GFP-positive neutrophils counted
(Renshaw et al., 2006) at the same time, and in the same fish the number of neutral red
positive macrophages were assessed. For macrophage count, the amputated larvae at 3dpf
were exposed to neutral red at a final concentration of 2.5µg/mL for 4 hours prior to
97
assessment. The macrophages are stained red and were counted at the amputation site
periodically as given in Fig. 8C, D.
Results and Discussion
Development of Rapid Throughput Zebrafish Regeneration Assay
Since regeneration is accomplished by an orchestrated coordination of multiple
pathways and signaling events, a vertebrate regeneration assay was developed to identify
small molecules that specifically modulated tissue regeneration. To demonstrate the
power of this approach, a 2000-member structurally diverse bioactive small molecule
library was screened to identify inhibitors of regeneration. Two day post fertilization
(dpf) larvae were amputated and transferred to 96-well plates and continuously exposed
to individual chemicals. At 3 days post amputation (dpa), the larvae were microscopically
imaged to assess regenerative progression. A total of 17 small molecules (approximately,
0.8% of the library) inhibited tissue regeneration. These inhibitory chemicals comprised
several different functional classes such as anti-inflammatory, keratolytic, cytochrome P-
450 inhibitor, etc. Representative images of complete and impaired regeneration are
depicted (Fig. 2A, B). Although a number of small molecules produced overt toxicity at
the test concentration (25 μM) leading to systemic edema by the end of the assay, these
animals completely regenerated their fin tissue (Fig. 2C). This specificity indicates that a
toxic response can be uncoupled from the regenerative response.
Identification of Glucocorticoids as Modulators of Regeneration
The positive “hits” were of different chemical classes and using structure function
analysis, a major cluster of compounds was identified as glucocorticoids (5 of the “hit”
compounds). Although the main focus of this study was to demonstrate the feasibility of
using small molecules to probe tissue regeneration, we also wanted to demonstrate the
ability to rapidly identify small molecule targets during early life stages. We selected
glucocorticoids for further studies since this was the largest cluster of “hits”.
98
Glucocorticoids consistently and specifically inhibited regeneration without inhibiting
normal growth, creating a “V” shaped fin (Fig. 3A). This characteristic morphology
occurs because the tissue lateral to the amputation plane continues to grow and partially
collapses around the amputation plane. Glucocorticoids are steroid hormones that exert
most of their actions by binding the glucocorticoid receptor (GR) (Carlstedt-Duke and
Gustafsson, 1987; Gustafsson et al., 1987; Schaaf and Cidlowski, 2002). From
mammalian studies it is clear that there are several isoforms of GR due to differential
splicing and alternative translation initiation sites, of which GRα and GRβ are the most
well-studied (Lu and Cidlowski, 2004; Lu and Cidlowski, 2006; Schaaf and Cidlowski,
2002). Binding of glucocorticoid activates GRα transcriptional activity, leading to the
initiation or repression of transcription, whereas GRβ is not able to bind ligands and has a
dominant negative activity through inhibition of GRα transcriptional activity (Oakley et
al., 1999). In addition to the classical genomic model of GR activation, non-genomic
activities have also been reported at high concentrations of glucocorticoids (Croxtall et
al., 2002; Goulding, 2004). In order to broadly analyze the mechanism of action from the
positive “hits”, dose response studies were completed with selected glucocorticoids by
measuring the length of maximum outgrowth. The length of maximum outgrowth is the
distance from the center of the amputation plane to the tip of the regenerating fin
(Mathew et al., 2006), and the IC50 for regeneration ranged from 200-400 nM (Fig. 3B).
Beclomethasone dipropionate (Beclomethasone) has a potent inhibitory effect on
regeneration at the lower nanomolar range, and hence this small molecule was selected
for further experiments.
Since the adult fin regeneration model is more widely studied, it was important to
determine if chemical “hits” identified in the larval screen would be predictive for the
adult fin regeneration responses. Therefore, the regeneration response to glucocorticoid
exposure on fin regeneration was also assessed in adult zebrafish. Similar to the larvae,
Beclomethasone exposure inhibited adult caudal fin regeneration and small projection-
like structures were observed at the plane of amputation (Fig. 3C). The similar inhibitory
response suggested that a common underlying molecular target was targeted by this
chemical.
99
Beclomethasone Induces Expression of GR Target Genes
Since the IC50 of glucocorticoids for regeneration was in the nanomolar range, it is
highly likely that the glucocorticoids are acting via activation of the GR. To test whether
Beclomethasone activates the GR pathway, three primary GR target genes were identified
including the glucocorticoid induced leucine zipper (GILZ), the FK506 binding protein 5
(FKBP5) and the SRY-box containing gene 9b (SOX9b) (Chen et al., 2006; Rogatsky et
al., 2003; Sekiya et al., 2001; Wang et al., 2004). To analyze the expression of these
genes, qRT-PCR was conducted using RNA from the larval regenerating fin tissue at
1dpa in the presence and absence of Beclomethasone. All three genes were significantly
induced in response to Beclomethasone exposure, indicating that the GR is activated by
glucocorticoids in this regeneration model (Fig. 4). Similarly, qRT-PCR analysis was
performed in the whole embryo at 3dpf after exposure to Beclomethasone at 2dpf, and
the global expression of those genes was similar in pattern to the regenerating fin tissue
(Supplemental Fig.1). These results suggest that Beclomethasone is activating the GR
and the inhibitory effect on regeneration could be mediated through inappropriate GR
activation.
GR Activation is Required for Beclomethasone to Inhibit Regeneration
To directly determine if the GR was the molecular target of Beclomethasone and
to determine if the GR was necessary for the glucocorticoid-mediated inhibition of
regeneration, a morpholino was designed to block splicing of the exons encoding the well
conserved GR ligand binding domain (Fig. 5B). Transient knockdown of GR did not
elicit obvious early developmental defects, suggesting that the GR is not essential for
early embryonic development (data not shown). The standard control morpholinos-
microinjected larvae (morphants) and GR morphants were amputated at 2dpf and
continuously exposed for 3 days to vehicle or Beclomethasone. It is noteworthy that the
control and GR morphants exposed to vehicle completely regenerated their fin tissue,
emphasizing that endogenous GR is not required for larval fin regeneration (Fig. 5A).
Control morphants exposed to Beclomethasone failed to regenerate, whereas knockdown
of GR completely restored regenerative capacity in the presence of Beclomethasone (Fig.
5A). These results indicate that impaired regeneration by Beclomethasone is mediated
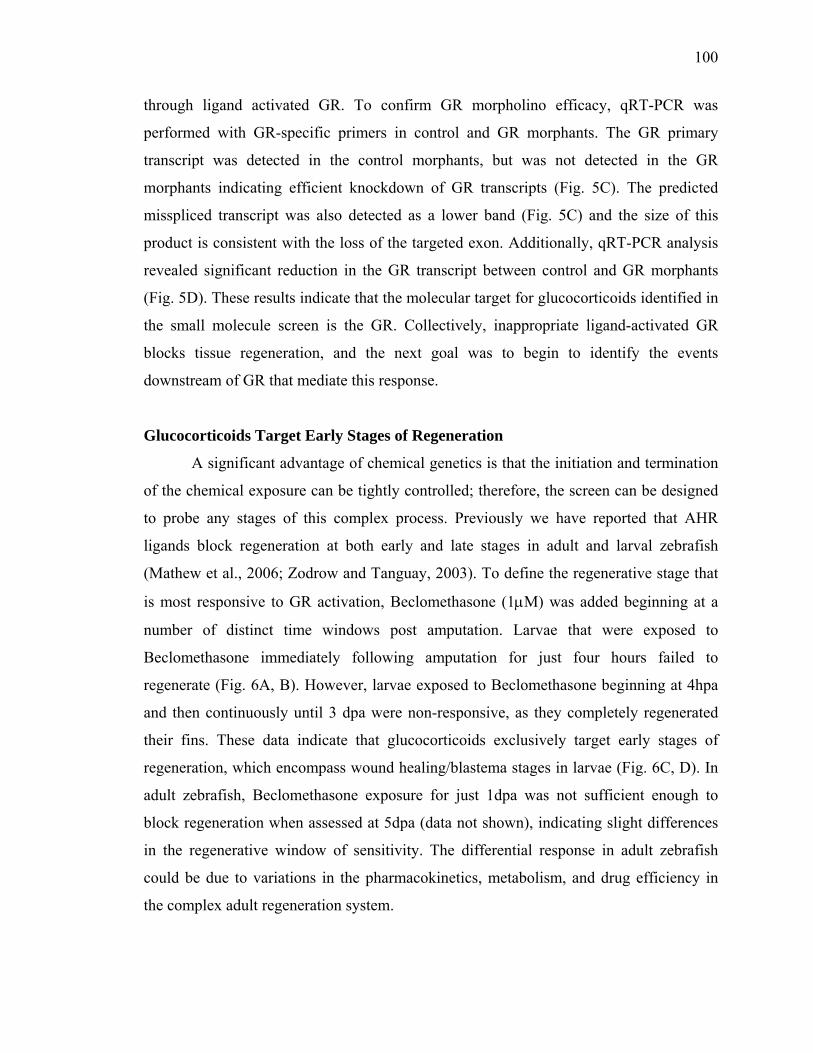
100
through ligand activated GR. To confirm GR morpholino efficacy, qRT-PCR was
performed with GR-specific primers in control and GR morphants. The GR primary
transcript was detected in the control morphants, but was not detected in the GR
morphants indicating efficient knockdown of GR transcripts (Fig. 5C). The predicted
misspliced transcript was also detected as a lower band (Fig. 5C) and the size of this
product is consistent with the loss of the targeted exon. Additionally, qRT-PCR analysis
revealed significant reduction in the GR transcript between control and GR morphants
(Fig. 5D). These results indicate that the molecular target for glucocorticoids identified in
the small molecule screen is the GR. Collectively, inappropriate ligand-activated GR
blocks tissue regeneration, and the next goal was to begin to identify the events
downstream of GR that mediate this response.
Glucocorticoids Target Early Stages of Regeneration
A significant advantage of chemical genetics is that the initiation and termination
of the chemical exposure can be tightly controlled; therefore, the screen can be designed
to probe any stages of this complex process. Previously we have reported that AHR
ligands block regeneration at both early and late stages in adult and larval zebrafish
(Mathew et al., 2006; Zodrow and Tanguay, 2003). To define the regenerative stage that
is most responsive to GR activation, Beclomethasone (1μM) was added beginning at a
number of distinct time windows post amputation. Larvae that were exposed to
Beclomethasone immediately following amputation for just four hours failed to
regenerate (Fig. 6A, B). However, larvae exposed to Beclomethasone beginning at 4hpa
and then continuously until 3 dpa were non-responsive, as they completely regenerated
their fins. These data indicate that glucocorticoids exclusively target early stages of
regeneration, which encompass wound healing/blastema stages in larvae (Fig. 6C, D). In
adult zebrafish, Beclomethasone exposure for just 1dpa was not sufficient enough to
block regeneration when assessed at 5dpa (data not shown), indicating slight differences
in the regenerative window of sensitivity. The differential response in adult zebrafish
could be due to variations in the pharmacokinetics, metabolism, and drug efficiency in
the complex adult regeneration system.
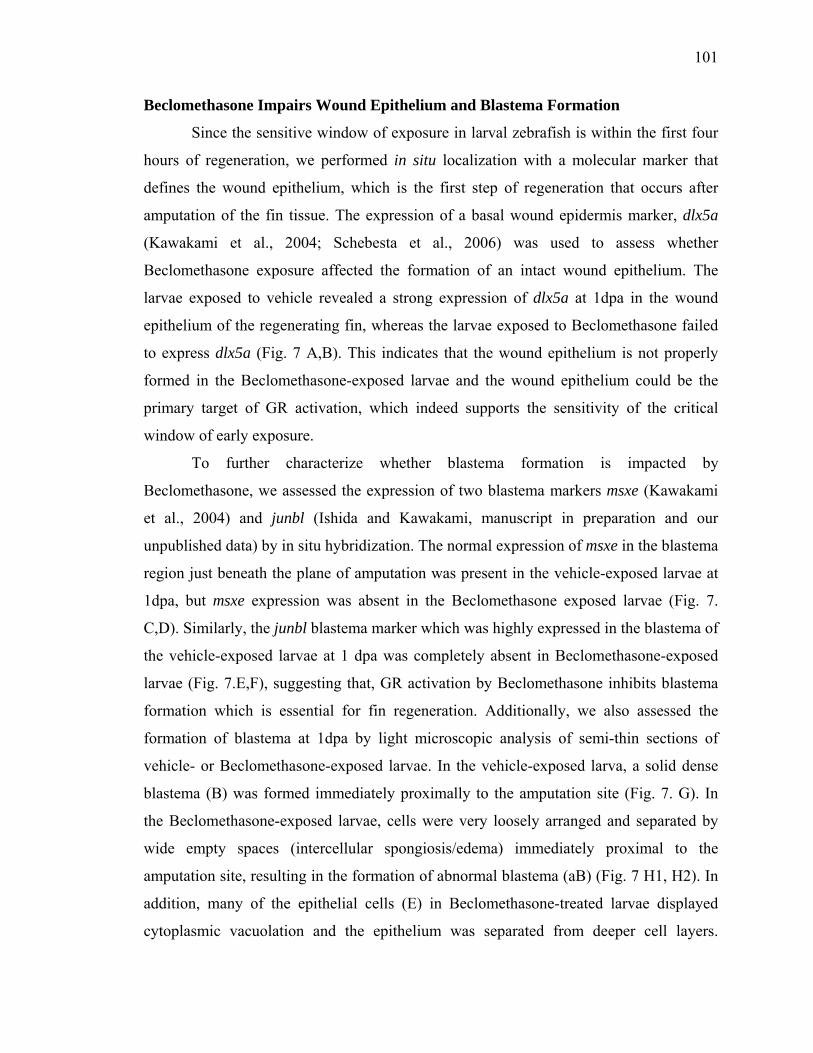
101
Beclomethasone Impairs Wound Epithelium and Blastema Formation
Since the sensitive window of exposure in larval zebrafish is within the first four
hours of regeneration, we performed in situ localization with a molecular marker that
defines the wound epithelium, which is the first step of regeneration that occurs after
amputation of the fin tissue. The expression of a basal wound epidermis marker, dlx5a
(Kawakami et al., 2004; Schebesta et al., 2006) was used to assess whether
Beclomethasone exposure affected the formation of an intact wound epithelium. The
larvae exposed to vehicle revealed a strong expression of dlx5a at 1dpa in the wound
epithelium of the regenerating fin, whereas the larvae exposed to Beclomethasone failed
to express dlx5a (Fig. 7 A,B). This indicates that the wound epithelium is not properly
formed in the Beclomethasone-exposed larvae and the wound epithelium could be the
primary target of GR activation, which indeed supports the sensitivity of the critical
window of early exposure.
To further characterize whether blastema formation is impacted by
Beclomethasone, we assessed the expression of two blastema markers msxe (Kawakami
et al., 2004) and junbl (Ishida and Kawakami, manuscript in preparation and our
unpublished data) by in situ hybridization. The normal expression of msxe in the blastema
region just beneath the plane of amputation was present in the vehicle-exposed larvae at
1dpa, but msxe expression was absent in the Beclomethasone exposed larvae (Fig. 7.
C,D). Similarly, the junbl blastema marker which was highly expressed in the blastema of
the vehicle-exposed larvae at 1 dpa was completely absent in Beclomethasone-exposed
larvae (Fig. 7.E,F), suggesting that, GR activation by Beclomethasone inhibits blastema
formation which is essential for fin regeneration. Additionally, we also assessed the
formation of blastema at 1dpa by light microscopic analysis of semi-thin sections of
vehicle- or Beclomethasone-exposed larvae. In the vehicle-exposed larva, a solid dense
blastema (B) was formed immediately proximally to the amputation site (Fig. 7. G). In
the Beclomethasone-exposed larvae, cells were very loosely arranged and separated by
wide empty spaces (intercellular spongiosis/edema) immediately proximal to the
amputation site, resulting in the formation of abnormal blastema (aB) (Fig. 7 H1, H2). In
addition, many of the epithelial cells (E) in Beclomethasone-treated larvae displayed
cytoplasmic vacuolation and the epithelium was separated from deeper cell layers.
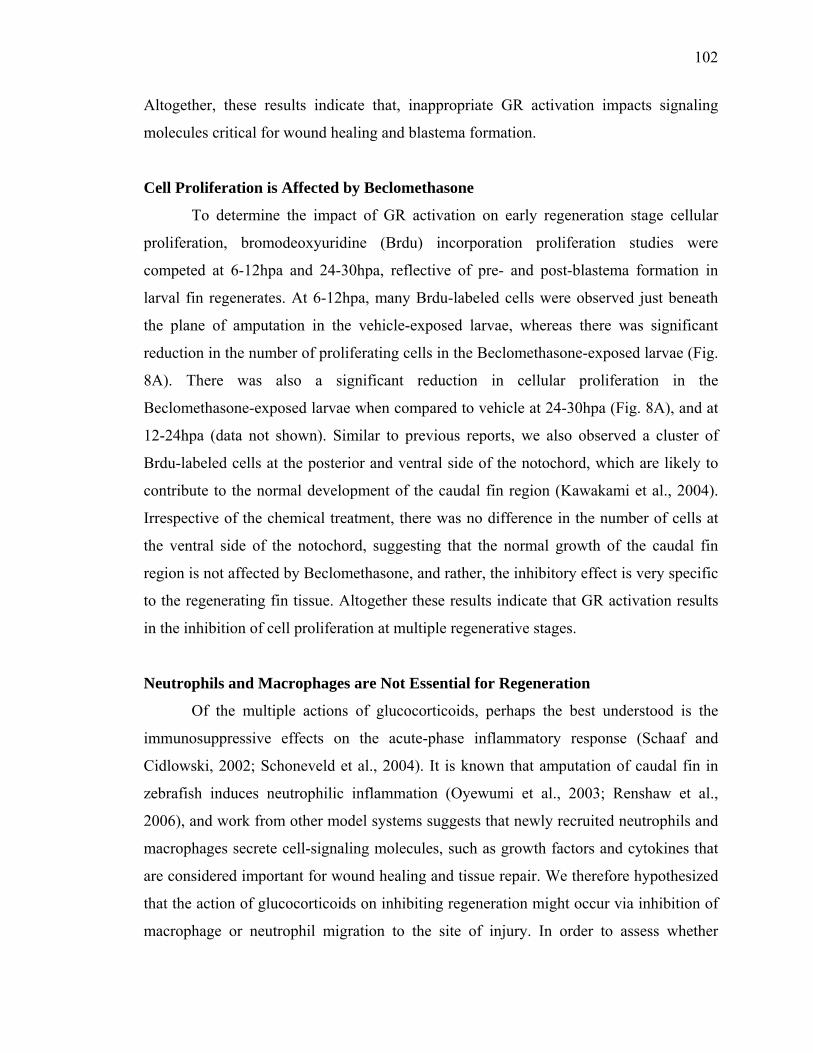
102
Altogether, these results indicate that, inappropriate GR activation impacts signaling
molecules critical for wound healing and blastema formation.
Cell Proliferation is Affected by Beclomethasone
To determine the impact of GR activation on early regeneration stage cellular
proliferation, bromodeoxyuridine (Brdu) incorporation proliferation studies were
competed at 6-12hpa and 24-30hpa, reflective of pre- and post-blastema formation in
larval fin regenerates. At 6-12hpa, many Brdu-labeled cells were observed just beneath
the plane of amputation in the vehicle-exposed larvae, whereas there was significant
reduction in the number of proliferating cells in the Beclomethasone-exposed larvae (Fig.
8A). There was also a significant reduction in cellular proliferation in the
Beclomethasone-exposed larvae when compared to vehicle at 24-30hpa (Fig. 8A), and at
12-24hpa (data not shown). Similar to previous reports, we also observed a cluster of
Brdu-labeled cells at the posterior and ventral side of the notochord, which are likely to
contribute to the normal development of the caudal fin region (Kawakami et al., 2004).
Irrespective of the chemical treatment, there was no difference in the number of cells at
the ventral side of the notochord, suggesting that the normal growth of the caudal fin
region is not affected by Beclomethasone, and rather, the inhibitory effect is very specific
to the regenerating fin tissue. Altogether these results indicate that GR activation results
in the inhibition of cell proliferation at multiple regenerative stages.
Neutrophils and Macrophages are Not Essential for Regeneration
Of the multiple actions of glucocorticoids, perhaps the best understood is the
immunosuppressive effects on the acute-phase inflammatory response (Schaaf and
Cidlowski, 2002; Schoneveld et al., 2004). It is known that amputation of caudal fin in
zebrafish induces neutrophilic inflammation (Oyewumi et al., 2003; Renshaw et al.,
2006), and work from other model systems suggests that newly recruited neutrophils and
macrophages secrete cell-signaling molecules, such as growth factors and cytokines that
are considered important for wound healing and tissue repair. We therefore hypothesized
that the action of glucocorticoids on inhibiting regeneration might occur via inhibition of
macrophage or neutrophil migration to the site of injury. In order to assess whether
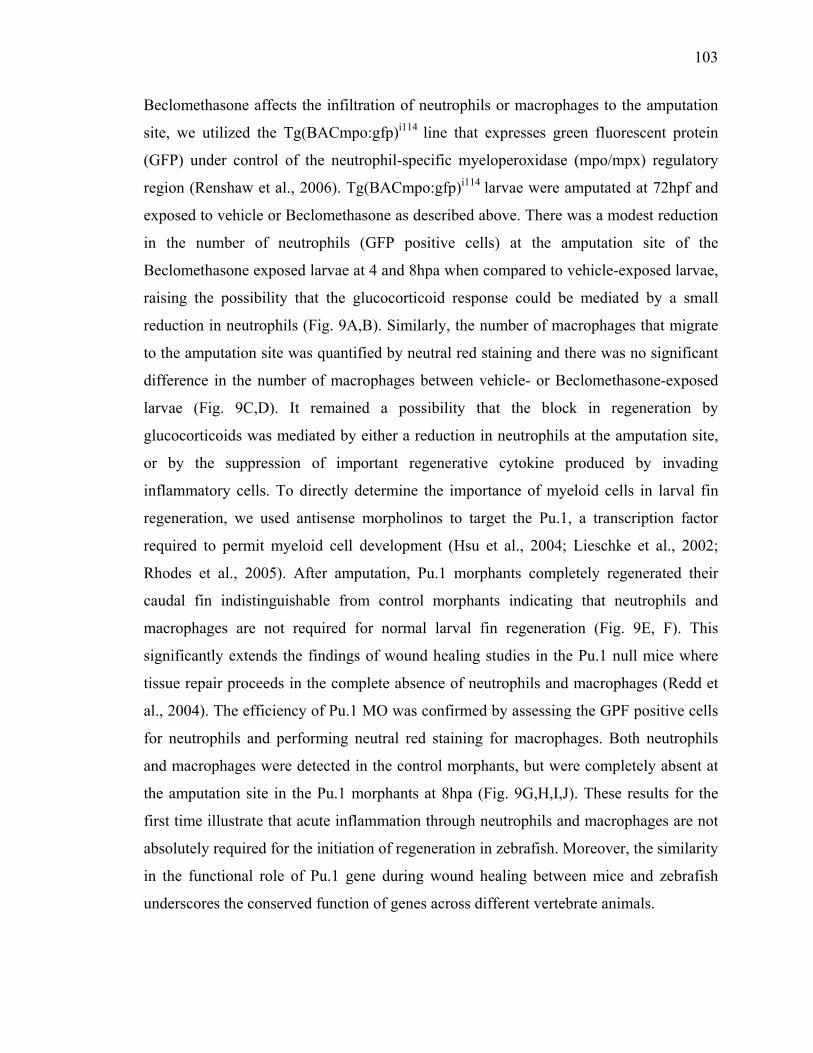
103
Beclomethasone affects the infiltration of neutrophils or macrophages to the amputation
site, we utilized the Tg(BACmpo:gfp)i114 line that expresses green fluorescent protein
(GFP) under control of the neutrophil-specific myeloperoxidase (mpo/mpx) regulatory
region (Renshaw et al., 2006). Tg(BACmpo:gfp)i114 larvae were amputated at 72hpf and
exposed to vehicle or Beclomethasone as described above. There was a modest reduction
in the number of neutrophils (GFP positive cells) at the amputation site of the
Beclomethasone exposed larvae at 4 and 8hpa when compared to vehicle-exposed larvae,
raising the possibility that the glucocorticoid response could be mediated by a small
reduction in neutrophils (Fig. 9A,B). Similarly, the number of macrophages that migrate
to the amputation site was quantified by neutral red staining and there was no significant
difference in the number of macrophages between vehicle- or Beclomethasone-exposed
larvae (Fig. 9C,D). It remained a possibility that the block in regeneration by
glucocorticoids was mediated by either a reduction in neutrophils at the amputation site,
or by the suppression of important regenerative cytokine produced by invading
inflammatory cells. To directly determine the importance of myeloid cells in larval fin
regeneration, we used antisense morpholinos to target the Pu.1, a transcription factor
required to permit myeloid cell development (Hsu et al., 2004; Lieschke et al., 2002;
Rhodes et al., 2005). After amputation, Pu.1 morphants completely regenerated their
caudal fin indistinguishable from control morphants indicating that neutrophils and
macrophages are not required for normal larval fin regeneration (Fig. 9E, F). This
significantly extends the findings of wound healing studies in the Pu.1 null mice where
tissue repair proceeds in the complete absence of neutrophils and macrophages (Redd et
al., 2004). The efficiency of Pu.1 MO was confirmed by assessing the GPF positive cells
for neutrophils and performing neutral red staining for macrophages. Both neutrophils
and macrophages were detected in the control morphants, but were completely absent at
the amputation site in the Pu.1 morphants at 8hpa (Fig. 9G,H,I,J). These results for the
first time illustrate that acute inflammation through neutrophils and macrophages are not
absolutely required for the initiation of regeneration in zebrafish. Moreover, the similarity
in the functional role of Pu.1 gene during wound healing between mice and zebrafish
underscores the conserved function of genes across different vertebrate animals.
104
Conclusions
Numerous human conditions could be significantly improved if therapies that encourage
tissue regeneration were available. Our findings illustrate the power of in vivo chemical
genetics to identify novel bioactive compounds, and their molecular targets, that together
function to modulate tissue regeneration. The genetic and molecular utilities of this early
life stage regeneration model such as transient and stable transgenics, genetic mutant
screens, rapid antisense repression, and the controlled use of chemical genetics makes
this vertebrate regeneration model an outstanding discovery platform. The results
generated can be rapidly evaluated in other regenerative models. By utilizing the power
of comparative approaches, the most exciting outcome will be a molecular explanation
for the observed differences in regenerative capacity across taxa, and will reveal
pathways for therapeutic interventions.
105
References
Akimenko MA, Mari-Beffa M, Becerra J and Geraudie J (2003) Old questions, new tools, and some answers to the mystery of fin regeneration. Dev Dyn 226:190-201.
Andreasen EA, Mathew LK and Tanguay RL (2006) Regenerative Growth is Impacted by TCDD: Gene Expression Analysis Reveals Extracellular Matrix Modulation. Toxicol Sci 92:254-269.
Bader D and Oberpriller JO (1978) Repair and reorganization of minced cardiac muscle in the adult newt (Notophthalmus viridescens). J Morphol 155:349-57.
Bayliss PE, Bellavance KL, Whitehead GG, Abrams JM, Aegerter S, Robbins HS, Cowan DB, Keating MT, O'Reilly T, Wood JM, Roberts TM and Chan J (2006) Chemical modulation of receptor signaling inhibits regenerative angiogenesis in adult zebrafish. Nat Chem Biol 2:265-73.
Brockes JP and Kumar A (2005) Appendage regeneration in adult vertebrates and implications for regenerative medicine. Science 310:1919-23.
Carlstedt-Duke J and Gustafsson JA (1987) Structure and function of the glucocorticoid receptor. J Steroid Biochem 27:99-104.
Chen W, Rogatsky I and Garabedian MJ (2006) MED14 and MED1 differentially regulate target-specific gene activation by the glucocorticoid receptor. Mol Endocrinol 20:560-72.
Croxtall JD, van Hal PT, Choudhury Q, Gilroy DW and Flower RJ (2002) Different glucocorticoids vary in their genomic and non-genomic mechanism of action in A549 cells. Br J Pharmacol 135:511-9.
Ding S and Schultz PG (2004) A role for chemistry in stem cell biology. Nat Biotechnol 22:833-40.
Fujisawa T (2003) Hydra regeneration and epitheliopeptides. Dev Dyn 226:182-9. Goulding NJ (2004) The molecular complexity of glucocorticoid actions in inflammation
- a four-ring circus. Curr Opin Pharmacol 4:629-36. Gustafsson JA, Carlstedt-Duke J, Poellinger L, Okret S, Wikstrom AC, Bronnegard M,
Gillner M, Dong Y, Fuxe K and Cintra A (1987) Biochemistry, molecular biology, and physiology of the glucocorticoid receptor. Endocr Rev 8:185-234.
Hsu K, Traver D, Kutok JL, Hagen A, Liu TX, Paw BH, Rhodes J, Berman JN, Zon LI, Kanki JP and Look AT (2004) The pu.1 promoter drives myeloid gene expression in zebrafish. Blood 104:1291-7.
Kawakami A, Fukazawa T and Takeda H (2004) Early fin primordia of zebrafish larvae regenerate by a similar growth control mechanism with adult regeneration. Dev Dyn 231:693-9.
Lien CL, Schebesta M, Makino S, Weber GJ and Keating MT (2006) Gene Expression Analysis of Zebrafish Heart Regeneration. PLoS Biol 4.
Lieschke GJ, Oates AC, Paw BH, Thompson MA, Hall NE, Ward AC, Ho RK, Zon LI and Layton JE (2002) Zebrafish SPI-1 (PU.1) marks a site of myeloid development independent of primitive erythropoiesis: implications for axial patterning. Dev Biol 246:274-95.
106
Love DR, Pichler FB, Dodd A, Copp BR and Greenwood DR (2004) Technology for high-throughput screens: the present and future using zebrafish. Curr Opin Biotechnol 15:564-71.
Lu NZ and Cidlowski JA (2004) The origin and functions of multiple human glucocorticoid receptor isoforms. Ann N Y Acad Sci 1024:102-23.
Lu NZ and Cidlowski JA (2006) Glucocorticoid receptor isoforms generate transcription specificity. Trends Cell Biol.
MacRae CA and Peterson RT (2003) Zebrafish-based small molecule discovery. Chem Biol 10:901-8.
Mathew LK, Andreasen EA and Tanguay RL (2006) Aryl hydrocarbon receptor activation inhibits regenerative growth. Mol Pharmacol 69:257-65.
Mescher AL (1996) The cellular basis of limb regeneration in urodeles. Int J Dev Biol 40:785-95.
Nakatani Y, Kawakami A and Kudo A (2007) Cellular and molecular processes of regeneration, with special emphasis on fish fins. Dev Growth Differ 49:145-54.
Nasevicius A and Ekker SC (2000) Effective targeted gene 'knockdown' in zebrafish. Nat Genet 26:216-20.
Oakley RH, Jewell CM, Yudt MR, Bofetiado DM and Cidlowski JA (1999) The dominant negative activity of the human glucocorticoid receptor beta isoform. Specificity and mechanisms of action. J Biol Chem 274:27857-66.
Oyewumi MO, Liu S, Moscow JA and Mumper RJ (2003) Specific association of thiamine-coated gadolinium nanoparticles with human breast cancer cells expressing thiamine transporters. Bioconjug Chem 14:404-11.
Peterson RT and Fishman MC (2004) Discovery and use of small molecules for probing biological processes in zebrafish. Methods Cell Biol 76:569-91.
Peterson RT, Link BA, Dowling JE and Schreiber SL (2000) Small molecule developmental screens reveal the logic and timing of vertebrate development. Proc Natl Acad Sci U S A 97:12965-9.
Peterson RT, Shaw SY, Peterson TA, Milan DJ, Zhong TP, Schreiber SL, MacRae CA and Fishman MC (2004) Chemical suppression of a genetic mutation in a zebrafish model of aortic coarctation. Nat Biotechnol 22:595-9.
Poss KD, Keating MT and Nechiporuk A (2003) Tales of regeneration in zebrafish. Dev Dyn 226:202-210.
Poss KD, Shen J and Keating MT (2000a) Induction of lef1 during zebrafish fin regeneration. Dev Dyn 219:282-6.
Poss KD, Shen J, Nechiporuk A, McMahon G, Thisse B, Thisse C and Keating MT (2000b) Roles for Fgf signaling during zebrafish fin regeneration. Dev Biol 222:347-58.
Redd MJ, Cooper L, Wood W, Stramer B and Martin P (2004) Wound healing and inflammation: embryos reveal the way to perfect repair. Philos Trans R Soc Lond B Biol Sci 359:777-84.
Renshaw SA, Loynes CA, Trushell DM, Elworthy S, Ingham PW and Whyte MK (2006) A transgenic zebrafish model of neutrophilic inflammation. Blood 108:3976-8.
Rhodes J, Hagen A, Hsu K, Deng M, Liu TX, Look AT and Kanki JP (2005) Interplay of pu.1 and gata1 determines myelo-erythroid progenitor cell fate in zebrafish. Dev Cell 8:97-108.
107
Rogatsky I, Wang JC, Derynck MK, Nonaka DF, Khodabakhsh DB, Haqq CM, Darimont BD, Garabedian MJ and Yamamoto KR (2003) Target-specific utilization of transcriptional regulatory surfaces by the glucocorticoid receptor. Proc Natl Acad Sci U S A 100:13845-50.
Schaaf MJ and Cidlowski JA (2002) Molecular mechanisms of glucocorticoid action and resistance. J Steroid Biochem Mol Biol 83:37-48.
Schebesta M, Lien CL, Engel FB and Keating MT (2006) Transcriptional profiling of caudal fin regeneration in zebrafish. ScientificWorldJournal 6:38-54.
Schier AF, Neuhauss SC, Helde KA, Talbot WS and Driever W (1997) The one-eyed pinhead gene functions in mesoderm and endoderm formation in zebrafish and interacts with no tail. Development 124:327-42.
Schoneveld OJ, Gaemers IC and Lamers WH (2004) Mechanisms of glucocorticoid signalling. Biochim Biophys Acta 1680:114-28.
Sekiya I, Koopman P, Tsuji K, Mertin S, Harley V, Yamada Y, Shinomiya K, Nifuji A and Noda M (2001) Dexamethasone enhances SOX9 expression in chondrocytes. J Endocrinol 169:573-9.
Shafizadeh E, Peterson RT and Lin S (2004) Induction of reversible hemolytic anemia in living zebrafish using a novel small molecule. Comp Biochem Physiol C Toxicol Pharmacol 138:245-9.
Stoick-Cooper CL, Weidinger G, Riehle KJ, Hubbert C, Major MB, Fausto N and Moon RT (2007) Distinct Wnt signaling pathways have opposing roles in appendage regeneration. Development 134:479-89.
Wang JC, Derynck MK, Nonaka DF, Khodabakhsh DB, Haqq C and Yamamoto KR (2004) Chromatin immunoprecipitation (ChIP) scanning identifies primary glucocorticoid receptor target genes. Proc Natl Acad Sci U S A 101:15603-8.
Zodrow JM and Tanguay RL (2003) 2,3,7,8-tetrachlorodibenzo-p-dioxin inhibits zebrafish caudal fin regeneration. Toxicol Sci 76:151-161.
Zon LI and Peterson RT (2005) In vivo drug discovery in the zebrafish. Nat Rev Drug Discov 4:35-44.

108
Acknowledgements
We would like to thank Ms. Jane LaDu, Kay Fischer, Jessica Perry and Laura Young for
their technical assistance. These studies were supported in part by NIEHS grants
ES10820, ES00210, and ES03850, Oregon Medical Research Foundation grant and pre-
doctoral fellowship from American Heart Association (LKM).
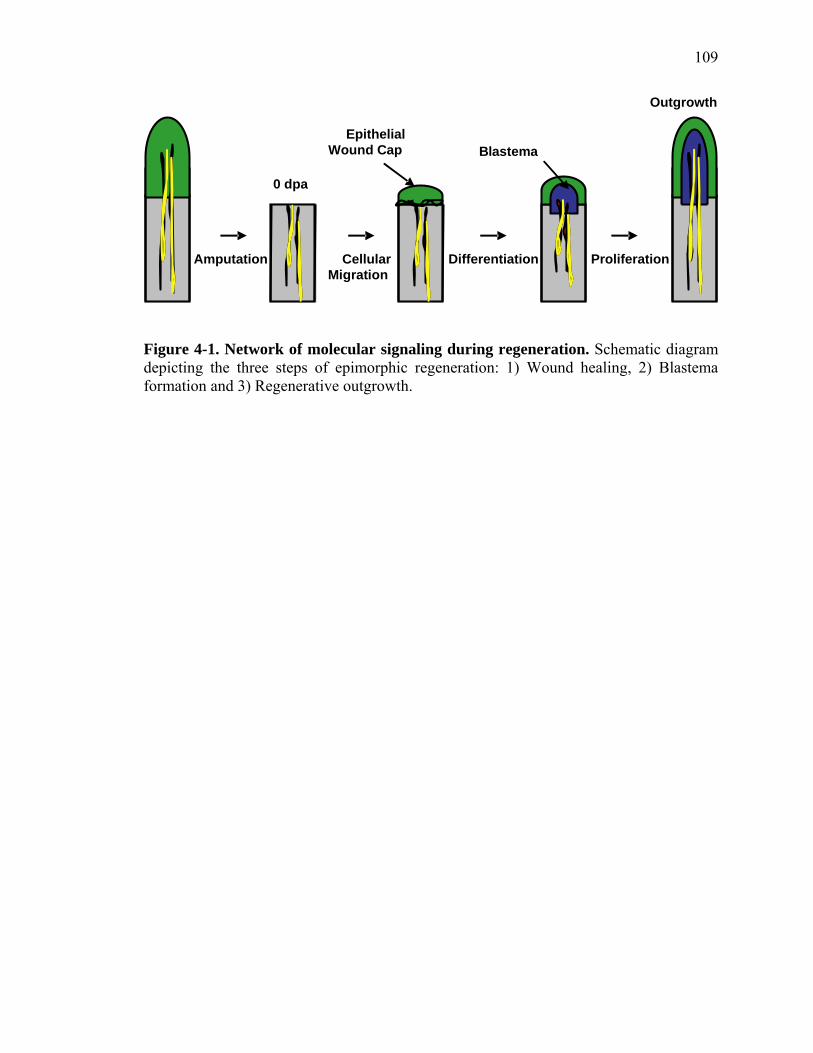
109
0 dpa
Amputation
Outgrowth
EpithelialWound Cap Blastema
CellularMigration
Differentiation Proliferation
Figure 4-1. Network of molecular signaling during regeneration. Schematic diagram depicting the three steps of epimorphic regeneration: 1) Wound healing, 2) Blastema formation and 3) Regenerative outgrowth.
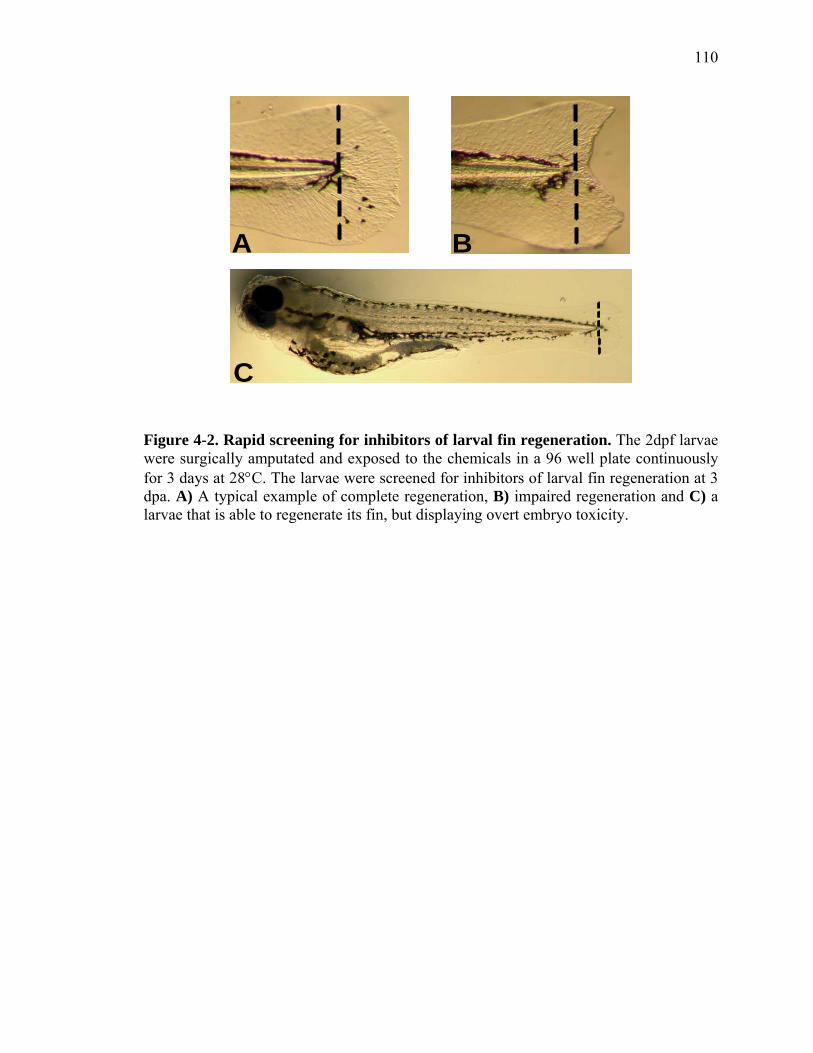
110
A B
C
Figure 4-2. Rapid screening for inhibitors of larval fin regeneration. The 2dpf larvae were surgically amputated and exposed to the chemicals in a 96 well plate continuously for 3 days at 28°C. The larvae were screened for inhibitors of larval fin regeneration at 3 dpa. A) A typical example of complete regeneration, B) impaired regeneration and C) a larvae that is able to regenerate its fin, but displaying overt embryo toxicity.

111
Figure 4-3. Glucocorticoids inhibit regeneration. A) The caudal fin primordia of larvae at 2 dpf were amputated and exposed to vehicle or glucocorticoid continuously for 3 days at 28°C. The regeneration images were captured at 3 dpa and the broken line indicates the plane of amputation. These images are representative of 12 larvae. B) Tissue regenerate length from the original plane of amputation measured at 3 dpa in the presence of the indicated concentrations of selected glucocorticoids. The regenerate length was calculated from the center of the plane of amputation to the tip of the regenerating fin. C) The inhibitory effect of glucocorticoids on regeneration was also assessed in adults to determine if chemical “hits” from the larval screen would be predictive for the more well-established adult regeneration model. Adult zebrafish were amputated and continuously exposed to Beclomethasone (0.005mg/L) (n=6). The images were captured at 5 dpa and the arrow indicates the plane of amputation.
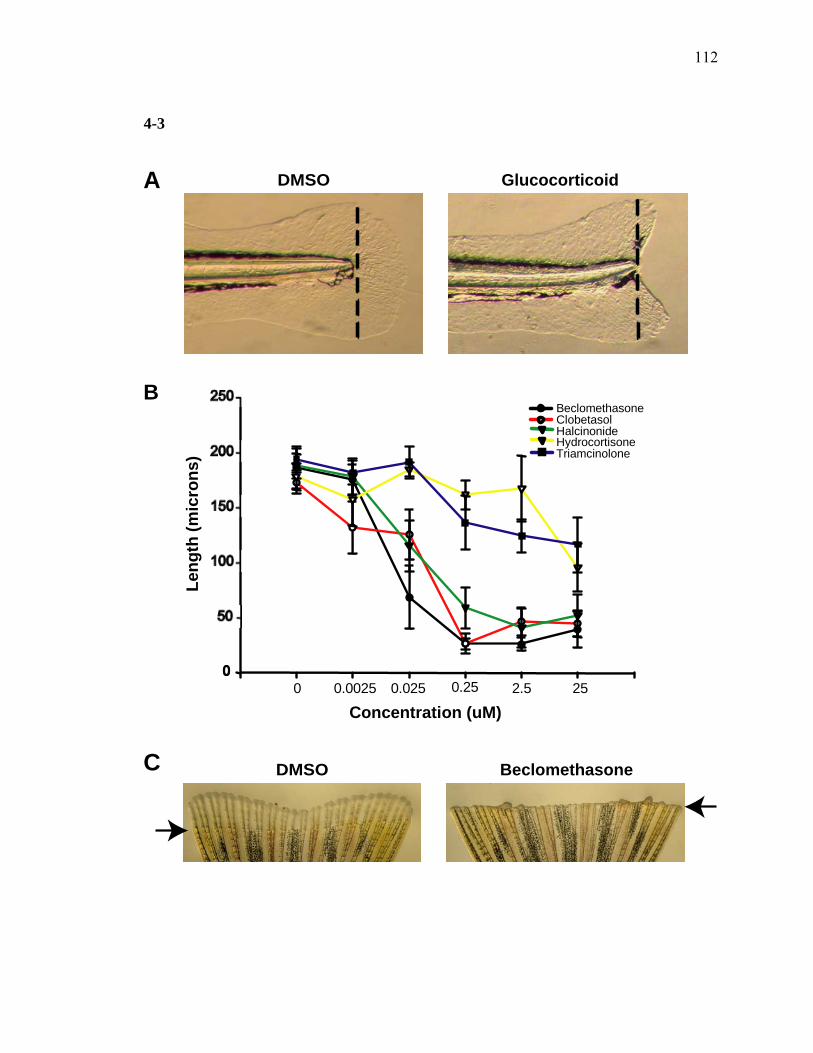
112
4-3
DMSO Glucocorticoid
DMSO Beclomethasone
A
C
BBeclomethasoneClobetasolHalcinonideHydrocortisoneTriamcinolone
Leng
th (m
icro
ns)
0 0.0025 0.025 0.25 2.5 25
Concentration (uM)
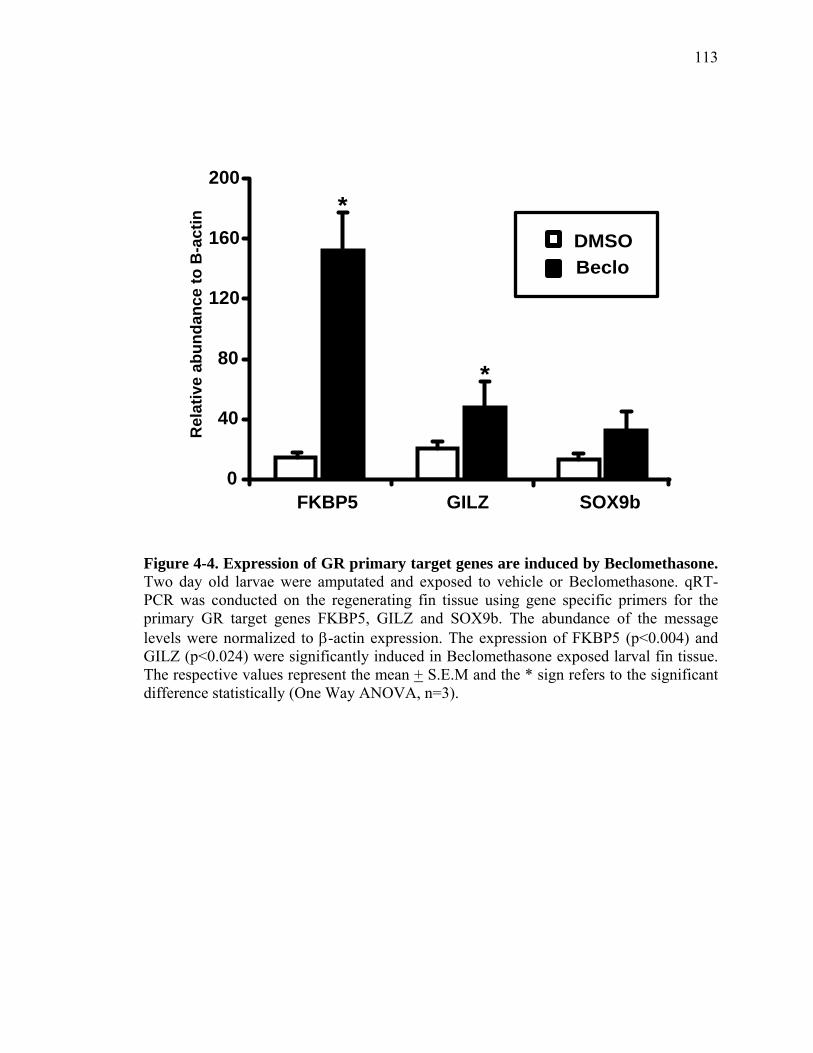
113
DMSOBeclo
0
40
80
120
160
200
FKBP5 GILZ SOX9b
*
*
Rel
ativ
e ab
unda
nce
to B
-act
in
Figure 4-4. Expression of GR primary target genes are induced by Beclomethasone. Two day old larvae were amputated and exposed to vehicle or Beclomethasone. qRT-PCR was conducted on the regenerating fin tissue using gene specific primers for the primary GR target genes FKBP5, GILZ and SOX9b. The abundance of the message levels were normalized to β-actin expression. The expression of FKBP5 (p<0.004) and GILZ (p<0.024) were significantly induced in Beclomethasone exposed larval fin tissue. The respective values represent the mean + S.E.M and the * sign refers to the significant difference statistically (One Way ANOVA, n=3).
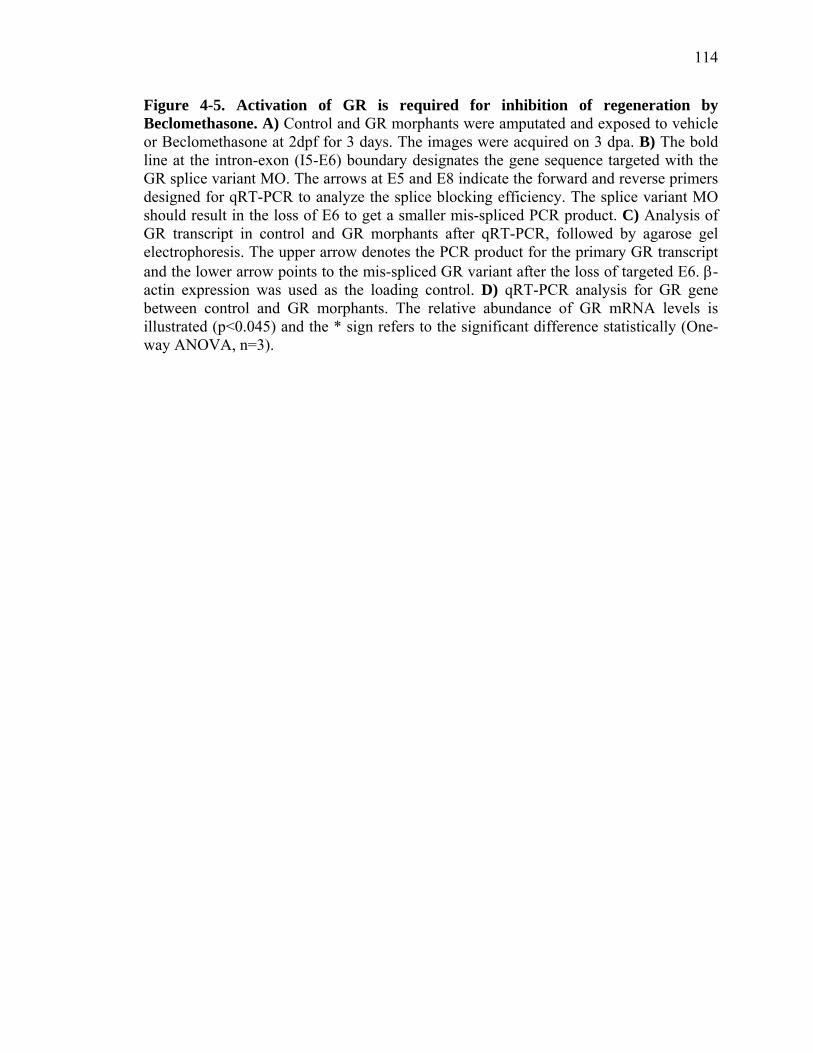
114
Figure 4-5. Activation of GR is required for inhibition of regeneration by Beclomethasone. A) Control and GR morphants were amputated and exposed to vehicle or Beclomethasone at 2dpf for 3 days. The images were acquired on 3 dpa. B) The bold line at the intron-exon (I5-E6) boundary designates the gene sequence targeted with the GR splice variant MO. The arrows at E5 and E8 indicate the forward and reverse primers designed for qRT-PCR to analyze the splice blocking efficiency. The splice variant MO should result in the loss of E6 to get a smaller mis-spliced PCR product. C) Analysis of GR transcript in control and GR morphants after qRT-PCR, followed by agarose gel electrophoresis. The upper arrow denotes the PCR product for the primary GR transcript and the lower arrow points to the mis-spliced GR variant after the loss of targeted E6. β-actin expression was used as the loading control. D) qRT-PCR analysis for GR gene between control and GR morphants. The relative abundance of GR mRNA levels is illustrated (p<0.045) and the * sign refers to the significant difference statistically (One-way ANOVA, n=3).
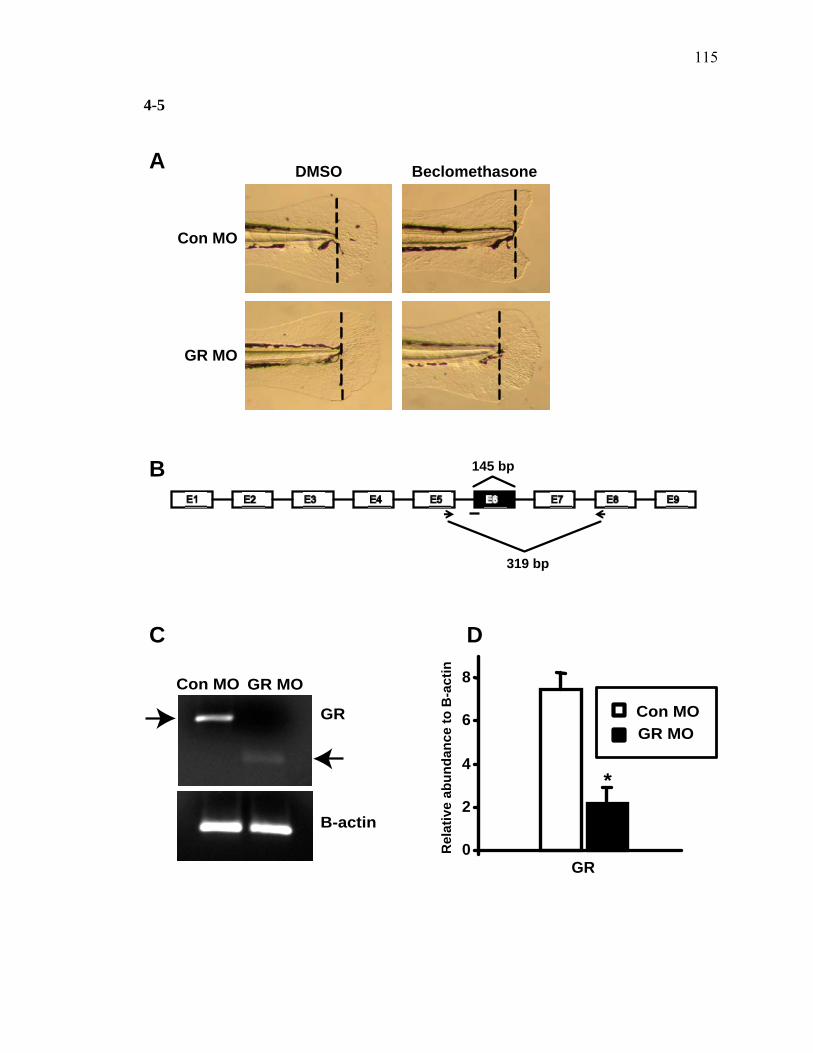
115
4-5
DMSO Beclomethasone
Con MO
GR MO
0
2
4
6
8
Con MOGR MO
*
GR
Rel
ativ
e ab
unda
nce
to B
-act
in
319 bp
145 bpB
A
Con MO GR MO
GR
B-actin
C D
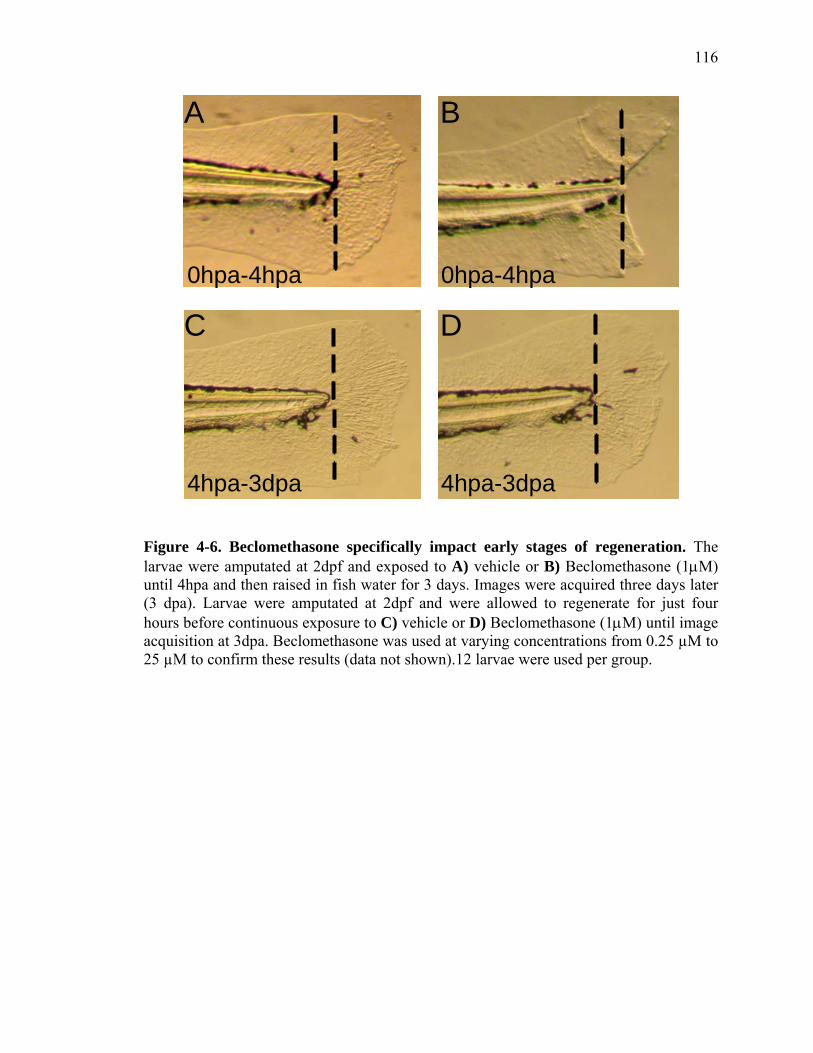
116
DMSO Beclomethasone
0hpa-4hpa 0hpa-4hpa
A B
4hpa-3dpa
C
4hpa-3dpa
D
Figure 4-6. Beclomethasone specifically impact early stages of regeneration. The larvae were amputated at 2dpf and exposed to A) vehicle or B) Beclomethasone (1μM) until 4hpa and then raised in fish water for 3 days. Images were acquired three days later (3 dpa). Larvae were amputated at 2dpf and were allowed to regenerate for just four hours before continuous exposure to C) vehicle or D) Beclomethasone (1μM) until image acquisition at 3dpa. Beclomethasone was used at varying concentrations from 0.25 µM to 25 µM to confirm these results (data not shown).12 larvae were used per group.
117
Figure 4-7. Wound healing and blastema formation is affected by Beclomethasone. In situ hybridization was performed with amputated larvae exposed and vehicle or Beclomethasone using different molecular markers at 1dpa. The expression of wound epithelium and blastema markers in the regenerating fin at 1dpa exposed to vehicle or Beclomethasone, A,B) dlx5a C,D) msxe and E,F) junbl. G) Images are of methylene blue-stained semi-thin sections of larvae taken at 400x by light microscopy. Two images of the same Beclomethasone exposed larvae sectioned at different levels are depicted as H1 and H2. Orientation of Beclomethasone treated larvae within the blocks was slightly oblique. The level of the amputation site was identified by the presence of multifocal necrosis with the notochord. The arrowhead indicates the plane of amputation. Blastema – B; Abnormal Blastema – aB; Epithelium – E; Melanocyte – M; Notochord – N.
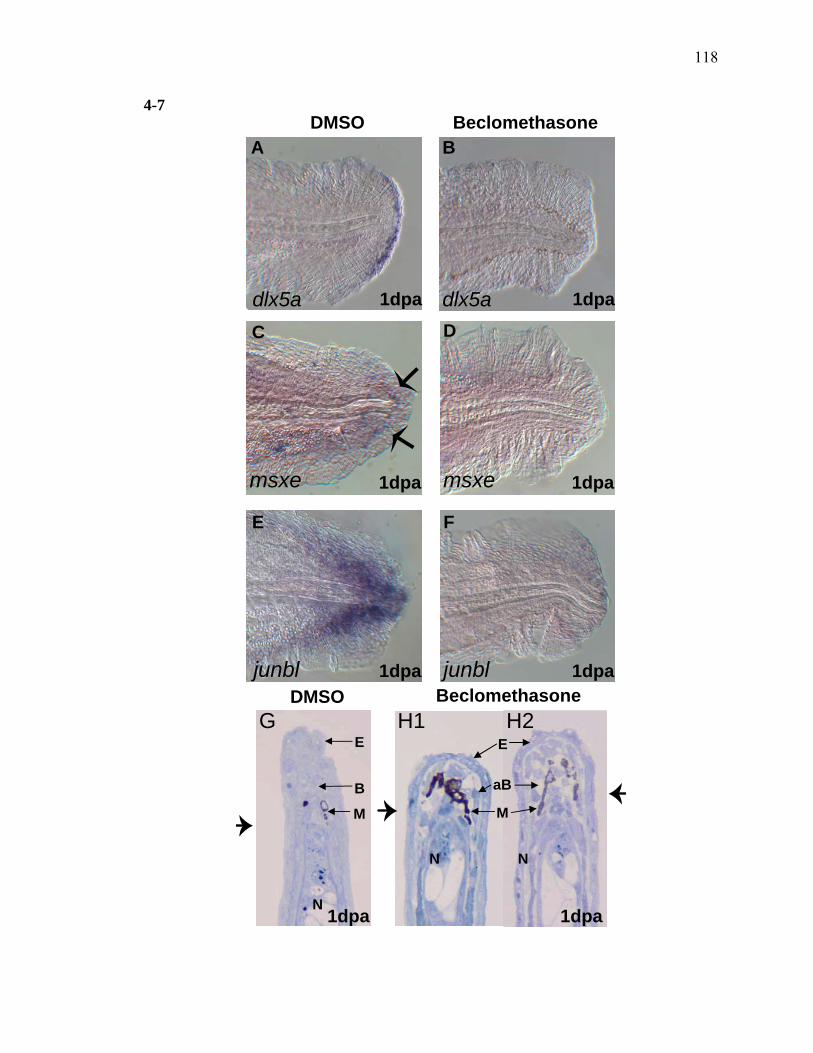
118
4-7 DMSO Beclomethasone
1dpa 1dpadlx5a dlx5a
A B
DMSO
E
B
N
M
GBeclomethasone
H1
aB
E
NN
M
H2
1dpa 1dpa
msxe msxe1dpa 1dpa
C D
1dpa 1dpajunbl junbl
E F
1dpa 1dpa
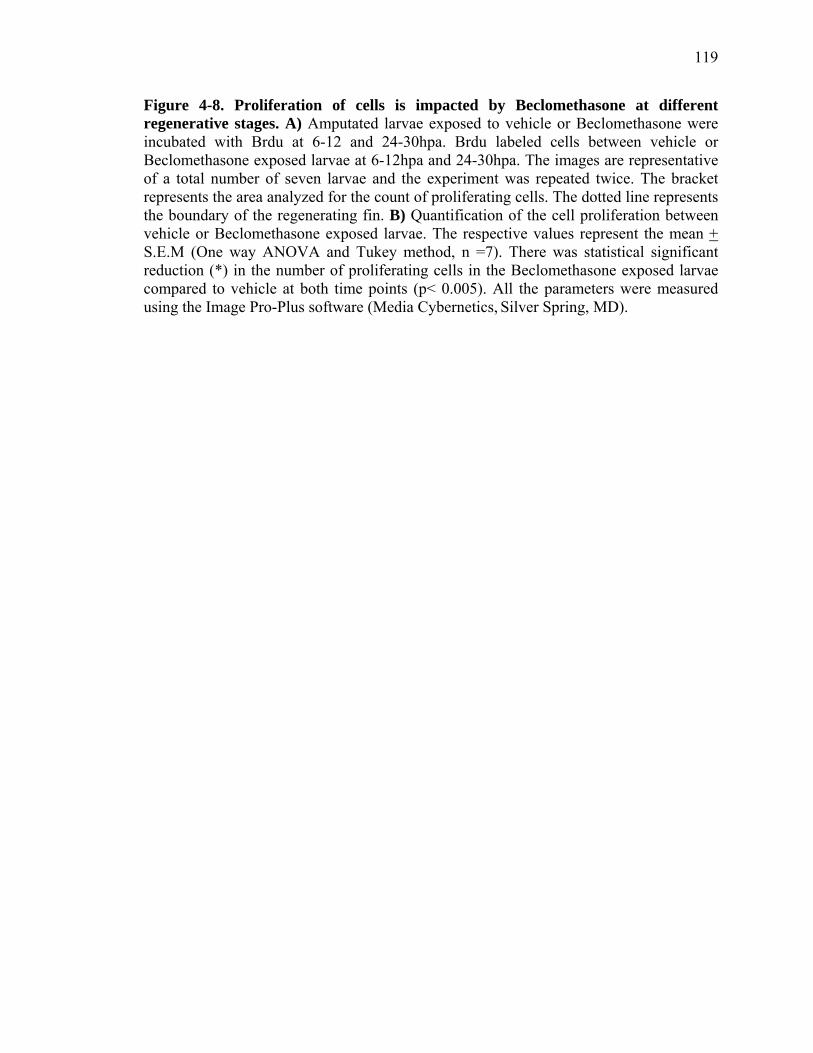
119
Figure 4-8. Proliferation of cells is impacted by Beclomethasone at different regenerative stages. A) Amputated larvae exposed to vehicle or Beclomethasone were incubated with Brdu at 6-12 and 24-30hpa. Brdu labeled cells between vehicle or Beclomethasone exposed larvae at 6-12hpa and 24-30hpa. The images are representative of a total number of seven larvae and the experiment was repeated twice. The bracket represents the area analyzed for the count of proliferating cells. The dotted line represents the boundary of the regenerating fin. B) Quantification of the cell proliferation between vehicle or Beclomethasone exposed larvae. The respective values represent the mean + S.E.M (One way ANOVA and Tukey method, n =7). There was statistical significant reduction (*) in the number of proliferating cells in the Beclomethasone exposed larvae compared to vehicle at both time points (p< 0.005). All the parameters were measured using the Image Pro-Plus software (Media Cybernetics, Silver Spring, MD).
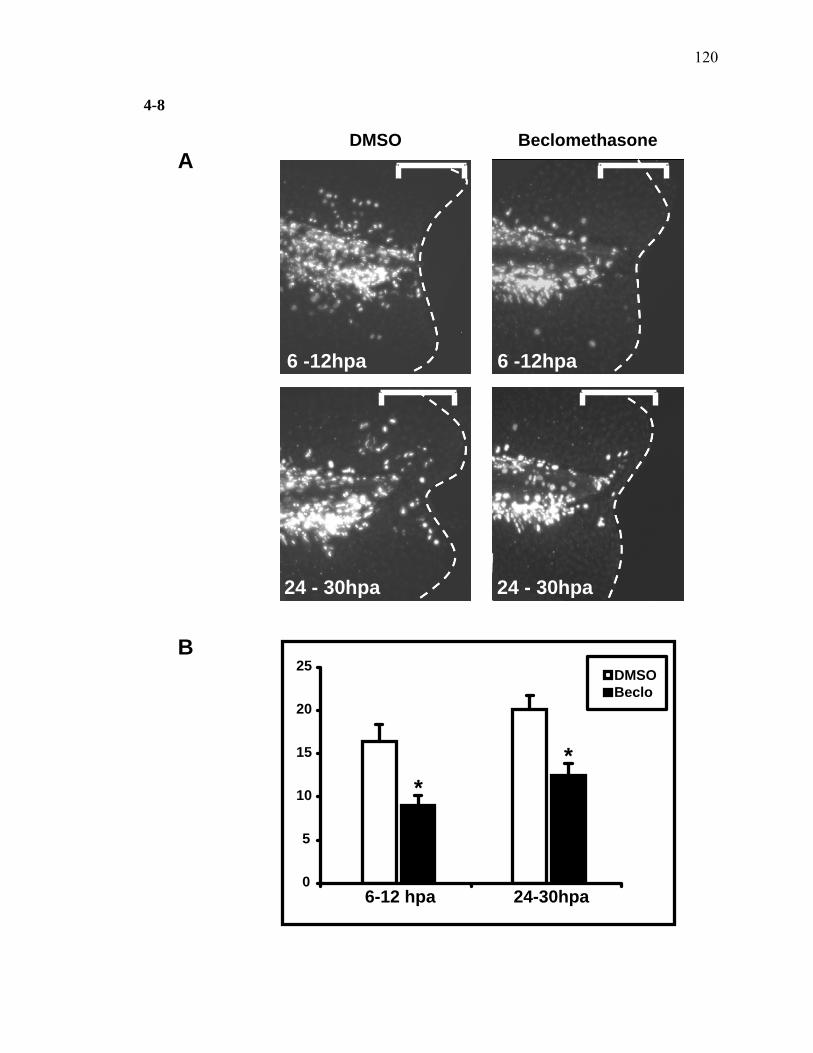
120
4-8
0
5
10
15
20
25
6-12 hpa 24-30hpa
DMSOBeclo
**
24 - 30hpa
DMSO
6 -12hpa
Beclomethasone
6 -12hpa
24 - 30hpa
A
B
121
Figure 4-9. Neutrophils and Macrophages are not critical for regeneration. A) Neutrophil migration assay performed on vehicle or Beclomethasone exposed larvae at various time points. B) An image depicting the neutrophil migration to the wound site and the GFP positive cells were counted as part of the development of this assay. C) Macrophage migration assay was performed as described above using neutral red staining. D) A representative image showing the macrophages that are stained red at the amputation site. E) Control morphants and F) Pu.1 morphants completely regenerate the fin tissue. Images of G) control and H) Pu.1 morphant stained with neutral red at 8hpa.12 larvae were used for each group. The statistical analysis was conducted by One way ANOVA, with Bonferroni post test correction for multiple comparisons (Prism, GraphPad) and the (*) sign refers that the difference between number of neutrophils at 4 and 8hpa are statistically significant.
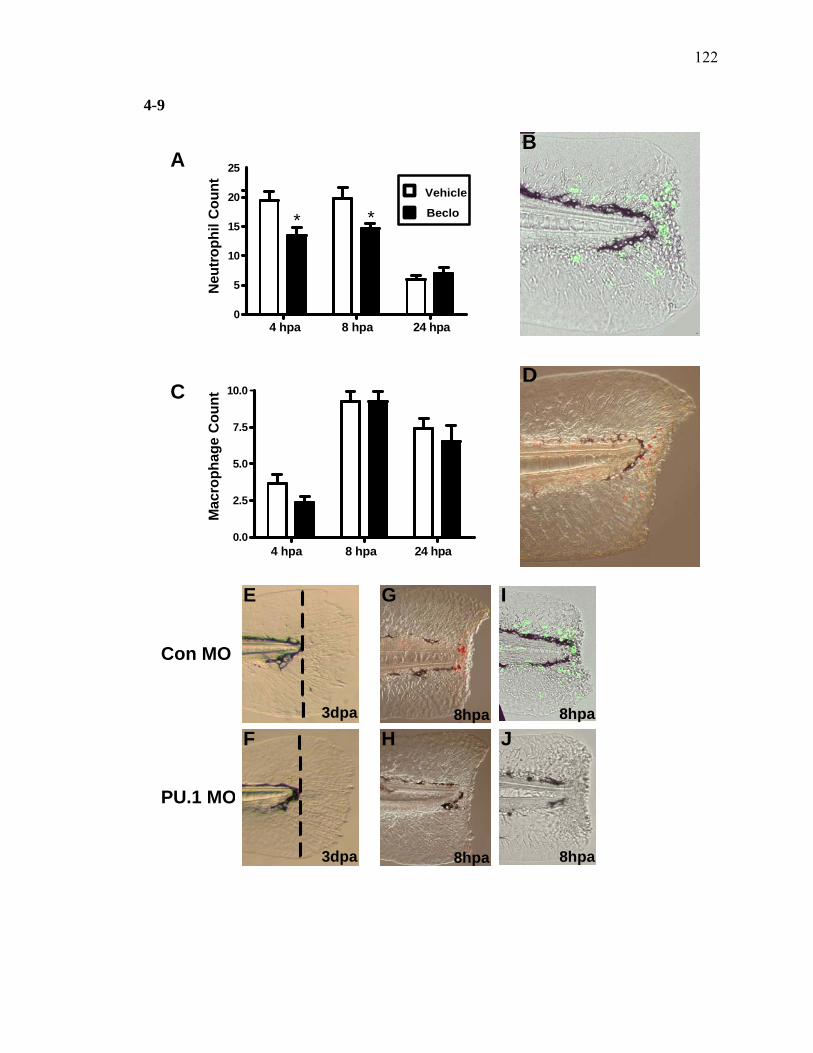
122
4-9
A
C
Con MO
PU.1 MO
D
G
H
E
F3dpa
3dpa
8hpa
8hpa
4 hpa 8 hpa 24 hpa0
5
10
15
20
25
* *Vehicle
BecloN
eutr
ophi
l Cou
nt
0.0
2.5
5.0
7.5
10.0
Mac
roph
age
Cou
nt
4 hpa 8 hpa 24 hpa
8hpa
8hpa
I
J
B
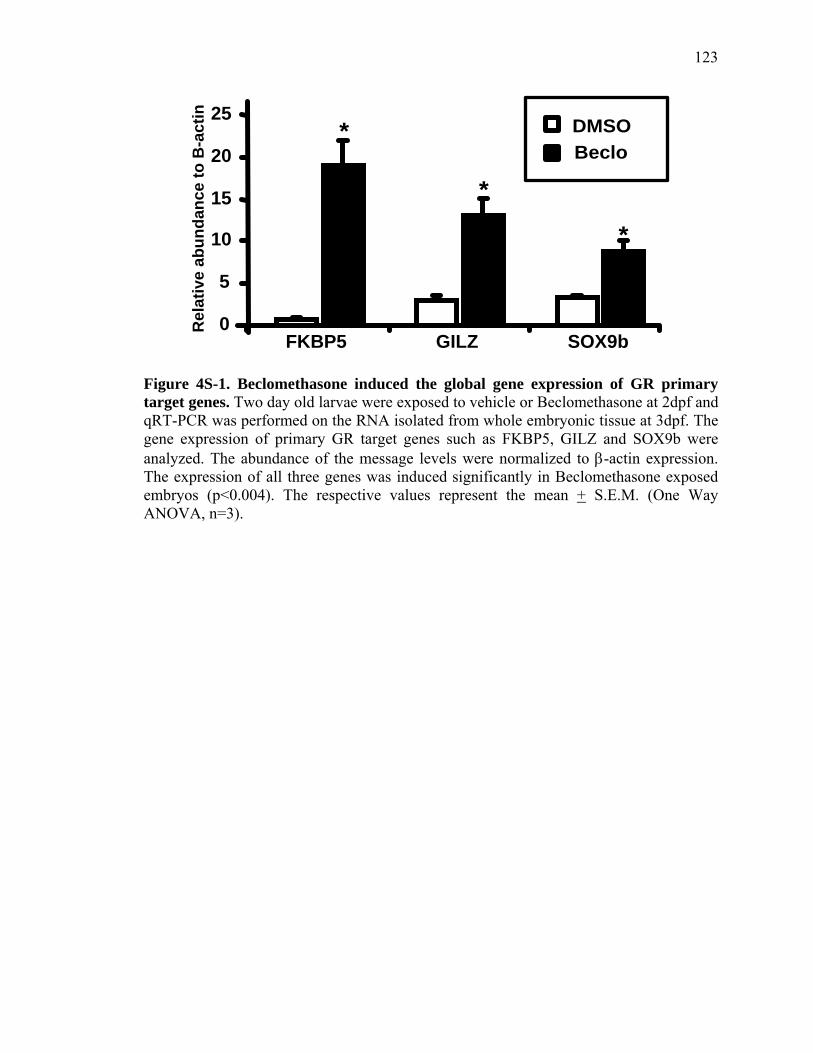
123
Rel
ativ
e ab
unda
nce
to B
-act
in
FKBP5 GILZ0
5
10
15
20
25
SOX9b
*
*
*
DMSOBeclo
Figure 4S-1. Beclomethasone induced the global gene expression of GR primary target genes. Two day old larvae were exposed to vehicle or Beclomethasone at 2dpf and qRT-PCR was performed on the RNA isolated from whole embryonic tissue at 3dpf. The gene expression of primary GR target genes such as FKBP5, GILZ and SOX9b were analyzed. The abundance of the message levels were normalized to β-actin expression. The expression of all three genes was induced significantly in Beclomethasone exposed embryos (p<0.004). The respective values represent the mean + S.E.M. (One Way ANOVA, n=3).
124
Chapter 5. Comparative Genomic Profiling Reveals Common Regenerative Pathways
Lijoy K Mathew, Sumitra Sengupta, Jessica Perry, Jane LaDu, Eric A Andreasen, Robert
L Tanguay.
Department of Environmental and Molecular Toxicology, Environmental Health
Sciences Center, Oregon State University, Corvallis, OR, 97331.
Formatted for Publication in PLoS Genetics.
125
Abstract
Zebrafish have the remarkable ability to regenerate body parts including the heart,
spinal cord and fins by a process referred to as epimorphic regeneration. Recent studies
have illustrated that similar to adult zebrafish, early life stage-larvae also possess the
ability to regenerate the caudal fin. A comparative genomic analysis was used to
determine the degree of conservation in gene expression among the regenerating adult
caudal fin, adult heart and larval fin. Results indicate that these tissues respond to
amputation/injury with strikingly similar genomic responses. Comparative analysis
revealed raldh2, a rate-limiting enzyme for the synthesis of Retinoic acid (RA), as one of
the highly induced genes across the three regeneration platforms. In situ localization and
functional studies suggest that raldh2 expression is critical for the complete formation of
wound epithelium and blastema, processes which are indispensable for epimorphic
regeneration. Patterning during regenerative outgrowth was previously considered to be
the primary function of RA signaling during regeneration; however our results suggest
that RA signaling is also essential for the initiation of regenerative events. We further
demonstrate that the expression of raldh2 is regulated by Wnt, Fgf and actβA signaling
during regeneration. Since the early life stage larvae are highly amenable to molecular
and genetic manipulations, the larval fin regeneration model offers an outstanding
platform to rapidly identify the molecular signaling events that are required to accomplish
tissue regeneration.
126
Introduction
Injury, disease and aging all result in a loss of tissue and reduced quality of life.
Numerous human conditions could be significantly improved if therapies that encourage
tissue regeneration were available. Most adult tissues and organs, especially in human
beings and other mammals, have lost their regenerative potential. As a result, injury to a
tissue or organ usually results in permanent damage from scarring to disability. The field
of regenerative medicine is aimed at developing strategies to restore individual cell types,
complex tissues, or structures that are lost or damaged. Currently, one of the main
approaches in the field of regenerative medicine is to understand more about the
differentiation of stem cells into specific cell types and then into complex structures
(Bianco and Robey 2001). Alternatively, another strategy is to comprehend how some
organisms have retained the ability to regenerate their tissues, organs and appendages
(Morgan 1900; O'Steen and Walker 1962; Kemp and Park 1970) (reviewed in (Brockes et
al. 2001). By understanding the molecular and genetic pathways that differentially
function in these “lower” animals to accomplish regeneration, we will be in a stronger
position to figure out why mammals fail to respond to tissue injury with a regenerative
mechanism.
Lower vertebrate model systems such as urodele amphibians and teleost fish have
the remarkable ability to regenerate organs such as the heart, spinal cord, retina and
limbs/fins (Santamaria and Becerra 1991; Brockes 1994; Yamada et al. 1995; Akimenko
et al. 2003; Poss et al. 2003). Adult fin regeneration has been studied in a number of
teleost fishes, including goldfish (Morgan 1902; Santamaria et al. 1992; Santamaria et al.
1996), trout (Alonso et al. 2000), tilapia (Kemp and Park 1970; Santamaria et al. 1992)
and minnows (Morgan 1900; Geraudie and Singer 1977), indicating that regenerative
growth is functionally similar in teleosts. In recent years, emergence of the zebrafish
model has reinvigorated the field of adult fin regeneration and has been established as a
research model for the identification of critical molecular signaling pathways that govern
the process of regeneration (Poss et al. 2000b; Nechiporuk and Keating 2002; Poss et al.
2002a; Quint et al. 2002; Akimenko et al. 2003; Poss et al. 2003). Adult zebrafish caudal
127
fin regeneration is completed by a process termed epimorphic regeneration, which
involves reprogramming and differentiation of blastema cells to different cell types to
restore the tissue to its original form (Geraudie et al. 1993; Akimenko et al. 1995; Mari-
Beffa et al. 1996; Nechiporuk and Keating 2002; Poss et al. 2003). A genetic zebrafish
mutant study revealed that fgf20a is absolutely required for the initiation and formation
of blastema, whereas recent reports suggest that Wnt/β-catenin signaling seems to act
upstream of FGF signaling (Whitehead et al. 2005; Stoick-Cooper et al. 2007). Even
though major progress has been made in the identification of some of the essential
pathways for regeneration such as FGF, Wnt and Activin-βA (actβA) signaling, most
would agree that we are still at the early stages of gene discovery (Poss et al. 2000a; Poss
et al. 2000b; Poss et al. 2003; Whitehead et al. 2005; Kawakami et al. 2006b; Jazwinska
et al. 2007; Stoick-Cooper et al. 2007).
The adult fin regeneration model has unique advantages, but technical barriers
have slowed progress. Recently it was reported that the fin primordia is capable of
complete regeneration (2-5 days post fertilization) (Kawakami et al. 2004).
Morphologically, the larval fin regenerates similarly to the adult by the development of a
wound epithelium followed by blastema formation, which later proliferates and
differentiates into the required cell types (Kawakami et al. 2004). Also not surprisingly,
similar to the adult zebrafish, chemical inhibition of FGFR1 by SU5402, aryl
hydrocarbon receptor (AHR) activation by TCDD and Glucocorticoid receptor (GR)
activation by Beclomethasone abrogates larval fin regeneration (Poss et al. 2000b;
Zodrow and Tanguay 2003; Kawakami et al. 2004; Mathew et al. 2006; Mathew et al.
2007) suggesting that there are similarities at the cellular and molecular level between
adult and larval regeneration. Since many of the experimental advantages of zebrafish lie
at the earliest life stages, the possibility of evaluating fin regeneration during this
experimentally tractable life stage is enticing.
A comprehensive microarray analysis of adult zebrafish fin and adult heart
regeneration identified some conserved genomic responses to amputation in these distinct
regeneration models (Lien et al. 2006; Schebesta et al. 2006). This suggests that the
molecular signaling pathways essential for the initiation of regeneration may be
conserved. To identify whether there are corresponding similarities in the regenerative
128
gene expression response in the early life stage models, we conducted global genomic
analysis of larval and adult fin regeneration and compared the gene expression changes.
Larval microarray analysis revealed that the major functional groups altered were wound
healing, signal transduction, transcriptional regulation and extracellular matrix
components. Comparative analysis between larval and the adult fin regeneration systems
indicated high degree of similarity between the two gene expression profiles. When the
larval gene list was compared with the published zebrafish heart regeneration gene list,
similar pattern of gene expression changes were also observed. Since the tissue
architecture of larval fin, adult fin and heart are very different; the significant
commonality in the gene expression changes must be due to the conserved molecular
signaling events that are required for this remarkable process. To demonstrate the power
of the larval model to investigate candidate gene function, we analyzed the role of RA
signaling and performed functional studies with the larval regeneration model.
Collectively, our results demonstrate that the larval model is well-suited to rapidly
unravel critical molecular signaling pathways essential for tissue regeneration.
Materials and Methods
Zebrafish lines and care:
For the larval fin regeneration studies, fertilized eggs were obtained from AB
strain zebrafish (University of Oregon, Eugene, OR). For the adult in situ hybridization
study, 2 month old AB strain zebrafish were used. The fin amputations were performed
as previously described (Poss et al. 2000b; Mathew et al. 2006; Andreasen et al. 2007;
Mathew et al. 2007). The Tg(hsp70l:tcf3-GFP) line was obtained from ZIRC.
Chemicals:
The RA synthesis inhibitors DEAB and Citral were from Sigma Aldrich (St.
Louis, MO). The amputated larvae were exposed to DEAB and Citral at a final
concentration of 200 and 20μM, respectively, and the solutions were changed daily until
129
3 dpa. The ERK1/2 inhibitor U0126 was purchased from EMD Biosciences (San Diego,
CA) and SB431542 from Sigma Aldrich (St. Louis, MO).UU0126 and SB431542 were
continuously exposed at a final concentration of 10 and 100μM respectively.
Fin Development:
The development of the fin vasculature was analyzed using a transgenic fish (Tg-
fli-GFP) that expresses green fluorescent protein in the vasculature under the control of
the fli promoter. Periodically, bright field pictures were taken to analyze the development
of the fin rays and overall structural changes. Simultaneously, fluorescent pictures at
488nM were taken to observe the development of the vasculature.
Isolation of Fin RNA:
The caudal fin tissue of 2dpf embryos were amputated and the fin tissues were
pooled together for RNA isolation and these samples were used as non-regenerating fin
tissue (0 dpa). The amputated larvae were allowed to grow for 1, 2, or 3 days and the fin
tissues were re-amputated and pooled as described above for the respective 1, 2, and 3
dpa time points. Three technical replicates, each comprisied of regenerating fin tissue
from 150 larvae were isolated for each time point. RNA was isolated from the fin tissue
using the RNAqueous Micro kit (Ambion, Austin, TX). Adult zebrafish were amputated
and the intact fin tissues were used as non regenerating fin tissue. The fin tissues were re-
amputated at 1, 3, and 5 dpa for RNA isolation. Each replicate consisted of 10 fins.
RNAlater was removed from the samples and total RNA was purified with TRI reagent
(Molecular Research Laboratories, Cincinnati, OH) according to the manufacturer's
instructions. The quality and quantity of RNA was determined by UV absorbance.
Ribosomal RNA abundance and degree of degradation was determined in
electropherogram patterns using the 2100 Bioanalyzer and RNA 6000 Nano chips
(Agilent Technologies, Palo Alto, CA).
Affymetrix Microarray Processing:
The microarray processing including probe synthesis, hybridization and scanning
were conducted by the Center for Genome Research and Biocomputing at Oregon State
130
University, Corvallis OR. For analysis of larval transcript abundance, 100 ng of total
RNA from 0,1, 2 and 3 dpa larval fin tissue were used to generate biotinylated
complementary RNA (cRNA) using the Two-Cycle Target Labeling kit (Affymetrix,
Santa Clara, CA). Briefly, RNA samples were reverse transcribed using a T7-(dT)24
primer and Superscript II reverse transcriptase (Invitrogen, Carlsbad, CA) and double
stranded cDNA was synthesized. This was then used as a template for in vitro
transcription for another round of double-stranded cDNA synthethis. For the adult fin
regeneration study, 2.5 µg of total RNA was used to generate biotinylated cRNA for each
treatment group using the One-Cycle Target Labeling kit (Affymetrix, Santa Clara, CA).
From the double-stranded cDNA, biotinylated cRNA was synthesized using T7 RNA
polymerase and a biotin-conjugated pseudouridine containing nucleotide mixture
provided in the IVT Labeling Kit (Affymetrix, Santa Clara, CA). For both larval and
adult fin regeneration experiments, 10µg of purified and fragmented cRNA from each
experimental sample was hybridized to zebrafish genome arrays (Zebrafish430_2)
according to the Affymetrix GeneChip Expression Analysis Technical Manual (701021
Rev. 5). Arrays were scanned with an Affymetrix scanner 3000. Each array image was
visualized to discount artifactual signals, scratches or debris. Experiments were MIAME
certified.
For data analysis, the Affymetrix cel files were imported into GeneSpring 7.1
software (Agilent Technologies, Palo Alto, CA). The files were GC-RMA processed to
discount for background signal and each transcript was normalized to the median signal
to allow comparison between arrays on a relative scale for each gene. The differential
effect of time on regeneration was performed by comparing the non-regenerating fin
tissue (0 dpa) to other time points by one-way ANOVA assuming equal variance
employing Benjamini and Hochberg multiple testing corrections (p < 0.05). Only genes
that were at least 1.7 fold differentially expressed from the 0 dpa gene levels were
considered for analysis. The annotation of genes was performed by considering the
sequence similarity to known mammalian proteins that was determined by conducting a
BLAST search of each Affymetrix probe set against the Sanger database
(http://www.sanger.ac.uk/Projects/D_rerio/). Additionally, other databases such as
Genbank (http://www.ncbi.nlm.nih.gov/BLAST/) and the Zebrafish Affy Chip
131
Annotation Project at Children's Hospital Boston
(http://134.174.23.160/zfaca/hash/master020106public.aspx) were utilized.
Quantitative RT-PCR:
Total RNA was isolated in triplicate from the regenerating fins at 0, 1, 2 and 3 dpa
(n = 150/group). From the larval fin RNA, cDNA was prepared from 100 ng of total
RNA per group using Superscript II (Life Technologies, Gaithersburg, MD) and
oligo(dT) primers in a 20 μl volume. Quantitative RT-PCR (qRT-PCR) was conducted
using gene specific primers (Supplemental Table 7) with the Opticon 2 real-time PCR
detection system (MJ Research, Waltham, MA). Briefly, 1 μl of cDNA was used for each
PCR reaction in the presence of SYBR Green, using DyNAmo SYBR green qPCR kit
according to the manufacturer’s instructions (Finnzymes, Espoo Finland). All samples
were normalized to their β-actin abundance. Quantitative differences between biological
samples were determined by normalizing all samples to a common reference sample.
Agarose gel electrophoresis and thermal denaturation (melt curve analysis) were
conducted to ensure formation of specific products. Significant differences of mRNA
abundance were assessed by one-way ANOVA on log10 transformed data using Tukey
method (p < 0.05) (SigmaStat software, Chicago, IL).
Morpholinos:
The fluorescein tagged raldh2 morpholino (Gene Tools, Philomath, OR) was
used to transiently knockdown raldh2 gene. The sequence of raldh2 morpholino is 5’-
GTTCAACTTCACTGGAGGTCATCGC-3’. Morpholinos were diluted to 3 mM in 1X
Danieau’s solution (58 mM NaCl, 0.7 mM KCl, 0.4 mM MgSO4, 0.6 mM Ca(NO3)2, 5
mM HEPES, pH 7.6) as described (Nasevicius and Ekker 2000). A standard control
morpholino (Gene Tools, Philomath, OR) (5'CTCTTACCTCAGTTACAATTTATA 3')
was used as the control morpholino (Control-MO). Approximately 2 nl of 0.3mM MO
solution was microinjected into the embryos at the 1–2 cell stage. The fin tissue of
control and raldh2 morphants were amputated at 2dpf and exposed and allowed to grow
for 3 days at 28°C.
132
Whole Mount In situ Hybridization:
In situ hybridization was performed on the regenerating fin at respective time
points as described previously (Schier et al. 1997; Poss et al. 2000a). The msxe and dlx5a
probes were obtained from Atsushi Kawakami (Kawakami et al. 2004). Raldh2 probe
was prepared by cloning the cDNA by RT-PCR from the RNA isolated from the whole
adult zebrafish. The wnt10a probe was a gift from Gilbert Weidinger (Biotechnological
Center, Technical University of Dresden, Germany). The embryos were reared in
phenylthiourea (Sigma) at a final concentration of 100μM from 24hpf to inhibit
formation of pigmentation.
Cell Proliferation Assay:
The cell proliferation assay was conducted as previously described (Mathew et al.
2007) on the regenerating fin tissue after pulse labeling with Brdu (Roche, Indianapolis,
IN) for 6hrs starting from 24 hpa or 48 hpa. Brdu assay was performed on vehicle- or
DEAB exposed amputated larvae and similarly on the amputated control or raldh2
morphants at the respective time points. After 6hrs of incubation with Brdu at 28°C, the
larvae were fixed in 4% paraformaldehyde (PFA) overnight. The fixed larvae were
dehydrated with methanol and then stored in methanol at -20°C. Briefly,
immunochemistry was conducted on the stored larvae by rehydrating with a graded
methanol/PBST (phosphate-buffered saline (PBS) and 0.1% Tween-20) series. The larvae
were then treated with Proteinase K in PBST for 20 minutes at room temperature (RT)
and then rinsed several times with PBST. The larvae were refixed in 4% PFA for 30
minutes and then washed several times in water, followed by quick rinses in 2N HCL and
incubation in 2N HCL at RT for an hour. After several washes, the larvae were then
blocked with 1% normal goat serum in PBST for an hour at RT and then incubated with
anti-Brdu antibody (1:100; G3G4; Developmental Studies Hybridoma Bank, Iowa City,
IA) overnight at 4°C. After four or more 30 min washes with PBST, the larvae were
incubated with a secondary antibody (1:1000; Alexa-546 conjugated goat anti mouse;
Molecular Probes, Eugene, OR) for 4 hrs at RT. The larvae were then washed 4x for 30
min in PBST and visualized by epifluorescence microscopy. The Brdu-labeled
133
fluorescent cells were quantified with the acquired images using ImagePro Plus software
program (Media Cybernetics, Inc., Silver Spring, MD).
Results
Structural Morphogenesis of Larval to Adult Fin:
Although both larvae and adult zebrafish regenerate their caudal fins following
amputation, it is clear that there are structural differences in the regenerating tissues
between the two life stages. Bright field imaging revealed that the lepidotrichia (fin rays)
are not yet present in larvae at 5 days post fertilization (dpf). Instead, the larval fin
primordia contained an abundance of actinotrichia (composed of collagenous fibrils)
which populate the tissue. It is also noteworthy that the larval fin at this stage is not
vascularized as revealed by in vivo imaging of the Fli1-GFP transgenic line. This led us
to ask the question: when does the larval fin take on an adult fin morphology? To answer
this question, fin developmental progression was systematically assessed to identify the
structural morphogenesis until the fin developed an adult-like phenotype (Supplemental
Fig. 1). Although vasculature in the trunk was functional with strong blood flow in 3- and
7- day-old zebrafish, vascularization of the caudal fin was not apparent until after 10dpf.
At approximately 10dpf, the posterior end of the notochord begins to bend dorsally, and
soon after, clusters of actinotrichia gather, like corn stalks tied with twine, to form ray-
like structures ventral to the notochord (Supplemental Fig. 1). Concomitant with the
formation of rays, the vasculature forms along these rigid tracks. By 19 dpf, 18 rays had
developed, become vascularized and innervated (neuronal immunohistochemistry data
not shown). By approximately 3 weeks, the caudal fin appears similar to the adult
morphologically, with fully formed vasculature including intersegmental vascular loops.
These studies illustrate there are significant structural differences between the adult and 2
day old larval fin structures, yet at both life stages, the animals are equally able to
regenerate their fin tissues following amputation.
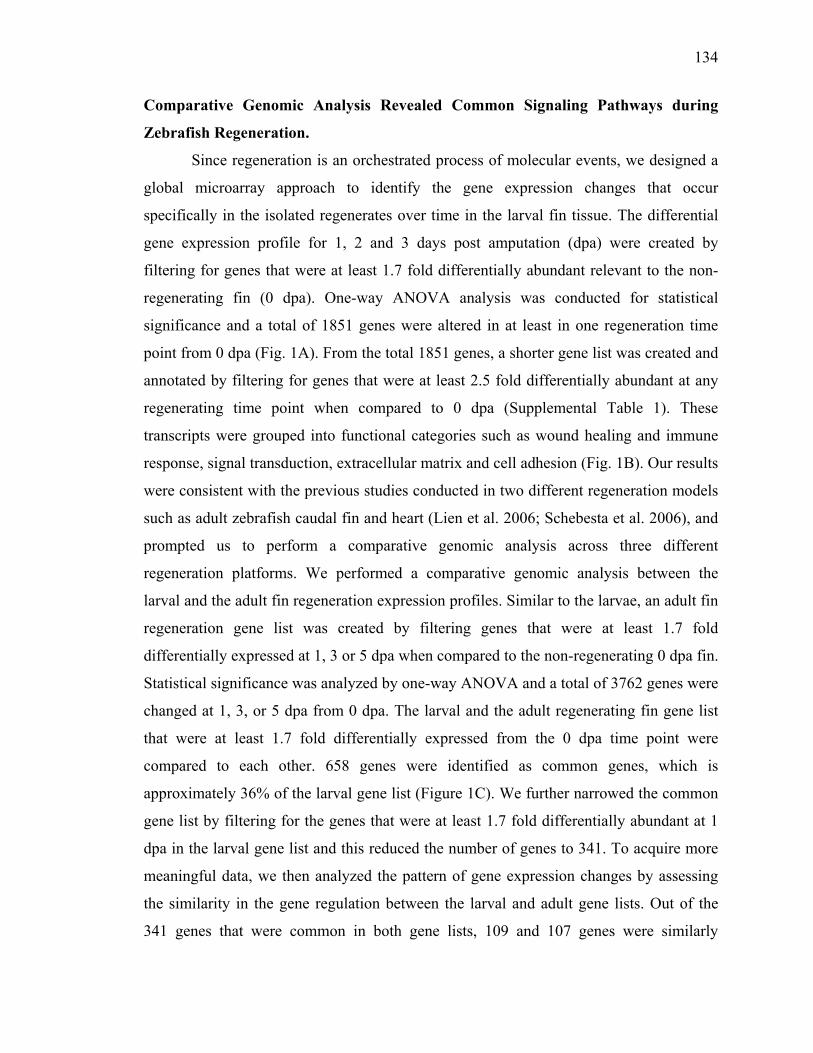
134
Comparative Genomic Analysis Revealed Common Signaling Pathways during
Zebrafish Regeneration.
Since regeneration is an orchestrated process of molecular events, we designed a
global microarray approach to identify the gene expression changes that occur
specifically in the isolated regenerates over time in the larval fin tissue. The differential
gene expression profile for 1, 2 and 3 days post amputation (dpa) were created by
filtering for genes that were at least 1.7 fold differentially abundant relevant to the non-
regenerating fin (0 dpa). One-way ANOVA analysis was conducted for statistical
significance and a total of 1851 genes were altered in at least in one regeneration time
point from 0 dpa (Fig. 1A). From the total 1851 genes, a shorter gene list was created and
annotated by filtering for genes that were at least 2.5 fold differentially abundant at any
regenerating time point when compared to 0 dpa (Supplemental Table 1). These
transcripts were grouped into functional categories such as wound healing and immune
response, signal transduction, extracellular matrix and cell adhesion (Fig. 1B). Our results
were consistent with the previous studies conducted in two different regeneration models
such as adult zebrafish caudal fin and heart (Lien et al. 2006; Schebesta et al. 2006), and
prompted us to perform a comparative genomic analysis across three different
regeneration platforms. We performed a comparative genomic analysis between the
larval and the adult fin regeneration expression profiles. Similar to the larvae, an adult fin
regeneration gene list was created by filtering genes that were at least 1.7 fold
differentially expressed at 1, 3 or 5 dpa when compared to the non-regenerating 0 dpa fin.
Statistical significance was analyzed by one-way ANOVA and a total of 3762 genes were
changed at 1, 3, or 5 dpa from 0 dpa. The larval and the adult regenerating fin gene list
that were at least 1.7 fold differentially expressed from the 0 dpa time point were
compared to each other. 658 genes were identified as common genes, which is
approximately 36% of the larval gene list (Figure 1C). We further narrowed the common
gene list by filtering for the genes that were at least 1.7 fold differentially abundant at 1
dpa in the larval gene list and this reduced the number of genes to 341. To acquire more
meaningful data, we then analyzed the pattern of gene expression changes by assessing
the similarity in the gene regulation between the larval and adult gene lists. Out of the
341 genes that were common in both gene lists, 109 and 107 genes were similarly
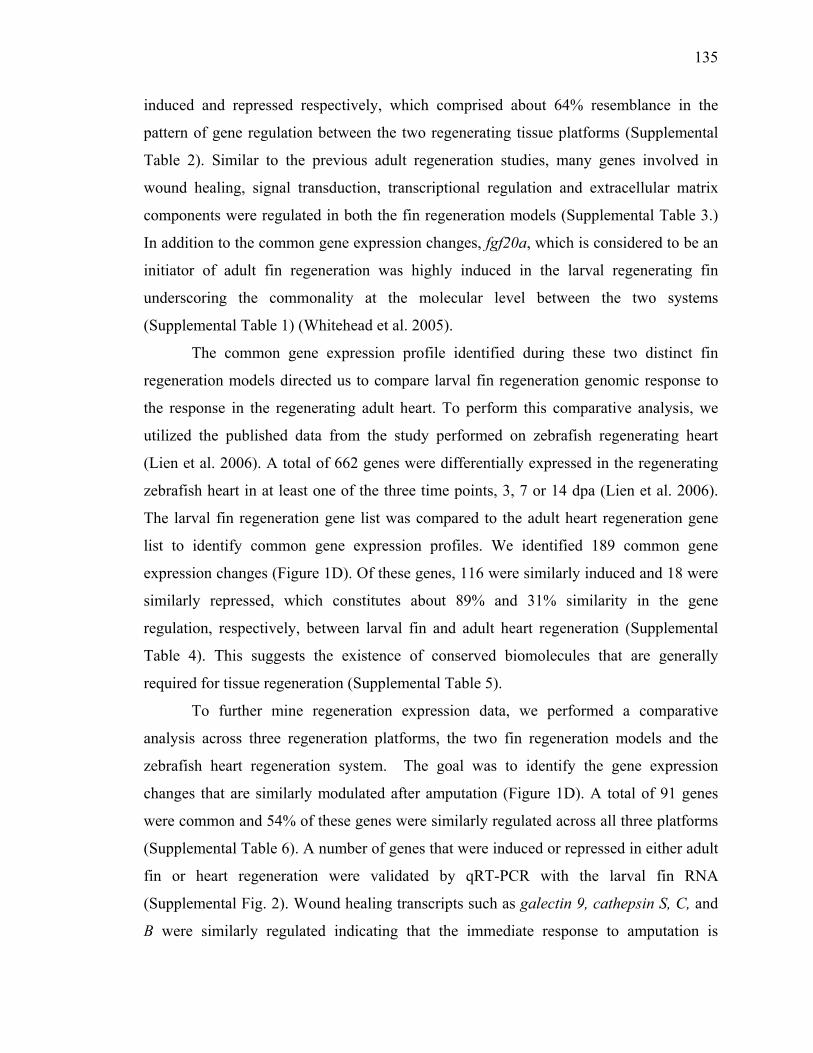
135
induced and repressed respectively, which comprised about 64% resemblance in the
pattern of gene regulation between the two regenerating tissue platforms (Supplemental
Table 2). Similar to the previous adult regeneration studies, many genes involved in
wound healing, signal transduction, transcriptional regulation and extracellular matrix
components were regulated in both the fin regeneration models (Supplemental Table 3.)
In addition to the common gene expression changes, fgf20a, which is considered to be an
initiator of adult fin regeneration was highly induced in the larval regenerating fin
underscoring the commonality at the molecular level between the two systems
(Supplemental Table 1) (Whitehead et al. 2005).
The common gene expression profile identified during these two distinct fin
regeneration models directed us to compare larval fin regeneration genomic response to
the response in the regenerating adult heart. To perform this comparative analysis, we
utilized the published data from the study performed on zebrafish regenerating heart
(Lien et al. 2006). A total of 662 genes were differentially expressed in the regenerating
zebrafish heart in at least one of the three time points, 3, 7 or 14 dpa (Lien et al. 2006).
The larval fin regeneration gene list was compared to the adult heart regeneration gene
list to identify common gene expression profiles. We identified 189 common gene
expression changes (Figure 1D). Of these genes, 116 were similarly induced and 18 were
similarly repressed, which constitutes about 89% and 31% similarity in the gene
regulation, respectively, between larval fin and adult heart regeneration (Supplemental
Table 4). This suggests the existence of conserved biomolecules that are generally
required for tissue regeneration (Supplemental Table 5).
To further mine regeneration expression data, we performed a comparative
analysis across three regeneration platforms, the two fin regeneration models and the
zebrafish heart regeneration system. The goal was to identify the gene expression
changes that are similarly modulated after amputation (Figure 1D). A total of 91 genes
were common and 54% of these genes were similarly regulated across all three platforms
(Supplemental Table 6). A number of genes that were induced or repressed in either adult
fin or heart regeneration were validated by qRT-PCR with the larval fin RNA
(Supplemental Fig. 2). Wound healing transcripts such as galectin 9, cathepsin S, C, and
B were similarly regulated indicating that the immediate response to amputation is
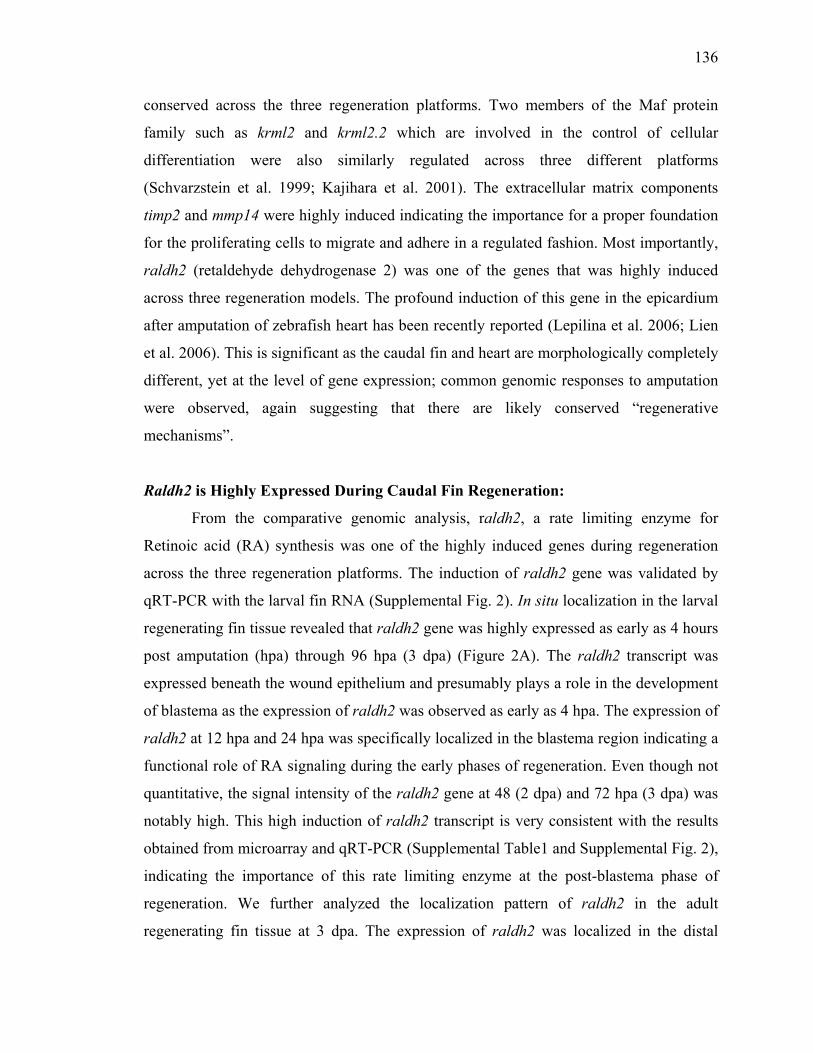
136
conserved across the three regeneration platforms. Two members of the Maf protein
family such as krml2 and krml2.2 which are involved in the control of cellular
differentiation were also similarly regulated across three different platforms
(Schvarzstein et al. 1999; Kajihara et al. 2001). The extracellular matrix components
timp2 and mmp14 were highly induced indicating the importance for a proper foundation
for the proliferating cells to migrate and adhere in a regulated fashion. Most importantly,
raldh2 (retaldehyde dehydrogenase 2) was one of the genes that was highly induced
across three regeneration models. The profound induction of this gene in the epicardium
after amputation of zebrafish heart has been recently reported (Lepilina et al. 2006; Lien
et al. 2006). This is significant as the caudal fin and heart are morphologically completely
different, yet at the level of gene expression; common genomic responses to amputation
were observed, again suggesting that there are likely conserved “regenerative
mechanisms”.
Raldh2 is Highly Expressed During Caudal Fin Regeneration:
From the comparative genomic analysis, raldh2, a rate limiting enzyme for
Retinoic acid (RA) synthesis was one of the highly induced genes during regeneration
across the three regeneration platforms. The induction of raldh2 gene was validated by
qRT-PCR with the larval fin RNA (Supplemental Fig. 2). In situ localization in the larval
regenerating fin tissue revealed that raldh2 gene was highly expressed as early as 4 hours
post amputation (hpa) through 96 hpa (3 dpa) (Figure 2A). The raldh2 transcript was
expressed beneath the wound epithelium and presumably plays a role in the development
of blastema as the expression of raldh2 was observed as early as 4 hpa. The expression of
raldh2 at 12 hpa and 24 hpa was specifically localized in the blastema region indicating a
functional role of RA signaling during the early phases of regeneration. Even though not
quantitative, the signal intensity of the raldh2 gene at 48 (2 dpa) and 72 hpa (3 dpa) was
notably high. This high induction of raldh2 transcript is very consistent with the results
obtained from microarray and qRT-PCR (Supplemental Table1 and Supplemental Fig. 2),
indicating the importance of this rate limiting enzyme at the post-blastema phase of
regeneration. We further analyzed the localization pattern of raldh2 in the adult
regenerating fin tissue at 3 dpa. The expression of raldh2 was localized in the distal
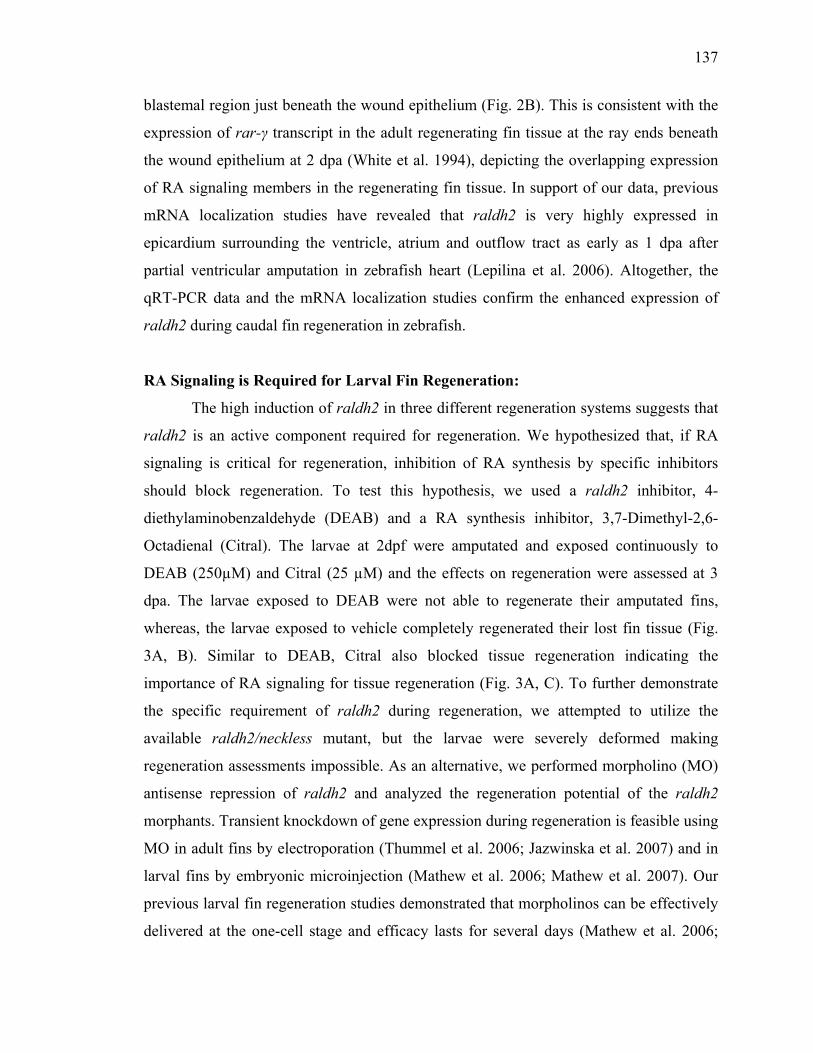
137
blastemal region just beneath the wound epithelium (Fig. 2B). This is consistent with the
expression of rar-γ transcript in the adult regenerating fin tissue at the ray ends beneath
the wound epithelium at 2 dpa (White et al. 1994), depicting the overlapping expression
of RA signaling members in the regenerating fin tissue. In support of our data, previous
mRNA localization studies have revealed that raldh2 is very highly expressed in
epicardium surrounding the ventricle, atrium and outflow tract as early as 1 dpa after
partial ventricular amputation in zebrafish heart (Lepilina et al. 2006). Altogether, the
qRT-PCR data and the mRNA localization studies confirm the enhanced expression of
raldh2 during caudal fin regeneration in zebrafish.
RA Signaling is Required for Larval Fin Regeneration:
The high induction of raldh2 in three different regeneration systems suggests that
raldh2 is an active component required for regeneration. We hypothesized that, if RA
signaling is critical for regeneration, inhibition of RA synthesis by specific inhibitors
should block regeneration. To test this hypothesis, we used a raldh2 inhibitor, 4-
diethylaminobenzaldehyde (DEAB) and a RA synthesis inhibitor, 3,7-Dimethyl-2,6-
Octadienal (Citral). The larvae at 2dpf were amputated and exposed continuously to
DEAB (250µM) and Citral (25 µM) and the effects on regeneration were assessed at 3
dpa. The larvae exposed to DEAB were not able to regenerate their amputated fins,
whereas, the larvae exposed to vehicle completely regenerated their lost fin tissue (Fig.
3A, B). Similar to DEAB, Citral also blocked tissue regeneration indicating the
importance of RA signaling for tissue regeneration (Fig. 3A, C). To further demonstrate
the specific requirement of raldh2 during regeneration, we attempted to utilize the
available raldh2/neckless mutant, but the larvae were severely deformed making
regeneration assessments impossible. As an alternative, we performed morpholino (MO)
antisense repression of raldh2 and analyzed the regeneration potential of the raldh2
morphants. Transient knockdown of gene expression during regeneration is feasible using
MO in adult fins by electroporation (Thummel et al. 2006; Jazwinska et al. 2007) and in
larval fins by embryonic microinjection (Mathew et al. 2006; Mathew et al. 2007). Our
previous larval fin regeneration studies demonstrated that morpholinos can be effectively
delivered at the one-cell stage and efficacy lasts for several days (Mathew et al. 2006;
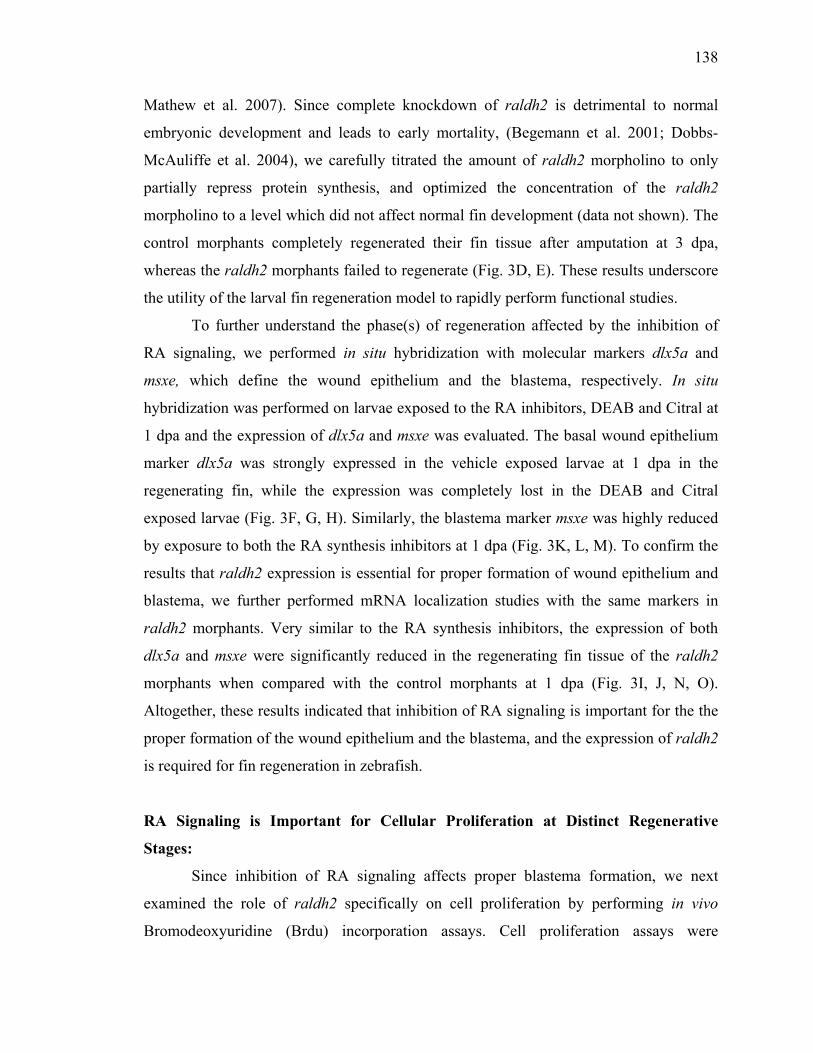
138
Mathew et al. 2007). Since complete knockdown of raldh2 is detrimental to normal
embryonic development and leads to early mortality, (Begemann et al. 2001; Dobbs-
McAuliffe et al. 2004), we carefully titrated the amount of raldh2 morpholino to only
partially repress protein synthesis, and optimized the concentration of the raldh2
morpholino to a level which did not affect normal fin development (data not shown). The
control morphants completely regenerated their fin tissue after amputation at 3 dpa,
whereas the raldh2 morphants failed to regenerate (Fig. 3D, E). These results underscore
the utility of the larval fin regeneration model to rapidly perform functional studies.
To further understand the phase(s) of regeneration affected by the inhibition of
RA signaling, we performed in situ hybridization with molecular markers dlx5a and
msxe, which define the wound epithelium and the blastema, respectively. In situ
hybridization was performed on larvae exposed to the RA inhibitors, DEAB and Citral at
1 dpa and the expression of dlx5a and msxe was evaluated. The basal wound epithelium
marker dlx5a was strongly expressed in the vehicle exposed larvae at 1 dpa in the
regenerating fin, while the expression was completely lost in the DEAB and Citral
exposed larvae (Fig. 3F, G, H). Similarly, the blastema marker msxe was highly reduced
by exposure to both the RA synthesis inhibitors at 1 dpa (Fig. 3K, L, M). To confirm the
results that raldh2 expression is essential for proper formation of wound epithelium and
blastema, we further performed mRNA localization studies with the same markers in
raldh2 morphants. Very similar to the RA synthesis inhibitors, the expression of both
dlx5a and msxe were significantly reduced in the regenerating fin tissue of the raldh2
morphants when compared with the control morphants at 1 dpa (Fig. 3I, J, N, O).
Altogether, these results indicated that inhibition of RA signaling is important for the the
proper formation of the wound epithelium and the blastema, and the expression of raldh2
is required for fin regeneration in zebrafish.
RA Signaling is Important for Cellular Proliferation at Distinct Regenerative
Stages:
Since inhibition of RA signaling affects proper blastema formation, we next
examined the role of raldh2 specifically on cell proliferation by performing in vivo
Bromodeoxyuridine (Brdu) incorporation assays. Cell proliferation assays were
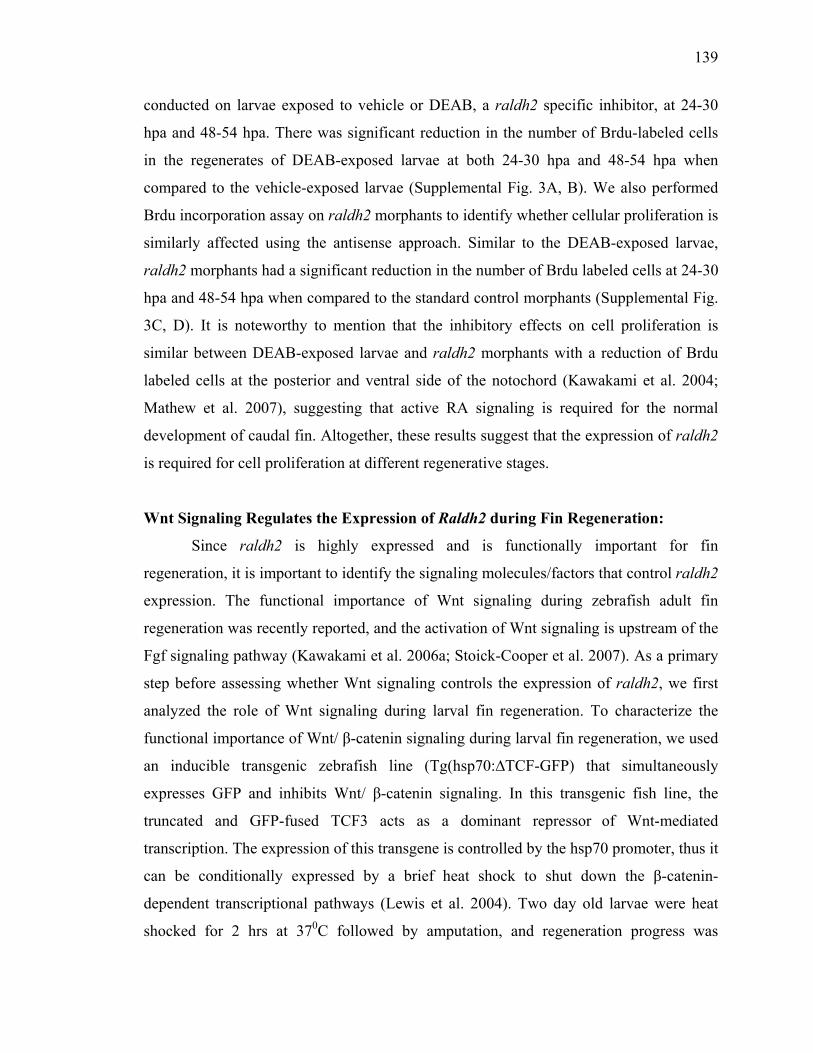
139
conducted on larvae exposed to vehicle or DEAB, a raldh2 specific inhibitor, at 24-30
hpa and 48-54 hpa. There was significant reduction in the number of Brdu-labeled cells
in the regenerates of DEAB-exposed larvae at both 24-30 hpa and 48-54 hpa when
compared to the vehicle-exposed larvae (Supplemental Fig. 3A, B). We also performed
Brdu incorporation assay on raldh2 morphants to identify whether cellular proliferation is
similarly affected using the antisense approach. Similar to the DEAB-exposed larvae,
raldh2 morphants had a significant reduction in the number of Brdu labeled cells at 24-30
hpa and 48-54 hpa when compared to the standard control morphants (Supplemental Fig.
3C, D). It is noteworthy to mention that the inhibitory effects on cell proliferation is
similar between DEAB-exposed larvae and raldh2 morphants with a reduction of Brdu
labeled cells at the posterior and ventral side of the notochord (Kawakami et al. 2004;
Mathew et al. 2007), suggesting that active RA signaling is required for the normal
development of caudal fin. Altogether, these results suggest that the expression of raldh2
is required for cell proliferation at different regenerative stages.
Wnt Signaling Regulates the Expression of Raldh2 during Fin Regeneration:
Since raldh2 is highly expressed and is functionally important for fin
regeneration, it is important to identify the signaling molecules/factors that control raldh2
expression. The functional importance of Wnt signaling during zebrafish adult fin
regeneration was recently reported, and the activation of Wnt signaling is upstream of the
Fgf signaling pathway (Kawakami et al. 2006a; Stoick-Cooper et al. 2007). As a primary
step before assessing whether Wnt signaling controls the expression of raldh2, we first
analyzed the role of Wnt signaling during larval fin regeneration. To characterize the
functional importance of Wnt/ β-catenin signaling during larval fin regeneration, we used
an inducible transgenic zebrafish line (Tg(hsp70:∆TCF-GFP) that simultaneously
expresses GFP and inhibits Wnt/ β-catenin signaling. In this transgenic fish line, the
truncated and GFP-fused TCF3 acts as a dominant repressor of Wnt-mediated
transcription. The expression of this transgene is controlled by the hsp70 promoter, thus it
can be conditionally expressed by a brief heat shock to shut down the β-catenin-
dependent transcriptional pathways (Lewis et al. 2004). Two day old larvae were heat
shocked for 2 hrs at 370C followed by amputation, and regeneration progress was
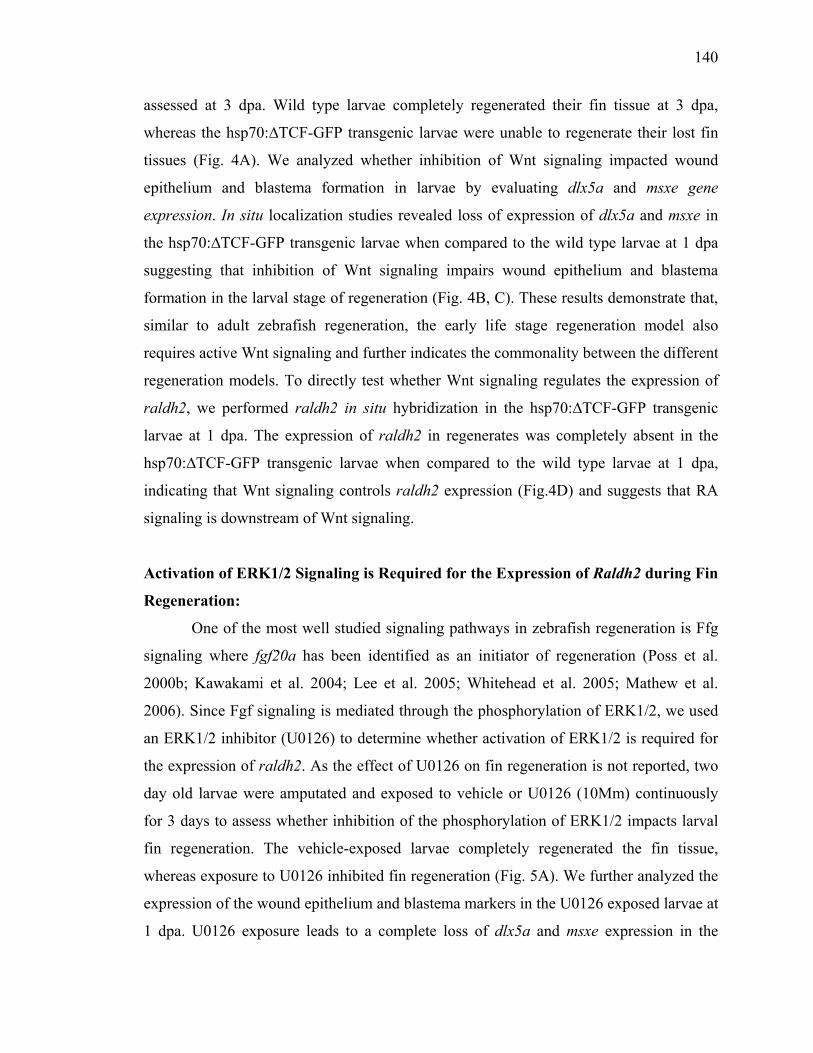
140
assessed at 3 dpa. Wild type larvae completely regenerated their fin tissue at 3 dpa,
whereas the hsp70:∆TCF-GFP transgenic larvae were unable to regenerate their lost fin
tissues (Fig. 4A). We analyzed whether inhibition of Wnt signaling impacted wound
epithelium and blastema formation in larvae by evaluating dlx5a and msxe gene
expression. In situ localization studies revealed loss of expression of dlx5a and msxe in
the hsp70:∆TCF-GFP transgenic larvae when compared to the wild type larvae at 1 dpa
suggesting that inhibition of Wnt signaling impairs wound epithelium and blastema
formation in the larval stage of regeneration (Fig. 4B, C). These results demonstrate that,
similar to adult zebrafish regeneration, the early life stage regeneration model also
requires active Wnt signaling and further indicates the commonality between the different
regeneration models. To directly test whether Wnt signaling regulates the expression of
raldh2, we performed raldh2 in situ hybridization in the hsp70:∆TCF-GFP transgenic
larvae at 1 dpa. The expression of raldh2 in regenerates was completely absent in the
hsp70:∆TCF-GFP transgenic larvae when compared to the wild type larvae at 1 dpa,
indicating that Wnt signaling controls raldh2 expression (Fig.4D) and suggests that RA
signaling is downstream of Wnt signaling.
Activation of ERK1/2 Signaling is Required for the Expression of Raldh2 during Fin
Regeneration:
One of the most well studied signaling pathways in zebrafish regeneration is Ffg
signaling where fgf20a has been identified as an initiator of regeneration (Poss et al.
2000b; Kawakami et al. 2004; Lee et al. 2005; Whitehead et al. 2005; Mathew et al.
2006). Since Fgf signaling is mediated through the phosphorylation of ERK1/2, we used
an ERK1/2 inhibitor (U0126) to determine whether activation of ERK1/2 is required for
the expression of raldh2. As the effect of U0126 on fin regeneration is not reported, two
day old larvae were amputated and exposed to vehicle or U0126 (10Μm) continuously
for 3 days to assess whether inhibition of the phosphorylation of ERK1/2 impacts larval
fin regeneration. The vehicle-exposed larvae completely regenerated the fin tissue,
whereas exposure to U0126 inhibited fin regeneration (Fig. 5A). We further analyzed the
expression of the wound epithelium and blastema markers in the U0126 exposed larvae at
1 dpa. U0126 exposure leads to a complete loss of dlx5a and msxe expression in the
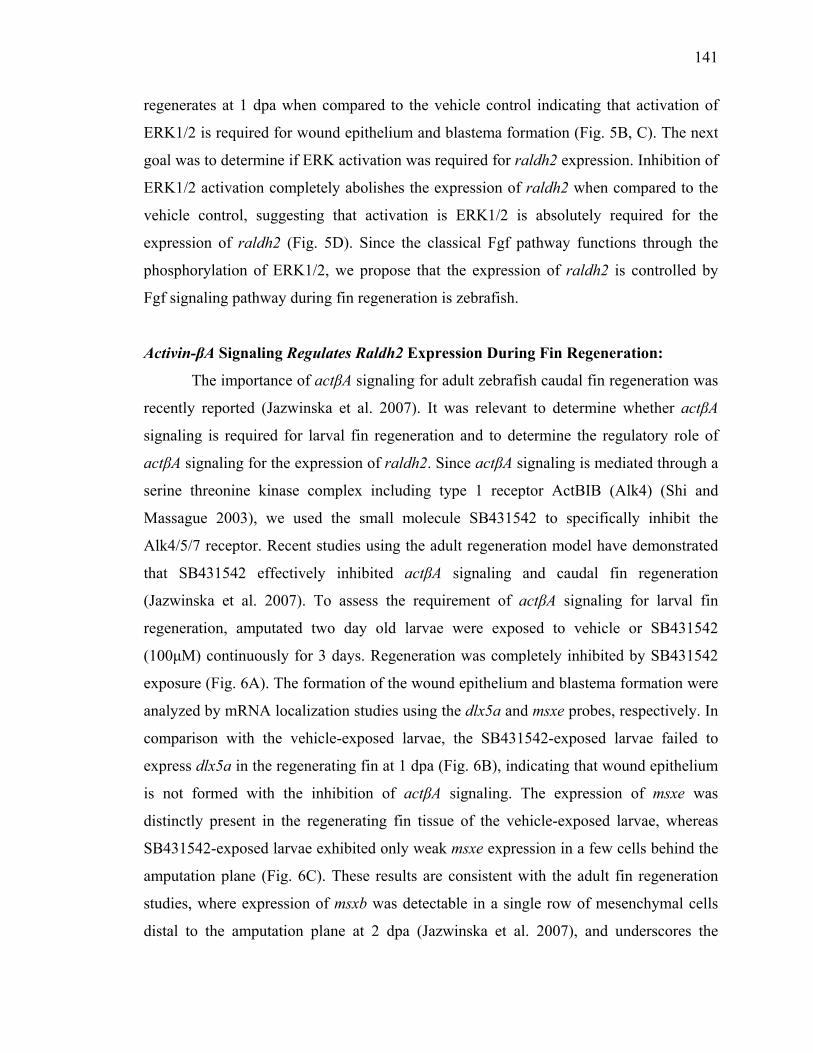
141
regenerates at 1 dpa when compared to the vehicle control indicating that activation of
ERK1/2 is required for wound epithelium and blastema formation (Fig. 5B, C). The next
goal was to determine if ERK activation was required for raldh2 expression. Inhibition of
ERK1/2 activation completely abolishes the expression of raldh2 when compared to the
vehicle control, suggesting that activation is ERK1/2 is absolutely required for the
expression of raldh2 (Fig. 5D). Since the classical Fgf pathway functions through the
phosphorylation of ERK1/2, we propose that the expression of raldh2 is controlled by
Fgf signaling pathway during fin regeneration is zebrafish.
Activin-βA Signaling Regulates Raldh2 Expression During Fin Regeneration:
The importance of actβA signaling for adult zebrafish caudal fin regeneration was
recently reported (Jazwinska et al. 2007). It was relevant to determine whether actβA
signaling is required for larval fin regeneration and to determine the regulatory role of
actβA signaling for the expression of raldh2. Since actβA signaling is mediated through a
serine threonine kinase complex including type 1 receptor ActBIB (Alk4) (Shi and
Massague 2003), we used the small molecule SB431542 to specifically inhibit the
Alk4/5/7 receptor. Recent studies using the adult regeneration model have demonstrated
that SB431542 effectively inhibited actβA signaling and caudal fin regeneration
(Jazwinska et al. 2007). To assess the requirement of actβA signaling for larval fin
regeneration, amputated two day old larvae were exposed to vehicle or SB431542
(100μM) continuously for 3 days. Regeneration was completely inhibited by SB431542
exposure (Fig. 6A). The formation of the wound epithelium and blastema formation were
analyzed by mRNA localization studies using the dlx5a and msxe probes, respectively. In
comparison with the vehicle-exposed larvae, the SB431542-exposed larvae failed to
express dlx5a in the regenerating fin at 1 dpa (Fig. 6B), indicating that wound epithelium
is not formed with the inhibition of actβA signaling. The expression of msxe was
distinctly present in the regenerating fin tissue of the vehicle-exposed larvae, whereas
SB431542-exposed larvae exhibited only weak msxe expression in a few cells behind the
amputation plane (Fig. 6C). These results are consistent with the adult fin regeneration
studies, where expression of msxb was detectable in a single row of mesenchymal cells
distal to the amputation plane at 2 dpa (Jazwinska et al. 2007), and underscores the
142
conserved functional role of actβA signaling for fin regeneration. It was also revealed that
in the presence of SB431542, the expression of raldh2 was completely absent in the
regenerating fin tissue compared to vehicle-exposed larvae. (Fig. 6D). These results
indicate that actβA signaling controls raldh2 expression.
Finally, since wnt10a is proposed to be one of the key players of Wnt signaling
during regeneration, we also analyzed whether wnt10a is expressed in the regenerating
fin tissue when actβA signaling is blocked with SB431542. The expression of wnt10a
was present in both vehicle and SB431542-exposed larvae in the regenerating fin tissue
distal to the amputation plane at 1 dpa (Fig. 6E), suggesting that Wnt10a signaling is
upstream to actβA. Altogether, these results suggest that that, Wnt signaling is at the top
of the hierarchy of the known signaling pathways and RA signaling is downstream to
Wnt, Fgf and actβA signaling during zebrafish fin regeneration (Fig. 7).
Discussion
Since the early life stages of zebrafish are amenable to molecular and genetic
techniques, the development of the larval fin regeneration model provides a unique
platform to rapidly identify the gene products required for regeneration (Kawakami et al.
2004; Mathew et al. 2006). The major goal of this study was to discern whether
regeneration mechanisms are conserved in morphologically distinct zebrafish tissues. By
exploiting the power of comparative gene expression analysis, it was revealed that there
are significant common gene expression profiles in larval fin, adult caudal fin and in
heart regenerating tissues, suggesting the possible existence of common molecular
pathways that choreograph the regeneration process.
The physiological progression of fin regeneration in larvae and adults is similar,
as both initiating with the formation of a wound epithelium, blastema formation and the
distal to proximal propagation of cell proliferation pattern (Poss et al. 2003; Kawakami et
al. 2004). Furthermore, there is also growing evidence to suggest that heart regeneration
in zebrafish has a high degree of commonality with fin regeneration with respect to the
143
order of events which occur after a surgical wound. Both tissues regenerate through the
blastema formation followed by proliferation of cells to complete outgrowth (Poss et al.
2002b; Poss et al. 2003; Raya et al. 2003; Raya et al. 2004; Lepilina et al. 2006). Gene
expression of msxB and msxC encoding homeo-domain containing transcription factors
are re-induced in regenerating zebrafish hearts as early as 3 dpa (Raya et al. 2003; Raya
et al. 2004) and also in regenerating fin blastema (Akimenko et al. 1995). Additionally,
the expression pattern of notch1b and deltaC, members of the Notch signaling pathway,
are induced very early after heart amputation and in the regenerating fin blastema (Raya
et al. 2003). None of the four genes described above were detected in the non-amputated
fin or heart tissue, indicating that the re-induction of these genes was specific to the
regenerating tissue. Altogether, the current literature supports the comparative gene
expression analysis, indicating that there are conserved molecular mechanisms during
regeneration across the three different platforms.
Recent studies illustrate that a proper balance of Wnt/β-catenin signaling is also
critical for the formation and proliferation of blastemal cells (Kawakami et al. 2006b;
Stoick-Cooper et al. 2007). This is consistent with our result observed in the larval
model: when canonical Wnt signaling is blocked, the formation of wound epithelium and
blastema are blocked (Fig. 4A, B, and C). Moreover, Wif1, a feedback regulator of Wnt
signaling pathway was one of the repressed transcripts in both adult and larval fin
regeneration models suggesting that the Wnt signaling pathway is well-regulated during
regeneration. Moreover, a significant number of Wnt target genes were identified in both
the larval and adult fin regeneration gene expression list (Supplemental Fig. 2).
Fgf signaling is one of the well-studied signaling pathways during zebrafish
regeneration. The necessity of Fgf signaling during adult zebrafish fin and heart
regeneration was demonstrated with the use of the Fgfr 1 inhibitor (SU5402) and the
transgenic line (hsp70:dn-fgfr1) that expresses the dominant negative Fgfr1 protein upon
heat shock (Poss et al. 2000b; Lee et al. 2005; Lepilina et al. 2006). Predictably, the
larval fin regeneration system also requires Fgf signaling since SU5402 also blocked the
early life stage regeneration (Kawakami et al. 2004; Mathew et al. 2006). Moreover,
fgf20a which was identified as an initiator of blastema formation in adult regenerating fin
(Whitehead et al. 2005) is also highly induced in the larval fin tissue (Supplemental Table
144
1). Even though fgf20a was detected by microarray analysis, the expression was too low
to detect by in situ hybridization in the larval fin tissue. During zebrafish heart
regeneration, among the several Fgf ligands tested, only fgf17b was strongly expressed in
the cardiomyocytes at the apical edge of the regenerating heart tissue (Lepilina et al.
2006). The expression of different Fgf ligands in these tissues is not unexpected
considering the diversity of the regenerating tissues. But the data strongly indicates that,
epimorphic tissue regeneration requires functional Fgf signaling in the early stages of the
regenerative process.
Similar to Wnt and Fgf signaling, actβA is also required for tissue regeneration in
adult and larval fin regeneration. The inhibition of actβA signaling by SB431542 in the
adult caudal fin impaired cellular migration during wound healing and inhibited
blastemal cell proliferation (Jazwinska et al. 2007). When actβA signaling was inhibited
during larval fin regeneration, the wound epithelium was not properly formed.
Furthermore, similar to the reduced expression of msxb to a row of mesenchymal cells
beneath the wound epidermis of the SB431542-exposed adult zebrafish (Jazwinska et al.
2007), msxe expression becomes restricted to a few cells beneath the amputation plane of
the SB431542 exposed larvae. The functional requirement of actβA signaling between the
two models underscores the conserved requirement for this pathway for zebrafish tissue
regeneration.
Raldh2, a rate limiting enzyme for RA synthesis was one of the most highly
induced genes in all three regeneration models. Previous in situ localization studies have
revealed that raldh2 was highly expressed in epicardium surrounding the ventricle,
atrium and outflow tract as early as 1 dpa after partial ventricular amputation in zebrafish
heart (Lepilina et al. 2006). RALDH2 enzyme activity is also highly induced in NG-2
cells after spinal cord injury in rats (Mey et al. 2005), and raldh2 expressing cells have
been characterized in a subpopulation of activated oligodendrocyte precursors or
polydendrocytes (Kern et al. 2007). During deer antler regeneration, in addition to the
other RA signaling members, raldh2 is also expressed in the skin and perichondrium and
in perivascular cells in cartilage, indicating the requirement for this RA rate limiting
enzyme during the process of regeneration (Allen et al. 2002). Whole body regeneration
from a miniscule blood vessel fragment has been illustrated in the colonial urochordate
145
Botrylloides leachi and the homologue of the RA receptor and raldh-related gene were
exclusively expressed in blood cells in the regeneration niches, suggesting the ancestral
involvement of RA signaling during regeneration and body restoration events (Rinkevich
et al. 2007).
The induction of raldh2 in the regenerating larval fin as early as 4 hpa suggests
the involvement of active RA signaling during the early phases of regeneration. The
functional role of RA signaling during amphibian and zebrafish regeneration has been
studied for decades and RA is even referred to as a regeneration-inducing molecule
(Brockes 1990; White et al. 1994; Ferretti and Geraudie 1995; Viviano and Brockes
1996; Maden and Hind 2003). RA is mainly characterized as a signaling molecule that is
required for the vertebrate pattern formation both in developing and regenerating tissues.
Amphibian regeneration studies revealed that exposure of regenerating axolotl and
urodele limbs to RA results in the modification of positional memory in the
proximodistal axis and caused patterning defects such as duplication of the stump
(Stocum and Thoms 1984; Thoms and Stocum 1984; Kim and Stocum 1986; Brockes
1991; Geraudie et al. 1993). Similarly, exposure of zebrafish with RA during fin
regeneration resulted in remarkable morphological effects suggesting that exogenous RA
can respecify patterns in the regenerating fin tissue (White et al. 1994). Most of the
regeneration studies with RA signaling are related with the patterning of the structures
during regeneration and very little information is currently available about whether RA
signaling is critically required for the initiation of regeneration, mainly for the formation
of wound epithelium and blastema formation.
Our chemical inhibition and antisense repression of raldh2 suggests that RA
signaling is indeed required for the complete formation of the wound epithelium and the
blastema. The reduced expression of msxe in the presence of RA synthesis inhibitors and
raldh2 morphants could be due to the absence of blastema formation or its inhibitory
effect on blastemal cell proliferation at 24 and 48 hpa (Supplemental Fig.3). The
complete understanding of the RA signaling requirement for wound epithelium and
blastema formation requires further studies. Since the expression of raldh2 was
continuously present from 4 hpa to 3 dpa, we presume that the requirement of RA
signaling is continuous from the initiation of regeneration through pattern formation and
146
regenerative outgrowth (Fig. 2, 7). However, the increased expression of raldh2 at 2 dpa
raises the possibility for a distinct flux of RA signaling (Fig. 2, 7 and Supplemental
Fig.2), and suggests a dual phase of RA signaling during regeneration. In support of our
two-phase RA signaling during regeneration, vertebrate limb developmental studies in
mice have illustrated the existence of an early phase of RA signaling to initiate forelimb
development, followed by a late phase of RA signaling required to develop the apical
ectodermal ridge fully along the distal ectoderm to complete the limb outgrowth (Mic et
al. 2004). Moreover, studies with the raldh2/neckless zebrafish mutant has demonstrated
that RA signaling is required for the induction of pectoral fin field and also to establish a
prepattern of anteroposterior fates in the condensing fin mesenchyme (Gibert et al. 2006).
Therefore, in addition to the established functional role of RA signaling during the
regenerative outgrowth, this signaling pathway is also essential in the early stages of
regeneration, suggesting the existence of two phases of RA signaling during regeneration.
Finally, we illustrated that, the expression of raldh2 is controlled by Wnt, Fgf and
actβA signaling during zebrafish regeneration (Fig. 7). Even though multiple signaling
pathways are active during regeneration, the functional requirement of each pathway for
completing the process of regeneration from a wound/injury is still not completely
understood. Collectively, these studies reveal that there is a conservation of fundamental
regenerative networks and pathways that control epimorphic tissue regeneration. Since
the larval fin regeneration model is amenable to rapid molecular and genetic
manipulations, this early life stage fin regeneration model is a powerful platform to
discover and unravel regenerative mechanisms.
147
References
Akimenko MA, Johnson SL, Westerfield M and Ekker M (1995) Differential induction of four msx homeobox genes during fin development and regeneration in zebrafish. Development 121:347-57.
Akimenko MA, Mari-Beffa M, Becerra J and Geraudie J (2003) Old questions, new tools, and some answers to the mystery of fin regeneration. Dev Dyn 226:190-201.
Allen SP, Maden M and Price JS (2002) A role for retinoic acid in regulating the regeneration of deer antlers. Dev Biol 251:409-23.
Alonso M, Tabata YA, Rigolino MG and Tsukamoto RY (2000) Effect of induced triploidy on fin regeneration of juvenile rainbow trout, Oncorhynchus mykiss. J Exp Zool 287:493-502.
Andreasen EA, Mathew LK, Lohr CV, Hasson R and Tanguay RL (2007) Aryl hydrocarbon receptor activation impairs extracellular matrix remodeling during zebra fish fin regeneration. Toxicol Sci 95:215-26.
Begemann G, Schilling TF, Rauch GJ, Geisler R and Ingham PW (2001) The zebrafish neckless mutation reveals a requirement for raldh2 in mesodermal signals that pattern the hindbrain. Development 128:3081-94.
Bianco P and Robey PG (2001) Stem cells in tissue engineering. Nature 414:118-21. Brockes JP (1990) Retinoic acid and limb regeneration. J Cell Sci Suppl 13:191-8. Brockes JP (1991) Some current problems in amphibian limb regeneration. Philos Trans
R Soc Lond B Biol Sci 331:287-90. Brockes JP (1994) New approaches to amphibian limb regeneration. Trends Genet
10:169-73. Brockes JP, Kumar A and Velloso CP (2001) Regeneration as an evolutionary variable. J
Anat 199:3-11. Dobbs-McAuliffe B, Zhao Q and Linney E (2004) Feedback mechanisms regulate
retinoic acid production and degradation in the zebrafish embryo. Mech Dev 121:339-50.
Ferretti P and Geraudie J (1995) Retinoic acid-induced cell death in the wound epidermis of regenerating zebrafish fins. Dev Dyn 202:271-83.
Geraudie J, Monnot MJ, Ridet A, Thorogood P and Ferretti P (1993) Is exogenous retinoic acid necessary to alter positional information during regeneration of the fin in zebrafish? Prog Clin Biol Res 383B:803-14.
Geraudie J and Singer M (1977) Relation between nerve fiber number and pectoral fin regeneration in the teleost. J Exp Zool 199:1-8.
Gibert Y, Gajewski A, Meyer A and Begemann G (2006) Induction and prepatterning of the zebrafish pectoral fin bud requires axial retinoic acid signaling. Development 133:2649-59.
Jazwinska A, Badakov R and Keating MT (2007) Activin-betaA Signaling Is Required for Zebrafish Fin Regeneration. Curr Biol.
148
Kajihara M, Kawauchi S, Kobayashi M, Ogino H, Takahashi S and Yasuda K (2001) Isolation, characterization, and expression analysis of zebrafish large Mafs. J Biochem (Tokyo) 129:139-46.
Kawakami A, Fukazawa T and Takeda H (2004) Early fin primordia of zebrafish larvae regenerate by a similar growth control mechanism with adult regeneration. Dev Dyn 231:693-9.
Kawakami Y, Rodriguez Esteban C, Raya M, Kawakami H, Marti M, Dubova I and Izpisua Belmonte JC (2006a) Wnt/beta-catenin signaling regulates vertebrate limb regeneration. Genes Dev 20:3232-7.
Kawakami Y, Rodriguez Esteban C, Raya M, Kawakami H, Martí M, Dubova I and Izpisua Belmonte JC (2006b) Wnt/-catenin signaling regulates vertebrate limb regeneration. Genes and Dev Dec 2006; 20: 3232 - 3237 ; doi:10.1101/gad.1475106.
Kemp NE and Park JH (1970) Regeneration of lepidotrichia and actinotrichia in the tailfin of the teleost Tilapia mossambica. Dev Biol 22:321-42.
Kern J, Schrage K, Koopmans GC, Joosten EA, McCaffery P and Mey J (2007) Characterization of retinaldehyde dehydrogenase-2 induction in NG2-positive glia after spinal cord contusion injury. Int J Dev Neurosci 25:7-16.
Kim WS and Stocum DL (1986) Retinoic acid modifies positional memory in the anteroposterior axis of regenerating axolotl limbs. Dev Biol 114:170-9.
Lee Y, Grill S, Sanchez A, Murphy-Ryan M and Poss KD (2005) Fgf signaling instructs position-dependent growth rate during zebrafish fin regeneration. Development.
Lepilina A, Coon AN, Kikuchi K, Holdway JE, Roberts RW, Burns CG and Poss KD (2006) A dynamic epicardial injury response supports progenitor cell activity during zebrafish heart regeneration. Cell 127:607-19.
Lewis JL, Bonner J, Modrell M, Ragland JW, Moon RT, Dorsky RI and Raible DW (2004) Reiterated Wnt signaling during zebrafish neural crest development. Development 131:1299-308.
Lien CL, Schebesta M, Makino S, Weber GJ and Keating MT (2006) Gene Expression Analysis of Zebrafish Heart Regeneration. PLoS Biol 4.
Maden M and Hind M (2003) Retinoic acid, a regeneration-inducing molecule. Dev Dyn 226:237-44.
Mari-Beffa M, Mateos I, Palmqvist P and Becerra J (1996) Cell to cell interactions during teleosts fin regeneration. Int J Dev Biol Suppl 1:179S-180S.
Mathew LK, Andreasen EA and Tanguay RL (2006) Aryl hydrocarbon receptor activation inhibits regenerative growth. Mol Pharmacol 69:257-65.
Mathew LK, Sengupta S, Kawakami A, Andreasen EA, Lohr CV, Loynes CA, Renshaw SA, Peterson RT and Tanguay RL (2007) Unraveling tissue regeneration pathways using chemical genetics. J Biol Chem.
Mey J, D JM, Brook G, Liu RH, Zhang YP, Koopmans G and McCaffery P (2005) Retinoic acid synthesis by a population of NG2-positive cells in the injured spinal cord. Eur J Neurosci 21:1555-68.
Mic FA, Sirbu IO and Duester G (2004) Retinoic acid synthesis controlled by Raldh2 is required early for limb bud initiation and then later as a proximodistal signal during apical ectodermal ridge formation. J Biol Chem 279:26698-706.
Morgan TH (1900) Regeneration in teleosts. Arch Entw Org 10:120-131.
149
Morgan TH (1902) Further experiments on the regeneration of the tail fins of fishes. Arch Entw MEch 14:539-561.
Nasevicius A and Ekker SC (2000) Effective targeted gene 'knockdown' in zebrafish. Nat Genet 26:216-20.
Nechiporuk A and Keating MT (2002) A proliferation gradient between proximal and msxb-expressing distal blastema directs zebrafish fin regeneration. Development 129:2607-17.
O'Steen WK and Walker BE (1962) Radioautographic studies or regeneration in the common newt. III. Regeneration and repair of the intestine. Anat Rec 142:179-87.
Poss KD, Keating MT and Nechiporuk A (2003) Tales of regeneration in zebrafish. Dev Dyn 226:202-210.
Poss KD, Nechiporuk A, Hillam AM, Johnson SL and Keating MT (2002a) Mps1 defines a proximal blastemal proliferative compartment essential for zebrafish fin regeneration. Development 129:5141-9.
Poss KD, Shen J and Keating MT (2000a) Induction of lef1 during zebrafish fin regeneration. Dev Dyn 219:282-6.
Poss KD, Shen J, Nechiporuk A, McMahon G, Thisse B, Thisse C and Keating MT (2000b) Roles for Fgf signaling during zebrafish fin regeneration. Dev Biol 222:347-58.
Poss KD, Wilson LG and Keating MT (2002b) Heart regeneration in zebrafish. Science 298:2188-90.
Quint E, Smith A, Avaron F, Laforest L, Miles J, Gaffield W and Akimenko MA (2002) Bone patterning is altered in the regenerating zebrafish caudal fin after ectopic expression of sonic hedgehog and bmp2b or exposure to cyclopamine. Proc Natl Acad Sci U S A 99:8713-8.
Raya A, Consiglio A, Kawakami Y, Rodriguez-Esteban C and Izpisua-Belmonte JC (2004) The zebrafish as a model of heart regeneration. Cloning Stem Cells 6:345-51.
Raya A, Koth CM, Buscher D, Kawakami Y, Itoh T, Raya RM, Sternik G, Tsai HJ, Rodriguez-Esteban C and Izpisua-Belmonte JC (2003) Activation of Notch signaling pathway precedes heart regeneration in zebrafish. Proc Natl Acad Sci U S A 100 Suppl 1:11889-95.
Rinkevich Y, Paz G, Rinkevich B and Reshef R (2007) Systemic Bud Induction and Retinoic Acid Signaling Underlie Whole Body Regeneration in the Urochordate Botrylloides leachi. PLoS Biol 5:e71.
Santamaria JA and Becerra J (1991) Tail fin regeneration in teleosts: cell-extracellular matrix interaction in blastemal differentiation. J Anat 176:9-21.
Santamaria JA, Mari-Beffa M and Becerra J (1992) Interactions of the lepidotrichial matrix components during tail fin regeneration in teleosts. Differentiation 49:143-50.
Santamaria JA, Mari-Beffa M, Santos-Ruiz L and Becerra J (1996) Incorporation of bromodeoxyuridine in regenerating fin tissue of the goldfish Carassius auratus. J Exp Zool 275:300-7.
Schebesta M, Lien CL, Engel FB and Keating MT (2006) Transcriptional profiling of caudal fin regeneration in zebrafish. ScientificWorldJournal 6:38-54.
150
Schier AF, Neuhauss SC, Helde KA, Talbot WS and Driever W (1997) The one-eyed pinhead gene functions in mesoderm and endoderm formation in zebrafish and interacts with no tail. Development 124:327-42.
Schvarzstein M, Kirn A, Haffter P and Cordes SP (1999) Expression of Zkrml2, a homologue of the Krml1/val segmentation gene, during embryonic patterning of the zebrafish (Danio rerio). Mech Dev 80:223-6.
Shi Y and Massague J (2003) Mechanisms of TGF-beta signaling from cell membrane to the nucleus. Cell 113:685-700.
Stocum DL and Thoms SD (1984) Retinoic-acid-induced pattern completion in regenerating double anterior limbs of urodeles. J Exp Zool 232:207-15.
Stoick-Cooper CL, Weidinger G, Riehle KJ, Hubbert C, Major MB, Fausto N and Moon RT (2007) Distinct Wnt signaling pathways have opposing roles in appendage regeneration. Development 134:479-89.
Thoms SD and Stocum DL (1984) Retinoic acid-induced pattern duplication in regenerating urodele limbs. Dev Biol 103:319-28.
Thummel R, Bai S, Sarras MP, Jr., Song P, McDermott J, Brewer J, Perry M, Zhang X, Hyde DR and Godwin AR (2006) Inhibition of zebrafish fin regeneration using in vivo electroporation of morpholinos against fgfr1 and msxb. Dev Dyn 235:336-46.
Viviano CM and Brockes JP (1996) Is retinoic acid an endogenous ligand during urodele limb regeneration? Int J Dev Biol 40:817-22.
White JA, Boffa MB, Jones B and Petkovich M (1994) A zebrafish retinoic acid receptor expressed in the regenerating caudal fin. Development 120:1861-72.
Whitehead GG, Makino S, Lien CL and Keating MT (2005) fgf20 is essential for initiating zebrafish fin regeneration. Science 310:1957-60.
Yamada H, Miyake T and Kitamura T (1995) Regeneration of axons in transection of the carp spinal cord. Zoolog Sci 12:325-32.
Zodrow JM and Tanguay RL (2003) 2,3,7,8-tetrachlorodibenzo-p-dioxin inhibits zebrafish caudal fin regeneration. Toxicol Sci 76:151-161.
151
Acknowledgements
We would like to thank Anne-Marie Girard from the Center for Gene Research
and Biotechnology at Oregon State University for her valuable assistance. The vascular
specific fli directed gfp transgenic fish was kindly provided by Dr. Brant Weinstein of the
Unit on Vertebrate Organogenesis at the National Institutes of Health, Bathesda, MD.
The Tg(hsp70l:tcf3-GFP) line was obtained from ZIRC.

152
Figure 5-1. Comparative genomic analysis during zebrafish regeneration. A) Heat map illustrating the changes in gene expression during the progression of larval fin regeneration. The unamputated fin tissue at 2dpf (0dpa) was used as the control to compare with the regenerating fin at 1, 2 and 3dpa. B) The genes that were at least 2 fold differentially expressed were grouped based on the known function of the proteins. Comparative gene expression profiling was performed between larval fin, adult fin and adult heart regeneration systems in zebrafish. The venn diagram comparing the genes that were modulated during regeneration between the C) larval and the adult fin regeneration, D) larval fin and the adult heart regeneration and E) larval fin, adult fin and adult heart regeneration models.
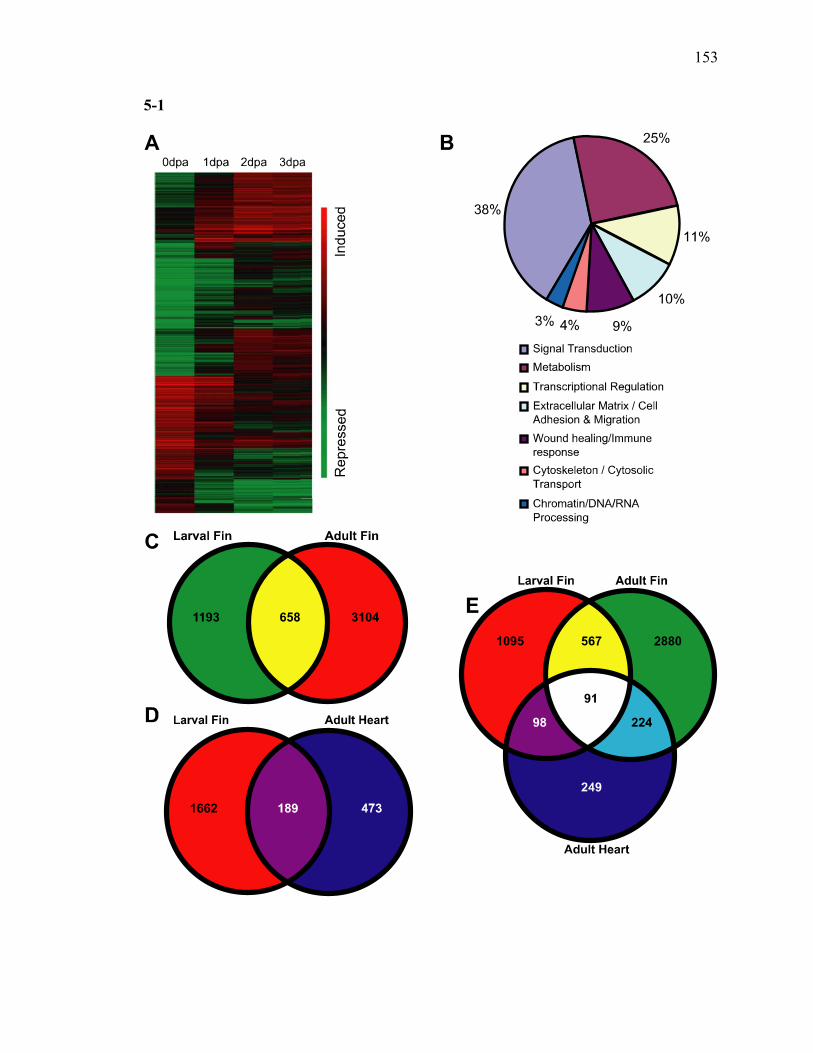
153
5-1

154
Figure 5-2. In situ localization of raldh2 in the larval and adult regenerating fin tissue. A) The mRNA localization of raldh2 was performed in the regenerating fin tissue at various time points in the larval fin tissue. The expression was detected in the larval regenerate as early as 4hpa and continuously till 3dpa. The raldh2 is clearly expressed beneath the wound epithelium at 4 & 8hpa and in the blastema region at 12hpa and 1dpa. Similar to the microarray and qRT-PCR data, raldh2 is highly expressed at 2dpa when compared to the other time points. B) The expression of raldh2 is present in the distal blastema region in the adult regenerating fin at 3dpa and the transcript is completely absent in the uncut adult fin.
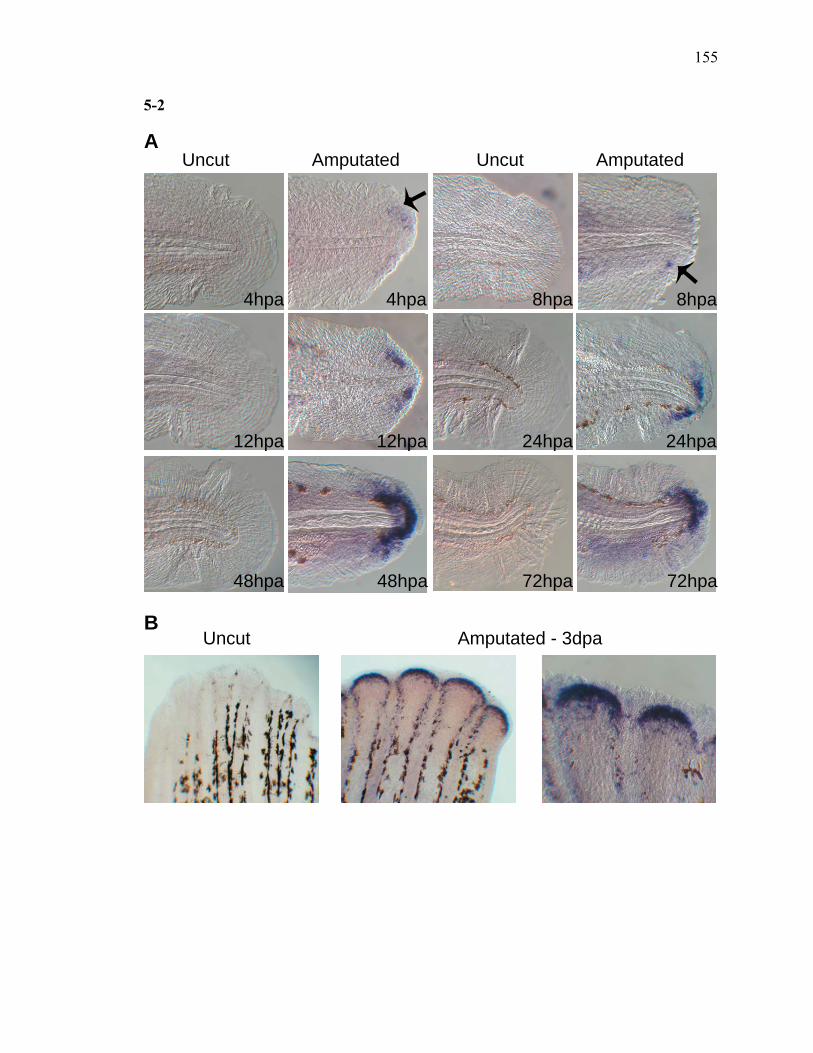
155
5-2
Uncut Amputated Uncut Amputated
4hpa 4hpa 8hpa 8hpa
12hpa 12hpa 24hpa 24hpa
48hpa 48hpa 72hpa 72hpa
A
BUncut Amputated - 3dpa
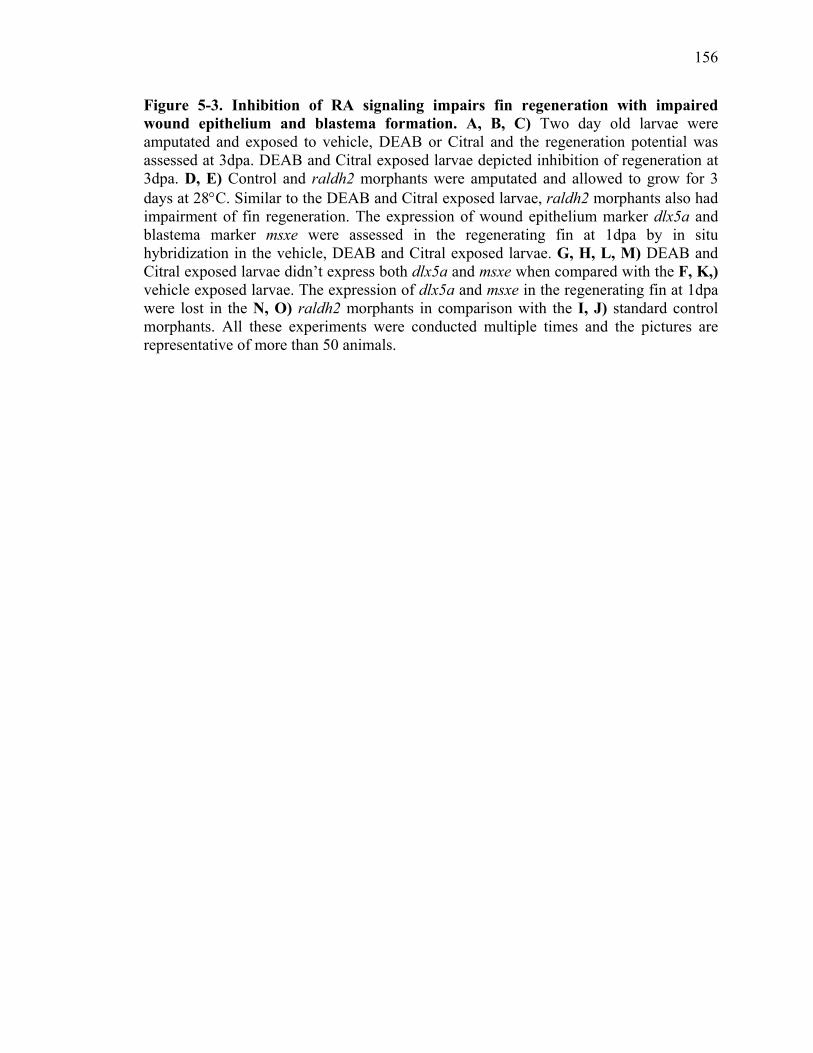
156
Figure 5-3. Inhibition of RA signaling impairs fin regeneration with impaired wound epithelium and blastema formation. A, B, C) Two day old larvae were amputated and exposed to vehicle, DEAB or Citral and the regeneration potential was assessed at 3dpa. DEAB and Citral exposed larvae depicted inhibition of regeneration at 3dpa. D, E) Control and raldh2 morphants were amputated and allowed to grow for 3 days at 28°C. Similar to the DEAB and Citral exposed larvae, raldh2 morphants also had impairment of fin regeneration. The expression of wound epithelium marker dlx5a and blastema marker msxe were assessed in the regenerating fin at 1dpa by in situ hybridization in the vehicle, DEAB and Citral exposed larvae. G, H, L, M) DEAB and Citral exposed larvae didn’t express both dlx5a and msxe when compared with the F, K,) vehicle exposed larvae. The expression of dlx5a and msxe in the regenerating fin at 1dpa were lost in the N, O) raldh2 morphants in comparison with the I, J) standard control morphants. All these experiments were conducted multiple times and the pictures are representative of more than 50 animals.
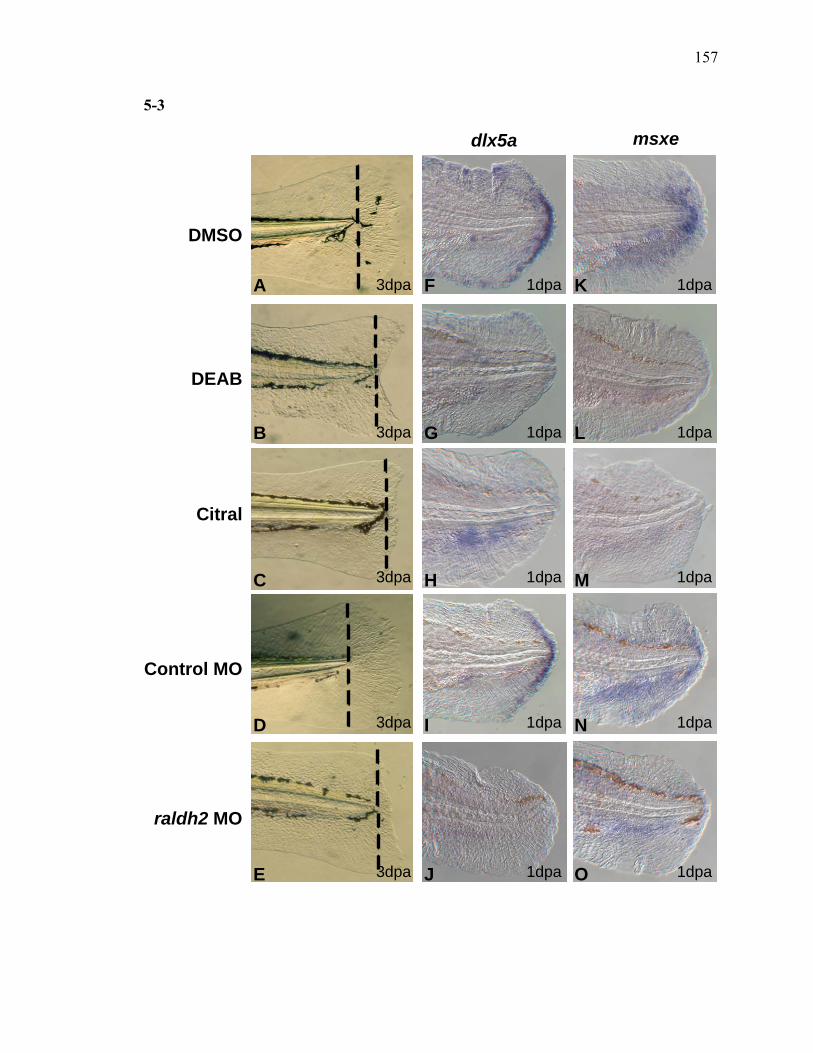
157
5-3
DMSO
3dpa
DEAB
3dpa
Citral
3dpa
3dpa
Control MO
3dpa
raldh2 MO
dlx5a msxe
1dpa 1dpa
1dpa 1dpa
1dpa1dpa
1dpa
1dpa
1dpa
1dpa
A
B
C
D
E
F
G
H
I
J
K
L
M
N
O

158
Figure 5-4. Raldh2 expression during fin regeneration is controlled by Wnt Signaling. Two day old wild type or homozygous Tg(hsp70l:tcf3-GFP) larvae were heat shocked at 37°C for 2hours followed by amputation after a few hours of heat shock. A) The Tg(hsp70l:tcf3-GFP) larvae had impaired regeneration at 3dpa when compared to the wild type. The dotted line indicates the plane of amputation. B, C) The expression of dlx5a in the wound epithelium and msxe in the blastema were not detectable in the Tg(hsp70l:tcf3-GFP) larvae in comparison with the wild type larvae. D) The expression of raldh2 was completely lost in the Tg(hsp70l:tcf3-GFP) larvae, whereas raldh2 is clearly expressed in the wild type larvae at 1dpa.
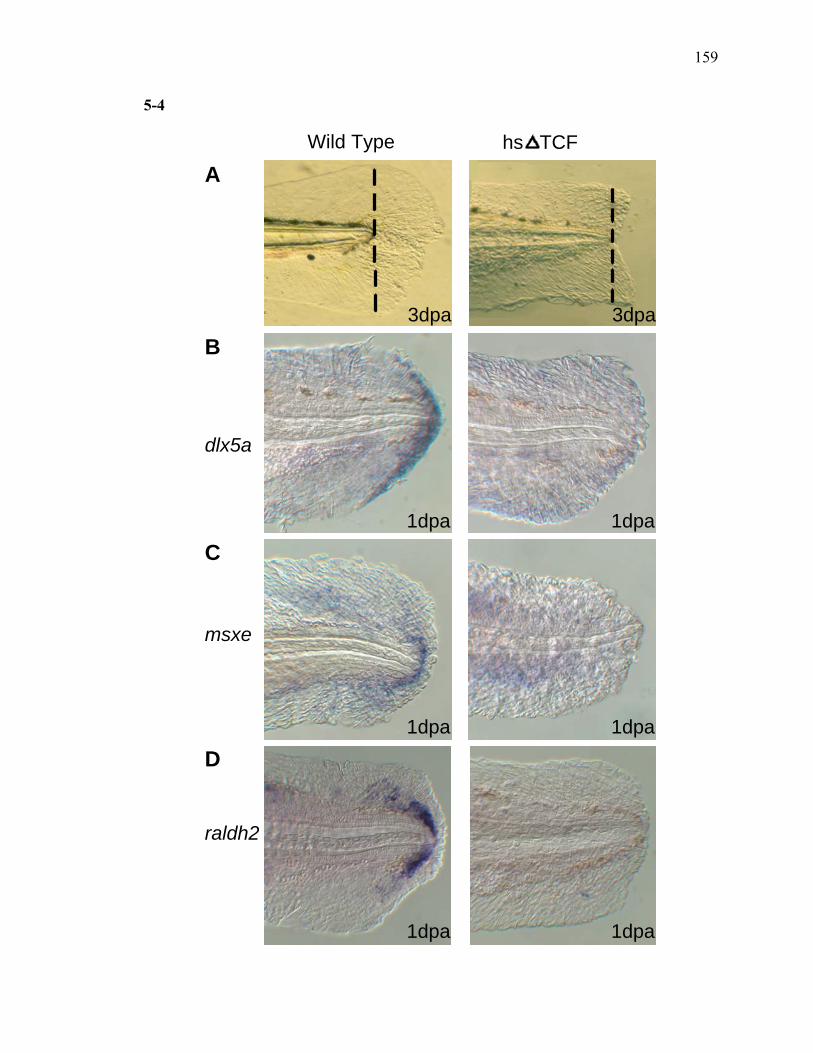
159
5-4
Wild Type hs TCF
3dpa
1dpa 1dpa
3dpa
raldh2
dlx5a
A
B
msxe
C
D
1dpa 1dpa
1dpa 1dpa
160
Figure 5-5. Expression of raldh2 is dependent on the phosphorylation of ERK1/2 during fin regeneration. The amputated larvae at 2dpf were exposed to vehicle or U0126 and regeneration was assessed at 3dpa. A) The vehicle exposed larvae completely regenerated by 3dpa, whereas, U0126 exposed larvae had inhibition of fin regeneration. The dotted line indicates the plane of amputation. B, C) The wound epithelium marker dlx5a and blastema marker msxe were expressed in the vehicle exposed larvae and is not detectable in the U0126 exposed larvae. D) Raldh2 expression is present in the blastema area in the vehicle exposed larvae at 1dpa and is not detectable in the U0126 exposed larvae.
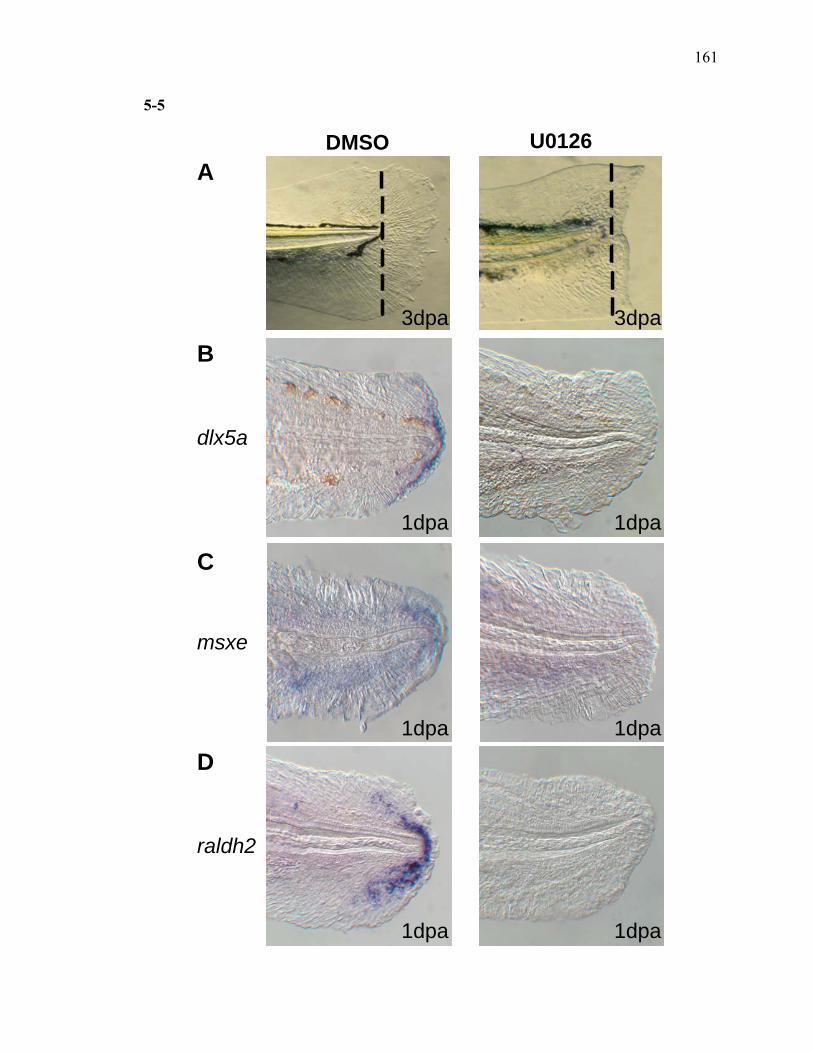
161
5-5
3dpa 3dpa
raldh2
1dpa 1dpa
DMSO U0126
dlx5a
A
B
msxe
1dpa 1dpa
1dpa 1dpa
C
D

162
Figure 5-6. Activin-βA Signaling regulates raldh2 expression during regeneration. A) Inhibition of activin-βA signaling by SB431542 completely blocks larval fin regeneration. The dotted line indicates the plane of amputation. B, C) The wound epithelium and blastema markers such as dlx5a and msxe respectively are completely repressed in the SB431542 exposed larval regenerating fin at 1dpa. D) Exposure to SB431542 results in the loss of expression of raldh2 in the regenerating fin at 1dpa in comparison with the vehicle exposed larvae. E) The Wnt signaling molecule wnt10a is expressed in the regenerating fin of both vehicle as well as SB431542 exposed larvae at 1dpa.
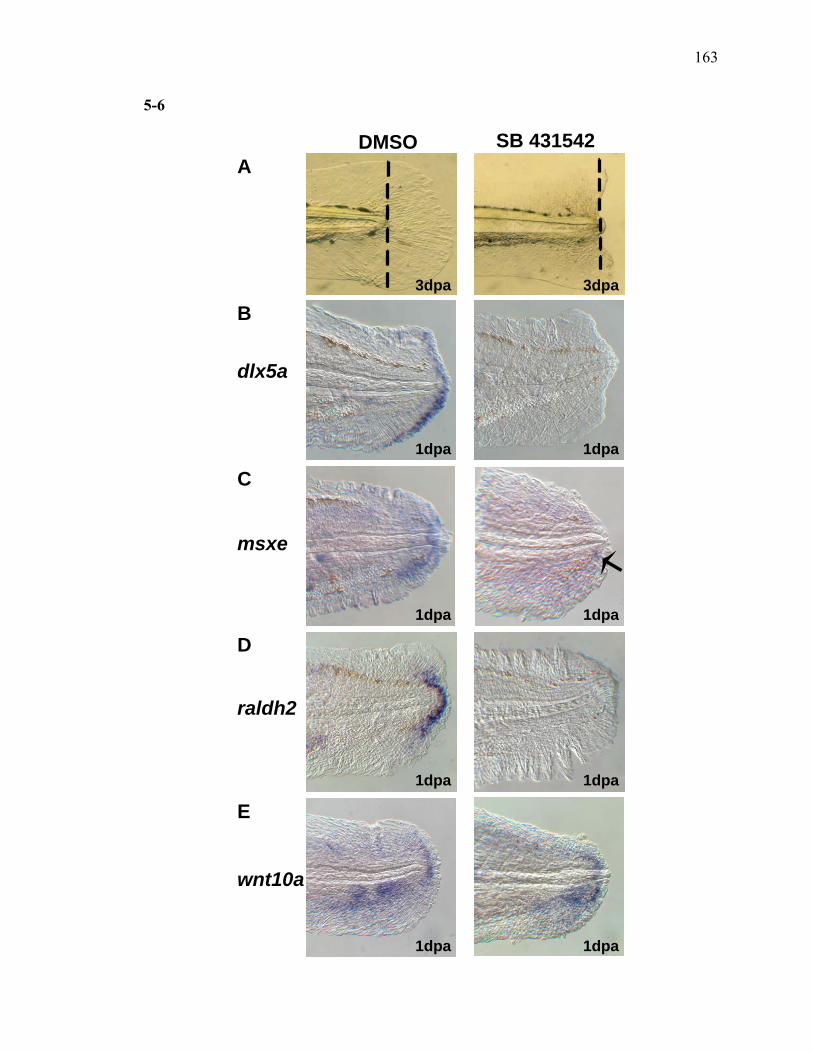
163
5-6
DMSO SB 431542A
raldh2
msxe
dlx5a
wnt10a
B
C
D
E
3dpa 3dpa
1dpa
1dpa1dpa
1dpa1dpa
1dpa1dpa
1dpa
164
Figure 5-7. Proposed model of essential molecular pathways controlling fin regeneration. Zebrafish, unlike mammals and human beings have the remarkable ability to regenerate several organs including heart, spinal cord, and caudal fin after surgical amputation or injury. Based on the comparative genomic and functional analysis, we propose that, the hierarchy of molecular signaling pathways actively involved during the process of regeneration is highly conserved across different regeneration platforms and life stages. Since the expression of fgf20a is regulated by Wnt signaling and the expression of wnt10a is detectable in the regenerating fin with the inhibition of activin-βA signaling, we propose that Wnt signaling pathway is upstream to all the signaling pathways studied during fin regeneration. Raldh2, a rate limiting enzyme for the synthesis of retinoic acid is regulated by Wnt signaling and is also dependent on the phosphorylation of ERK1/2, implicating the involvement of Fgf pathway as Fgf signaling is mediated through the phosphorylation of ERK1/2. Activin-βA signaling is also involved in the regulation of raldh2, suggesting that, raldh2 is downstream to Wnt, Fgf and activin-βA signaling during regeneration. The possibility of Wnt controlling the expression of raldh2 directly is also plausible. Similarly, whether the regulation of raldh2 by activin-βA signaling is Fgf dependent or not has to be studied further.
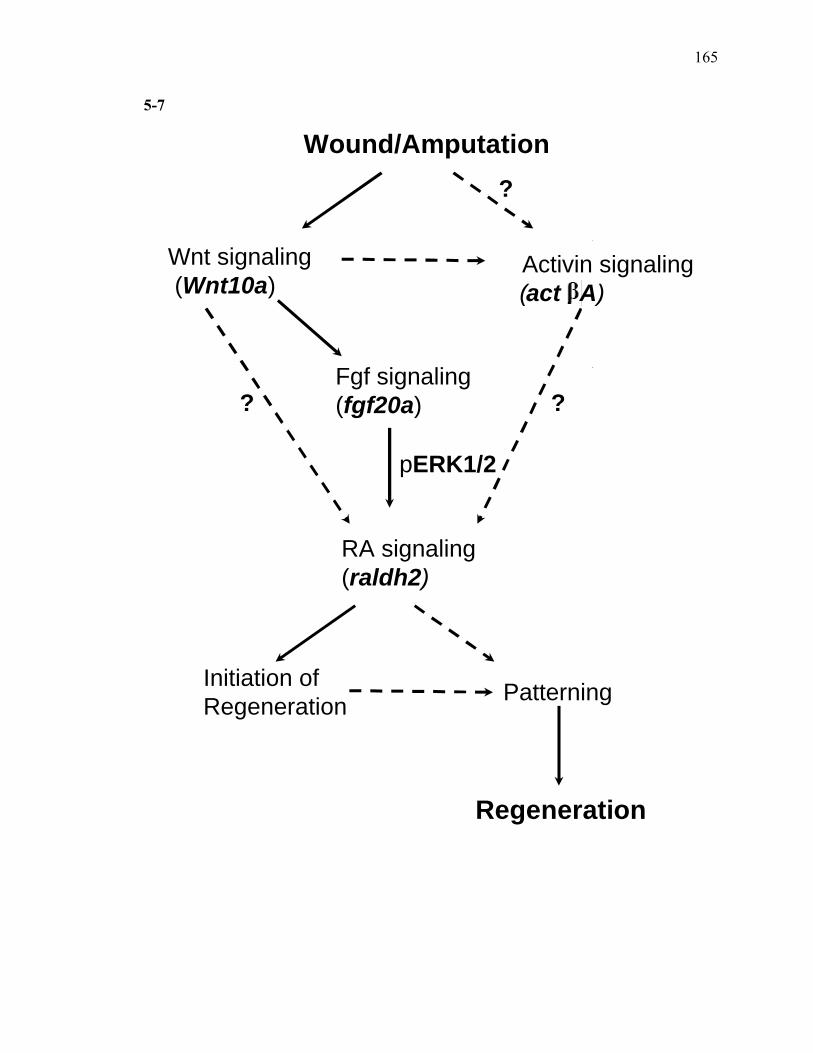
165
5-7
Wound/Amputation
Wnt signaling(Wnt10a)
Fgf signaling(fgf20a)
pERK1/2
Regeneration
RA signaling(raldh2)
?
??
Activin signaling(act A)
Initiation ofRegeneration Patterning
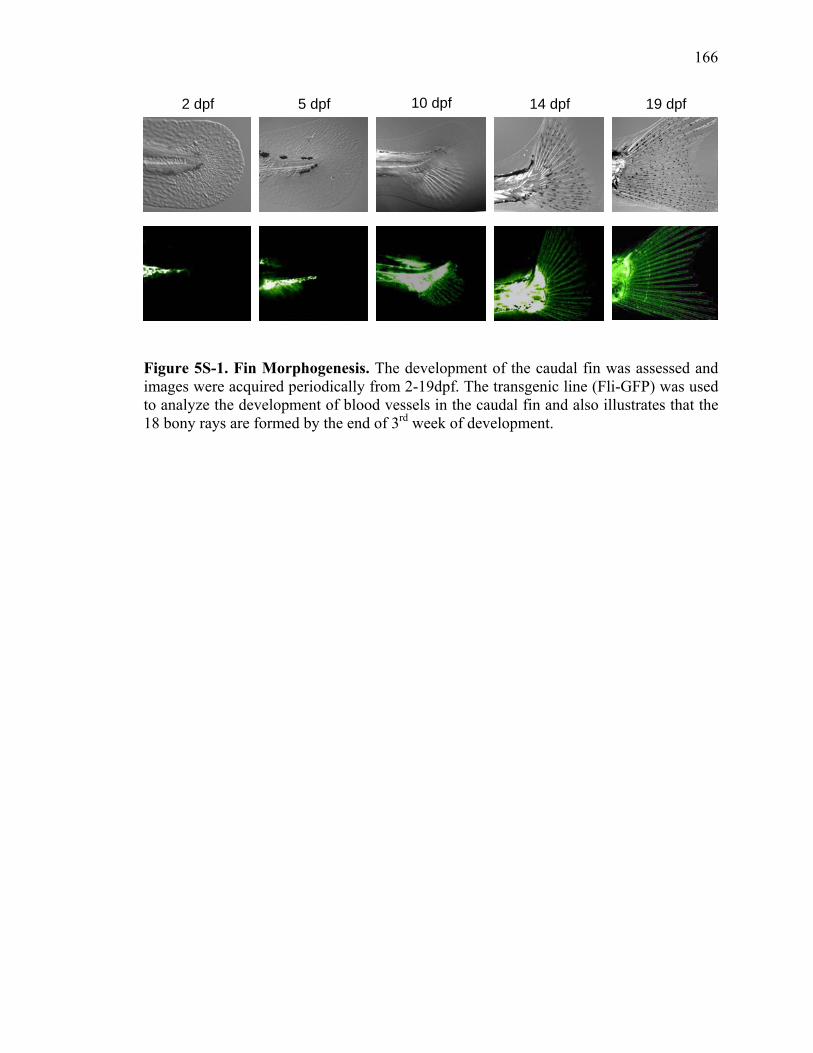
166
2 dpf 10 dpf5 dpf 14 dpf 19 dpf
Figure 5S-1. Fin Morphogenesis. The development of the caudal fin was assessed and images were acquired periodically from 2-19dpf. The transgenic line (Fli-GFP) was used to analyze the development of blood vessels in the caudal fin and also illustrates that the 18 bony rays are formed by the end of 3rd week of development.
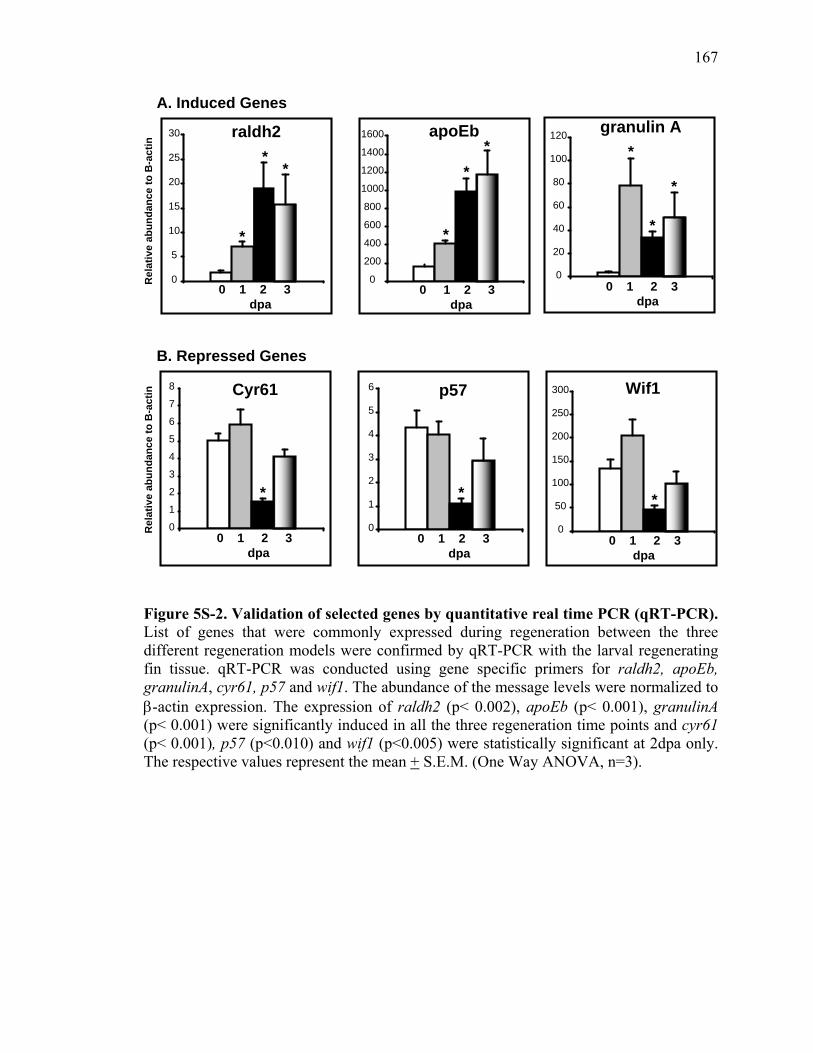
167
0
5
10
15
20
25
30 raldh2
0 1 2 3 dpa
*
**
0
200
400
600
800
1000
1200
1400
1600 apoEb
0 1 2 3 dpa
*
**
0
20
40
60
80
100
120 granulin A
0 1 2 3 dpa
*
*
*
0
50 *100
150
200
250
300 Wif1
0 1 2 3 dpa
0
1
2
3
4
5
6 p57
0 1 2 3 dpa
*
0
1
2
3
4
5
6
7
8 Cyr61
0 1 2 3 dpa
*
A. Induced Genes
B. Repressed Genes
Rel
ativ
e ab
unda
nce
to B
-act
inR
elat
ive
abun
danc
e to
B-a
ctin
Figure 5S-2. Validation of selected genes by quantitative real time PCR (qRT-PCR). List of genes that were commonly expressed during regeneration between the three different regeneration models were confirmed by qRT-PCR with the larval regenerating fin tissue. qRT-PCR was conducted using gene specific primers for raldh2, apoEb, granulinA, cyr61, p57 and wif1. The abundance of the message levels were normalized to β-actin expression. The expression of raldh2 (p< 0.002), apoEb (p< 0.001), granulinA (p< 0.001) were significantly induced in all the three regeneration time points and cyr61 (p< 0.001), p57 (p<0.010) and wif1 (p<0.005) were statistically significant at 2dpa only. The respective values represent the mean + S.E.M. (One Way ANOVA, n=3).
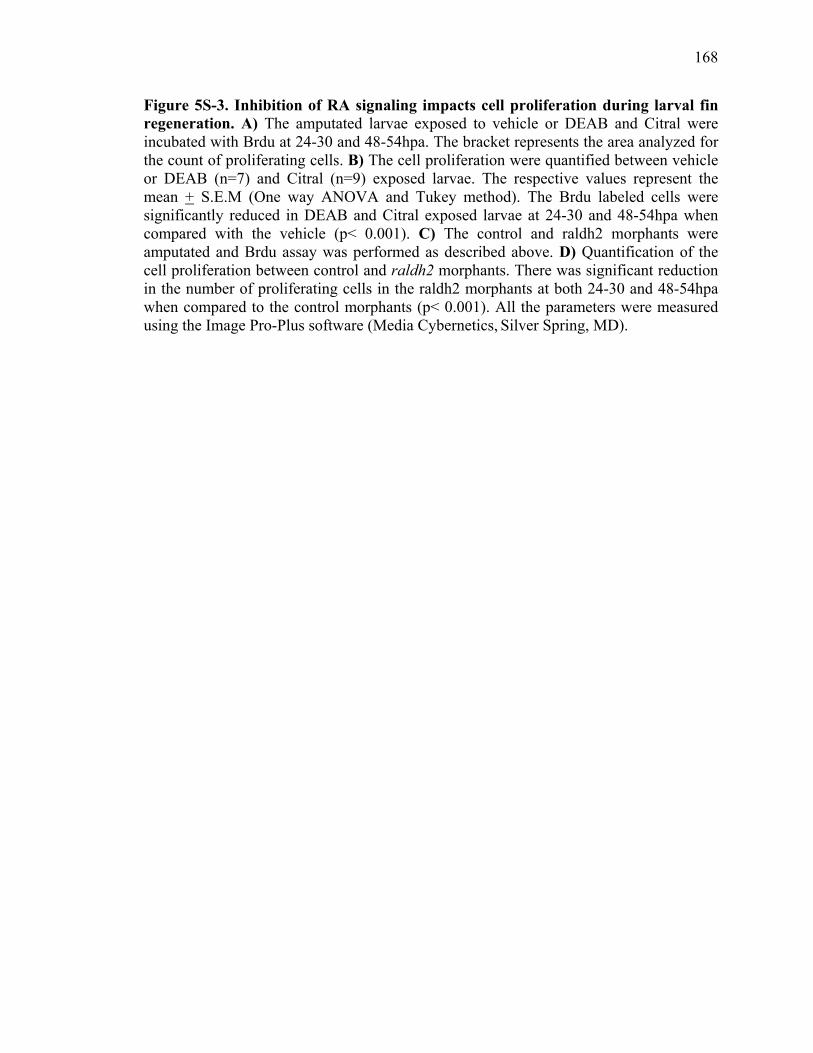
168
Figure 5S-3. Inhibition of RA signaling impacts cell proliferation during larval fin regeneration. A) The amputated larvae exposed to vehicle or DEAB and Citral were incubated with Brdu at 24-30 and 48-54hpa. The bracket represents the area analyzed for the count of proliferating cells. B) The cell proliferation were quantified between vehicle or DEAB (n=7) and Citral (n=9) exposed larvae. The respective values represent the mean + S.E.M (One way ANOVA and Tukey method). The Brdu labeled cells were significantly reduced in DEAB and Citral exposed larvae at 24-30 and 48-54hpa when compared with the vehicle (p< 0.001). C) The control and raldh2 morphants were amputated and Brdu assay was performed as described above. D) Quantification of the cell proliferation between control and raldh2 morphants. There was significant reduction in the number of proliferating cells in the raldh2 morphants at both 24-30 and 48-54hpa when compared to the control morphants (p< 0.001). All the parameters were measured using the Image Pro-Plus software (Media Cybernetics, Silver Spring, MD).
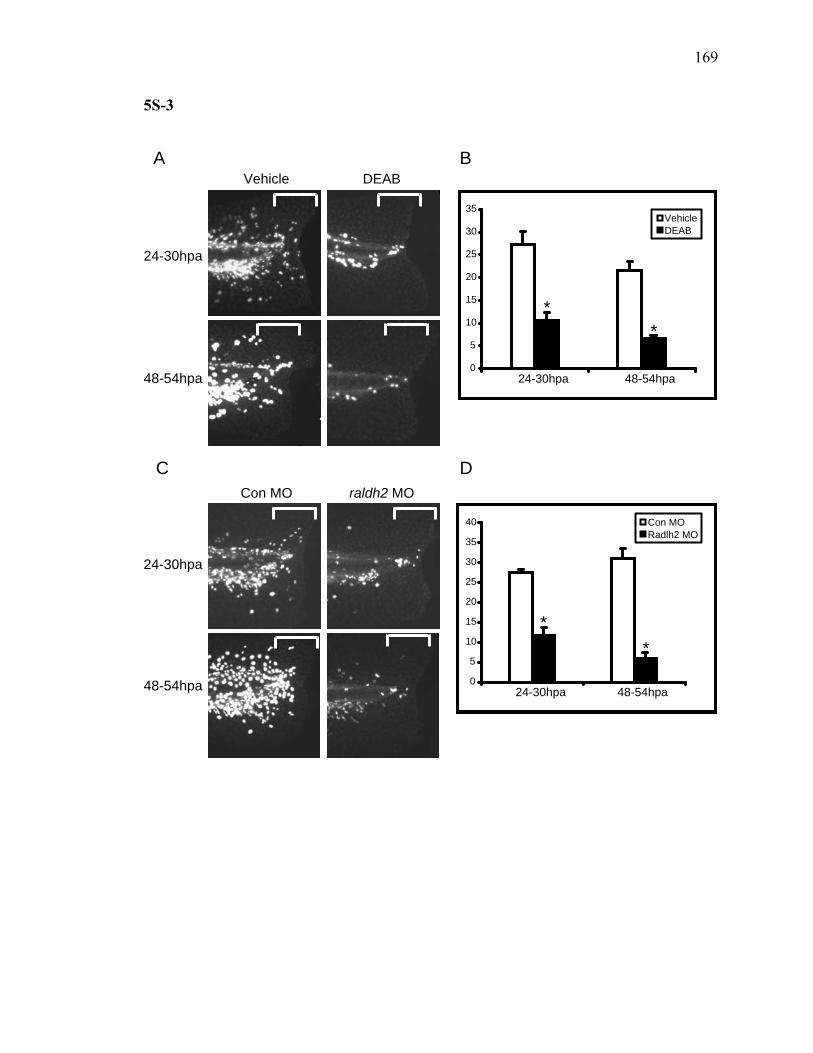
169
5S-3
0
5
10
15
20
25
30
35
40
24-30hpa 48-54hpa
Con MORadlh2 MO
**
0
5
10
15
20
25
30
35
24-30hpa 48-54hpa
VehicleDEAB
**
Vehicle DEAB
24-30hpa
48-54hpa
24-30hpa
48-54hpa
Con MO raldh2 MO
A
C
B
D
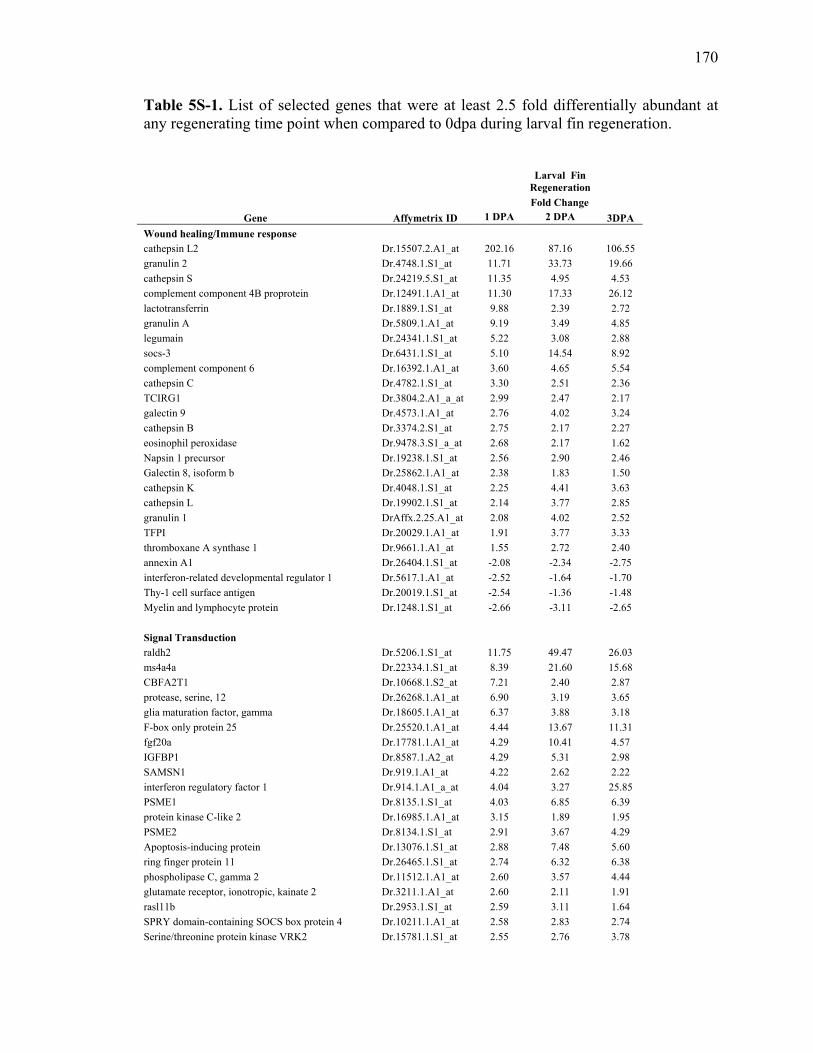
170
Table 5S-1. List of selected genes that were at least 2.5 fold differentially abundant at any regenerating time point when compared to 0dpa during larval fin regeneration.
Larval Fin Regeneration Fold Change
Gene Affymetrix ID 1 DPA 2 DPA 3DPA Wound healing/Immune response cathepsin L2 Dr.15507.2.A1_at 202.16 87.16 106.55 granulin 2 Dr.4748.1.S1_at 11.71 33.73 19.66 cathepsin S Dr.24219.5.S1_at 11.35 4.95 4.53 complement component 4B proprotein Dr.12491.1.A1_at 11.30 17.33 26.12 lactotransferrin Dr.1889.1.S1_at 9.88 2.39 2.72 granulin A Dr.5809.1.A1_at 9.19 3.49 4.85 legumain Dr.24341.1.S1_at 5.22 3.08 2.88 socs-3 Dr.6431.1.S1_at 5.10 14.54 8.92 complement component 6 Dr.16392.1.A1_at 3.60 4.65 5.54 cathepsin C Dr.4782.1.S1_at 3.30 2.51 2.36 TCIRG1 Dr.3804.2.A1_a_at 2.99 2.47 2.17 galectin 9 Dr.4573.1.A1_at 2.76 4.02 3.24 cathepsin B Dr.3374.2.S1_at 2.75 2.17 2.27 eosinophil peroxidase Dr.9478.3.S1_a_at 2.68 2.17 1.62 Napsin 1 precursor Dr.19238.1.S1_at 2.56 2.90 2.46 Galectin 8, isoform b Dr.25862.1.A1_at 2.38 1.83 1.50 cathepsin K Dr.4048.1.S1_at 2.25 4.41 3.63 cathepsin L Dr.19902.1.S1_at 2.14 3.77 2.85 granulin 1 DrAffx.2.25.A1_at 2.08 4.02 2.52 TFPI Dr.20029.1.A1_at 1.91 3.77 3.33 thromboxane A synthase 1 Dr.9661.1.A1_at 1.55 2.72 2.40 annexin A1 Dr.26404.1.S1_at -2.08 -2.34 -2.75 interferon-related developmental regulator 1 Dr.5617.1.A1_at -2.52 -1.64 -1.70 Thy-1 cell surface antigen Dr.20019.1.S1_at -2.54 -1.36 -1.48 Myelin and lymphocyte protein Dr.1248.1.S1_at -2.66 -3.11 -2.65 Signal Transduction raldh2 Dr.5206.1.S1_at 11.75 49.47 26.03 ms4a4a Dr.22334.1.S1_at 8.39 21.60 15.68 CBFA2T1 Dr.10668.1.S2_at 7.21 2.40 2.87 protease, serine, 12 Dr.26268.1.A1_at 6.90 3.19 3.65 glia maturation factor, gamma Dr.18605.1.A1_at 6.37 3.88 3.18 F-box only protein 25 Dr.25520.1.A1_at 4.44 13.67 11.31 fgf20a Dr.17781.1.A1_at 4.29 10.41 4.57 IGFBP1 Dr.8587.1.A2_at 4.29 5.31 2.98 SAMSN1 Dr.919.1.A1_at 4.22 2.62 2.22 interferon regulatory factor 1 Dr.914.1.A1_a_at 4.04 3.27 25.85 PSME1 Dr.8135.1.S1_at 4.03 6.85 6.39 protein kinase C-like 2 Dr.16985.1.A1_at 3.15 1.89 1.95 PSME2 Dr.8134.1.S1_at 2.91 3.67 4.29 Apoptosis-inducing protein Dr.13076.1.S1_at 2.88 7.48 5.60 ring finger protein 11 Dr.26465.1.S1_at 2.74 6.32 6.38 phospholipase C, gamma 2 Dr.11512.1.A1_at 2.60 3.57 4.44 glutamate receptor, ionotropic, kainate 2 Dr.3211.1.A1_at 2.60 2.11 1.91 rasl11b Dr.2953.1.S1_at 2.59 3.11 1.64 SPRY domain-containing SOCS box protein 4 Dr.10211.1.A1_at 2.58 2.83 2.74 Serine/threonine protein kinase VRK2 Dr.15781.1.S1_at 2.55 2.76 3.78
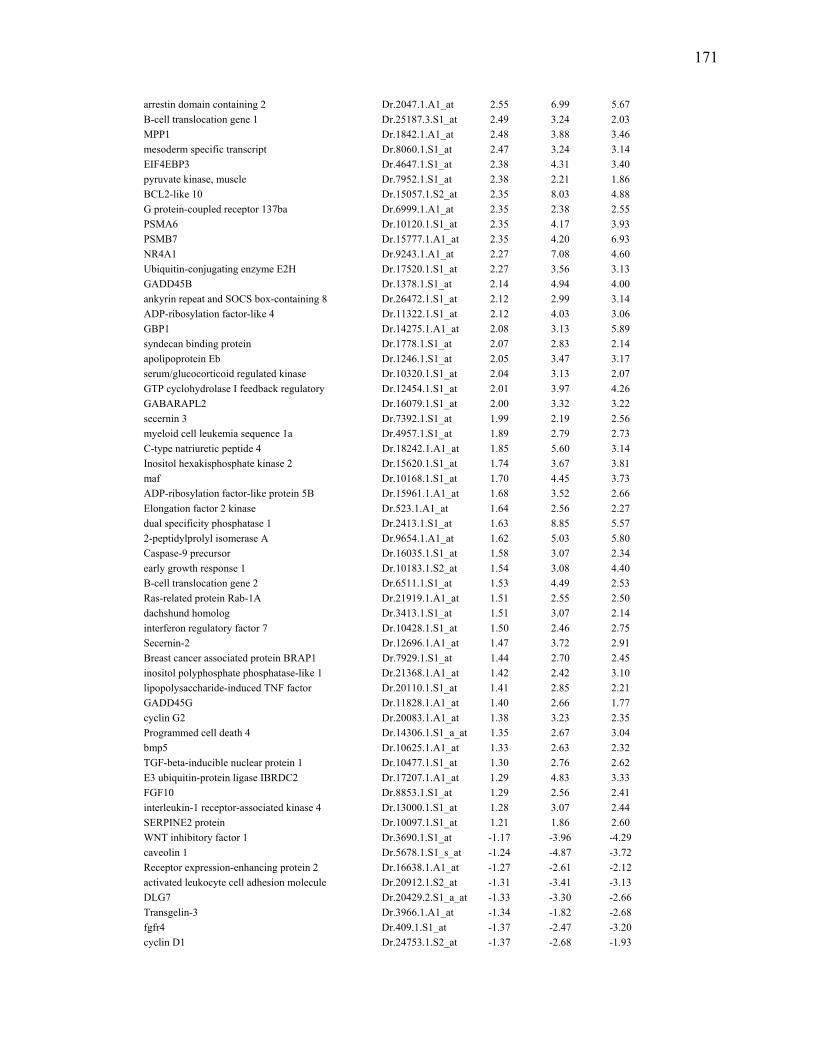
171
arrestin domain containing 2 Dr.2047.1.A1_at 2.55 6.99 5.67 B-cell translocation gene 1 Dr.25187.3.S1_at 2.49 3.24 2.03 MPP1 Dr.1842.1.A1_at 2.48 3.88 3.46 mesoderm specific transcript Dr.8060.1.S1_at 2.47 3.24 3.14 EIF4EBP3 Dr.4647.1.S1_at 2.38 4.31 3.40 pyruvate kinase, muscle Dr.7952.1.S1_at 2.38 2.21 1.86 BCL2-like 10 Dr.15057.1.S2_at 2.35 8.03 4.88 G protein-coupled receptor 137ba Dr.6999.1.A1_at 2.35 2.38 2.55 PSMA6 Dr.10120.1.S1_at 2.35 4.17 3.93 PSMB7 Dr.15777.1.A1_at 2.35 4.20 6.93 NR4A1 Dr.9243.1.A1_at 2.27 7.08 4.60 Ubiquitin-conjugating enzyme E2H Dr.17520.1.S1_at 2.27 3.56 3.13 GADD45B Dr.1378.1.S1_at 2.14 4.94 4.00 ankyrin repeat and SOCS box-containing 8 Dr.26472.1.S1_at 2.12 2.99 3.14 ADP-ribosylation factor-like 4 Dr.11322.1.S1_at 2.12 4.03 3.06 GBP1 Dr.14275.1.A1_at 2.08 3.13 5.89 syndecan binding protein Dr.1778.1.S1_at 2.07 2.83 2.14 apolipoprotein Eb Dr.1246.1.S1_at 2.05 3.47 3.17 serum/glucocorticoid regulated kinase Dr.10320.1.S1_at 2.04 3.13 2.07 GTP cyclohydrolase I feedback regulatory Dr.12454.1.S1_at 2.01 3.97 4.26 GABARAPL2 Dr.16079.1.S1_at 2.00 3.32 3.22 secernin 3 Dr.7392.1.S1_at 1.99 2.19 2.56 myeloid cell leukemia sequence 1a Dr.4957.1.S1_at 1.89 2.79 2.73 C-type natriuretic peptide 4 Dr.18242.1.A1_at 1.85 5.60 3.14 Inositol hexakisphosphate kinase 2 Dr.15620.1.S1_at 1.74 3.67 3.81 maf Dr.10168.1.S1_at 1.70 4.45 3.73 ADP-ribosylation factor-like protein 5B Dr.15961.1.A1_at 1.68 3.52 2.66 Elongation factor 2 kinase Dr.523.1.A1_at 1.64 2.56 2.27 dual specificity phosphatase 1 Dr.2413.1.S1_at 1.63 8.85 5.57 2-peptidylprolyl isomerase A Dr.9654.1.A1_at 1.62 5.03 5.80 Caspase-9 precursor Dr.16035.1.S1_at 1.58 3.07 2.34 early growth response 1 Dr.10183.1.S2_at 1.54 3.08 4.40 B-cell translocation gene 2 Dr.6511.1.S1_at 1.53 4.49 2.53 Ras-related protein Rab-1A Dr.21919.1.A1_at 1.51 2.55 2.50 dachshund homolog Dr.3413.1.S1_at 1.51 3.07 2.14 interferon regulatory factor 7 Dr.10428.1.S1_at 1.50 2.46 2.75 Secernin-2 Dr.12696.1.A1_at 1.47 3.72 2.91 Breast cancer associated protein BRAP1 Dr.7929.1.S1_at 1.44 2.70 2.45 inositol polyphosphate phosphatase-like 1 Dr.21368.1.A1_at 1.42 2.42 3.10 lipopolysaccharide-induced TNF factor Dr.20110.1.S1_at 1.41 2.85 2.21 GADD45G Dr.11828.1.A1_at 1.40 2.66 1.77 cyclin G2 Dr.20083.1.A1_at 1.38 3.23 2.35 Programmed cell death 4 Dr.14306.1.S1_a_at 1.35 2.67 3.04 bmp5 Dr.10625.1.A1_at 1.33 2.63 2.32 TGF-beta-inducible nuclear protein 1 Dr.10477.1.S1_at 1.30 2.76 2.62 E3 ubiquitin-protein ligase IBRDC2 Dr.17207.1.A1_at 1.29 4.83 3.33 FGF10 Dr.8853.1.S1_at 1.29 2.56 2.41 interleukin-1 receptor-associated kinase 4 Dr.13000.1.S1_at 1.28 3.07 2.44 SERPINE2 protein Dr.10097.1.S1_at 1.21 1.86 2.60 WNT inhibitory factor 1 Dr.3690.1.S1_at -1.17 -3.96 -4.29 caveolin 1 Dr.5678.1.S1_s_at -1.24 -4.87 -3.72 Receptor expression-enhancing protein 2 Dr.16638.1.A1_at -1.27 -2.61 -2.12 activated leukocyte cell adhesion molecule Dr.20912.1.S2_at -1.31 -3.41 -3.13 DLG7 Dr.20429.2.S1_a_at -1.33 -3.30 -2.66 Transgelin-3 Dr.3966.1.A1_at -1.34 -1.82 -2.68 fgfr4 Dr.409.1.S1_at -1.37 -2.47 -3.20 cyclin D1 Dr.24753.1.S2_at -1.37 -2.68 -1.93
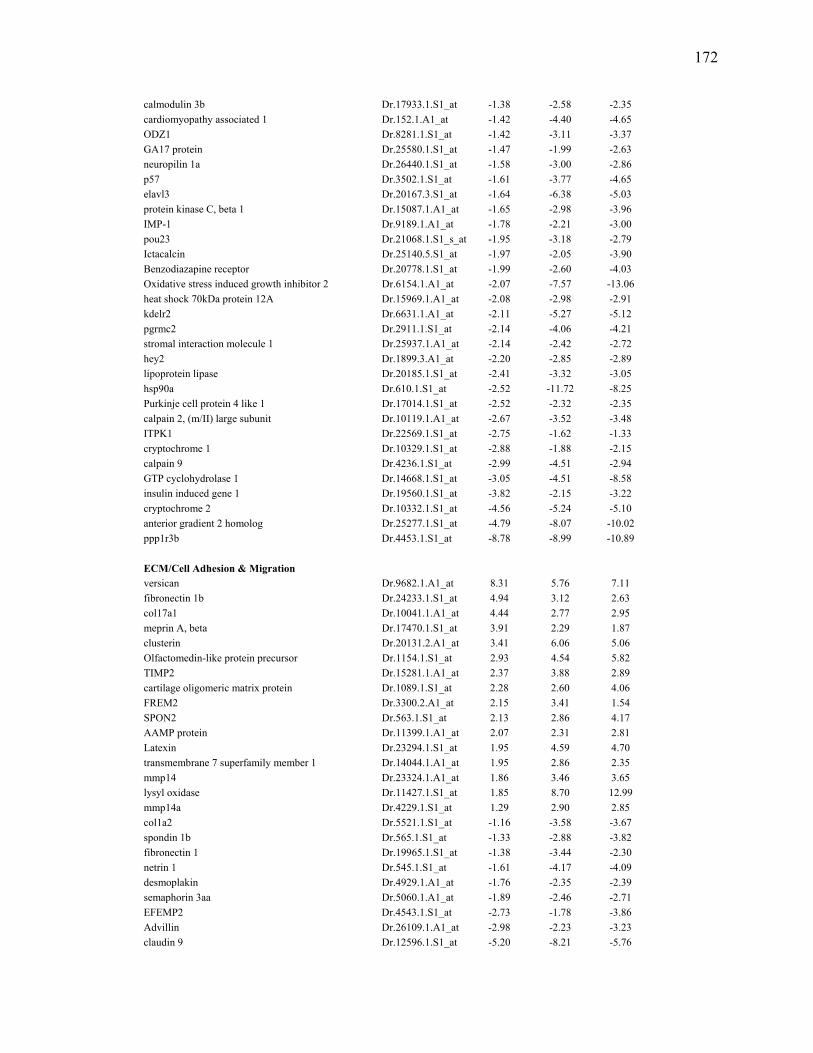
172
calmodulin 3b Dr.17933.1.S1_at -1.38 -2.58 -2.35 cardiomyopathy associated 1 Dr.152.1.A1_at -1.42 -4.40 -4.65 ODZ1 Dr.8281.1.S1_at -1.42 -3.11 -3.37 GA17 protein Dr.25580.1.S1_at -1.47 -1.99 -2.63 neuropilin 1a Dr.26440.1.S1_at -1.58 -3.00 -2.86 p57 Dr.3502.1.S1_at -1.61 -3.77 -4.65 elavl3 Dr.20167.3.S1_at -1.64 -6.38 -5.03 protein kinase C, beta 1 Dr.15087.1.A1_at -1.65 -2.98 -3.96 IMP-1 Dr.9189.1.A1_at -1.78 -2.21 -3.00 pou23 Dr.21068.1.S1_s_at -1.95 -3.18 -2.79 Ictacalcin Dr.25140.5.S1_at -1.97 -2.05 -3.90 Benzodiazapine receptor Dr.20778.1.S1_at -1.99 -2.60 -4.03 Oxidative stress induced growth inhibitor 2 Dr.6154.1.A1_at -2.07 -7.57 -13.06 heat shock 70kDa protein 12A Dr.15969.1.A1_at -2.08 -2.98 -2.91 kdelr2 Dr.6631.1.A1_at -2.11 -5.27 -5.12 pgrmc2 Dr.2911.1.S1_at -2.14 -4.06 -4.21 stromal interaction molecule 1 Dr.25937.1.A1_at -2.14 -2.42 -2.72 hey2 Dr.1899.3.A1_at -2.20 -2.85 -2.89 lipoprotein lipase Dr.20185.1.S1_at -2.41 -3.32 -3.05 hsp90a Dr.610.1.S1_at -2.52 -11.72 -8.25 Purkinje cell protein 4 like 1 Dr.17014.1.S1_at -2.52 -2.32 -2.35 calpain 2, (m/II) large subunit Dr.10119.1.A1_at -2.67 -3.52 -3.48 ITPK1 Dr.22569.1.S1_at -2.75 -1.62 -1.33 cryptochrome 1 Dr.10329.1.S1_at -2.88 -1.88 -2.15 calpain 9 Dr.4236.1.S1_at -2.99 -4.51 -2.94 GTP cyclohydrolase 1 Dr.14668.1.S1_at -3.05 -4.51 -8.58 insulin induced gene 1 Dr.19560.1.S1_at -3.82 -2.15 -3.22 cryptochrome 2 Dr.10332.1.S1_at -4.56 -5.24 -5.10 anterior gradient 2 homolog Dr.25277.1.S1_at -4.79 -8.07 -10.02 ppp1r3b Dr.4453.1.S1_at -8.78 -8.99 -10.89 ECM/Cell Adhesion & Migration versican Dr.9682.1.A1_at 8.31 5.76 7.11 fibronectin 1b Dr.24233.1.S1_at 4.94 3.12 2.63 col17a1 Dr.10041.1.A1_at 4.44 2.77 2.95 meprin A, beta Dr.17470.1.S1_at 3.91 2.29 1.87 clusterin Dr.20131.2.A1_at 3.41 6.06 5.06 Olfactomedin-like protein precursor Dr.1154.1.S1_at 2.93 4.54 5.82 TIMP2 Dr.15281.1.A1_at 2.37 3.88 2.89 cartilage oligomeric matrix protein Dr.1089.1.S1_at 2.28 2.60 4.06 FREM2 Dr.3300.2.A1_at 2.15 3.41 1.54 SPON2 Dr.563.1.S1_at 2.13 2.86 4.17 AAMP protein Dr.11399.1.A1_at 2.07 2.31 2.81 Latexin Dr.23294.1.S1_at 1.95 4.59 4.70 transmembrane 7 superfamily member 1 Dr.14044.1.A1_at 1.95 2.86 2.35 mmp14 Dr.23324.1.A1_at 1.86 3.46 3.65 lysyl oxidase Dr.11427.1.S1_at 1.85 8.70 12.99 mmp14a Dr.4229.1.S1_at 1.29 2.90 2.85 col1a2 Dr.5521.1.S1_at -1.16 -3.58 -3.67 spondin 1b Dr.565.1.S1_at -1.33 -2.88 -3.82 fibronectin 1 Dr.19965.1.S1_at -1.38 -3.44 -2.30 netrin 1 Dr.545.1.S1_at -1.61 -4.17 -4.09 desmoplakin Dr.4929.1.A1_at -1.76 -2.35 -2.39 semaphorin 3aa Dr.5060.1.A1_at -1.89 -2.46 -2.71 EFEMP2 Dr.4543.1.S1_at -2.73 -1.78 -3.86 Advillin Dr.26109.1.A1_at -2.98 -2.23 -3.23 claudin 9 Dr.12596.1.S1_at -5.20 -8.21 -5.76
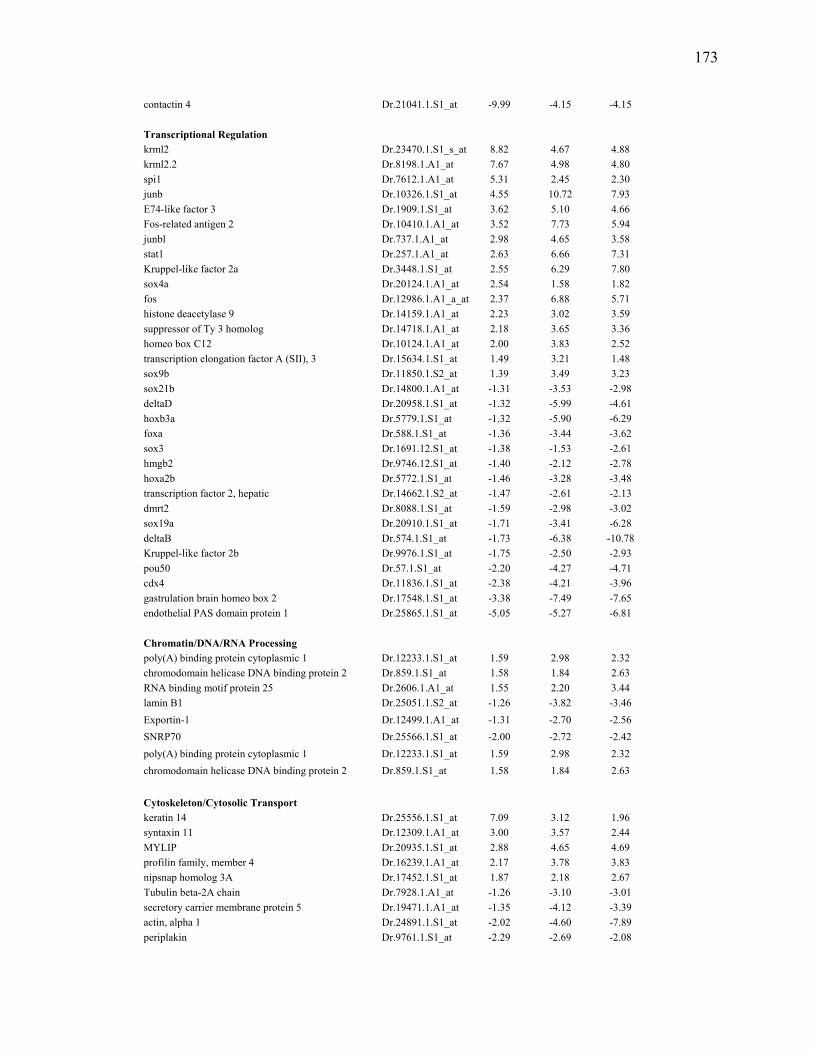
173
contactin 4 Dr.21041.1.S1_at -9.99 -4.15 -4.15 Transcriptional Regulation krml2 Dr.23470.1.S1_s_at 8.82 4.67 4.88 krml2.2 Dr.8198.1.A1_at 7.67 4.98 4.80 spi1 Dr.7612.1.A1_at 5.31 2.45 2.30 junb Dr.10326.1.S1_at 4.55 10.72 7.93 E74-like factor 3 Dr.1909.1.S1_at 3.62 5.10 4.66 Fos-related antigen 2 Dr.10410.1.A1_at 3.52 7.73 5.94 junbl Dr.737.1.A1_at 2.98 4.65 3.58 stat1 Dr.257.1.A1_at 2.63 6.66 7.31 Kruppel-like factor 2a Dr.3448.1.S1_at 2.55 6.29 7.80 sox4a Dr.20124.1.A1_at 2.54 1.58 1.82 fos Dr.12986.1.A1_a_at 2.37 6.88 5.71 histone deacetylase 9 Dr.14159.1.A1_at 2.23 3.02 3.59 suppressor of Ty 3 homolog Dr.14718.1.A1_at 2.18 3.65 3.36 homeo box C12 Dr.10124.1.A1_at 2.00 3.83 2.52 transcription elongation factor A (SII), 3 Dr.15634.1.S1_at 1.49 3.21 1.48 sox9b Dr.11850.1.S2_at 1.39 3.49 3.23 sox21b Dr.14800.1.A1_at -1.31 -3.53 -2.98 deltaD Dr.20958.1.S1_at -1.32 -5.99 -4.61 hoxb3a Dr.5779.1.S1_at -1.32 -5.90 -6.29 foxa Dr.588.1.S1_at -1.36 -3.44 -3.62 sox3 Dr.1691.12.S1_at -1.38 -1.53 -2.61 hmgb2 Dr.9746.12.S1_at -1.40 -2.12 -2.78 hoxa2b Dr.5772.1.S1_at -1.46 -3.28 -3.48 transcription factor 2, hepatic Dr.14662.1.S2_at -1.47 -2.61 -2.13 dmrt2 Dr.8088.1.S1_at -1.59 -2.98 -3.02 sox19a Dr.20910.1.S1_at -1.71 -3.41 -6.28 deltaB Dr.574.1.S1_at -1.73 -6.38 -10.78 Kruppel-like factor 2b Dr.9976.1.S1_at -1.75 -2.50 -2.93 pou50 Dr.57.1.S1_at -2.20 -4.27 -4.71 cdx4 Dr.11836.1.S1_at -2.38 -4.21 -3.96 gastrulation brain homeo box 2 Dr.17548.1.S1_at -3.38 -7.49 -7.65 endothelial PAS domain protein 1 Dr.25865.1.S1_at -5.05 -5.27 -6.81 Chromatin/DNA/RNA Processing poly(A) binding protein cytoplasmic 1 Dr.12233.1.S1_at 1.59 2.98 2.32 chromodomain helicase DNA binding protein 2 Dr.859.1.S1_at 1.58 1.84 2.63 RNA binding motif protein 25 Dr.2606.1.A1_at 1.55 2.20 3.44 lamin B1 Dr.25051.1.S2_at -1.26 -3.82 -3.46 Exportin-1 Dr.12499.1.A1_at -1.31 -2.70 -2.56 SNRP70 Dr.25566.1.S1_at -2.00 -2.72 -2.42 poly(A) binding protein cytoplasmic 1 Dr.12233.1.S1_at 1.59 2.98 2.32 chromodomain helicase DNA binding protein 2 Dr.859.1.S1_at 1.58 1.84 2.63 Cytoskeleton/Cytosolic Transport keratin 14 Dr.25556.1.S1_at 7.09 3.12 1.96 syntaxin 11 Dr.12309.1.A1_at 3.00 3.57 2.44 MYLIP Dr.20935.1.S1_at 2.88 4.65 4.69 profilin family, member 4 Dr.16239.1.A1_at 2.17 3.78 3.83 nipsnap homolog 3A Dr.17452.1.S1_at 1.87 2.18 2.67 Tubulin beta-2A chain Dr.7928.1.A1_at -1.26 -3.10 -3.01 secretory carrier membrane protein 5 Dr.19471.1.A1_at -1.35 -4.12 -3.39 actin, alpha 1 Dr.24891.1.S1_at -2.02 -4.60 -7.89 periplakin Dr.9761.1.S1_at -2.29 -2.69 -2.08
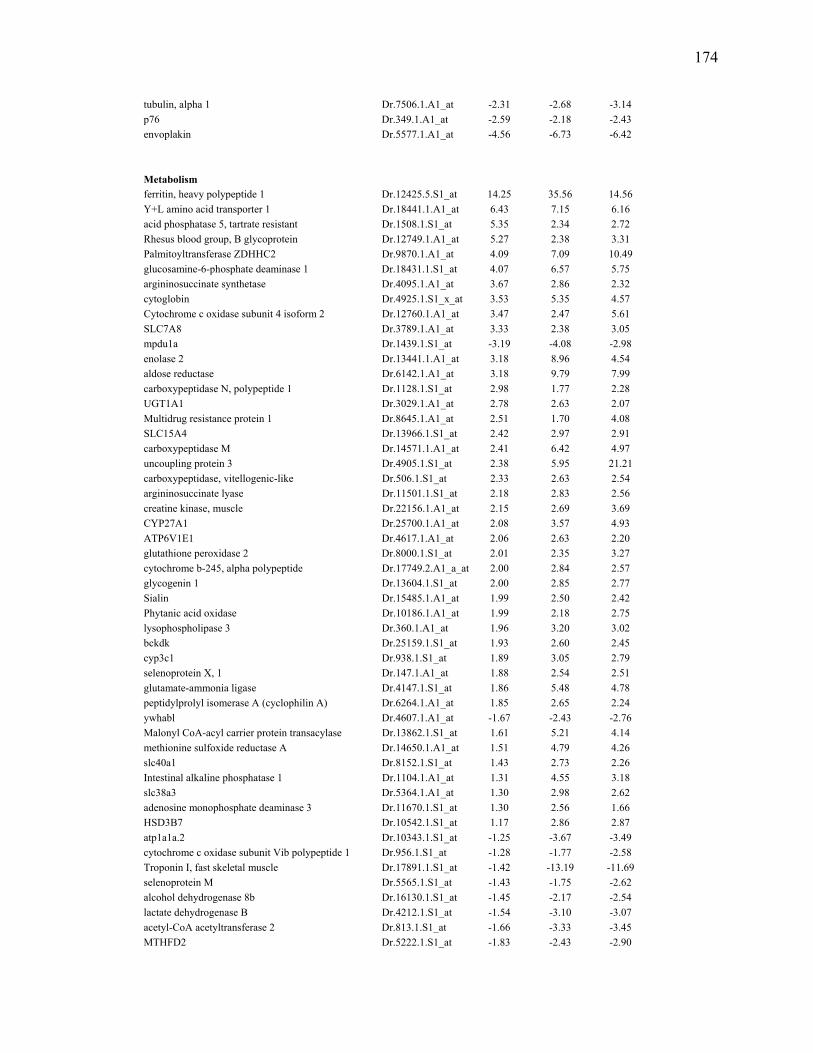
174
tubulin, alpha 1 Dr.7506.1.A1_at -2.31 -2.68 -3.14 p76 Dr.349.1.A1_at -2.59 -2.18 -2.43 envoplakin Dr.5577.1.A1_at -4.56 -6.73 -6.42 Metabolism ferritin, heavy polypeptide 1 Dr.12425.5.S1_at 14.25 35.56 14.56 Y+L amino acid transporter 1 Dr.18441.1.A1_at 6.43 7.15 6.16 acid phosphatase 5, tartrate resistant Dr.1508.1.S1_at 5.35 2.34 2.72 Rhesus blood group, B glycoprotein Dr.12749.1.A1_at 5.27 2.38 3.31 Palmitoyltransferase ZDHHC2 Dr.9870.1.A1_at 4.09 7.09 10.49 glucosamine-6-phosphate deaminase 1 Dr.18431.1.S1_at 4.07 6.57 5.75 argininosuccinate synthetase Dr.4095.1.A1_at 3.67 2.86 2.32 cytoglobin Dr.4925.1.S1_x_at 3.53 5.35 4.57 Cytochrome c oxidase subunit 4 isoform 2 Dr.12760.1.A1_at 3.47 2.47 5.61 SLC7A8 Dr.3789.1.A1_at 3.33 2.38 3.05 mpdu1a Dr.1439.1.S1_at -3.19 -4.08 -2.98 enolase 2 Dr.13441.1.A1_at 3.18 8.96 4.54 aldose reductase Dr.6142.1.A1_at 3.18 9.79 7.99 carboxypeptidase N, polypeptide 1 Dr.1128.1.S1_at 2.98 1.77 2.28 UGT1A1 Dr.3029.1.A1_at 2.78 2.63 2.07 Multidrug resistance protein 1 Dr.8645.1.A1_at 2.51 1.70 4.08 SLC15A4 Dr.13966.1.S1_at 2.42 2.97 2.91 carboxypeptidase M Dr.14571.1.A1_at 2.41 6.42 4.97 uncoupling protein 3 Dr.4905.1.S1_at 2.38 5.95 21.21 carboxypeptidase, vitellogenic-like Dr.506.1.S1_at 2.33 2.63 2.54 argininosuccinate lyase Dr.11501.1.S1_at 2.18 2.83 2.56 creatine kinase, muscle Dr.22156.1.A1_at 2.15 2.69 3.69 CYP27A1 Dr.25700.1.A1_at 2.08 3.57 4.93 ATP6V1E1 Dr.4617.1.A1_at 2.06 2.63 2.20 glutathione peroxidase 2 Dr.8000.1.S1_at 2.01 2.35 3.27 cytochrome b-245, alpha polypeptide Dr.17749.2.A1_a_at 2.00 2.84 2.57 glycogenin 1 Dr.13604.1.S1_at 2.00 2.85 2.77 Sialin Dr.15485.1.A1_at 1.99 2.50 2.42 Phytanic acid oxidase Dr.10186.1.A1_at 1.99 2.18 2.75 lysophospholipase 3 Dr.360.1.A1_at 1.96 3.20 3.02 bckdk Dr.25159.1.S1_at 1.93 2.60 2.45 cyp3c1 Dr.938.1.S1_at 1.89 3.05 2.79 selenoprotein X, 1 Dr.147.1.A1_at 1.88 2.54 2.51 glutamate-ammonia ligase Dr.4147.1.S1_at 1.86 5.48 4.78 peptidylprolyl isomerase A (cyclophilin A) Dr.6264.1.A1_at 1.85 2.65 2.24 ywhabl Dr.4607.1.A1_at -1.67 -2.43 -2.76 Malonyl CoA-acyl carrier protein transacylase Dr.13862.1.S1_at 1.61 5.21 4.14 methionine sulfoxide reductase A Dr.14650.1.A1_at 1.51 4.79 4.26 slc40a1 Dr.8152.1.S1_at 1.43 2.73 2.26 Intestinal alkaline phosphatase 1 Dr.1104.1.A1_at 1.31 4.55 3.18 slc38a3 Dr.5364.1.A1_at 1.30 2.98 2.62 adenosine monophosphate deaminase 3 Dr.11670.1.S1_at 1.30 2.56 1.66 HSD3B7 Dr.10542.1.S1_at 1.17 2.86 2.87 atp1a1a.2 Dr.10343.1.S1_at -1.25 -3.67 -3.49 cytochrome c oxidase subunit Vib polypeptide 1 Dr.956.1.S1_at -1.28 -1.77 -2.58 Troponin I, fast skeletal muscle Dr.17891.1.S1_at -1.42 -13.19 -11.69 selenoprotein M Dr.5565.1.S1_at -1.43 -1.75 -2.62 alcohol dehydrogenase 8b Dr.16130.1.S1_at -1.45 -2.17 -2.54 lactate dehydrogenase B Dr.4212.1.S1_at -1.54 -3.10 -3.07 acetyl-CoA acetyltransferase 2 Dr.813.1.S1_at -1.66 -3.33 -3.45 MTHFD2 Dr.5222.1.S1_at -1.83 -2.43 -2.90
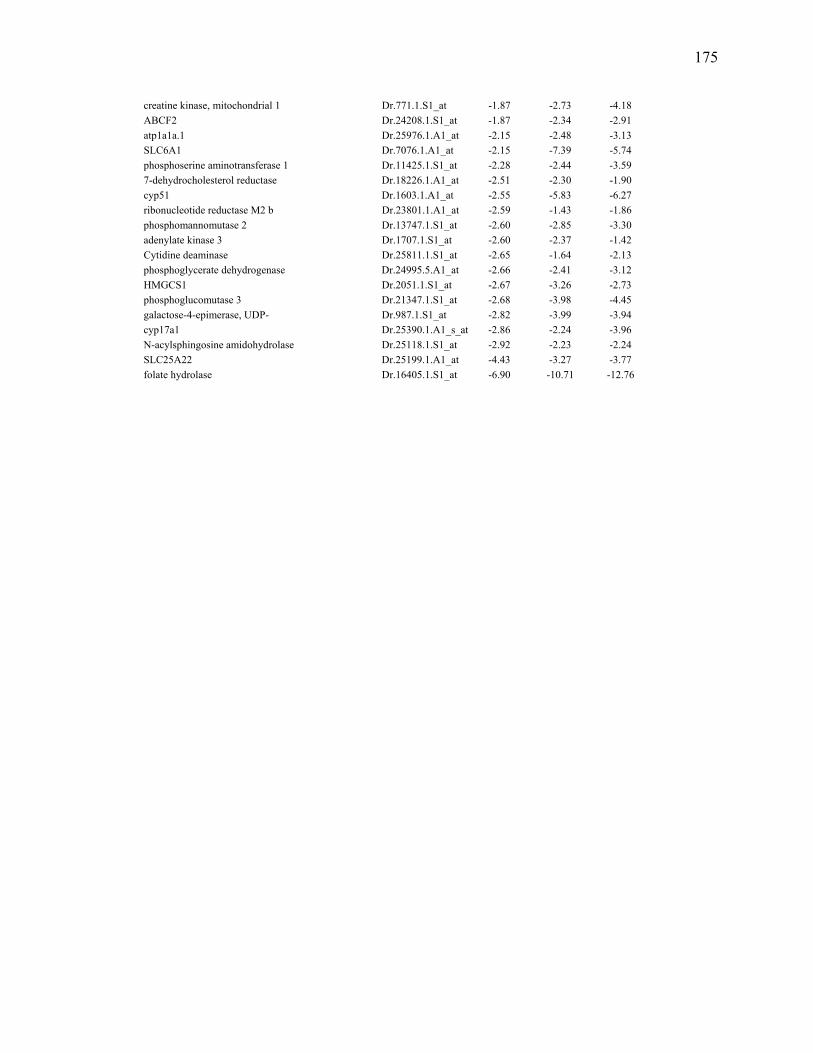
175
creatine kinase, mitochondrial 1 Dr.771.1.S1_at -1.87 -2.73 -4.18 ABCF2 Dr.24208.1.S1_at -1.87 -2.34 -2.91 atp1a1a.1 Dr.25976.1.A1_at -2.15 -2.48 -3.13 SLC6A1 Dr.7076.1.A1_at -2.15 -7.39 -5.74 phosphoserine aminotransferase 1 Dr.11425.1.S1_at -2.28 -2.44 -3.59 7-dehydrocholesterol reductase Dr.18226.1.A1_at -2.51 -2.30 -1.90 cyp51 Dr.1603.1.A1_at -2.55 -5.83 -6.27 ribonucleotide reductase M2 b Dr.23801.1.A1_at -2.59 -1.43 -1.86 phosphomannomutase 2 Dr.13747.1.S1_at -2.60 -2.85 -3.30 adenylate kinase 3 Dr.1707.1.S1_at -2.60 -2.37 -1.42 Cytidine deaminase Dr.25811.1.S1_at -2.65 -1.64 -2.13 phosphoglycerate dehydrogenase Dr.24995.5.A1_at -2.66 -2.41 -3.12 HMGCS1 Dr.2051.1.S1_at -2.67 -3.26 -2.73 phosphoglucomutase 3 Dr.21347.1.S1_at -2.68 -3.98 -4.45 galactose-4-epimerase, UDP- Dr.987.1.S1_at -2.82 -3.99 -3.94 cyp17a1 Dr.25390.1.A1_s_at -2.86 -2.24 -3.96 N-acylsphingosine amidohydrolase Dr.25118.1.S1_at -2.92 -2.23 -2.24 SLC25A22 Dr.25199.1.A1_at -4.43 -3.27 -3.77 folate hydrolase Dr.16405.1.S1_at -6.90 -10.71 -12.76
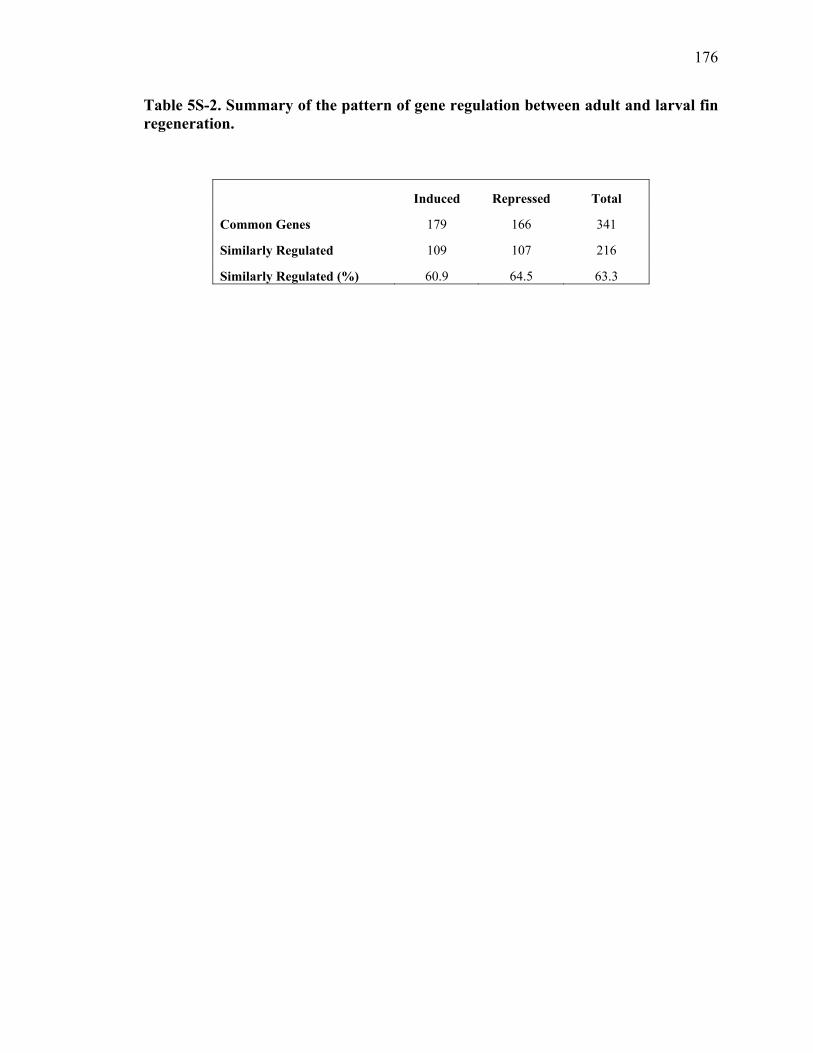
176
Table 5S-2. Summary of the pattern of gene regulation between adult and larval fin regeneration.
Induced Repressed Total
Common Genes 179 166 341
Similarly Regulated 109 107 216
Similarly Regulated (%) 60.9 64.5 63.3
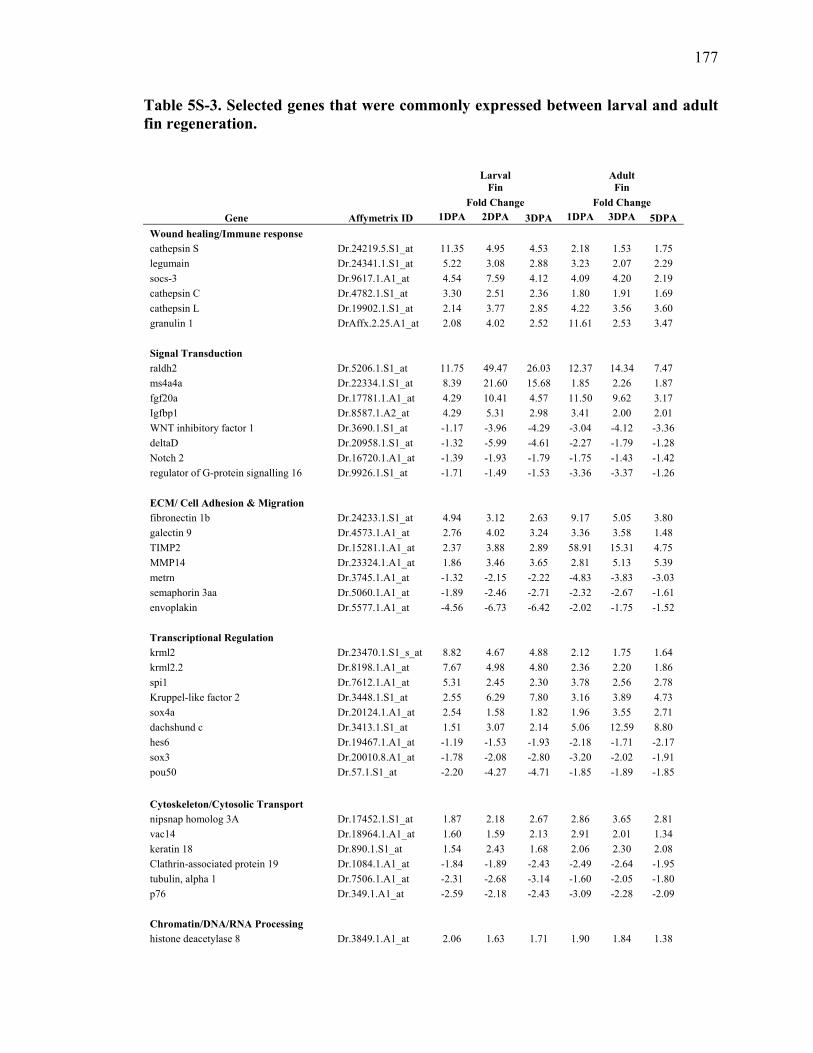
177
Table 5S-3. Selected genes that were commonly expressed between larval and adult fin regeneration.
Larval
Fin Adult Fin
Fold Change Fold Change Gene Affymetrix ID 1DPA 2DPA 3DPA 1DPA 3DPA 5DPA
Wound healing/Immune response cathepsin S Dr.24219.5.S1_at 11.35 4.95 4.53 2.18 1.53 1.75 legumain Dr.24341.1.S1_at 5.22 3.08 2.88 3.23 2.07 2.29 socs-3 Dr.9617.1.A1_at 4.54 7.59 4.12 4.09 4.20 2.19 cathepsin C Dr.4782.1.S1_at 3.30 2.51 2.36 1.80 1.91 1.69 cathepsin L Dr.19902.1.S1_at 2.14 3.77 2.85 4.22 3.56 3.60 granulin 1 DrAffx.2.25.A1_at 2.08 4.02 2.52 11.61 2.53 3.47 Signal Transduction raldh2 Dr.5206.1.S1_at 11.75 49.47 26.03 12.37 14.34 7.47 ms4a4a Dr.22334.1.S1_at 8.39 21.60 15.68 1.85 2.26 1.87 fgf20a Dr.17781.1.A1_at 4.29 10.41 4.57 11.50 9.62 3.17 Igfbp1 Dr.8587.1.A2_at 4.29 5.31 2.98 3.41 2.00 2.01 WNT inhibitory factor 1 Dr.3690.1.S1_at -1.17 -3.96 -4.29 -3.04 -4.12 -3.36 deltaD Dr.20958.1.S1_at -1.32 -5.99 -4.61 -2.27 -1.79 -1.28 Notch 2 Dr.16720.1.A1_at -1.39 -1.93 -1.79 -1.75 -1.43 -1.42 regulator of G-protein signalling 16 Dr.9926.1.S1_at -1.71 -1.49 -1.53 -3.36 -3.37 -1.26 ECM/ Cell Adhesion & Migration fibronectin 1b Dr.24233.1.S1_at 4.94 3.12 2.63 9.17 5.05 3.80 galectin 9 Dr.4573.1.A1_at 2.76 4.02 3.24 3.36 3.58 1.48 TIMP2 Dr.15281.1.A1_at 2.37 3.88 2.89 58.91 15.31 4.75 MMP14 Dr.23324.1.A1_at 1.86 3.46 3.65 2.81 5.13 5.39 metrn Dr.3745.1.A1_at -1.32 -2.15 -2.22 -4.83 -3.83 -3.03 semaphorin 3aa Dr.5060.1.A1_at -1.89 -2.46 -2.71 -2.32 -2.67 -1.61 envoplakin Dr.5577.1.A1_at -4.56 -6.73 -6.42 -2.02 -1.75 -1.52 Transcriptional Regulation krml2 Dr.23470.1.S1_s_at 8.82 4.67 4.88 2.12 1.75 1.64 krml2.2 Dr.8198.1.A1_at 7.67 4.98 4.80 2.36 2.20 1.86 spi1 Dr.7612.1.A1_at 5.31 2.45 2.30 3.78 2.56 2.78 Kruppel-like factor 2 Dr.3448.1.S1_at 2.55 6.29 7.80 3.16 3.89 4.73 sox4a Dr.20124.1.A1_at 2.54 1.58 1.82 1.96 3.55 2.71 dachshund c Dr.3413.1.S1_at 1.51 3.07 2.14 5.06 12.59 8.80 hes6 Dr.19467.1.A1_at -1.19 -1.53 -1.93 -2.18 -1.71 -2.17 sox3 Dr.20010.8.A1_at -1.78 -2.08 -2.80 -3.20 -2.02 -1.91 pou50 Dr.57.1.S1_at -2.20 -4.27 -4.71 -1.85 -1.89 -1.85 Cytoskeleton/Cytosolic Transport nipsnap homolog 3A Dr.17452.1.S1_at 1.87 2.18 2.67 2.86 3.65 2.81 vac14 Dr.18964.1.A1_at 1.60 1.59 2.13 2.91 2.01 1.34 keratin 18 Dr.890.1.S1_at 1.54 2.43 1.68 2.06 2.30 2.08 Clathrin-associated protein 19 Dr.1084.1.A1_at -1.84 -1.89 -2.43 -2.49 -2.64 -1.95 tubulin, alpha 1 Dr.7506.1.A1_at -2.31 -2.68 -3.14 -1.60 -2.05 -1.80 p76 Dr.349.1.A1_at -2.59 -2.18 -2.43 -3.09 -2.28 -2.09 Chromatin/DNA/RNA Processing histone deacetylase 8 Dr.3849.1.A1_at 2.06 1.63 1.71 1.90 1.84 1.38

178
Orc6L Dr.24945.1.S1_at 1.96 2.29 1.85 3.22 2.15 1.70 poly(A) binding protein cytoplasmic 1 Dr.12233.1.S1_at 1.59 2.98 2.32 25.99 12.39 23.62 HLA-B associated transcript 1 Dr.5423.1.A1_at -1.39 -1.84 -1.71 -1.55 -1.93 -2.23 deoxyribonuclease I-like 3 Dr.20334.1.S1_at -2.08 -1.31 -1.60 -3.35 -2.64 -1.90 ribonucleotide reductase M2 b Dr.23801.1.A1_at -2.59 -1.43 -1.86 -2.52 -2.34 -2.39
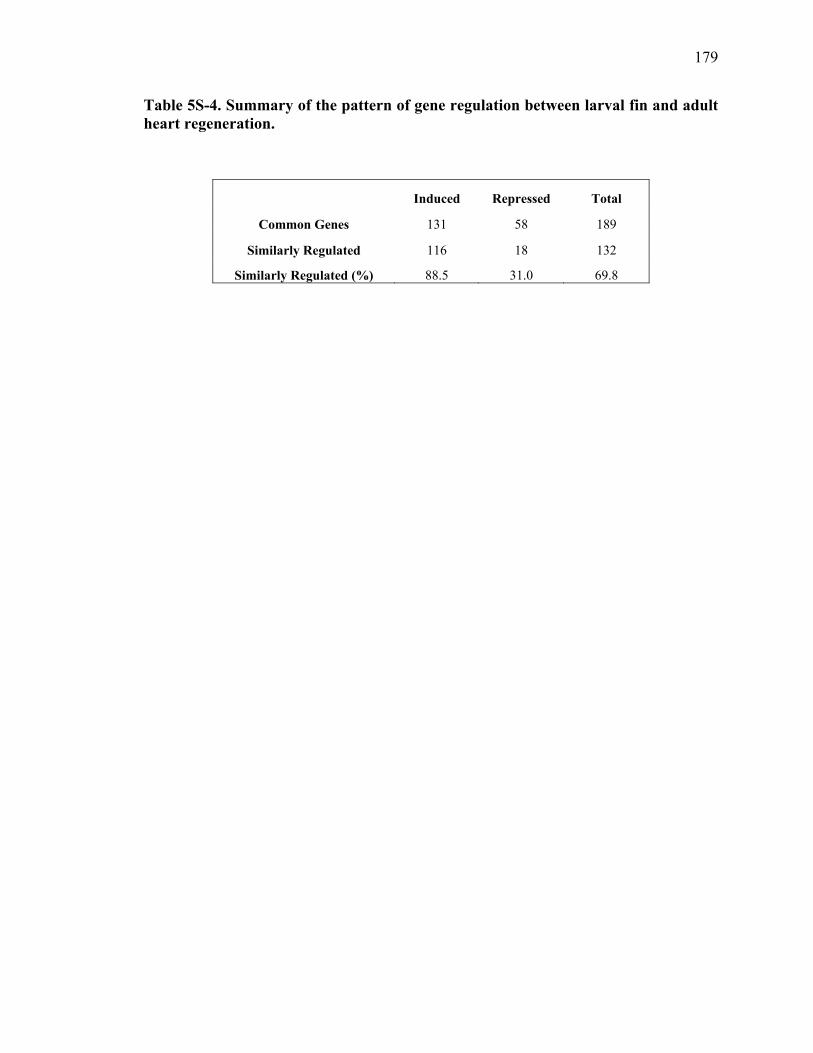
179
Table 5S-4. Summary of the pattern of gene regulation between larval fin and adult heart regeneration.
Induced Repressed Total
Common Genes 131 58 189
Similarly Regulated 116 18 132
Similarly Regulated (%) 88.5 31.0 69.8
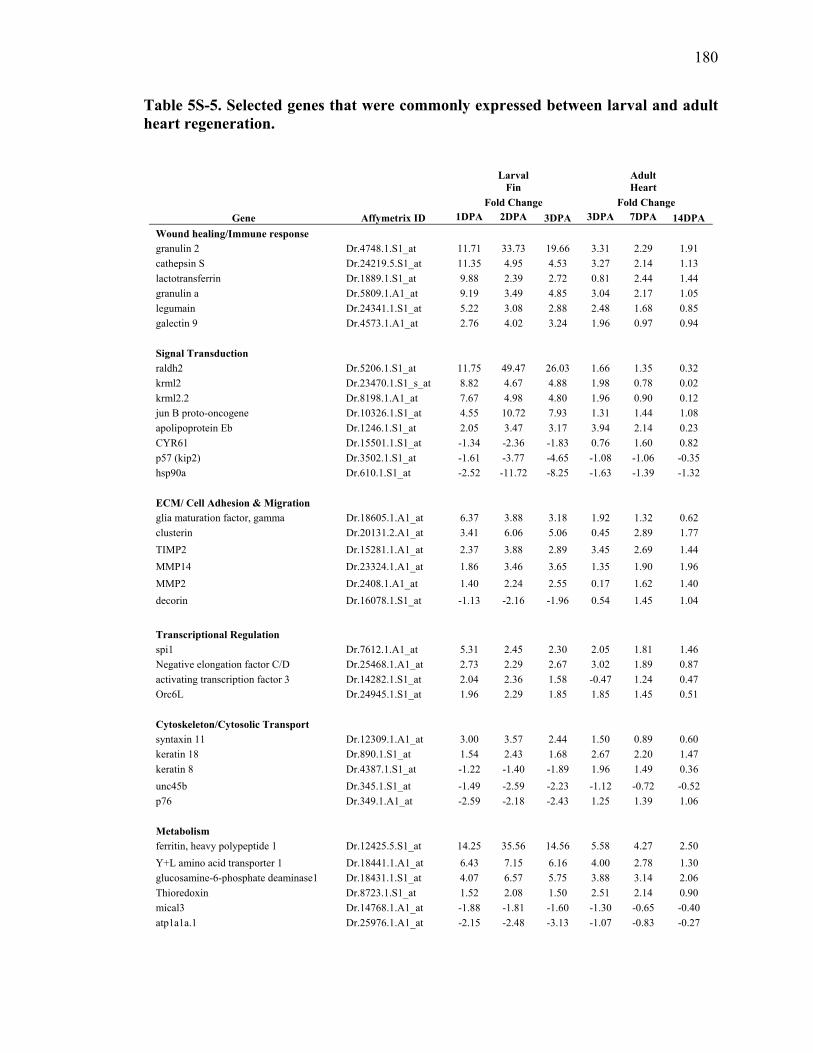
180
Table 5S-5. Selected genes that were commonly expressed between larval and adult heart regeneration.
Larval
Fin Adult Heart
Fold Change Fold Change Gene Affymetrix ID 1DPA 2DPA 3DPA 3DPA 7DPA 14DPA
Wound healing/Immune response granulin 2 Dr.4748.1.S1_at 11.71 33.73 19.66 3.31 2.29 1.91 cathepsin S Dr.24219.5.S1_at 11.35 4.95 4.53 3.27 2.14 1.13 lactotransferrin Dr.1889.1.S1_at 9.88 2.39 2.72 0.81 2.44 1.44 granulin a Dr.5809.1.A1_at 9.19 3.49 4.85 3.04 2.17 1.05 legumain Dr.24341.1.S1_at 5.22 3.08 2.88 2.48 1.68 0.85 galectin 9 Dr.4573.1.A1_at 2.76 4.02 3.24 1.96 0.97 0.94 Signal Transduction raldh2 Dr.5206.1.S1_at 11.75 49.47 26.03 1.66 1.35 0.32 krml2 Dr.23470.1.S1_s_at 8.82 4.67 4.88 1.98 0.78 0.02 krml2.2 Dr.8198.1.A1_at 7.67 4.98 4.80 1.96 0.90 0.12 jun B proto-oncogene Dr.10326.1.S1_at 4.55 10.72 7.93 1.31 1.44 1.08 apolipoprotein Eb Dr.1246.1.S1_at 2.05 3.47 3.17 3.94 2.14 0.23 CYR61 Dr.15501.1.S1_at -1.34 -2.36 -1.83 0.76 1.60 0.82 p57 (kip2) Dr.3502.1.S1_at -1.61 -3.77 -4.65 -1.08 -1.06 -0.35 hsp90a Dr.610.1.S1_at -2.52 -11.72 -8.25 -1.63 -1.39 -1.32 ECM/ Cell Adhesion & Migration glia maturation factor, gamma Dr.18605.1.A1_at 6.37 3.88 3.18 1.92 1.32 0.62 clusterin Dr.20131.2.A1_at 3.41 6.06 5.06 0.45 2.89 1.77 TIMP2 Dr.15281.1.A1_at 2.37 3.88 2.89 3.45 2.69 1.44 MMP14 Dr.23324.1.A1_at 1.86 3.46 3.65 1.35 1.90 1.96 MMP2 Dr.2408.1.A1_at 1.40 2.24 2.55 0.17 1.62 1.40 decorin Dr.16078.1.S1_at -1.13 -2.16 -1.96 0.54 1.45 1.04 Transcriptional Regulation spi1 Dr.7612.1.A1_at 5.31 2.45 2.30 2.05 1.81 1.46 Negative elongation factor C/D Dr.25468.1.A1_at 2.73 2.29 2.67 3.02 1.89 0.87 activating transcription factor 3 Dr.14282.1.S1_at 2.04 2.36 1.58 -0.47 1.24 0.47 Orc6L Dr.24945.1.S1_at 1.96 2.29 1.85 1.85 1.45 0.51 Cytoskeleton/Cytosolic Transport syntaxin 11 Dr.12309.1.A1_at 3.00 3.57 2.44 1.50 0.89 0.60 keratin 18 Dr.890.1.S1_at 1.54 2.43 1.68 2.67 2.20 1.47 keratin 8 Dr.4387.1.S1_at -1.22 -1.40 -1.89 1.96 1.49 0.36 unc45b Dr.345.1.S1_at -1.49 -2.59 -2.23 -1.12 -0.72 -0.52 p76 Dr.349.1.A1_at -2.59 -2.18 -2.43 1.25 1.39 1.06 Metabolism ferritin, heavy polypeptide 1 Dr.12425.5.S1_at 14.25 35.56 14.56 5.58 4.27 2.50 Y+L amino acid transporter 1 Dr.18441.1.A1_at 6.43 7.15 6.16 4.00 2.78 1.30 glucosamine-6-phosphate deaminase1 Dr.18431.1.S1_at 4.07 6.57 5.75 3.88 3.14 2.06 Thioredoxin Dr.8723.1.S1_at 1.52 2.08 1.50 2.51 2.14 0.90 mical3 Dr.14768.1.A1_at -1.88 -1.81 -1.60 -1.30 -0.65 -0.40 atp1a1a.1 Dr.25976.1.A1_at -2.15 -2.48 -3.13 -1.07 -0.83 -0.27
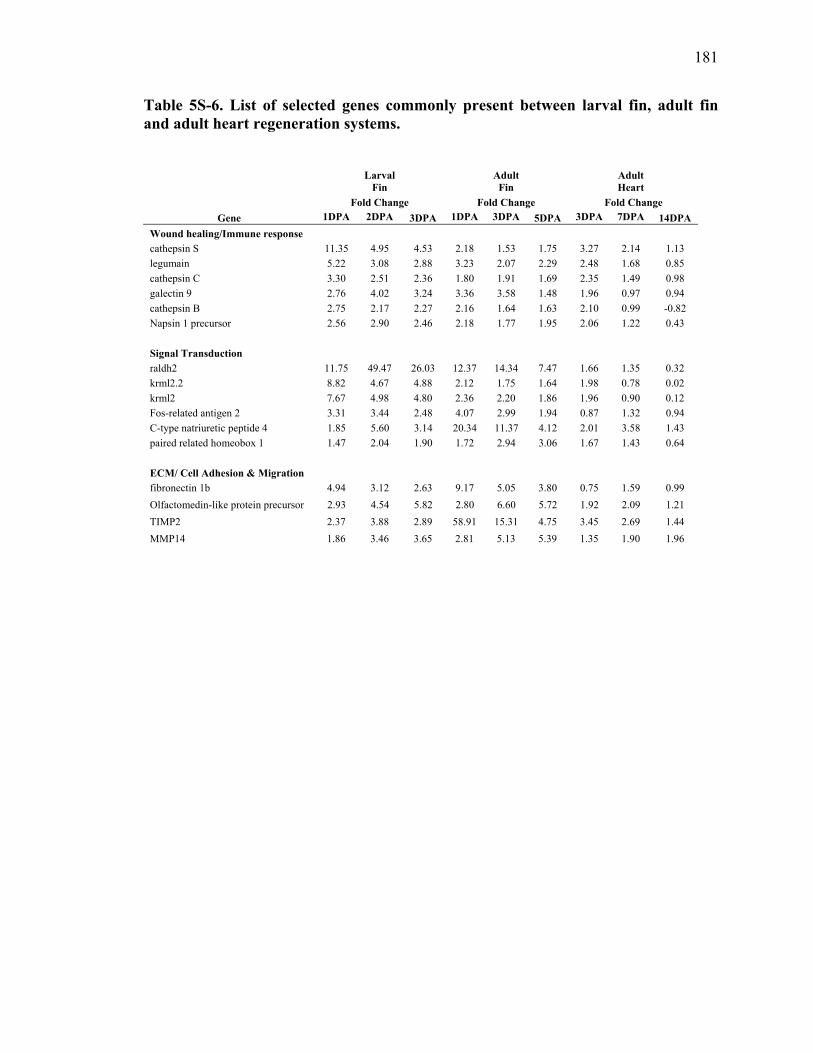
181
Table 5S-6. List of selected genes commonly present between larval fin, adult fin and adult heart regeneration systems.
Larval
Fin Adult Fin
Adult Heart
Fold Change Fold Change Fold Change Gene 1DPA 2DPA 3DPA 1DPA 3DPA 5DPA 3DPA 7DPA 14DPA
Wound healing/Immune response cathepsin S 11.35 4.95 4.53 2.18 1.53 1.75 3.27 2.14 1.13 legumain 5.22 3.08 2.88 3.23 2.07 2.29 2.48 1.68 0.85 cathepsin C 3.30 2.51 2.36 1.80 1.91 1.69 2.35 1.49 0.98 galectin 9 2.76 4.02 3.24 3.36 3.58 1.48 1.96 0.97 0.94 cathepsin B 2.75 2.17 2.27 2.16 1.64 1.63 2.10 0.99 -0.82 Napsin 1 precursor 2.56 2.90 2.46 2.18 1.77 1.95 2.06 1.22 0.43 Signal Transduction raldh2 11.75 49.47 26.03 12.37 14.34 7.47 1.66 1.35 0.32 krml2.2 8.82 4.67 4.88 2.12 1.75 1.64 1.98 0.78 0.02 krml2 7.67 4.98 4.80 2.36 2.20 1.86 1.96 0.90 0.12 Fos-related antigen 2 3.31 3.44 2.48 4.07 2.99 1.94 0.87 1.32 0.94 C-type natriuretic peptide 4 1.85 5.60 3.14 20.34 11.37 4.12 2.01 3.58 1.43 paired related homeobox 1 1.47 2.04 1.90 1.72 2.94 3.06 1.67 1.43 0.64 ECM/ Cell Adhesion & Migration fibronectin 1b 4.94 3.12 2.63 9.17 5.05 3.80 0.75 1.59 0.99 Olfactomedin-like protein precursor 2.93 4.54 5.82 2.80 6.60 5.72 1.92 2.09 1.21 TIMP2 2.37 3.88 2.89 58.91 15.31 4.75 3.45 2.69 1.44 MMP14 1.86 3.46 3.65 2.81 5.13 5.39 1.35 1.90 1.96
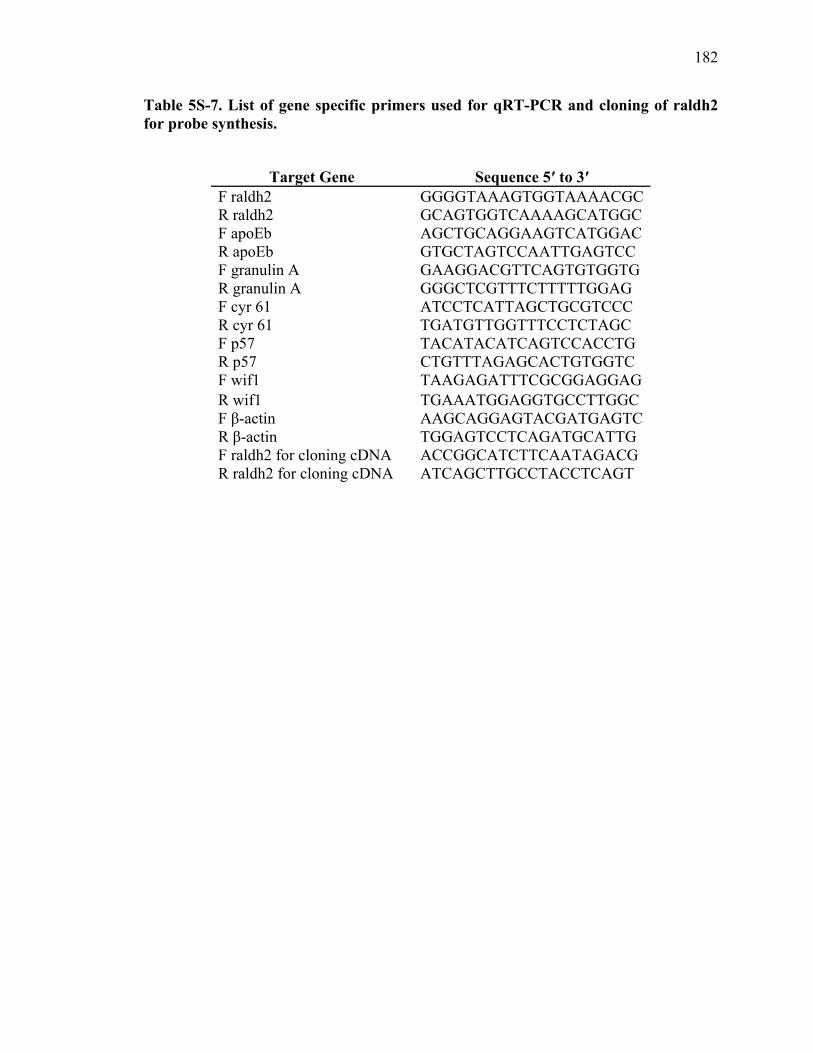
182
Table 5S-7. List of gene specific primers used for qRT-PCR and cloning of raldh2 for probe synthesis.
Target Gene Sequence 5′ to 3′ F raldh2 GGGGTAAAGTGGTAAAACGC R raldh2 GCAGTGGTCAAAAGCATGGC F apoEb AGCTGCAGGAAGTCATGGAC R apoEb GTGCTAGTCCAATTGAGTCC F granulin A GAAGGACGTTCAGTGTGGTG R granulin A GGGCTCGTTTCTTTTTGGAG F cyr 61 ATCCTCATTAGCTGCGTCCC R cyr 61 TGATGTTGGTTTCCTCTAGC F p57 TACATACATCAGTCCACCTG R p57 CTGTTTAGAGCACTGTGGTC F wif1 TAAGAGATTTCGCGGAGGAG R wif1 TGAAATGGAGGTGCCTTGGC F β-actin AAGCAGGAGTACGATGAGTC R β-actin TGGAGTCCTCAGATGCATTG F raldh2 for cloning cDNA ACCGGCATCTTCAATAGACG R raldh2 for cloning cDNA ATCAGCTTGCCTACCTCAGT
183
Chapter 6. Conclusion
Zebrafish caudal fin regeneration system is an exceptional platform to decipher
the complex molecular pathways during epimorphic regeneration. We took advantage of
the early life stage fin regeneration model because of its amenability for various
molecular and genetic manipulations. First, we utilized a toxicological approach to impair
the larval fin regeneration using an AHR ligand, TCDD. By antisense repression
techniques, we demonstrated that AHR2 and ARNT1 are the in vivo molecular partners
for TCDD to inhibit fin regeneration. We developed this in vivo platform for two
purposes, first to understand the downstream target genes of AHR activation and second
to unravel the essential regenerative signaling pathways affected by TCDD. Comparative
toxicogenomic analysis between the adult and larval fin regeneration models after
treatment with TCDD revealed that, AHR activation misexpressed Wnt signaling family
members as well as Wnt target genes. We hypothesized that misexpression of R-
Spondin1, a TCDD- induced gene, which is a novel ligand for Wnt co-receptor LRP6 is
responsible for the differential expression of the Wnt target genes in the regenerating fin
tissue after AHR activation. By partial antisense approaches, we demonstrated that, mis-
induction of R-Spondin1 is absolutely required for TCDD-mediated inhibition of
regeneration. This is for the first time a toxic phenomenon of AHR activation is
completely reversed by modulating a single downstream target gene in vivo. Moreover,
our studies for the first time identify functional cross talk between Wnt and AHR signal
transduction pathways and indicate the power of zebrafish model to discover and define
molecular pathways that regulate complex in vivo biological responses. Further studies
have to be performed to identify the regulation of R-Spondin1 by AHR activation which
will provide more insight how TCDD elicits toxic responses. Moreover, it is also
important to understand how improper induction of R-Spondin1 impaired regeneration
and is critical to identify the target genes responsible for this effect. This will eventually
lead to the identification of critical signaling molecules during regeneration, which have
numerous clinical implications in the emerging field of regenerative medicine.
184
Second, we used an unbiased chemical genetic approach and we developed an in
vivo rapid throughput regeneration assay to identify novel molecular signaling pathways
important for regeneration. Glucocorticoids were identified as modulators of regeneration
and we demonstrated that transient activation of the glucocorticoid receptor is sufficient
to block regeneration, but only if activation occurs during a narrow window of time
during wound healing/blastema formation. We further showed that neutrophils and
macrophages are not required for fin regeneration and these results indicate that signaling
from exogenous glucocorticoids impairs blastema formation and limits regenerative
capability in vertebrates through an acute inflammation-independent mechanism. Our
findings illustrate the power of in vivo chemical genetics to identify novel bioactive
compounds, and their molecular targets, that together function to modulate tissue
regeneration. The signaling molecules affected by glucocorticoids have to be identified
and the results will provide more understanding about tissue regeneration. Moreover, the
use of additional small molecules to probe tissue regeneration will definitely lead to
identification of novel regenerative pathways which will enhance the field of regenerative
medicine.
Lastly, we took a comparative genomic approach to identify commonality in gene
expression changes across different zebrafish regeneration models. We identified and
functionally evaluated the role of RA signaling during fin regeneration. Most of the
previous regeneration studies with RA signaling are related with the patterning of the
structures during the regenerative outgrowth phase, but we illustrated that, RA signaling
is also essential for the initiation of regeneration. Therefore, in addition to the established
functional role of RA signaling during the regenerative outgrowth, RA signaling pathway
is also essential in the early stages of regeneration, suggesting the existence of a dual
phase of RA signaling during regeneration. Collectively, our studies revealed that there is
conservation of fundamental regenerative networks and pathways that control epimorphic
tissue regeneration.
Since the larval fin regeneration model is amenable to rapid molecular and genetic
manipulations, this early life stage fin regeneration model is a powerful platform to
discover and unravel regenerative mechanisms. By utilizing the power of chemical
genetic and comparative approaches, the most exciting outcome will be a molecular

185
explanation for the observed differences in regenerative capacity across taxa, and will
reveal pathways for therapeutic interventions.