Embed Size (px)
Citation preview

Ride On
CONTINUED ON BACK
Title VI Compliance Monitoring
Report
August 2017
Title VI of the Civil Rights Act of 1964 (42 U.S.C. §§ 2000d, et seq.)
& FTA Circular 4702.1B, dated October 1, 2012
TITLE VI REQUIREMENTS AND GUIDELINES FOR FEDERAL TRANSIT ADMINISTRATION RECIPIENTS
Montgomery County Department of Transportation
Division of Transit Services Rockville, Maryland

Title VI Compliance Monitoring Report August 2017
ii RIDE ON
Accessible Formats
This document will be made available in accessible formats and other languages upon request. Paper copies of this document as well as information regarding accessible formats may be obtained by contacting the Title VI Coordinator, Division of Transit Services.
Montgomery County Department o f Transportation Divis ion o f Transit Services 101 Monroe Street, 5th Floor Rockville, Maryland 20850
240-777-5800 * http://www.montgomerycountymd.gov/dot-transit

Title VI Compliance Monitoring Report August 2017
iii RIDE ON
Table of Contents 1. Overview and Recommendations ......................................................................... 1
2. Montgomery County Service Standards ............................................................... 2
2.1. FTA Service Standard Requirements .............................................................................2 2.2. Ride On Service Standards ............................................................................................2 2.3. RIDE ON Service Policies ............................................................................................3
3. Monitoring Methods ............................................................................................... 5
3.1. Minority Population by Bus Route ................................................................................5 3.2. Vehicle Load Factor Monitoring Method ......................................................................7 3.3. Route Headways Monitoring Method ............................................................................7 3.4. On-Time Performance Monitoring Method ...................................................................7 3.5. Service Accessibility Monitoring Method .....................................................................7 3.6. Vehicle Assignment Monitoring Method .......................................................................7 3.7. Distribution of Transit Amenities Monitoring Method ...................................................7
4. Monitoring Results ................................................................................................. 8
4.1. Vehicle Load Factor Monitoring Results .......................................................................8 4.2. Route Headways Monitoring Results ............................................................................8 4.3. On-Time Performance Monitoring Results ....................................................................9 4.4. Service Accessibility Monitoring Results ......................................................................9 4.5. Vehicle Assignment Monitoring Results ..................................................................... 10 4.6. Distribution of Transit Amenities Monitoring Results ................................................. 10 4.7. Load Factor Detailed Results ...................................................................................... 12 4.8. Route Headways Detailed Results ............................................................................... 14 4.9. On-Time Performance Detailed Results ...................................................................... 16 4.10. Service Accessibility Detailed Results ..................................................................... 17 4.11. Vehicle Assignment Detailed Results ...................................................................... 20 4.12. Distribution of Transit Amenities ............................................................................ 22

Title VI Compliance Monitoring Report August 2017
1RIDE ON
1. Overview and Recommendations Following the guidelines set forth by FTA Circular 4702.1B, the Montgomery County Department of Transportation (MCDOT) monitors the performance of the transit system relative to system-wide service standards and service policies on a tri-annual basis. These monitoring activities are used to compare the level of service provided to predominantly minority areas with the level of service provided to predominantly non-minority areas to ensure that the result of policies and decision-making is equitable. The monitoring methodology groups the routes into four quartiles with quartile 1 having the highest minority population and quartile 4 having the lowest minority population. For the purpose of this monitoring report, routes grouped in quartiles 1 and 2 are considered the minority services. This Compliance Monitoring Report has not identified any of disparity which requires additional review.

Title VI Compliance Monitoring Report August 2017
2RIDE ON
2. Montgomery County Service Standards
2.1. FTA Service Standard Requirements MCDOT receives FTA funding to provide service in Montgomery County, Maryland as a sub-recipient to the Maryland Transit Administration. As defined under 49 U.S.C. 5307, the county has a population of 200,000 people or greater. As such, public transit providers are required to develop service standards and policies.
Pursuant to FTA circular 4702.1B, RIDE ON has established and monitors service performance under quantitative service standards and qualitative service policies. The standards and policies that must be monitored are:
Standards o Vehicle Load for each mode o Vehicle Headway for each mode o On-Time Performance for each mode o Service Accessibility for each mode
Policies o Vehicle Assignment for each mode o Distribution of Transit Amenities (Policy and Standards) for each mode
2.2. Ride On Service Standards Standards for each of the FTA requirements are described below:
Vehicle Load Factor - This standard is measured as the ratio of passengers on board to the seated bus capacity expressed as a percent. Values of 100 percent or less indicate all riders are provided a seated ride while values of more than 100 percent denote standees. Loading standards indicate the degree of crowding (i.e., standees) which is acceptable, with consideration given to both the type of service and the operating period. Acceptable load factors are as follows:
Service Type Load Factor
Regular Routes 1.2
Express 1.0
Vehicle Headways - In general, frequencies or "headways" (the time between one bus and the next at the same location in the same direction) are established to provide enough vehicles past the maximum load point(s) on a route to accommodate the passenger volume and stay within the recommended load factor standards. If passenger loads are so light that an excessive time is needed between vehicles to meet loading standards, then headways should be set on the basis of policy

Title VI Compliance Monitoring Report August 2017
3RIDE ON
considerations. Montgomery County has established a thirty minute headway as the minimum policy headway for routes operating in any time period.
As with all standards, the minimum headway is not an absolute measure and should be used as a guide. There may be situations where low demand and actual running times warrants even less frequent service. Further, headways should be designed, wherever possible, to conform to regularly recurring clock face intervals. There are instances where operational efficiencies may take the place of the benefits of clock face headways. On-Time Performance – on-time performance standards have been established as follows:
Schedule Adherence (OTP):
All Service Types
2 minutes early to 7 minutes late 88.5%
Service Accessibility – Within Montgomery County transit service is provided to traffic analysis zones with 3+ households per acre and/or 4+ jobs per acre.
2.3. RIDE ON Service Policies Vehicle Assignment Policy – Ride On transit vehicles are assigned to three garages based upon their size and technology. The Nicholson Court Garage located near White Flint is a leased facility and can only accommodate diesel buses 30 foot in length or shorter. The Silver Spring Garage located near downtown Silver Spring can only accommodate diesel fueled buses. The David F. Bone Equipment Maintenance and Transit Operations Center (EMTOC) located in Gaithersburg can accommodate diesel and CNG buses up to 60 foot in length. Vehicles are assigned to routes based upon ridership loads with smaller buses assigned to routes with lighter loads and full sized buses assigned to routes with heavier loads. RIDE ON monitors the age of buses assigned to routes by periodically sampling the bus assignments for a weekday and then comparing the average age of the buses assigned by quartile to the average age for all buses assigned. If the average age of buses assigned to any quartile is one standard deviation higher than the average of all buses assigned, then further investigation of the bus assignment process will be conducted.
Distribution of Transit Amenities Policy - In accordance with RIDE ON policy Bus Stop/Passenger Facilities will generally be located at or near major trip generators or destinations or at regular intervals based on the population density and transit-related demographic factors along the route. Stops must be in locations passengers can board and alight safely and where buses can safely enter and exit. Optimally, bus stop locations will have pedestrian friendly facilities, including sidewalks and walkways that separate pedestrians from vehicular traffic. Whenever possible, stops in opposite directions on a route will be located directly opposite each other. All stops will be fixed locations designated by RIDE ON in accordance with this policy. Additionally, Ride On has a Night Request Stop program that allows passengers to request to be let off at any location with the following limitations: after 9:00 p.m. only; alighting only; must be on the regular route; location must be safe to stop; in Maryland only.

Title VI Compliance Monitoring Report August 2017
4RIDE ON
Bus stops shall not obstruct driveways or entranceways or cause visual obstructions for motorists or for bus operators merging back into the traffic stream. In areas that have high traffic volumes, turning movements, and pedestrian crossings through intersections, the stop should be placed where it presents the least conflict with vehicular traffic and pedestrians.
Decisions for final bus stop selection are based on the following:
Passenger origins Adjacent land use and activities Operational feasibility in accessing the stop Physical constraints or obstructions (trees, driveways, etc.) Pedestrian access including accessibility for people with disabilities Parking restrictions and requirements Traffic volumes on adjacent roadways particularly as evidenced by turning
movements An examination of the individual bus route/routes that serve the potential stop Bus and intermodal (rail, park and ride) transfers to the stop
Safety is a critical consideration. Stops shall not be placed where they present a hazard to passengers, transit vehicles, or other traffic. Park and Ride lots are a special category of bus stops intended to extend the reach of transit by collecting passengers from a wider area. Their location is based on availability of land or preexisting parking and connections to the regional highway system. Park and rides may also accommodate carpoolers, bicycle riders and serve as transit hubs. Planning and development of park and rides include a higher level of involvement with the public, other MCDOT divisions, Maryland National Capital Park and Planning Commission, WMATA and Maryland Transit Administration.
Bus stop interval spacing has a major impact on transit operations. It greatly impacts a route’s travel time, service reliability, and schedule adherence as well as the route’s attractiveness to the customer population. RIDE ON guidelines for bus stop spacing are based on a combination of factors including:
Type of service operated Ridership levels Passenger transfer potential and demand Type of roadway used for operation Prevailing traffic conditions operating on the roadway Adjacent and surrounding land use, trip generators, or attractors Topography of the area Population densities and demographic characteristics Interface with other routes and public transportation services
Bus stops should be placed approximately 750 feet to 1000 feet apart or 5-7 bus stops per mile.
1. Exceptions to Interval Spacing Requirements: Interval spacing guideline exceptions should be limited and made on a case-by-case basis in order to not confuse customers or

Title VI Compliance Monitoring Report August 2017
5RIDE ON
adversely impact a route’s running time and schedule adherence. The following are examples of exceptions to interval spacing requirements:
o Street or subdivision design causes walking distance to the stop to be excessive o Topographic conditions, such as hills or steep grades leading to and from a bus stop o Demographic characteristics of customers, such as elderly customers who are
unable to conveniently travel the prescribed guideline distance between bus stops o High volume activity centers.
2. Consolidation of Bus Stops: Where there are excessive numbers of stops located at short intervals, stops with low levels of ridership will be consolidated. Individual stops may be eliminated or adjacent stops may be consolidated at a suitable intermediate location. Determination of stops to be retained will be based on operational, safety, accessibility, customer convenience considerations and on the suitability of the site for customer facilities.
3. Monitoring Methods RIDE ON will produce a Title VI Monitoring Report every three years. The monitoring method for each service standard and policy follow.
3.1. Minority Population by Bus Route Using the 2014 on-board survey, RIDE ON has identified the minority and majority population for each route. Each route’s minority and majority population will be totaled and a percent minority population will be calculated. The routes will then be ranked in descending order of minority population and divided into four quartiles with the highest minority percentage in the first quartile. Table 3-1 below lists the Ride On routes with minority percentages and arranged in quartiles. This minority ridership ranking by quartile will be utilized in the service monitoring to determine if service is being fairly and equitably provided.

Title VI Compliance Monitoring Report August 2017
6RIDE ON
Table 3-1: Ride On – Montgomery County Population by Transit Route
Minority by Route – 2014 Survey Route # % Minority
Qua
rtile
1
43 94.7% 15 94.1% 20 93.9% 41 93.8% 65 93.3% 38 92.5% 17 92.4% 10 92.3% 83 91.8% 79 91.3% 49 91.1% 16 90.8%
8 90.1% 25 89.8% 39 89.8% 58 89.5% 74 89.3% 55 89.2% 57 89.1% 59 89.1%
Qua
rtile
2
26 89.0% 97 88.9% 56 88.3% 11 88.1% 51 87.5% 64 87.1% 28 86.8%
2 86.7% 48 86.2% 61 85.9% 31 85.7% 66 85.7% 75 85.1%
9 84.9% 67 84.6% 18 84.5% 54 84.2% 71 84.0% 46 83.4% 94 83.3%
Minority by Route – 2014 Survey Route # % Minority
Qua
rtile
3
63 83.1% 70 82.1% 60 81.8% 21 81.1%
100 80.6% 42 80.3% 78 80.0% 93 80.0%
5 79.8% 1 78.4%
12 77.1% 34 77.0% 81 75.0% 98 75.0% 90 74.6% 24 74.2% 47 72.1% 44 71.8% 23 71.6%
Qua
rtile
4
45 71.1% 96 71.0% 53 70.7% 37 70.6% 33 70.2% 76 69.8% 13 65.6% 36 65.5% 29 64.0%
6 63.2% 22 63.0% 52 60.0% 19 57.1% 30 56.1% 14 55.4%
4 51.4% 7 50.0%
32 33.3% 3 0.0%

Title VI Compliance Monitoring Report August 2017
7RIDE ON
3.2. Vehicle Load Factor Monitoring Method Using the GFI Fare collection data for a recent fiscal year, ridership and service capacity data will be collected for each route and an average week day AM peak period and PM peak period will be calculated. Using the quartiles shown in Table 3-1, the average load factor per quartile for each peak period will be calculated. A disparity will exist if the average load factor for either quartile 1 or 2 is one standard deviation higher than the system average.
3.3. Route Headways Monitoring Method Using published timetables, headway data will be collected for each route by four time periods. Using the quartiles shown in Table 3-1, the average headway will be calculated for each quartile and time period. A disparity will exist if the average headway for either quartile 1 or 2 is one standard deviation longer that the system average.
3.4. On-Time Performance Monitoring Method Using automatic vehicle location data for a recent fiscal year, on-time performance will be collected for each route. Using the quartiles shown in Table 3-1, the average on-time performance will be calculated for each quartile and time period. A disparity will exist if the average on-time performance for either quartile 1 or 2 is one standard deviation less than the system average.
3.5. Service Accessibility Monitoring Method Using the most recent US Census and GIS analysis RIDE ON will estimate the percentage of the minority and majority population within ¼ mile of a transit route. If a transit route travels within ¼ mile of a block group, the minority and majority population from that census block group will be assumed to have accessibility to transit services. The average minority and majority access to transit for the system will be calculated. If the minority rate of transit service access is less than 90% of the average rate of transit service access for the total population a disparity will exist.
3.6. Vehicle Assignment Monitoring Method Using vehicle assignments for a recent weekday, the average age of all buses operating on a route during that weekday will be calculated. Using the quartiles shown in Table 3-1, the average age will be calculated for each quartile. A disparity will exist if the average bus age for either quartile 1 or 2 is one standard deviation older than the system average for all buses assigned.
3.7. Distribution of Transit Amenities Monitoring Method Transit amenities will be mapped on GIS mapping for minority and low income populations and the number of shelters and benches will be counted in each area. The number of shelters and the number of benches will be calculated for the minority / non-minority areas and the low income areas based upon the percent of households in poverty. Rates of shelters and benches per 1,000 households will be calculated. If the rate of shelters or benches in minority / low income areas is 20 per cent less that in non-minority / non-low income areas a disparity will exist.

Title VI Compliance Monitoring Report August 2017
8RIDE ON
4. Monitoring Results
4.1. Vehicle Load Factor Monitoring Results Ridership and service capacity data was collected for Fiscal Year 2017. Average weekday AM peak period and PM peak period load factors by quartiles are shown in Table 4.1. Table 4-1: Ride On Vehicle Load Factor Monitoring Results – Fiscal Year 2017
Quartile AM Peak PM Peak 1 54.0% 64.0% 2 43.9% 57.9% 3 41.9% 48.4% 4 33.8% 30.0%
System Average 43.6% 50.6% Standard Deviation 0.199718 0.3205554
Disparity Limit 63.5% 82.7% The monitoring methodology establishes that a disparity exists if the average load factor for either quartile 1 or 2 is one standard deviation higher than the system average. In the AM Peak and PM Peak, the load factor for quartiles 1 and 2 are higher than the system average but lower than the disparity limit. There are four routes that exceed Ride On’s PM Peak Hour Load factor policy of 120% during the PM peak including Route 55 – 174%, Route 59 – 125%, Route 61 – 122% and Route 1 – 125%. Routes 55, 59 are in Quartile 1, Route 61 is in Quartile 2, and Route 1 is in Quartile 3. Beginning October 2, 2017, RIDE ON is adding a new Route 101 – Ride On extRa which will add additional capacity between Lakeforest, Shady Grove, Rockville and Bethesda. This new route should reduce overcrowding on Routes 55, 59 and 61.
4.2. Route Headways Monitoring Results Using the Fiscal Year 2017 Service Summary, headway data was collected for each route by four time periods. The average headway was calculated for each quartile and time period as shown in Table 4-2 below. A disparity exists if the average headway for either quartile 1 or 2 is one standard deviation longer that the system average. Table 4-2: Ride On Route Headways Monitoring Results – Fiscal Year 2017
Quartile AM Peak Mid Day PM Peak Evening 1 21.4 25.6 22.1 28.0 2 23.0 27.1 22.8 28.5 3 23.6 27.7 24.4 30.0 4 26.9 30.0 27.1 35.0
System Average 23.7 27.2 24.0 28.8
Standard Deviation 7.9 5.6 7.5 4.1

Title VI Compliance Monitoring Report August 2017
9RIDE ON
Disparity Limit 31.6 32.8 31.6 32.9 Analysis of the headways indicates that there are no disparities.
4.3. On-Time Performance Monitoring Results Using the automatic vehicle location system for Fiscal Year 2017, on-time performance data for all time points was collected for each route. The average on-time performance was calculated for each quartile and summarized in Table 4-3. The monitoring methodology provides that a disparity exists when the average on-time performance for either quartile 1 or 2 is one standard deviation less than the system average. Table 4-3: Ride On On-Time Performance – Fiscal Year 2017
Quartile On-Time Performance 1 90.7% 2 89.8% 3 82.7% 4 91.0%
System Average 90.9% Standard Deviation 9.7%
Disparity Limit 81.2% Analysis of the on-time performance results indicates that overall on-time performance has achieved the system goal of 90.9 percent.
4.4. Service Accessibility Monitoring Results Table 4-4 presents the GIS analysis of the percentage of minority and non-minority populations within ¼ mile of a Ride On and Metro Bus transit route. The monitoring methodology provides that a disparity exists if the minority rate of transit service access is less than 90% of the majority population rate of transit service access. The data for this calculation is shown in Table 4-9 below. Table 4-4: Ride On Service Accessibility Analysis – September 2013
Total Population Minority
Population Non-Minority
Population Montgomery County 971,777 493,012 478,765
Transit Service Area 854,312 447,350 406,962 % of population within
transit service area 87.9% 90.7% 85.0%
Review of the data indicates that no disparity exists.

Title VI Compliance Monitoring Report August 2017
10RIDE ON
4.5. Vehicle Assignment Monitoring Results Using vehicle assignments for April 26, 2017, the average age of all buses operating on a route was calculated and the average age was calculated for each quartile. The monitoring methodology requires that a disparity exists if the average bus age for either quartile 1 or 2 is one standard deviation older that the system average for all buses assigned. Table 4-5: Bus Average Age April 26, 2017
Quartile Average Age 1 6.70 2 7.21 3 6.47 4 5.92
System Average 6.63 Standard Deviation 2.35
Disparity Limit 8.99 Review of the data indicates that the average age of buses assigned to quartile 1 and quartile 2 are slightly older than the system average. The analysis demonstrates however that no disparity exists.
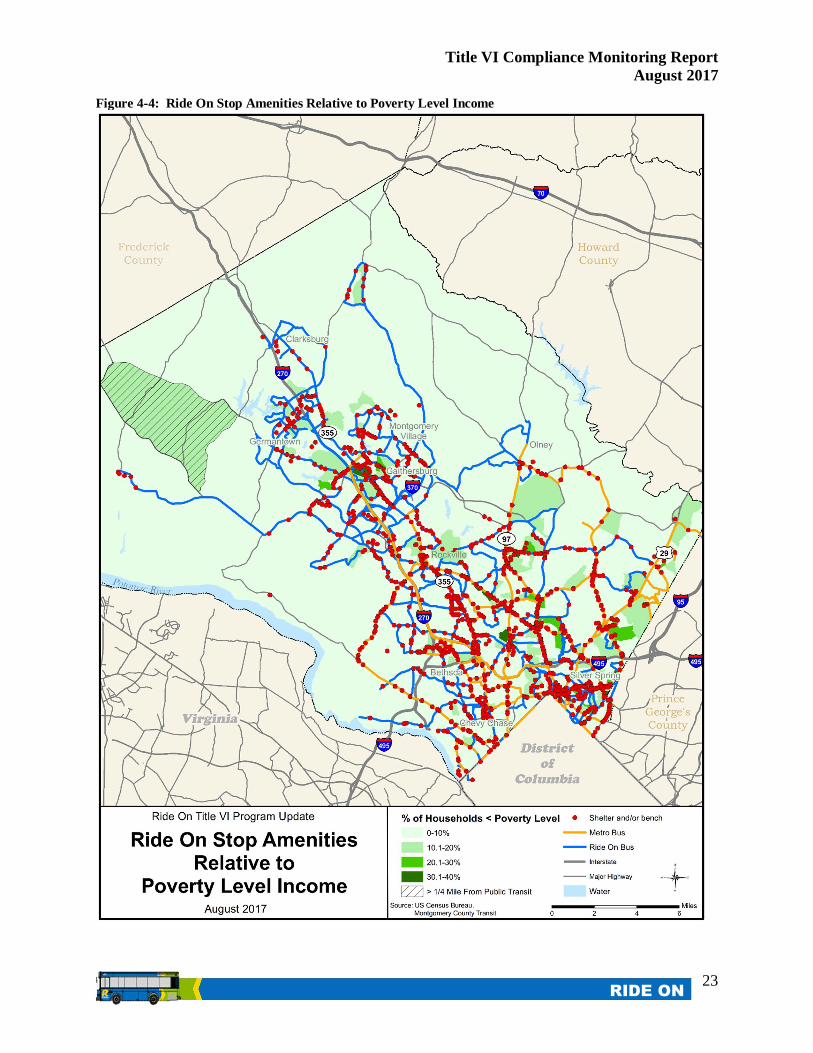
4.6. Distribution of Transit Amenities Monitoring Results The location of transit amenities has been analyzed to determine if they have been fairly located for minority and low-income populations. Tables 4-6 and 4-7 compare the rate of transit amenities calculated as shelters and / or benches per 1,000 households. The rate of transit amenities per 1,000 households is higher for census block groups that have minority concentrations greater than the county average and the rate of transit amenities per 1,000 households is highest in the low income groups. Considering this data, there does not appear to be any disparity in the location of transit amenities. Table 4-6: Transit Amenities Relative to Minority Concentrations
Minority Census Block Groups Households Shelters Benches
Shelters per 1,000 Households
Benches per 1,000 Households
Low Minority concentrations less than 50.7% 186,442 397 627 2.13 3.36 High Minority Concentrations more than 50.7% 166,735 367 501 2.20 3.00 County Total 353,177 764 1,128 2.16 3.19

Title VI Compliance Monitoring Report August 2017
11RIDE ON
Table 4-7: Transit Amenities Relative to Low-income Concentrations
Percent of Households less that Poverty Level Households Shelters Benches
Shelters per 1,000 Households
Benches per 1,000 Households
< 10 % 287,338 557 885 1.94 3.08 10.1% - 20% 50,598 149 179 2.94 3.54 20.1% - 30% 11,755 40 45 3.40 3.83 30.1% - 40% 3,486 18 19 5.16 5.45 County Total 353,177 764 1,128 2.16 3.19

Title VI Compliance Monitoring Report August 2017
12RIDE ON
4.7. Load Factor Detailed Results Table 4-8: Load Factor Analysis – Fiscal Year 2017
Load Factor Average Weekday – Fiscal Year 2017
Q# Route # AM Peak Boardings
PM Peak Boardings
AM Peak Seats
PM Peak Seats
AM Load
Factor
PM Load
Factor
Qua
rtile
I
43 94.7% 157 198 692 655 23% 15 94.1% 998 601 1743 1440 57% 20 93.9% 657 726 1099 910 60% 41 93.8% 182 188 569 455 32% 65 93.3% 137 50 218 182 63% 38 92.5% 230 239 720 493 32% 17 92.4% 215 229 682 606 32% 10 92.3% 531 512 606 455 88% 83 91.8% 112 137 540 432 21% 79 91.3% 159 84 295 221 54% 49 91.1% 512 453 764 655 67% 16 90.8% 605 859 1023 1023 59% 8 90.1% 119 163 324 324 37%
25 89.8% 268 168 594 459 45% 39 89.8% 129 78 243 216 53% 58 89.5% 296 383 582 510 51% 74 89.3% 242 284 546 437 44% 55 89.2% 1389 1598 1200 920 116% 57 89.1% 436 451 764 582 57% 59 89.1% 806 863 910 692 89%
Qua
rtile
2
26 89.0% 650 741 796 644 82% 97 88.9% 182 212 405 324 45% 56 88.3% 441 454 728 546 61% 11 88.1% 288 307 569 455 51% 51 87.5% 135 107 443 443 30% 64 87.1% 335 337 582 473 58% 28 86.8% 70 166 432 648 16% 2 86.7% 196 228 720 606 27%
48 86.2% 438 457 655 582 67% 61 85.9% 546 664 728 546 75% 31 85.7% 29 62 297 297 10% 66 85.7% 61 65 218 182 28% 75 85.1% 103 106 546 437 19% 9 84.9% 278 298 796 569 35%
67 84.6% 75 62 218 218 34% 18 84.5% 137 177 297 297 46% 54 84.2% 472 503 692 510 68% 71 84.0% 169 69 255 218 66% 46 83.4% 477 859 920 800 52% 94 83.3% 6 14 81 162 8%

Title VI Compliance Monitoring Report August 2017
13RIDE ON
Load Factor Average Weekday – Fiscal Year 2017
Q# Route # AM Peak Boardings
PM Peak Boardings
AM Peak Seats
PM Peak Seats
AM Load Factor
PM Load Factor
Qua
rtile
3
63 83.1% 166 220 473 437 35% 70 82.1% 323 274 946 837 34% 60 81.8% 193 129 291 218 66% 21 81.1% 106 74 189 162 56% 100 80.6% 748 680 2288 1882 33% 42 80.3% 111 90 378 297 29% 78 80.0% 145 83 291 218 50% 93 80.0% 17 11 162 162 11% 5 79.8% 442 490 985 720 45% 1 78.4% 390 523 644 417 60%
12 77.1% 336 375 834 758 40% 34 77.0% 653 677 910 682 72% 81 75.0% 66 79 324 324 21% 98 75.0% 88 89 432 324 20% 90 74.6% 300 243 812 590 37% 24 74.2% 183 85 303 265 60% 47 72.1% 387 403 644 493 60% 44 71.8% 66 50 324 324 20% 23 71.6% 183 222 569 455 32%
Qua
rtile
4
45 71.1% 263 261 648 486 41% 96 71.0% 141 163 324 432 44% 53 70.7% 152 116 378 324 40% 37 70.6% 138 111 455 417 30% 33 70.2% 147 124 531 493 28% 76 69.8% 264 203 655 582 40% 13 65.6% 106 119 341 379 31% 36 65.5% 106 120 417 455 25% 29 64.0% 176 184 351 324 50% 6 63.2% 88 71 324 324 27%
22 63.0% 154 125 569 493 27% 52 60.0% 81 58 297 243 27% 19 57.1% 88 49 190 227 47% 30 56.1% 225 206 493 455 46% 14 55.4% 250 248 569 455 44% 4 51.4% 72 68 297 324 24% 7 50.0% 23 16 108 108 21%
32 33.3% 100 94 297 297 34% 3 0.0% 26 12 81 81 33%
System Average 43.6% 50.6% Standard Deviation 0.199718 0.3205554
Disparity Limit 63.5% 82.7%

Title VI Compliance Monitoring Report August 2017
14RIDE ON
4.8. Route Headways Detailed Results The purpose of this evaluation is to determine if the routes that provide service to the minority quartiles (1 and 2) have significantly less frequent service (longer headways) that the routes that provide service to the non-minority quartiles (3 and 4). The average headway was taken from the Fiscal Year 2017 service summary. The detailed results are shown on Table 4-9 on the next two pages. Table 4-9: Route Headway Detailed Results
Quartile % Minority Route Route Description
AM Avg
Hdwy
Base Day
1200n
PM Avg
Hdwy Evng 900p
1
94.7% 43 Traville TC-Shady Grove-Hospital-Shady Grove 20 30 25 30 94.1% 15 Langley Park-Wayne Ave.-Silver Spring 6 15 7 20 93.9% 20 Hillandale-Northwest Park-Silver Spring 8 20 10 20 93.8% 41 Aspen Hill-Weller Rd.-Glenmont 30 30 30 30 93.3% 65 Montgomery Village-Shady Grove 30 30 92.5% 38 Wheaton-White Flint 20 30 25 30 92.4% 17 Langley Park-Maple Ave.-Silver Spring 20 25 20 30 92.3% 10 Twinbrook-Glenmont-White Oak-Hillandale 30 30 25 30 91.8% 83 Germantown MARC-GTC-Waters Landing-Milestone-Holy Cross 30 30 30 30 91.3% 79 Clarksburg-Skylark-Scenery-Shady Grove 30 30 91.1% 49 Glenmont-Layhill-Rockville 15 30 20 30 90.8% 16 Takoma-Langley Park-Silver Spring 12 20 12 20 90.1% 8 Wheaton-Forest Glen-Silver Spring 30 30 30 89.8% 25 Langley Park-Washington Adventist Hosp-Maple Ave-Takoma 15 15 89.8% 39 Briggs Chaney-Glenmont 30 30 89.5% 58 Lakeforest-Montgomery Ville-East Village-Shady Grove, Watkins Mill & MD355 25 30 25 30 89.3% 74 GTC-Great Seneca Hwy.-Shady Grove 30 30 30 30 89.2% 55 GTC-Milestone-MC,G-Lakeforest-Shady Grove-MC,R-Rockville 12 10 12 30 89.1% 57 Lakeforest-Washington Grove-Shady Grove 20 20 20 30 89.1% 59 Montgomery Village-Lakeforest-Shady Grove-Rockville 15 30 15 30
2
89.0% 26 Glenmont-Aspen Hill-Twinbrook-Montgomery Mall 15 30 15 30 88.9% 97 GTC, Germantown MARC, Waring Station, GTC 15 30 15 30 88.3% 56 Lakeforest-Quince Orchard-Shady Grove Hospital-Rockville 20 30 20 30 88.1% 11 Silver Spring-East/West Hwy-Friendship Heights 9 15 87.5% 51 Norbeck P&R-Hewitt Ave.-Glenmont 30 30 87.1% 64 Montgomery Village-Quail Valley-Emory Grove-Shady Grove 25 30 25 30 86.8% 28 Silver Spring Downtown (VanGo) 15 12 15 12 86.7% 2 Lyttonsville-Silver Spring 25 30 20 30 86.2% 48 Wheaton-Bauer Dr.-Rockville 25 25 20 30 85.9% 61 GTC-Lakeforest-Shady Grove 20 30 20 30 85.7% 31 Glenmont-Kemp Mill Rd.-Wheaton 30 30 85.7% 66 Shady Grove-Piccard Drive-Shady Grove Hospital-Traville TC 30 30 85.1% 75 Clarksburg-Correctional Facility-Milestone-GTC 30 30 30 84.9% 9 Wheaton-Four Corners-Silver Spring 20 30 20 30 84.6% 67 Traville TC-North Potomac-Shady Grove 30 30 84.5% 18 Langley Park-Takoma-Silver Spring 30 30 30 30 84.2% 54 Lakeforest-Washingtonian Blvd-Rockville 20 30 20 30 84.0% 71 Kingsview-Dawson Farm-Shady Grove 30 30 83.4% 46 Shady Grove-Montgomery College-Rockville Pike-Medical Center 15 15 15 30 83.3% 94 Germantown MARC-Clarksburg Meet the MARC Janaury 2014 25 25

Title VI Compliance Monitoring Report August 2017
15RIDE ON
Table 4-10: Ride On Headway Analysis – August 2014
Quartile % Minority Route Route Description
AM Avg
Hdwy
Base Day
1200n
PM Avg
Hdwy Evng 900p
3
83.1% 63 Shady Grove-Gaither Road-Piccard Dr.-Rockville 30 30 30 82.1% 70 Milestone-Medical Center-Bethesda Express 12 15 81.8% 60 Montgomery Village-Flower Hill-Shady Grove 30 30 81.1% 21 Briggs Chaney-Tamarack-Dumont Oaks-Silver Spring 30 30 80.6% 100 GTC-Shady Grove 6 15 6 30 80.3% 42 White Flint-Montgomery Mall 30 30 30 30 80.0% 78 Kingsview-Richter Farm-Shady Grove 30 30 80.0% 93 Twinbrook-HHS-Twinbrook 30 30 79.8% 5 Twinbrook-Kensington-Silver Spring 10 30 12 30 78.4% 1 Silver Spring-Leland St.-Friendship Heights 30 20 25 30 77.1% 12 Takoma-Flower Avenue-Wayne Avenue-Silver Spring 15 30 15 30 77.0% 34 Aspen Hill-Wheaton-Bethesda-Friendship Heights 15 30 15 30 75.0% 81 Rockville-Tower Oaks-White Flint 30 30 75.0% 98 GTC, Kingsview, GCC, Cinnamon Woods 30 30 30 30 74.6% 90 Damascus-Woodfield Rd- Airpark Shady Grove 20 30 20 74.2% 24 Hillandale-Northwest Park-Takoma 20 30 72.1% 47 Rockville-Montgomery Mall-Bethesda 25 30 25 30 71.8% 44 Twinbrook-Hungerford-Rockville 30 30 71.6% 23 Sibley Hospital-Brookmont-Sangamore Road-Friendship Heights 25 30 30 30
4
71.1% 45 Fallsgrove-Rockville Senior Center-Rockville-Twinbrook 15 30 15 71.0% 96 Montgomery Mall-Rock Spring-Grosvenor 10 30 10 70.7% 53 Shady Grove-MGH-Olney-Glenmont 35 35 70.6% 37 Potomac-Tuckerman La.-Grosvenor-Wheaton 30 30 70.2% 33 Glenmont-Kensington-Medical Center 25 25 69.8% 76 Poolesville-Kentlands-Shady Grove 15 30 15 65.6% 13 Takoma-Manchester Rd.-Three Oaks Dr.-Silver Spring 25 30 65.5% 36 Potomac-Bradley Blvd.-Bethesda 30 30 30 64.0% 29 Bethesda-Glen Echo-Friendship Heights 30 30 30 35 63.2% 6 Grosvenor-Parkside-Montgomery Mall Loop 30 30 30 63.0% 22 Hillandale-White Oak-FDA-Silver Spring 15 15 60.0% 52 MGH-Olney-Rockville 30 30 57.1% 19 Northwood-Four Corners-Silver Spring 30 30 56.1% 30 Medical Center-Pooks Hill-Bethesda 30 30 30 55.4% 14 Takoma-Piney Branch Road-Franklin Ave.-Silver Spring 30 30 30 51.4% 4 Kensington-Silver Spring 30 30 50.0% 7 Forest Glen-Wheaton 30 30 33.3% 32 Naval Ship R&D-Cabin John-Bethesda 32 30 0.0% 3 Takoma-Dale Dr.-Silver Spring 40 40

Title VI Compliance Monitoring Report August 2017
16RIDE ON
4.9. On-Time Performance Detailed Results Table 4-11: Ride On On-Time Performance – Fiscal Year 2017
Quartile Route Route OTP
Quartile OTP Quartile Route
Route OTP
Quartile OTP
Qua
rtile
1
43 93.9%
90.7%
Qua
rtile
3
63 95.5%
91.0%
15 89.8% 70 85.0% 20 84.8% 60 91.4% 41 92.0% 21 81.8% 65 97.4% 100 96.8% 38 92.9% 42 95.4% 17 89.7% 78 92.7% 10 87.4% 93 92.8% 83 95.8% 5 88.2% 79 85.1% 1 95.0% 49 91.7% 12 89.7% 16 82.9% 34 90.7% 8 85.7% 81 98.5%
25 93.9% 98 90.0% 39 88.4% 90 90.7% 58 93.7% 24 90.2% 74 93.0% 47 89.4% 55 89.2% 44 94.2% 57 94.5% 23 81.5% 59 91.5%
Qua
rtile
2
26 88.8%
89.8%
Qua
rtile
4
45 94.2%
92.3%
97 81.3% 96 95.8% 56 88.5% 53 92.2% 11 91.2% 37 95.0% 51 92.7% 33 88.4% 64 93.0% 76 92.7% 28 66.0% 13 86.2% 2 94.2% 36 90.8%
48 93.7% 29 95.2% 61 90.7% 6 97.5% 31 93.9% 22 87.6% 66 96.4% 52 91.7% 75 90.5% 19 87.7% 9 88.5% 30 95.9%
67 92.3% 14 88.6% 18 90.5% 4 92.5% 54 91.3% 7 98.9% 71 93.3% 32 86.8% 46 91.2% 3 96.2% 94 87.4%

Title VI Compliance Monitoring Report August 2017
17RIDE ON
4.10. Service Accessibility Detailed Results Using the 2010 census and the methodology described in Section 3.5, RIDE ON has utilized GIS to estimate the numbers of persons in Montgomery County that are within the transit service area for the Ride On and Metro Bus services. Table 4.11 below provides the numerical analysis. Figure 5-1 illustrates the minority populations served by the Ride On transit services and Figure 5-2 illustrates the low-income populations served by the Ride On transit services. Table 4-12: Ride On Service Accessibility Analysis – August 2014
Total Population Minority
Population Non-Minority
Population Montgomery County 971,777 493,012 478,765
Transit Service Area 854,312 447,350 406,962 % of population within
transit service area 87.9% 90.7% 85.0%

Title VI Compliance Monitoring Report August 2017
18RIDE ON
Figure 4-1: Ride On Service Area with Minority Population Concentrations by Block Group

Title VI Compliance Monitoring Report August 2017
19RIDE ON
Figure 4-2: Ride On Service Area with Households below Poverty Level by Block Group

Title VI Compliance Monitoring Report August 2017
20RIDE ON
4.11. Vehicle Assignment Detailed Results Table 4-13: Ride On Average Bus Age by Route – April 26, 2017
Quartile Route Trips Total Age
Route Average
Age
Quartile Average
Age
Qua
rtile
1
43 76 812 10.7
6.70
15 142 737 5.2 20 97 497 5.1 41 67 377 5.6 65 14 138 9.9 38 64 286 4.5 17 65 359 5.5 10 59 330 5.6 83 78 325 4.2 79 18 169 9.4 49 89 522 5.9 16 89 462 5.2 8 56 278 5 25 38 108 2.8 39 24 108 4.5 58 73 794 10.9 74 66 617 9.3 55 163 1136 7 57 98 1077 11 59 100 764 7.6
Qua
rtile
2
26 63 347 5.5
7.21
97 53 227 4.3 56 79 844 10.7 11 33 164 5 51 20 141 7.1 64 71 611 8.6 28 91 339 3.7 2 58 357 6.2 48 89 706 7.9 61 83 726 8.7 31 22 155 7 66 14 146 10.4 75 58 520 9 9 65 401 6.2 67 15 161 10.7 18 55 151 2.7 54 81 927 11.4 71 16 150 9.4 46 122 764 6.3 94 14 108 7.7

Title VI Compliance Monitoring Report August 2017
21RIDE ON
Quartile Route Trips Total Age
Route Ave Age
Quartile Ave Age
Qua
rtile
3
63 57 660 11.6
6.47
70 62 299 4.8 60 17 174 10.2 21 15 103 6.9 100 182 1581 8.7 42 59 326 5.5 78 16 179 11.2 93 14 78 5.6 5 80 433 5.4 1 58 249 4.3
12 78 368 4.7 34 80 375 4.7 81 31 180 5.8 98 62 317 5.1 90 73 721 9.9 24 14 78 5.6 47 55 270 4.9 44 25 146 5.8 23 56 148 2.6
Qua
rtile
4
45 79 469 5.9
5.92
96 59 361 6.1 53 31 175 5.6 37 27 152 5.6 33 31 192 6.2 76 66 643 9.7 13 18 81 4.5 36 43 231 5.4 29 64 402 6.3 6 58 278 4.8
22 35 95 2.7 52 21 133 6.3 19 10 58 5.8 30 42 253 6.0 14 51 286 5.6 4 26 78 3 7 12 92 7.7
32 28 158 5.6 3 6 48 8

Title VI Compliance Monitoring Report August 2017
22RIDE ON
4.12. Distribution of Transit Amenities Transit amenities are mapped on Figures 4.3 and 4.4. Figure 4-3: Ride On Stop Amenities Relative to Minority Population
Title VI Compliance Monitoring Report August 2017
23RIDE ON
Figure 4-4: Ride On Stop Amenities Relative to Poverty Level Income