Embed Size (px)
Citation preview
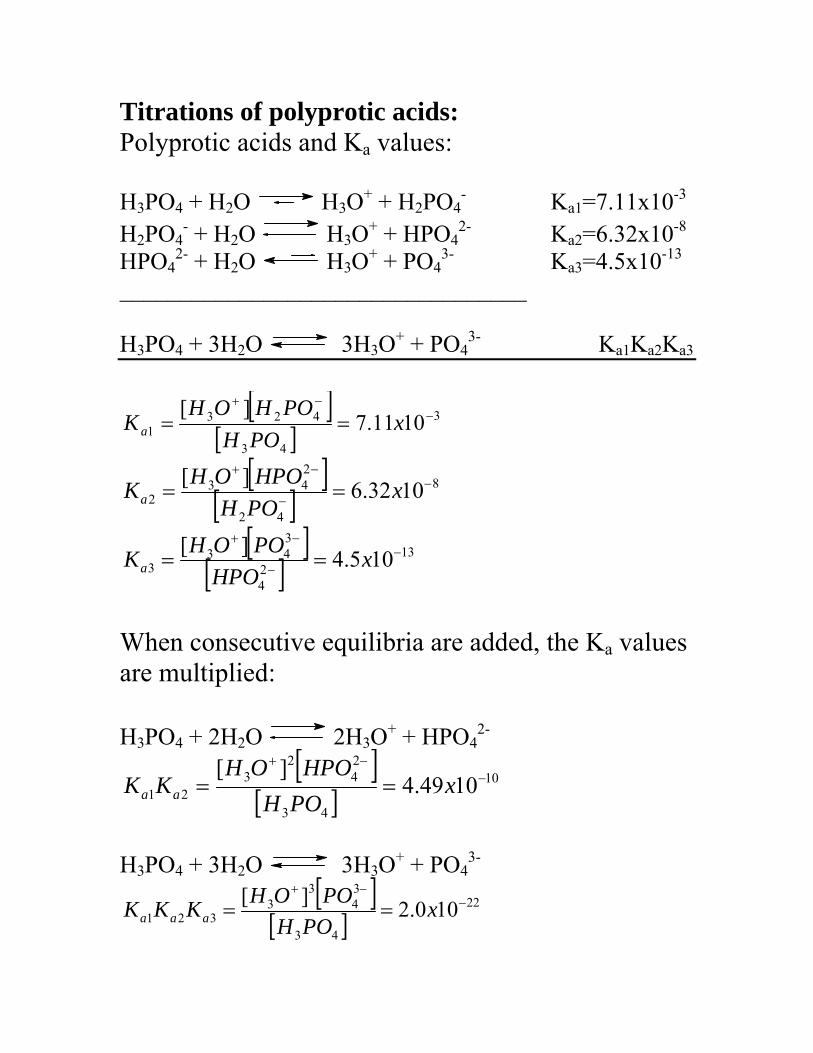
Titrations of polyprotic acids: Polyprotic acids and Ka values: H3PO4 + H2O H3O+ + H2PO4
- Ka1=7.11x10⁻³ H2PO4
- + H2O H3O+ + HPO42- Ka2=6.32x10⁻⁸
HPO42- + H2O H3O+ + PO4
3- Ka3=4.5x10⁻¹³
__________________________________ H3PO4 + 3H2O 3H3O+ + PO4
3- Ka1Ka2Ka3
[ ][ ]
3
43
4231 1011.7
][ −−+
== xPOH
POHOHK a
[ ][ ]
8
42
243
2 1032.6][ −−
−+
== xPOHHPOOHKa
[ ][ ]
1324
343
3 105.4][ −−
−+
== xHPO
POOHKa
When consecutive equilibria are added, the Ka values are multiplied: H3PO4 + 2H2O 2H3O+ + HPO4
2- [ ]
[ ]10
43
24
23
21 1049.4][ −
−+
== xPOH
HPOOHKK aa
H3PO4 + 3H2O 3H O+ + PO4
3- 3
[ ][ ]
22
43
34
33
321 100.2][ −−+
== xPOH
POOHKKK aaa
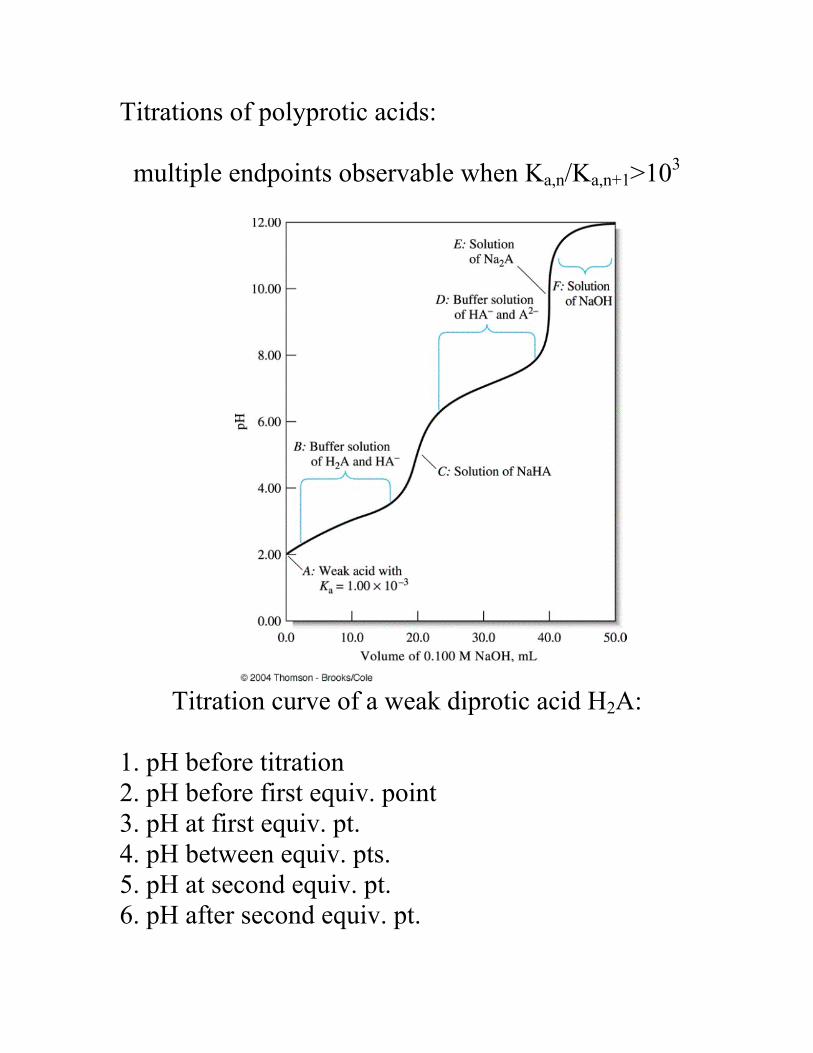
Titrations of polyprotic acids:
multiple endpoints observable when Ka,n/Ka,n+1>103
Titration curve of a weak diprotic acid H2A:
1. pH before titration 2. pH before first equiv. point 3. pH at first equiv. pt. 4. pH between equiv. pts. 5. pH at second equiv. pt. 6. pH after second equiv. pt.
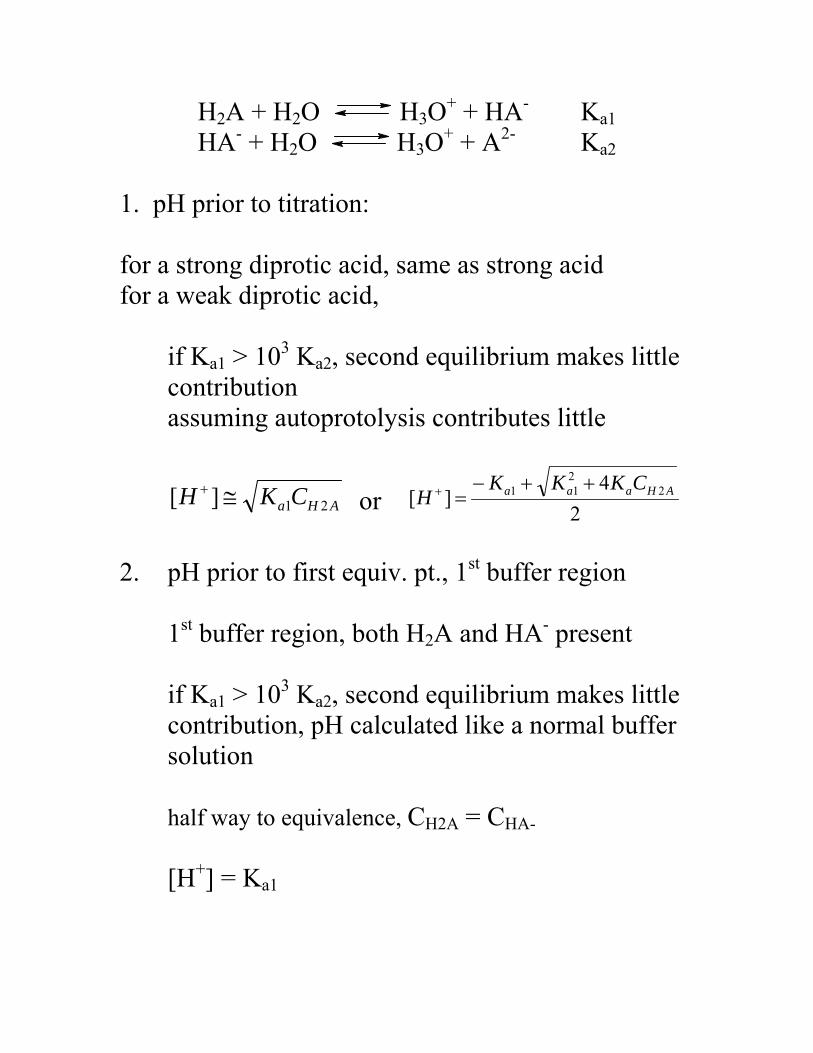
H2A + H2O H3O+ + HA- Ka1 HA- + H2O H3O+ + A2- Ka2
1. pH prior to titration: for a strong diprotic acid, same as strong acid for a weak diprotic acid, if Ka1 > 103 Ka2, second equilibrium makes little
contribution assuming autoprotolysis contributes little
AHa CKH 21][ ≅+ or 2
4][ 2
211 AHaaa CKKK
H++−
=+
2. pH prior to first equiv. pt., 1st buffer region 1st buffer region, both H2A and HA- present if Ka1 > 103 Ka2, second equilibrium makes little
contribution, pH calculated like a normal buffer solution
half way to equivalence, CH2A = CHA- [H+] = Ka1
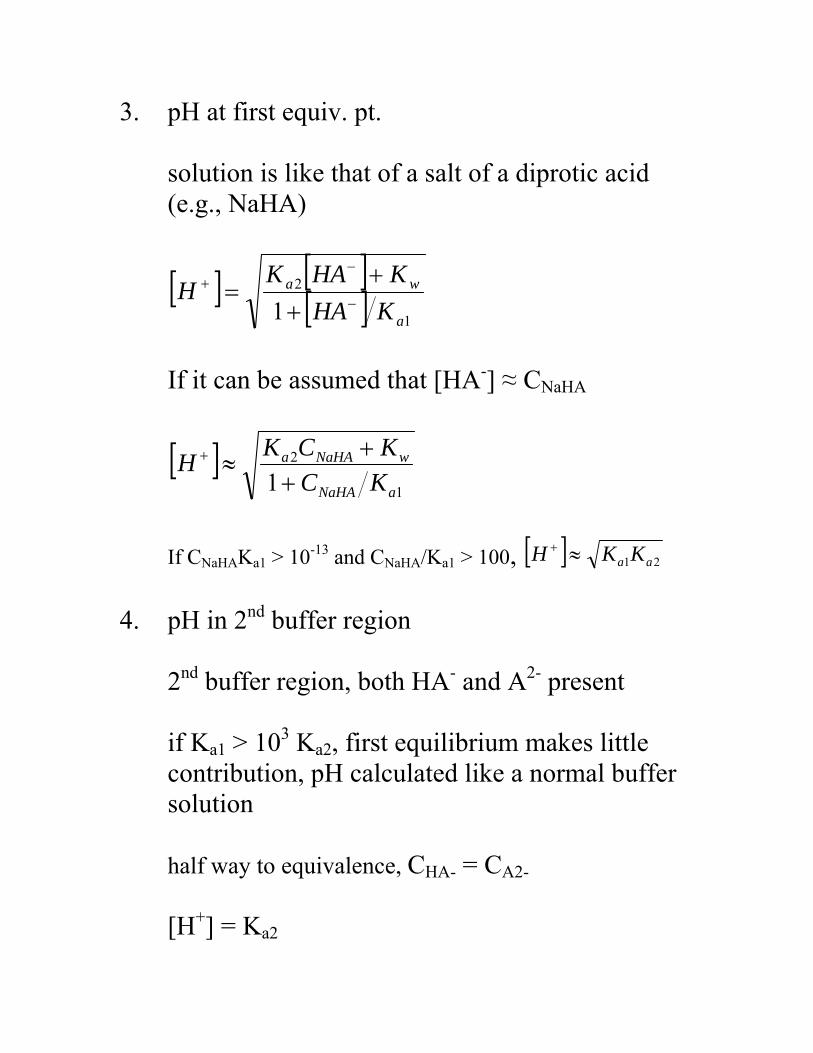
3. pH at first equiv. pt. solution is like that of a salt of a diprotic acid
(e.g., NaHA)
[ ] [ ][ ] 1
2
1 a
wa
KHAKHAK
H −
−+
++
=
If it can be assumed that [HA-] ≈ CNaHA
[ ]1
2
1 aNaHA
wNaHAa
KCKCKH
++
≈+
If CNaHAKa1 > 10-13 and CNaHA/Ka1 > 100, [ ] 21 aa KKH ≈+
4. pH in 2nd buffer region
2nd buffer region, both HA- and A2- present if Ka1 > 103 Ka2, first equilibrium makes little
contribution, pH calculated like a normal buffer solution
half way to equivalence, CHA- = CA2- [H+] = Ka2
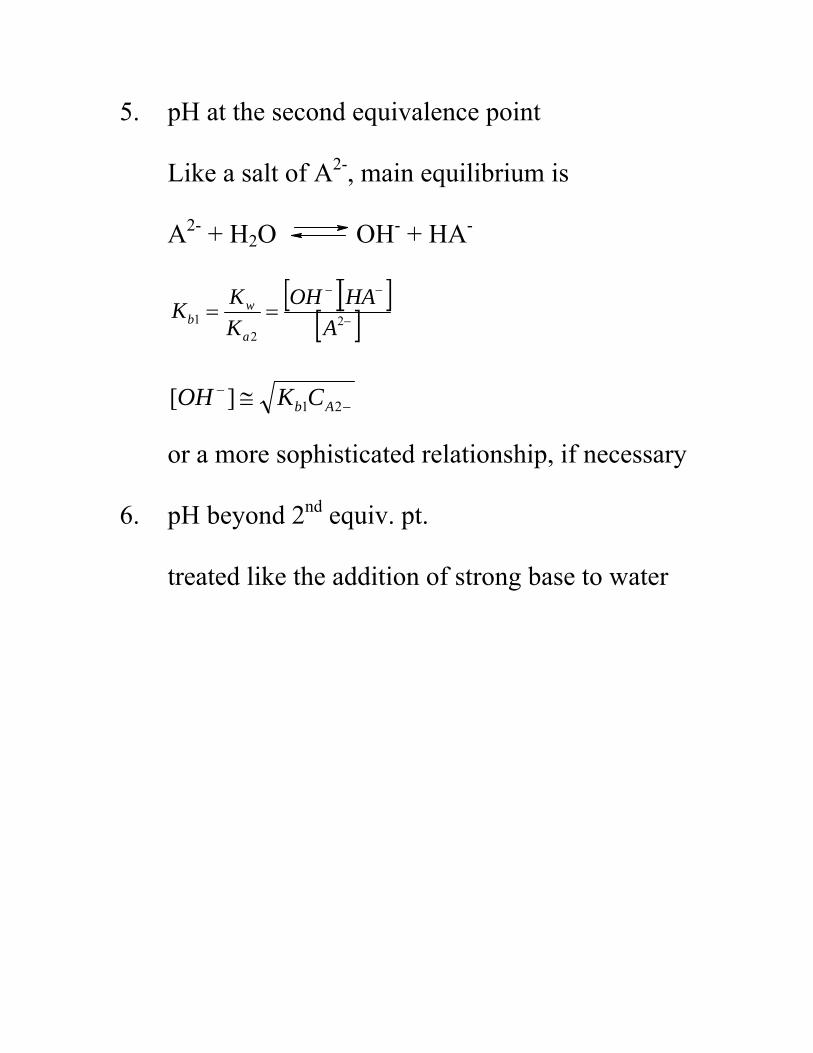
5. pH at the second equivalence point Like a salt of A2-, main equilibrium is A2- + H2O OH- + HA-
[ ][ ][ ]−
−−
== 22
1 AHAOH
KKK
a
wb
−
− ≅ 21][ Ab CKOH
or a more sophisticated relationship, if necessary 6. pH beyond 2nd equiv. pt. treated like the addition of strong base to water
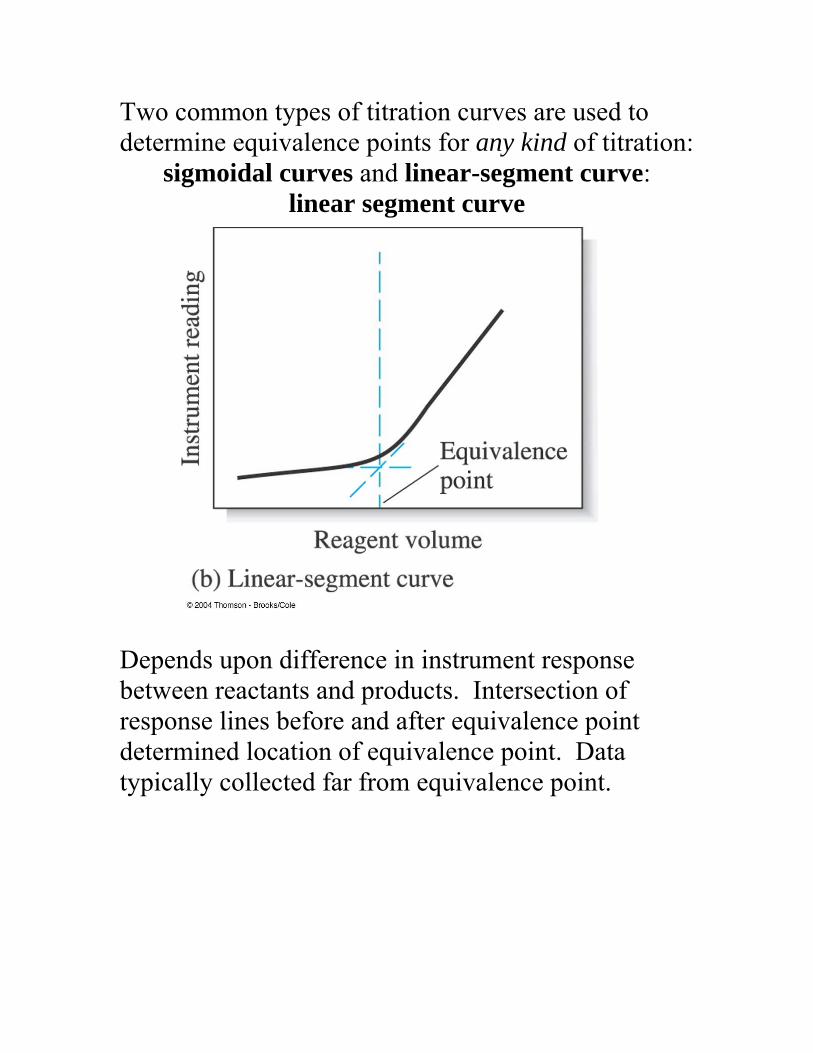
Two common types of titration curves are used to determine equivalence points for any kind of titration:
sigmoidal curves and linear-segment curve: linear segment curve
Depends upon difference in instrument response between reactants and products. Intersection of response lines before and after equivalence point determined location of equivalence point. Data typically collected far from equivalence point.
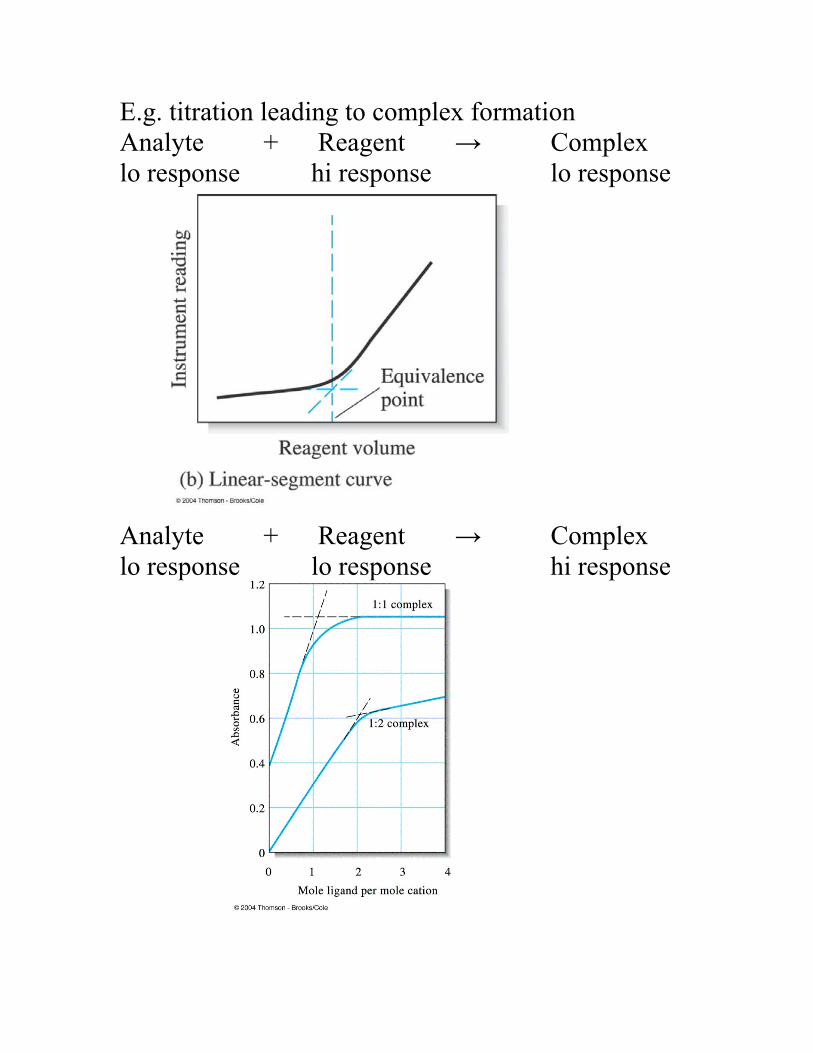
E.g. titration leading to complex formation Analyte + Reagent → Complex lo response hi response lo response
Analyte + Reagent → Complex lo response lo response hi response
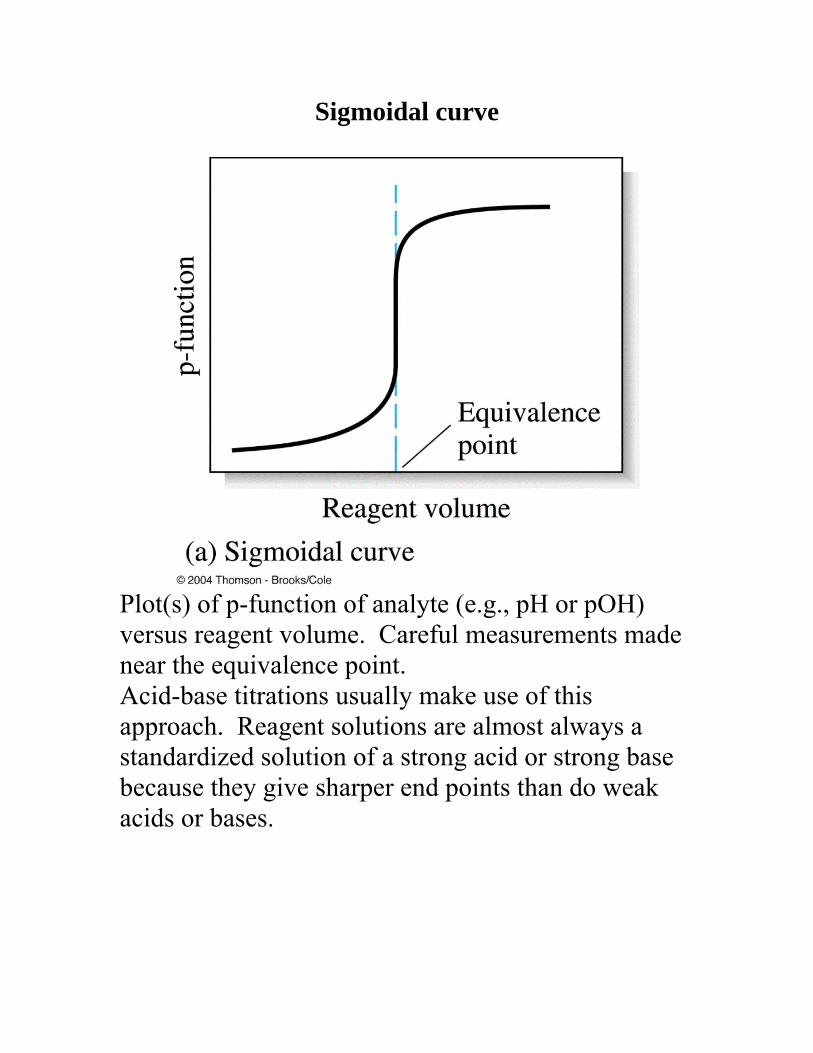
Sigmoidal curve
Plot(s) of p-function of analyte (e.g., pH or pOH) versus reagent volume. Careful measurements made near the equivalence point. Acid-base titrations usually make use of this approach. Reagent solutions are almost always a standardized solution of a strong acid or strong base because they give sharper end points than do weak acids or bases.
Identifying equivalence points:
1. titration with indicators (sigmoidal curve) 2. titration with linear-segment curve 3. titration monitored with a pH meter 4. Gran plot (see feature 14-5, text)
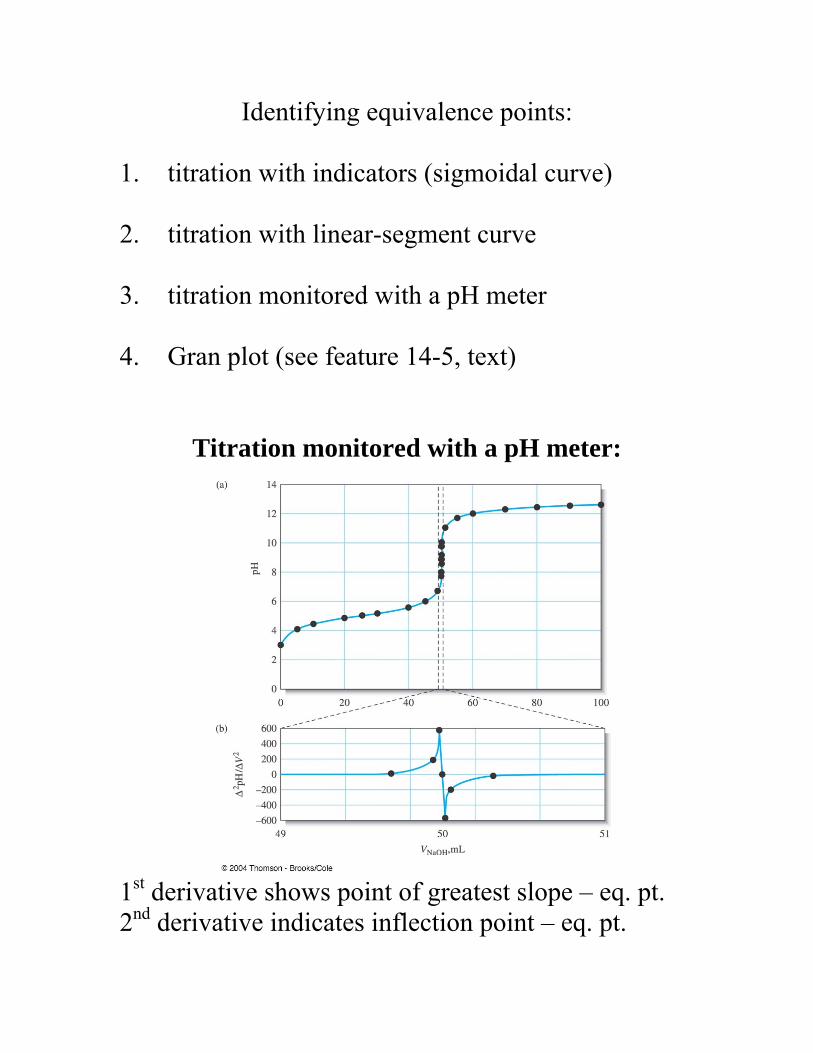
Titration monitored with a pH meter:
1st derivative shows point of greatest slope – eq. pt. 2nd derivative indicates inflection point – eq. pt.
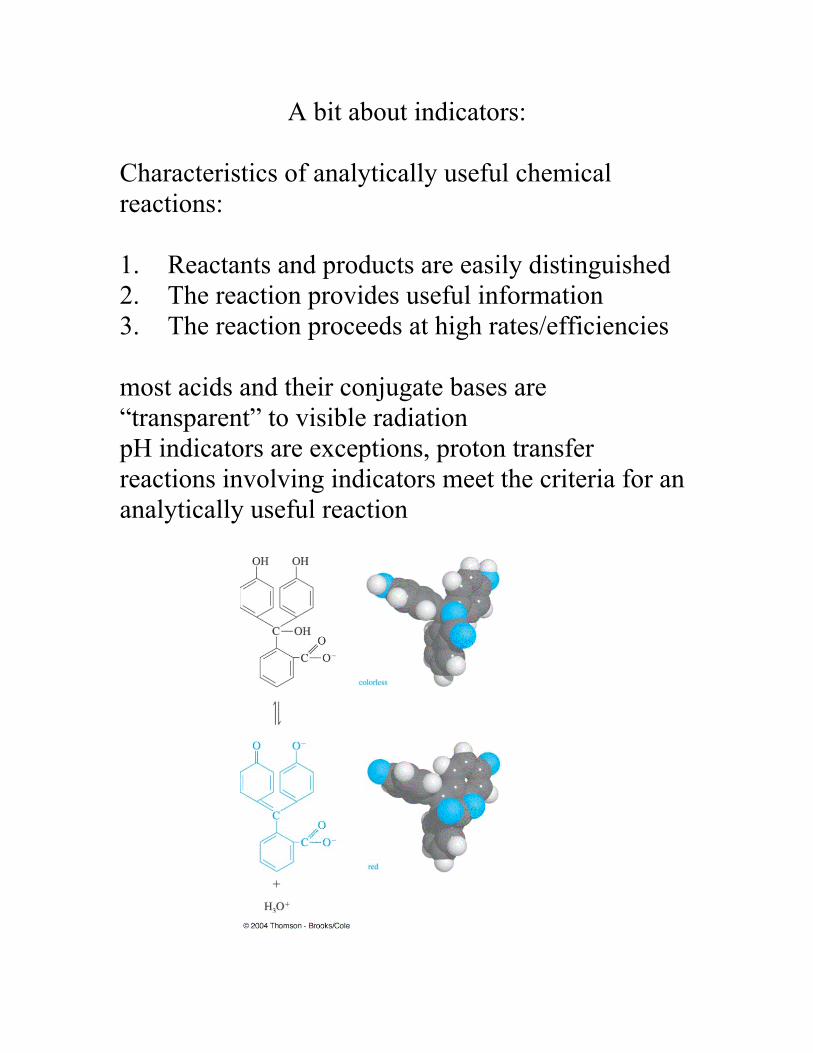
A bit about indicators:
Characteristics of analytically useful chemical reactions: 1. Reactants and products are easily distinguished 2. The reaction provides useful information 3. The reaction proceeds at high rates/efficiencies most acids and their conjugate bases are “transparent” to visible radiation pH indicators are exceptions, proton transfer reactions involving indicators meet the criteria for an analytically useful reaction
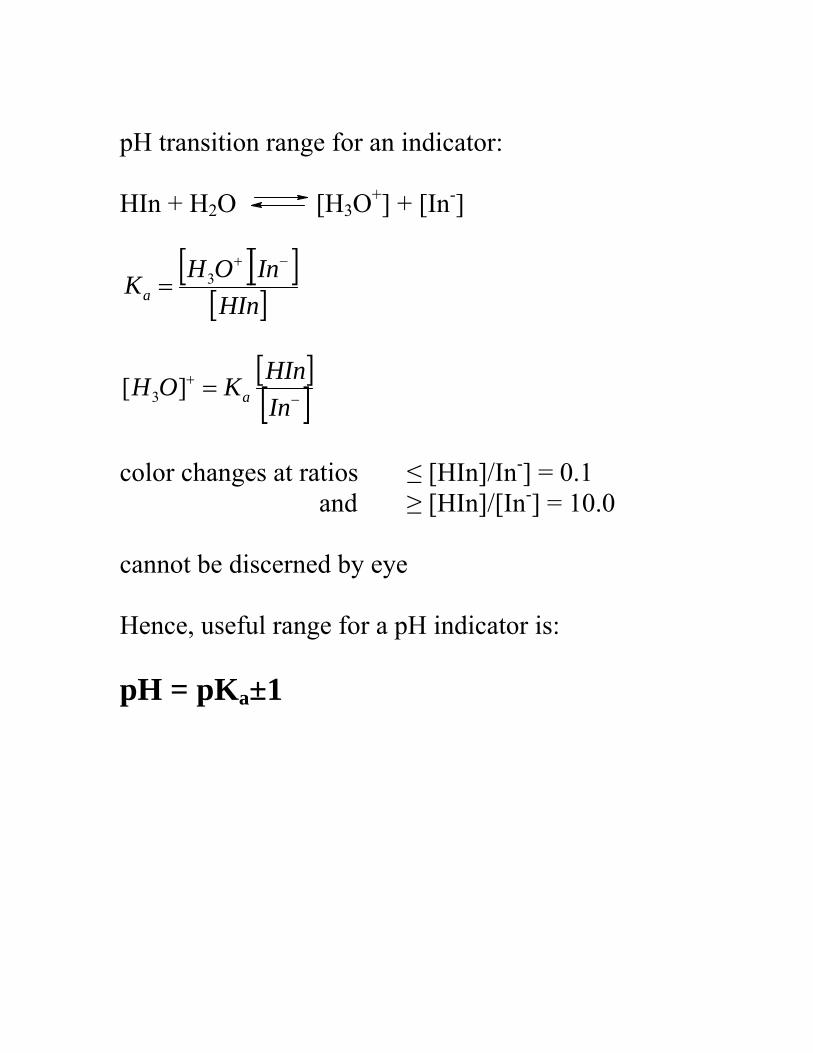
pH transition range for an indicator: HIn + H2O [H3O+] + [In-]
[ ][ ][ ]HIn
InOHKa
−+
= 3
[ ][ ]−
+ =InHInKOH a][ 3
color changes at ratios ≤ [HIn]/In-] = 0.1 and ≥ [HIn]/[In-] = 10.0 cannot be discerned by eye Hence, useful range for a pH indicator is: pH = pKa±1
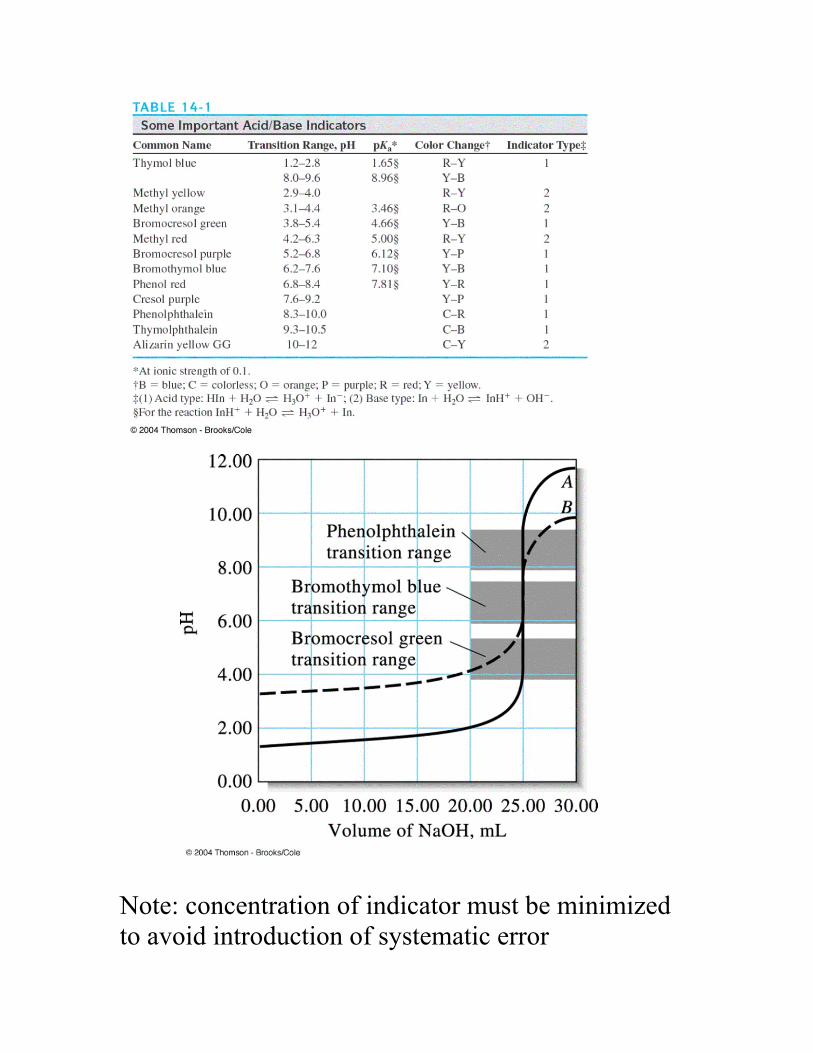
Note: concentration of indicator must be minimized to avoid introduction of systematic error


![pH = -log [H + ]. Strong Acid. Strong base. Weak Acid. Weak Base. “Conjugate Acid – Base Pair” a proton donor & its corresponding proton](https://img.pdfslide.net/doc/110x75/56649e215503460f94b0d171/-ph-log-h-strong-acid-strong-base-weak-acid-.jpg)


![Titrations. Strong Acid with Strong Base Starting pH pH = -log[F Acid ] Just before the Equivalence Point [H + ] = (V acid ·F acid -V base ·F base )/(V](https://img.pdfslide.net/doc/110x75/56649d635503460f94a463ff/titrations-strong-acid-with-strong-base-starting-ph-ph-logf-acid-just.jpg)