Embed Size (px)
Citation preview
TLE Corte June 2008
BALLOON BORNE DC AND AC ELECTRIC MEASUREMENTSIN THE VICINTY OF TROPICAL CONVECTIVE CLOUDS.
J.J. BERTHELIER 1, F. SIMOES 1, J.P. POMMEREAU 2
1 CETP/IPSL, 2 SERVICE D’AÉRONOMIE/IPSL
TLE Corte June 2008
Overview of the presentation
1- Objectives and description of the HV-AIRS experiment
2- Meteorological conditions during flight
3- Global parameters of atmospheric electricity, EDC and σ
4- Small scale features and electric turbulence in clouds
5- Lightning and atmospheric electric fields- Lightning detection- EDC and EAC variations associated with lightning
6- Summary and conclusions
TLE Corte June 2008
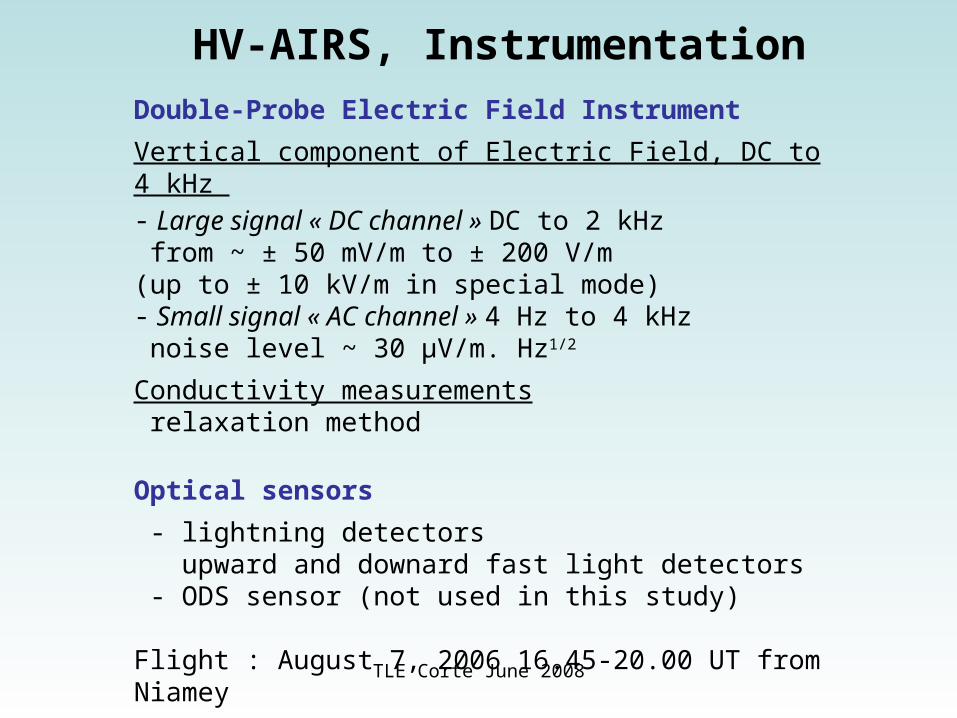
HV-AIRS, Instrumentation
Double-Probe Electric Field Instrument
Vertical component of Electric Field, DC to 4 kHz - Large signal « DC channel » DC to 2 kHz from ~ ± 50 mV/m to ± 200 V/m(up to ± 10 kV/m in special mode)- Small signal « AC channel » 4 Hz to 4 kHz noise level ~ 30 µV/m. Hz1/2
Conductivity measurements relaxation method
Optical sensors
- lightning detectors upward and downard fast light detectors - ODS sensor (not used in this study)
Flight : August 7, 2006 16.45-20.00 UT from Niamey
TLE Corte June 2008
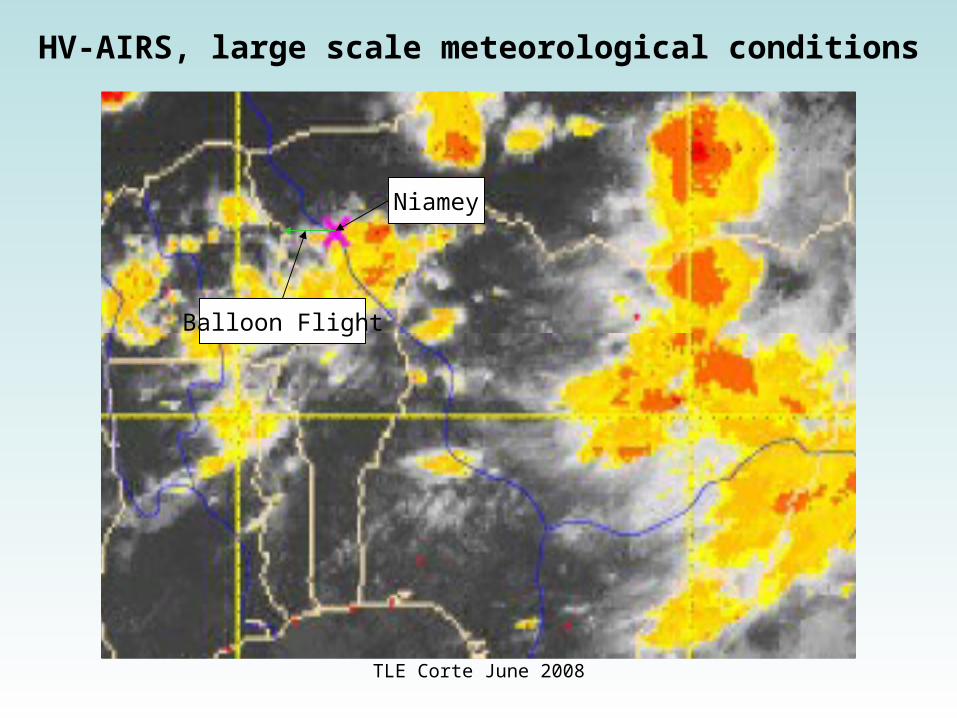
HV-AIRS, large scale meteorological conditions
Niamey
Balloon Flight
TLE Corte June 2008
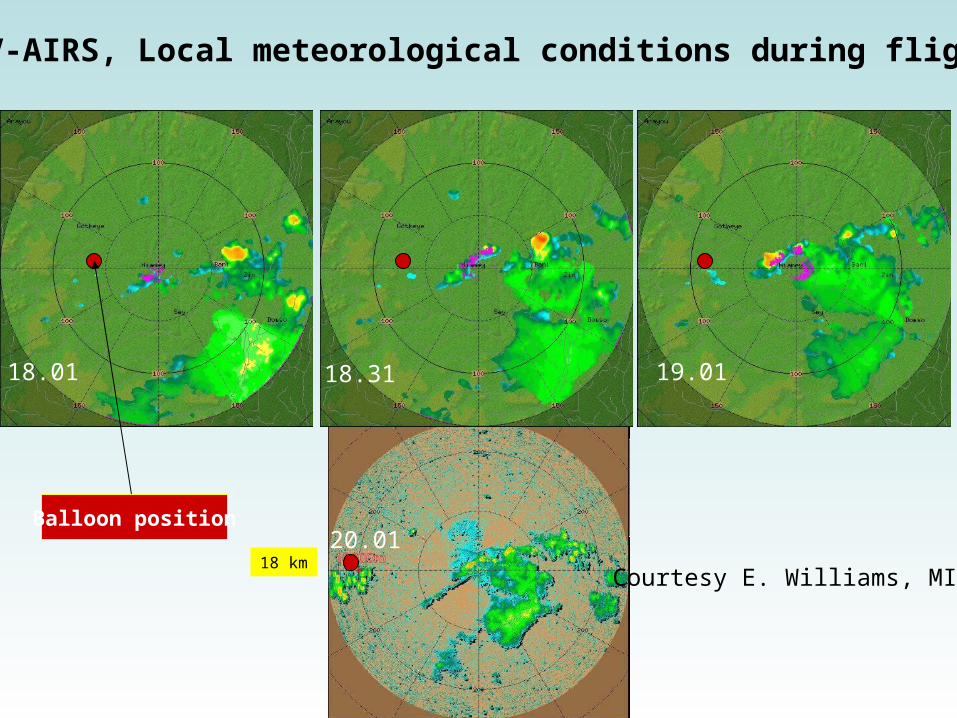
18.01 19.31 19.0118.31
HV-AIRS, Local meteorological conditions during flight
18 km
Balloon position
Courtesy E. Williams, MIT
20.01
TLE Corte June 2008
0 1000 2000 3000 4000 5000 6000 7000 8000 9000 10000-8000
-6000
-4000
-2000
0
2000
4000
Time [s]
Ele
ctric
Fie
ld [1
]
0 1000 2000 3000 4000 5000 6000 7000 8000 9000 100000
5
10
15
20
25
Alti
tude
[km
]
DC Field 1
DC Field 2
DC1-DC2
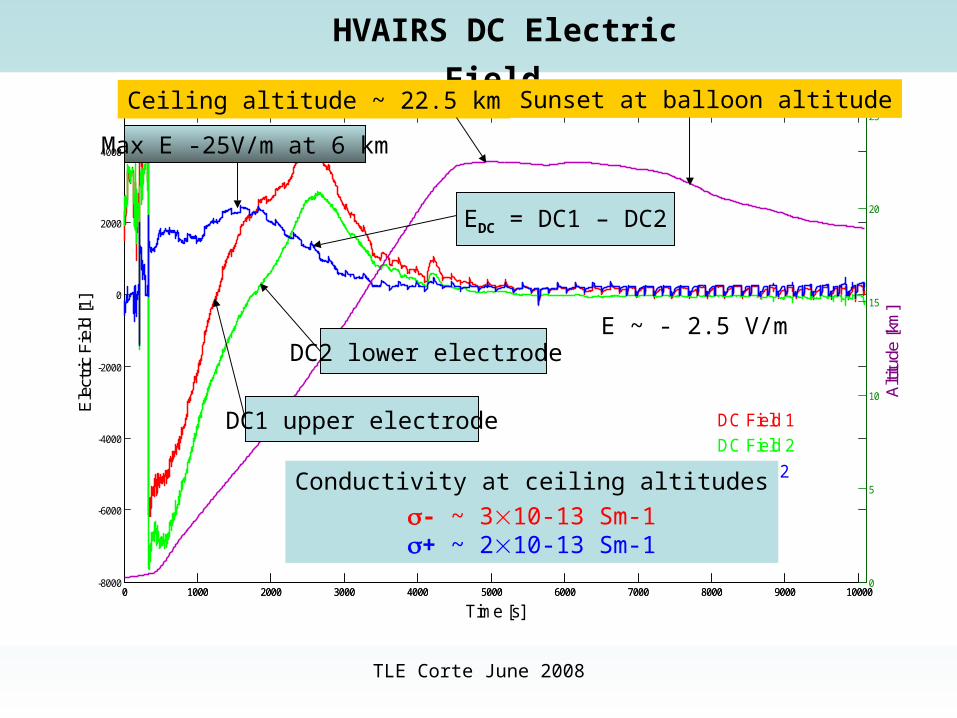
HVAIRS DC Electric Field
E ~ - 2.5 V/m
Conductivity at ceiling altitudes
- ~ 310-13 Sm-1+ ~ 210-13 Sm-1
Ceiling altitude ~ 22.5 km Sunset at balloon altitude
DC2 lower electrode
DC1 upper electrode
Max E -25V/m at 6 km
EDC = DC1 – DC2
TLE Corte June 2008
5 10 15 20 25 30 35
1
2
3
4
5
6
7
8
9
10x 10
6
Fréquence [Hz]
ampl
itude
du c
ham
p
Intégration des FFT de chaque page des fichiers 4 à 12 (divion 15)
fichier4
fichier5fichier6
fichier7
fichier8
fichier9
fichier10fichier11
fichier12
Power (au)
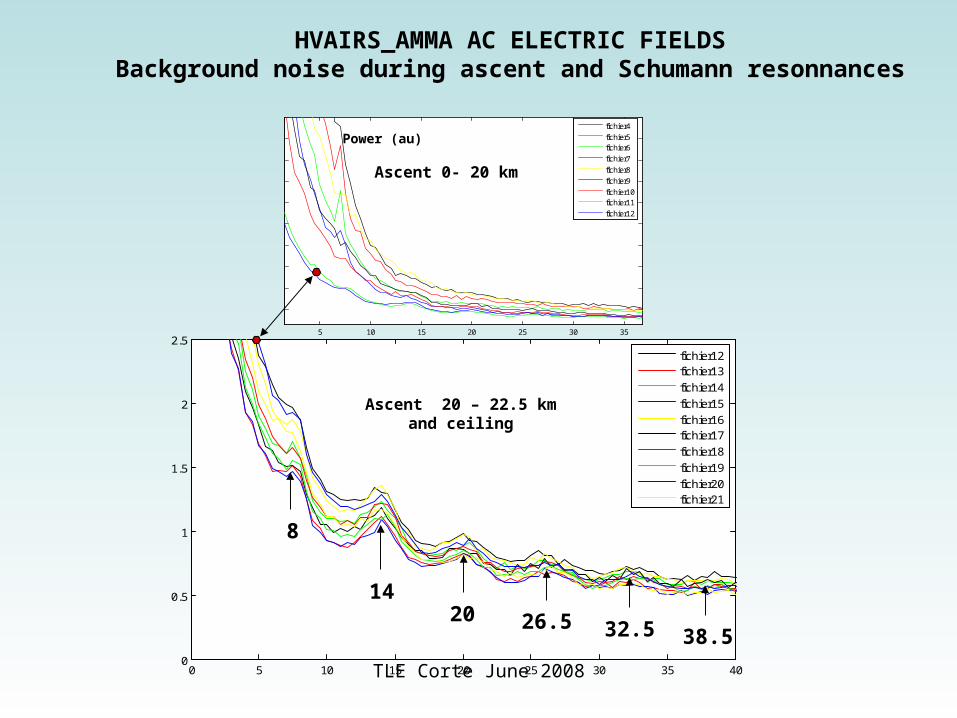
HVAIRS_AMMA AC ELECTRIC FIELDSBackground noise during ascent and Schumann resonnances
0 5 10 15 20 25 30 35 400
0.5
1
1.5
2
2.5x 10
6
Fréquence [Hz]
Am
plit
ude d
u c
ham
p
Intégration des fft de chaque page des fichiers 12 à 21 (division 15)
fichier12fichier13
fichier14
fichier15
fichier16fichier17
fichier18
fichier19
fichier20fichier21
Ascent 0- 20 km
Ascent 20 – 22.5 kmand ceiling
8
1420 26.5 32.5 38.5
TLE Corte June 2008
700 800 900 1000 1100 1200 1300 1400 1500 16000
5
10
15
20
25
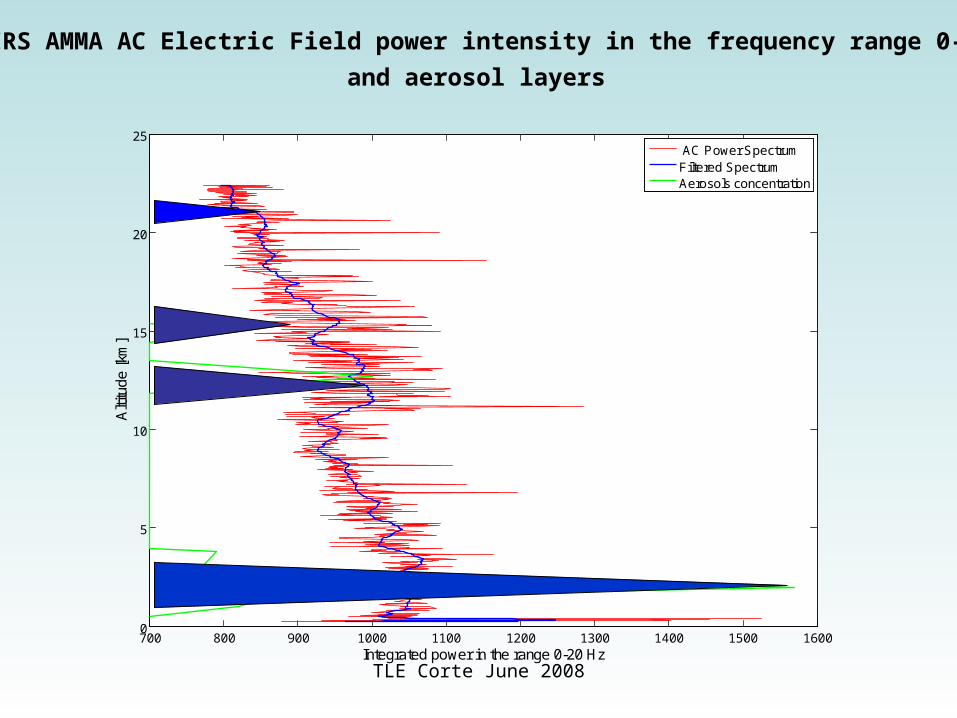
Integrated power in the range 0-20 Hz
Alti
tude
[km
]
AC Power SpectrumFiltered SpectrumAerosols concentration
HV-AIRS AMMA AC Electric Field power intensity in the frequency range 0-20Hz
and aerosol layers
TLE Corte June 2008
0 50 100 150 200 250 300 350-0.2
-0.15
-0.1
-0.05
0
0.05
0.1
0.15
0.2
Time [s]
AC
Fie
ld [V
m-1
]
File 8
0 50 100 150 200 250 300 350
15
20
25
T0=17:24:49 + Time [s]
DC
Fie
ld [V
m-1
]
0 50 100 150 200 250 300 35011.5
12
12.5
13
13.5
14
14.5
Alti
tude
[km
]
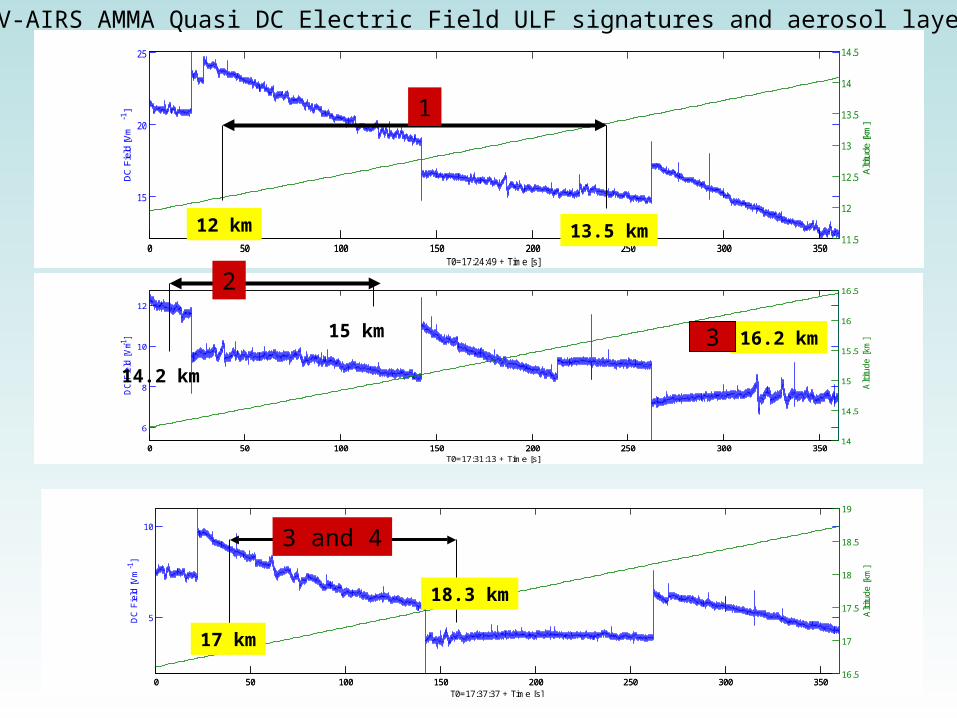
1
12 km 13.5 km0 50 100 150 200 250 300 350-0.2
-0.15
-0.1
-0.05
0
0.05
0.1
0.15
0.2
Time [s]
AC
Fie
ld [
Vm-1
]
File 9
0 50 100 150 200 250 300 350
6
8
10
12
T0=17:31:13 + Time [s]
DC
Fie
ld [
Vm-1
]
0 50 100 150 200 250 300 35014
14.5
15
15.5
16
16.5
Altitude [
km
]
14.2 km
15 km
0 50 100 150 200 250 300 350-0.2
-0.15
-0.1
-0.05
0
0.05
0.1
0.15
0.2
Time [s]
AC
Fie
ld [
Vm
-1]
File 10
0 50 100 150 200 250 300 350
5
10
T0=17:37:37 + Time [s]
DC
Fie
ld [
Vm
-1]
0 50 100 150 200 250 300 35016.5
17
17.5
18
18.5
19
Alti
tude
[km
]
2
17 km
18.3 km
16.2 km
3 and 4
3
HV-AIRS AMMA Quasi DC Electric Field ULF signatures and aerosol layers
TLE Corte June 2008
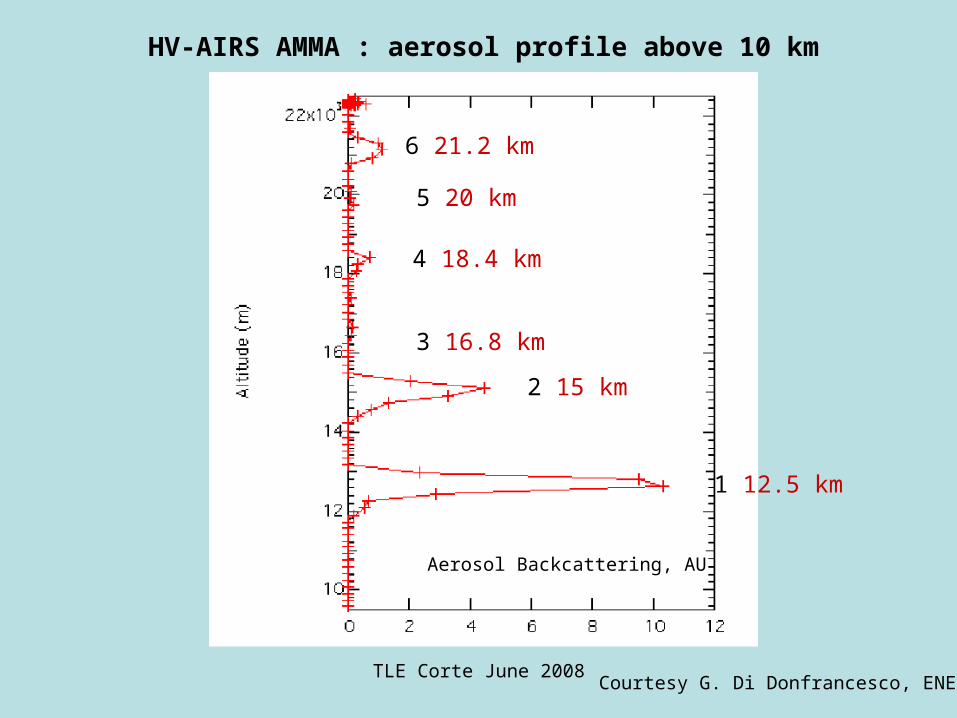
HV-AIRS AMMA : aerosol profile above 10 km
1 12.5 km
2 15 km
4 18.4 km
5 20 km
6 21.2 km
3 16.8 km
Courtesy G. Di Donfrancesco, ENEA
Aerosol Backcattering, AU
TLE Corte June 2008
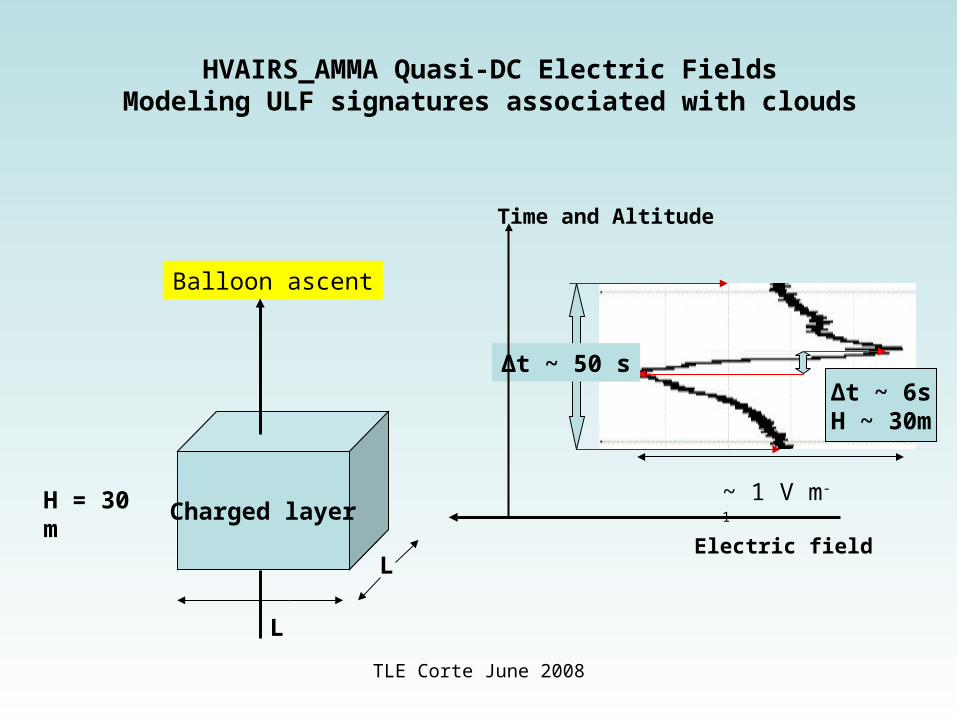
H = 30 m ~ 1 V m-1
HVAIRS_AMMA Quasi-DC Electric FieldsModeling ULF signatures associated with clouds
L
Balloon ascent
Δt ~ 50 s
Time and Altitude
Electric field
Δt ~ 6sH ~ 30m
Charged layer
L
TLE Corte June 2008
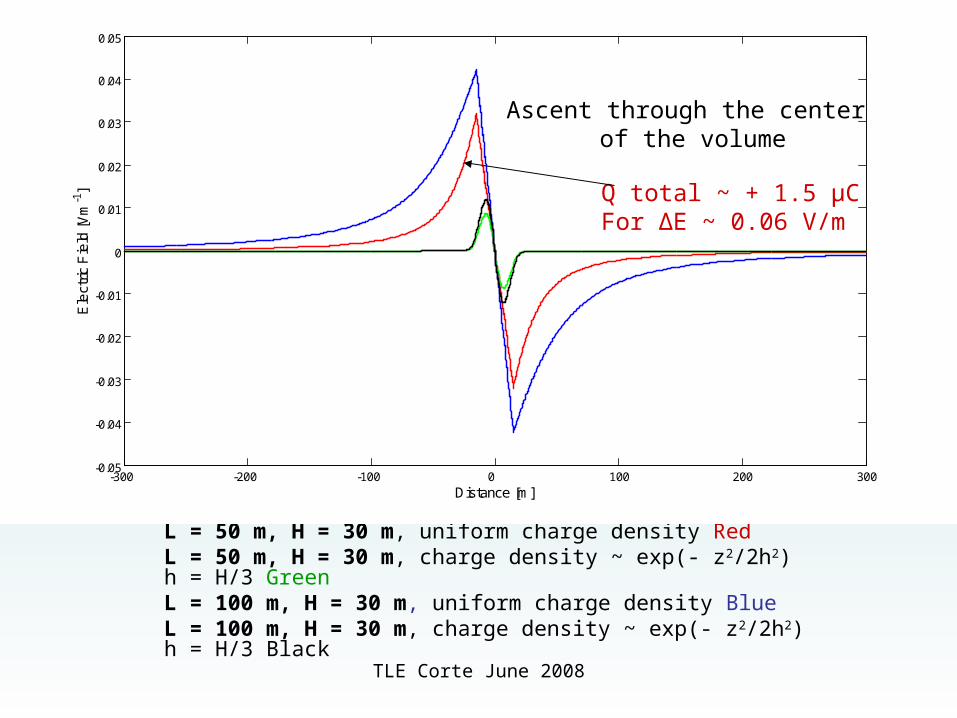
L = 50 m, H = 30 m, uniform charge density RedL = 50 m, H = 30 m, charge density ~ exp(- z2/2h2) h = H/3 Green L = 100 m, H = 30 m, uniform charge density Blue L = 100 m, H = 30 m, charge density ~ exp(- z2/2h2) h = H/3 Black
3002001000 -100 -200 -300 -0.05
-0.04
-0.03
-0.02
-0.01
0
0.01
0.02
0.03
0.04
0.05
Distance [m]
Ele
ctric
Fie
ld [V
m-1
]
Ascent through the center of the volume
Q total ~ + 1.5 µCFor ΔE ~ 0.06 V/m
TLE Corte June 2008
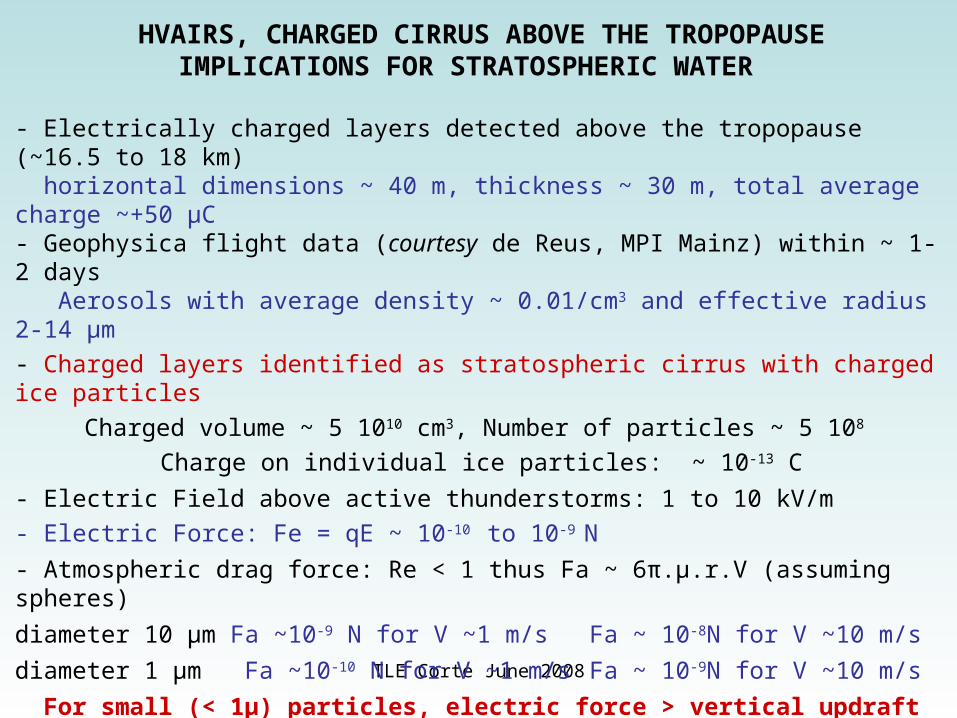
HVAIRS, CHARGED CIRRUS ABOVE THE TROPOPAUSEIMPLICATIONS FOR STRATOSPHERIC WATER
- Electrically charged layers detected above the tropopause (~16.5 to 18 km) horizontal dimensions ~ 40 m, thickness ~ 30 m, total average charge ~+50 µC- Geophysica flight data (courtesy de Reus, MPI Mainz) within ~ 1-2 days Aerosols with average density ~ 0.01/cm3 and effective radius 2-14 µm
- Charged layers identified as stratospheric cirrus with charged ice particles
Charged volume ~ 5 1010 cm3, Number of particles ~ 5 108
Charge on individual ice particles: ~ 10-13 C
- Electric Field above active thunderstorms: 1 to 10 kV/m
- Electric Force: Fe = qE ~ 10-10 to 10-9 N
- Atmospheric drag force: Re < 1 thus Fa ~ 6π.µ.r.V (assuming spheres)
diameter 10 µm Fa ~10-9 N for V ~1 m/s Fa ~ 10-8N for V ~10 m/s
diameter 1 µm Fa ~10-10 N for V ~1 m/s Fa ~ 10-9N for V ~10 m/s
For small (< 1µ) particles, electric force > vertical updraft force
Upward transport of water to stratosphere above thunderstorms
Atmospheric E-field as efficient as vertical winds for small ice particles
TLE Corte June 2008
6.9 6.95 7 7.05 7.1 7.15 7.2 7.25 7.3 7.35 7.40.9
1
1.1
1.2
1.3
1.4
1.5
1.6
DC
Fie
ld [
Vm
-1]
File:28 Pages:4-4
6.9 6.95 7 7.05 7.1 7.15 7.2 7.25 7.3 7.35 7.40
1
2
3
4
5
Time [s]
Ligh
tnin
g [1
]
precursors Continuing current
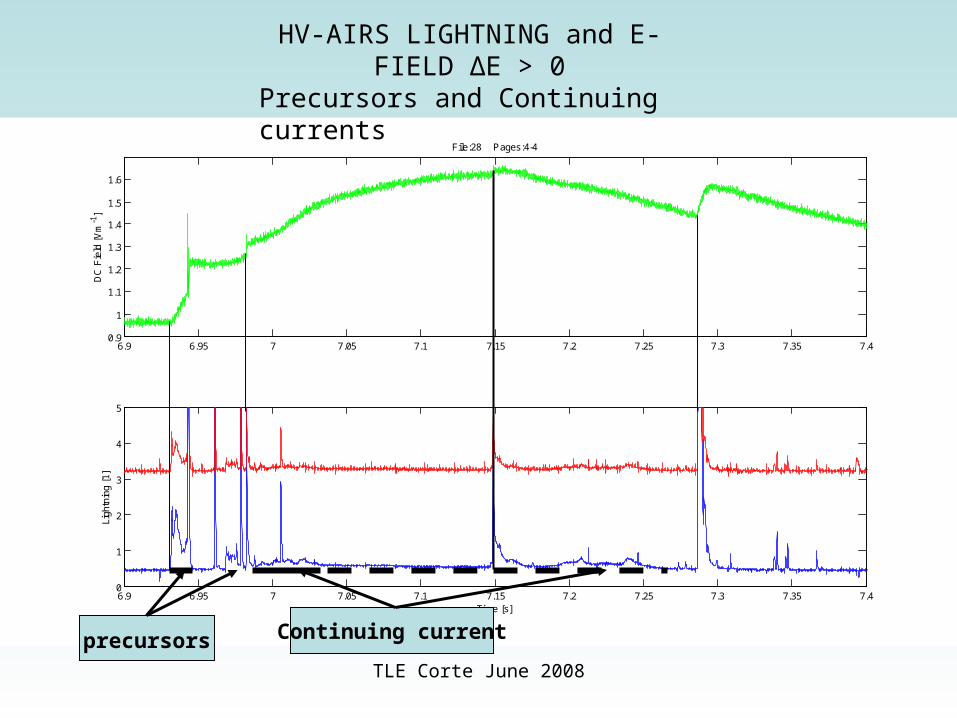
HV-AIRS LIGHTNING and E-FIELD ΔE > 0
Precursors and Continuing currents
TLE Corte June 2008
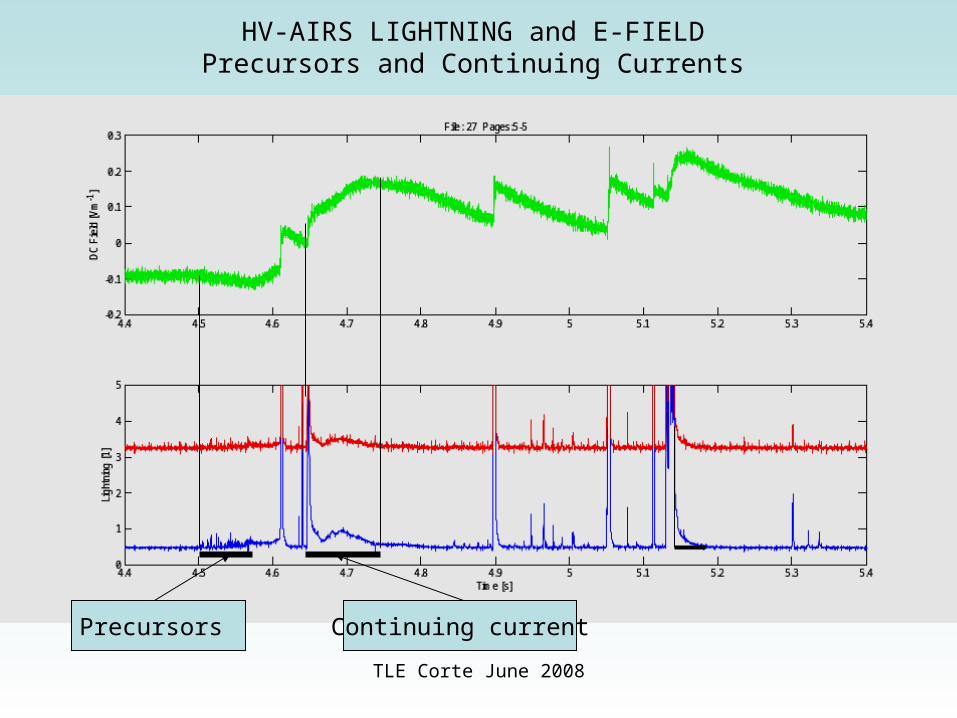
HV-AIRS LIGHTNING and E-FIELDPrecursors and Continuing Currents
Precursors Continuing current
TLE Corte June 2008
21 21.1 21.2 21.3 21.4 21.5 21.6 21.7 21.8 21.9 22
0.6
0.8
1
1.2
1.4
1.6
DC
Fie
ld [
Vm
-1]
File:29 Pages:2-2
21 21.1 21.2 21.3 21.4 21.5 21.6 21.7 21.8 21.9 220
1
2
3
4
5
Time [s]
Ligh
tnin
g [1
]
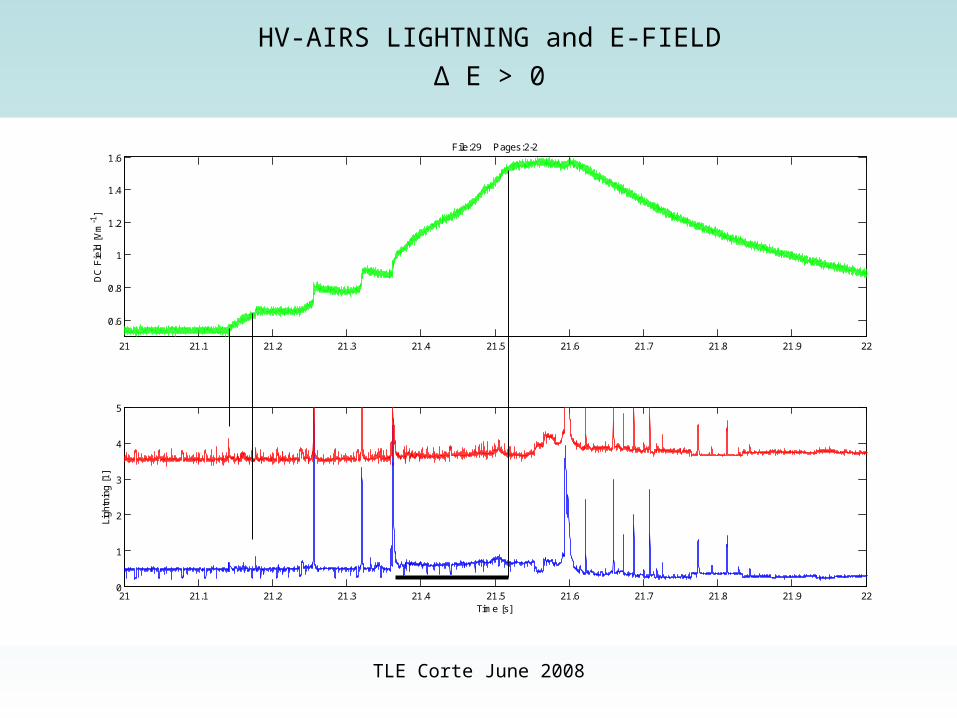
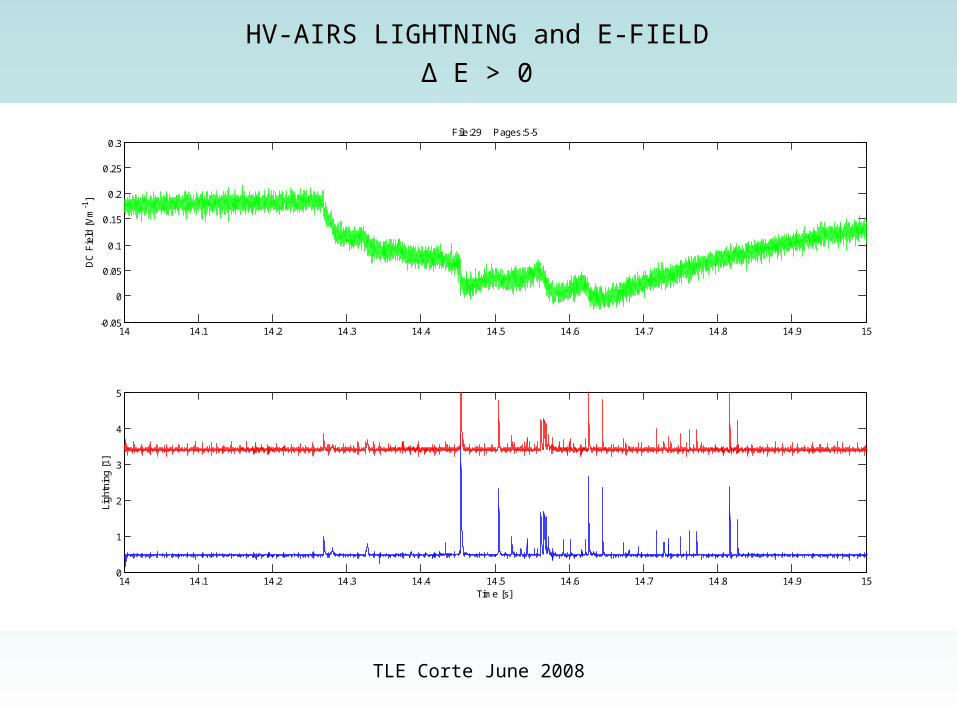
HV-AIRS LIGHTNING and E-FIELD
Δ E > 0
TLE Corte June 2008
14 14.1 14.2 14.3 14.4 14.5 14.6 14.7 14.8 14.9 15-0.05
0
0.05
0.1
0.15
0.2
0.25
0.3
DC
Fie
ld [
Vm
-1]
File:29 Pages:5-5
14 14.1 14.2 14.3 14.4 14.5 14.6 14.7 14.8 14.9 150
1
2
3
4
5
Time [s]
Ligh
tnin
g [1
]
HV-AIRS LIGHTNING and E-FIELD
Δ E > 0
TLE Corte June 2008
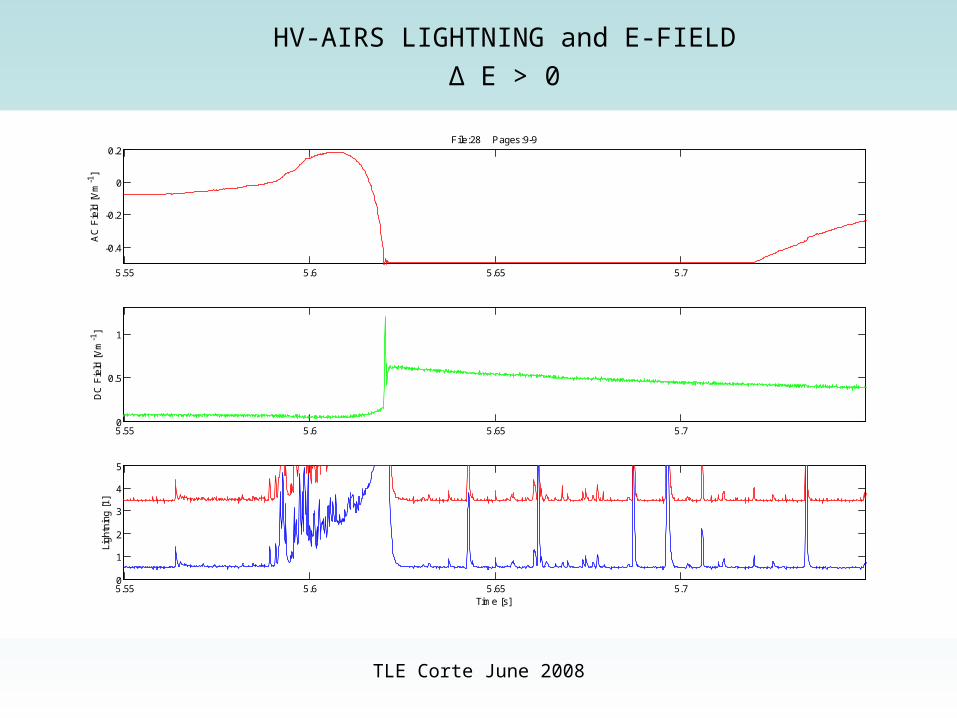
5.55 5.6 5.65 5.7
-0.4
-0.2
0
0.2
AC
Fie
ld [
Vm
-1]
File:28 Pages:9-9
5.55 5.6 5.65 5.70
0.5
1
DC
Fie
ld [
Vm
-1]
5.55 5.6 5.65 5.70
1
2
3
4
5
Time [s]
Ligh
tnin
g [1
]
HV-AIRS LIGHTNING and E-FIELD
Δ E > 0
TLE Corte June 2008
20 20.1 20.2 20.3 20.4 20.5 20.6 20.7 20.8 20.9 21-0.2
0
0.2
0.4
0.6
0.8
AC
Fie
ld [
Vm
-1]
File:25 Pages:7-7
20 20.1 20.2 20.3 20.4 20.5 20.6 20.7 20.8 20.9 210.8
0.9
1
1.1
DC
Fie
ld [
Vm
-1]
20 20.1 20.2 20.3 20.4 20.5 20.6 20.7 20.8 20.9 210
1
2
3
4
5
Time [s]
Lig
htn
ing [
1]
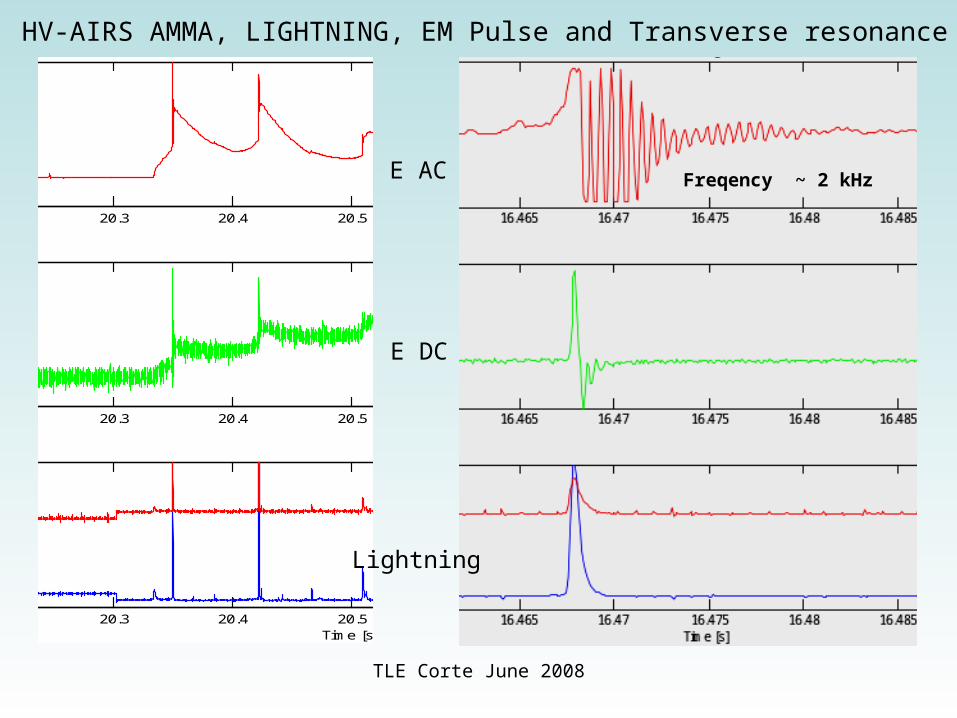
E AC
E DC
Lightning
HV-AIRS AMMA, LIGHTNING, EM Pulse and Transverse resonance
Freqency ~ 2 kHz
TLE Corte June 2008
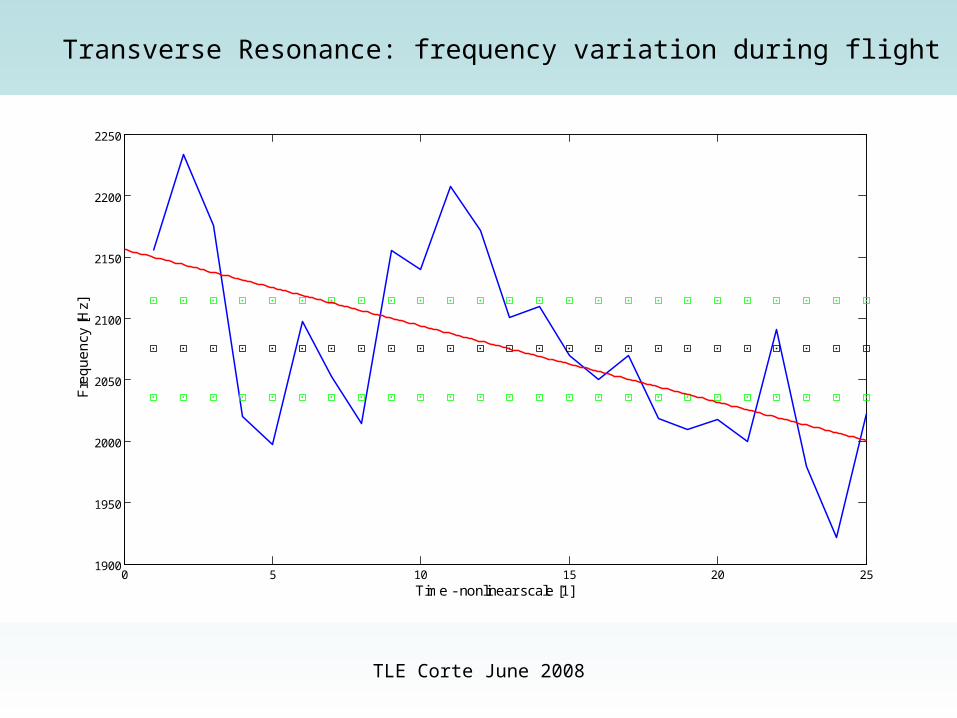
0 5 10 15 20 251900
1950
2000
2050
2100
2150
2200
2250
Time - nonlinear scale [1]
Fre
qu
en
cy [H
z]
Transverse Resonance: frequency variation during flight
TLE Corte June 2008
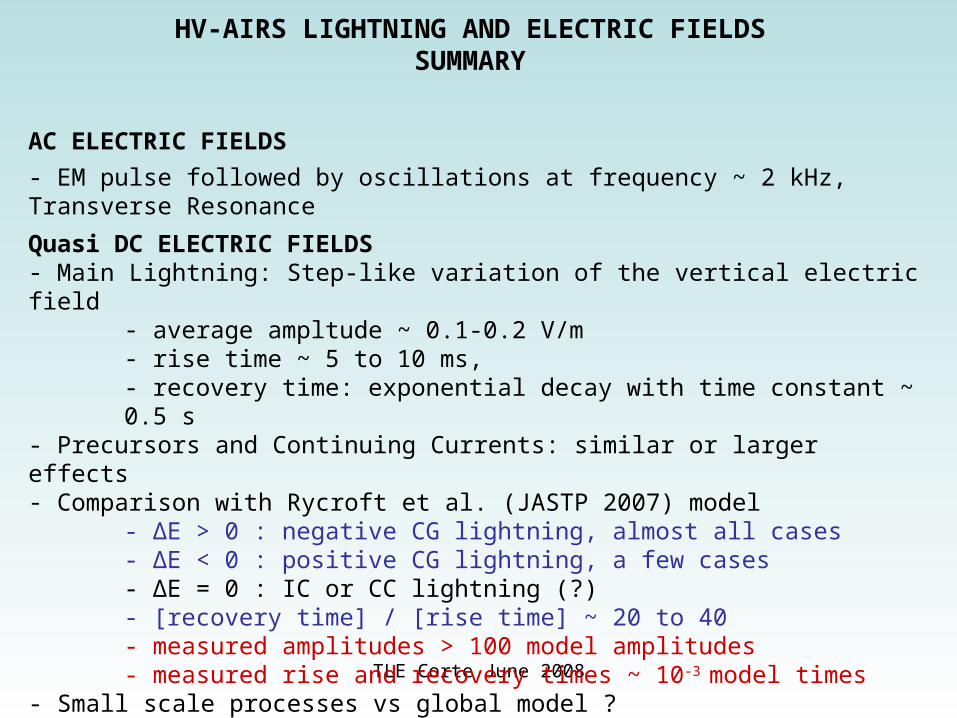
HV-AIRS LIGHTNING AND ELECTRIC FIELDSSUMMARY
AC ELECTRIC FIELDS
- EM pulse followed by oscillations at frequency ~ 2 kHz, Transverse Resonance
Quasi DC ELECTRIC FIELDS- Main Lightning: Step-like variation of the vertical electric field
- average ampltude ~ 0.1-0.2 V/m- rise time ~ 5 to 10 ms,- recovery time: exponential decay with time constant ~ 0.5 s
- Precursors and Continuing Currents: similar or larger effects- Comparison with Rycroft et al. (JASTP 2007) model
- ΔE > 0 : negative CG lightning, almost all cases- ΔE < 0 : positive CG lightning, a few cases- ΔE = 0 : IC or CC lightning (?)- [recovery time] / [rise time] ~ 20 to 40- measured amplitudes > 100 model amplitudes- measured rise and recovery times ~ 10-3 model times
- Small scale processes vs global model ?- Resistive Ionosphere?
TLE Corte June 2008
END