Embed Size (px)
Citation preview
IIIIIIIIIII
Technical Report
An Assessment Of The Microtek*1 ToxicityTM
Analyzer As A Screening Test For Acitvated Sludge
Wastewater Treatment Plant Influents
Michael J. McGrath
Research Assistant
I Michael S. Svitzenbaui
Associate Professor of Civil E igineering
IIIllll

IIIIIIIIIIIIIIIIIII
No/ember 1988Env. Eng. Report No. 104-88-3
Technical Report
TMAn Assessment of the MicroLox Tox..city Analyze-1
as a Screening Test for Activated Sludge WastewaterTreatment Plant, Influent,s
by
Michael J. McGrathResearch Assistant
and
Micaael S. SwLtzenbaunAssociate Professor of Civil Ergineering
Environmental Engineering ProgramDepartment of Civil Engineering
University of MassachusettsArnherst, MA 01003
Submitted (;o the
Commonwealth of M issachusettsDepartment of En-rironmentai Quality Engineering
Division or Water Pollution ControlDaniel Greenbaum, CommissionerThomas C. McMahon, Director

IIII
111
ACKNOWLEDGEMENTS
The authors wish to thank Daniel Wagner and the rest of the
™ Environmental Engineering Program for their help and guidance. We are
• also greatful to the Massachusetts Division of Water Polluton Control for
funding this research.
IIlIIlIllllll

III
IV
ABSTRACT
• Many municipal activated sludge wastewater treatment systems must treat
industrial discharges as well as domestic sewage and therefore have the
I potential problem of dealing with toxic pollutants which can inhibit and
• upset biological treatment systems. Monitoring influent waste streams
becomes an important aspect of treatment plant operations where toxicity is
I a problem, but specific chemical analyses are a costly process. A more cost
effective alternative to chemical species identification is acute toxicity
• testing.
This report discusses an examination of some toxicity tests proposed to
| screen activated sludge wastewater treatment plant influents. The
TM• Microtox t BOD inhibition, and short term oxygen uptake tests were
conducted on synthet-ic wastewaters containing a toxicant. Four categories
• of toxicants were tested: heavy metals, solvents, pesticides, and refractory
TMorganics. The Microtox test was the most sensitive. It was followed in
rp i*
sensitivity by the BOD inhibition test. The sensitivity of the MicrotoxI• test to toxicants was compared to the sensitivity of acitvated sludge to
TM_ toxicants by comparing reported literature values. Microtox was equall;
™ or more sensitive to 83% of the chemical compounds. Wastewater treatment
I TMplant operators owning Microtox were surveyed. They described I he
TM_ Microtox test as rapid, easy to conduct, easy to maintain, and
™ inexpensive. It was used at all the surveyed sites as a screening test,
• usually in a battery approach with other toxixity tests.
iI

IIIIIIIIIIIIIIIIIII
TABLE OF CONTENTS
ACKNOWLEDGEMENTS ........................ i i i
ABSTRACT ..................................................... - ..... iv
LIST OF TABLES ......................... vii
LIST OF FIGURES ........................ viii
1. INTRODUCTION ........................ 1
2. BACKGROUND ......................... 3
Toxicity testing . .................... 3Dehydrogenase Activity .................. 6ATP Activity ... .................... 7
TMMicrotox ........................ 9Respirometry ....................... 10
BOD ......................... 11Respirometers .................... 12Sludge Respiration .................. 12
3. EXPERIMENTAL METHODS .................... 14
Literature ReviewComparison of Toxicity Screening Tests ........ 14Comparison of Toxic Sensitivity of Activated Sludge
TMand Microtox ................. 14Laboratory Comparison of Toxicity Screening Tests . . . . 16
TMMicrotox ...................... 16Fill and Drav Reactor ................ 18BOD, Inhibition ................... 20Sluage Respiration .................. 21
TMSurvey of Wastewater Treatment Plants Using Microtox . . 22
4. RESULTS AND DISCUSSION .................. 24
Literature Review .................... 24Comparison of Toxicity Screening Tesls ........ 24Comparison of Toxic Sensitivity of Activated Sludge
TMand Microtox ................. 26Laboratory Comparison of Toxicity Screening Tests . . . . 28
TMMicrotox ...................... 29
Inhibition ... ................. 29Sluage Respiration . ................. 36

VI
Summary Discussion 38
TMSurvey of Vastevater Treatment Plants Using Microtox . . 38
5. CONCLUSIONS AND RECOMMENDATIONS 42Conclusions 42Recommendations 43
REFERENCES 44
APPENDIX A A-l
APPENDIX B B-l

111111
1
1111111
vii
LIST OF TABLES
Table
1. List of Toxicants
2. Feed Solution for Fill and Draw Reactor
3. Literature Comparison of Proposed Toxicity Screening Tests
A. Listing of Chemical Compounds by Reported Toxicity toTM
TM
6. Comparison of Literature Activated Sludge InhibitoryConcentrations with Laboratory Micro tox ToxicityConcentrations using Different Test Modifications . . . .
7. Comparison of Laboratory Results for Three ToxicityScreening Tests
Page
17
19
25
28
34
35
37

IIIII
LIST OF FIGURES
I
VI 11
IFigure
1. The Respiratory Chain 7
TM2. Microtox Results for Heavy Metals 30
I . . . . . .TM
TM4. Microtox Results for Pesticides 32
TM5. Microtox Results for Priority Pollutants 33
3. Microtox Results for Organic Solvents 31
IIIIIiIIIIl
IIIII
IIII
CHAPTER 1
INTRODUCTION
Over 5,500 activated sludge wastewater treatment plants exist in
the United States (USEPA 1982). One reason for the popularity of this
I treatment process is its relatively low land requirement. It is an
economically attractive alternative in urban areas, where land
I availability is limited. Urbanly located activated sludge treatment
plants must often treat industrial discharges as veil as domestic sewage
I (Kurz e_t al. 1984, Slattery et al. 1985). As would be expected, many
• priority pollutants are found in publicly-owned wastewater treatment
" works (POTW's) (Burns and Roe Industrial Services Corp. 1982). Toxic
• pollutants can inhibit and upset biological treatment of wastewater.
Upsets ol vastewater treatment plants are a source of concern both in
I the U.S. and abroad (Russell 1983, Murakami 19BO, Green 1975).
Pretreatment regulations are a means of preventing the introduction
| of pollutants in toxic concentrations. Federal pretreatment regulations
— as stated in 40 CFR 403 are enforced by monitoring specified quantities
• or concentrations of pollutants or pollutant properties according to
• industrial subcategory. Specific chemical analysis of wastewater is a
costly process (Chapman et al. 1981, Alleman 1986). A more cost
effective alternative to chemical species identification is acute
toxicity testing (Szal 1985). Used as screening tests, acute toxicity

i
i
ii
TMMicrotox Toxicity Analyzer made by Hicrobics Corporation of Carlsbad,
TMCalifornia. Microtox measures toxicity by reduction in light output
II•I tests can eliminate non-inhibitory wastewater sources from further
testing.
One analysis proposed as an influent toxicity screening test is the
I• of bioluminescent bacteria f;xposed to potential toxicants-
The objective of this research was to evaluate the appropriateness
I TMof the Microtox Toxicity Analyzer as an influent toxicity screening
test for activated sludge wastevater treatment. This project assessed
I TMthe use of Microtox as an influent toxicity .screening test using
_ published vorks, laboratory experiments, and wastewater treatment plant
^ - questionnaires. Work progressed in the follow:.ng stages:
• TM1) Discuss and compare Microtox and other proposed influent
• toxicity screening tests using the aforementioned criteria and
publications
I T!12) Compare the sensitivity of Microtox and activated sludge to
toxicants using reported toxic concertrations of chemical
• compounds.
3) Conduct laboratory experiments to con pare the toxic
TMsensitivity of Microtox with two other toxicity tests
I (BOD inhibition and sludge respiration inhibition).
TM4) Investigate field use of Hiccotox through a questionnaire
I TMsent to wastevater treatment plant operators using Mic:otox .
i

IIIIIIIIIIIIIIIIIII
CHAPTER 2
BACKGROUND
Toxicity Testing
Specific chemical analysis, in combination with model;; can provide
more complete insight into such things as chemical reactivity,
biological availability, physiological and toxicological effects (Stumm
and Morgan 1981), but has the following disadvantages (Szal 1985):
1) There is a lack of criteria for all bu; the most commontoxicants.
2) Synergistic and/or antagonistic interactions of con pounds in acomplex vaste cannot be accounted for,
3) Site specifics of receiving waters (pH.hardness) cannot beincorporated into most chemical evaluations.
4) Chemical approach relies on the previous identification of toxiccomponents of a waste.
Toxicity tests are the measurement of a test substance which
produces a quantifiable poisonous effect on a test organism. Though
toxicity tests do not provide information about the mechanisms
associated with the fate of pollutants; toxicity tests do provide a
prediction of the effects of toxicants on organisms. There are a large
number of toxicity tests which use different combinations o>T effects on
organisms. The tests can be classified into tWD groups: acute tests

which measure short term effects like death; and chronic tests, which
measure long term effects such as cancerous growths.
| Aquatic toxicity testing is traditionally done by freshwater
_ organism bioassay. Test organisms such as Pimephales promelas (fathead•• minnows) or Daphnia (water fleas) aie exposed lo the toxicants for a 24
• to 96 hour test period. The number of dead organisms are counted and
the results are presented as an LCM)F the concentration which is lethal
I to 50% of the test organisms. Fish bioassays cost $100-500+ dollars to
run (Alleman 1986, Branson et al. 1981) and require trained personnel.
I Bioassays are sensitive and often specified as toxicity tests in
discharge permits (Peltier and Weber 1980).
I The high cost of fish bioassays is one reason why tier testing of
• toxicity has been proposed (Builema et al* 1982, Brandes et al. 1984).
The first round of tests would include inexpensive toxicity tests and
• simple chemical analysis. The next round of tests, if required, would
be more complicated and costly. With rapid turn around time and better
• allocation of laboratory resources (Kurz 1984) the tier approach offers
less expense and more compliance (Branson et al. 1981). In pretreatment
• monitoring of industrial discharges to wastewater treatment plants, the
• first round toxicity test (the screening test) is an inexpensive,
relatively crude test used to pretest discharge samples to determine
I whether more costly fish bioassays are required. An appropriate
screening test for wastewater influent of industrial discharges would
IIII

IIIIIIIIIIIIIIIIIII
have the following characteristics:
1. Inexpensive,2. Rapid,3. Operationally simple,4. Reproducible,5. Reliable (few false alarms), and6. Sensitive
These characteristics will be used later in this project as the
basis of comparison of various toxicity screening tests. Tests should
cost less than $50 per test and should have a turn around time of less
than 3 hours. The tests should be operationally simple enough that they
do not require specially trained personnel. The tests must be
reproducible for results to be meaningful. Correlation to the treatment
works is provided by tests which are both reliable and sensitive.
Reliable tests do not show toxicity for noninhibitory wastes and
sensitive tests do show toxicity for inhibitory wastes.
Numerous tests have been proposed as toxicity screening tests for
wastewater influent. Many are adapted either from aquatic toxicology or
sanitary engineering process control. Some proposed tests include:
bioassays on Lumbricillus rivalis (worms), Tetrahymena pyriformis
(protozoa), and Zoogloea ramigera or N:Ltrobacter (bacteria); assessment
of Spirillum volutans bacteria movement or Photobacterium phosphoreum
light output; and measurement of dehydrogenase, ATP, respiration, and
glucose activities of activated sludge (Green et. al. 1974, Slabbert and
Morgan 1982, Norberg and Molln 1983, Williamson and Johnson 1981,
McElroy 1983, Bulich 1982, kenhard 1964, Patterson et al. 1969, Arthur

II• 1984, Olah and Princz 1986). The toxicity tests discussed in this study
are: dehydrogenase activity, ATP activity, Microtox, and respirometry.
II
I
III
Dehydrogenase Activity
Dehydrogenase enzymes are intracellar enzymes which mediate
reactions between electron donors and acceptors during the oxidation of
• substrate. Measurement of the enzyme activity is measurement of the
metabolic activity of the cell itself. In the presence of readily
I degradable substrate, cell activity is high; in the presence of an
inhibiting toxicant, cell activity is low.
Reduced nicotinamide adenine dinucleotide (NADH) is oxidized by a
dehydrogenase, forming reduced flavin adenine dinucleotide (FADH ) from
FAD at the start of the electron transport chain which is shown in
Figure 1 (Lehninger 1982).
Note that the FADH,, can be linked with an electron acceptor instead
of ubiquinone (coenzyme Q). The dehydrogenase activity test uses a
I reducible dye as an electron acceptor. Reduced dye concentration is a
measure of the dehydrogenase activity. Some proposed dyes include 2-
• (£-iodophenyl)-3-(p-nitrophenyl)-5-phenyltetra2olium chloride (INT),
2,3,5 triphenyltetrazolium chloride (TTC), and methylene blue (MBRR).
• The advantages of the various dyes are described elswhere (Patterson et
• al. 1969, Jorgensen 1984, Lopez et al. 1986). A spectrophotometer is
used to measure the amount of reduced dye present. Some substances,
such as metal ions, sulfides, humic substances, hydrogen peroxide can

oxidize the reduced dye, interfering with the test (Lopez ej^ al. 1986).
Temperature, pH and oxygen concentration may affect the test results
(Lenhard et al. 1964, Lopez et al. 1986).
Dehydrogenase activity measurement has been advocated for use as an
influent screening test (Lenhard et al. 1964, Ryssov-Nielsen 1975).
Using a spectrophotometer, it produces rapid, measurable responses and
easily intcrpretable results. The equipment and materials are fairly
inexpensive and easy to maintain.
ATP Activity
" Adenosine triphosphate (ATP) is an important compound in all cells.
• It transfers energy needed for cell synthesis and maintenance from
substrate. ATP is synthesized by substrate level phosphorylation and
• oxidative phosphorylation during electron trani'er in the respiration
chain as shown earlier (See Figure 1). Measurement of the ATP pool is a
• measurement of the number of viable cells and the activity of the cells
(Patterson e_t al. 1970).
• The test is conducted by first extracting ATP from activated sludge
• exposed to test material. Next, luciferin and luciferase enzyme are
added to the ATP extraction. Finally, the resulting light output is
I measured after a specified time in a photometer.
In the presence of substrate, the ATP pool increases rapidly
I (Brezonik and Patterson 1971). In the presence of a toxicant, the ATP
IIl

FIG. 1: THE RESPIRATORY CHAIN
COATP
NADH FHN
ANAD FMNH
ATP TTC(COLORLESS)
UBI-
QUINONE
QUINONE
2Fe3 +
CYTOCHROMEb
\2Fe
2 +
2F8
\/CYTOCHROME
2Fa
2Fe3 +
CYTOCHROMEc1
2Fe2 +
2Fe
2Cu
2 +
\
CYTOCHROMEaa
/\2Fe
2Cu
H O2
ATP
TF(RED)
WHERE: NAD 15 NICOTINAMIDE ADENINE DINUCLEOTIDEFMN IS FLAVIN MONONUCLEOTIDETCC IS TRIPHENYLTETRA2OLIUM CHLORIDE DYETF IS TRIPHENYL FORMAZAN

_
™
III
III
.pool decreases. This is caused by either efforts to maintain
homeostasis, or reduction in viable cell mass (Patterson et al. 1969).
Because ATP concentration increases after substrate addition, it is
difficult to measure ATP pool decreases marking the presence of
inhibitory substances in the test material. It is necessary to measure
response to toxicants during endogenous phase of cells and without•
substrate addition (Parker 1982), which is difficult in the case of
• vastewater because of its variability. Schneider (1987) observed this
in an activated sludge pilot plant.
| The ATP test is inexpensive after the initial investment and it is
rapid. Automation may make it easy to perform (Picciolo et al. 1981).
H Results are reproducible and appropriate for screening wastewater
toxicity (Brezonik and Patterson 1971).
TMMicrotox
TMThe Microtox test consists of measuring the change in light
• output of the luminescent bacteria Photobacterimn phpsphoreum when
exposed to a toxicant. The test uses constant temperature cooling
I wells, lyophized test organisms, and prepared osmotic adjustment,
dilutent and reconstituion solutions in order to insure reproducible
I results (Beckman 1982). Results are generally presented as the 5EC50
• concentration (i.e., concentration which caused 50% light diminution
after exposure of 5 minutes).

III TM
Microtox has been proposed for a variety of uses including
_ landfill leachate toxicity, tracking and pinpointing sources of
• industrial toxic sources, toxic levels of oil and gas drilling fluids,
• and quality control for package foods and medicines (Bulich and Isenberg
1981). Many researchers have proposed it as an influent screening test
• for vastewater treatment plants (Bulich and Isenberg 1981, Casseri et
al. 1983, Dutka and Kwan 1983, Slattery 1983, Kur2 ej: al. 1984).
I The test is easy to run. It costs approximately $10-$50 per test
(Alleman 1986, Sheehan et: al. 1983, Kurz e^ al. 1984). It produces
• rapid results and is reproducible (Bulich et a_l. 1981, Atkinson 1987).
Respirometry
IRespirometers make use of the stoichiometry of aerobic conversion
I of organic matter (Metcalf & Eddy 1979):
• Organic + 02 + bacteria -> CO,, + NH« + nev + H?0 + energy (1)
matter cells
Oxygen is the terminal electron acceptor in the electron transport
I chain. A measurement of the oxygen used is a measurement of the amount
of substrate consumed. Thus, oxygen consumption measures the
• degradability of the substrate or the health of the microorganisms.
• Respirometry test results are presented as either the total amount of
oxygen consumed, the rate of oxygen consumed (oxygen uptake rate), or
iii
10
11
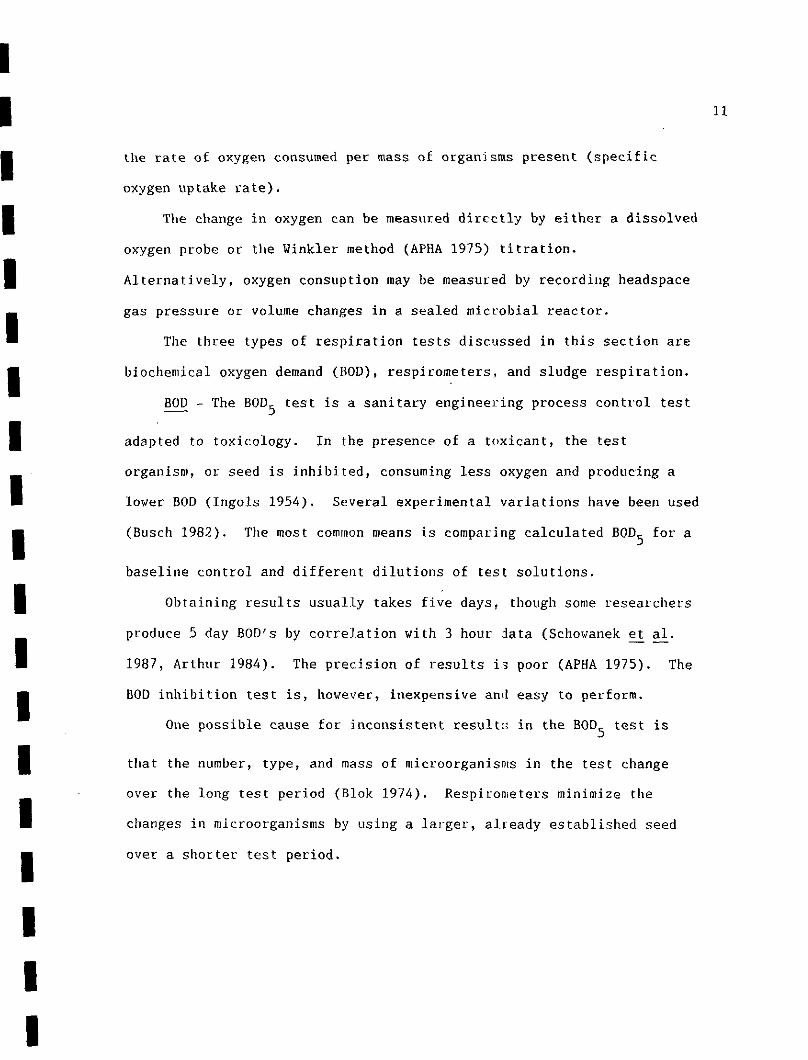
the rate of oxygen consumed per mass of organisms present (specific
oxygen uptake rate).
The change in oxygen can be measured directly by either a dissolved
oxygen probe or the Winkler method (APHA 1975) titration.
Alternatively, oxygen consuption may be measured by recording headspace
gas pressure or volume changes in a sealed microbial reactor.
The three types of respiration tests discussed in this section are
biochemical oxygen demand (BOD), respirometers, and sludge respiration.
BOP - The BOD^ test is a sanitary engineering process control test
adapted to toxicology. In the presence of a toxicant, the test
organism, or seed is inhibited, consuming less oxygen and producing a
lover BOD (Ingols 1954). Several experimental variations have been used
(Busch 1982). The most common means is comparing calculated BOD^ for a
baseline control and different dilutions of test solutions.
Obtaining results usually takes five days, though some researchers
produce 5 day BOD's by correlation with 3 hour data (Schovanek et al.
1987, Arthur 1984). The precision of results i,3 poor (APHA 1975). The
BOD inhibition test is, however, inexpensive and easy to perform.
One possible cause for inconsistent result;; in the BOD,, test is
that the number, type, and mass of microorganisms in the test change
over the long test period (Blok 1974). Respirometers minimize the
changes in microorganisms by using a larger, already established seed
over a shorter test period.

12
Respirometers - Many different varieties of respirometers exist.
Some use organisms in suspended growth (Arthur 1984) or fixed film
(Shieh and Yee 1985). Some measure headspace pressure or volume change,
while others measure dissolved oxygen change (Montgomery 1967).
Respirometers run as batch reactors (Spanjers and Klapwijk. 1987), plug
flow reactors (Reeves 1976), or continously stirred tank reactors with
recycle (Pagga and Gunthner 1981). Some respirometers reported in
literature include: Simcar Respirometer (Abson et al. 1967), Robertshaw
Respirometer (Reeves 1976), Sapormat (Blok 197ft), Biomonitor (Clark, et
al. 1977), Toximeter (Pagga and Gunthner 1981). Arthur Techline (Arthur
1984), Toxigard (Roesler 1986), and WAZU Respiration Meter (Spanjers and
Klapwijk 1987).
Inhibition is calculated by comparing the oxygen uptake rate of a
biomass at endogenous respiration rate as baseline to the oxygen uptake
rate of a biomass feeding 'on the test substance. Some researchers use a
biomass in high growth phase as the baseline in order to better
differentiate between a nonbiodegradable substance and an inhibitory
substance (Arthur 1984, Slattery 1985).
Respirometers require trained technicians because of difficulty in
operating and obtaining results (Williamson and Johnson 1981, Patterson
e_t al. 1969). The tests are rapid. They can be insensitive if seed is
acclimitized or previously upset (Pagga and Gunthner 1981).
Respirometers are relatively inexpensive to run (Parker 1982).
Sludge Respiration - The standard sludge respiration test method
attempts to eliminate some of the variability of respiration tests

13
(Pointer 1986). It is a bntch test in which n standard amount of:
standard synthetic sewage js spiked with different concentrations of
| test substance and added to aerated standard prepared sludge. Oxygen
uptake rate is measured after 30 minutes and after 3 hours. The EC50 is
• the concentration which causes 50% inhibition of respiration activity.
• The standard sludge respiration test is considered reproducible
(King and Painter 1986), sensitive (Dutka et al. 1983), inexpensive,
I simple and rapid.
IIIIIIIIIIII

H
CHAPTER 3
EXPERIMENTAL METHODS
Literature Review
The objectives of the literature review were twofold. First, the
literature review provided information necessary to compare proposed
toxicity screening tests using the previosly established criteria.
Second, the literature review provided data necessary to compare
relative toxicities of chemical compounds to activated sludge and
TMMicrotox
Comparison of Toxicity Screening Tests - This project first
compared the toxicity tests outlined in the previous chapter using the
screening test criteria. Published articles provided opinions on the
characteristics of the different tests. The results, recognized as
secondary sources, yielded the "yes" or "no" answers to the questions
posed by the criteria. The results of this work are presented in Table
3.
TMComparison of Toxic Sensitivity of Activated Sludge and Microtox
Published reports also gave information used to better assess whether
TMMicrotox is sensitive enough to measure inhibitory influents. The
project compared reported concentrations of chemical compounds which
TMwere toxic to both the activated sludge process and Microtox . The

IIIIIIIIIIIIIIIIIII
15
comparison used the activated sludge threshold of inhibition
TMconcentration and the Microtox 5EC50 concentration.
Researchers report a wide range of activated sludge inhibition
threshold concentrations. One reason is that several factors cause
activated sludge toxic inhibition to vary from plant to plant and within
plant including: temperature, pH, substrate concentration, and presence
of complexing agents in the plant influent; age, concentration,
population distribution, and previous exposure history of the plant
biomass (Schneider 1987). Another reason for the vide range is that
different researchers were looking at the toxicity to different aspects
of the activated sludge process, such as carbonaceous material removal,
nitrification, and subsequent anaerobic digestion of waste activated
sludge (Russell et al. 1982).
TMResearchers also report a vide range of Microtox 5EC50's. Though
reproducibility within laboratories has been good, reproducibility
between laboratories has not been good (Dutka <vt al. 1983). Ansar
Qureshi et al. (1987) is currently investigating this.
This project presented two comparisons of the toxic sensitivity of
TMactivated sludge and Microtox . First, chemical compounds were listed
according to the categories: l)chemicals more loxic to activated sludge
T*M 'Plufthan Microtox ; 2)chemicals more toxic to Miciotox than activated
sludge; and 3)chemicals equally toxic to both activated sludge and
TMMicrotox . Second, the activated sludge inhibiting concentrations were
TMgraphed against the lowest reported Microtox 5EC50 concentrations.

16
TMLaboratory Comparison of Microtox , BOD,., and Sludge Respiration Tests
TMMicrotox , BODf. inhibition, and sludge respiration experiments
were conducted on chemical compounds of pollutant classifications found
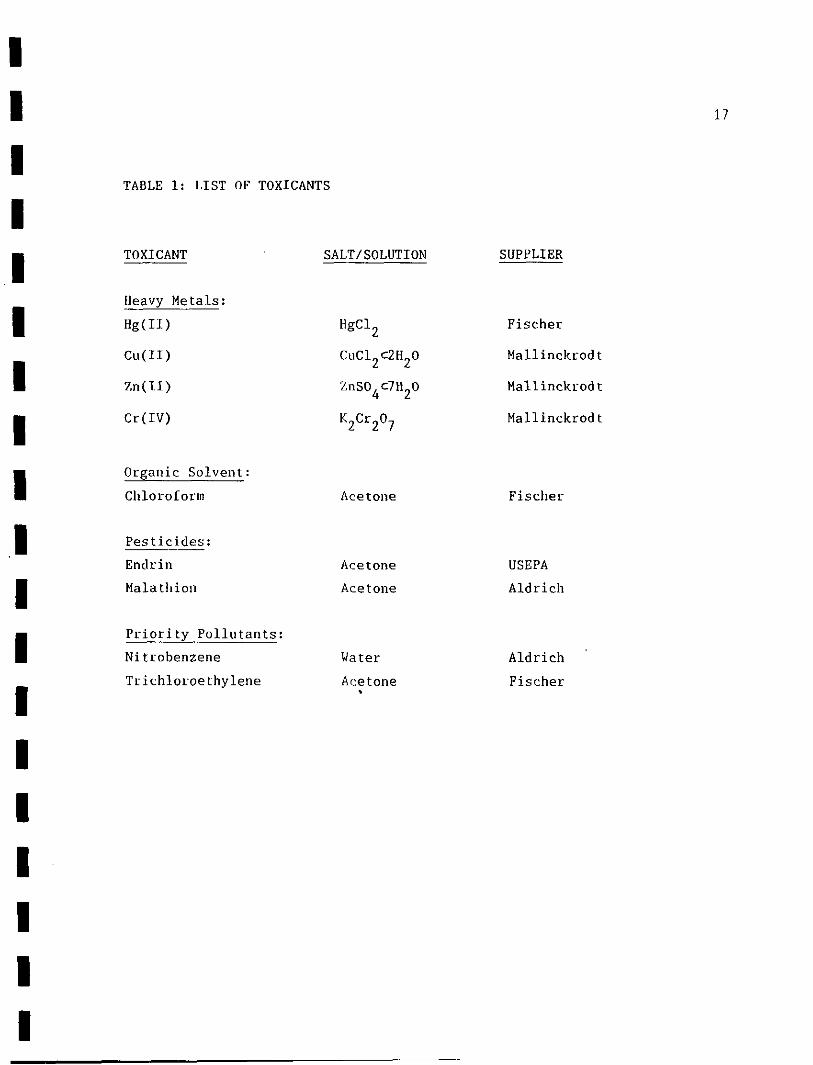
in municipal wastevater. Table 1 lists the chemical compounds. Each
experiment was run using the Beckman (1983) reported 5EC50
concentrations in each test. The results provided a comparison of the
the relative sensitivity of the three tests.
TM TMMicrotox - The Microtox experiments were run according to the
TMstandard procedure outlined in the Beckman Microtox System Operating
Manual (1982). Test samples vere prepared with distilled water and
TMosmotically adjusted using the Microtox Osmotic Adjusting Solution
(MOAS). Sample dilutions were prepared by the 2:1 serial dilution
method. Freeze-dried bacteria were reconstituted and equilibrated for
15 minutes before addition to the test cuvettes for another 20 minutes
of equilibration. Initial light output was recorded on the strip chart
| before transfering test samples to test cuvettes. Light output was
_ measured again 5 and 15 minutes after the introduction of the toxicant.
^ If the initial light output readings of any test cuvettes was not
• between 80 and 100, or if the two blank ratios differed by more than
0.02, then that test was aborted.
I Results were presented in a graphical form by plotting log
IIII
16
IIIIIIIIIIIIIIIIIII
TABLE 1: LIST OF TOXICANTS
TOXICANT
Heavy Metals:
Hg(II)
Cu(II)
7,n(T.I)
Cr(IV)
0rganic Solvent:
Chloroform
Pesticides:
Endrin
Malathion
Priority Pollutants
Nitrobenzene
Trichloroelhylene
SALT/SOLUTION
HgCl,
Acetone
Acetone
Acetone
Water
Acetone
SUPPLIER
Fischer
Mallinckrodt
Mallinckrodt
Mallinckrodt
Fischer
USEPA
Aidrich
Aldrich
Fischer
17
18
II
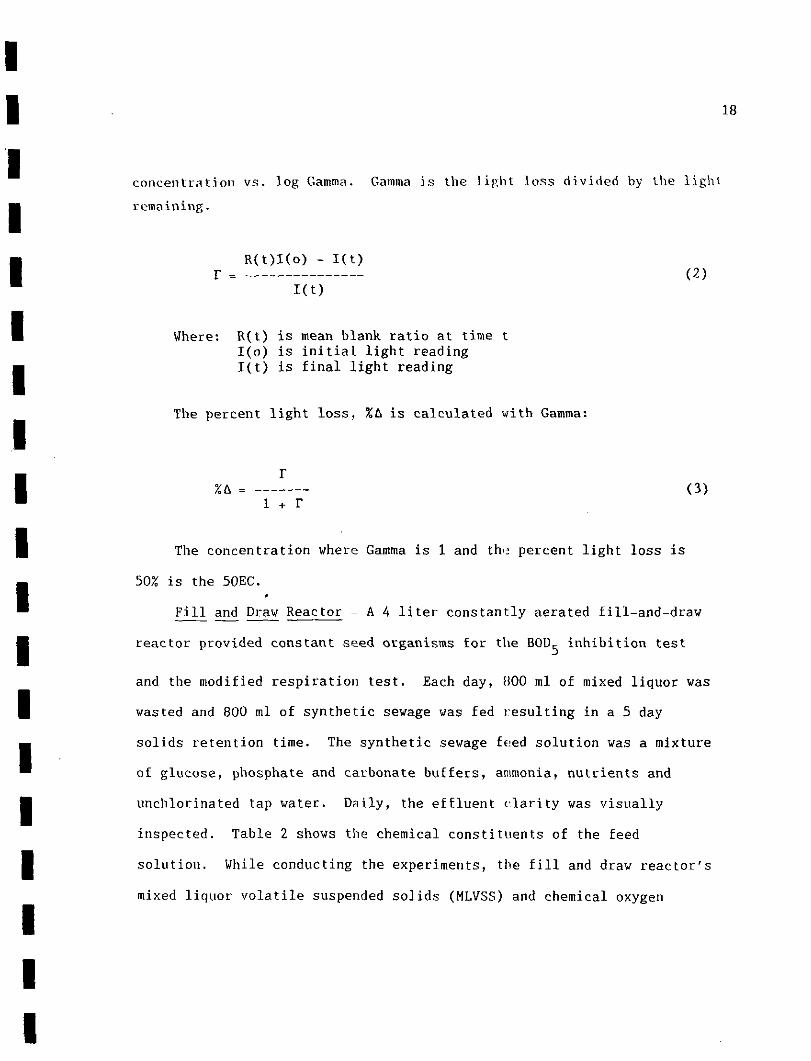
concentration vs. log Gamma. Gamma is the lip;ht loss divided by the light
remaining.
r = --------------- (2)Kt)
Where: R(t) is mean blank ratio at time tI(o) is initial light readingI(t) is final light reading
The percent light loss, %A is calculated with Gamma
r<3)
+ r
The concentration where Gamma is 1 and the percent light loss is
50% is the 50EC.*
Fill and Draw Reactor - A 4 liter constantly aerated fill-and-draw
• reactor provided constant seed organisms for the BOD,.- inhibition test
and the modified respiration test. Each day, HOO ml of mixed liquor was
| wasted and 800 ml of synthetic sewage was fed resulting in a 5 day
_ solids retention time. The synthetic sewage feed solution was a mixture
• of glucose, phosphate and carbonate buffers, ammonia, nutrients and
• unchlorinated tap water. Daily, the effluent clarity was visually
inspected. Table 2 shows the chemical constituents of the feed
• solution. While conducting the experiments, the fill and draw reactor's
mixed liquor volatile suspended solids (MLVSS) and chemical oxygen
Iil

19
TABLE 2: FEED SOLUTION FOR FILL-AND-DRAW REACTOR
FEED COMPONENT
Glucose
Phosphate Buffer
A. KHP0
B. K0HPO,I 4
NaHCO
NH.SO,4 4
CaCl2
FeCl3
Yeast
CONCENTRATION
(HG/L)
500
527
1070
375
125
50
5
5
10

111
20
demand (COD) we ire monitored. Those tests were conducted according to
standard methods (APHA 1975, APHA 1985).
1
1
1I
1
1
BOD,. Inhibitionj
methods (API1A 1975).
in 300 ml bottles at
the seed. Dissolved
modification of the
formula (Sawyer and
(D0b - DO
RODUvL/ — ^
Vol.
Where: DO. isD
00, isi
DO iss
- The test procedure was run according to standard
Seed, test solution, and dilution water were incubated
20°C for 5 days. The fill and draw reactor provided
oxygen concentrations were measured using the azide
Vinkler method. The BOD was calculated according to the
McCarty 1978):
.)Vol. of bottle
- ( OO DO > ( k}- - *• h o' ^ '
of sample
the dissolved oxygen in the blank
the dissolved oxgen in the sample
the dissolved oxygen ini tally present
Test samples were the synthetic feed solution spiked with a
i
1
1
ii
TMconcentration of toxicants to provide the Microtox EC50 concentration.
In each test, three series were run concurrency : two were the test
samples; one was the blank of unspiked synthetic sewage. For each
series, the bottles
time zero, blank at
containing dilution water control (DWC), blank at
time 5 days, and dilutions of 1 ml, 2 ml, 5 ml, 10
ml were prepared. The test sample was inhibitory if either: 1) the
residual dissolved oxygen of greater dilution volumes (e.g., 10 ml) were
1111•11
11111111•1111
greater than the residual dissolved oxygen of lesser dilution volumes
e.g., 5 ml), or 2) if the calculated BOD,- of greater dilution volumes
(e.g., 10 ml) were less than the BOD,- of lesser dilution volumes (e.g., 5
ml).
Tests were invalid if the dissolved oxygen concentration of the DVC
was more than 1 mg/1 less than the initial blank (Sawyer and McCarty
1978). Samples which did not show an oxygen depletion of more than 2
mg/1 were not used for results.
Inhibition occurred if the dissolved oxygen concentration of the
greater dilutions exceeded those of the lesser dilutions. A second
means was to examine the BOO,, of the different dilutions. If greater
dilution volumes showed lower BODc-'s than the Lesser dilution volumes5
than there was inhibition. Percent inhibition, %A, was calculated
according to the formula:
BOD0 , - BOD. 12ml 5ml/'A - ^S1fo Li — * • " — l^JJ
BOD- _2ml
Where: BOD0 , is the BOD calculated for 2 ml dilution bottle,znuBOD , is the BOD calculated for 2 ml dilution bottle.
Sludge Respiration Test - This test differed from the BOD test in
that it had a constant amount of biomass and no lag phase. It was run
similarly to the standard sludge respiration test (Painter 1986) except
21

IlII
22a smaller, less concentrated biomass was used. This test simulated the
reactor shortly after feeding.
The test series was synthetic sewage spiked to provide the toxic
TMconcentration used in the Microtox test. The control, or baseline,
was unspiked synthetic sewage.
The test consisted of adding 72 ml of spiked or unspiked synthetic
sewage to 2fl8 nil mixed liquor from the fill arid draw reactor and placing
the mixture immediately in 60 ml BOD bottles. Dissolved oxygen was
measured by the Winkler method at time zero and each 30 minutes
thereafter for two hours. The method required sacrificing a BOD bottle
at every reading.
The spiked sewage series' 30 minute oxygen uptake rate was then
compared to the baseline series' 30 minute oxygen uptake rate. The test
samples which had a lower oxygen uptake rate than the baseline exhibited
inhibition. Results were presented as percent inhibition, (£6) as
follows:
OUR. - OURb t*A = (6)
OURb
Where: OUR, is Oxygen Uptake Rate of Baseline
OUR is Oxygen Uptake Rate of Test Substance
Survey of Wastewater Treatment Plants Using Miccotox In The United
States
II
I
23A survey of publicly owned treatment plants in the United States
I TM TMusing Microtox was conducted in order to find out whether Microtox
was used as toxicity screening test and why. A copy of the survey is
included in Appendix B.
Microbics Corporation graciously provided a list of the wastewater
TMtreatment plants owning a Microtox Toxicity Analyzer. A questionnaire
• was mailed to treatment plant operators. This was followed up with
phone calls to obtain more information, if necessary.
IIIIIiIIIlII

24
CHAPTER 4
RESULTS AND DISCUSSION
Literature Review
The literature review accomplished two tasks: comparing several
proposed toxicity screening tests and comparing the toxic sensitivity of
TMMicrotox with activated sludge.
Comparison of Toxicity Screening Test s - The comparison of proposed
toxicity screening tests showed that no one test was completely
satisfactory in all categories (Table 3).
The dehydrogenase activity test was unreliable when the dye was
toxic itself or when the dye was reactive with a reducing agent
(Patterson e_t al. 1969). Though some researchers stated that
dehydrogenase activity measurement was a sensitive toxicity test
(Ryssov-Nielsen 1975, Patterson 1969, Lopez et al. 1985), one researcher
said that it was not (Klapwijk et al. 1974),
ATP pool measurent was considered an expensive test by one
researcher (Parker 1982). The test was unreliable because it produced
false toxicity reading immediately after sludge was fed highly
degradable substrate (Schneider 1987). Schneider (1987) also noted that
ATP activity test was not sensitive to nickel toxicity.

1111
11
11
1
11•1
11
TABLE 3: LITERATURE COMPARISON OF
</* **$s "<$/
TEST " /
Dehydrogenase + +activity
ATP activity - +
TMMicro tox + +
Respirometer + /- 4
BOD +
Sludge + +Respiration
SOURCES
1. Lenhard 19642. Ford et al. 19663. Ryssov-Nielsen 19754, Patterson et al. 19695, Lopez et al. 19856. Klapwijk et al. 19747, Brezonik and Patterson 19718. Picciolo et al. 19819. Schneider 198710. Sheehan et al. 198411. Bulich 198212. Dutka and Kvan 198113. Kurz et al. 198414. Parker 198215. Summers and Sion 198116. Montgomery 196717. Williamson and Johnson 198018. Blok 197419. Pagga and Gunthner 198120. Arthur 198421. Movat 197622. Busch 198223. Painter 198624. King and Painter 1986
25PROPOSED TOXICITY SCREENING TESTS
^^ ^ x
/ "V V^ \^ SOURCES
+ + - + / - 1-6
+ + +/- 7-9,14
+ +/- +/- + 9-13
+/- + +/- + 14-20
+ +/- +/- 14,16,17,21,22
23,24
,

_
^
•
•
I
26Dutka and Kwan (1981) questioned the Microtox's reproducibility
between different laboratories because of the wide range of reported
TMEC50 concentrations One researcher thought the Microtox may be too
sensitive, producing toxic reponses to noninhibitory substances
(Schneider 1987). Bulich (1982) noted that the sensitivity of the test
was variable depending on the data reduction method.
Reseachers had differing opinions on respirometry. This may be
due to the differnent devices and operating procedures.
Researchers also had differing opinions on the BOD toxicity test.
Again this may be due to the different test procedures. The BOD test is
usually run for 5 days making it a slow test. One researcher even
suggested incubating the bottles for 2 weeks (Mowat 1976). No reports
were found stating that the BOD inhibition test can give false toxicity
results, though one researcher described chromium interfering with the
dissolved oxygen measurement and giving a false reading (Stones 1962).
The standard sludge respiration test was a recent test procedure
which had not been investigated thoroughly. One researcher noted that
the test procedure occasionally gave false toxicity results (King 1986).
TM_ In a comparison with Microtox , sludge inhibition was not as sensitive
' TMto toxicity as Microtox (Dutka et al. 1983).
Each toxicity test had its limitations. For that reason, some
researchers suggested a battery approach to toxicity testing (Dutka and
| Kwan 1983, Schneider 1987). Others suggested using a sensitive test as
_ the first step in a tiered toxicity protocol (Koesler 1986, Branson
' 1981).
I TMComparisons of Toxic Sensitivity of Activated Sludge and Microtox
Comparison of reported chemical toxicities to activated sludge andii

IIIII
IIIII
IIIIII
27
Microtox showed that most chemicals were approximately of equal
toxicity to both. Table 4 lists chemicals in three categories according
to relative toxicity. (Appendix A lists the reported concentrations of
TMactivated sludge threshold of inhibition and Microtox 5EC50 used in
the comparisons. Appendix A also supplies the references for the
concentration.) The largest category was the on= of chemical compounds
I TM TMequally toxic to both activated sludge and Micratox . Microtox would
be an appropriately sensitive toxicity test for influents containing
chemicals in this category. Many compounds wer^ in this category
because of the wide range of reported threshold of inhibition to
TMactivated sludge and the wide range of Microtox ECSO's.
The literature survey placed 21 percent of: the chemicals in the
TMcategory of chemicals more toxic to Microtox than activated sludge.
Chemicals in this category, present in wastewatar influents, would cause
false toxicity readings during screening tests. This is not desirable
as possibly noninhibitory influents would require further testing.
Even less desirable is potentially inhibitory influents passing
through screening tests without toxic readings. Chemicals in the
Ienter treatment plants at inhibitory concentrations without detection by
TMcategory of more toxic to activated sludge than Microtox may possibly
TMMicrotox . Sixteen percent of the chemicals i:i the survey were in this
category.
TMSeveral modifications of the Microtox t^st procedure may improve
sensitivity. Changing the test exposure time from 5 minutes to 15
TMminutes increases the sensitivity of Microtox . Calculating the

IIIIIIIIIIIIIIIIIII
28
TABLE 4: LISTING OF CHEMICAL COMPOUNDS BY REPORTED TOXICITY TO ACTIVATEDTM
SLUDGE AND MICROTOX
Chemical CompoundsMore Toxic To
Activated Sludge
ChloroformDimethylformamide2,4-DinitrotolueneMethylene Chloride2,4-DinitrophenolArsenicNickel
Chemical CompoundsMore Toxic To
TMMicrotox
NaphthaleneCarbon TetrachlorideAmmonia (Free)Acrolein1,1,1-TrichloroethaneHexachloroethane1,1,2,2-Te t rachloroe tha.iepara-Chloro-meta-CresolArochlor-1242
Chemical CompoundsEqually Toxic
To Both
Benzene2,4,6-Trichlorophenol2-Chlorophenol1,2-Dichlorobenzene1,3-Dichlorobenzene1,4-Dichlorobenzene2,4-Dichlorophenol2,4-Dimethy1phenolNitrobenzenePentachlorophenolPhenolToluene3,5~DichlorophenolTrinitrotolueneMalathionCadmiumChromium(VI)Chromate(III)CopperCyanideLeadMercurySilverZincAluminumAmmonia (Free)

I
II
TMalso makes the Microtox a more sensitive test.
29
I concentration which causes 25% inhibition (5EC25) instead of the 5EC50
I• Laboratory Comparison of Toxicity Screening Tests
I TM TMMicrotox - In general, Microtox produced results comparable to
• the expected Beckman (1983) 5EC50 concentrations. Figures 2-5 show
the results for the four classes of potential pollutants in wastevater.
I Table 5 summarizes the results. Both 5 minute and 15 minute EC50
concentrations were presented as suggested by Beckman (1981) and Sellers
I (1985).
TMComparing the laboratory Microtox test results with literature
TMreported activated sludge inhibitory thresholds, it appeared Microtox
I was not sensitive enough to measure potential toxicants at inhibitory
concentrations for the chemicals tested. Table 6 presents reported
I . TMactivated sludge thresholds of inhibition concentrations and Microtox
5EC50 concentrations. Changing the test exposure time from 5 minutes to
TM15 minutes improved toxic sensitivity of Microtox . Changing the
percent inhibition from 50% to 25% also improved the toxic sensitivity
I TM TMof Microtox . Using the 5 or 15EC25 concentration, Microtox was a
sensitive enough toxicity test.
I BODc Inhibition - As mentioned earlier, the BOD inhibition test
• data were examined in two manners. First, the residual dissolved oxygen
of each dilution volume was compared, inhibitioi being exhibited when
I there was a higher residual dissolved oxygen in a bottle containing a
higher sample volume after the 5 day incubation. For instance, a test
II

11 TM
FIG 2: M I C R O T O X RESULTS FOR
• 10.00-
iii
_i• -I .V.
I nxr
1GA
1 '• MA
i• 0.10-
iii
0.01-
i ii i
&I Aii
/
///.•
// i
d /i m
/! .'
\ ^'
4
1
J
1I1
I
j
j
ii
i
1 1i- r -• 0.01 0.10 1.00
30
HEAVY METALS
/ ,D
/ /
w1 - rjI i V
I ! /1 • // •' /
/ / wQ-' / /
f^ /
//'//
/ i
ii
$
--
ir . . . . ( .10.00 100.00
FINAL ASSAY CONCENTRATION (MG/L)
1 A COPPER (5EC50 = 2.• 0 MERCURY (5EC50 = 0
D ZINC (5EC50 = 7 . 8
I V CHROMIUM (5EC50 =A COPPER (15EC50 = 0^ MERCURY (15EC50 =
I m Z I N C (15EC50 = 3.7V CHROMIUM (15EC50 =
i
0 M G / L ).051 MG/L)MG/L)32. M G / L ).70 MG/L)0.038)
M G / L )23. MG/L)

IIIIIIIIIIIIIIIIIII
31
TMFIG. 3: MICROTOX RESULTS FOR ORGANIC SOLVENTS
GAM lt
0.1100 1000
FINAL ASSAY CONCENTRATION (MG/L)
03 CHLOROFORM (5EC50 = 790 MG/L)

IIIIIIIIIIIIIIIIIII
32
10.00
1.00-
o.io--
0.01
TMFIG. 4: MICROTOX RESULTS FOR PESTICIDES
10
FINAL ASSAY CONCENTRATION (MG/L)
m MALATHION (5EC50 = 7.2 MG/L)A ENDRIN (5EC50 = 12. MG/L)
EXTRAPOLATED
100

IIIIIIIIIIIIIIIIIII
33
TMFIG. 5: MICROTOX RESULTS FOR PRIORITY POLLUTANTS
10.O
1.0"
0.110 100 1000
FINAL ASSAY CONCENTRATION (MG/L)
TRICHLOROETHYLENE (5EC50 = 303 MG/L)NITROBENZENE (5EC50 = 29.3 MG/L)

TMTABLE 5: MICROTOX LABORATORY RESULTS
IIIIIIIIII• a. limit of solubility
iiiiiiii
34
TOXICANT
COPPER(II)
MERCURY(I])
ZINC(II)
CHROMIUM (VI)
CHLOROFORM
ENDRIN
MALATHION
TRICHLOROETHYLENE
NITROBENZENE
5EC50(MG/L)
2.0
0.051
7.8
32.
790a
12. 3
7.2
300
29.
15EC50(MG/L)
0.70
0.036
3.7
23.
-
-
-
-_

11111111•••
11H
1
1
35
*
TABLE 6: COMPARISON OF LITERATURE ACTIVATED SLUDGE INHIBITORY CONCENTRATIONS
TOXICANT
COPPER (II)
MERCURY(II)
ZINC(II)
CHROMIUM(VI)
CHLOROFORM
ENDRIN
MALATHION
TRICHLOROETHYLENE
NITROBENZENE
TMWITH LABORATORY MICROTOX TOXICITY CONCENTRATIONS USINGDIFFERENT TEST MODIFICATIONS
ACTIVATED*1 5EC50 15EC50 5 or 15EC25C
SLUDGE(MG/L) (MG/L) (MG/L) (MG/L)
0.05-2. 2.0 0.70 0.46
0.1-5. 0.051 0.036 0.033
0.08-0.5 7.8 3.7 1.5
0.25-10. 32. 23. 9.1
10. 790a 61. a
12. a 5.7a
100. 7.2 3.9
>10.b 303 97.
30. -500 29. 12.
I a. Results calculated from data at limit of solubility'
iiIlIl
b. No inhibitionc. 15 minute data
at reported concentrationfor heavy metals; 5 minute data for others
d. Literature values. References are in Appendix A

36
substance would be inhibitory if the 10 ml dilution volume bottle had a
residual dissolved oxygen of 7.0 mg/1 while the 5 ml dilution volume
bottle had a residual dissolved oxygen of 6.8 mg/1. No toxicants
exhibited this behavior. Results are not presented.
Second, the BOD,, was calculated for each test dilution.
Inhibition occurred where greater test volumes (e.g., 10 ml) showed
lower BOD than smaller test volumes (e.g., 5 ml). In this test
procedure, inhibition was exhibited. Table 7 list the results. The
percent inhibition of malathion was equivocal because the control series
also exhibited some inhibition, possibly the result of the acetone
solvent. The chromium results may reflect some reaction with the
Winkler titrant (Stones 1962).
Generally, the BOD inhibition laboratory results were less than
literature reported BOD inhibition test results (Mowat 1976, Stones
1962). This was attributed to test procedure. The other two
researchers used low substrate concentration which remained constant
while the toxicant spike concentration varied. Mowats' test procedure
was more sensitive, but required chemical analysis of the wastevater
influent in conjucton vith the BOD inhibition test. It was therefore
not appropriate as a screening test.
Sludge Respiration - Only the toxicant trichloroethylene caused
inhibition in this test at the concentration tested. Table 7 lists all
the results. Over half the compounds caused stimulation rather than
inhibition. Several researchers have observed stimulation at low
toxicant doses (Brouzes et al. 1978, Poon and Bhayani 1971, Randall and
Lauderdale 1967, Hastings et al. 1985). One possible explanation is
that some toxicants can block a competing metabolic pathway before

37
TABLE 7: COMPARISON OF LABORATORY RESULTS FOR THREE TOXICITY TESTS
TOXICANT
COPPER(II)
MERCURY(II)
ZINC(II)
CHROMIUM (VI)
CHLOROFORM
ENDRIN
MALATHION
TRICHLOROETHYLENE
NITROBENZENE
CONCENTRATION
(MG/L)
3.5
0.065
26.
22.
930. b
7.3b
12.2
365.
47.8
MICROTOXTEST(%A)
72
84
81
86
56
33
72
54
65
BODTEST<*A>
3
17
12
31
11
-2
42C
-3
1
RESPIRATIONTEST<XA)
-33a
13
-5 ,
-23
-37
10
-3
27
-81
a. Negative values denote stimulationb. Limit of solubilityc. Blank exhibited 34% inhibition
IllIllllllllllll
38
affecting the measured pathway. Without the competition, the measured
pathway's activity would increase (Johnson et ;il. 1974).
The test modification used in this research project was not as
sensitive as the standard sludge respiration test (Dutka and Kwan 1983).
The modified test differed from the standard test by having a lower
solids concentration and a more dilute test sample. Low solids
concentration did not compensate enough for test sample dilution.
The results show this sludge respiration inhibition test is not as
sensitive as the other two toxicity tests. One other researcher found
that the standard sludge respiration test is not as sensitive as
TMMicrotox to toxicity (Dutka "and Kwan 1983).
TMSummary Discjoss^ion - The Microtox test was the most sensitive
toxicity test. The Microtox test procedure could be modified to change
TMits sensitivity. The BOD inhibition test followed Microtox in
sensitivity. In this study, the BOD inhibition toxicity test, run as a
screening test, was not as sensitive as other researcher's BOD
inhibition toxicity tests. The sludge inhibition test was not as
sensitive as the other two toxicity tests.
TMSurvey of Wastewater Treatment Plants using Microtox
The purpose of this part of the research project was to examine
TMfield use of Microtox . Results of the survey are in Appendix B. The
TM
project found 18 wastewater treatment plants possessing a Microtox
Analyzer. Only one plant was located in New England. The treatment
plants used different process types, treated various flows, and treated

111
1
1•11•1
1
1
1111
ja
different shares of industrial and domestic vastewater. The treatment
plants treated wastewater from many of; the industrial categories subject
to national pretreatment regulations. Uastewater influents contained
pollutants from the four classes used in this study
percentage:
Heavy MetalsOrganic SolventsPesticidesRefractory Organics
The percentages of plant operators conducting
various uses were:
Toxlcity ScreeningEffluent Moni toringToxicity Reduction EvaluationsEstablishing the Treatibility of New SourcesPollutant Source IdentificationEstablishing Operating ParametersBilling
TMMost treatment plants owning Microtox use it
screening. The percentages of the treatment plants
TMtests (who also use Microtox ) by type were:
Fish BioassayDaphnia BioassayRespirometrySelenastrum Algal AssayAmes Mutagenicity
in the following
87%80%53%47%
TMMicrotox tests for
82%76%53%50%24%12%6%
for toxicity
using other toxici
40%40%20%'13%7%
ty
Other toxicity tests were conducted at treatment plants using a
buttery approach to toxicity testing. The battery approach recognizes
that there is usually more than one type of organism influenced by a

40
iiiiiiiiiiii
potential toxicants, so more than one test organism may better predict
toxicants' effects. The other toxicity tests's uses by percentage of
all treatment works were:
Effluent Monitoring 70%Establishing Treatibility of New Sources 70%Toxicity Screening 50%Toxicity Reduction Evaluations 50%Pollutant Sources Identification 20%
TMMicrotox was used more often in toxicity screening tests.
TMMicrotox users identified the following merits and faults of the test
by percentage of respondents:
Merits:Uuickness 100%Ease of Operation/Maintenance 86%Inexpensive 50%Reproducible Results 33%Sensitivity 29%
Faults:Lack of Government Regulations 80%Expensive 27%Time Required to Analyze Results 7%Sample Preparation 7%Not Reproducible 7%No Chronic Test 7%Difficult ot Interpret Complex Effluents 7%
TMThe Microtox test was credited with being quick and easy to use.
Most users considered it inexpensive. It was considered reproducible
and sensitive by some, but not all users. Its most cited drawback was
the lack of government regulation. This is in regards to effluent

III TMmonitoring where Mierotox is rarely allowed as the toxicity test on
_ N.P.D.E.S. discharge permits.
ilIIIlIlliillll

IIIII
CHAPTER 5
CONCLUSIONS AND RECOMMENDATIONS
Conclusions
Using the criteria for a good influent wastewater toxicity
screening test, the project compared some proposed toxicity tests by
reviewing available literature. The dehydrogenase activity test was
inexpensive, rapid, easily conducted, reliable, but not reproducible or
sensitive. The ATP activity test was inexpensive, rapid, easily
TMconducted, sensitive, but not reproducible or reliable. The Microtox
was inexpensive, rapid, easily operated, reproducible, reliable, and
sensitive. The BOD,, inhibition test was inexpensive, easily conducted
and sensitive. It was not, however, rapid, reproducible or reliable,
Respirometers were found to be inexpensive, rapid and sensitive; they
were not found to be easily operated, reproducible, or reliable. The
sludge respiration test was inexpensive, rapid, easily conducted,.
* reproducible, reliable, and sensitive.
The project also compared reported toxicities of chemical compounds
TMto activated sludge and Microtox . Activated sludge inhibitory
TMconcentrations and Microtox toxic concentrations were of the same
order of magnitude according to a comparison of published literature

IIIIIII
43
II
chemical concentrations of activated sludge threshold of inhibition and
TMMicrotox 5EC50's. Most reported inorganic compounds inhibited
TMactivated sludge at lower concentrations than the Microtox 5EC50.
Laboratory experiments compared three microbial toxicity tests.
TMBased on the modifications used in these experiments, Microtox- was the
most sensitive of the three tests. The modified BOD,- inhibition test
was generally the next most sensitive test. The modified sludge
respiration inhibition test exhibited stimulation for most of the
chemicals tested.
I The survey of wastewater treatment plant operators using Microtox
iTM
showed that Microtox was considered rapid and easy to use. It was
considered inexpensive and sensitive by the majority of treatment plant
operators.
Recommendations
TMactivated sludge treatment plant. Microtox would be compared to
treatment inhibition using different toxicant concentrations, chemical
matrices, and operating parameters.
• Recommended future work would be pilot studies using a bench scale
IiiIIII

11111•111H
111
11111
44
REFERENCES
Abson, J.W., C.D. Furness and C. Hove. 1967. Development of the Simcar
Respirometer and its Application to Waste Treatment. Water
Pollution Control 66: 607-615.
Alleman, J.E. 1986. Respiration-Based Evaluation of Nitrification
Inhibition using Enriched Nitrosomonas Cultures. Proc. 41th Ind.
Waste Conf.
American Public Heath Association. 1975. Standard Methods for the
Examination of Water and Wastevater. 14th ed. Washington D.C.:
APHA.
American Public Heath Association. 1985. Standard Methods for the
Examination of Water and Wastewater. 16th ed. Washington D.C. :
APHA.
Anthony, R.M. and L.H. Breimhurst. 1981. Determining Maximum Influent
Concentrations of Priority Pollutants for Treatment Plants. J.
Water Pollution Control Federation 53: 1457-1468.
Arthur, R.M. 1984- Twenty Years of Respirometry. Proc. 39th Ind. Waste
Conf.
Atkinson, D.S. 1987. Assessment of the Microtox Bioassay as a Predictor
for Anaerobic Bacterial Toxicity. M.S. Thesis, University of
Massachusetts, Amherst.

45
Beckman, Inc. 1981. Microtox Application Notes: Advantages of Using
Several Test Times. Carlsbad, CA: Beckman Instruments, Inc.
Beckman, Inc. 1982. Microtox System Operating Manual. Carlsbad, CA:
Beckman Instruments, Inc.
Beckman, Inc. 1983. Microtox Application Notes: Microtox EC50 Values.
Carlsbad, CA: Beckman Instruments, Inc.
Blok, J. 1974. Respirometric Measurements on Activated Sludge. Water
Research 8: 11-18.
Blok, J. 1976. Measurements of the Viable Biomass Concentration in
Activated Sludge by Respirometric Techniques. Water Research 10:
919-925.
Boethling, R.S. 1984. Environmental Fate and Toxicity in Wastewater
Treatment of Quaternary Ammonium Surfactants. Water Research 18:
1061-1076.
Brandes, R., B. Newton and E. Southerland. 1984. Technical Support
Document for Water Quality-Based Toxics Control. Washington D.C.:
USEPA.
Branson, D.R., D.N. Armentrout, W.M. Parker, C. Van Hall, and L.I. Bone
1981. Effluent Monitoring Step by Step. Environmental Science And
Technology 15: 513-518.
Brezonik, P.L. and J.W. Patterson. 1971. Activated Sludge ATP: Effects
of Environmental Stress. Journal oj! Sanitary Engineering Division,
ASCE 97: 813-824, 1971.

46
i
iii
Broecker, B. and R. Zahn. 1977. The perfomance of Activated Sludge
Plants Compared with the Results of Various Bacterial Toxicity
| Tests-Study with 3,4-Dichlorophenol. Water Research 11: 165-172.
Brouzes, P.H., A. Defrierrefeu, J.Y. Bernhard. 1978. Rapid Appraisal of
m the Effects of Various Substances on Microorganisms. Prog . Wat.
• l££h. 10: 715-725.
Builema, A.L., B.R. Niederlehner, and J. Cairns. 1982. Biological
• Monitoring Part IV-Toxicity Testing. Water Research 16: 239-262.
Bulich, A. A. 1982. A Practical and Reliable Method for Monitoring the
• Toxicity of Aquatic Samples. Process Biochemistry (March/April):
45-47.
Bulich, A.A. and D.L. Isenberg. 1981. Use of the Luminescent Bacterial
System for the Rapid Assessment of Aquatic Toxicity. ISA
Transactions 20: 29-33.
• Bulich, A. A. M.U. Greene, and D.L. Isenberg. 1981. Reliability of the
Bacterial Luminescence Assay for the Determination of the Toxicity
• of Pure Compunds and Complex Effluents. In the Aquatic Toxicity and
Hazard Assessment: Fourth Conference edited by D.R. Branson and
| K.L. Dickson, 338-347. American Society for Testing and Materials.
_ Burns and Roe Industrial Services Corporation. 1982. Fate of_ Priority
Pollutants in Publicly Owned Treatment Works. Washington D.C.:
• USEPA,
Busch, A.W. 1982. Bioassay Technique for Relative Toxicity in Water
I Pollution Control. J. Water Pollution Control 54: 1152-1154.

47
Casseri, N.A., W.C. Ying and S.A. Sojka. 1983. Use of a Rapid Bioassay
for Assessment of Industrial Wastewater Treatment Effectiveness.
Froc. 38th Ind. Waste Conf. pp. 867-878.
Chang, J.C., P.B. Taylor and F.R. Taylor. 1981. Use of Hicrotox Assay
System for Environmental Samples. Bulletin Enyijronm. Corvtam.
Toxicol. 26: 150-156.
Chapman, P.M., G.P. Romberg, and G.A. Vigers. 1982. Design of Monitoring
Studies for Priority Pollutants, J. Water Pollution Control
Federation 54: 292-297.
Clarke, A.N., W.W. Eckenfelder and J.A. Roth. 1977. The Deveopment of an
Influent Monitor for Biological Treatment Systems. Prog. Wat. Tech.
9: 103-107.
Curtis, C., A. Lima, S.J. Lozano and G.D. Veitli. 1982. Evaluation of a
Bacterial Bioluminescence Bioassa as a Method for Prediction Acute
Toxicity of Organic Chemicals to Fish. In Aquatic Toxicology and
Hazard Assessment: Fifth Conference, edited by J.G. Pearson et al.
Philadelphia, PA: ASTM, 170-178.
Dutka, B.J. and K.K. Kvan. 1981. Comparison of Three Microbial Toxicity
Screening Tests with the Microtox Test. Bulletin Environ. Contam.
Toxicol. 27: 753-757.
Dutka, B.J. and K.K. Kwan. 1982. Application of Four Bacterial Screening
Procedures to Assess Changes in the Toxicity of Chemicals in
Mixtures. Environ. Pollut. Ser. A. 29: 125-134.
Dutka, B.J. and K.K. Kvan. 1983. Studies on a Synthetic Activated Sludge
Toxicity Screening Procedure with Comparison to Three Microbial

II
48
• Toxicity Tests. Toxicity Screening Procedures using Bacterial
System. New York: Marcel Dekker, Inc.
• Dutka, B.J., N. Nyholm and J. Petersen. 1983. Comparison of Several
Microbiological Toxicity Screening Tests. Uat. Research 17: 1363-
I 1368.
• Elnabarawy, M.T., R.R. Robideau and S.A. Beach. 1987. Comparison of
Three Rapid Toxicity Test Procedures: Microtox, Polytox and
I Activated Sludge Respiration Inhibition. Presented as the Third
International Symposium on Toxicity testing Using Microbial Systems
• in Valencia, Spain, May 11-15.
Ford, D.L., J.T. Yang and W.W. Eckenfelder. 1966. Dehydrogenase Enzyme
| as a Parameter of Activated Sludge Activities- Proc. 21th Ind.
Waste Conf.III
IIIIII
Green, M.B., D.G. Willets, M. Bennett, R.F. Crovther, and J. Bourton.
1975. Applications of Toxicity Testing to Sewage Treatment
Processes. Water Pollution Control 74: 40--54.
Greene, J.C., W.E. Miller, M.K. Debacon, M.A. hong and C.L. Bartels.
1985. A comparison of three Microbial Assay procedures for
measuring Toxicity of Chemical Residues. Arch. Enyiron. Contain.
Toxicol. 14: 659-667.
Hastings, J.W., C.J. Potrikus, S.C. Gupta, M. K.urfurst and J.C.
Makemson. 1985. Biochemistry and Physiology of Bioluminescent
Bacteria. Advances in Microbial Physiology 26: 235-291.

49
•
™
II
•
•
•
iiiiii
Indorato, A.M., K.B. Snyder and P.J. Usionovicz. 1983. Toxicity
Screening using Microtox. Toxicity Screening Procedures
Bacterial System. New York: Marcel Dekker, Inc.
Ingols, R.S. et al. 1954. Toxicity of Mercuric Chloride, Chromic Sulfate
and Sodium Chromate in the Dilution BOD Test. J. Water Pollution
Conti-ol Federation 26: 536-538.
Jackson, S. and V.M. Brown. 1970, Effect of Toxic Wastes on Treatment
Processes and Watercourses. Water Pollution Control 69: 292-303.
Johnson, F.H., H Eyring, B.J. Stover. 1974. The Theory of Rate Processes
in Biology and Medicine. New York: John Wiley & Sons.
Jorgensen, K.P. 1984. Determination of the Enzyme Activity of Activated
Sludge by Methylene Blue Reduction. J. Water Pollution Control
Federation 56: 89-93.
Kamlet, J., R.M. Dohert, G.D. Veith, R.W. Taft and M.H. Abraham. 1986.
Solubility Properties in Polmers and Biological Media. 7. An
Analysis of Toxicant Properties That Influence Inhibition of
Bioluminescence in Photobacterium phoshoreum (The Microtox Test).
Environ. Sci. Technol. 20: 690-695.
King, E.F. and H.A. Painter. 1986. Inhibition oE Respiration of
Activated Sludge: Variablitiy and Reproducibility of Results.
Toxicity Assessment 1: 27-39.
Klapwijk, A., J. Drent, and J.H.A.M. Steenvoordon. 1974. A Modified
Procedure for the TTC-Dehydrogenase Test in Activated Sludge. Water
Research 8: 211-125.

50
Kurz, G.E., N. Leslie and R.J. Henderson. 1984- A Rapid Industrial Vaste
Screening Method. Proc. 39th Ind. Waste Conf. pp. 395-406.
Lehninger, A.L. 1982. Principles of Biochemistry. New York: Worth
Publishers, Inc.
Lenhard, G. 1964. Dehydrogenase Activity as Criterion for the
Determination of Toxic Effects on Biological Purification Systems.
Hydrobiologia 25: 1-8.
Lenhard, G., L.D. Nourse and H.tf. Schwartz, 1964. The Measurement of
Dehydrogenase Activity of Activated Sludges. Advances in Water
Pollution Research 2: 105-119.
Lopez, J.M., B. Koopman and G. Bitton. 1986. INT-Dehdrogenase Test for
Activated Sludge Process Control. Biotechnology and Bioengineering
28: 1080-1085.
McElroy, L.J. 1983. Detection of Industrial Pollutants and Toxic
Chemical Wastes in Sewage Treatment Plant Influents by Use of
Biological Monitor. Applied and Env. Microbio. 45: 730-732.
McFeters, G.A., P.J. Bond, S.B. Olson and T. Tchan. 1983. A Comparison
of Microbial Bioassays for the Detection of Aquatic Toxicants.
Water Res. 17: 1757-1762.
Metcalf and Eddy, Inc. 1979. Wastewatei' Engineering: Treatment Disposal
Reuse. New York: McGrav-Hill.
Montgomery, H.A.C. 1967. The Determination of BOD By Respirometric
Methods, Vater Research 1: 631.
Mowat, A. 1976. Measurement of Metal Toxicity by Biochemical Oxygen
Demand. J. Water Pollution Control Federation 48: 853-866.

II
Murakami, K. 1980. Automatic Water Quality Analyzers for Wastewater
I
I
III
IIII
Collection and Treatment. J. Water Pollution Control Federation
52: 938-942.
Norberg, A.B. and N. Molin 1983. Toxicity of Cadmium, Cobalt, Uranium,
I and Zinc to Zoogloea Ramigera. Water Research 17: 1333-1336.
Olah, J. and P. Princz. 1986. A New Rapid Method for Determining Sludge
I Activity. Water Research 12: 1529-1534.
Pagga, U. and W. Gunthner. 1981. The BASF Toximeter- A Helpful
| Instrument to Control and Monitor Biological Waste Water Treatment
Plants. Wat. Sci. Technol. 13: 233-238.
Painter, H.A. 1986. Testing the Toxicity of Chemicals by Inhibition of
Respiration of Activated Sludge. Toxicity Assessment 1: 515-524.IParker, C.E. 1982. Surrogate Parameter Analysis for Organic Priority
Pollutants. J. Water Pollution Control Federation 54: 77-86.
Patterson, J.U., P.L. Brezonik, and H.D. Putnam. 1969. Sludge Activity
Parameters and their Application to Toxicity Measurements and
Activated Sludge. Proc. 24th Ind. Waste Conf. pp. 127-154.
Patterson, J.W., P.L. Brezonik, and H.D. Putnam. 1970. Measurement and
Significance of ATP in Activated Sludge. Environmental Science And
Technology 4: 569-575.
• Peltier, W. and C.I. Weber. 1980. Comparison of the Toxicity of
Effluents to Fish, Invertebrates and Microtox. Washington D.C.:
USEPA.
Picciolo, G.L., E.W. Chappell, J.W. Deming, R.R. Thomas, D.A. Nible and
H. Okrend. 1981. Project Summary: Firefly Lucif erase ATP Assay
II• Development for Monitoring Bacjrerial Concentrations in Water
Supplies. Washington D.C.: USEPA.
| Poon, C.P.C. and K.H. Bhayani. 1971. Metal Toxicity to Sewage
_ Organisms. ASCE J. of Sanitary Engineering Division 97: 161-169.
' Qureshi, A.A., K.W. Flood, S.R. Thompson, S.M. Janhurst, C.S. Inniss and
• D.A. Rokosh. 1982. Comparison of a Luminescent Bacterial Test with
olher B.ioassas fo Determining Toxicity of Pure Compounds and
I Complex Effluents. In Aquatic Toxicology and Hazard Assessment:
Fifth Conference, edited by J.G. Pearson e_t al. Philadelphia, PA:
| ASTM, 170-178.
Qureshi, A.A., R.N. Coleman and J.H. Paran. 1983. Evaluation and
• Refinement of the Microtox Test for use in Toxicity Screening.
I Toxicity Screening Procedures using Bacterial System. New York:
Marcel Dekker, Inc.
I Qureshi, A.A., A.K.. Sharma and J.H. Paran. 1987. Microtox Quality
Control Collaborative: A Unique and Enlightening Experience.
I Presented at the Third International Symposium on Toxicity Testing
Using Microbial Systems, Valencia, Spain, May 11-15.
• Randall, C.W. and R.A. Lauderdale. 1967. Biodegradation of Malathion.
• ASCE J. of Sanitary Engineering Division 93: 145-156.
Rudolfs, W. et al. 1950. Review of Literature on Toxic Materials
• Affecting Sewage Treatment Processes, Streams and BOD
Determinations. Sewage and Industrial Wastess 22^ 1157-1177.
iiIl

53
I
Reeves, J.B. 1976. Activated Sludge System Influent Toxicity Monitoring
Through Use of a Commercial, Continous Reispirometer. M.Sc. Thesis,
| Virginia Polytechnic Institute and State University, Blacksburg.
_ Roesler, J. 1986. Potential Analyzers of Toxic Materials for On-Line
• Use. in Treatment Efficiency and Energy Use in Activated Sludge
Process Control, ed. R.M. Arthur. Ann Arbor, MI: Butterworth
Publishers.
I Russell, L.L., C.B. Cain and D.I. Jenkins. 1982. Impact of Priority
Pollutants on Publicly Owned Treatment Works Processes: A
| Literature Review. Proc. 37th Ind. Waste Conf. pp. 871-883.
Ryssov-Nielsen, H. 1975. The Measurement of the Inhibition of
• Respiration in Activated Sludge by a Modified Determination of the
• TTC-Dehydrogenase Activity. Water Research: 9: 1179-1185.
Samak, Q.M. and R. Noiseus. 1980. Acute Aquatic Toxicity Measurement by
• the Beckman Microtox. Presented at the 7th Annual Aquatic Toxicity
Workshop in Montreal, Canada, November 1980.
I Sawyer, C.N. and P.L. McCarty. 1978. Chemistry for Environmental
Engineering. New York: McGraw-Hill.
I Schneider, C.G. 1987. Screening Wastewater for Toxicity to Activated
• Sludge. Ph.D. Dissertation, Vanderbilt University.
Schovanek, D., M. Weyme, C. Vancayseele, F. Doms, R. Vandebroek and W.
• Verstraete. 1987. The RODTOX Biosensor For Rapd Monitoring of
Biochemical Oxygen Demand and Toxicity of Wastewaters. Med. Fac.
IlII
Landbouww. Gent 52: 1757-1779.

54
Sellers, K. 1.985. Studies on the Actions and Interactions on Heavy
Metals on Bioluminescent Bacteria. M.Sc. Thesis, University of
Massachusetts, Amherst.
Sheehan, K.C., K.E. Sellars and N.M. Ram. 1984. Establishment of a
Microtox Laboratory and Presentation of Several Case Studies Using
Hicrotox Data. Amherst, Massachusetts: University of Massachusetts
Department of Civil Engineering Environmental Engineering Report
No. 77-83-8.
Shieh, W.K. and C.J. Yee. 1985. Microbial Toxicity Monitor for In Situ
| Continous Applications. Biotechnology and Bioengineering. 27: 1500-
_ 1506.
^ Slabbert, J.L.. and W.S.G. Morgan. 1982. A Bioassay Technique using
Tetrahymena Pyriformis for the Rapid Assessment of Toxicants in
Water. Water Research 16: 517-523.
• Slattery, G.H. 1985. Plant Operations at the Patapsco Wastewater
Treatment Plant. Presented at the Chesapeake Water Pollution
• Control Associaton.
Slattery, G.H. 1985. Biomonitoring and Toxicity Testing: Toxicant
H Treatability Definition and Measurement, presented at the WPCF
• Analytical Techniques in Water Pollution Control Conference,
Cincinnati, OH, May 2-3.
• Spanjers, H. and A. Klapwijk. 1987. Measurement of the Toxicity of KCN
and Some Organic Compounds for Activated Sludge Using the WAZU-
• Respiration Meter. Presented at Recent Advances in the Management
i
iii

• 55
i• of Hazardous and Toxic Wastes in the Process Industries, Vienna,
March 8-13.
• Stones, T. 1962. The Influence of Metallic Compounds on the Biochemical
Oxygen Demand of Sewage. J. of Sevage Purification, pp. 516-520.
• Stumm, W. and J.J. Morgan. 1981. Aquatic Chemistry. New York: John Wiley
• & Sons, Inc.
Summers, S.M. and R.A. Sion. 1981. Real-Time Process Monitoring of
I Biomass Respiration in an Activate Sludge System. Proc. 36th Ind.
Waste Conf. pp. 701-710.
I Szal, G.M. 1985. A Comparison of Acute Toxicity Evaluations and EPA
Water Quality Criteria with Macrolnvertebcate Community Analysis at
I Sites of Electrofinishing Discharges to Streams. Proc. 40th Ind.
• Waste Conf. pp. 586-605.
B USEPA. 1977. Federal Guidelines: State and Local Pretreatment Programs,
I Vol. I, II & III. Quoted in Schneider, C.G. Screening Wastewater
for Toxicity to Activated Sludge. Ph.D. Dissertation, Vanderbilt
• University.
USEPA. 1982 Needs Surve of the United States and Territories Treatment
| Capacity, Washington D.C.: USEPA.
m Water Pollution Control Federation. 1977. Wastevater Treatment PlantI '
Design. Lancaster, PA: Lancaster Press.
• Weber, S.A. and T.H. Sherrard, 1980. Effects of. Cadmium on the
Completely Mixed Activated Sludge Process. J. of Water Pollution
IIII
Control Federation 52: 2378.

56II• Williamson, K.J. and D.G. Johnson. 1981. A Bacterial Bioassay for
Assessment of Wastewaler Toxicity. Water Research 15: 383-390,
IIIIIIIIIIIIIIII

APPENDIX A
A-l

IIIIIIIIIIIIIIIIIII
A-2
INHIBITION THRESHOLD CONCENTRATIONS TO ACTIVATED SLUDGE BY PROCESS
TOXICANT
ORGANICS:
BENZENEBENZIDINEHEXACHLOROBENZENE2,4, 6-TRICHLOROPHENOLCHLOROFORM2-CHLOROPHENOL1,2-DICHLOROBENZENE1,3-DICHLOROBENZENE1,4-DICHLOROBENZENE2,4-DICHLOROPHENOLDICHLOROPHENDIMETHYLFORMAMIDE2,4-DIMETHYLPHENOL2,4-DINITROTOLUENE2,6-DINITROTOLUENE1 , 2-DIPHENYLHYDRAZINEETHYLBENZENEMETHYLENE CHLORIDETRICHLOROFLOUROMETHANENAPHTHALENENITROBENZENE2,4-DINITROPHENOLPENTACHLOROPHENOLPHENOLANTHRACENEPHENANTHRKNETOLUENE
3,5 DICHLOROPHENOLEDTATRINITROTOLUENENACCONOLCEEPRYNCRESOLMALATH10NCARBON TETRACHLORIDE
ACT. NITRIFYINGSLUDGE BACTERIA(MG/L) (MG/L)
125-8805-500
550
1020-200
555
64-75 64
40-200555
200
50030-500
1 1500.95-5050-200 4-10
500500200
2525
20-25200100 25
4-16100800
ANAEROBIC SOURCEDIGESTION(MG/L)
2,3,102,3,433323332,3
1 1400 1
23332
1 10.7 1
2,32,33,5
0.4 1,2,32,3,4,5332
74
60 4,1044,65810

IIIIIIIIIIIIIIIIIII
TOXI CANT
INORGANICS:ARSENICCADMIUMCHROMIUM(VT)CHROMATE(III)COPPERCYANIDEIKONLEADMERCURYNECKELSILVERZINC
ALUMINUMAMMONIABORATECALCIUMMAGNESIUMMANGANESESULFATETIN
ACT. NITRIFYINGSLUDGE BACTERIA(MG/L) (MG/L)
ANAEROBICDIGESTION(MG/L)
A-3
SOURCE
0.10.5-100
1-1010-50
10.1-55-10000.1-10
0.1-51-10
0.25-50.3-55
15-26ABO0.05-1002500
10
1.50.02-50.25-1050
0.005-20.34-4
0.5-1013650.25-10
0.08-0.5
50
500
2,3,4,51 1,2,3,4,55-10 1,2,3,4,5,10
2,3,4,50.7-5 1,2,3,4,5,102 2,3,4,5,105 1,4,5,10
50-70 1,2,3,4,5,102,3,4,5
40 1,2,3,4,5,102 3 4 5
10-20 1,2,3,4,5,10
54,5
4,5,10454,55
9 1
IIIIIIIIIIIIIIIIIII
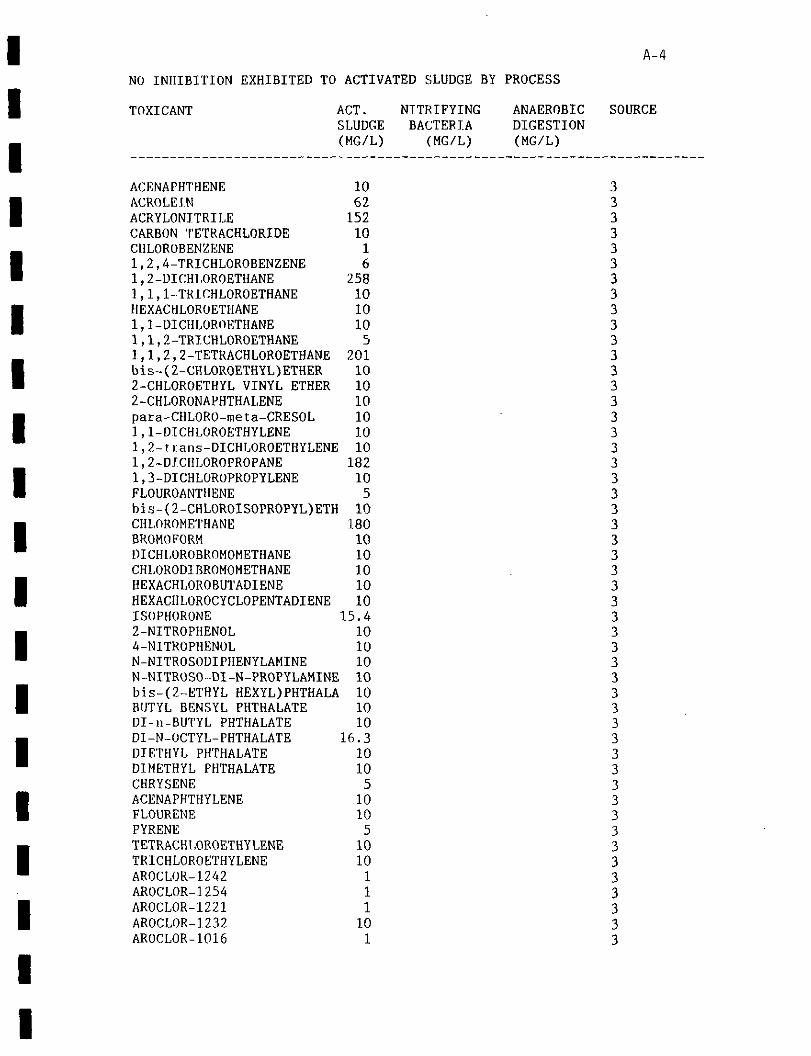
NO INHIBITION EXHIBITED TO ACTIVATED SLUDGE BY PROCESS
TOXICANT NITRIFYING ANAEROBICSLUDGE BACTERIA DIGESTION(MG/L) (MG/L) (MG/L)
A-4
SOURCE
ACENAPHTHENEACROLEi.NACRYLONITRILECARBON TETRACHLORIDECHLOROBENZENE1,2, 4-TRICHLOROBENZENE1,2-DICHLOROETHANE1,1, 1- TR1CHLOROETHANEHEXACHLOROETHANE1,1-DICHLOROETHANE1,1, 2-TRICHLOROETHANE1,1,2, 2-TETRACHLOROETHANEbis-(2-CHLOROETHYL)ETHER2-CHLOROETHYL VINYL ETHER2-CHLORONAPHTHALENEpara-CHLORO-meta-CRESOL1 , 1-DICHLOROETHYLENE1 , 2- t rans-DICHLOROETHYLENE1,2~DICHLOROPROPANE1 , 3-DICHLOROPROPYLENEFLOUROANTHENEbis-(2-CHLOROISOPROPYL)ETHCHLOROM ETHANEBROMOFORMDICHLOROBROMOMETHANECHLORODIBROMOMETHANEHEXACHLOROBUTADIENEHEXACHLOROCYCLOPENTADIENEISOPHORONE2-NITROPHENOL4-N1TROPHENOLN-NITROSOUIPHENYLAMINEN-NITROSO-DI-N-PROPYLAMINEbis-(2~-ETHYL HEXYL)PHTHALABUTYL BGNSYL PHTHALATEDI-n-BUTYL PHTHALATEDI-N-OCTYL-PHTHALATEDIETHYL PHTHALATEDIMETHYL PHTHALATECHRYSENEACENAPHTHYLENEFLOURENEPYRENETETRACH1 .OROETHYLENETRICHLOROETHYLENEAROCLOR-1242AROCLOR-1254AROCLOR-1221AROCLOR-1232AROCLOR-1016
10621521016
2581010105
201101010101010182105101801010101010
15.410101010101010
16.310105101051010111101
33333333333333333333333333333333333333333333333333

A-5
SOURCES
1. JACKSON 19702. ANTHONY 19813. RUSSELL 19834. USEPA 19775. WPCF 19776. BOETHLJNG 19847. BROECKER AND ZAHN 19778. RANDALL AND LAUDERDALE 19679. WEBER AND SHERRARD 198010. RUDOLFS 1950

1111•1111
1
1
1
1111
TMREPORTED MTCROTOX 5EC50
A- 6
CONCENTRATIONS
TOXICANT 5EC50 SOURCECONCENTRATION
ORGANICS:
BENZENEBENZID.LNEHEXACHLOROBENZENE2,4, 6-TRICHLOROPHENOLCHLOROFUKM2-CHLOROPHENOL1,2-DICHLOROBENZENE1,3-DICHLOROBENZENE1 ,4-DT.CHLOROB£NZENE2,4-DICHLOROPHENOLDICHLOROPHEND1METHYLFORMAMIDB2,4-OIMETHYl.PHENOL2,4-DINITROTOLUENE2,6-DINITROTOUJENE1 , 2-DIPHENYI.HYDRAZINEETHYLBENZENEMETHYLENE CHLORIDETRICHLOROFLOUROMETHANENAPHTHALENENITROBENZENE2,4-DINlTROPHENOLPENTACHLOROPHBNOLPHENOLANTHRACENEPHENANTHRENETOLUENE
3,5 DICHLOROPHENOLF.DTATRINITROTOLUENENACCONOLCEEPRYNCRESOLMALATHIONCARBON TETRACHLORIDE
(MG/L)
2-200 1,2,3,4,12,14
7.1-7.2 1,7435-520 1,9,1322.1 110,25 141.35 129.7 13.6-15.8 1,7,8
18685 14.4 170 8
1000 1,6
2 346.2 115.8-15.9 1,70.08-1.3 1,7,1320-42 1,2,3,4,5,7,9,10,13,14,15
17-33833 1,3,4,12,13,14
3.2-4.4 5,13
20 2
1.5-31.5 1,2,43-59.7 1,2,4,14
5.6 1

IIIIIIIIIIIIIIIIIII
A-7
TOXICANT 5EC50CONCENTRATION
(MG/L)
SOURCE
INORGANICS:
ARSENICCADMIUMCHROMIUM(VI)CHROMATE(III)COPPERCYANIDEIRONLEADMERCURYNICKELSILVERZINC
ALUMINUMAMMONIABORATECALCIUMMAGNESIUMMANGANESESULFATETIN
35-4044-15422-124
10.71.21-692.8-13.3
1.4-31.50.044-0.08155-10569.5-13.12.5-55.5
1.621.2-2
-
1,91,10,11,131,2,10,13,14101,2,5,6,9,10,11,13,141,2,3,6,8,9,11,13
1,5,6,101,2,5,6,9,11,13,151,5,6,10
1,141,2,5,6,9,10,11,13
101,2,9
TMREPORTED MICROTOX 5EC50 CONCENTRATIONS FOR SELECTED TOXICANTS
TOXICANT 5EC50
(MG/L)
SOURCE
ACENAPHTHENEACROLEINACRYLONITRILECARBON TETRACHLORIDECHLOROBENZENE1,2,4-TRICHLOROBENZENE1,2-DICHLOROETHANE1,1,1-TRICHLOROETHANEHEXACHLOROETHANE1,1-UICHLOROETHANE1,1,2-TR1CHLOROETHANE1,1,2,2-TETRACHLOROETHANEbis-(2-CHLOROETHYL)ETHER2-CHLOROETHYL VINYL ETHER2-CHLORONAPHTHALENEpara-CHLORO-meta-CRESOL1,1-DICHLOROETHYLENE
0.6739105.60.24
15818.2-105
0.14
3248.4
0.58
11112
1,77
11,7

A-8
1,2-trans- DTCHLOROETHYLENE 1220 151,2-LUClILOROPROPANE1,3-DICHLOROPROPYLENEFLOUROANTHENEbis-(2-CHLOROISOPROPYL)ETHERCHLOROMETHANEBROMOFORMDICHLOROBROMOMETHANECHLORODIBROMOMETHANEHEXACHLOROBUTADIENEHEXACHLOROCYCLOPENTADIENEISOPHORONE2-NITROPHENOL 13 74-NITROPHENOL 13.5 8N-NITROSODIPHENYLAMINEN-NTTROSO-DI-N-PROPYLAMINEbis-(2-ETHYL HEXYL)PHTHALATEBUTYL BENSYL PHTHALATEDJ-n-BUTYL PHTHALATEDI-N-OCTYL-PHTHALATEDTETHYL PHTHALATEDIMETHYL PHTHALATE 33.5 1CHRYSENEACENAPHTHYLENEFLOURENEPYRENETETRACHLOROETHYLENETRICHLOROETHYLENE 324AROCLOR-1242 0.7AROCLOR-1254AROCLOR-1221AROCLOR-1232AROCLOR-1016 2.05 14
SOURCES
1. Beckman 19832. Bulich and Isenberg 19813. Samak and Noiseux 19804. Chang e_t al. 19815. Dutka and Kwan 19826. Dutka and Kwan 19837. Curtis e_t al. 19818. Indorato et al. 19839. Qureshi et al. 198310. Qureshi e^ al. 198311. Green et al. 198512. Kamlet and Doherty 198613. Einabaravy et al. 198714. McFeters et al. 198315. Atkinson 1987

APPENDIX B
B-l

IIIIIIIIIIIIIIIIIII
B-2
THSURVEY OF MICROTOX USE IN PUBLICLY OWNED WASTEWATER TREATMENT PLANTS
TREATMENT PLANT CHARACTERISTICS:
What is Plant Classification?
Conv. Activated Sludge__ Pure Oxygen Act. Sludge__ Contact Stabilization
Trickling FilterOther. Please Specify:
Plug-Flow Act. SludgeExtended Aeration Act. SludgeOxidation DitchLagoon
What is Average Daily Dry Weather Flow? Please check one.
< 1 MOD10-50 MGD> 100 MGD
1-10 MGD50-100 MGD
What percentage of total influent flow is from industrial sources?
10-20%30-40%>50%
20-30%40-50%
What industries contribute to influent flow? Please check.
AdhesivesLeather tanning and finishingSoaps and detergentsAluminum formingBattery manufactoringCoil coatingCopper formingElectroplatingFoundriesIron and steelNonferrous metalsPhotographic suppliesPlastics processingPorcelain enamelGum and wood chemicalsPaint and inkPrinting and publishing
Pulp and paperTextile millsInorganic chemicalsTimberCoal miningOre miningPetroleum refiningSteam electricOrganic chemicalsPesticidesPharmaceuticalsPlastic and synthetic materialRubberAuto and other laundriesMechanical productsElectric and electronic componentsExplosives manufacturing
What are some identified pollutants in the influent? (i.e. Cyanide, Mercury)
Heavy metals _Pesticides _Other. Please specify:
Refractory organicsOrganic solvents

IIIIIIIIIIIIIIIIIII
TMMICROTOX USE
Please check uses:
Toxicity ScreeningToxicity Reduction EvaluationPollutant Source IdentificationEstablishment of Operating ParametersEffluent MonitoringEstablishing Treatability of New Industry EffluentsBillJng of Specific IndustriesOther, Please Explain:
How otten do you test toxicity?
OTHER TOXICITY MEASURING MEANS:
Are other toxicity measuring devices used at your plant? What are they?
Fish assays Daphnia assaysATP assays RespirometryOther. Please specify:
How are they used?
Toxicity ScreeningToxicity Reduction EvaluationPollutant Source IdentificationEstablishment of Operating ParametersEffluent MonitoringEstablishing Treatability of New Industry EffluentsBilling of Specific IndustriesOther, Please Explain:
PERMIT REQUIREMENTS:
What effluent discharge requirements must be met?
TMIs Microtox used to monitor any requirement in your permit?

IIIIIIIIIIIIIIIIIII
ADDITIONAL COMMENTS;
TMWhat are the reasons that you use the Macrotox ?
Ease QuicknessSensitivity CostReproducibility Other. Please Specify:
TMWhat are the disadvantages of Microtox ?
Cost Lack o£ government standardsSpeed ResultsSample preparation Other. Please Specify:
Please add your own comments.
Please fill in name, address, and telephone number of a person ve maycontact at your facility:
Name:Address:
Telephone number:
Please return to:
Mike McGrathCivil Engineering DepartmentUniversity of MassachusettsAmberst, MA 01003

111•11•1
11111M
1
-•
11111
TMRESULTS OF SURVEY OF WASTEWATER TREATMENT PLANTS USING MICROTOX
TMPOTW'S Using Microtox :
Respondants:
Treatment Process Types:
Prim.iry OnlyConventional Activated SludgePure Oxygen Activated SludgeContact StabilizationExtended AerationOxidation DitchTrickling FilterRBC
Plant Size:
1-30 MGD10-50 MGD50-100 MGDMOO MGD
Industrial Contribution to Plant Influent:
0-10%10-20%20-30%30-40%40-50%
Toxicant Classes Identified in Plant Influent:
Heavy MetalsOrganic SolventsRefractory OrganicsPesticides
B-5
18
17
32%42%
1 POTU21%
40%13%20%20%
1 POTV
87%80%53%47%

IIIIIIIIIIIIIIIIIII
B-6
Industrial Categories Contributing to Plant Influent:
Aluminum FormingBattery ManufacturingCoil CoatingCopper FormingElectrical and Electronic ComponentsElectroplatingPaint and Ink FormulatingInorganic ChemicalsIron and Steel ManufacturingLeather Tanning and FinishingMetal Molding and CastingNonferrous Metals Forming and ManufactoringPesticidesPetroleum RefiningPharmaceuticalsPorcelain EnamelingPulp and PaterRubber ProcessingSoaps and Detergents ManufactoringTimber Products ManufactoringPlastics Molding and FormingTextile Mills
TMMicrotox Uses :
Toxicity Screening 82%Pollutant Sources Identification 24%Establishing Treatibility of New Sources 50%Toxicity Reduction Evaluations 53%Effluent Monitoring 76%Establishing Operating Parameters 12%Billing 6%
Testing Frequency:
Daily 38%Weekly 31%Monthly 1 POTWQuarterly 15%Irregularly 1 POTU
Other Toxicity Tests:
Fish Bioassay 40%Daphvua Bioassay 40%Respirometry 20%Selenastrum Algal Assay 13%Ames Mutagenicity 1 POTU

B-7
Other Toxicity Test Uses:
Toxicity Screening 50%Pollutant Sources Identification 20%Establishing Treatibility of New Sources 70%Toxicity Reduction Evaluations 50%Effluent Monitoring 70%Establishizig Operating Parameters 0Billing 0
Discharge Permit Requirements:
Toxicity Testing Required in NPDES Permit 33%TMMicrotox Used to Meet Toxicity Testing Requirement 1 POTW
TMMerits of Microtox Test:
Quickness 100%Ease of Operation/Maintenance 86%Inexpensive 50%Reproducible Results 33%Sensitivity 29%
TMFaults of the Microtox Test:
Lack of Government Regulations 80%Expensive 27%Time Required to Analyze Results 1 POTWSample Preparation 1 POTWNot Reproducible 1 POTWNo Chronic Test 1 POTWDifficult to Interpret Complex Effluents 1 POTW