Embed Size (px)
DESCRIPTION
online monitoring
Citation preview
TM View Software User's Manual 3.4
810-1648-05 Rev A
December 2010
For more information, contact your nearest Serveron
Representative or Serveron Corporation.
Serveron Corporation, A BPL Global Company 3305 NW Aloclek Drive Hillsboro, OR 97124-7101 Corporate Office: +1 (800) 880-2552 Technical Support: +1 (866) 273-7763 Fax: (503) 924-3290 E-mail: [email protected] http://www.serveron.com
Copyright © 2010 Serveron Corporation All rights reserved
TM View, TM8, TM5 TM3, Serveron and LoadGuide are registered trademarks of Serveron Corporation. Microsoft, Microsoft Internet Explorer, Microsoft .NET, Windows NT, Windows XP, Windows Server 2003, DirectX and Windows are either registered trademarks or trademarks of Microsoft Corporation in the United States and/or other countries. FreeWave is a registered trademark of FreeWave Technologies. Unicode is a registered trademark of the Unicode Consortium. All other trademarks, registered trademarks, service marks, and trade names are the property of their respective owners.
810-1648-05 Rev A TM View Software User's Manual
3 of 73
Table of Contents
Before You Begin .................................................................................................................................. 6 About This Manual .......................................................................................................................... 6
References ...................................................................................................................................... 6 About TM View Software ............................................................................................................... 7
TM View Feature Overview ....................................................................................................... 8
Installing TM View .............................................................................................................................. 9 System Requirements ...................................................................................................................... 9 Choosing an Installation Configuration ....................................................................................... 9 Installation Procedure ................................................................................................................... 10 Upgrade Procedure ........................................................................................................................ 11
Using TM View .................................................................................................................................. 12 Starting TM View ........................................................................................................................... 12 Creating New Files (Adding an Asset) ....................................................................................... 13 Opening Files .................................................................................................................................. 14 Navigating to Company, Sites, Assets and Monitors ............................................................... 15 Navigation Pane Icons and Notification ..................................................................................... 15 Working with Files ......................................................................................................................... 17
Using Legacy Files ..................................................................................................................... 17 Corrupt or Invalid Files ............................................................................................................. 18
Removing a File from the Navigation Pane ............................................................................... 18 Using Commands........................................................................................................................... 19 Using Tabs ....................................................................................................................................... 19
Using the Asset Status Tab ....................................................................................................... 19 External Monitors: TBM, TMS and LTC ................................................................................. 21 Using the Graphs........................................................................................................................ 23
Graph Toolbar .......................................................................................................................... 24 Installing and Using Licenses ....................................................................................................... 25
Overview ..................................................................................................................................... 26 Automatic Scheduled Polling Option ..................................................................................... 26
TM View Reference ............................................................................................................................ 28 Navigation Pane ............................................................................................................................. 28 Viewing Pane .................................................................................................................................. 29
Transformer Asset Tabs ............................................................................................................ 29 Status Tab.................................................................................................................................. 29 Gas in Oil Tab ........................................................................................................................... 31 Limits Tab ................................................................................................................................. 34 Percent of Alarm Tab .............................................................................................................. 34 Rate of Change Tab ................................................................................................................. 34 Duval Triangle Tab .................................................................................................................. 35 Sensor Data Tab ....................................................................................................................... 35 Extractor Data Tab ................................................................................................................... 35 Retention Time Tab ................................................................................................................. 35 Verification Data Tab .............................................................................................................. 35
810-1648-05 Rev A TM View Software User's Manual
4 of 73
Company Specific Tabs ............................................................................................................. 36 Welcome Tab ............................................................................................................................ 36 Polling Tab ................................................................................................................................ 36 Status Tab.................................................................................................................................. 38
Site Specific Tabs ........................................................................................................................ 38 Status Tab.................................................................................................................................. 39
Monitor Specific Tabs ................................................................................................................ 39 Sampling Tab (Monitor icon selected in Navigation Pane) ............................................... 39 Communications Tab (Monitor icon selected in Navigation Pane) ................................. 39
Menu Commands ........................................................................................................................... 39 File Menu ..................................................................................................................................... 39
File New… ........................................................................................................................... 39 File Open… .......................................................................................................................... 42 File Close… .......................................................................................................................... 42 File Archive…...................................................................................................................... 42 File Export… ........................................................................................................................ 43 File Print… ........................................................................................................................... 43 File Print Preview ............................................................................................................... 43 File Exit ................................................................................................................................. 43
Action Menu ............................................................................................................................... 43 Action Select Modem ......................................................................................................... 43 Action Send Diagnostic Data… ........................................................................................ 46 Action Rename Company… (Company selected, Status tab) ...................................... 47 Action Rename Site… (Site selected, Status tab) ............................................................ 47 Action Rename Asset… (Transformer asset selected, Status tab) ................................ 47 Action Poll Now (Transformer asset or Monitor selected, any tab) ............................ 47 Action -> Edit Notification Rules (any node selected, any tab ......................................... 48 Action -> Edit ODBC Configuration (any node selected, any tab .................................... 48 Action -> Configure External Monitors (Transformer asset selected, Status tab) .......... 48 Action Enter DGA… (Transformer asset selected, Gas in Oil tab) .............................. 48 Action Import TOA4-CSV File… (Transformer asset selected, Gas in Oil tab) ......... 48 Action Start Sample Run (Transformer asset selected, Gas in Oil tab) ....................... 49 Action Update Limits (Transformer asset selected, Limits tab) ................................... 49 Action Start Verification Run (Transformer asset selected, Verification Data tab) ... 49 Action Start Calibration Run (Transformer asset selected, Verification Data tab) .... 49 Action Change Monitor Password… (Transformer asset selected, Status tab) ......... 50 Action Set Monitor Date and Time (Transformer asset selected, Status tab) ............. 50 Action View Log… (Transformer asset selected, Status tab) ....................................... 50 Action Sample Hourly (Monitor selected, Sampling tab) ............................................. 50 Action Check Communications (Monitor selected, Communications tab) ................ 51 Action Update Communications (Monitor selected, Communications tab) .............. 51
View Menu .................................................................................................................................. 52 View Refresh (F5)................................................................................................................ 52 View Auto Refresh ............................................................................................................. 52 View Navigator ................................................................................................................... 52 View Show Service Tabs .................................................................................................... 52
810-1648-05 Rev A TM View Software User's Manual
5 of 73
Help Menu .................................................................................................................................. 52 Help Documentation .......................................................................................................... 52 Help Licensing .................................................................................................................... 52 Help Install Sample Files ................................................................................................... 53 Help About TM View ......................................................................................................... 53
Using the Duval Triangle .............................................................................................................. 53 Overview ..................................................................................................................................... 53 Interpretation of regions ........................................................................................................... 54 Interpretation of the Triangle ................................................................................................... 55 Multiple data points ................................................................................................................... 55 Manually Entered DGA data .................................................................................................... 55 Summary ..................................................................................................................................... 55
Using the Serveron Rogers Ratio Viewer ................................................................................... 55 Introduction ................................................................................................................................ 56 Functional Overview ................................................................................................................. 56 Interpretation of Regions .......................................................................................................... 58 Interpreting the Graphical View .............................................................................................. 58 Summary ..................................................................................................................................... 59
Maintaining TM View Installations ................................................................................................. 60 Configuring Communications ..................................................................................................... 60
Introduction ................................................................................................................................ 60 Local Area Network (LAN) ...................................................................................................... 61 RS-485........................................................................................................................................... 61 Telephone Modem ..................................................................................................................... 61 RS-232........................................................................................................................................... 62 RS-232 with radio (FreeWave®) ............................................................................................... 62 Telephone Modem with radio (FreeWave®) ......................................................................... 63
Configuring Modems .................................................................................................................... 64 Modem Initialization ................................................................................................................. 64 Advanced Dialing Strings ......................................................................................................... 65
Overview .................................................................................................................................. 65 Send/Expect Protocol ............................................................................................................. 65
Configuring TAPI Modems ...................................................................................................... 66 Troubleshooting ............................................................................................................................. 67
Corrupt or Invalid Files ............................................................................................................. 67 Overview .................................................................................................................................. 67 File Structure ............................................................................................................................ 67 Causes of File Corruption ....................................................................................................... 69 Repairing Damaged Files ....................................................................................................... 69
Menu Items Unavailable (“Grayed Out”)............................................................................... 70 Theory of Operations ..................................................................................................................... 70
Overview ..................................................................................................................................... 70 Viewer Component .................................................................................................................... 71 Poller Component ...................................................................................................................... 71
Poller Output ............................................................................................................................ 72
810-1648-05 Rev A TM View Software User's Manual
6 of 73
Before You Begin
About This Manual This User‟s Manual provides the information that you need to install, setup, and use the Serveron TM View software to monitor and diagnose the state of your transformer assets.
The manual is organized into chapters of increasing depth and detail. The chapters Installing TM View and Using TM View are informal user guides. The TM View
Reference chapter provides detailed descriptions of all parts of the user interface. Finally, the chapter titled Maintaining TM View Installations provides additional information.
Note: this manual assumes you have basic familiarity with the operating principles of your Serveron Online Transformer Monitor. If you require
information regarding the features, operation, and installation of a Serveron transformer monitor please review the technical documentation available at the Serveron web site www.serveron.com or contact your local distributor.
Current contact information for authorized distributors and technical support is published on the Serveron web site.
References
1. DNP3 Guide for Serveron DGA Monitors.pdf This is the guide for using the DNP3 protocol for communications with TM Series DGA monitors.
2. TM View OPC User Guide.pdf This is the guide for using the OPC interface of the Serveron Integrated Poller, which is part of the TM View server and standalone installations (not the Viewer-only installations).
3. ModBus Guide for Serveron DGA Monitors.pdf This is the guide for using the ModBus protocol for communications with TM Series DGA monitors.
4. TM View ODBC User Guide.pdf This is the reference guide for using ODBC output from the Serveron Integrated Poller installed with Server versions of TM View
5. TM View ODBC Tutorial A short tutorial guiding the user through using ODBC to export the data polled by TM View.
6. TM View Notifications User Guide This is the reference guide for the Alarms Notifications, available with the Server install of TM View.
810-1648-05 Rev A TM View Software User's Manual
7 of 73
About TM View Software TM View is a software application for Windows®-compatible PCs. It is used to retrieve and display data that has been collected by a Serveron on-line transformer monitor and also to change settings within the monitor. TM View does not measure gas-in-oil levels; the Serveron monitor makes those measurements. TM View retrieves these measurements from the monitor and displays them in a variety of formats. Serveron monitors measure, record, and report the status of fault gases in transformer insulating oil.
TM View requires an Ethernet, dial-up, direct serial or radio link from the PC to the Serveron monitor in order to retrieve measurements and change settings. Transformer data retrieved by TM View is stored in ordinary files on the PC.
Retrieving data does not cause the monitor to lose or delete its internal measurement history. This allows more than one computer running TM View to remotely retrieve data from a single Serveron monitor. Alternatively, the security features of TM View can be used to restrict monitor access to a single, privileged installation on a single computer.
Note: TM View 3.4 is fully compatible with transformer data files created by earlier versions of TM View. After you install or upgrade to Serveron TM
View 3.4 software, however, all TM View users at your site must upgrade to version 3.4. Files created or updated with Serveron TM View 3.4 software
cannot be viewed using TM View software version 2.x or older. Users who have not upgraded will be notified of an error when they attempt to view or
update these files.
Windows 2000 Support TM View 3.4 is not supported on Windows 2000. TM View 3.3 is the last version of TM View supported on Windows 2000. TM View 3.4 is supported on Windows XP, Windows Server 2003, Windows Vista and Windows 7.
810-1648-05 Rev A TM View Software User's Manual
8 of 73
TM View Feature Overview
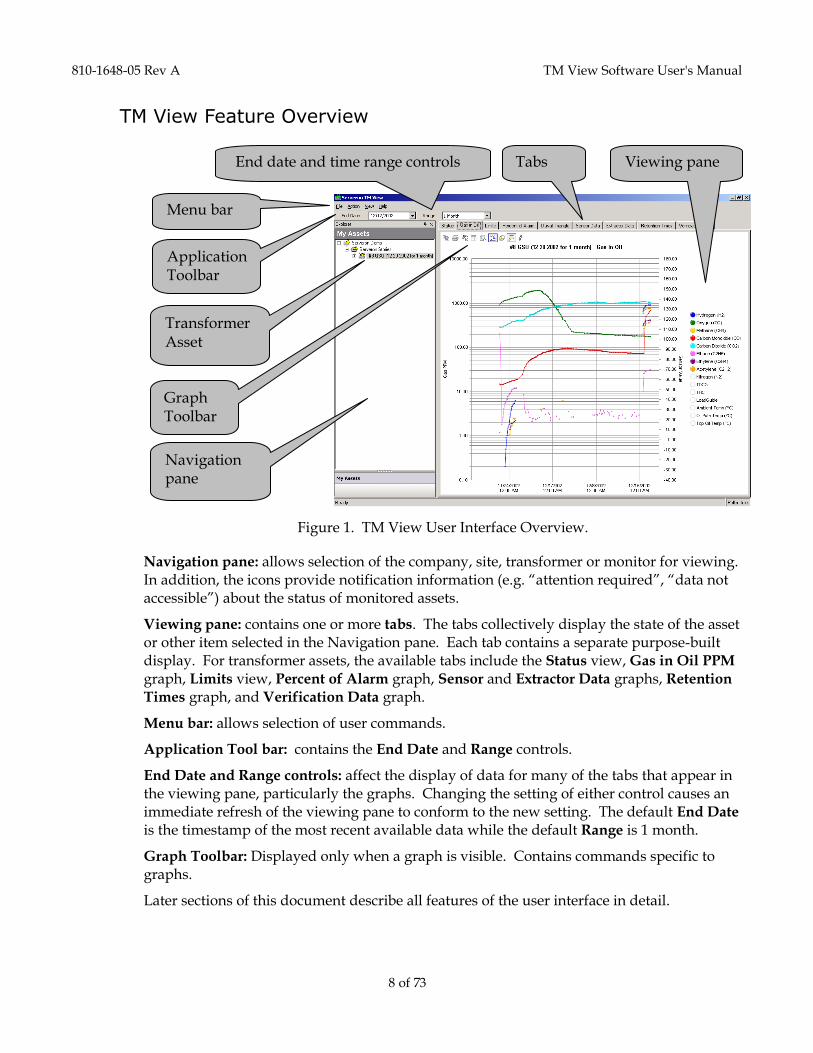
Figure 1. TM View User Interface Overview.
Navigation pane: allows selection of the company, site, transformer or monitor for viewing. In addition, the icons provide notification information (e.g. “attention required”, “data not accessible”) about the status of monitored assets.
Viewing pane: contains one or more tabs. The tabs collectively display the state of the asset or other item selected in the Navigation pane. Each tab contains a separate purpose-built display. For transformer assets, the available tabs include the Status view, Gas in Oil PPM graph, Limits view, Percent of Alarm graph, Sensor and Extractor Data graphs, Retention
Times graph, and Verification Data graph.
Menu bar: allows selection of user commands.
Application Tool bar: contains the End Date and Range controls.
End Date and Range controls: affect the display of data for many of the tabs that appear in the viewing pane, particularly the graphs. Changing the setting of either control causes an immediate refresh of the viewing pane to conform to the new setting. The default End Date is the timestamp of the most recent available data while the default Range is 1 month.
Graph Toolbar: Displayed only when a graph is visible. Contains commands specific to graphs.
Later sections of this document describe all features of the user interface in detail.
Navigation pane
Transformer Asset
Application Toolbar
Menu bar
Viewing pane Tabs End date and time range controls
Graph Toolbar
810-1648-05 Rev A TM View Software User's Manual
9 of 73
Installing TM View
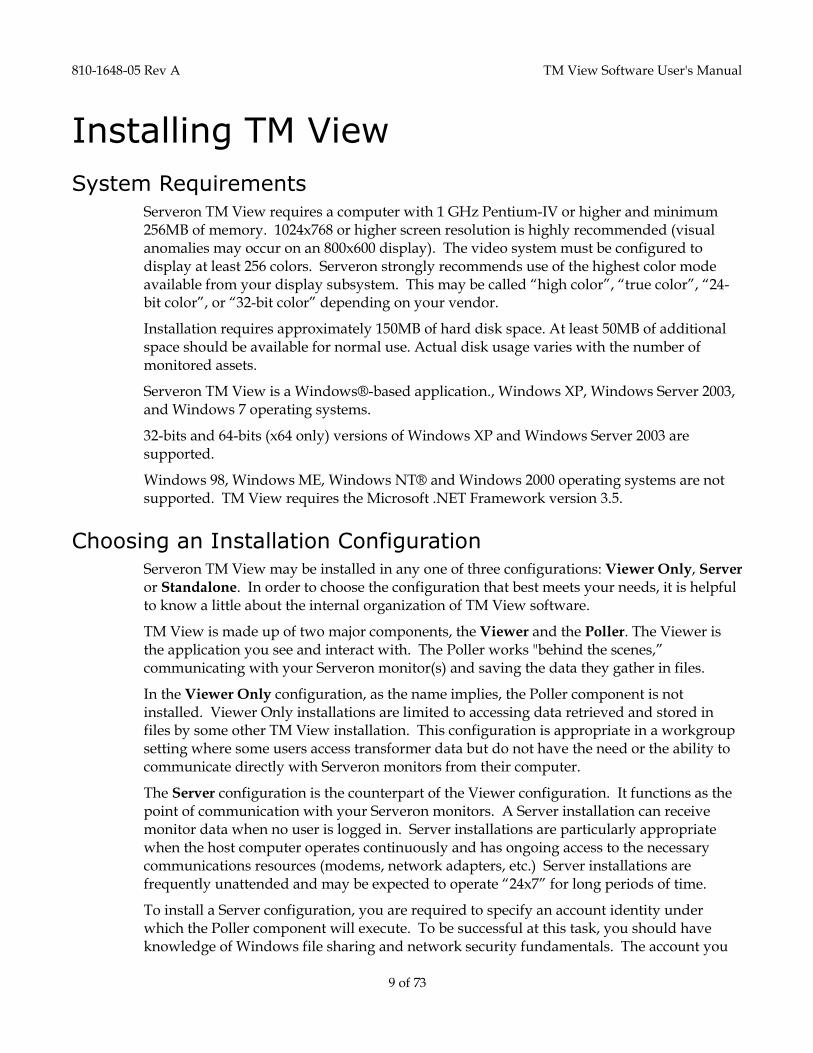
System Requirements Serveron TM View requires a computer with 1 GHz Pentium-IV or higher and minimum 256MB of memory. 1024x768 or higher screen resolution is highly recommended (visual anomalies may occur on an 800x600 display). The video system must be configured to display at least 256 colors. Serveron strongly recommends use of the highest color mode available from your display subsystem. This may be called “high color”, “true color”, “24-bit color”, or “32-bit color” depending on your vendor.
Installation requires approximately 150MB of hard disk space. At least 50MB of additional space should be available for normal use. Actual disk usage varies with the number of monitored assets.
Serveron TM View is a Windows®-based application., Windows XP, Windows Server 2003, and Windows 7 operating systems.
32-bits and 64-bits (x64 only) versions of Windows XP and Windows Server 2003 are supported.
Windows 98, Windows ME, Windows NT® and Windows 2000 operating systems are not supported. TM View requires the Microsoft .NET Framework version 3.5.
Choosing an Installation Configuration Serveron TM View may be installed in any one of three configurations: Viewer Only, Server or Standalone. In order to choose the configuration that best meets your needs, it is helpful to know a little about the internal organization of TM View software.
TM View is made up of two major components, the Viewer and the Poller. The Viewer is the application you see and interact with. The Poller works "behind the scenes,” communicating with your Serveron monitor(s) and saving the data they gather in files.
In the Viewer Only configuration, as the name implies, the Poller component is not installed. Viewer Only installations are limited to accessing data retrieved and stored in files by some other TM View installation. This configuration is appropriate in a workgroup setting where some users access transformer data but do not have the need or the ability to communicate directly with Serveron monitors from their computer.
The Server configuration is the counterpart of the Viewer configuration. It functions as the point of communication with your Serveron monitors. A Server installation can receive monitor data when no user is logged in. Server installations are particularly appropriate when the host computer operates continuously and has ongoing access to the necessary communications resources (modems, network adapters, etc.) Server installations are frequently unattended and may be expected to operate “24x7” for long periods of time.
To install a Server configuration, you are required to specify an account identity under which the Poller component will execute. To be successful at this task, you should have knowledge of Windows file sharing and network security fundamentals. The account you
810-1648-05 Rev A TM View Software User's Manual
10 of 73
choose must have sufficient privileges. These include the privilege to access all files (including network files) that will be used by the Poller and also privilege to use the system-wide portion of the Registry. In keeping with industry best practices, Serveron recommends that you do not assign unnecessary privileges to this account.
In Server installs, the user identity and credentials used to run the Serveron Integrated Poller must have local Administrator privileges. This is necessary for the Poller to successfully store and retrieve various data items required by the program.
If these concepts are not clear to you, Serveron recommends that you create a Standalone configuration.
In the Standalone configuration, the Poller component is installed in your Startup folder and runs only when you are logged in. Data cannot be received from the monitor when you are not logged in. The benefit of the Standalone configuration is that it largely eliminates the need for special knowledge of file sharing and network security.
A Standalone installation of TM View behaves like a traditional desktop application program. Note that this configuration is intended for use by a single user on a single computer. If multiple user login identities will be accessing TM View on the same computer, Serveron recommends that a Server configuration be used instead.
Installation Procedure
Note: Administrative privilege is required to install the software.
When you insert the installation CD-ROM, TM View setup may start automatically. If it does not, please double click AutoRun.exe in the root directory of the CD-ROM to start it. Setup will install the necessary prerequisite software and then install TM View.
TM View requires version 3.5 of the Microsoft .NET Framework, Visual Studio 2005 and Visual Studio 2008 redistributable packages (x86 for 32-bits processors, x64 for 64-bits processors running Windows XP Pro x64 Edition), and the OPC core redistributable package. If the installation program detects that this mandatory prerequisite is not present, it will be installed automatically from the CD-ROM.
Serveron recommends that you use Windows Update to check for any recent updates to Microsoft components after installing TM View on your computer.
When installation is complete, you may start TM View using either the Start menu or the Desktop icon.

810-1648-05 Rev A TM View Software User's Manual
11 of 73
Upgrade Procedure
Note: Administrative privilege is required to upgrade the software.
Insert the installation CD-ROM. TM View setup should start automatically. If it does not, please double click AutoRun.EXE in the root directory of the CD-ROM to start it. Setup will automatically upgrade your existing installation to version 3.4 of TM View.
TM View requires version 3.5 of the Microsoft .NET Framework, Visual Studio 2005 and Visual Studio 2008 redistributable packages (x86 for 32-bits processors, x64 for 64-bits processors running Windows XP Pro x64 Edition), and the OPC core redistributable package. If the installation program detects that this mandatory prerequisite is not present, it will be installed automatically from the CD-ROM.
Note: TM View 3.4 is fully compatible with transformer data files created by earlier versions of TM View. After you install or upgrade to Serveron TM
View 3.4 software, however, all TM View users at your site must upgrade to version 3.4. Files created or updated with Serveron TM View 3.4 software
cannot be viewed using older versions of TM View software. Users who have not upgraded will be notified of an error when they attempt to view or
update these files.
Serveron recommends that you use Windows Update to check for any recent updates to Microsoft components after upgrading to TM View version 3.4 on your computer.
When installation is complete, you may start TM View using either the Start menu or the Desktop icon.
810-1648-05 Rev A TM View Software User's Manual
12 of 73
Using TM View This chapter contains an informal guide to the features of TM View. Details of each part of the user interface appear in the TM View Reference chapter later in this manual.
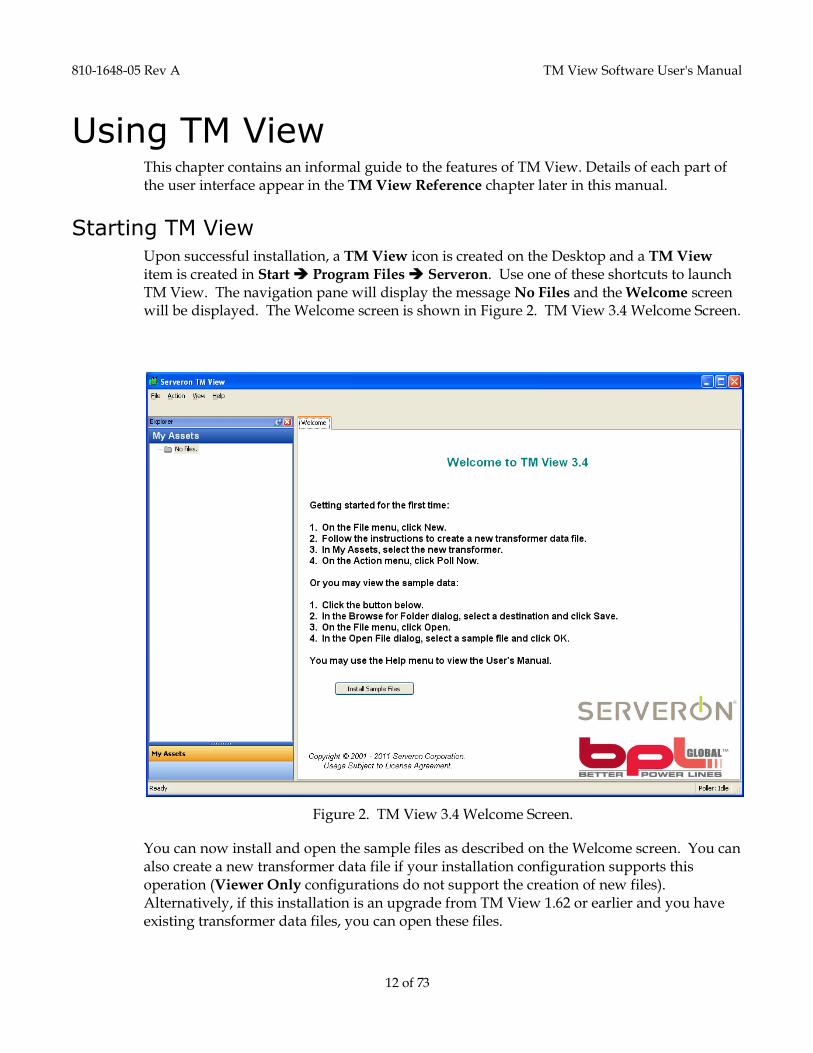
Starting TM View Upon successful installation, a TM View icon is created on the Desktop and a TM View
item is created in Start Program Files Serveron. Use one of these shortcuts to launch TM View. The navigation pane will display the message No Files and the Welcome screen will be displayed. The Welcome screen is shown in Figure 2. TM View 3.4 Welcome Screen.
Figure 2. TM View 3.4 Welcome Screen.
You can now install and open the sample files as described on the Welcome screen. You can also create a new transformer data file if your installation configuration supports this operation (Viewer Only configurations do not support the creation of new files). Alternatively, if this installation is an upgrade from TM View 1.62 or earlier and you have existing transformer data files, you can open these files.
810-1648-05 Rev A TM View Software User's Manual
13 of 73
Creating New Files (Adding an Asset)
Note: this operation is available if you selected the Standalone or Server configuration during installation. If you selected Viewer Only, operations
that create and modify files are not available to you.
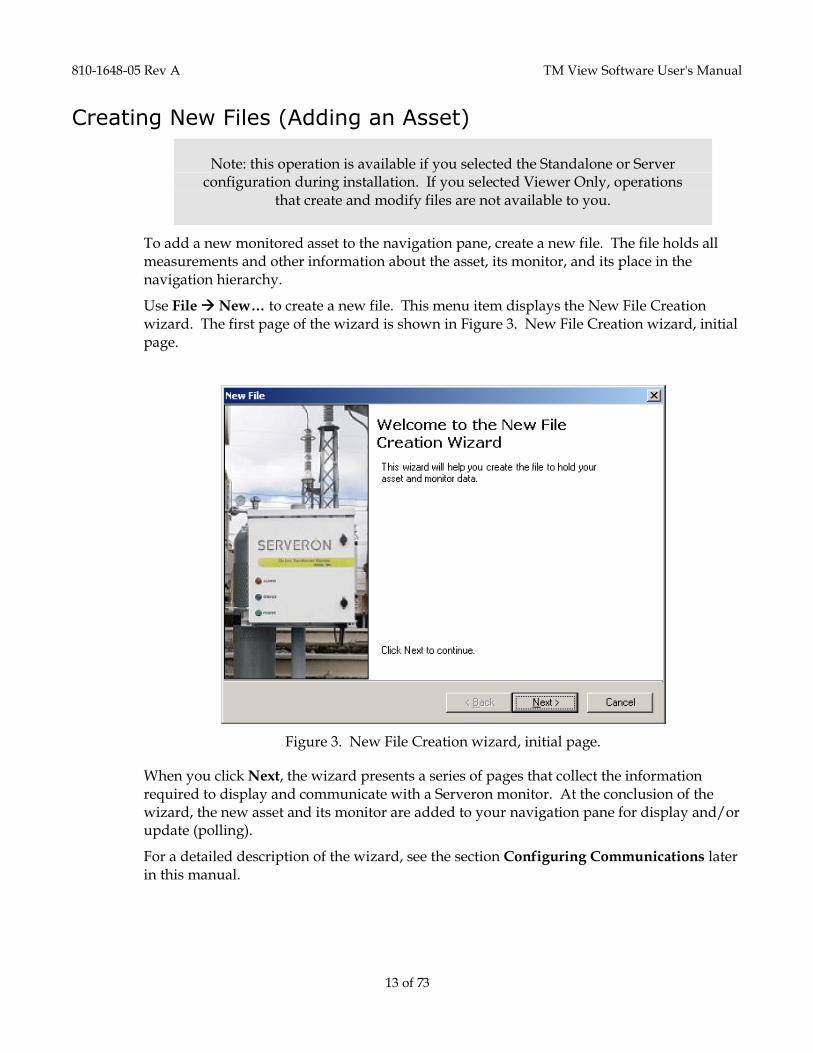
To add a new monitored asset to the navigation pane, create a new file. The file holds all measurements and other information about the asset, its monitor, and its place in the navigation hierarchy.
Use File New… to create a new file. This menu item displays the New File Creation wizard. The first page of the wizard is shown in Figure 3. New File Creation wizard, initial page.
Figure 3. New File Creation wizard, initial page.
When you click Next, the wizard presents a series of pages that collect the information required to display and communicate with a Serveron monitor. At the conclusion of the wizard, the new asset and its monitor are added to your navigation pane for display and/or update (polling).
For a detailed description of the wizard, see the section Configuring Communications later in this manual.

810-1648-05 Rev A TM View Software User's Manual
14 of 73
Opening Files To familiarize yourself with the TM View user interface, you may examine the sample files. To do so, first click the Install Sample Files button on the Welcome screen or click Install
Sample Files… in the Help menu. Use the browse box to choose a location (e.g. your My
Documents folder). When you click OK, the files are copied to the location you chose (e.g., My Documents). You do not need the installation media to install the sample files.
Now select Open… from the File menu and navigate to the location you selected in the previous step. Select one of the sample files and click the Open button. The file contents are added to the navigation pane. The viewing pane displays the Status tab shown in Figure 4.
Figure 4. Asset selected in navigation pane and Status tab displayed in viewing pane.
Note: since the contents of the sample files were captured by Serveron some time ago, the Data Age section on the Status tab warns you that the file contents are not up-to-date and the Alarm History section displays the
message WARNING: No Recent Gas Data.
Additional information about the Status tab can be found in the section “Using the Asset
Status Tab” later in this manual.
810-1648-05 Rev A TM View Software User's Manual
15 of 73
Navigating to Company, Sites, Assets and Monitors The navigation pane is used to select a company, site, transformer or monitor for display. It is organized as a hierarchy of Company, Sites, Assets and their Monitors. Its structure is similar to the navigation pane found in Windows Explorer and in many other software applications and web sites.
The navigation pane remembers all the files you have opened and provides easy access to their contents. When you open additional files, their contents are merged with existing sites and companies if the names match.
Click on the small + adjacent to an icon to expand it. Expanding the transformer icon, for example, displays the icon representing the monitor. If you then click the monitor icon, the viewing pane redraws to show tabs specific to managing the monitor‟s operation (scheduling and communications).
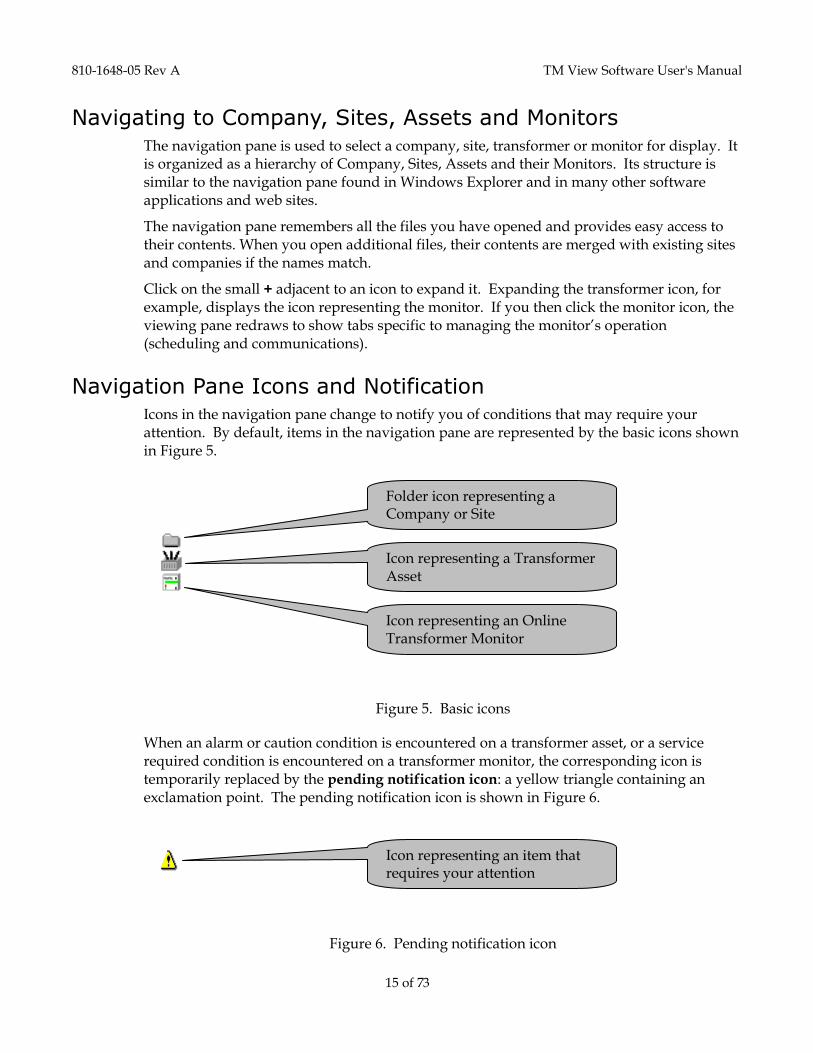
Navigation Pane Icons and Notification Icons in the navigation pane change to notify you of conditions that may require your attention. By default, items in the navigation pane are represented by the basic icons shown in Figure 5.
Figure 5. Basic icons
When an alarm or caution condition is encountered on a transformer asset, or a service required condition is encountered on a transformer monitor, the corresponding icon is temporarily replaced by the pending notification icon: a yellow triangle containing an exclamation point. The pending notification icon is shown in Figure 6.
Figure 6. Pending notification icon
Icon representing an item that requires your attention
Folder icon representing a Company or Site
Icon representing a Transformer Asset
Icon representing an Online Transformer Monitor
810-1648-05 Rev A TM View Software User's Manual
16 of 73
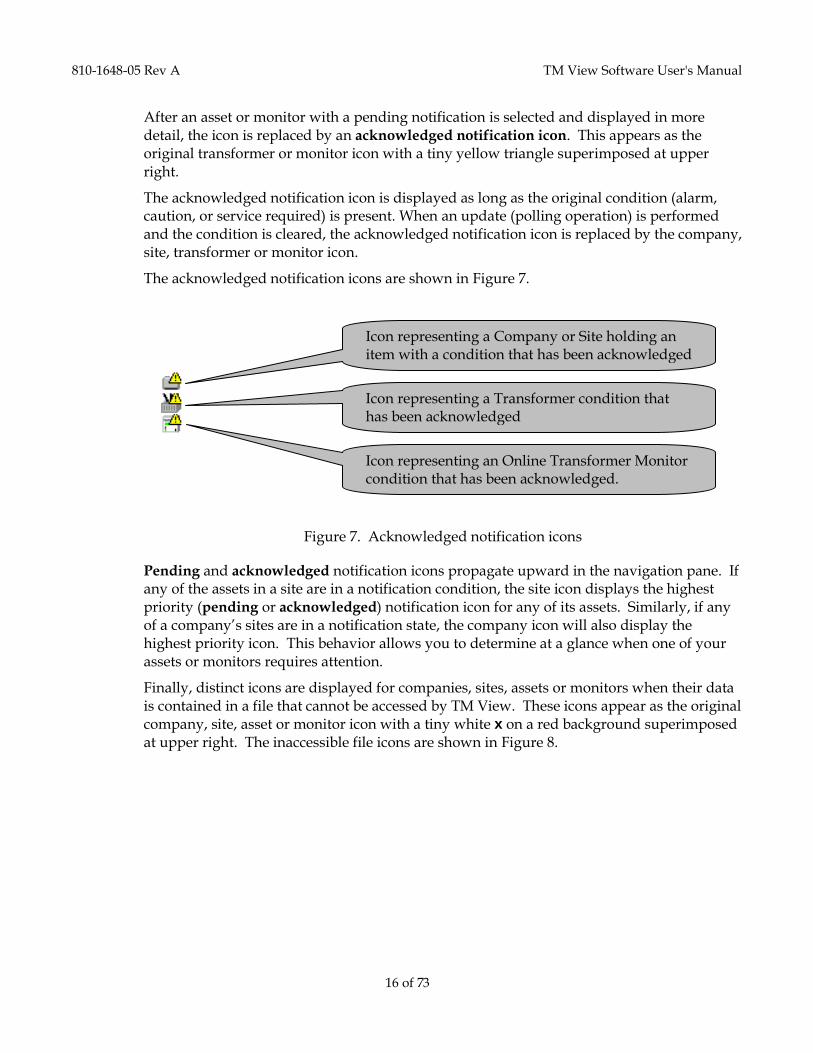
After an asset or monitor with a pending notification is selected and displayed in more detail, the icon is replaced by an acknowledged notification icon. This appears as the original transformer or monitor icon with a tiny yellow triangle superimposed at upper right.
The acknowledged notification icon is displayed as long as the original condition (alarm, caution, or service required) is present. When an update (polling operation) is performed and the condition is cleared, the acknowledged notification icon is replaced by the company, site, transformer or monitor icon.
The acknowledged notification icons are shown in Figure 7.
Figure 7. Acknowledged notification icons
Pending and acknowledged notification icons propagate upward in the navigation pane. If any of the assets in a site are in a notification condition, the site icon displays the highest priority (pending or acknowledged) notification icon for any of its assets. Similarly, if any of a company‟s sites are in a notification state, the company icon will also display the highest priority icon. This behavior allows you to determine at a glance when one of your assets or monitors requires attention.
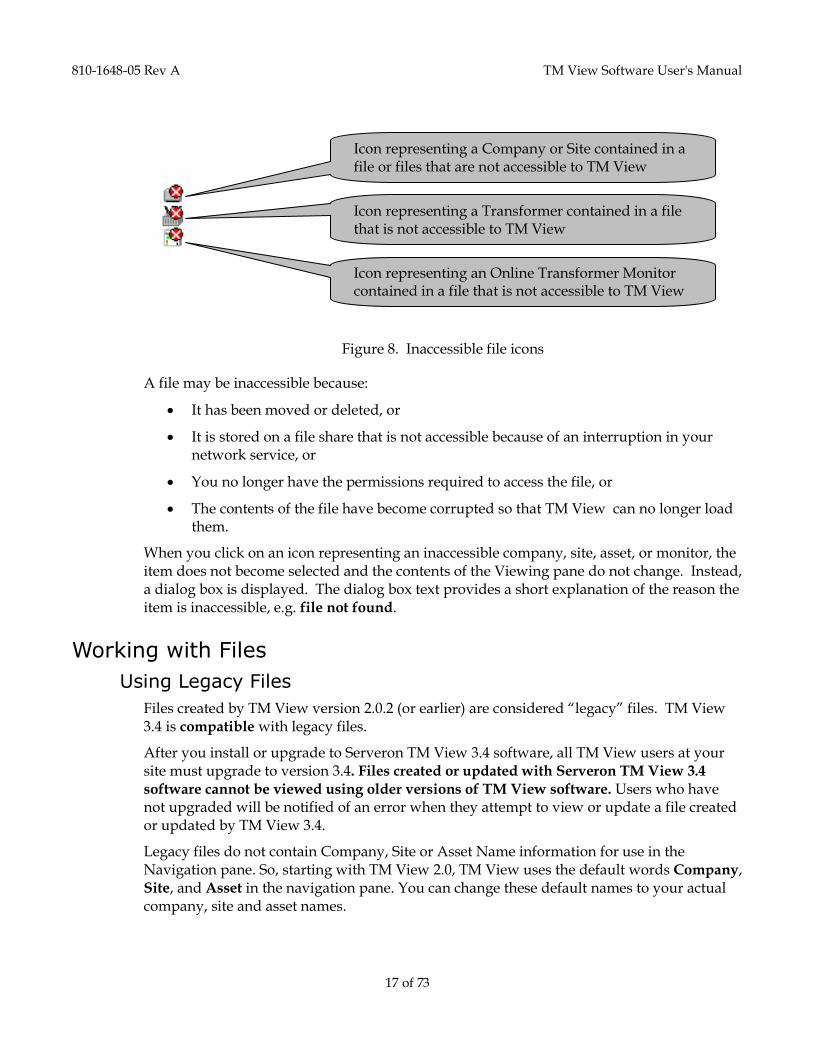
Finally, distinct icons are displayed for companies, sites, assets or monitors when their data is contained in a file that cannot be accessed by TM View. These icons appear as the original company, site, asset or monitor icon with a tiny white x on a red background superimposed at upper right. The inaccessible file icons are shown in Figure 8.
Icon representing a Company or Site holding an item with a condition that has been acknowledged
Icon representing a Transformer condition that has been acknowledged
Icon representing an Online Transformer Monitor condition that has been acknowledged.
810-1648-05 Rev A TM View Software User's Manual
17 of 73
Figure 8. Inaccessible file icons
A file may be inaccessible because:
It has been moved or deleted, or
It is stored on a file share that is not accessible because of an interruption in your network service, or
You no longer have the permissions required to access the file, or
The contents of the file have become corrupted so that TM View can no longer load them.
When you click on an icon representing an inaccessible company, site, asset, or monitor, the item does not become selected and the contents of the Viewing pane do not change. Instead, a dialog box is displayed. The dialog box text provides a short explanation of the reason the item is inaccessible, e.g. file not found.
Working with Files
Using Legacy Files
Files created by TM View version 2.0.2 (or earlier) are considered “legacy” files. TM View 3.4 is compatible with legacy files.
After you install or upgrade to Serveron TM View 3.4 software, all TM View users at your site must upgrade to version 3.4. Files created or updated with Serveron TM View 3.4
software cannot be viewed using older versions of TM View software. Users who have not upgraded will be notified of an error when they attempt to view or update a file created or updated by TM View 3.4.
Legacy files do not contain Company, Site or Asset Name information for use in the Navigation pane. So, starting with TM View 2.0, TM View uses the default words Company, Site, and Asset in the navigation pane. You can change these default names to your actual company, site and asset names.
Icon representing a Company or Site contained in a file or files that are not accessible to TM View
Icon representing a Transformer contained in a file that is not accessible to TM View
Icon representing an Online Transformer Monitor contained in a file that is not accessible to TM View
810-1648-05 Rev A TM View Software User's Manual
18 of 73
To change a name, first select the Company, Site, or Asset icon in the Navigation pane and then click Rename… in the Action menu. Updated values are stored in the file itself so the change need only be performed once. Please see the Menu Commands section of this manual for more information.
Corrupt or Invalid Files
TM View 3.4 differs from earlier versions of TM View in its handling of corrupt or invalid files. TM View 3.4 generally detects and refuses to open corrupt or invalid files where earlier versions of TM View may have provided partial functionality or behaved incorrectly.
If you encounter a Corrupt or Invalid message when opening a legacy file, please see the Troubleshooting section of this manual or contact Serveron or your Serveron representative for assistance. In most cases, corrupt or invalid files can be repaired without loss of data.
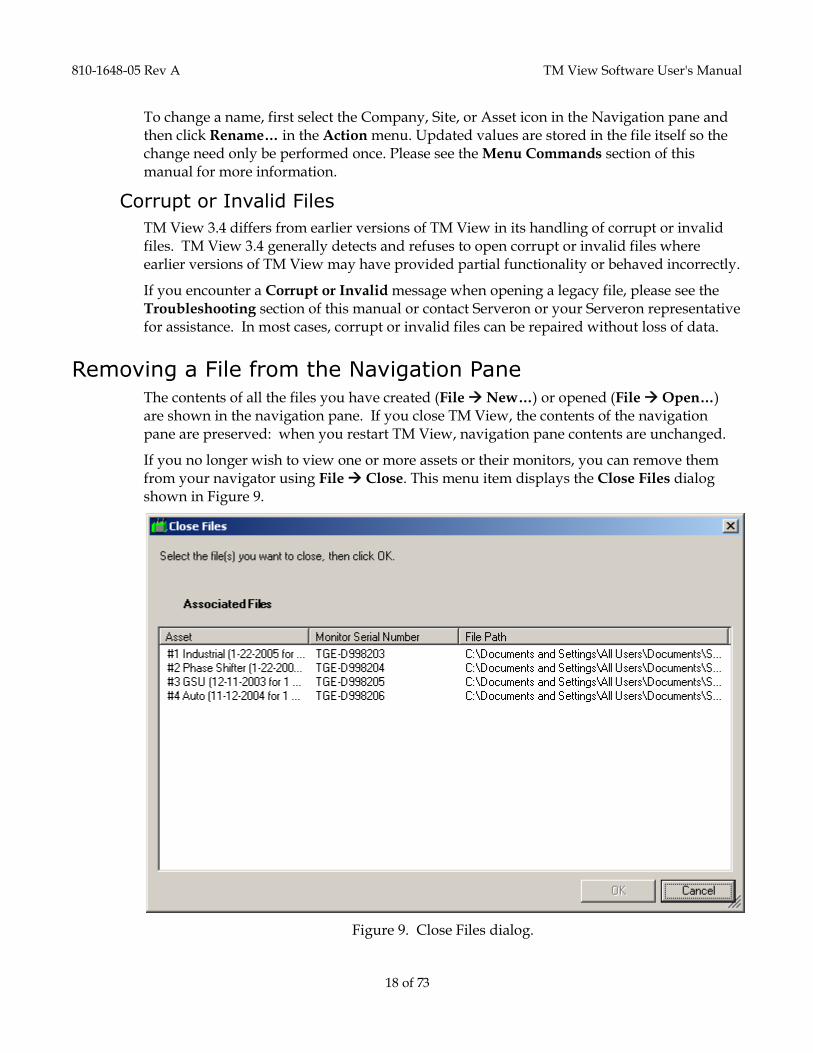
Removing a File from the Navigation Pane The contents of all the files you have created (File New…) or opened (File Open…) are shown in the navigation pane. If you close TM View, the contents of the navigation pane are preserved: when you restart TM View, navigation pane contents are unchanged.
If you no longer wish to view one or more assets or their monitors, you can remove them from your navigator using File Close. This menu item displays the Close Files dialog shown in Figure 9.
Figure 9. Close Files dialog.
810-1648-05 Rev A TM View Software User's Manual
19 of 73
Select the row(s) containing the monitor(s) you no longer wish to view and click OK. The dialog clears and the screen is redrawn. If you close all files, the No files message is displayed in the navigation pane and the Welcome screen appears in the viewing pane.
Sites continue to be displayed so long as they contain any visible transformer assets, and companies continue to be displayed so long as they contain any visible sites. If you close all the transformers within a Site, the Site will disappear from your navigator as well.
Closing a file merely removes the file from the navigation pane. It does not delete or alter the file data itself. To again display information for a transformer and its monitor in TM View, use File Open… to add the file to the navigation pane.
Using Commands Commands (user actions) appear in the TM View menu bar. Menu items are unavailable (“grayed out”) when they do not apply to the current selection; for example, the File
Export… menu item is available only when the Viewing Pane shows data that may be exported. Otherwise, it is grayed out.
Note: if your TM View installation is a Viewer Only configuration, all commands that update or modify data are unavailable to you. These
commands must be performed from a Standalone or Server configuration.
The contents of the Action menu change according to the currently selected navigation item and tab. The command to Enter DGA…, for example, is only available when viewing the Gas in Oil graph that displays the DGA data. The Enter DGA command does not appear in the menu when viewing other navigational selections or tabs.
Some Action menu commands are always present. These commands affect the TM View application as a whole and appear at the top of the Action menu. They include Select
Modem and Send Diagnostic Data.
All TM View commands are described in the Menu Commands section of the TM View
Reference section of this manual.
Using Tabs This section provides an overview of the status and graphing tabs.
Using the Asset Status Tab
When a transformer asset is selected, the default (leftmost) tab presents a dashboard-like status overview. The tab contains colored status indicators, an Alarm History display, and certain textual information. The tab is shown in Figure 10.
810-1648-05 Rev A TM View Software User's Manual
20 of 73
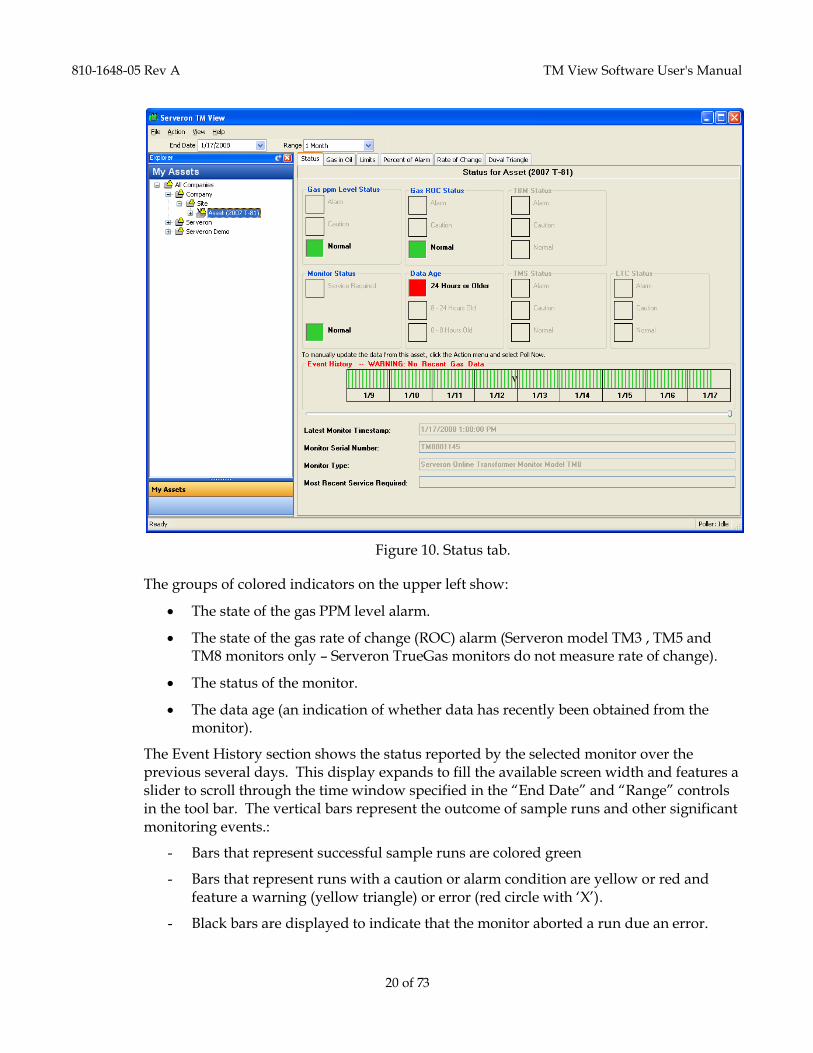
Figure 10. Status tab.
The groups of colored indicators on the upper left show:
The state of the gas PPM level alarm.
The state of the gas rate of change (ROC) alarm (Serveron model TM3 , TM5 and TM8 monitors only – Serveron TrueGas monitors do not measure rate of change).
The status of the monitor.
The data age (an indication of whether data has recently been obtained from the monitor).
The Event History section shows the status reported by the selected monitor over the previous several days. This display expands to fill the available screen width and features a slider to scroll through the time window specified in the “End Date” and “Range” controls in the tool bar. The vertical bars represent the outcome of sample runs and other significant monitoring events.:
- Bars that represent successful sample runs are colored green
- Bars that represent runs with a caution or alarm condition are yellow or red and feature a warning (yellow triangle) or error (red circle with „X‟).
- Black bars are displayed to indicate that the monitor aborted a run due an error.
810-1648-05 Rev A TM View Software User's Manual
21 of 73
- Service Required conditions in the monitor at the time it was polled are represented by a blue bar with a Serveron Monitor icon with a blue exclamation point.
- White bars with a „V‟ character through it represent verification runs.
- If the most recent data is more than about 48 hours old, the Event History label displays WARNING: No Recent Gas Data in red.
Note: for more information about sample runs, Service Required conditions, and other Serveron Online Transformer Monitor principles of operation,
please consult the documentation that was provided with your monitor or visit http://www.serveron.com.
To obtain details of a particular day‟s runs and other significant monitor events, move the mouse pointer over the rectangle (tile) representing that day and click. A small dialog box will be shown containing details of that day‟s activity. Click OK to clear the dialog.
The Action menu for the Status tab contains several commands. For details of these commands, please refer to the TM View Reference chapter later in this manual.
External Monitors: TBM, TMS and LTC
The Status tab displays 3 other boxes, labeled by default “TBM Status”, “TMS Status” and “LTC Status”. These represent the status from optional external monitors which can be installed alongside the TM3, TM5 or TM8 monitors.
These monitors are connected to the TMx through any available auxiliary input (4-20 mA current loop) of the TMx.
“TBM” stands for “Transformer Bushing Monitor”, so the TBM box would show the status of a Serveron TBM connected to this TMx.
“TMS” stands for “Temperature Monitoring System”, so the TMS box would show the status of a Serveron TMS system connected to this TMx.
“LTC” stands for “Load-Tap Changer”, so the TC box would show the status of a Serveron LTC monitor connected to this TMx.
The requirements to enable these features are as follows:
1. Only Serveron Monitors installed by approved Serveron technicians are supported.
2. The monitors must be properly configured in the TMx by the installation technician, using the approved Serveron configuration software.
3. The monitor must also be configured in TM View, using the External Configuration dialog.
4. This feature is only supported with Serveron TM8, TM5 and TM3 monitors.
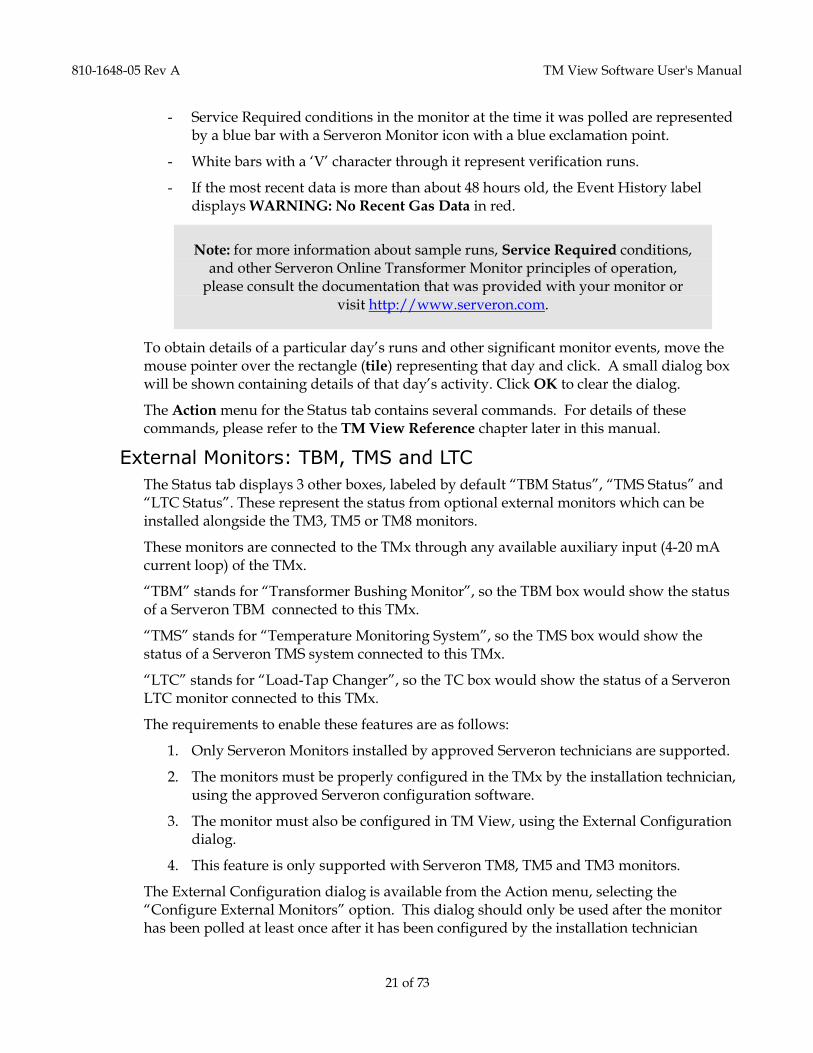
The External Configuration dialog is available from the Action menu, selecting the “Configure External Monitors” option. This dialog should only be used after the monitor has been polled at least once after it has been configured by the installation technician
810-1648-05 Rev A TM View Software User's Manual
22 of 73
The elements of this dialog are identical for all types of monitors.
The tabs at the top of the dialog will have the same name as was configured in the TMx when the external monitor was installed.
The name is repeated in the “Name of Monitor” control.
By default, the alarm and caution levels are set at the minimum of the range for that input, as defined by the installation technician, and the alarm/caution status of the monitor is „unknown‟ (no status). The range is displayed in the “Range” control at the right end of the Alarm Level slider.
Using the sliders, the user can set the alarm and caution levels for the monitor.
This status is a feature of the TM View program only: there is no physical output related to that status other than a visual indication on the status tab.
The “Manager Application” is an option available to the user, to specify an external application (provided with the monitor itself), which TM View can launch for the user, as a convenience.
The external application needs to have been installed by the user on this computer prior to configuring the external monitor. The “Browse…” button allows the user to navigate to the executable of that application.
For TMS the application is the configuration utility for the TMS, provided on a CD when the TMS is delivered and installed.
For LTC the application is a configuration and display application provided with the monitor when it is installed.
810-1648-05 Rev A TM View Software User's Manual
23 of 73
For TBM monitors there is no Manager Application: instead, the user must use Windows Remote Desktop to connect to the monitor. The monitor must also be connected to a TCP/IP LAN connection, and the port 3389 must be allowed through any site firewall for the connection to be established. The manager application for TBM is, instead, the location of the RDP file which can be saved by the Remote Desktop Application.
Using the Graphs
The Gas in Oil PPM, Rate of Change, and Percent of Alarm graph tabs share several key features. (The Rate of Change graph is available for Serveron model TM8, TM5 and TM3 monitors only. Serveron TrueGas monitors do not compute Rate of Change.)
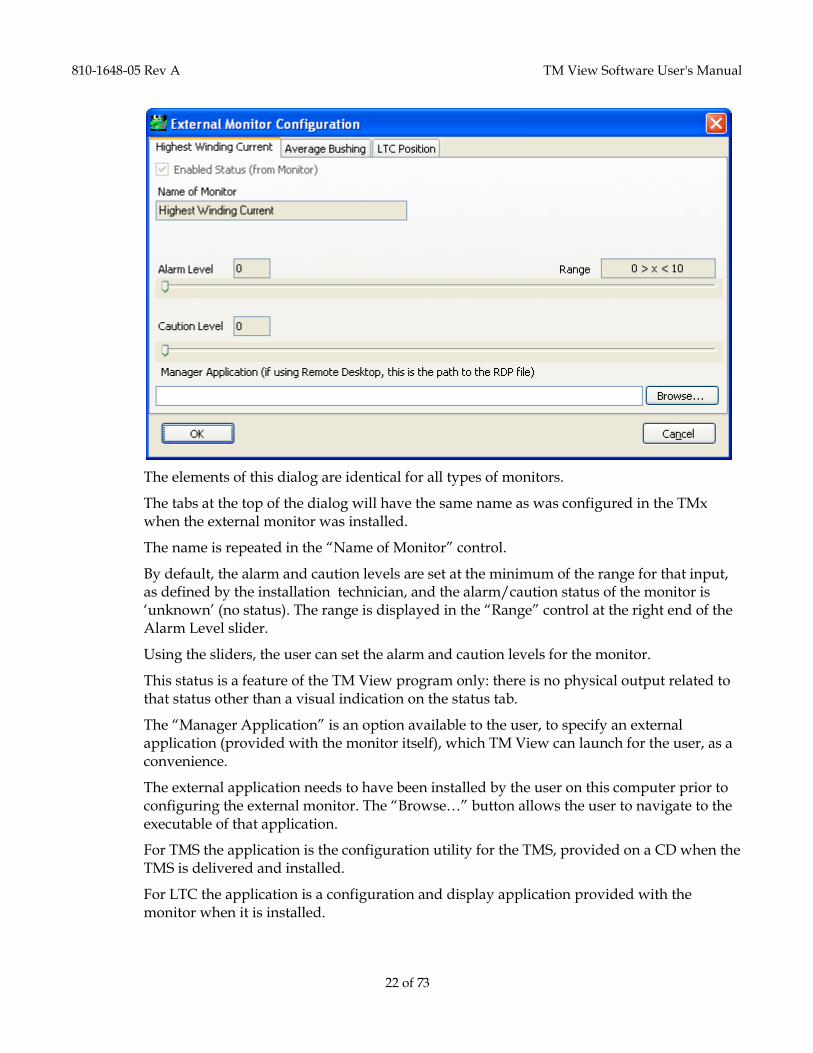
The content of a typical graph tab is shown in Figure 11.
Figure 11. Graph tab components.
These graphs display two vertical (Y) axes, one at the left and the other at the right. The values of gases are always displayed relative to the left or primary axis, which may be either logarithmic or linear. Sensor readings (LoadGuide, Ambient Temperature, etc) are displayed relative to the right or secondary axis, which always displays a linear scale.
A graph legend indicating the color of each gas or sensor data series appears to the right of the graph area. The graph legend relates colors to measured values. Carbon Monoxide (CO), for example, is always shown in red. When a graph is first displayed, measured gas values are shown while computed values and sensor values are hidden. The colored circle adjacent to each series names in the legend is a control buttons. To display or hide a particular gas or sensor data series, click the appropriate button.
Primary Y (gas value) axis
Primary Y axis label
X (time) axis
Graph toolbar Secondary Y (sensor) axis
Graph legend
Graph title
DGA
DGA legend
810-1648-05 Rev A TM View Software User's Manual
24 of 73
Serveron model TM8, TM5 and TM3 monitors support configurable labeling for external sensors. For these models, the external sensor labels are taken from information stored in the transformer monitor itself. The labels are normally configured when the monitor is installed. TM View does not support the ability to change the configured labels.
When a TBM, TMS or LTC external monitor is connected and configured in the monitor, the name configured for that monitor will be read when the monitor is polled, and displayed on the graph.
Serveron TrueGas monitors do not support configurable labeling, so external sensor labels for TrueGas monitors are determined by the TM View software.
The legend information at extreme upper right indicates that one or more manual dissolved gas analysis (DGA) readings are currently being displayed on the graph. This legend block appears only when manual DGA readings are being shown. On the graph surface, manual
DGA data appears as small x markers in the color of the corresponding gas data series. To see the numerical values of DGA data, simply slide the mouse over the area of the DGA.
For more information about the Gas in Oil PPM, Rate of Change, and Percent of Alarm tabs, including instructions for entering manual DGA readings, see the corresponding section in the TM View Reference chapter later in this manual.
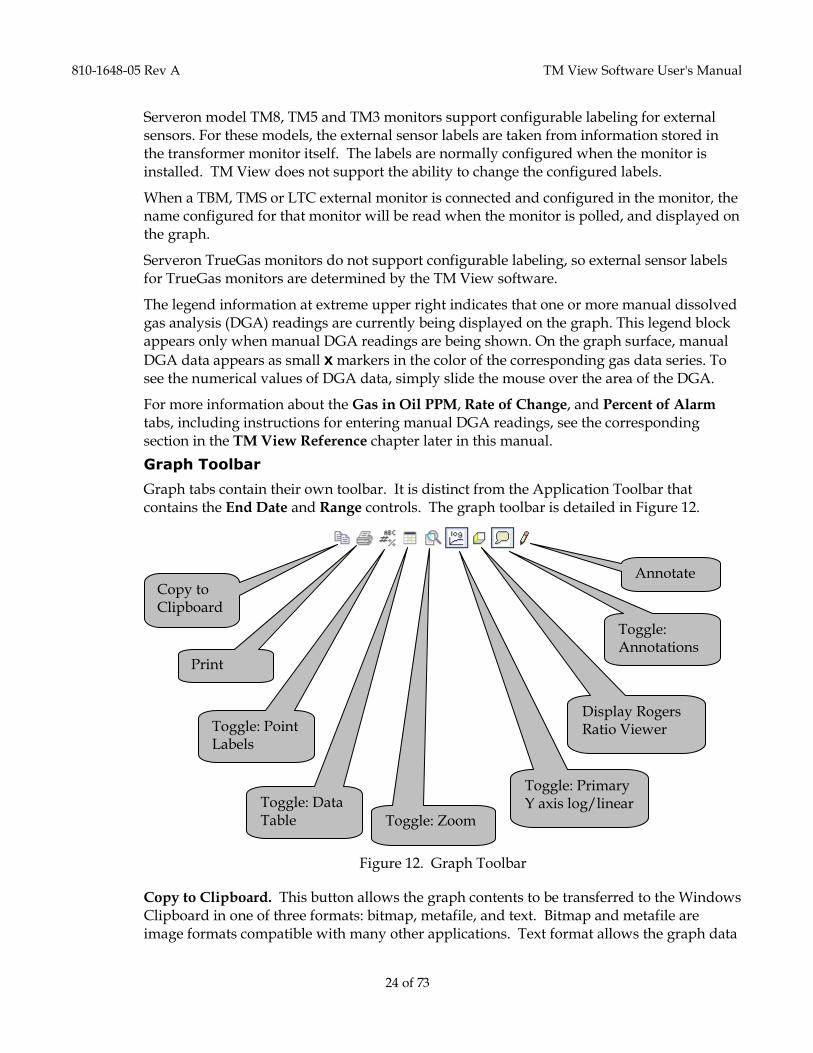
Graph Toolbar
Graph tabs contain their own toolbar. It is distinct from the Application Toolbar that contains the End Date and Range controls. The graph toolbar is detailed in Figure 12.
Figure 12. Graph Toolbar
Copy to Clipboard. This button allows the graph contents to be transferred to the Windows Clipboard in one of three formats: bitmap, metafile, and text. Bitmap and metafile are image formats compatible with many other applications. Text format allows the graph data
Copy to Clipboard
Toggle: Point Labels
Toggle: Zoom
Toggle: Primary Y axis log/linear Toggle: Data
Table
Display Rogers Ratio Viewer
Toggle: Annotations
Annotate
810-1648-05 Rev A TM View Software User's Manual
25 of 73
to be copied. In most cases, better results can be achieved with the File Export menu item, which is described in the TM View Menu Commands section of this manual.
Print. This button allows the graph contents to be printed. Its behavior is identical to the File Print menu item, also described in the Menu Commands section.
Point Labels. This button allows point labels to be displayed or hidden. Point labels are most useful when only a limited number of points are displayed (for example, a 3-day view).
Data Table. TM View can display a data table which provides a tabular data view of the data that is linked to the graph contents. The Data Table button allows the data table to be displayed or hidden. When the mouse is moved over Data Table cells, the corresponding point in the graph series is highlighted. When the mouse is moved over a point in the graph series, the Data Table is automatically scrolled to display the corresponding cell and that cell is highlighted.
Zoom. The zoom button enables or disables “zooming” the graph. With zoom enabled, you can click in the graph area at the upper left corner of the area you wish to enlarge and drag the mouse down and to the right to define the area you wish to display. When you release the mouse button the selected area expands to fill the entire graph region and sliders (similar to scroll bars) are displayed to allow the graph to be repositioned. You may zoom repeatedly to magnify smaller areas or click the toggle again to restore the original resolution.
Log Scale. The log/linear button changes the primary Y axis from a log scale to a linear scale and back. Display of sensor values is not affected. Sensor values are displayed relative to the secondary Y axis, which is always linear and displays a fixed range suitable for sensors supported by Serveron.
Display Rogers Ratio Viewer. Clicking this button displays the Serveron Rogers Ratio Viewer, a graphical transformer diagnostic display. For more information about the Rogers Ratio Viewer, see Using the Serveron Rogers Ratio Viewer.
Toggle Annotations. This button toggles the display of graph annotation markers. Annotations are notes attached to particular points in time on the graph while their markers are cartoon-style “thought bubbles.” To see the annotation contents, move the mouse over the marker or click within the bubble.
Annotate. Clicking this button displays the Annotate dialog box, which allows you to enter annotations (notes) that are associated with a point in time on the graph.
Installing and Using Licenses Your initial installation of TM View is a fully-functional application for monitoring and managing Serveron Online Transformer monitors. In addition, Serveron offers an automatic polling option which requires separate licensing.
This license provides the ability to perform automatic scheduled polling for more than one monitor (automatic scheduled polling for a single monitor is included in the initial installation).
810-1648-05 Rev A TM View Software User's Manual
26 of 73
This section explains how to obtain, install, and use licenses for this extended feature. To purchase licenses, please contact Serveron or your Serveron representative.
Overview
Licensed features are enabled through a two-step process. The process begins when you transmit your Machine ID via email to Serveron and is completed when you receive the license key corresponding to the desired feature. You then install the license key into your TM View installation in order to enable the feature. Your installation has only one Machine ID, but you must obtain one license key from Serveron for each option you wish to access.
In order to obtain a license key, you must first install TM View in either the Standalone or the Server configuration. Requesting and installing license keys are administrative activities that cannot be performed from a Viewer Only configuration.
To begin the process, start TM View and then click Licensing… in the Help menu to display the Licensing dialog. After a moment, the dialog box displays your Machine ID and enables the Copy to Clipboard button.
Create an email message. Address it to [email protected] with subject License
Request. Paste the Machine ID into the body of the message. It should look like this (your Machine ID value will be different):
Machine ID: 5F01-7C60-F311-43B2-3A8D
Send the email message. Serveron makes every effort to respond to license key requests within two business days, but cannot guarantee response. If you do not receive a timely response to your email, please contact Serveron Customer Support or your Serveron representative.
When the email response arrives from Serveron, your license key will take the form of a text file attachment. Please save the file attachment to a known, and preferably backed up directory on your PC or another safe location. If you are ever forced to perform a complete re-installation of TM View , you may need to re-install your license keys.
After saving the license key file attachment, open TM View and again click Licensing… in the Help menu to display the Licensing dialog. Click the Browse… button located at left to display a standard Open File dialog. Navigate to the license key file (the attachment you saved). Select the file and click OK. After a short pause, TM View should respond with a dialog stating 1 license key installed. If it does not, please try the operation again. If the problem reoccurs, please contact Serveron or your Serveron representative.
You can now make use of the feature or features enabled by your license.
Automatic Scheduled Polling Option
TM View maintains an internal table of licenses available for automatic polling. Each license enables automatic polling for a single monitor. When you install TM View in either the Standalone or Server configuration, the table is initialized with one (1) license.
An automated polling license key encodes a number of additional licenses. Licenses are available from Serveron in groups of 6, 12, or unlimited. When you install the key as
810-1648-05 Rev A TM View Software User's Manual
27 of 73
described above, the additional licenses you purchased are placed in the internally-managed table.
To access your automatic polling licenses, select the Company node in the navigator and click the Polling tab. The viewing pane should show a list of monitors. Click on a monitor (row) to select it and then click Update Automatic Polling Status… in the Action menu.
The Update Automatic Polling Status dialog box appears. The dialog box shows the number of automated polling licenses available in the pool. The value is 1 when you first install TM View. When you add licenses, the value increases by the number of additional licenses you purchased (6, 12, or unlimited).
Automated polling for a monitor is enabled by checking Automatically poll this monitor in the Update Automatic Polling Status dialog. When you click OK, one license is removed from the internally managed table and assigned to the selected monitor. The number of available licenses remaining in the table is reduced by one (if you purchased an unlimited license, the table still contains an unlimited number of licenses).
If you uncheck Automatically poll this monitor for an automatically polled monitor or use File Close to close the file, its license is automatically returned to the internally managed table. This increases the number of available polling licenses by one. This table-based design allows you to “float” a smaller number of licenses across a larger number of monitors should you choose to do so.
810-1648-05 Rev A TM View Software User's Manual
28 of 73
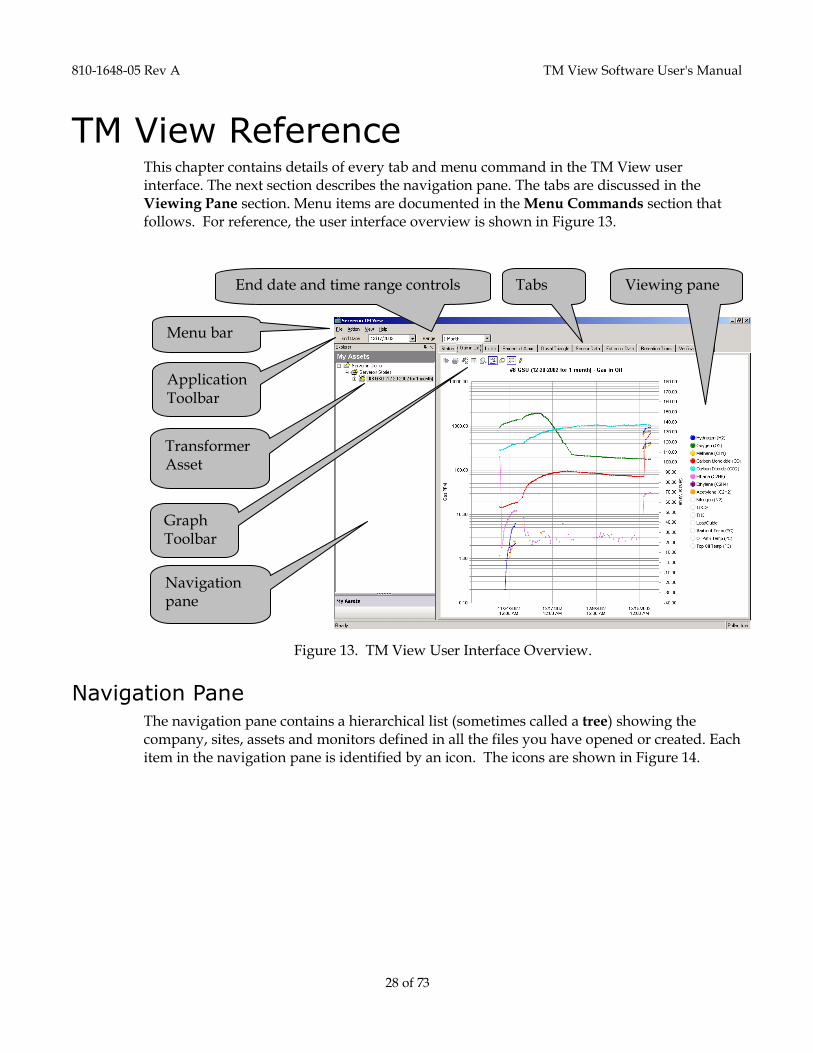
TM View Reference This chapter contains details of every tab and menu command in the TM View user interface. The next section describes the navigation pane. The tabs are discussed in the Viewing Pane section. Menu items are documented in the Menu Commands section that follows. For reference, the user interface overview is shown in Figure 13.
Figure 13. TM View User Interface Overview.
Navigation Pane The navigation pane contains a hierarchical list (sometimes called a tree) showing the company, sites, assets and monitors defined in all the files you have opened or created. Each item in the navigation pane is identified by an icon. The icons are shown in Figure 14.
Navigation pane
Transformer Asset
Application Toolbar
Menu bar
Viewing pane Tabs End date and time range controls
Graph Toolbar
810-1648-05 Rev A TM View Software User's Manual
29 of 73
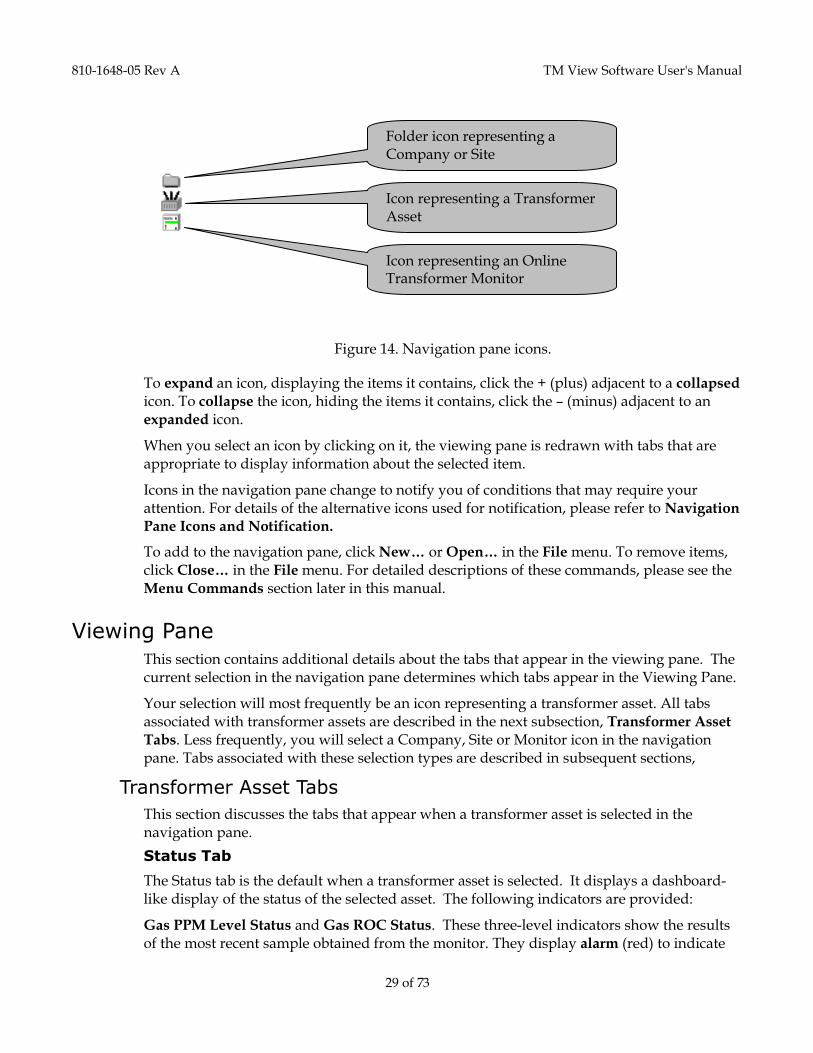
Figure 14. Navigation pane icons.
To expand an icon, displaying the items it contains, click the + (plus) adjacent to a collapsed icon. To collapse the icon, hiding the items it contains, click the – (minus) adjacent to an expanded icon.
When you select an icon by clicking on it, the viewing pane is redrawn with tabs that are appropriate to display information about the selected item.
Icons in the navigation pane change to notify you of conditions that may require your attention. For details of the alternative icons used for notification, please refer to Navigation Pane Icons and Notification.
To add to the navigation pane, click New… or Open… in the File menu. To remove items, click Close… in the File menu. For detailed descriptions of these commands, please see the Menu Commands section later in this manual.
Viewing Pane This section contains additional details about the tabs that appear in the viewing pane. The current selection in the navigation pane determines which tabs appear in the Viewing Pane.
Your selection will most frequently be an icon representing a transformer asset. All tabs associated with transformer assets are described in the next subsection, Transformer Asset
Tabs. Less frequently, you will select a Company, Site or Monitor icon in the navigation pane. Tabs associated with these selection types are described in subsequent sections,
Transformer Asset Tabs
This section discusses the tabs that appear when a transformer asset is selected in the navigation pane.
Status Tab
The Status tab is the default when a transformer asset is selected. It displays a dashboard-like display of the status of the selected asset. The following indicators are provided:
Gas PPM Level Status and Gas ROC Status. These three-level indicators show the results of the most recent sample obtained from the monitor. They display alarm (red) to indicate
Folder icon representing a Company or Site
Icon representing a Transformer Asset
Icon representing an Online Transformer Monitor
810-1648-05 Rev A TM View Software User's Manual
30 of 73
that the monitor encountered a gas alarm condition on the most recent sample run or caution (yellow) to indicate a gas caution condition. If no cautions or warnings were detected on the most recent sample run, both indicators display normal (green). If no readings have ever been received, all three indicators display background gray.
Rate of change (ROC) alarm status is available from Serveron model TM8, TM5 and TM3 transformer monitors only, not from Serveron TrueGas monitors.
Monitor Status. This two-level indicator displays service required (blue) to indicate that the monitor has encountered a service required condition. The blue indicator mimics the blue Service Required lamp on the front panel of the monitor itself. The indicator displays normal (green) to indicate a healthy monitor. If no data has ever been received from the monitor, both indicators display background gray.
Data Age. This three-level indicator shows whether gas in oil data from the monitor is up to date or needs to be refreshed by polling the monitor. 0 – 8 Hours Old (green) indicates that the timestamp of the most recently-received sample run is from 0 to approximately 8 hours old. 8 – 24 Hours Old (yellow) indicates the most recent sample is more than about 8 hours old but no older than about 24 hours. 24 Hours or Older (red) indicates that the most recent sample is more than about 24 hours old. If no sample data has ever been received from the monitor, all three indicators display background gray.
External Monitors. A three-level indicator is shown for each possible type of external monitor which can be configured in a TMx monitor (TBM, TMS and LTC). Green means that the data reported by the monitor through the 4-20 mA current loop to the TMx is within acceptable range. Yellow and Red mean that the data from the monitor is within the Caution or Alarm range, respectively. The limits for Caution and Alarm are set in the “Configure External Monitor” dialog, shown previously. The ranges for the sliders are set in the TMx monitor itself when the external monitor is configured.
Event History. This horizontal region shows the monitor‟s activity over recent days. Each rectangular block or tile displays one day‟s activities with the most recent day‟s activity appearing at right.
Within a day‟s tile, the colored vertical bars indicate one significant activity by the monitor. Most activities are sample runs, which appear as green, yellow or red bars to indicate their most urgent outcome (normal, caution, or alarm, respectively). Service required conditions, if any, are displayed as vertical blue bars. Aborted runs are shown as black bars. Finally, non-sample runs are displayed as vertical white bars. Most non-sample runs are regularly-scheduled verification runs. If no data has ever been received from the monitor, the Event History block is empty.
Note: for more information about sample runs, Service Required conditions, and other Serveron Online Transformer Monitor principles of operation,
please consult the documentation that was provided with your monitor or visit http://www.serveron.com.
810-1648-05 Rev A TM View Software User's Manual
31 of 73
Textual Information. At the bottom of the screen textual information about the monitor is displayed. The Latest Monitor Timestamp is the timestamp on the most recent piece of significant information (service required event, sample run, etc) received from the monitor. Below the Latest Monitor Timestamp, the Status screen displays the monitor‟s serial number and model information for reference purposes.
Many commands are available in the Action menu when viewing the Status tab. These commands are documented in the Action Menu section later in this manual.
Gas in Oil Tab
Overview
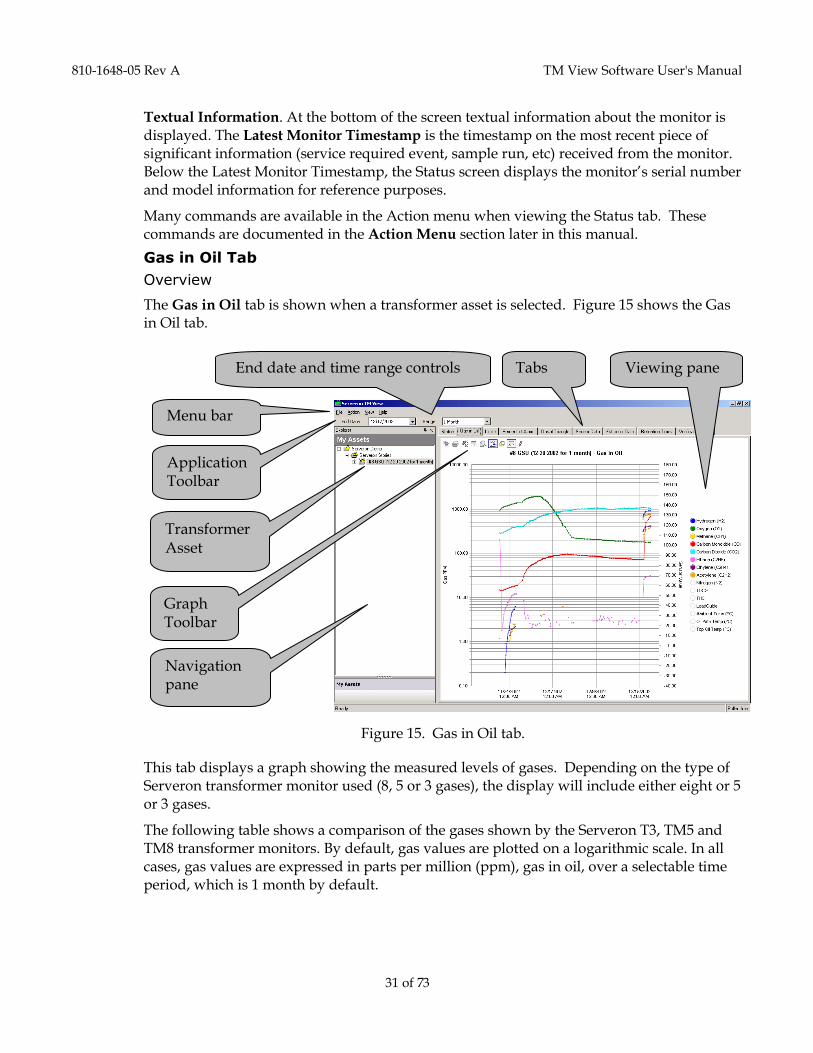
The Gas in Oil tab is shown when a transformer asset is selected. Figure 15 shows the Gas in Oil tab.
Figure 15. Gas in Oil tab.
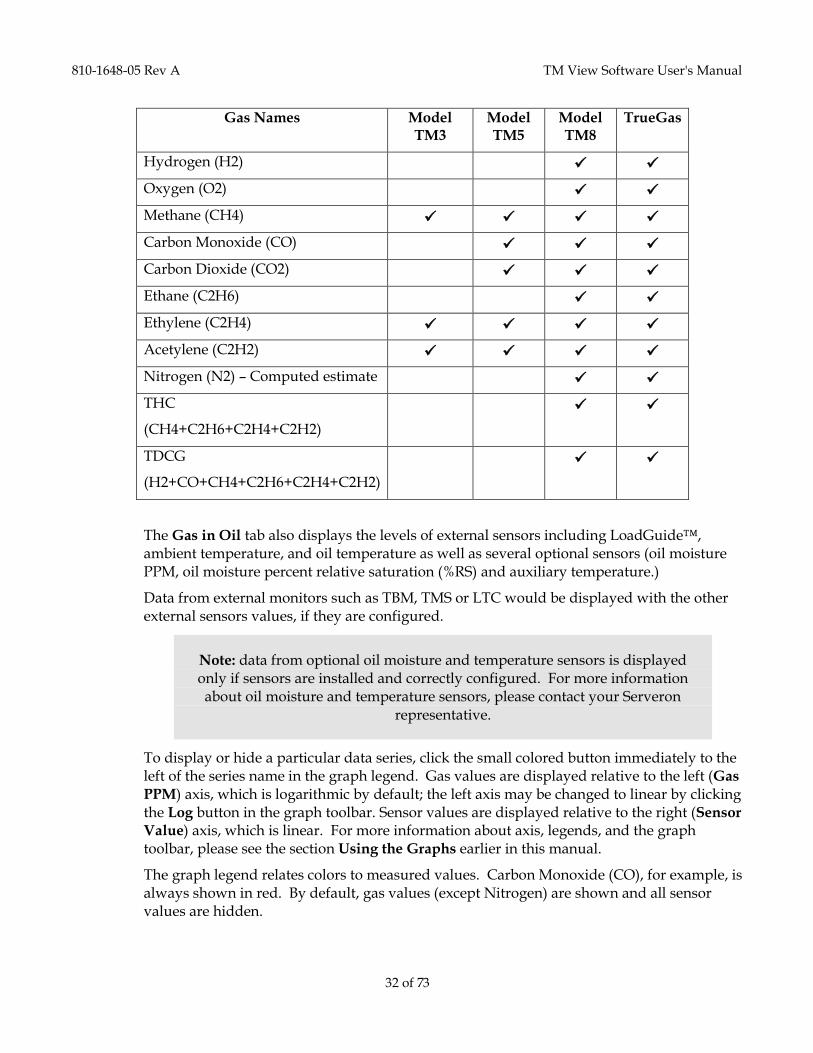
This tab displays a graph showing the measured levels of gases. Depending on the type of Serveron transformer monitor used (8, 5 or 3 gases), the display will include either eight or 5 or 3 gases.
The following table shows a comparison of the gases shown by the Serveron T3, TM5 and TM8 transformer monitors. By default, gas values are plotted on a logarithmic scale. In all cases, gas values are expressed in parts per million (ppm), gas in oil, over a selectable time period, which is 1 month by default.
Navigation pane
Transformer Asset
Application Toolbar
Menu bar
Viewing pane Tabs End date and time range controls
Graph Toolbar
810-1648-05 Rev A TM View Software User's Manual
32 of 73
Gas Names Model TM3
Model TM5
Model TM8
TrueGas
Hydrogen (H2)
Oxygen (O2)
Methane (CH4)
Carbon Monoxide (CO)
Carbon Dioxide (CO2)
Ethane (C2H6)
Ethylene (C2H4)
Acetylene (C2H2)
Nitrogen (N2) – Computed estimate
THC
(CH4+C2H6+C2H4+C2H2)
TDCG
(H2+CO+CH4+C2H6+C2H4+C2H2)
The Gas in Oil tab also displays the levels of external sensors including LoadGuide™, ambient temperature, and oil temperature as well as several optional sensors (oil moisture PPM, oil moisture percent relative saturation (%RS) and auxiliary temperature.)
Data from external monitors such as TBM, TMS or LTC would be displayed with the other external sensors values, if they are configured.
Note: data from optional oil moisture and temperature sensors is displayed only if sensors are installed and correctly configured. For more information about oil moisture and temperature sensors, please contact your Serveron
representative.
To display or hide a particular data series, click the small colored button immediately to the left of the series name in the graph legend. Gas values are displayed relative to the left (Gas
PPM) axis, which is logarithmic by default; the left axis may be changed to linear by clicking the Log button in the graph toolbar. Sensor values are displayed relative to the right (Sensor Value) axis, which is linear. For more information about axis, legends, and the graph toolbar, please see the section Using the Graphs earlier in this manual.
The graph legend relates colors to measured values. Carbon Monoxide (CO), for example, is always shown in red. By default, gas values (except Nitrogen) are shown and all sensor values are hidden.
810-1648-05 Rev A TM View Software User's Manual
33 of 73
Commands
When viewing a Gas in Oil graph, the Action menu contains the tab-specific commands Enter DGA… and Start Sample Run.
Selecting Enter DGA… displays the Enter DGA Data dialog box, which contains a simple spreadsheet-like data editor. Set the date of your manual DGA report in the Record Time field and enter the values for the nine supported gases. You may enter multiple rows or correct existing entries. When you click OK, the DGA data is saved and displayed on the graph. For more details about the DGA data display, see Displaying Manual DGA Data below.
Selecting Start Sample Run immediately contacts the monitor to begin a sample run. Since sample runs are scheduled automatically by the monitor, use of this command is rarely required.
Note: to adjust the monitor‟s sampling schedule, click the monitor icon in the navigation pane, then click the Sampling tab, and finally click Update
Sampling… in the Action menu. TM View displays the Update Sample
Schedule dialog box. When you click OK, TM View immediately contacts the monitor and updates the schedule you have defined.
Values below the Lower Detection Limit (LDL)
The lower detection limit (LDL) values for Serveron model TM8, TM5 and model TM3 monitors are specified in the Data Sheet for the respective monitor. The monitor may report values below these levels, however, and TM View will display them. Values below the LDL are visually distinguished by their pale translucent color. This pale color serves as a visual reminder that uncertainty is associated with the measurement.
Displaying Manual DGA Data
Manual DGA data is displayed as one or more small colored x markers on the Gas in Oil graph and on the Duval Triangle graph.
On the Gas in Oil graph, the colors match the corresponding data series, i.e. CO is displayed in red, H2 in blue, etc.
On the Duval Triangle graph, all manual entry data is shown in various shades of green, depending on the age of the data point.
Moving the mouse pointer near a DGA reading on the graph surface displays a popup window showing the exact numerical value of each of the DGA measurements.
Note: if you have a Serveron model TM3 monitor, only the TM3 gases (CH4, C2H2, and C2H4) are displayed on the graph. You may enter values for all 9 fields in the dialog box, however. When you move the mouse over the DGA
sample area, all 9 gas in oil values are shown in the pop-up window.
810-1648-05 Rev A TM View Software User's Manual
34 of 73
Disabling a data series by clicking in the graph legend also disables the corresponding DGA value from appearing on the graph.
When DGA data is visible on the graph, a small DGA legend appears at the upper right corner of the screen to indicate the meaning of the display.
Limits Tab
The Limits tab is shown when a transformer asset is selected. It displays caution (warning) and alarm limits for the eight measured gases and TDCG (TrueGas and model TM8 monitors), five measured gases (model TM5 monitor) or for three measured gases (model TM3 monitor). Limits are displayed for both gas in oil PPM level and gas in oil rate of change (ROC, reported in PPM/day). This tab also displays the most recently measured values reported by the monitor for gas in oil, rate of change, and goodness of fit (a quality metric for the current ROC value).
Note: ROC data is available from model TM8, TM5 and TM3 monitors only. The TrueGas monitor does not measure or report ROC data. ROC alarm and caution limits cannot be set for the TrueGas monitor.
To change the limits, click Update Limits… in the Action menu. This displays the Update Alarm and Caution Limits dialog box. To change a limit, click in the desired cell and type the new value. When you click OK, the monitor is immediately updated. The viewing pane is refreshed when the update is complete.
Percent of Alarm Tab
The Percent of Alarm tab is shown when a transformer asset is selected. It displays measured gas values and TDCG normalized to their individual alarm or caution limit values.
Example: suppose the alarm limit for H2 is 50 PPM and the alarm limit for C2H4 is 120 PPM. Further, suppose the measured value for H2 is 40 PPM and the measured value for C2H4 is 60 PPM. Then the displayed value for H2 will be 80 (40 PPM is 80% of the limit value, 50 PPM) and the displayed value for C2H4 will be 50 (60 PPM is 50% of 120).
Values may be displayed relative to their caution limits instead of their alarm limits by clicking one of the buttons at lower right. Sensor values (LoadGuide, Ambient Temp, etc.) do not have alarm or caution limits. Their actual values are shown relative to the right axis for reference purposes.
No tab-specific commands are available in the Action menu when the Percent of Alarm tab is displayed.
Rate of Change Tab
The Rate of Change tab is shown when a transformer asset is selected and the transformer monitor is a Serveron model TM3, TM5 or TM8. Serveron TrueGas monitors do not perform rate of change calculations.
810-1648-05 Rev A TM View Software User's Manual
35 of 73
This tab displays the smoothed rate of change (ROC) of gas in oil values expressed in PPM per day. ROC is not computed for sensor values (LoadGuide, Ambient Temp, etc.). Their actual values are shown relative to the right axis for reference purposes.
No tab-specific commands are available in the Action menu when the Rate of Change tab is displayed.
Duval Triangle Tab
The Duval Triangle is an analytical tool developed by Dr. Michel Duval of IREQ (Hydro Quebec), Canada. The Triangle presents DGA (dissolved gas analysis) results in a graphical form by sorting them according to a list of faults as codified by IEC Publication 60599, "Mineral oil-impregnated electrical equipment in service- Guide to the interpretation of dissolved and free gases analysis," March 1999.
For more information about the Triangle, see Using the Duval Triangle.
Sensor Data Tab
The Sensor Data tab is shown when a transformer asset is selected. It displays the values of internal sensors. This information is intended for use by trained Customer Service personnel.
No tab-specific commands are available in the Action menu when the Sensor Data tab is displayed.
This tab is only displayed if the “Show Service Tabs” option in the View menu is selected.
Extractor Data Tab
The Extractor Data tab is shown when a transformer asset is selected. This tab displays the status of internal sensors related to the transformer monitor‟s gas extractor subsystem. This information is intended for use by trained Customer Service personnel.
No tab-specific commands are available in the Action menu when the Extractor Data tab is displayed.
This tab is only displayed if the “Show Service Tabs” option in the View menu is selected.
Retention Time Tab
The Retention Time tab is shown when a transformer asset is selected. The tab displays internal information about the status of the chromatography subsystem. This information is intended for use by trained Customer Service personnel.
No tab-specific commands are available in the Action menu when the Retention Time tab is displayed.
This tab is only displayed if the “Show Service Tabs” option in the View menu is selected.
Verification Data Tab
Overview
The Verification Data tab is shown when a transformer asset is selected. It displays the results of all verification runs performed in the selected time interval. Verification runs
810-1648-05 Rev A TM View Software User's Manual
36 of 73
measure gas levels from reference gas contained in the monitor‟s calibration bottle instead of sample gas from the transformer asset being monitored.
Sensor data is not displayed on the Verification Data graph.
This tab is only displayed if the “Show Service Tabs” option in the View menu is selected.
Commands
When viewing the Verification Data tab, the Action menu contains the tab-specific commands Start Verification Run and Start Calibration Run.
Selecting Start Verification Run immediately contacts the monitor to begin a verification run. Since verification runs are scheduled automatically by the monitor, use of this command is rarely required.
Note: to adjust the monitor‟s verification schedule, click the monitor icon in the navigation pane, then click the Sampling tab, and finally click Update
Sampling… in the Action menu. TM View displays the Update Sample Schedule dialog box. When you click OK, TM View immediately contacts the
monitor and updates the schedule you have defined.
Selecting Start Calibration Run immediately contacts the monitor to begin a calibration run.
Note: Serveron monitors contain an auto-calibration feature. Manual calibration runs should only be performed by trained Customer Service
personnel.
Company Specific Tabs
This section describes the tabs that appear when you select an organization (typically your company) in the navigation pane. Your organization is usually the top of the navigation hierarchy.
Welcome Tab
The Welcome tab contains first-time startup instructions and a button that allows you to install the sample files. Note that you may also install or reinstall the sample files at any time by clicking the Help menu and selecting Install Sample Files.
Polling Tab
The Polling tab is the central point of administration for automatically scheduled polling. The tab shows a row-oriented display of all monitors known to the software. Each row contains several status columns. The display is updated every few seconds to reflect the latest status of each monitor.
Each row in the list may be selected by clicking on it. Selecting a row enables some menu items in the Action menu. To configure automatic polling for a monitor, click the monitor‟s row to select it and then choose Update Automatic Polling Status… from the Action menu. This displays the Update Automatic Polling Status dialog box.
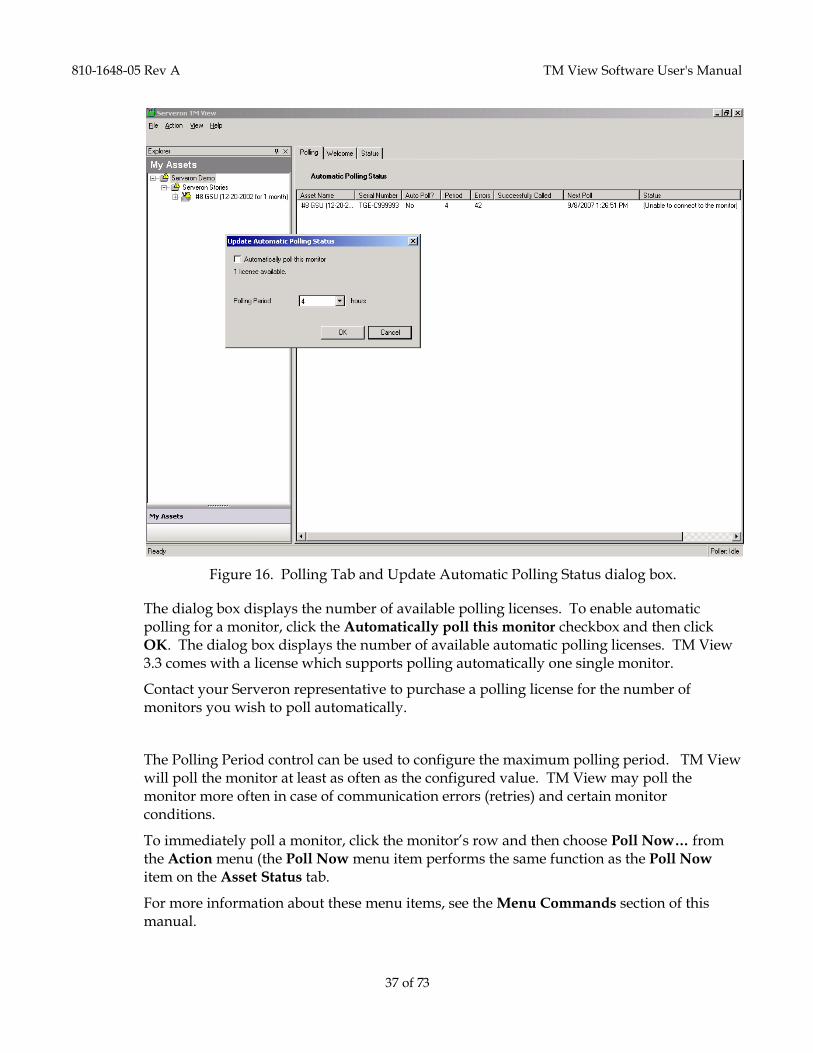
810-1648-05 Rev A TM View Software User's Manual
37 of 73
Figure 16. Polling Tab and Update Automatic Polling Status dialog box.
The dialog box displays the number of available polling licenses. To enable automatic polling for a monitor, click the Automatically poll this monitor checkbox and then click OK. The dialog box displays the number of available automatic polling licenses. TM View 3.3 comes with a license which supports polling automatically one single monitor.
Contact your Serveron representative to purchase a polling license for the number of monitors you wish to poll automatically.
The Polling Period control can be used to configure the maximum polling period. TM View will poll the monitor at least as often as the configured value. TM View may poll the monitor more often in case of communication errors (retries) and certain monitor conditions.
To immediately poll a monitor, click the monitor‟s row and then choose Poll Now… from the Action menu (the Poll Now menu item performs the same function as the Poll Now item on the Asset Status tab.
For more information about these menu items, see the Menu Commands section of this manual.
810-1648-05 Rev A TM View Software User's Manual
38 of 73
Each row displayed by the Polling tab is composed of several fields (columns). The following fields are shown:
Asset Name. The name of the transformer asset.
Serial Number. The serial number of Serveron monitor.
Auto Poll? This field displays Yes if the monitor is configured for automatic scheduled polling, No if it is not.
Period. This field displays the maximum period between automatic polling updates in hours. If the unit is not configured for automatic polling (Auto Poll column displays No), this column retains its previous value or displays the default value of 4 hours. TM View may contact the monitor more frequently than the value shown in this field. For further details, see the Next Poll subsection below.
Errors. This field displays the number of communication errors that have occurred since the monitor was last polled successfully. Each successful contact with the monitor resets the count to 0.
Successfully Called. This field displays the date and time of the last successful call to the monitor. If the monitor has not been successfully contacted, the field is empty.
Next Poll. This fields shows when the Poller component of TM View will next attempt to contact the monitor. In the simplest case, this value is approximately the time of the last successful call plus the value of the Period. The value may be different for several reasons. Two of the most common are:
If a polling attempt fails, the Poller component will retry the failed attempt using an internally defined retry algorithm. The retry frequency may be different than the normal polling frequency.
If the monitor begins sampling at an accelerated rate (e.g. hourly), the Poller will eventually detect the monitor‟s behavior and begin polling more frequently in order to make timely data available to you. For more information about accelerated sampling, see Action Sample Hourly (Monitor selected, Sampling Tab) in the Menu Commands section.
Status. When TM View is communicating with the monitor, this field displays the most recent status of the conversation, e.g. downloading a record, updating the host data file, etc. The last status is displayed within parenthesis after the communication is complete.
File Name. This field displays the name of the file in which the monitor‟s data is stored on the host.
Status Tab
The Status tab is shown when your organization (typically, your company) is selected in the navigation pane. The Status tab displays a flat list of your organization‟s sites. The list is not navigable.
Site Specific Tabs
This section describes the tabs that appear when you select a site icon in the navigation pane.
810-1648-05 Rev A TM View Software User's Manual
39 of 73
Status Tab
The Status tab is shown when one of your organization‟s sites is selected in the navigation pane. The Status tab displays a flat list of the assets of the selected site. The list is not navigable.
Monitor Specific Tabs
This section describes the tabs that appear when you select a monitor icon in the navigation pane. The monitor icon is the lowest or “leaf” node in the navigation hierarchy.
Sampling Tab (Monitor icon selected in Navigation Pane)
The Sampling tab is shown when a monitor icon is selected in the navigation pane. Use this tab to review the monitor‟s sampling and verification schedules.
To change the monitor‟s sampling or verification schedules, click Update Sampling… on the Action menu while this tab is displayed. The Update Sampling Schedule dialog is displayed. When you click OK in the dialog box, TM View immediately contacts the monitor and updates the monitor‟s sampling schedule.
The Action menu for this tab also contains the Sample Hourly… command. The Sample
Hourly command is described in the Action Sample Hourly (Monitor selected, Sampling Tab) section below.
Communications Tab (Monitor icon selected in Navigation Pane)
The Communications tab is shown when a monitor icon is selected in the navigation pane. It displays a textual summary of the communications settings for the selected transformer monitor. Use this tab to review the host‟s communication settings.
To change the settings used by TM View, click Update Communications… on the Action menu while this tab is displayed. The Update Communications Wizard is displayed. Use the Wizard to review and update the communication settings. When you click Finish, TM View updates the host‟s communication settings.
To verify monitor communications, click Check Communications… on the Action menu for this tab. This command will attempt to contact the monitor and retrieve basic information about the monitor. After the command completes (or fails), a message box displays the outcome of the test.
Menu Commands This section provides an overview of the menu commands available in TM View.
File Menu
File New…
This menu item displays the New File Creation wizard to begin the creation of a new file. Since each transformer asset and its monitor are represented in a single file, this operation is used to add new assets and monitors to your TM View installation.
After the initial screen, the wizard displays the Monitor Information page shown in Figure 17.
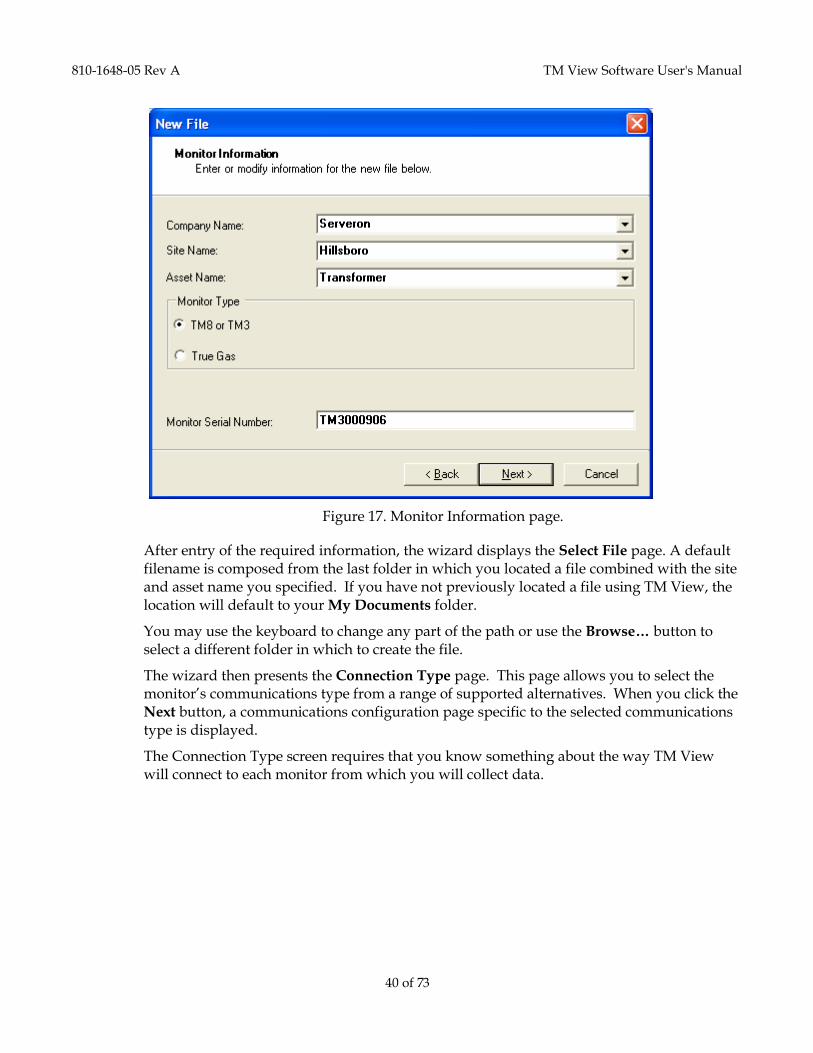
810-1648-05 Rev A TM View Software User's Manual
40 of 73
Figure 17. Monitor Information page.
After entry of the required information, the wizard displays the Select File page. A default filename is composed from the last folder in which you located a file combined with the site and asset name you specified. If you have not previously located a file using TM View, the location will default to your My Documents folder.
You may use the keyboard to change any part of the path or use the Browse… button to select a different folder in which to create the file.
The wizard then presents the Connection Type page. This page allows you to select the monitor‟s communications type from a range of supported alternatives. When you click the Next button, a communications configuration page specific to the selected communications type is displayed.
The Connection Type screen requires that you know something about the way TM View will connect to each monitor from which you will collect data.
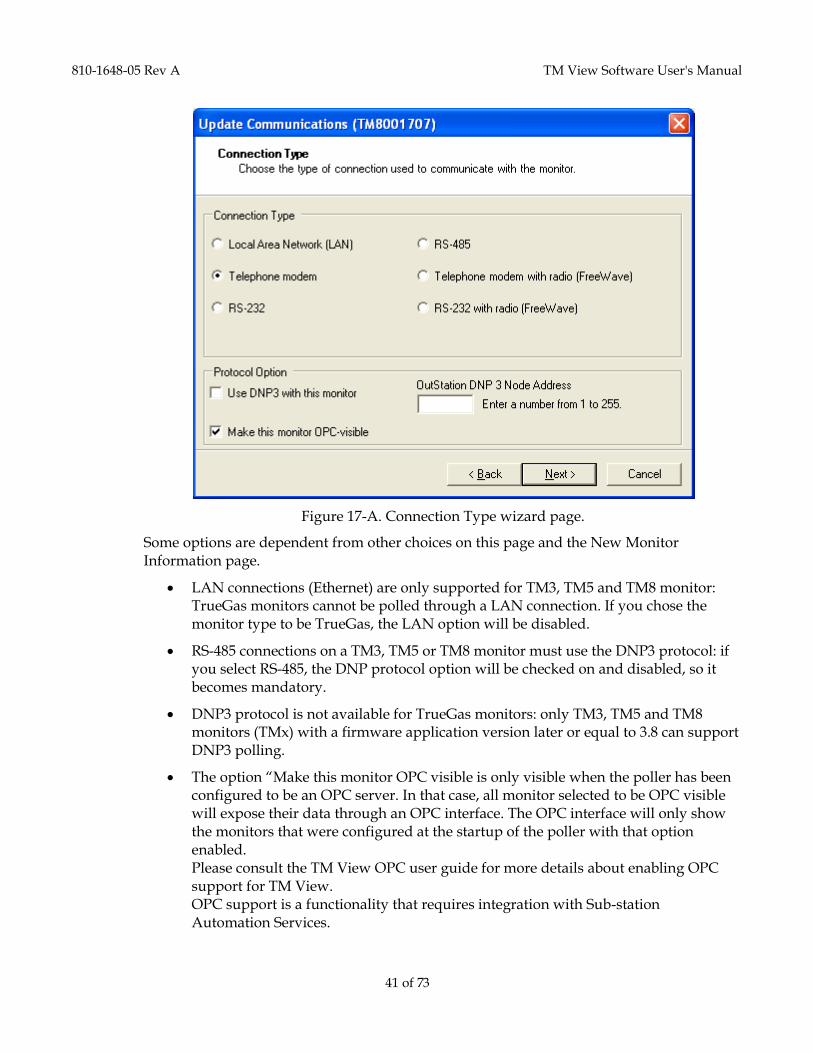
810-1648-05 Rev A TM View Software User's Manual
41 of 73
Figure 17-A. Connection Type wizard page.
Some options are dependent from other choices on this page and the New Monitor Information page.
LAN connections (Ethernet) are only supported for TM3, TM5 and TM8 monitor: TrueGas monitors cannot be polled through a LAN connection. If you chose the monitor type to be TrueGas, the LAN option will be disabled.
RS-485 connections on a TM3, TM5 or TM8 monitor must use the DNP3 protocol: if you select RS-485, the DNP protocol option will be checked on and disabled, so it becomes mandatory.
DNP3 protocol is not available for TrueGas monitors: only TM3, TM5 and TM8 monitors (TMx) with a firmware application version later or equal to 3.8 can support DNP3 polling.
The option “Make this monitor OPC visible is only visible when the poller has been configured to be an OPC server. In that case, all monitor selected to be OPC visible will expose their data through an OPC interface. The OPC interface will only show the monitors that were configured at the startup of the poller with that option enabled. Please consult the TM View OPC user guide for more details about enabling OPC support for TM View. OPC support is a functionality that requires integration with Sub-station Automation Services.
810-1648-05 Rev A TM View Software User's Manual
42 of 73
Note: when you add a new monitor and create a TGH file, you may be prompted to reboot the system if ALL the following conditions are met:
1. TM View has been installed as Standalone or Server
2. You have enabled OPC support for this installation of TM View
3. You have enable the OPC-visible flag for this asset
If you selected LAN communication, for example, the configuration page supports entry of a LAN (Ethernet) address. If you selected modem communications, the configuration page supports entry of phone number, communications port, and related information.
After configuring communications, clicking the Next button will display a textual summary of the information collected by the wizard. When the Finish button is clicked, the new file is created and added to the navigator. It will remain in the navigator even if you exit and restart TM View. To remove an asset and its associated monitor from the navigator, click Close… in the File menu.
File Open…
This item is used to open an existing file. It presents a standard Open File dialog. After the file is opened successfully, it is added to the navigator. It will remain in the navigator even if you exit and restart TM View. To remove an asset and its associated monitor from the navigator, use File Close….
Note: if OPC support is enabled for this configuration of TM View and the monitor is made OPC visible, you will be prompted to reboot the system. Changes will not be visible on OPC until the system is restarted.
File Close…
This item is used to close (remove from display) one or more files. The files must have previously been added to the navigator via File New… or File Open…. Closing the file only removes the file from view. The file‟s contents are not altered and the file is not deleted.
Note: if OPC support is enabled for this configuration of TM View and the monitor is made OPC visible, you will be prompted to reboot the system. Changes will not be visible on OPC until the system is restarted.
File Archive…
This item is used to reduce the size of large files while preserving their data. The Choose
Archive Date dialog is displayed. Use this dialog to set the boundary date. When you click OK, a standard file selection dialog is displayed. After you choose an archive file name and location and click OK, all monitor data older than the boundary date is removed from the primary data file and placed in the archive. Since archived data is no longer present in the data file, it is no longer displayed.
If you wish to review archived data at a later date, click Open in the File menu and select the archive file using the Open File dialog box.
Archiving your data is optional. TM View will function correctly even if all data ever downloaded is allowed to accumulate in the primary data file.
810-1648-05 Rev A TM View Software User's Manual
43 of 73
File Export…
Selecting this item displays a File Save dialog that allows the export of transformer data. The export file will contain the data for the date range currently selected in the End Date and Range controls in the application toolbar.
Use this command to make data available to other application programs, e.g. Microsoft Office Excel. Exports may be created at any time. Exporting data does not remove it from the data file: the data continues to be displayed by TM View after you export it.
Data may be exported in one of two formats:
Comma-separated value (.CSV): files in this textual format may be loaded directly by Microsoft Excel and many other applications.
TOA4: this textual file format is directly compatible with Transformer Oil Analyst version 4 (TOA-4) software from Delta-X Research.
File Print…
This item allows the contents of the viewing pane to be printed. A standard printer dialog is displayed. You may change print settings defined by your printer, if desired, and then click OK to print the viewing pane contents.
This item is unavailable (“grayed out”) if there is nothing to print.
File Print Preview
A standard Print Preview dialog is displayed. The contents of the viewing pane may be printed from within the preview using the controls at the top.
This item is unavailable (“grayed out”) if there is nothing to print.
File Exit
This item closes the application.
Action Menu
Some of the contents of the Action menu are determined by the selection in the navigation pane and the visible (currently selected) tab. This section describes each possible action and identifies the selection type and tab which must be visible for the action to be available in the menu.
The following menu items are available in the Action menu regardless of the selection or current tab.
Action Select Modem
This menu item opens the Select Modem dialog box. The dialog allows you to select the TAPI modem used to communicate with Serveron model TM3, TM5 and TM8 monitors.
810-1648-05 Rev A TM View Software User's Manual
44 of 73
Note: the modem selected using this dialog box affects communication with Serveron model TM3, TM5 and TM8 monitors only. When communicating with Serveron TrueGas monitors, the COM port selected on the Configure
Modem page of the Update Communications dialog determines the modem used to contact the monitor.
The Select Modem dialog box displays a dropdown list containing all properly-configured TAPI modems. If your modem is not displayed in the list, click Configure TAPI Modem to display the Add/Remove Hardware Wizard. Follow the prompts to configure your modem. For more information, see Configuring Modems later in this manual.
Note: On Windows 7, Windows Vista and Windows Server 2008 (both x86 and x64 versions), this action must only be selected when running the TM
View application as an Administrator. Normal users have insufficient privileges, and the action would fail. The user should right-click the TM View
icon and select “Run as Administrator…” to launch TM View when configuring a modem.
Please see the instructions below for TM View 3.4 about setting up a modem for TM View in Windows 7, Vista or Server 2008.
Setting up a modem in Windows 7, Vista or Server 2008
1. Log-in to your PC as administrator and install your modem and the most recent drivers for your modem on the operating system of your machine. You may have to reboot your PC after installing the modem drivers – the installer will prompt you if that is the case.
2. Use the “Control Panel -> Phone and Modem” applet to cause Windows to discover the modem. This is imperative on Windows Server 2008. On Windows 7 and Vista, the “Configure TAPUI modem” button can create the modem entry for you (see #4 below).
3. Run TM View as an Administrator for your machine: right click the start menu option or the desktop icon you use to launch TM View and select “Run as Administrator.
4. Use the menu option Action->Select Modem, and select the modem you intend to use for TM View dial-out.
5. Using the “Control Panel -> Network and Sharing Center” applet, go to “Change Adapter Settings” and open the properties window for the Serveron modem network adapter.
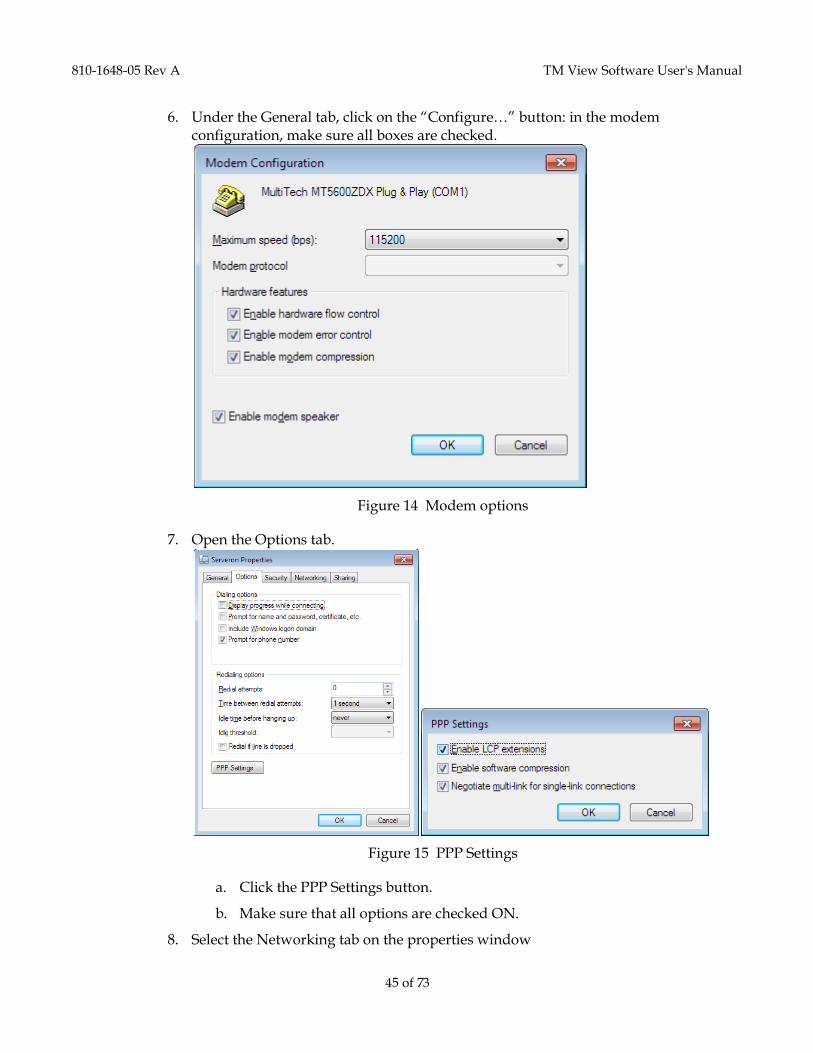
810-1648-05 Rev A TM View Software User's Manual
45 of 73
6. Under the General tab, click on the “Configure…” button: in the modem configuration, make sure all boxes are checked.
Figure 14 Modem options
7. Open the Options tab.
Figure 15 PPP Settings
a. Click the PPP Settings button.
b. Make sure that all options are checked ON.
8. Select the Networking tab on the properties window
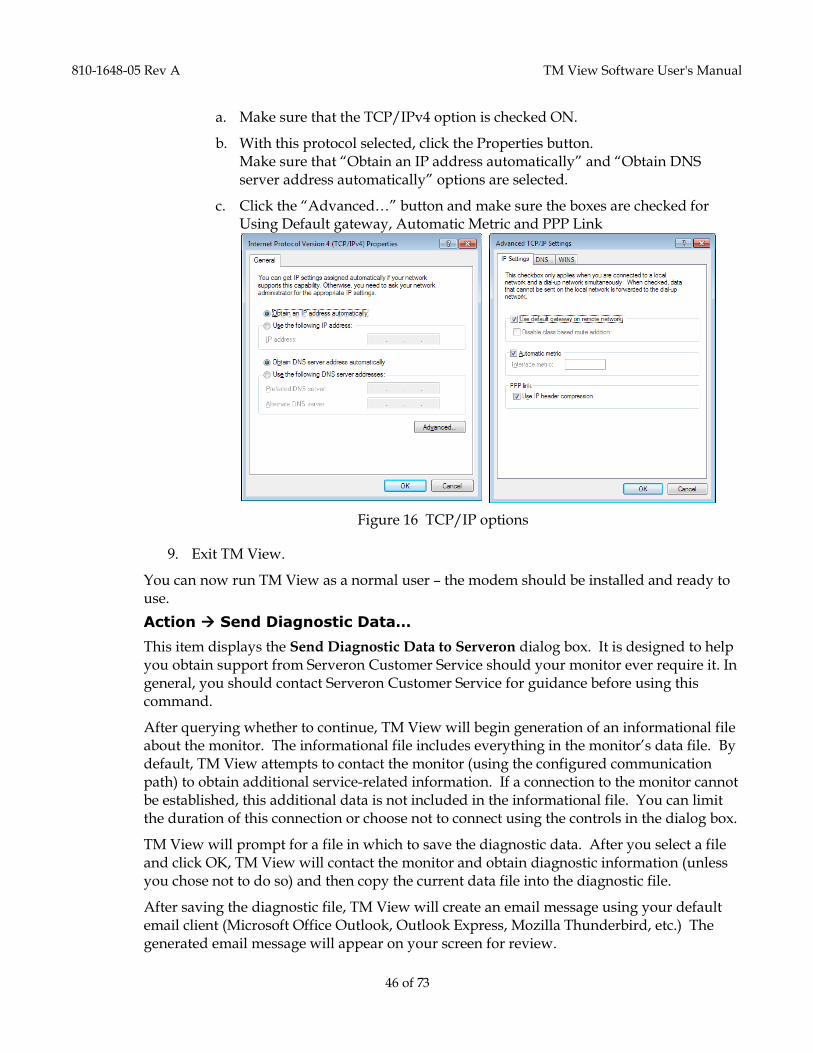
810-1648-05 Rev A TM View Software User's Manual
46 of 73
a. Make sure that the TCP/IPv4 option is checked ON.
b. With this protocol selected, click the Properties button. Make sure that “Obtain an IP address automatically” and “Obtain DNS server address automatically” options are selected.
c. Click the “Advanced…” button and make sure the boxes are checked for Using Default gateway, Automatic Metric and PPP Link
Figure 16 TCP/IP options
9. Exit TM View.
You can now run TM View as a normal user – the modem should be installed and ready to use.
Action Send Diagnostic Data…
This item displays the Send Diagnostic Data to Serveron dialog box. It is designed to help you obtain support from Serveron Customer Service should your monitor ever require it. In general, you should contact Serveron Customer Service for guidance before using this command.
After querying whether to continue, TM View will begin generation of an informational file about the monitor. The informational file includes everything in the monitor‟s data file. By default, TM View attempts to contact the monitor (using the configured communication path) to obtain additional service-related information. If a connection to the monitor cannot be established, this additional data is not included in the informational file. You can limit the duration of this connection or choose not to connect using the controls in the dialog box.
TM View will prompt for a file in which to save the diagnostic data. After you select a file and click OK, TM View will contact the monitor and obtain diagnostic information (unless you chose not to do so) and then copy the current data file into the diagnostic file.
After saving the diagnostic file, TM View will create an email message using your default email client (Microsoft Office Outlook, Outlook Express, Mozilla Thunderbird, etc.) The generated email message will appear on your screen for review.
810-1648-05 Rev A TM View Software User's Manual
47 of 73
You must attach the informational file to the generated email message using the commands provided by your email client. Instructions for locating the file appear within the generated email message itself.
Note: TM View only prepares data for transmission to Serveron. TM View will never, under any circumstances, send data of any kind to Serveron. You must send the email that was generated in TM View, like you would any other email, if you wish to communicate the diagnostic information to Serveron.
The remaining menu items in this section are specific to the selection in the navigation pane and the current tab. Example: the Rename Company item appears in the Action menu when you select a Company in the navigation pane and then display the Status tab.
Action Rename Company… (Company selected, Status tab)
This command displays the Rename Company dialog box which allows the entry of a new name for the currently selected company. When you click OK, one or more files are updated to reflect the change and both the navigation and viewing panes are redrawn.
Note: if OPC support is enabled for this configuration of TM View and the monitor is made OPC visible, you will be prompted to reboot the system. Changes will not be visible on OPC until the system is restarted.
Action Rename Site… (Site selected, Status tab)
This command displays the Rename Site dialog box which allows the entry of a new name for the currently selected site. When you click OK, one or more files are updated to reflect the change and both the navigation and viewing panes are redrawn.
Note: if OPC support is enabled for this configuration of TM View and the monitor is made OPC visible, you will be prompted to reboot the system. Changes will not be visible on OPC until the system is restarted.
Action Rename Asset… (Transformer asset selected, Status tab)
This command displays the Rename Asset dialog box which allows the entry of a new name for the currently selected asset. When you click OK, the file is updated to reflect the change and both the navigation and viewing panes are redrawn.
Note: if OPC support is enabled for this configuration of TM View and the monitor is made OPC visible, you will be prompted to reboot the system. Changes will not be visible on OPC until the system is restarted.
Action Poll Now (Transformer asset or Monitor selected, any tab)
Causes TM View to connect to the selected asset‟s transformer monitor and download all data. The connection attempt uses the current communications settings, which are displayed on the Communications tab when the monitor icon is selected.
810-1648-05 Rev A TM View Software User's Manual
48 of 73
Action -> Edit Notification Rules (any node selected, any tab
New in TM View 3.1: this allows the user managing the rules for Alarms Notifications by the Serveron Integrated Poller installed with TM. This feature is only available for the “Server” installations of TM View.
Please refer to the “TM View Notification User Guide.pdf” file, accessible from the “Help/Documentation” menu, for more information about this feature.
Action -> Edit ODBC Configuration (any node selected, any tab
New in TM View 3.1: this allows the user managing the ODBC output of the Serveron Integrated Poller installed with TM View. This feature is only available for the “Server” installations of TM View.
Please refer to the “TM View ODBC User Guide.pdf” and “TM View ODBC Tutorial.pdf” files, accessible from the “Help/Documentation” menu, for more information about this feature.
Action -> Configure External Monitors (Transformer asset selected, Status tab)
This menu option allows configuring the alarm and caution levels for any external monitor configured in the TMx, and to assign a manager application for that monitor.
Action Enter DGA… (Transformer asset selected, Gas in Oil tab)
Displays the Enter DGA Data dialog box, which supports entry of DGA data for display on the Gas in Oil graph. Enter the values from your manual DGA into the cells of the empty row and adjust the date as appropriate. If you need to add additional rows, click the Add Row button to add a new empty row. When you are satisfied, click OK to save your entries.
If you discover an error in a DGA entry, use the dialog box to change the value displayed in the cell and then click OK. To delete a manual DGA, open the dialog box. Click the area to the left of the date and time to highlight the entire row, click the Delete button, and then click OK to update the file and graph.
Action Import TOA4-CSV File… (Transformer asset selected, Gas in Oil tab)
Displays a File Open dialog, prompting the user to navigate to the CSV file to be imported. The file must match the standard for imported file for TOA4, as described in this document:
http://www.deltaxresearch.com/docs/toa4_data_file_req.pdf,
with some restrictions outlined below. A short version of the format requirements is that the file must be a text file in ANSI format, it must begin with a header line (see header requirements below), and that the values must be separated with a comma („,‟).The decimal separation character is a period („.‟): the floating point values are in US-English format.
- TM View will import all data found in the file for the transformer/monitor currently selected. So the file must contain only data for the same transformer as the one selected.
810-1648-05 Rev A TM View Software User's Manual
49 of 73
- TM View „keys in‟ on a column with header “sampledate”, and the columns with headers carrying the names of gases of interest to TM3, TM5 and TM8: H2, O2, CH4, CO, CO2, N2, C2H6, C2H4 and C2H2. The string comparison is not case-sensitive. The import operation will succeed only when there is a “sampledate” column and at least one column with a relevant gas name.
The data imported from a CSV file will be shown as „Manual DGA‟ data. A CSV import is a convenient way to manually enter many DGA data points at once.
Action Start Sample Run (Transformer asset selected, Gas in Oil tab)
After confirming your choice, this command commands the transformer monitor to immediately start a sample run. Since sample runs are scheduled automatically by the monitor, use of this command is rarely required.
Note: to adjust the monitor‟s sampling schedule, click the monitor icon in the navigation pane, then click the Sampling tab, and finally click Update
Sampling… in the Action menu. TM View displays the Update Sample Schedule dialog box. When you click OK, TM View immediately contacts the
monitor and updates the schedule you have defined.
Action Update Limits (Transformer asset selected, Limits tab)
Displays the Update Limits dialog box, which supports changes to the gas in oil caution and alarm limit values. For Serveron model TM3, TM5 and TM8 monitors, the dialog supports both level and rate of change alarms; for Serveron TrueGas monitors, only level alarms are supported.
When the OK button is clicked, TM View immediately contacts the monitor to update the limit values.
Action Start Verification Run (Transformer asset selected, Verification Data tab)
After confirming your choice, this command commands the transformer monitor to immediately start a verification run. Since verification runs are scheduled automatically by the monitor, use of this command is rarely required.
Note: to adjust the monitor‟s verification schedule, click the monitor icon in the navigation pane, then click the Sampling tab, and finally click Update
Sampling… in the Action menu. TM View displays the Update Sample
Schedule dialog box. When you click OK, TM View immediately contacts the monitor and updates the schedule you have defined.
Action Start Calibration Run (Transformer asset selected, Verification Data tab)
After confirming your choice, this command commands the transformer monitor to immediately start a calibration run. A calibration run takes 30 minutes to 1 hour depending the model of transformer monitor you have installed.
810-1648-05 Rev A TM View Software User's Manual
50 of 73
Note: Serveron monitors contain an auto-calibration feature. Manual calibration runs should only be performed by trained Customer Service
personnel.
Action Change Monitor Password… (Transformer asset selected, Status tab)
This command is intended to ensure that only a single approved installation of TM View software may access the transformer monitor.
Note: changing the password is intended to block access to the selected transformer monitor by other computers running TM View. The new
password is set in the monitor and stored securely on the local computer. After completing this command, TM View will be able to poll data or access
monitor data and settings from the local computer only.
TM View first offers the opportunity to cancel the operation. If you choose to continue, TM View displays a dialog box supporting entry of the new password. When you click OK on this dialog box , TM View securely stores the password in the host computer. TM View then displays the Poller Activity dialog and sets the new password in the monitor.
Action Set Monitor Date and Time (Transformer asset selected, Status tab)
This command sets the transformer monitor‟s internal date and time to match the local computer. If the monitor is a Serveron model TM3, TM5 or TM8, the time is converted to Universal Coordinated Time (UTC) before being sent to the monitor.
Action View Log… (Transformer asset selected, Status tab)
This command displays recent activity by the polling/dialing subsystem (“Poller”). For more information about the Poller, see Theory of Operations later in this manual.
Action Sample Hourly (Monitor selected, Sampling tab)
Note: this command is available for Serveron model TM3, TM5 and TM8 transformer monitors only. Serveron TrueGas monitors do not support
hourly sampling.
Causes TM View to connect to the transformer monitor and establish a temporary sampling schedule within the monitor. The temporary schedule continues for 24 hours and specifies that sample runs should be performed once per hour.
After the 24 hour period elapses, the monitor reverts to the schedule that was in effect when the Sample Hourly command was given. If you wish to continue hourly sampling, you may issue the command again to enable hourly sampling for another 24 hour period.
810-1648-05 Rev A TM View Software User's Manual
51 of 73
The Sample Hourly command is intended to allow you to temporarily accelerate sampling when additional online DGA data is critical, e.g. when a transformer is experiencing a gassing event or other unusual condition.
Note: by increasing the number of sample runs, this command increases the monitor‟s consumption of helium carrier gas. Excessive use of this command may require replacement of the helium cylinder more frequently than stated
in the Serveron Transformer Monitor product documentation.
The Sample Hourly command also interacts with the automatic scheduled polling feature of TM View. If the monitor that is sampling hourly is also configured for automatically scheduled polling, the Poller component of TM View will begin polling it at an accelerated rate (hourly) in order to make the data available to you.
Under certain conditions, the Serveron transformer monitor may begin sampling at an accelerated (hourly) rate without any input from you. This form of accelerated sampling occurs when a previously configured Rate of Change (ROC) gas alarm limit is violated within the monitor. ROC accelerated sample will not occur unless you configure Rate of Change alarm limits,. If this form of accelerated sampling does occur at your installation, the Poller component of TM View will notice after several hours and begin polling at an accelerated rate in order to make the data available to you.
A monitor that is performing hourly samples due to a ROC alarm will cease performing accelerated runs and return to its previous schedule approximately 24 hours after the ROC alarm condition is cleared. If ROC does not return to normal on its own, you can clear the condition by increasing the ROC alarm limit value or disabling the alarm for that gas. For more information, see Action Update Limits (Transformer asset selected, Limits tab)
below.
Action Check Communications (Monitor selected, Communications tab)
This command allows you to check communications by performing a lightweight poll of the monitor without switching tabs. The Poller Activity dialog is displayed just as with Poll
Now. Unlike the Poll Now operation, TM View will not attempt to download data from the monitor. Instead, it will update control information (alarm levels, sampling schedule, etc) and then terminate the connection. After communication is complete (or fails), a message box displays the outcome of the test.
Action Update Communications (Monitor selected, Communications tab)
This command displays the Update Communications Wizard, allowing all communication settings for the selected transformer monitor to be reviewed and optionally updated.
For more information about the Update Communications Wizard, see Configuring Communications later in this document.
810-1648-05 Rev A TM View Software User's Manual
52 of 73
View Menu
View Refresh (F5)
This command updates the Navigator and all tabs with the latest data.
View Auto Refresh
Enables or disables the automatic refresh feature. If the menu item is checked, TM View will automatically refresh the display with the latest data approximately once per hour. Each automatic refresh is equivalent to manually selecting View Refresh or pressing F5.
If the menu item is not checked, automatic refresh will not occur.
View Navigator
This command makes the Navigator visible. It is useful if the navigation pane has been hidden using the small close box at upper right of the pane.
View Show Service Tabs
Enables or disables viewing the service tabs (Verification, Internal Sensors, Extractor and Retention Times). If the menu item is checked, TM View will automatically display the service tabs when the Transformer asset is selected.
If the menu item is not checked, the service tabs will not be shown.
Help Menu
Help Documentation
Opens a File Browser dialog allowing access to all documentation files for the current Operating System‟s language and culture.
FAQ, Release Notes, this manual, and various user guides for ODBC, notifications, OPC, DNP3 and Modbus are available in the folder which is open by default.
Help Licensing
This menu item raises the Licensing dialog. All tasks associated with obtaining, installing and assigning licenses (except assigning polling licenses) are performed using this dialog box. These tasks are described in Installing and Using Licenses section of this manual.
The Licensing dialog box has two tabs.
Keys tab. This tab is used to obtain your machine ID, which must be provided to Serveron when you request a license. Use the Copy to Clipboard button to copy your machine ID and then paste it into the license request email as described under Installing and Using Licenses.
The Keys tab is also used to install licenses you receive from Serveron. After receiving your license via email and saving the license file attachment, click the Browse… button on the Keys tab to open the Serveron license key file. When you click OK, TM View attempts to install the license.
Finally, the Keys tab displays the license keys you have currently installed. To display the details of an installed license, click the license to select it and then click Details.
810-1648-05 Rev A TM View Software User's Manual
53 of 73
Polling tab. This tab displays the number of polling license you have available. Your available licenses are maintained in a pool managed internally by TM View as described under Installing and Using Licenses. The same value is displayed when you open the Update Automatic Polling Status dialog (Polling tab, Action menu, Update Automatic
Polling Status).
Polling licenses are installed by browsing from the Keys tab, and assigned to monitors using the Update Automatic Polling Status dialog as described in the Company Specific Tabs section.
Help Install Sample Files
Displays the Install Sample Files dialog box which allows the sample files to be copied to a folder of your choice. The function of this menu item is identical to the Install Sample Files button on the Welcome screen.
Help About TM View
This item displays the About Box, which shows the detailed version number of TM View and a link to Serveron‟s world wide web page.
Using the Duval Triangle To access the Triangle, select a Transformer asset in the navigation pane and then click the Duval Triangle tab in the viewing pane.
Overview
The Duval Triangle is an analytical tool developed by Dr. Michel Duval of IREQ (Hydro Quebec), Canada. The Triangle presents DGA (dissolved gas analysis) results in a graphical form by sorting them according to a list of faults as codified by IEC Publication 60599, "Mineral oil-impregnated electrical equipment in service- Guide to the interpretation of dissolved and free gases analysis," March 1999.
The Triangle and IEC Publication 60599 are analysis tools meant to be used as an aid for diagnosing the source of combustible gases in transformer coolant oil. The Triangle should not be regarded as the “final word” for such diagnosis but as a tool to be used by an informed expert for the purpose of evaluating the health of a transformer.
The Duval Triangle task is shown in Figure 18.
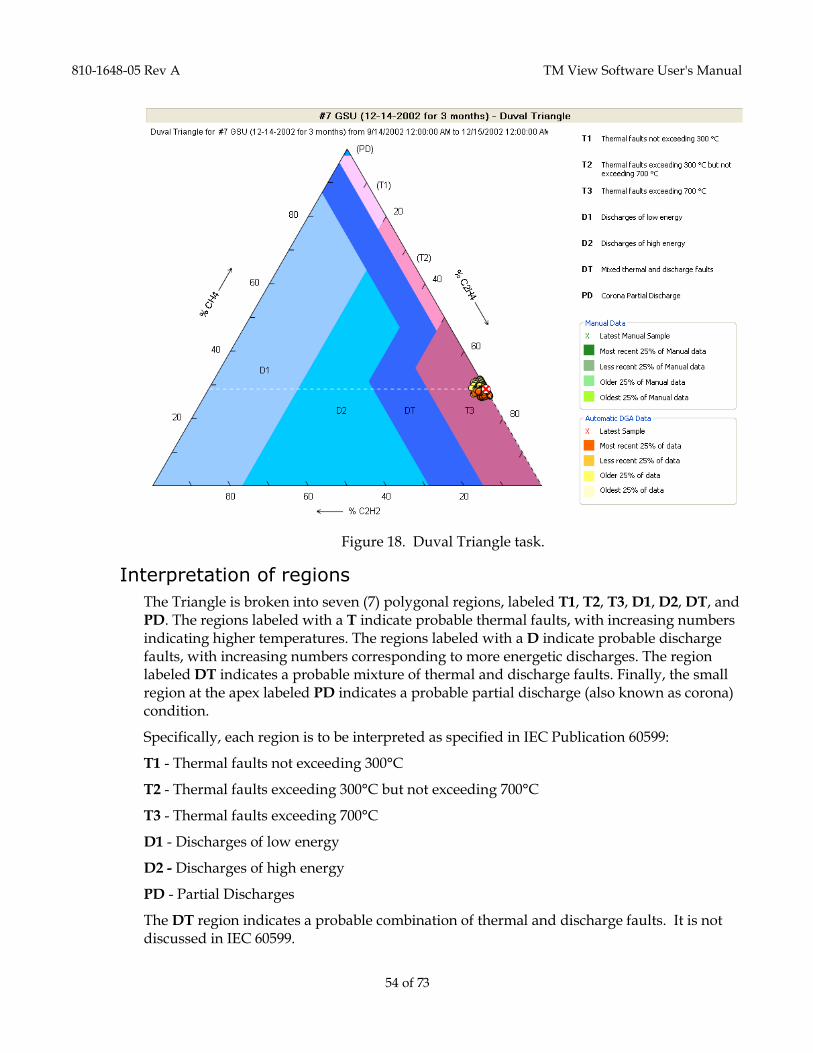
810-1648-05 Rev A TM View Software User's Manual
54 of 73
Figure 18. Duval Triangle task.
Interpretation of regions
The Triangle is broken into seven (7) polygonal regions, labeled T1, T2, T3, D1, D2, DT, and PD. The regions labeled with a T indicate probable thermal faults, with increasing numbers indicating higher temperatures. The regions labeled with a D indicate probable discharge faults, with increasing numbers corresponding to more energetic discharges. The region labeled DT indicates a probable mixture of thermal and discharge faults. Finally, the small region at the apex labeled PD indicates a probable partial discharge (also known as corona) condition.
Specifically, each region is to be interpreted as specified in IEC Publication 60599:
T1 - Thermal faults not exceeding 300°C
T2 - Thermal faults exceeding 300°C but not exceeding 700°C
T3 - Thermal faults exceeding 700°C
D1 - Discharges of low energy
D2 - Discharges of high energy
PD - Partial Discharges
The DT region indicates a probable combination of thermal and discharge faults. It is not discussed in IEC 60599.
810-1648-05 Rev A TM View Software User's Manual
55 of 73
Interpretation of the Triangle
Each of the Triangle's three sides forms an axis with a range of 0 to 100%. The Triangle's base is the acetylene (C2H2) axis. The left side is the methane (CH4) axis. The right side is the ethylene (C2H4) axis.
Use of the Triangle begins with a dissolved gas measurement (such as one obtained every few hours from the Serveron on-line transformer monitor) that includes acetylene, methane, and ethylene values. The values of the three gases are then normalized to total 100%.
Example: A DGA result might show acetylene at 10 parts per million (PPM), methane at 20 PPM, and ethylene at 20 PPM. The normalized values for these three gases at these concentrations are 20% acetylene, 40% methane, and 40% ethylene.
A single data point is plotted at the intersection of the three normalized values by drawing lines across the triangle from each of the appropriate normalized values on the axes. These lines are always drawn parallel to some axis of the graphic, as indicated by the dotted white lines.
Multiple data points
The advent of on-line DGA data provided by the Serveron transformer monitor provides new opportunities for use of the Triangle. In particular, the wealth of data provided by the Serveron monitor can be used to quickly assess the health of a transformer by viewing values in the Triangle over a specific range of dates, allowing one to correlate specific fault conditions with transformer loading or extraneous events.
The End Date and Range controls in the application tool bar determine the range of interest for plotting points on the Duval Triangle. The Duval Triangle displays all meaningful samples shown on the corresponding Trend Graph. The relative age of DGA samples are indicated using pale yellow for the oldest to bright yellow, pale orange, and bright orange for the most recent samples. The latest sample plotted in the Triangle is distinguished using an X marker contained in a circle. In addition, dotted lines normal to the three graph axes are shown on the graph, for the most recent data point only.
Manually Entered DGA data
If the user has entered DGA data manually about this monitor (see Action menu of the Gas
in Oil tab), the manual data points are showed in the color specified in the legend on the right of the triangle image.
Summary
The Duval Triangle analysis tool, integrated with Serveron's industry-leading On-Line Transformer Monitor and turnkey asset monitoring services, offers breakthrough capabilities for transformer asset management.
Using the Serveron Rogers Ratio Viewer To access the Viewer, select a Transformer asset in the navigation pane and then click the Gas in Oil tab in the viewing pane. Then click the Rogers Ratio Viewer button in the Graph toolbar (see Graph Toolbar in the section Using the Graphs).
810-1648-05 Rev A TM View Software User's Manual
56 of 73
Note: the Rogers Ratios (also known as Basic Gas Ratios) are based on five measured gases: H2, CH4, C2H2, C2H4, and C2H6. The Serveron model
TM3 and TM5 online transformer gas monitors do not measure C2H6 or H2. For this reason, Rogers Ratios cannot be computed from data gathered using
a TM3 or TM5.
When the asset selected in the Navigation Pane is monitored by a TM3 or TM5, the Rogers Ratio button does not appear in the graph toolbar. Serveron recommends use of the Duval Triangle to assess transformer gas in oil data
gathered with a TM3 or TM5 monitor.
Introduction
The Rogers Ratio Viewer is displayed using a button on the Graph toolbar as described above. The Viewer is a separate component that displays in its own window. If the Viewer is not installed or cannot be executed, the button itself is not shown on the Graph toolbar.
The Serveron Rogers Ratios Viewer uses Microsoft Windows Presentation Foundation (WPF) for its 3D graphic rendering library. Some older video adapters do not support WPF. The Viewer requires a video display with 32-bit color (24-bit RGB plus alpha). This mode may be referred to as “high color” or “true color” and is sometimes erroneously labeled as “24-bit color”. Most video adapters built since 2004 can support the Viewer.
Functional Overview
Dissolved gas ratios (known as Rogers Ratios in IEEE Standard PC57.104 D11d and Basic Gas Ratios in International Standard IEC-60599) are a tool for the interpretation of Dissolved Gas Analysis (DGA) results. The Ratios present DGA results in graphical form by organizing them according to a list of faults as codified in an IEC Standard and an IEEE Draft Standard. These documents are IEC Publication 60599, "Mineral oil-impregnated electrical equipment in service - Guide to the interpretation of dissolved and free gases analysis," March 1999, and draft IEEE Publication PC57.104 D11d, “Draft Guide for the Interpretation of Gases in Oil Immersed Transformers”, April 21 2004. Note that this latter document is an unapproved IEEE standards draft, subject to change.
Both specifications define the ratios as follows:
CH4 / H2
C2H2 / C2H4
C2H4 / C2H6
The Ratios and respective standards are intended as diagnostic aids for DGA interpretation. The Ratios should therefore not be regarded as the "final word" for such diagnosis but rather as a tool to be used by an informed expert for evaluating the health of a transformer.
The advantages of these ratio tools are that they are quantitative and independent of transformer oil volume. However, these and other ratio methods can produce incorrect interpretations or none at all. Therefore, they should be used in conjunction with other diagnostic tools such as the Duval Triangle. The value of on-line monitoring is that these
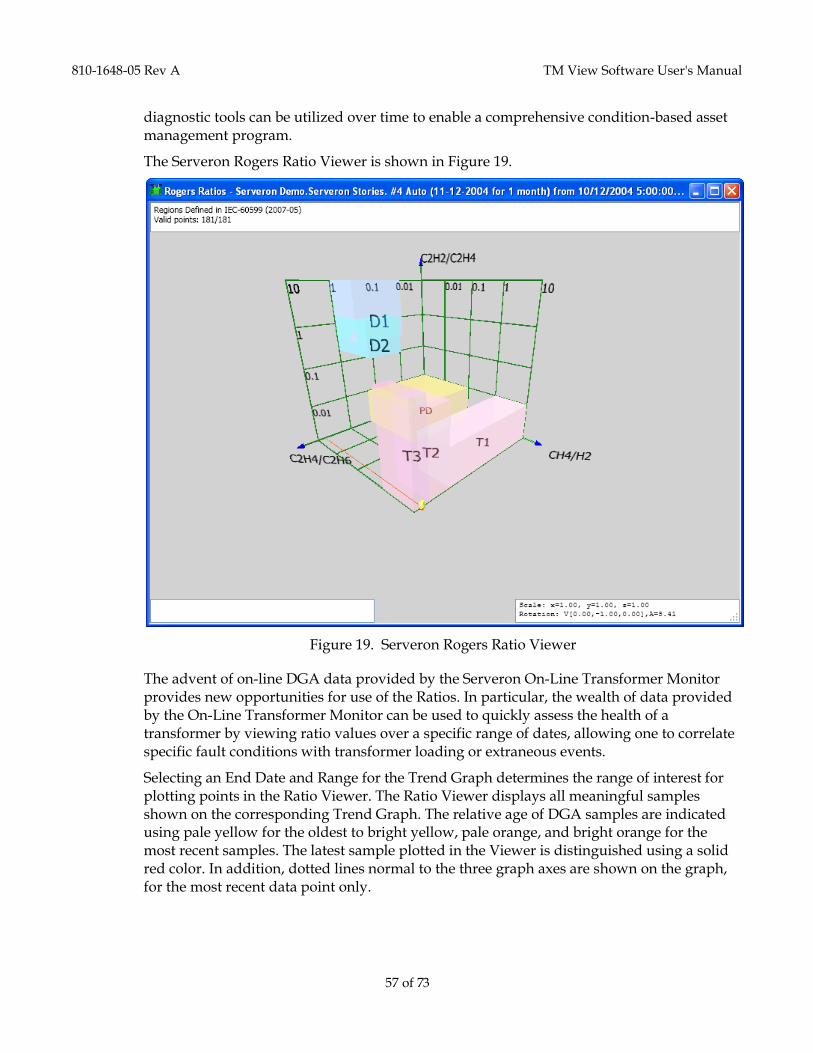
810-1648-05 Rev A TM View Software User's Manual
57 of 73
diagnostic tools can be utilized over time to enable a comprehensive condition-based asset management program.
The Serveron Rogers Ratio Viewer is shown in Figure 19.
Figure 19. Serveron Rogers Ratio Viewer
The advent of on-line DGA data provided by the Serveron On-Line Transformer Monitor provides new opportunities for use of the Ratios. In particular, the wealth of data provided by the On-Line Transformer Monitor can be used to quickly assess the health of a transformer by viewing ratio values over a specific range of dates, allowing one to correlate specific fault conditions with transformer loading or extraneous events.
Selecting an End Date and Range for the Trend Graph determines the range of interest for plotting points in the Ratio Viewer. The Ratio Viewer displays all meaningful samples shown on the corresponding Trend Graph. The relative age of DGA samples are indicated using pale yellow for the oldest to bright yellow, pale orange, and bright orange for the most recent samples. The latest sample plotted in the Viewer is distinguished using a solid red color. In addition, dotted lines normal to the three graph axes are shown on the graph, for the most recent data point only.
810-1648-05 Rev A TM View Software User's Manual
58 of 73
Interpretation of Regions
The Viewer displays ratios in a three-dimensional volume containing several rectangular solid regions, labeled T1, T2, T3, D1, D2, PD, and OK. Note that the region labeled PD
appears only in the IEC-60599 ratio definitions while the region labeled OK appears only in the IEEE PC57.104 D11d ratio definitions.
The regions labeled with a T indicate probable thermal faults, with increasing numbers indicating higher temperatures. The regions labeled with a D indicate probable discharge faults, with increasing numbers corresponding to discharges that are more energetic. The region labeled PD indicates a probable partial discharge (also known as corona) condition, while the region labeled OK indicates a presumed absence of faults.
The IEEE PC57.104 D11d and IEC-60599 specifications generally agree on the following detailed region definitions:
OK - Normal Unit
IEEE PC57.104 D11d names this region Case 0. IEC-60599 does not define this region.
PD - Partial Discharges
IEC-60599 defines this region, while IEEE PC57.104 does not.
D1 - Discharges of low energy
This region is named Case 1 in IEEE PC57.104 D11d.
D2 - Discharges of high energy
This region is named Case 2 in IEEE PC57.104 D11d. The extent of this region differs slightly between the IEC-60599 and IEEE PC57.104 D11d definitions.
T1 - Low temperature thermal faults not exceeding 300°C
This region is named Case 3 in IEEE PC57.104 D11d.
T2 - Thermal faults exceeding 300°C but not exceeding 700°C
This region is named Case 4 in IEEE PC57.104 D11d.
T3 - Thermal faults exceeding 700°C
This region is named Case 5 in IEEE PC57.104 D11d.
Interpreting the Graphical View
Each of the Viewer‟s three axes is logarithmic with conceptually unlimited range. The "front" axis shows an increasing ratio of Methane (CH4) to Hydrogen (H2), referred to as R1 in the text below. The "up" axis shows an increasing ratio of Acetylene (C2H2) to Ethylene (C2H4), referred to as R2. The "right" axis shows an increasing ratio of Ethylene (C2H4) to Ethane (C2H6), referred to as R3.
Use of the Viewer begins with a dissolved gas measurement (such as one obtained every few hours from the Serveron On-Line Transformer Monitor) that includes nonzero ethylene, ethane, and hydrogen values expressed in Parts per Million (PPM). The three ratios are
810-1648-05 Rev A TM View Software User's Manual
59 of 73
then computed. The resulting values determine the location of a point in 3D-space for display by the Viewer.
Mathematically speaking, a ratio value is not defined if its denominator is zero. Therefore, a sample containing a hydrogen (H2) value of 0.0 PPM causes R1 to be undefined. Likewise, a sample with an ethylene (C2H4) value of 0.0 PPM causes R2 to be undefined and an ethane (C2H6) value of 0.0 PPM causes R3 to be undefined.
When one or more of the ratios is undefined, the three values R1, R2 and R3 do not determine a point in 3D-space and the Viewer cannot plot the sample. The Viewer displays a count of samples that could not be plotted in the upper left corner of the display window. The count is labeled Zero denominator.
As noted above, each axis has conceptually unlimited range. The Viewer is capable of displaying ratio values between 0.01 and 100.0. If a value of R1, R2 or R3 lies outside the range from 0.01 to 100.0, an out of range marker is displayed. The marker appears as a small ring with an arrow through it.
The graphical view can be rotated, zoomed and panned using the arrow keys, shift-arrow keys, and control-arrow keys respectively. The display can be cleared and the points re-plotted in time sequence by pressing the Backspace key. For more information, press F1 while the Viewer is active to raise the Help window. In the Help window, press Show Key
Help... to display the complete command list for the Viewer.
Summary
The Rogers Ratio Viewer analysis tool, integrated with Serveron's industry-leading On-Line Transformer Monitor and turnkey asset monitoring services, offers breakthrough capabilities for transformer asset management.
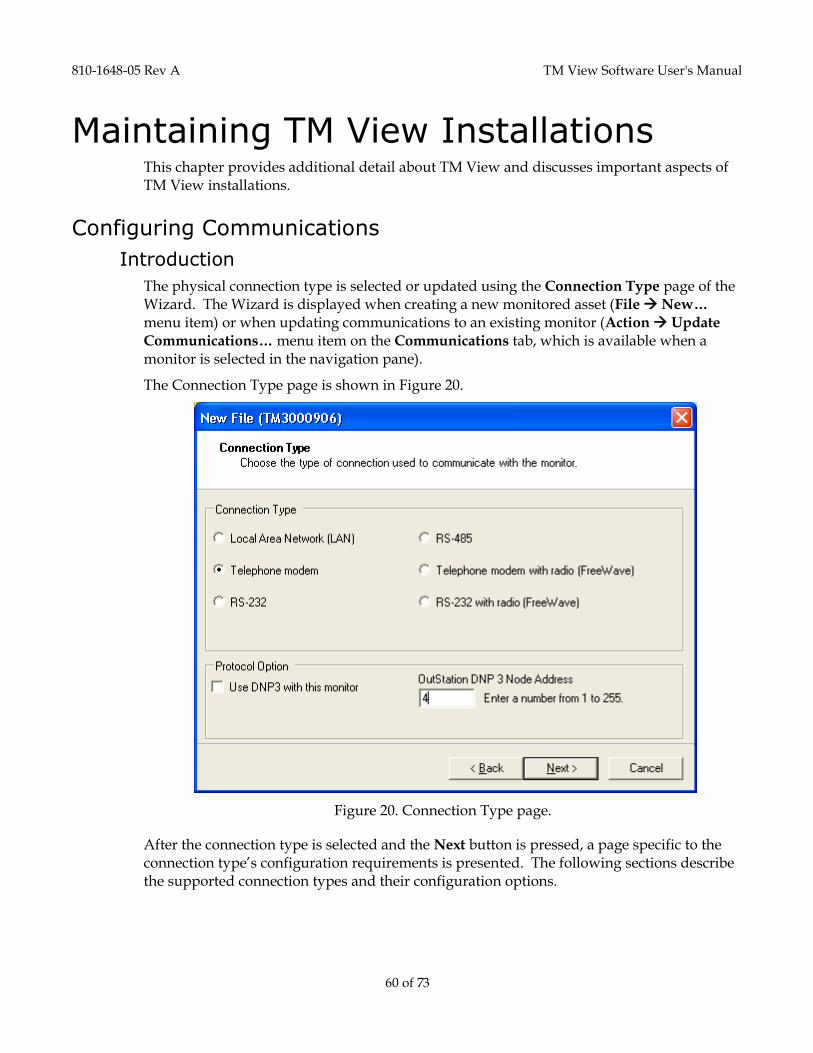
810-1648-05 Rev A TM View Software User's Manual
60 of 73
Maintaining TM View Installations This chapter provides additional detail about TM View and discusses important aspects of TM View installations.
Configuring Communications
Introduction
The physical connection type is selected or updated using the Connection Type page of the Wizard. The Wizard is displayed when creating a new monitored asset (File New… menu item) or when updating communications to an existing monitor (Action Update
Communications… menu item on the Communications tab, which is available when a monitor is selected in the navigation pane).
The Connection Type page is shown in Figure 20.
Figure 20. Connection Type page.
After the connection type is selected and the Next button is pressed, a page specific to the connection type‟s configuration requirements is presented. The following sections describe the supported connection types and their configuration options.
810-1648-05 Rev A TM View Software User's Manual
61 of 73
Local Area Network (LAN)
Direct monitor communication via Ethernet LAN is supported for Serveron model TM3, TM5 and TM8 monitors (Serveron TrueGas monitors do not support Ethernet). The Next button leads to the Configure LAN Connection page. When LAN is selected, only a single configuration item, the network (Ethernet) address of the monitor, need be supplied.
RS-485
TM View supports polling monitors connected through an RS-485 network, point to point or Multi-drop. Some restrictions apply on multi-drop networks: only TM3, TM5 or TM8 monitors using the DNP3 protocol are supported. When RS-485 is selected, the next screen will be similar to a simple RS-232 connection, and the user will be prompted to specify a COM port and a baud rate.
Telephone Modem
Plain old telephone system (POTS) and cellular modems are supported for both TrueGas and TMx family monitors. Configuration data for the modem is entered on the Configure
Modem Connection page. Five items are required to configure a modem connection:
The phone number, also called the dial string. The dial string may include commas to introduce delays into the dialing sequence. It may also include codes to temporarily disable PBX functionality; in the example, the code „*71’ represents a typical command to disable the Call Waiting feature. TM View also supports a send/expect protocol for arbitrarily complex interactions with the modem. This protocol is enabled by the caret (^) character, which can only be entered after checking the Allow advanced dial string checkbox. The send/expect protocol is described in the section Advanced Dialing Strings.
The modem setup string. This string contains modem initialization commands that should be in effect at all times. The default modem setup string is also described in the section Configuring
Modems, below.
The COM port to which the modem is attached (TrueGas monitors only). The number of the COM port on the local computer. This value does not apply to Serveron model TM3, TM5 and TM8 monitors and is not displayed for them. To select the modem used to communicate with your model TM3, TM5 or TM8 monitors, please click Select Modem in the Action menu.
The baud rate which should be used. The baud rate at which the port should be used.
810-1648-05 Rev A TM View Software User's Manual
62 of 73
The Modbus address of the monitor (Serveron TrueGas monitors only) TM View uses Modbus for direct serial/radio connection to Serveron TrueGas monitors only. For TrueGas monitors, the Modbus address of the monitor must be specified. The default Modbus address is 17.
RS-232
Direct RS-232 connectivity is supported for both TrueGas and TMx family monitors. Three items are required to configure a direct connection:
The COM port to which the cable is attached. The number of the COM port on the local computer.
The baud rate which should be used. The baud rate at which the port should be used.
The Modbus address of the monitor (Serveron TrueGas monitors only) TM View uses Modbus for direct serial connection to Serveron TrueGas monitors only. For TrueGas monitors, the Modbus address of the monitor must be specified. The default Modbus address is 17.
RS-232 with radio (FreeWave®)
TM View supports a direct serial connection to a short-range radio link, e.g. FreeWave from FreeWave Technologies. Four items are required to configure a direct-to-radio connection:
The COM port to which the cable is attached. The number of the COM port on the local computer.
The baud rate which should be used. The baud rate at which the port should be used.
The unit address of the slave radio. This value is a configuration parameter of the FreeWave.
The Modbus address of the monitor (Serveron TrueGas monitors only) TM View uses Modbus for direct serial/radio connection to Serveron TrueGas monitors only. For TrueGas monitors, the Modbus address of the monitor must be specified. The default Modbus address is 17.
810-1648-05 Rev A TM View Software User's Manual
63 of 73
Telephone Modem with radio (FreeWave®)
TM View supports a modem connection to a short-range radio link, e.g. FreeWave from FreeWave Technologies. Six items are required to configure a modem-to-radio connection:
The phone number, also called the dial string. The dial string may include commas to introduce delays into the dialing sequence. It may also include codes to temporarily disable PBX functionality; in the example, the code *71 represents a typical command to disable the Call Waiting feature. TM View also supports a send/expect protocol for arbitrarily complex interactions with the modem. This protocol is enabled by the caret (^) character, which can only be entered after checking the Allow advanced dial string checkbox. The send/expect protocol is described in the section Advanced Dialing Strings.
The modem setup string. This string contains modem initialization commands that should be in effect at all times. The default modem setup string is also described in the section Configuring
Modems, below.
The COM port to which the modem is attached (TrueGas monitors only). The number of the COM port on the local computer. This value does not apply to Serveron model TM3, TM5 and TM8 monitors and is not displayed for them. To select the modem used to communicate with your model TM3, TM5 or TM8 monitors, please click Select Modem in the Action menu.
The baud rate which should be used. The baud rate at which the port should be used.
The unit address of the slave radio. This value is a configuration parameter of the FreeWave.
The Modbus address of the monitor (Serveron TrueGas monitors only) TM View uses Modbus for direct serial/radio connection to Serveron TrueGas monitors only. For TrueGas monitors, the Modbus address of the monitor must be specified. The default Modbus address is 17.
810-1648-05 Rev A TM View Software User's Manual
64 of 73
Configuring Modems
Modem Initialization
Before sending any dial string to the modem, TM View will transmit the modem setup string. The default modem setup string is at v1 e0 q0 &d2 x4. This setup string is needed to configure the modem in your PC for proper communication with TM View.
at indicates the start of a modem command string.
v1 tells the modem to send responses that contain alphabetical codes rather than numeric codes.
e0 turns echo off.
q0 quiets or suppresses response codes from your modem.
&d2 sets the modem to do the following when Data Terminal Ready (DTR) is lost:
hang up
turn off auto answer
return to command mode
x4 sets the modem to display at least these response codes:
extended response set
dial tone
busy signal detection
Below are general definitions of the Hayes-compatible commands being used in the example. Your specific modem may require commands in addition to or instead of those shown in this example. Refer to the documentation that came with your modem for more information.
vN - Displays result codes in short form (numbers) or long form (test).
N = 0: send numeric responses
N = 1: send word responses (default).
eN - Turns the command echo feature on or off.
N = 0: command echo off
N = 1: command echo on (default).
qN - Displays or suppresses (quiets) result codes
N = 0: displays codes (default).
N = 1: suppresses codes.
&dN - Controls data terminal ready (DTR) transition
0 = ignore DTR signal
1 = return to command mode when after losing DTR
810-1648-05 Rev A TM View Software User's Manual
65 of 73
2 = hang up, turn off auto answer, and return to command mode after losing DTR (default)
3 = reset after losing DTR
xN - Determines which result codes will be displayed following modem operations
N = 0: Basic response set, blind dialing
N = 1: extended response set, blind dialing
N = 2: extended response set, dial tone detection
N = 3: extended response set, blind dialing, and busy signal detection
N = 4: extended response set, dial tone, and busy signal detection (default).
Advanced Dialing Strings
Overview
Occasionally, nonstandard communications configurations may require that you exercise direct control over interaction between the host computer running TM View and the modem (or modem-compatible) device.
TM View supports this unusual but important requirement through advanced dial strings. An advanced dial string is any string containing the caret (^, usually shift-6 on U.S. English keyboards).
Since the presence of caret characters significantly changes the behavior of the dial string, TM View prevents you from entering them by default. To enter an advanced dial string containing carets, you must first check the Allow advanced dial string checkbox. The box is found just below the Phone Number on the Configure Modem Connection page of the New File Creation (or Update Communications) wizard. After checking the box, you may type the advanced dial string in the Phone Number text box.
Send/Expect Protocol
The caret character is used to define a send/expect protocol between the computer running TM View and the modem (or modem-like device) attached to the selected COM port. Carets in properly-formed advanced dial strings always come in pairs. The first member of the pair defines a block of text that TM View will send to the modem. The second caret defines the response to expect from the modem-like device. Further interactions may be specified by entering a third caret with a send sequence, a matching fourth caret defining an expected response, etc. In principle there is no limit to the length of the send/expect sequence that may be defined.
Example: the advanced dial string
^AT^OK^ATDT5551212^CONNECTED^AT^OK^ATDT7^CHANNEL 7
Would be executed as follows:
1. TM View opens the COM port and then transmits the string AT to the port.
2. TM View collects response lines from the port until the pattern OK is found.
3. TM View sends the string ATDT5551212 to the port.
810-1648-05 Rev A TM View Software User's Manual
66 of 73
4. TM View collects response lines until the pattern CONNECTED is found.
5. TM View transmits the string AT to the port.
6. TM View collects response lines until the pattern OK is found.
7. TM View transmits the string ATDT7 to the port.
8. TM View collects response lines until the pattern CHANNEL 7 is found.
At this point, TM View assumes it is connected to the Serveron transformer monitor and begins communication with the monitor.
Each time TM View transmits a character sequence to the port, it begins interpreting response lines. It continues to collect response lines until the expected response is found or a timeout occurs. The timeout is relatively long (3 minutes). If the timeout occurs, TM View reports that it was unable to connect to the monitor.
Configuring TAPI Modems
TM View uses TAPI, a feature of Microsoft Windows, to access the modem when communicating with Serveron Model TM3, TM5 and TM8 (TMx) monitors. Use of TAPI requires that your analog modem be properly installed as a TAPI modem. If you plan to communicate with Model TMx monitors using analog modem(s), you must ensure your modem is properly installed and configured for use by TAPI.
Note: if you do not use modem(s) to communicate with Serveron Model TMx monitors, this section does not apply to your installation.
To select the TAPI modem, click Select Modem in the Action menu to display the Select Modem dialog box. The dialog box contains a dropdown list containing all properly-configured TAPI modems. If your modem does not appear in the list, click Configure TAPI
Modem to display the Add/Remove Hardware wizard. Follow the prompts in the wizard to configure your modem.
If your modem does not appear in the dropdown list after you complete the Add/Remove
Hardware wizard, the following information may be helpful.
To determine whether your analog modem is properly installed for use by TAPI, click Settings in your Start menu, open the Control Panel, and then double-click Phone and
Modem Options. In the Phone and Modem Options applet, select the Modems tab. Verify that your modem (example: MultiTech MT5600ZDX Play & Play) is shown in the list. If it is not, click the Add... button and use the wizard to properly install and configure your modem for use by TAPI.
TM View will automatically create a phonebook entry named Serveron to manage your modem. If you system does not have a properly configured TAPI modem, TM View may fail to bind or may logically bind to a nonfunctional device such as the printer port. If your modem is configured for TAPI but you are unable to connect to your model TMx monitor using it, click Settings in your Start menu and then click Network Connections. Right-click
810-1648-05 Rev A TM View Software User's Manual
67 of 73
and delete the Serveron entry in the list. Ensure your modem is properly installed for use by TAPI as described above and then restart your computer.
When your computer is ready, start TM View and try the connection again. You may then view your Network Connections and verify that the Serveron entry has been recreated.
Troubleshooting
Corrupt or Invalid Files
Overview
TM View stores data in structured textual files with the extension .TGH. These files are informally referred to as TGH files.1 Although they are textual, TGH files have an internal structure that must be preserved to allow TM View to correctly process of the file. If the internal structure of a TGH file is not correct, TM View will report that the file is corrupt or
invalid. This section describes steps that may be taken to recover most or all of the data in this unusual case.
Note: Serveron recommends that you create a backup copy of any .TGH file before attempting any of the actions described below. Serveron strongly
discourages the examination or modification of TGH files using programs other than TM View except when absolutely required.
File Structure
TGH files consist of a series of sections. Each section consists of a single header line followed by content lines. The header consists of the section name, e.g. Alarms, enclosed in angle brackets < and >.
TGH files may be examined and modified using any textual file editor, e.g. Microsoft Notepad. Examination of a TGH file that has been populated with data will show that the file‟s sections fall into two loose groups, header sections and data sections.
Each header section contains a collection of key=value pairs. The keys are often but not always numeric. The values include communications configuration, metadata (e.g. company, site and asset names), and monitor configuration (alarm limits, schedules, etc.)
Each data section contains an ordered collection of date-time=value,value,… lines. Each line in a data section must begin with a date and time. The definition of the values within the line varies from one section to another.
An example of a .TGH file is shown below.
1 The acronym TGH stands for Transformer Gas History.
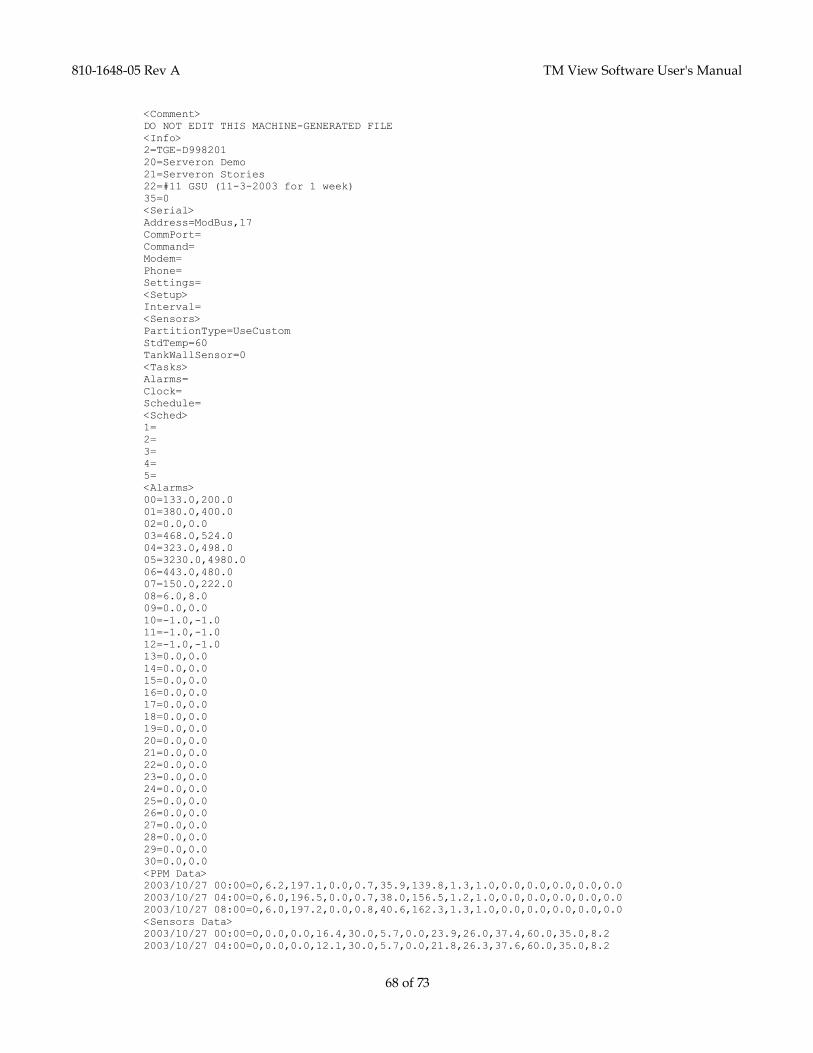
810-1648-05 Rev A TM View Software User's Manual
68 of 73
<Comment>
DO NOT EDIT THIS MACHINE-GENERATED FILE
<Info>
2=TGE-D998201
20=Serveron Demo
21=Serveron Stories
22=#11 GSU (11-3-2003 for 1 week)
35=0
<Serial>
Address=ModBus,17
CommPort=
Command=
Modem=
Phone=
Settings=
<Setup>
Interval=
<Sensors>
PartitionType=UseCustom
StdTemp=60
TankWallSensor=0
<Tasks>
Alarms=
Clock=
Schedule=
<Sched>
1=
2=
3=
4=
5=
<Alarms>
00=133.0,200.0
01=380.0,400.0
02=0.0,0.0
03=468.0,524.0
04=323.0,498.0
05=3230.0,4980.0
06=443.0,480.0
07=150.0,222.0
08=6.0,8.0
09=0.0,0.0
10=-1.0,-1.0
11=-1.0,-1.0
12=-1.0,-1.0
13=0.0,0.0
14=0.0,0.0
15=0.0,0.0
16=0.0,0.0
17=0.0,0.0
18=0.0,0.0
19=0.0,0.0
20=0.0,0.0
21=0.0,0.0
22=0.0,0.0
23=0.0,0.0
24=0.0,0.0
25=0.0,0.0
26=0.0,0.0
27=0.0,0.0
28=0.0,0.0
29=0.0,0.0
30=0.0,0.0
<PPM Data>
2003/10/27 00:00=0,6.2,197.1,0.0,0.7,35.9,139.8,1.3,1.0,0.0,0.0,0.0,0.0,0.0
2003/10/27 04:00=0,6.0,196.5,0.0,0.7,38.0,156.5,1.2,1.0,0.0,0.0,0.0,0.0,0.0
2003/10/27 08:00=0,6.0,197.2,0.0,0.8,40.6,162.3,1.3,1.0,0.0,0.0,0.0,0.0,0.0
<Sensors Data>
2003/10/27 00:00=0,0.0,0.0,16.4,30.0,5.7,0.0,23.9,26.0,37.4,60.0,35.0,8.2
2003/10/27 04:00=0,0.0,0.0,12.1,30.0,5.7,0.0,21.8,26.3,37.6,60.0,35.0,8.2
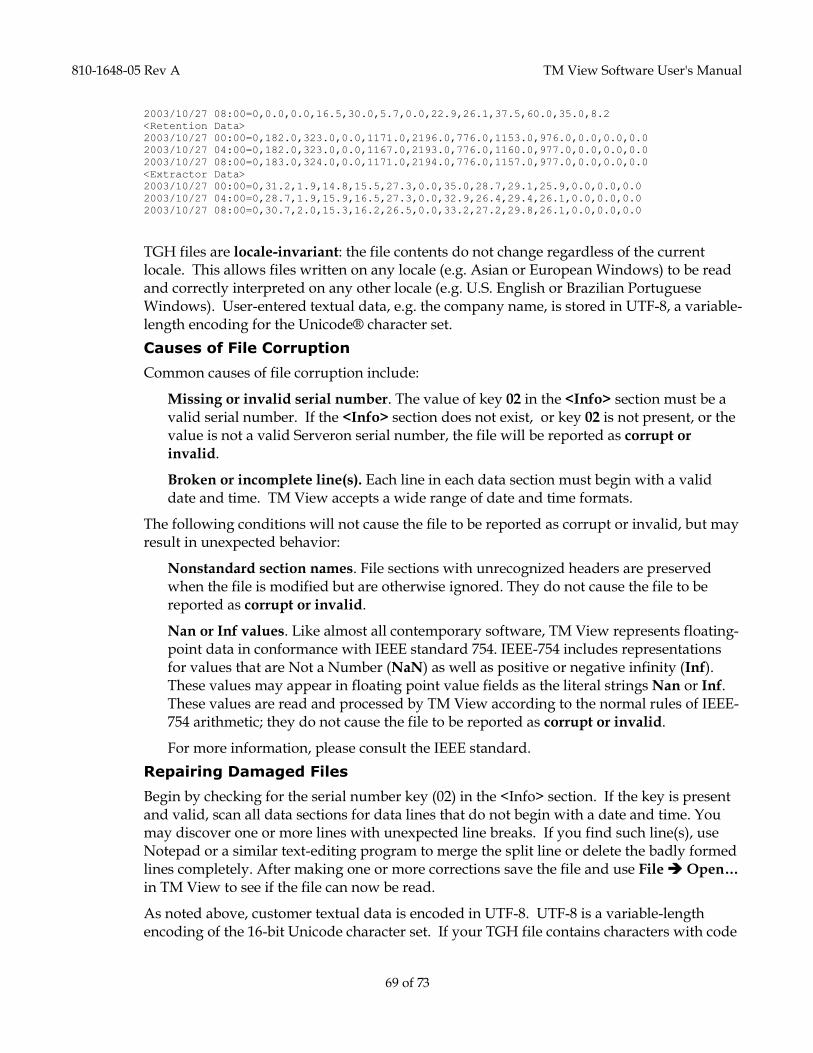
810-1648-05 Rev A TM View Software User's Manual
69 of 73
2003/10/27 08:00=0,0.0,0.0,16.5,30.0,5.7,0.0,22.9,26.1,37.5,60.0,35.0,8.2
<Retention Data>
2003/10/27 00:00=0,182.0,323.0,0.0,1171.0,2196.0,776.0,1153.0,976.0,0.0,0.0,0.0
2003/10/27 04:00=0,182.0,323.0,0.0,1167.0,2193.0,776.0,1160.0,977.0,0.0,0.0,0.0
2003/10/27 08:00=0,183.0,324.0,0.0,1171.0,2194.0,776.0,1157.0,977.0,0.0,0.0,0.0
<Extractor Data>
2003/10/27 00:00=0,31.2,1.9,14.8,15.5,27.3,0.0,35.0,28.7,29.1,25.9,0.0,0.0,0.0
2003/10/27 04:00=0,28.7,1.9,15.9,16.5,27.3,0.0,32.9,26.4,29.4,26.1,0.0,0.0,0.0
2003/10/27 08:00=0,30.7,2.0,15.3,16.2,26.5,0.0,33.2,27.2,29.8,26.1,0.0,0.0,0.0
TGH files are locale-invariant: the file contents do not change regardless of the current locale. This allows files written on any locale (e.g. Asian or European Windows) to be read and correctly interpreted on any other locale (e.g. U.S. English or Brazilian Portuguese Windows). User-entered textual data, e.g. the company name, is stored in UTF-8, a variable-length encoding for the Unicode® character set.
Causes of File Corruption
Common causes of file corruption include:
Missing or invalid serial number. The value of key 02 in the <Info> section must be a valid serial number. If the <Info> section does not exist, or key 02 is not present, or the value is not a valid Serveron serial number, the file will be reported as corrupt or
invalid.
Broken or incomplete line(s). Each line in each data section must begin with a valid date and time. TM View accepts a wide range of date and time formats.
The following conditions will not cause the file to be reported as corrupt or invalid, but may result in unexpected behavior:
Nonstandard section names. File sections with unrecognized headers are preserved when the file is modified but are otherwise ignored. They do not cause the file to be reported as corrupt or invalid.
Nan or Inf values. Like almost all contemporary software, TM View represents floating-point data in conformance with IEEE standard 754. IEEE-754 includes representations for values that are Not a Number (NaN) as well as positive or negative infinity (Inf). These values may appear in floating point value fields as the literal strings Nan or Inf. These values are read and processed by TM View according to the normal rules of IEEE-754 arithmetic; they do not cause the file to be reported as corrupt or invalid.
For more information, please consult the IEEE standard.
Repairing Damaged Files
Begin by checking for the serial number key (02) in the <Info> section. If the key is present and valid, scan all data sections for data lines that do not begin with a date and time. You may discover one or more lines with unexpected line breaks. If you find such line(s), use Notepad or a similar text-editing program to merge the split line or delete the badly formed lines completely. After making one or more corrections save the file and use File Open… in TM View to see if the file can now be read.
As noted above, customer textual data is encoded in UTF-8. UTF-8 is a variable-length encoding of the 16-bit Unicode character set. If your TGH file contains characters with code
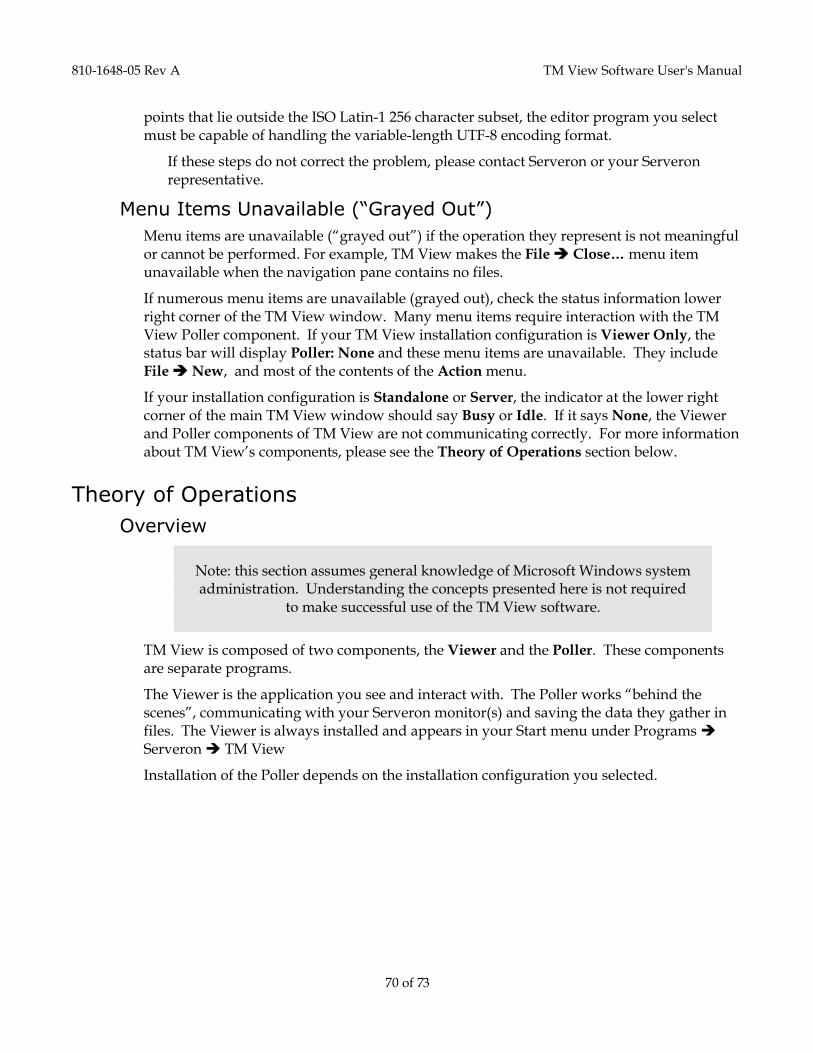
810-1648-05 Rev A TM View Software User's Manual
70 of 73
points that lie outside the ISO Latin-1 256 character subset, the editor program you select must be capable of handling the variable-length UTF-8 encoding format.
If these steps do not correct the problem, please contact Serveron or your Serveron representative.
Menu Items Unavailable (“Grayed Out”)
Menu items are unavailable (“grayed out”) if the operation they represent is not meaningful or cannot be performed. For example, TM View makes the File Close… menu item unavailable when the navigation pane contains no files.
If numerous menu items are unavailable (grayed out), check the status information lower right corner of the TM View window. Many menu items require interaction with the TM View Poller component. If your TM View installation configuration is Viewer Only, the status bar will display Poller: None and these menu items are unavailable. They include File New, and most of the contents of the Action menu.
If your installation configuration is Standalone or Server, the indicator at the lower right corner of the main TM View window should say Busy or Idle. If it says None, the Viewer and Poller components of TM View are not communicating correctly. For more information about TM View‟s components, please see the Theory of Operations section below.
Theory of Operations
Overview
Note: this section assumes general knowledge of Microsoft Windows system administration. Understanding the concepts presented here is not required
to make successful use of the TM View software.
TM View is composed of two components, the Viewer and the Poller. These components are separate programs.
The Viewer is the application you see and interact with. The Poller works “behind the scenes”, communicating with your Serveron monitor(s) and saving the data they gather in files. The Viewer is always installed and appears in your Start menu under Programs Serveron TM View
Installation of the Poller depends on the installation configuration you selected.
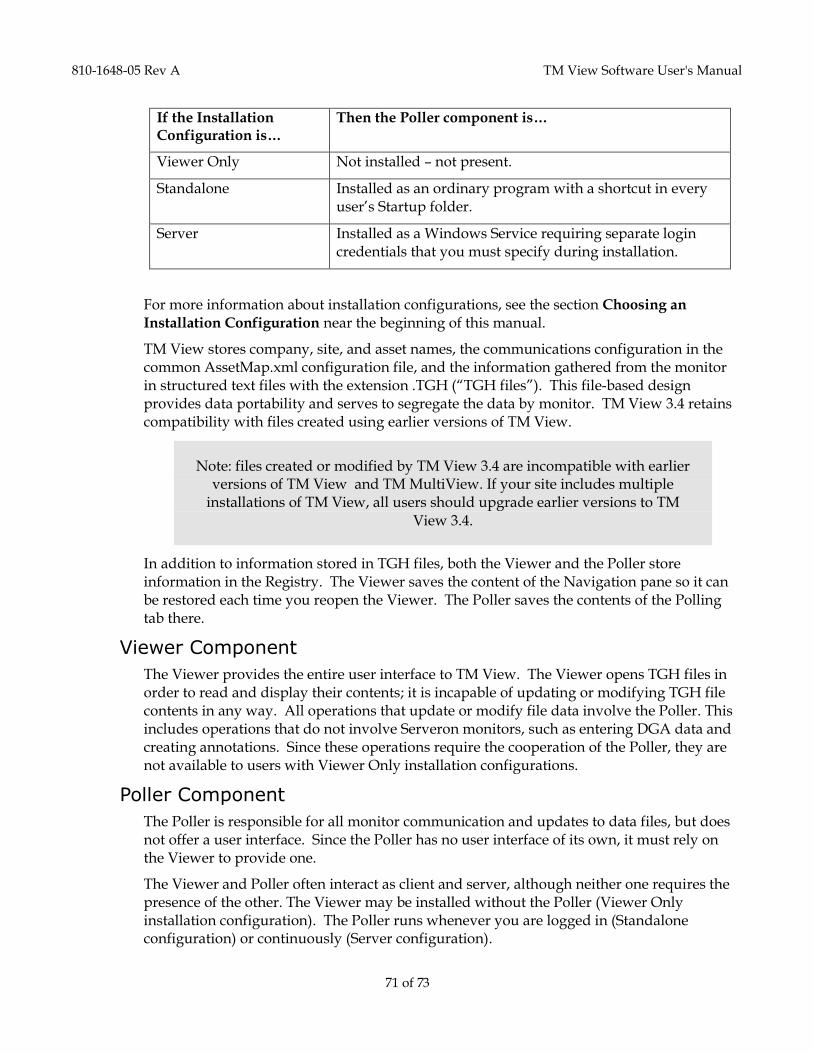
810-1648-05 Rev A TM View Software User's Manual
71 of 73
If the Installation Configuration is…
Then the Poller component is…
Viewer Only Not installed – not present.
Standalone Installed as an ordinary program with a shortcut in every user‟s Startup folder.
Server Installed as a Windows Service requiring separate login credentials that you must specify during installation.
For more information about installation configurations, see the section Choosing an
Installation Configuration near the beginning of this manual.
TM View stores company, site, and asset names, the communications configuration in the common AssetMap.xml configuration file, and the information gathered from the monitor in structured text files with the extension .TGH (“TGH files”). This file-based design provides data portability and serves to segregate the data by monitor. TM View 3.4 retains compatibility with files created using earlier versions of TM View.
Note: files created or modified by TM View 3.4 are incompatible with earlier versions of TM View and TM MultiView. If your site includes multiple
installations of TM View, all users should upgrade earlier versions to TM View 3.4.
In addition to information stored in TGH files, both the Viewer and the Poller store information in the Registry. The Viewer saves the content of the Navigation pane so it can be restored each time you reopen the Viewer. The Poller saves the contents of the Polling tab there.
Viewer Component
The Viewer provides the entire user interface to TM View. The Viewer opens TGH files in order to read and display their contents; it is incapable of updating or modifying TGH file contents in any way. All operations that update or modify file data involve the Poller. This includes operations that do not involve Serveron monitors, such as entering DGA data and creating annotations. Since these operations require the cooperation of the Poller, they are not available to users with Viewer Only installation configurations.
Poller Component
The Poller is responsible for all monitor communication and updates to data files, but does not offer a user interface. Since the Poller has no user interface of its own, it must rely on the Viewer to provide one.
The Viewer and Poller often interact as client and server, although neither one requires the presence of the other. The Viewer may be installed without the Poller (Viewer Only installation configuration). The Poller runs whenever you are logged in (Standalone configuration) or continuously (Server configuration).
810-1648-05 Rev A TM View Software User's Manual
72 of 73
The Viewer communicates with the Poller using TCP/IP. The Poller listens on port 8011. The Poller accepts connections only from a single Viewer on the same computer (localhost). This feature is hardwired in the code. Restricting incoming connections to localhost addresses network security concerns associated with the use of TCP.
If you run firewall software locally on the PC, you may be required to configure the firewall to allow the Poller to listen locally on port 8011. As noted above, this should not raise security concerns because the Poller will only accept connections originating from the same computer on which it is running. TM View does not offer any network service(s) available from off-host.
Poller Output
The poller output consists of the TGH files written when a monitor is polled.
Starting with TM View 3.0, another sort of output has been added to the poller: OPC publishing. OPC is a well established industrial standard for interfacing SCADA devices and computers. The Serveron Integrated Poller has OPC server capabilities, and can expose on OPC the data for all the TM3, TM5 and TM8 monitors that it is configured with.
See Appendix A for the OPC maps associated with the Serveron Poller, TM3, TM5 and TM8 monitors.
Normally this output mode is turned off. Most installations of TM View do not require OPC visibility, nor do they need the overhead. Please refer to the OPC User Guide for more information.
Starting with TM View 3.1, the Serveron Integrated Poller also features ODBC output and Alarms Notifications.
Please see the TM View ODBC User Guide and the TM View Notifications User Guide for more information about these features.
810-1648-05 Rev A TM View Software User's Manual
73 of 73
For more information, contact your nearest Serveron
Representative or Serveron Corporation.
Serveron Corporation, A BPL Global Company 3305 NW Aloclek Drive Hillsboro, OR 97124-7101 Corporate Office: +1 (800) 880-2552 Technical Support: +1 (866) 273-7763 Fax: (503) 924-3290 E-mail: [email protected] http://www.serveron.com
Copyright © 2010 Serveron Corporation
All rights reserved.