Embed Size (px)
Citation preview
Alarms, Trends and DiagnosticsTM640

2 TM640 - Alarms, Trends and Diagnostics
Prerequisites and requirementsTraining modules TM610 – Working with Integrated Visualization
Software Automation Studio 4.2
Hardware None
Table of Contents
TM640 - Alarms, Trends and Diagnostics 3
Table of Contents
1 Introduction...........................................................................................................................................41.1 Learning objectives................................................................................................................. 4
2 The Visual Components alarm system................................................................................................52.1 Alarm system terminology...................................................................................................... 52.2 Task definition......................................................................................................................... 72.3 Configuring the alarm system.................................................................................................82.4 Viewing alarms at runtime.................................................................................................... 102.5 Interacting with the alarm system.........................................................................................152.6 Acknowledging alarms.......................................................................................................... 192.7 Bit and value alarms.............................................................................................................202.8 mapp technology centralized alarm management................................................................21
3 The Visual Components trend system...............................................................................................243.1 Trend system terminology.....................................................................................................243.2 Task definition....................................................................................................................... 263.3 Configuring the trend system................................................................................................273.4 Displaying an online trend.................................................................................................... 283.5 Interacting with the trend system..........................................................................................38
4 Diagnostics using the System Diagnostics Manager (SDM)............................................................. 404.1 Task definition....................................................................................................................... 414.2 Enabling the System Diagnostics Manager..........................................................................424.3 Displaying the SDM HTML pages........................................................................................ 424.4 Interacting with the SDM...................................................................................................... 44
5 Summary............................................................................................................................................ 45
Introduction
4 TM640 - Alarms, Trends and Diagnostics
1 Introduction
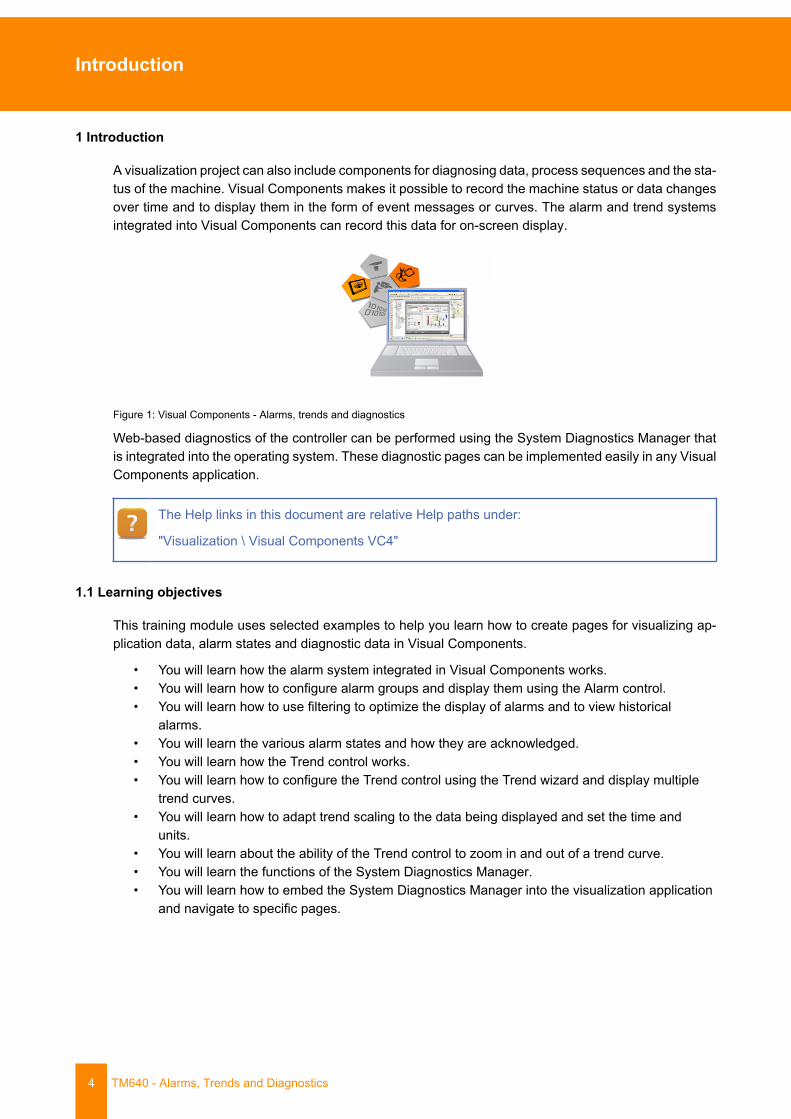
A visualization project can also include components for diagnosing data, process sequences and the sta-tus of the machine. Visual Components makes it possible to record the machine status or data changesover time and to display them in the form of event messages or curves. The alarm and trend systemsintegrated into Visual Components can record this data for on-screen display.
Figure 1: Visual Components - Alarms, trends and diagnostics
Web-based diagnostics of the controller can be performed using the System Diagnostics Manager thatis integrated into the operating system. These diagnostic pages can be implemented easily in any VisualComponents application.
The Help links in this document are relative Help paths under:
"Visualization \ Visual Components VC4"
1.1 Learning objectives
This training module uses selected examples to help you learn how to create pages for visualizing ap-plication data, alarm states and diagnostic data in Visual Components.
• You will learn how the alarm system integrated in Visual Components works.• You will learn how to configure alarm groups and display them using the Alarm control.• You will learn how to use filtering to optimize the display of alarms and to view historical
alarms.• You will learn the various alarm states and how they are acknowledged.• You will learn how the Trend control works.• You will learn how to configure the Trend control using the Trend wizard and display multiple
trend curves.• You will learn how to adapt trend scaling to the data being displayed and set the time and
units.• You will learn about the ability of the Trend control to zoom in and out of a trend curve.• You will learn the functions of the System Diagnostics Manager.• You will learn how to embed the System Diagnostics Manager into the visualization application
and navigate to specific pages.
The Visual Components alarm system
TM640 - Alarms, Trends and Diagnostics 5
2 The Visual Components alarm system
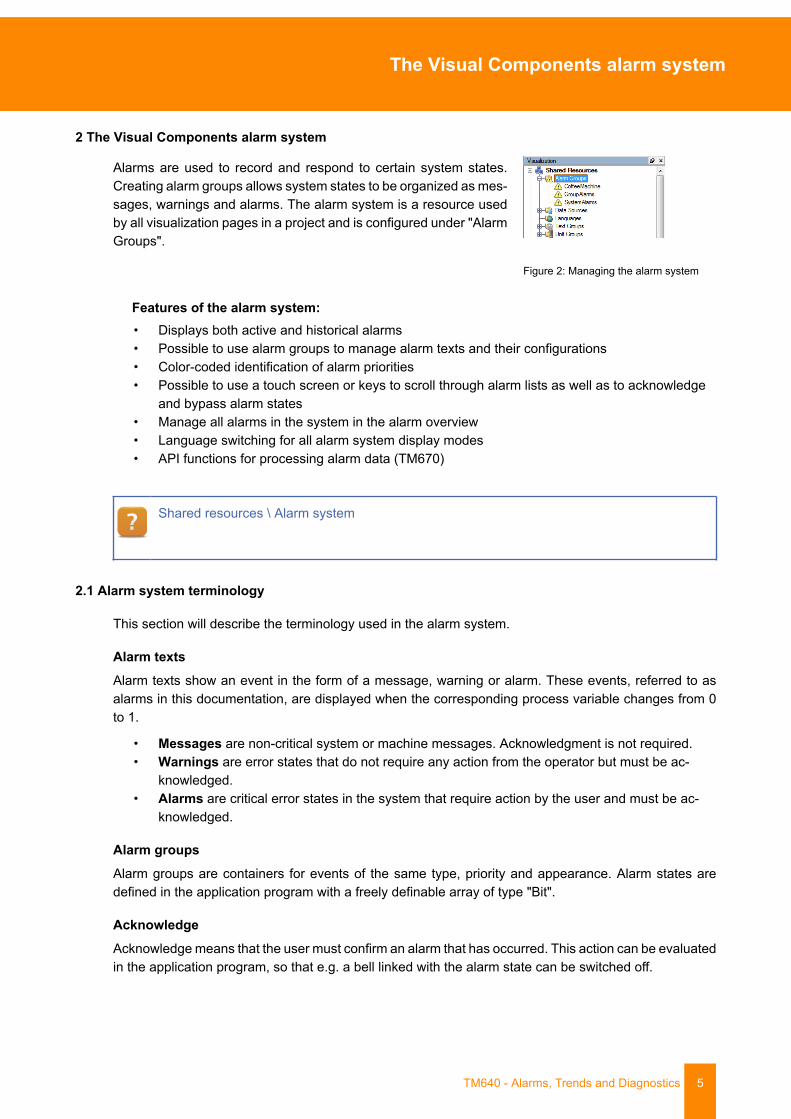
Alarms are used to record and respond to certain system states.Creating alarm groups allows system states to be organized as mes-sages, warnings and alarms. The alarm system is a resource usedby all visualization pages in a project and is configured under "AlarmGroups".
Figure 2: Managing the alarm system
Features of the alarm system:• Displays both active and historical alarms• Possible to use alarm groups to manage alarm texts and their configurations• Color-coded identification of alarm priorities• Possible to use a touch screen or keys to scroll through alarm lists as well as to acknowledge
and bypass alarm states• Manage all alarms in the system in the alarm overview• Language switching for all alarm system display modes• API functions for processing alarm data (TM670)
Shared resources \ Alarm system
2.1 Alarm system terminology
This section will describe the terminology used in the alarm system.
Alarm textsAlarm texts show an event in the form of a message, warning or alarm. These events, referred to asalarms in this documentation, are displayed when the corresponding process variable changes from 0to 1.
• Messages are non-critical system or machine messages. Acknowledgment is not required.• Warnings are error states that do not require any action from the operator but must be ac-
knowledged.• Alarms are critical error states in the system that require action by the user and must be ac-
knowledged.
Alarm groupsAlarm groups are containers for events of the same type, priority and appearance. Alarm states aredefined in the application program with a freely definable array of type "Bit".
AcknowledgeAcknowledge means that the user must confirm an alarm that has occurred. This action can be evaluatedin the application program, so that e.g. a bell linked with the alarm state can be switched off.
The Visual Components alarm system
6 TM640 - Alarms, Trends and Diagnostics
BypassingBypassing means that the alarm can be shut off intentionally by the user regardless of the alarm state.Bypassed alarms can be monitored in the application program.
Latched alarmsLatched alarms are given the date and time of the first time they occur. If the alarm is acknowledged (orbypassed) and then triggered again, the date and time is not updated.
System alarmsSystem alarms indicate errors and status information from the Visual Components runtime environment.These include, for example, the switch-on message and the battery status.
Story involving an alarm system In 1994 an explosion and subsequent fires at the Texacorefinery in Milford Haven, Wales, injured twenty-six people and caused material damages ofaround £48 million and considerable production downtime. In the course of an investigationby the British Health and Safety Executive (HSE), the following factors were found to havecontributed to the catastrophe:
• There were too many alarms, and they were poorly prioritized.• The displays in the control room didn't help the operators understand what was hap-
pening.
In the 11 minutes leading up to the explosion, two operators were faced with 274 alarms thathad to be acknowledged and responded to appropriately.
The Visual Components alarm system
TM640 - Alarms, Trends and Diagnostics 7
2.2 Task definition
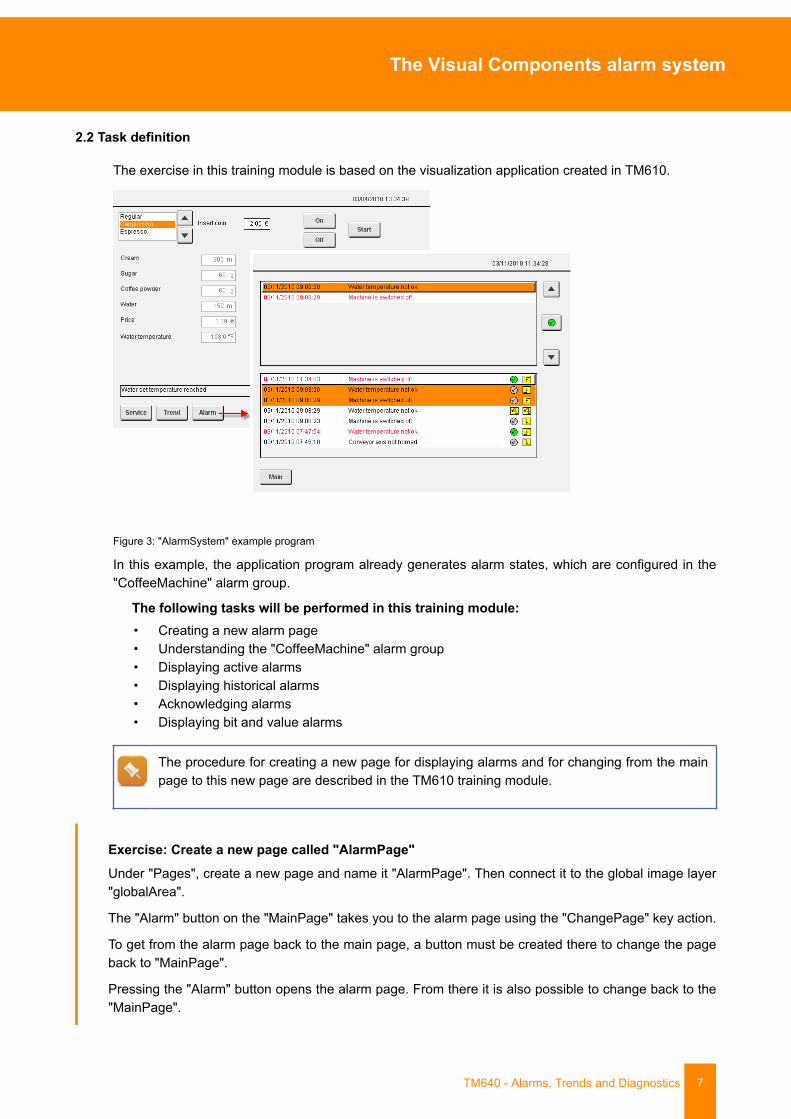
The exercise in this training module is based on the visualization application created in TM610.
Figure 3: "AlarmSystem" example program
In this example, the application program already generates alarm states, which are configured in the"CoffeeMachine" alarm group.
The following tasks will be performed in this training module:• Creating a new alarm page• Understanding the "CoffeeMachine" alarm group• Displaying active alarms• Displaying historical alarms• Acknowledging alarms• Displaying bit and value alarms
The procedure for creating a new page for displaying alarms and for changing from the mainpage to this new page are described in the TM610 training module.
Exercise: Create a new page called "AlarmPage"Under "Pages", create a new page and name it "AlarmPage". Then connect it to the global image layer"globalArea".
The "Alarm" button on the "MainPage" takes you to the alarm page using the "ChangePage" key action.
To get from the alarm page back to the main page, a button must be created there to change the pageback to "MainPage".
Pressing the "Alarm" button opens the alarm page. From there it is also possible to change back to the"MainPage".
The Visual Components alarm system
8 TM640 - Alarms, Trends and Diagnostics
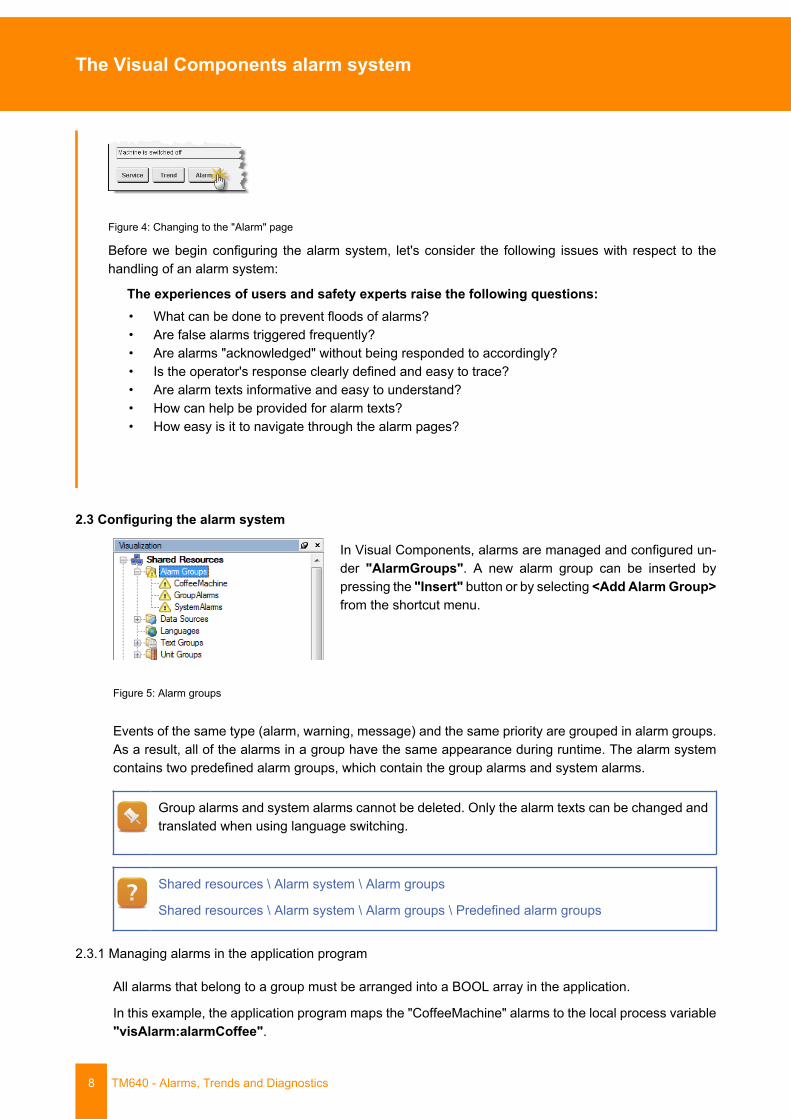
Figure 4: Changing to the "Alarm" page
Before we begin configuring the alarm system, let's consider the following issues with respect to thehandling of an alarm system:
The experiences of users and safety experts raise the following questions:• What can be done to prevent floods of alarms?• Are false alarms triggered frequently?• Are alarms "acknowledged" without being responded to accordingly?• Is the operator's response clearly defined and easy to trace?• Are alarm texts informative and easy to understand?• How can help be provided for alarm texts?• How easy is it to navigate through the alarm pages?
2.3 Configuring the alarm system
Figure 5: Alarm groups
In Visual Components, alarms are managed and configured un-der "AlarmGroups". A new alarm group can be inserted bypressing the "Insert" button or by selecting <Add Alarm Group>from the shortcut menu.
Events of the same type (alarm, warning, message) and the same priority are grouped in alarm groups.As a result, all of the alarms in a group have the same appearance during runtime. The alarm systemcontains two predefined alarm groups, which contain the group alarms and system alarms.
Group alarms and system alarms cannot be deleted. Only the alarm texts can be changed andtranslated when using language switching.
Shared resources \ Alarm system \ Alarm groups
Shared resources \ Alarm system \ Alarm groups \ Predefined alarm groups
2.3.1 Managing alarms in the application program
All alarms that belong to a group must be arranged into a BOOL array in the application.
In this example, the application program maps the "CoffeeMachine" alarms to the local process variable"visAlarm:alarmCoffee".
The Visual Components alarm system
TM640 - Alarms, Trends and Diagnostics 9
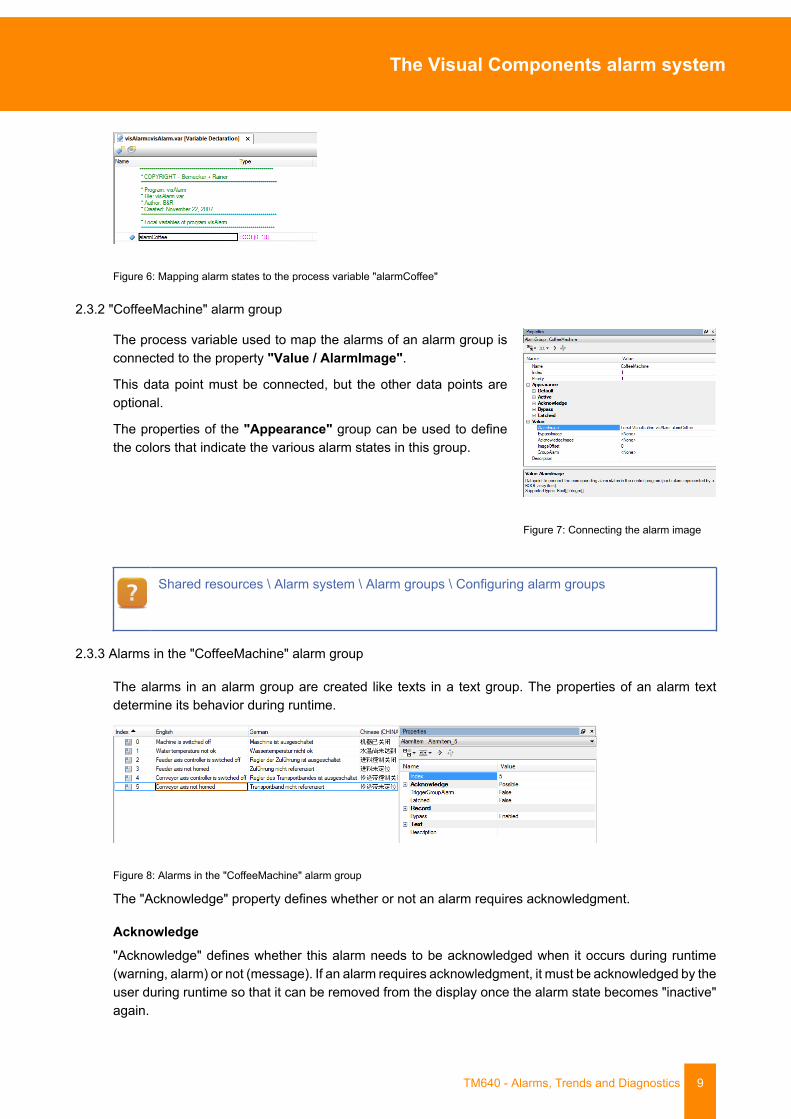
Figure 6: Mapping alarm states to the process variable "alarmCoffee"
2.3.2 "CoffeeMachine" alarm group
The process variable used to map the alarms of an alarm group isconnected to the property "Value / AlarmImage".
This data point must be connected, but the other data points areoptional.
The properties of the "Appearance" group can be used to definethe colors that indicate the various alarm states in this group.
Figure 7: Connecting the alarm image
Shared resources \ Alarm system \ Alarm groups \ Configuring alarm groups
2.3.3 Alarms in the "CoffeeMachine" alarm group
The alarms in an alarm group are created like texts in a text group. The properties of an alarm textdetermine its behavior during runtime.
Figure 8: Alarms in the "CoffeeMachine" alarm group
The "Acknowledge" property defines whether or not an alarm requires acknowledgment.
Acknowledge"Acknowledge" defines whether this alarm needs to be acknowledged when it occurs during runtime(warning, alarm) or not (message). If an alarm requires acknowledgment, it must be acknowledged by theuser during runtime so that it can be removed from the display once the alarm state becomes "inactive"again.
The Visual Components alarm system
10 TM640 - Alarms, Trends and Diagnostics
WhileActiveThis property specifies whether an acknowledgeable alarm is allowed to be acknowledged while it isstill pending.
The alarm bit array connected to the alarm group must be at least as large as the maximumindex of the alarm text.
Shared resources \ Alarm system \ Alarm groups \ Configuring alarm groups
2.3.4 Static and dynamic alarm text
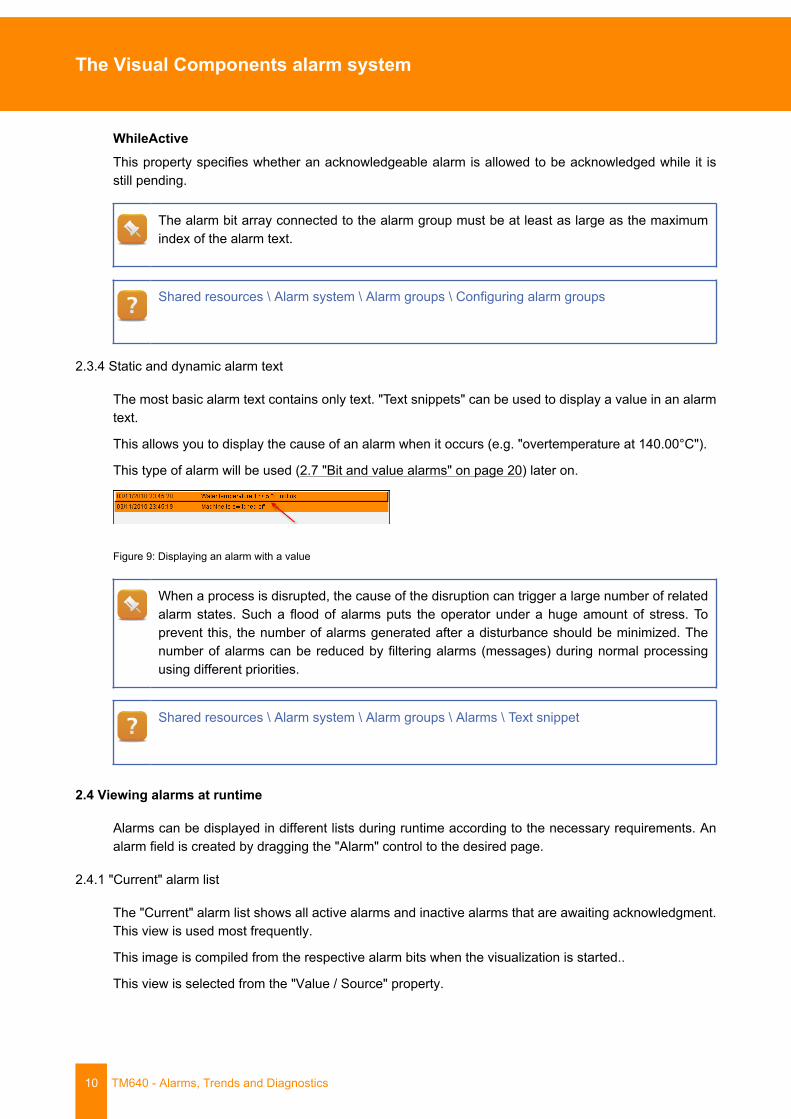
The most basic alarm text contains only text. "Text snippets" can be used to display a value in an alarmtext.
This allows you to display the cause of an alarm when it occurs (e.g. "overtemperature at 140.00°C").
This type of alarm will be used (2.7 "Bit and value alarms" on page 20) later on.
Figure 9: Displaying an alarm with a value
When a process is disrupted, the cause of the disruption can trigger a large number of relatedalarm states. Such a flood of alarms puts the operator under a huge amount of stress. Toprevent this, the number of alarms generated after a disturbance should be minimized. Thenumber of alarms can be reduced by filtering alarms (messages) during normal processingusing different priorities.
Shared resources \ Alarm system \ Alarm groups \ Alarms \ Text snippet
2.4 Viewing alarms at runtime
Alarms can be displayed in different lists during runtime according to the necessary requirements. Analarm field is created by dragging the "Alarm" control to the desired page.
2.4.1 "Current" alarm list
The "Current" alarm list shows all active alarms and inactive alarms that are awaiting acknowledgment.This view is used most frequently.
This image is compiled from the respective alarm bits when the visualization is started..
This view is selected from the "Value / Source" property.
The Visual Components alarm system
TM640 - Alarms, Trends and Diagnostics 11
Exercise: Insert an alarm control to display the "Current" alarm listOn the "AlarmPage", have the "Current" alarm list appear in the top half of the page. The alarm list shouldtherefore be placed in the top half of the screen. Leave about 50 pixels free to the right of the alarm list.
1) Insert an "Alarm" control on the "AlarmPage".
2) Adjust its size.
3) Change the "Value / Source" property.
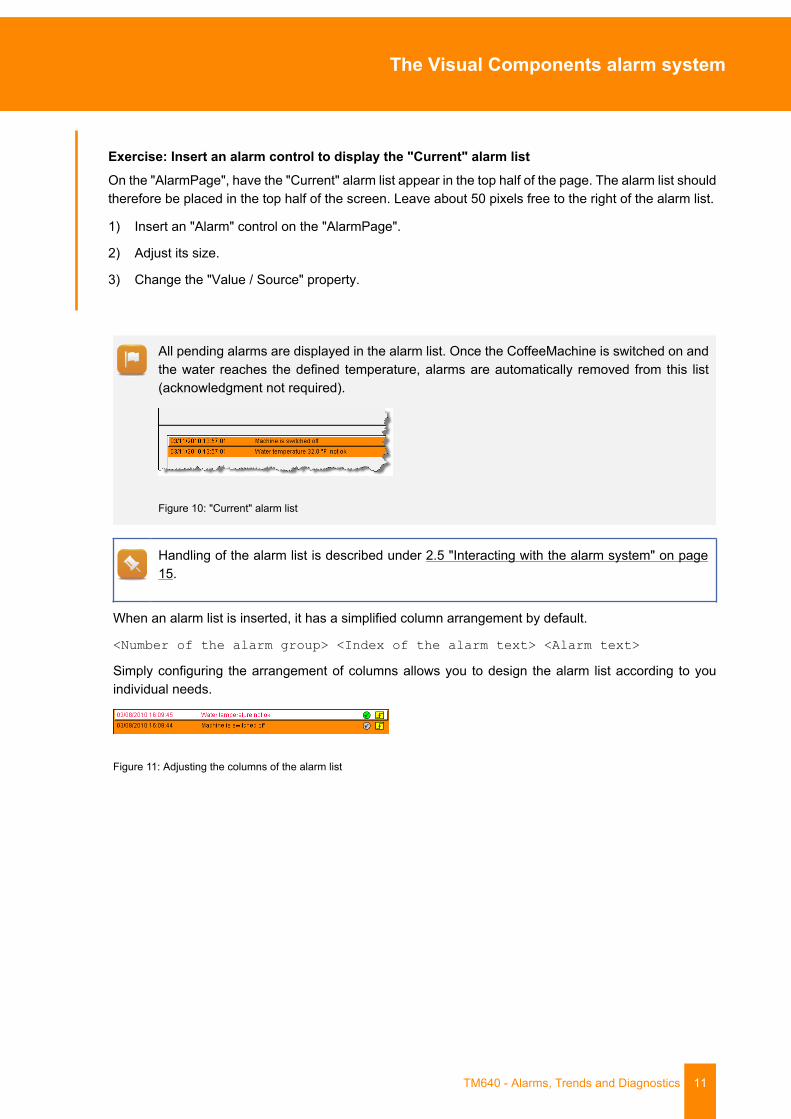
All pending alarms are displayed in the alarm list. Once the CoffeeMachine is switched on andthe water reaches the defined temperature, alarms are automatically removed from this list(acknowledgment not required).
Figure 10: "Current" alarm list
Handling of the alarm list is described under 2.5 "Interacting with the alarm system" on page15.
When an alarm list is inserted, it has a simplified column arrangement by default.
<Number of the alarm group> <Index of the alarm text> <Alarm text>
Simply configuring the arrangement of columns allows you to design the alarm list according to youindividual needs.
Figure 11: Adjusting the columns of the alarm list
The Visual Components alarm system
12 TM640 - Alarms, Trends and Diagnostics
2.4.2 Configuring the columns of the alarm list
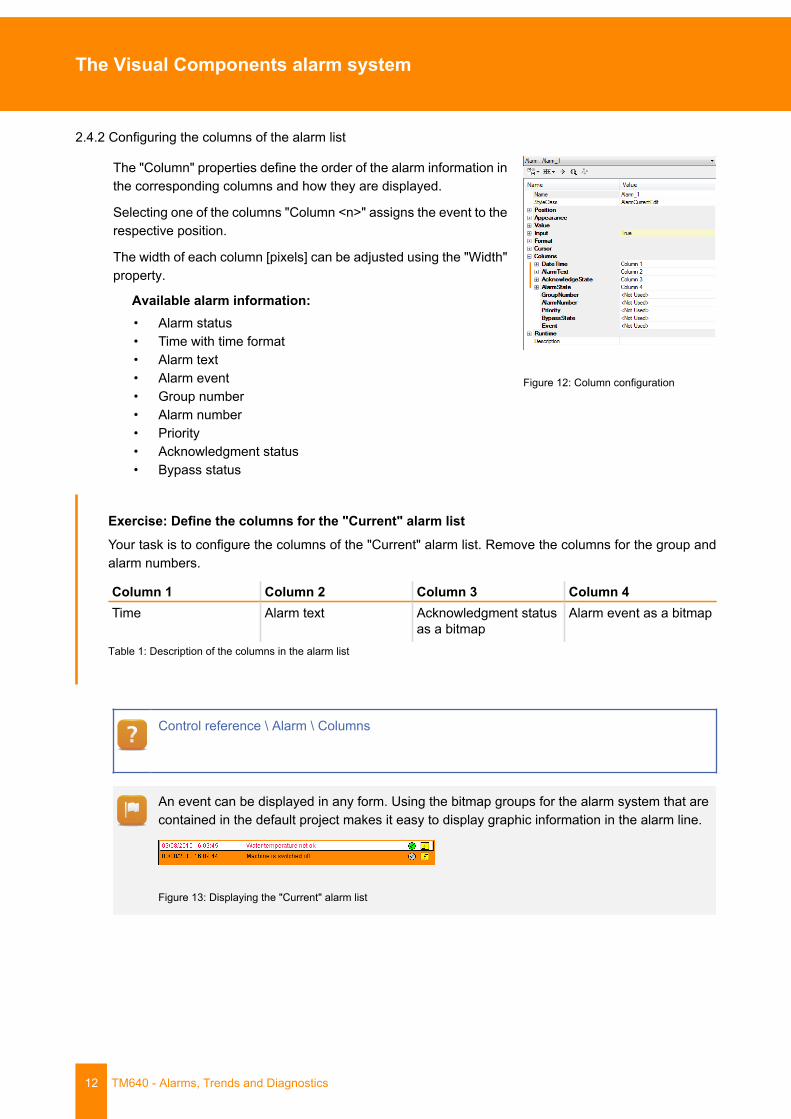
The "Column" properties define the order of the alarm information inthe corresponding columns and how they are displayed.
Selecting one of the columns "Column <n>" assigns the event to therespective position.
The width of each column [pixels] can be adjusted using the "Width"property.
Available alarm information:• Alarm status• Time with time format• Alarm text• Alarm event• Group number• Alarm number• Priority• Acknowledgment status• Bypass status
Figure 12: Column configuration
Exercise: Define the columns for the "Current" alarm listYour task is to configure the columns of the "Current" alarm list. Remove the columns for the group andalarm numbers.
Column 1 Column 2 Column 3 Column 4Time Alarm text Acknowledgment status
as a bitmapAlarm event as a bitmap
Table 1: Description of the columns in the alarm list
Control reference \ Alarm \ Columns
An event can be displayed in any form. Using the bitmap groups for the alarm system that arecontained in the default project makes it easy to display graphic information in the alarm line.
Figure 13: Displaying the "Current" alarm list
The Visual Components alarm system
TM640 - Alarms, Trends and Diagnostics 13
The colors used for the alarm texts to display the different alarmstates can be defined in the properties of the alarm group.
Each status can be assigned a different foreground and backgroundcolor.
Default: Appearance of an unacknowledged inactive alarm.
Active: Appearance of an active alarm (Alarm = 1)
Acknowledge: Appearance of an acknowledged alarm
Bypass: Appearance of a bypassed alarm
Latched: Appearance of a latched alarm
Figure 14: Color arrangement
As can be seen in the image above, the first alarm has been acknowledged while the second one isstill active.
The acknowledge bitmap is also displayed accordingly. The alarm event bitmap indicates that the alarmis active.
2.4.3 "History" alarm list
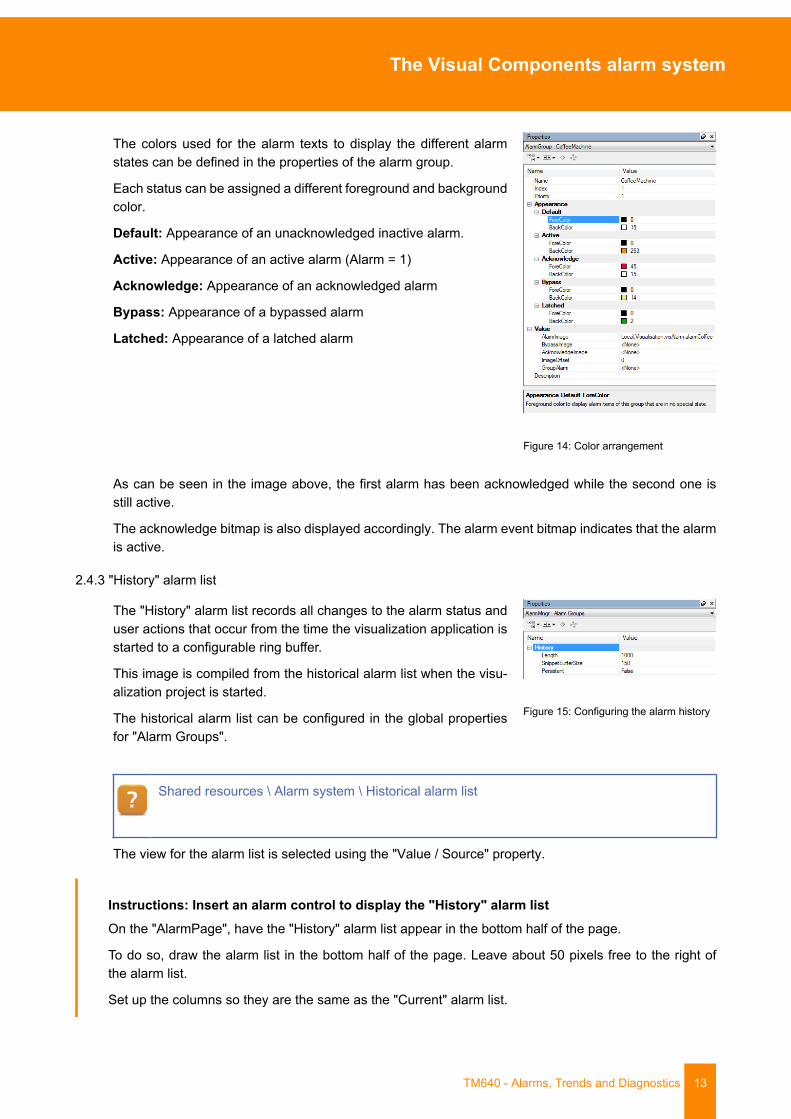
The "History" alarm list records all changes to the alarm status anduser actions that occur from the time the visualization application isstarted to a configurable ring buffer.
This image is compiled from the historical alarm list when the visu-alization project is started.
The historical alarm list can be configured in the global propertiesfor "Alarm Groups".
Figure 15: Configuring the alarm history
Shared resources \ Alarm system \ Historical alarm list
The view for the alarm list is selected using the "Value / Source" property.
Instructions: Insert an alarm control to display the "History" alarm listOn the "AlarmPage", have the "History" alarm list appear in the bottom half of the page.
To do so, draw the alarm list in the bottom half of the page. Leave about 50 pixels free to the right ofthe alarm list.
Set up the columns so they are the same as the "Current" alarm list.
The Visual Components alarm system
14 TM640 - Alarms, Trends and Diagnostics
1) Insert an "Alarm" control on the "AlarmPage".
2) Adjust its size and align it with the "Current" alarm list.
3) Change the "Value / Source" property.
4) Change the "Columns" properties.
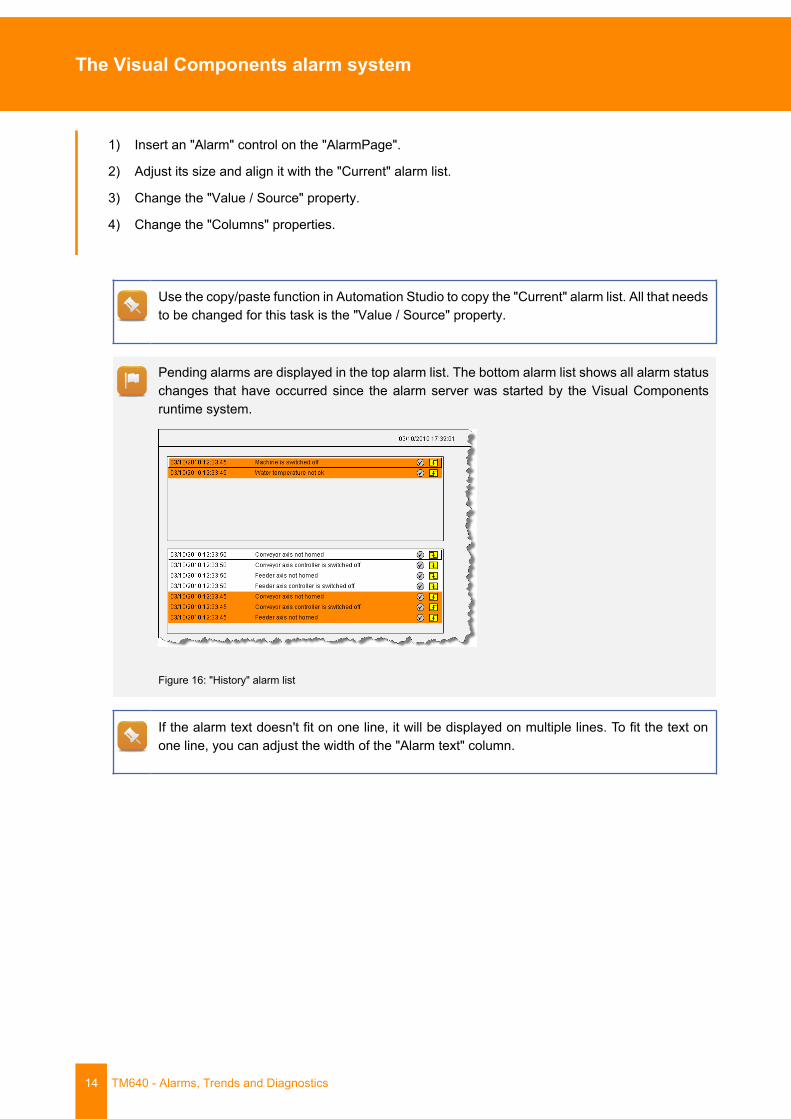
Use the copy/paste function in Automation Studio to copy the "Current" alarm list. All that needsto be changed for this task is the "Value / Source" property.
Pending alarms are displayed in the top alarm list. The bottom alarm list shows all alarm statuschanges that have occurred since the alarm server was started by the Visual Componentsruntime system.
Figure 16: "History" alarm list
If the alarm text doesn't fit on one line, it will be displayed on multiple lines. To fit the text onone line, you can adjust the width of the "Alarm text" column.
The Visual Components alarm system
TM640 - Alarms, Trends and Diagnostics 15
2.5 Interacting with the alarm system
In the previous exercises, we have focused on simply displaying alarms.
The alarm system can be operated using a configurable touchpad, buttons or the keyboard.
You can interact with the alarm system in the following ways:• Scrolling in the alarm list• Acknowledging an alarm that requires acknowledgment• Acknowledging all alarms• Bypassing an alarm
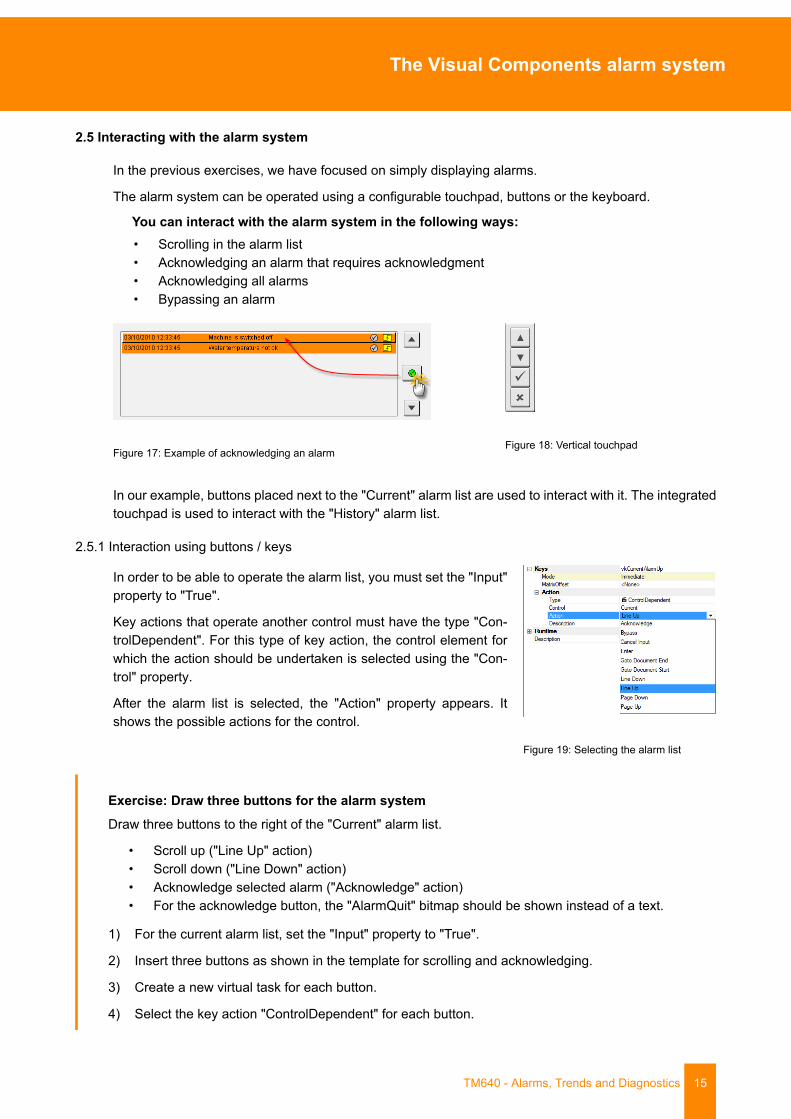
Figure 17: Example of acknowledging an alarmFigure 18: Vertical touchpad
In our example, buttons placed next to the "Current" alarm list are used to interact with it. The integratedtouchpad is used to interact with the "History" alarm list.
2.5.1 Interaction using buttons / keys
In order to be able to operate the alarm list, you must set the "Input"property to "True".
Key actions that operate another control must have the type "Con-trolDependent". For this type of key action, the control element forwhich the action should be undertaken is selected using the "Con-trol" property.
After the alarm list is selected, the "Action" property appears. Itshows the possible actions for the control.
Figure 19: Selecting the alarm list
Exercise: Draw three buttons for the alarm systemDraw three buttons to the right of the "Current" alarm list.
• Scroll up ("Line Up" action)• Scroll down ("Line Down" action)• Acknowledge selected alarm ("Acknowledge" action)• For the acknowledge button, the "AlarmQuit" bitmap should be shown instead of a text.
1) For the current alarm list, set the "Input" property to "True".
2) Insert three buttons as shown in the template for scrolling and acknowledging.
3) Create a new virtual task for each button.
4) Select the key action "ControlDependent" for each button.
The Visual Components alarm system
16 TM640 - Alarms, Trends and Diagnostics
5) Select the control for the "Current" alarm list.
6) Configure the respective actions.
The "ControlDependent" task action only affects controls whose "Input" property is set to "True".
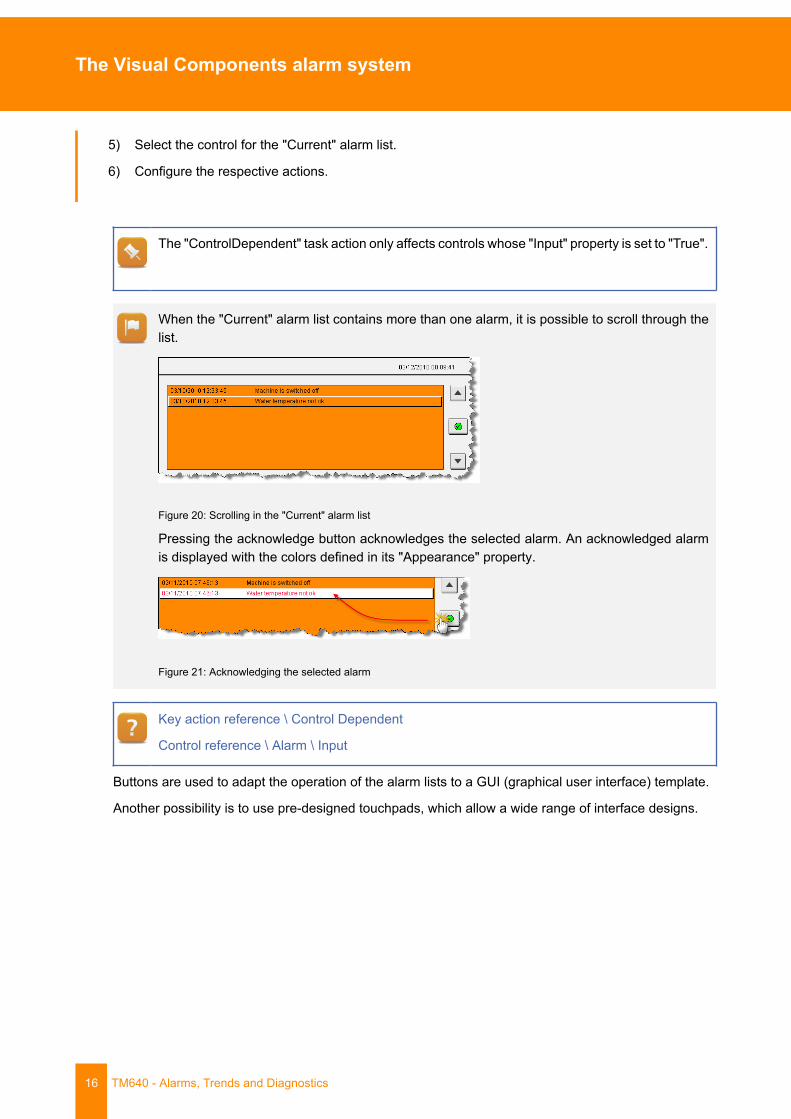
When the "Current" alarm list contains more than one alarm, it is possible to scroll through thelist.
Figure 20: Scrolling in the "Current" alarm list
Pressing the acknowledge button acknowledges the selected alarm. An acknowledged alarmis displayed with the colors defined in its "Appearance" property.
Figure 21: Acknowledging the selected alarm
Key action reference \ Control Dependent
Control reference \ Alarm \ Input
Buttons are used to adapt the operation of the alarm lists to a GUI (graphical user interface) template.
Another possibility is to use pre-designed touchpads, which allow a wide range of interface designs.
The Visual Components alarm system
TM640 - Alarms, Trends and Diagnostics 17
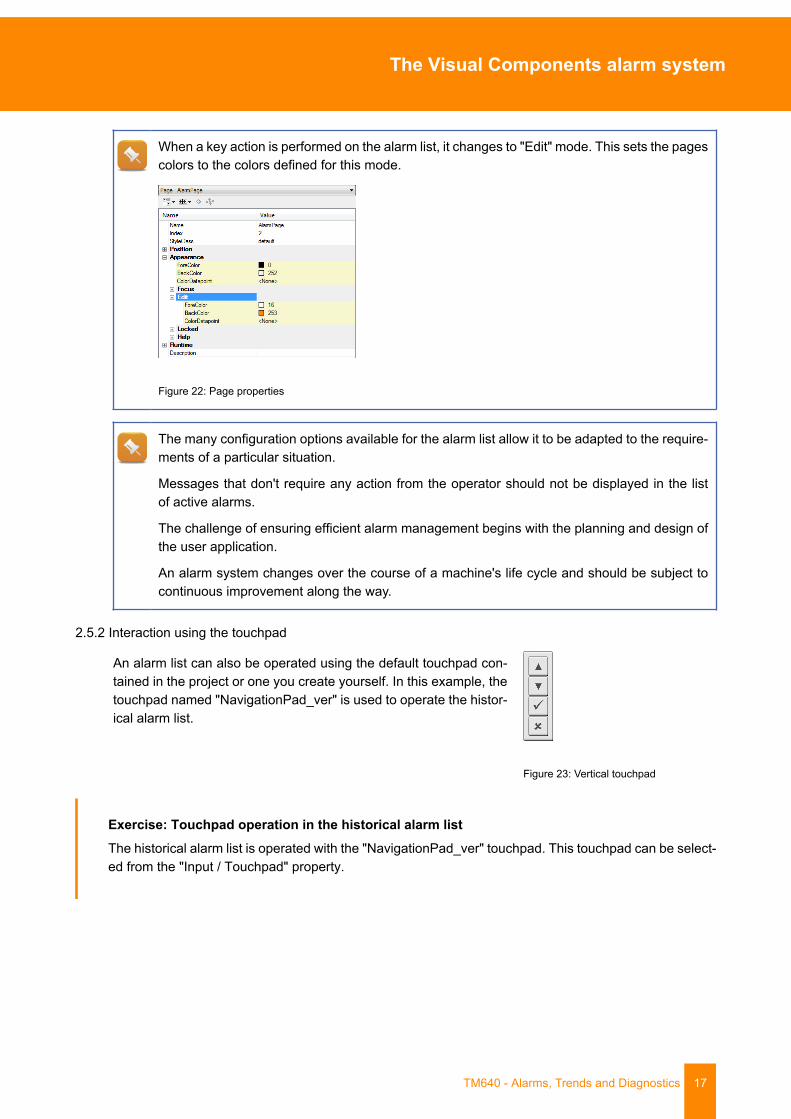
When a key action is performed on the alarm list, it changes to "Edit" mode. This sets the pagescolors to the colors defined for this mode.
Figure 22: Page properties
The many configuration options available for the alarm list allow it to be adapted to the require-ments of a particular situation.
Messages that don't require any action from the operator should not be displayed in the listof active alarms.
The challenge of ensuring efficient alarm management begins with the planning and design ofthe user application.
An alarm system changes over the course of a machine's life cycle and should be subject tocontinuous improvement along the way.
2.5.2 Interaction using the touchpad
An alarm list can also be operated using the default touchpad con-tained in the project or one you create yourself. In this example, thetouchpad named "NavigationPad_ver" is used to operate the histor-ical alarm list.
Figure 23: Vertical touchpad
Exercise: Touchpad operation in the historical alarm listThe historical alarm list is operated with the "NavigationPad_ver" touchpad. This touchpad can be select-ed from the "Input / Touchpad" property.
The Visual Components alarm system
18 TM640 - Alarms, Trends and Diagnostics
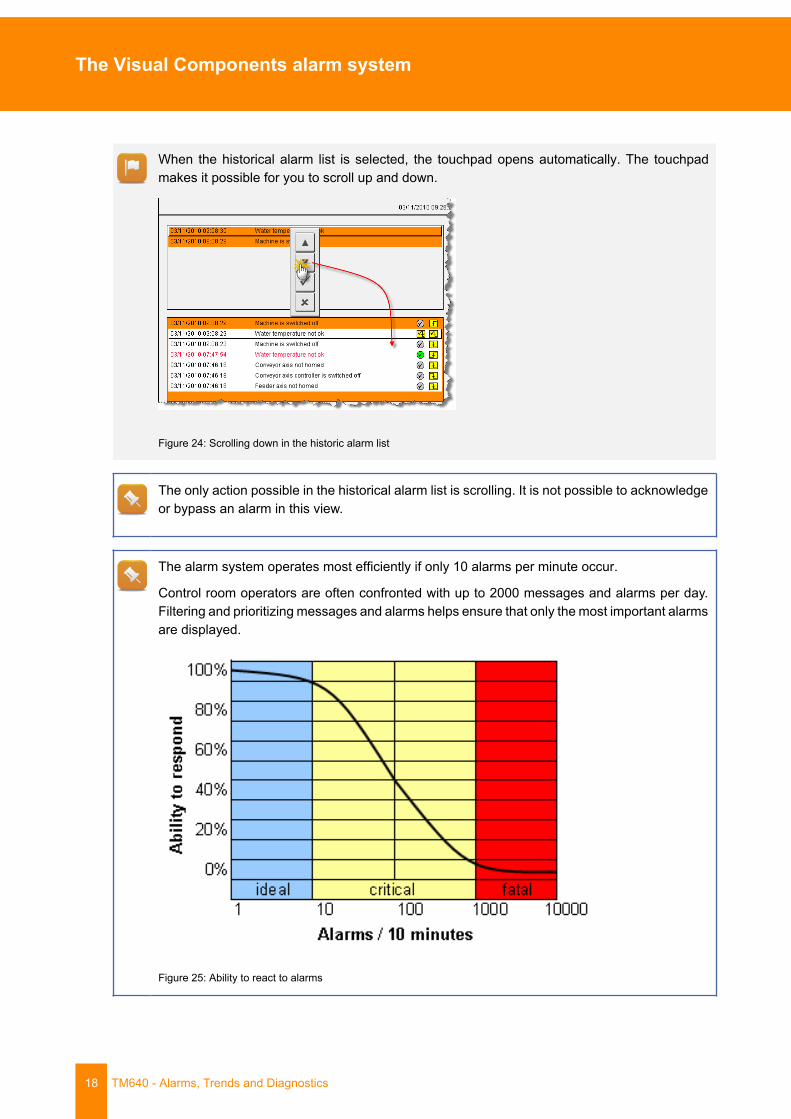
When the historical alarm list is selected, the touchpad opens automatically. The touchpadmakes it possible for you to scroll up and down.
Figure 24: Scrolling down in the historic alarm list
The only action possible in the historical alarm list is scrolling. It is not possible to acknowledgeor bypass an alarm in this view.
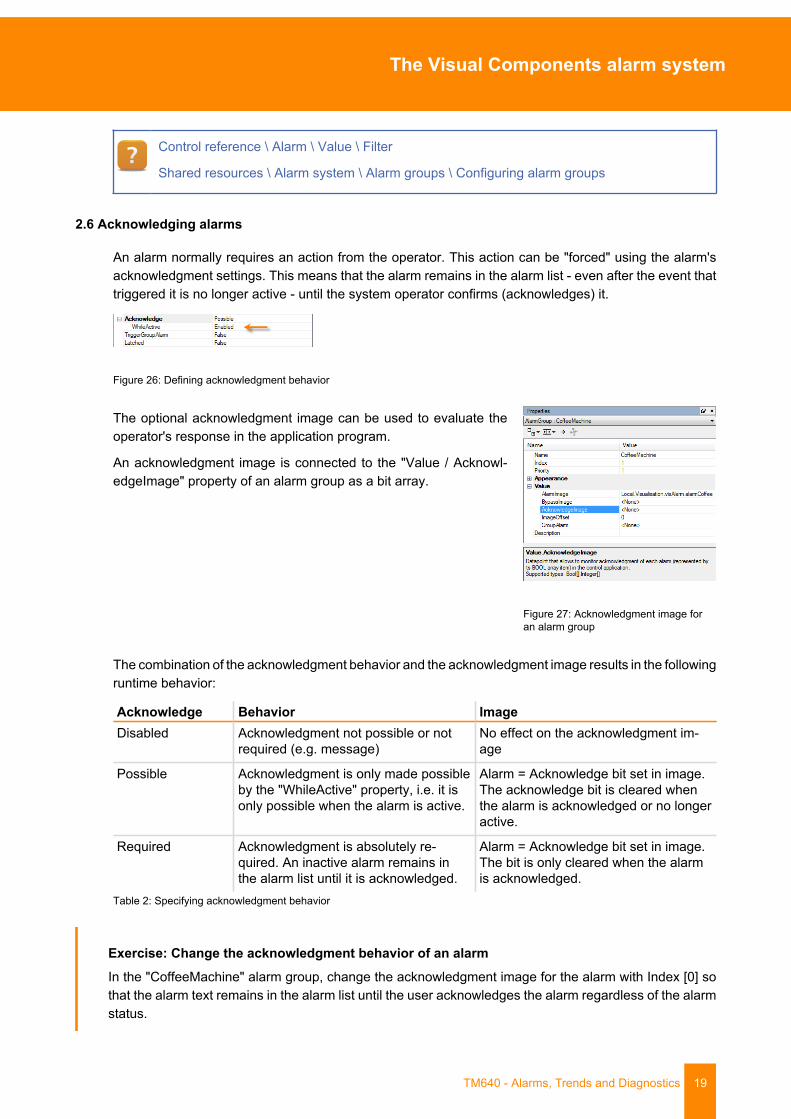
The alarm system operates most efficiently if only 10 alarms per minute occur.
Control room operators are often confronted with up to 2000 messages and alarms per day.Filtering and prioritizing messages and alarms helps ensure that only the most important alarmsare displayed.
Figure 25: Ability to react to alarms
The Visual Components alarm system
TM640 - Alarms, Trends and Diagnostics 19
Control reference \ Alarm \ Value \ Filter
Shared resources \ Alarm system \ Alarm groups \ Configuring alarm groups
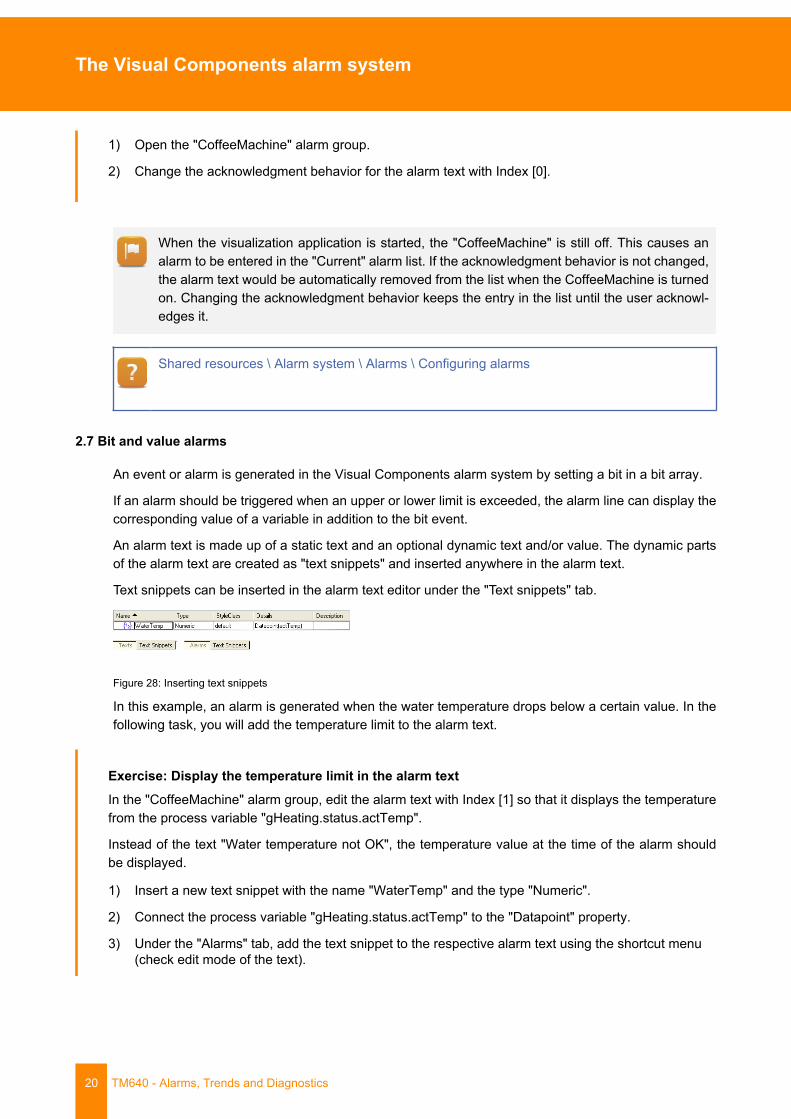
2.6 Acknowledging alarms
An alarm normally requires an action from the operator. This action can be "forced" using the alarm'sacknowledgment settings. This means that the alarm remains in the alarm list - even after the event thattriggered it is no longer active - until the system operator confirms (acknowledges) it.
Figure 26: Defining acknowledgment behavior
The optional acknowledgment image can be used to evaluate theoperator's response in the application program.
An acknowledgment image is connected to the "Value / Acknowl-edgeImage" property of an alarm group as a bit array.
Figure 27: Acknowledgment image foran alarm group
The combination of the acknowledgment behavior and the acknowledgment image results in the followingruntime behavior:
Acknowledge Behavior ImageDisabled Acknowledgment not possible or not
required (e.g. message)No effect on the acknowledgment im-age
Possible Acknowledgment is only made possibleby the "WhileActive" property, i.e. it isonly possible when the alarm is active.
Alarm = Acknowledge bit set in image.The acknowledge bit is cleared whenthe alarm is acknowledged or no longeractive.
Required Acknowledgment is absolutely re-quired. An inactive alarm remains inthe alarm list until it is acknowledged.
Alarm = Acknowledge bit set in image.The bit is only cleared when the alarmis acknowledged.
Table 2: Specifying acknowledgment behavior
Exercise: Change the acknowledgment behavior of an alarmIn the "CoffeeMachine" alarm group, change the acknowledgment image for the alarm with Index [0] sothat the alarm text remains in the alarm list until the user acknowledges the alarm regardless of the alarmstatus.
The Visual Components alarm system
20 TM640 - Alarms, Trends and Diagnostics
1) Open the "CoffeeMachine" alarm group.
2) Change the acknowledgment behavior for the alarm text with Index [0].
When the visualization application is started, the "CoffeeMachine" is still off. This causes analarm to be entered in the "Current" alarm list. If the acknowledgment behavior is not changed,the alarm text would be automatically removed from the list when the CoffeeMachine is turnedon. Changing the acknowledgment behavior keeps the entry in the list until the user acknowl-edges it.
Shared resources \ Alarm system \ Alarms \ Configuring alarms
2.7 Bit and value alarms
An event or alarm is generated in the Visual Components alarm system by setting a bit in a bit array.
If an alarm should be triggered when an upper or lower limit is exceeded, the alarm line can display thecorresponding value of a variable in addition to the bit event.
An alarm text is made up of a static text and an optional dynamic text and/or value. The dynamic partsof the alarm text are created as "text snippets" and inserted anywhere in the alarm text.
Text snippets can be inserted in the alarm text editor under the "Text snippets" tab.
Figure 28: Inserting text snippets
In this example, an alarm is generated when the water temperature drops below a certain value. In thefollowing task, you will add the temperature limit to the alarm text.
Exercise: Display the temperature limit in the alarm textIn the "CoffeeMachine" alarm group, edit the alarm text with Index [1] so that it displays the temperaturefrom the process variable "gHeating.status.actTemp".
Instead of the text "Water temperature not OK", the temperature value at the time of the alarm shouldbe displayed.
1) Insert a new text snippet with the name "WaterTemp" and the type "Numeric".
2) Connect the process variable "gHeating.status.actTemp" to the "Datapoint" property.
3) Under the "Alarms" tab, add the text snippet to the respective alarm text using the shortcut menu(check edit mode of the text).
The Visual Components alarm system
TM640 - Alarms, Trends and Diagnostics 21
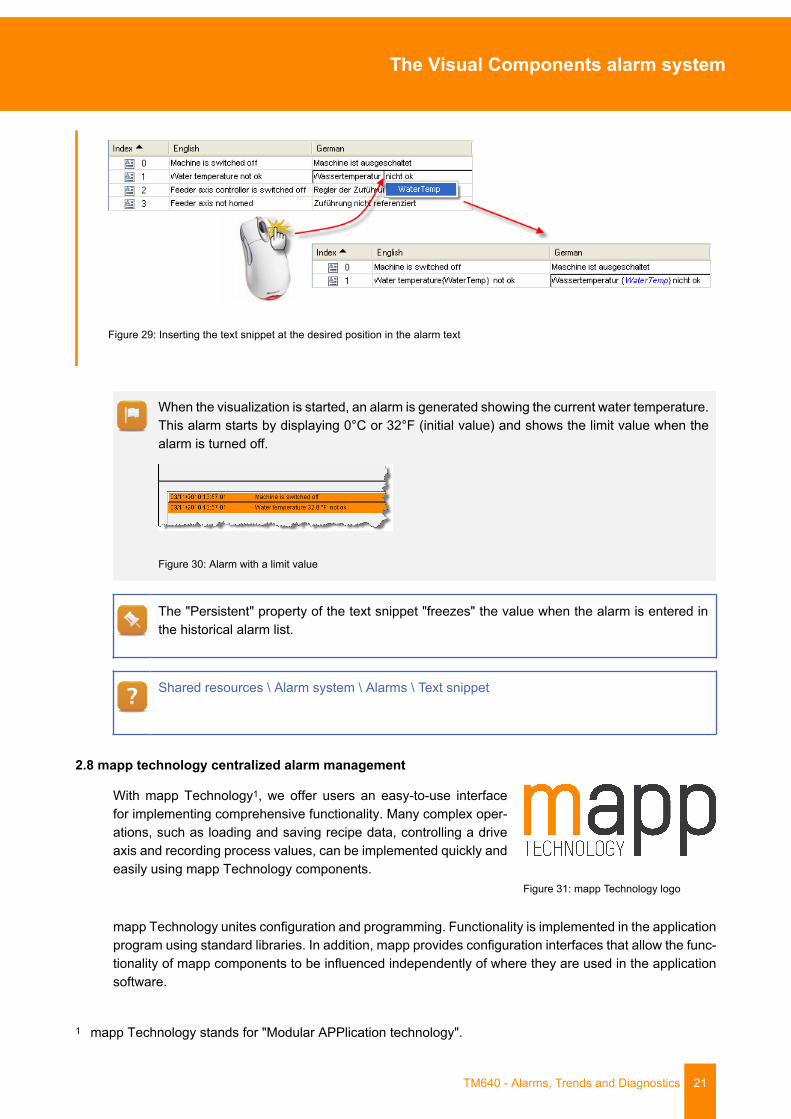
Figure 29: Inserting the text snippet at the desired position in the alarm text
When the visualization is started, an alarm is generated showing the current water temperature.This alarm starts by displaying 0°C or 32°F (initial value) and shows the limit value when thealarm is turned off.
Figure 30: Alarm with a limit value
The "Persistent" property of the text snippet "freezes" the value when the alarm is entered inthe historical alarm list.
Shared resources \ Alarm system \ Alarms \ Text snippet
2.8 mapp technology centralized alarm management
With mapp Technology1, we offer users an easy-to-use interfacefor implementing comprehensive functionality. Many complex oper-ations, such as loading and saving recipe data, controlling a driveaxis and recording process values, can be implemented quickly andeasily using mapp Technology components.
Figure 31: mapp Technology logo
mapp Technology unites configuration and programming. Functionality is implemented in the applicationprogram using standard libraries. In addition, mapp provides configuration interfaces that allow the func-tionality of mapp components to be influenced independently of where they are used in the applicationsoftware.
1 mapp Technology stands for "Modular APPlication technology".
The Visual Components alarm system
22 TM640 - Alarms, Trends and Diagnostics
Application layer - mapp Technology
• Concept• Getting started• Components
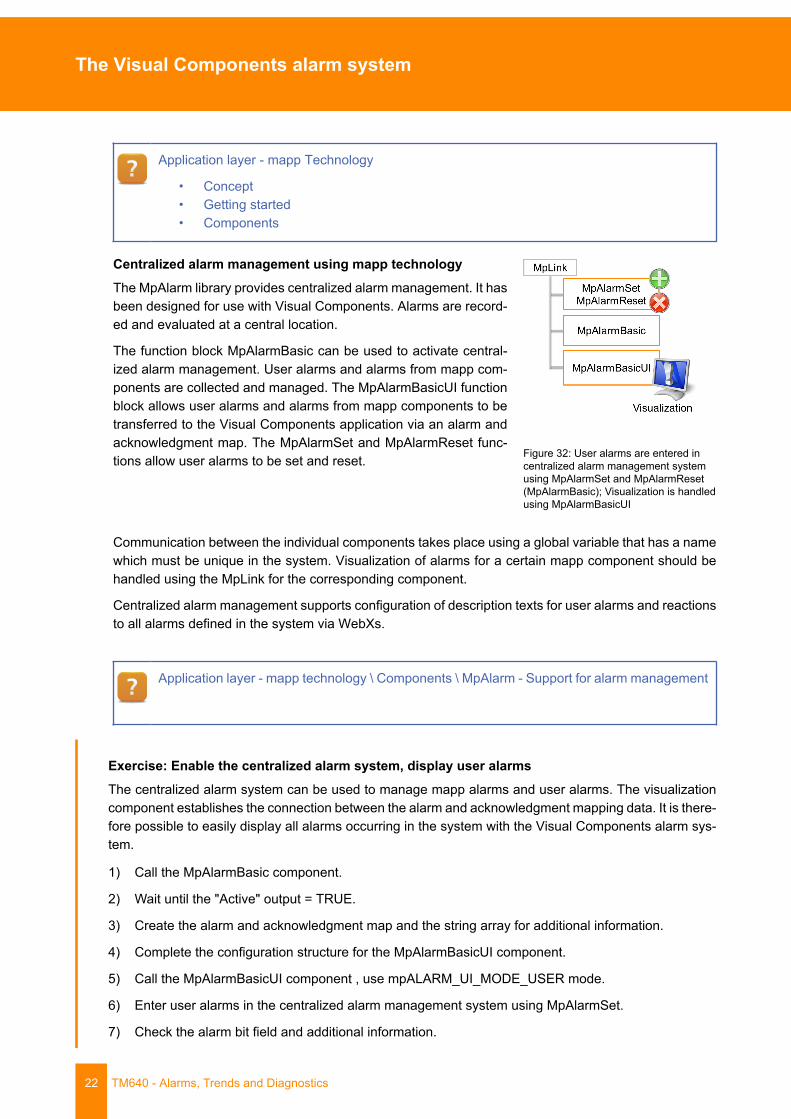
Centralized alarm management using mapp technologyThe MpAlarm library provides centralized alarm management. It hasbeen designed for use with Visual Components. Alarms are record-ed and evaluated at a central location.
The function block MpAlarmBasic can be used to activate central-ized alarm management. User alarms and alarms from mapp com-ponents are collected and managed. The MpAlarmBasicUI functionblock allows user alarms and alarms from mapp components to betransferred to the Visual Components application via an alarm andacknowledgment map. The MpAlarmSet and MpAlarmReset func-tions allow user alarms to be set and reset. Figure 32: User alarms are entered in
centralized alarm management systemusing MpAlarmSet and MpAlarmReset(MpAlarmBasic); Visualization is handledusing MpAlarmBasicUI
Communication between the individual components takes place using a global variable that has a namewhich must be unique in the system. Visualization of alarms for a certain mapp component should behandled using the MpLink for the corresponding component.
Centralized alarm management supports configuration of description texts for user alarms and reactionsto all alarms defined in the system via WebXs.
Application layer - mapp technology \ Components \ MpAlarm - Support for alarm management
Exercise: Enable the centralized alarm system, display user alarmsThe centralized alarm system can be used to manage mapp alarms and user alarms. The visualizationcomponent establishes the connection between the alarm and acknowledgment mapping data. It is there-fore possible to easily display all alarms occurring in the system with the Visual Components alarm sys-tem.
1) Call the MpAlarmBasic component.
2) Wait until the "Active" output = TRUE.
3) Create the alarm and acknowledgment map and the string array for additional information.
4) Complete the configuration structure for the MpAlarmBasicUI component.
5) Call the MpAlarmBasicUI component , use mpALARM_UI_MODE_USER mode.
6) Enter user alarms in the centralized alarm management system using MpAlarmSet.
7) Check the alarm bit field and additional information.
The Visual Components alarm system
TM640 - Alarms, Trends and Diagnostics 23
The alarm and acknowledgment mappings can now be connected with a new alarm group in the VisualComponents HMI application. The additional information texts can be added to the alarm texts using textsnippets, for example.
When calling the MpAlarmBasicUI component, a warning with ID mpALARM_WRN_I-MAGE_SIZE occurs if the alarm and acknowledgment mappings are too small.
Exercise: Display mapp component alarmsIn addition to the status information on the function block output, many mapp components also returnalarms directly. These alarms can be loaded using the visualization component for the centralized alarmsystem. In this case, it is necessary for the centralized alarm system to have already been selected.Alarms from a specific mapp component are accessed using the MpLink for the component. An attemptshould be made to display the recipe component alarms. An alarm is triggered when trying to load arecipe file that does not exist, for example.
1) Declare the alarm and acknowledgment bit field as well as the string array for additional informa-tion.
2) Complete the configuration structure for the MpAlarmBasicUI component.
3) Enable the MpAlarmBasicUI component, configure mpALARM_BASIC_UI_MODE_MAPP mode.
4) Try to load a recipe file that does not exist.
5) Check the status ID of the MpRecipeXml component.
6) Check the alarm bit field and additional information.
The Visual Components trend system
24 TM640 - Alarms, Trends and Diagnostics
3 The Visual Components trend system
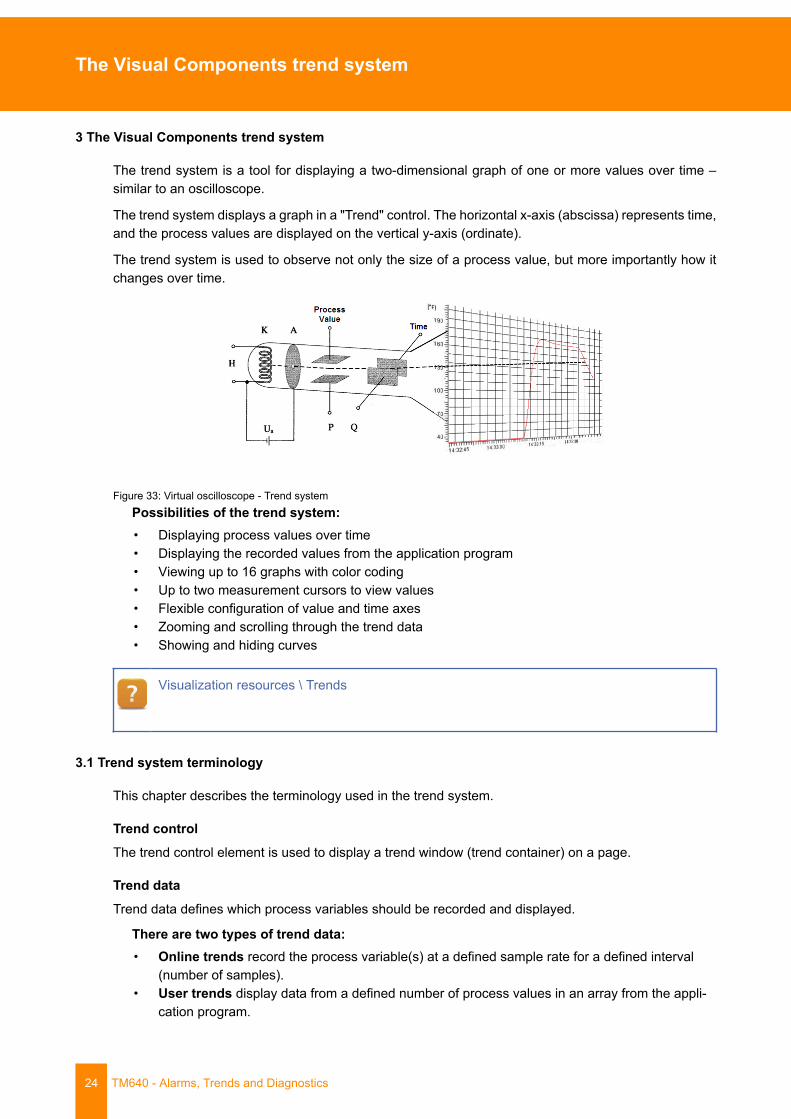
The trend system is a tool for displaying a two-dimensional graph of one or more values over time –similar to an oscilloscope.
The trend system displays a graph in a "Trend" control. The horizontal x-axis (abscissa) represents time,and the process values are displayed on the vertical y-axis (ordinate).
The trend system is used to observe not only the size of a process value, but more importantly how itchanges over time.
Figure 33: Virtual oscilloscope - Trend systemPossibilities of the trend system:• Displaying process values over time• Displaying the recorded values from the application program• Viewing up to 16 graphs with color coding• Up to two measurement cursors to view values• Flexible configuration of value and time axes• Zooming and scrolling through the trend data• Showing and hiding curves
Visualization resources \ Trends
3.1 Trend system terminology
This chapter describes the terminology used in the trend system.
Trend controlThe trend control element is used to display a trend window (trend container) on a page.
Trend dataTrend data defines which process variables should be recorded and displayed.
There are two types of trend data:• Online trends record the process variable(s) at a defined sample rate for a defined interval
(number of samples).• User trends display data from a defined number of process values in an array from the appli-
cation program.
The Visual Components trend system
TM640 - Alarms, Trends and Diagnostics 25
Trend curvesTrend curves show the trend data in the trend container.
Trend scalingTrend scaling is used to label and subdivide the time and value axes in the trend container.
Trend containerTrend containers define the appearance of the trend control and include one or more trend curves, thegrid in which the curves are displayed and the appearance of the value and time axes.
• Up to 16 curves• One time axis with variable scaling and labeling• Several value axes with different scaling and labeling functions
The trend system is composed of various controls and configurations that can be created usingthe Trend Wizard.
The Visual Components trend system
26 TM640 - Alarms, Trends and Diagnostics
3.2 Task definition
The exercise in this training module is based on the visualization application created in TM610.
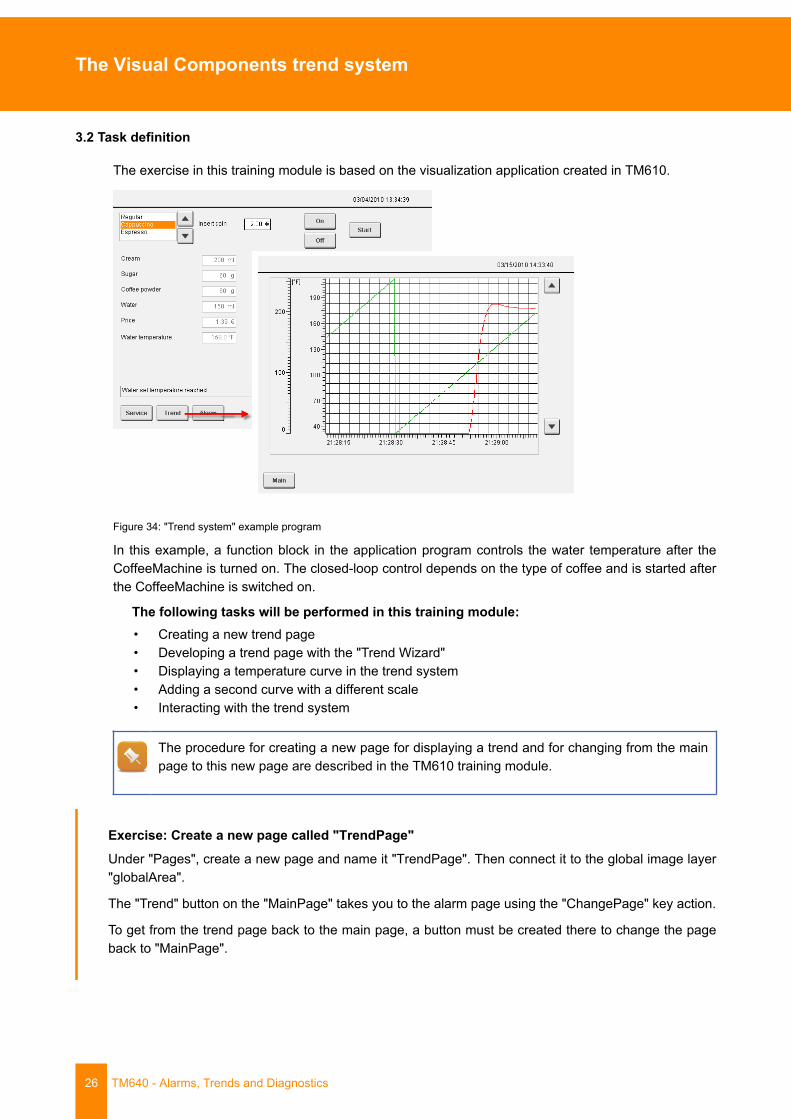
Figure 34: "Trend system" example program
In this example, a function block in the application program controls the water temperature after theCoffeeMachine is turned on. The closed-loop control depends on the type of coffee and is started afterthe CoffeeMachine is switched on.
The following tasks will be performed in this training module:• Creating a new trend page• Developing a trend page with the "Trend Wizard"• Displaying a temperature curve in the trend system• Adding a second curve with a different scale• Interacting with the trend system
The procedure for creating a new page for displaying a trend and for changing from the mainpage to this new page are described in the TM610 training module.
Exercise: Create a new page called "TrendPage"Under "Pages", create a new page and name it "TrendPage". Then connect it to the global image layer"globalArea".
The "Trend" button on the "MainPage" takes you to the alarm page using the "ChangePage" key action.
To get from the trend page back to the main page, a button must be created there to change the pageback to "MainPage".
The Visual Components trend system
TM640 - Alarms, Trends and Diagnostics 27
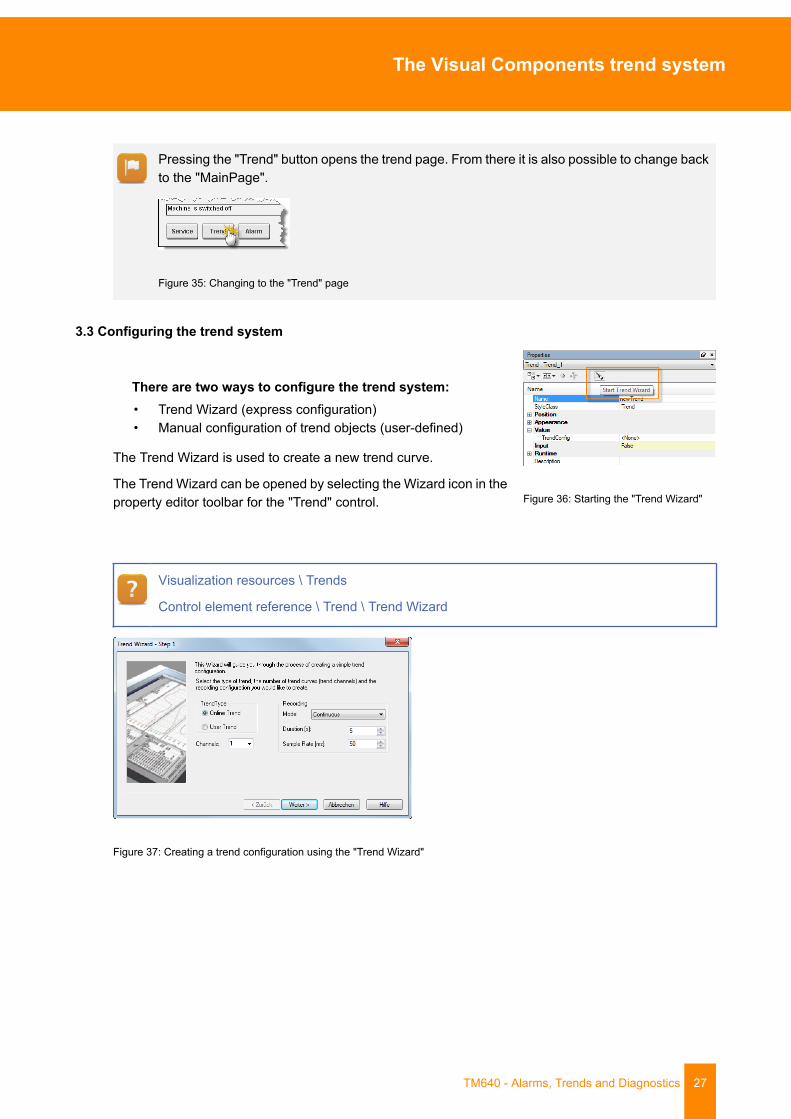
Pressing the "Trend" button opens the trend page. From there it is also possible to change backto the "MainPage".
Figure 35: Changing to the "Trend" page
3.3 Configuring the trend system
There are two ways to configure the trend system:• Trend Wizard (express configuration)• Manual configuration of trend objects (user-defined)
The Trend Wizard is used to create a new trend curve.
The Trend Wizard can be opened by selecting the Wizard icon in theproperty editor toolbar for the "Trend" control. Figure 36: Starting the "Trend Wizard"
Visualization resources \ Trends
Control element reference \ Trend \ Trend Wizard
Figure 37: Creating a trend configuration using the "Trend Wizard"
The Visual Components trend system
28 TM640 - Alarms, Trends and Diagnostics
3.4 Displaying an online trend
In this example, the change in water temperature over time after the CoffeeMachine is turned on isdisplayed in the trend control as an "online trend".
Exercise: Online trend configuration for displaying the water temperatureA trend configuration should be created to display the water temperature over time.
Insert a "Trend" control on the "TrendPage" as shown in the exercises.
Use the "Trend Wizard" to configure an online trend that records the process variable "gHeating.sta-tus.actTemp" for one minute with a sample rate of 100 milliseconds.
Trend Wizard Page1:
Trend Type: Online trend
Channels: 1
Mode: Continuous
Duration [s]: 60
Sampling rate [ms] 100
Trend Wizard Page 2:
Value data point: gHeating.status.actTemp
Foreground color: Red
MinValue: 0
MaxValue: 100
Trend Wizard Page 3:
No changes necessaryTable 3: Configuration in the pages of the Trend Wizard
1) Insert a "Trend" control on the "TrendPage".
2) Start the Trend Wizard from the properties editor.
3) Make the configurations on the three pages of the Trend Wizard.
The Visual Components trend system
TM640 - Alarms, Trends and Diagnostics 29
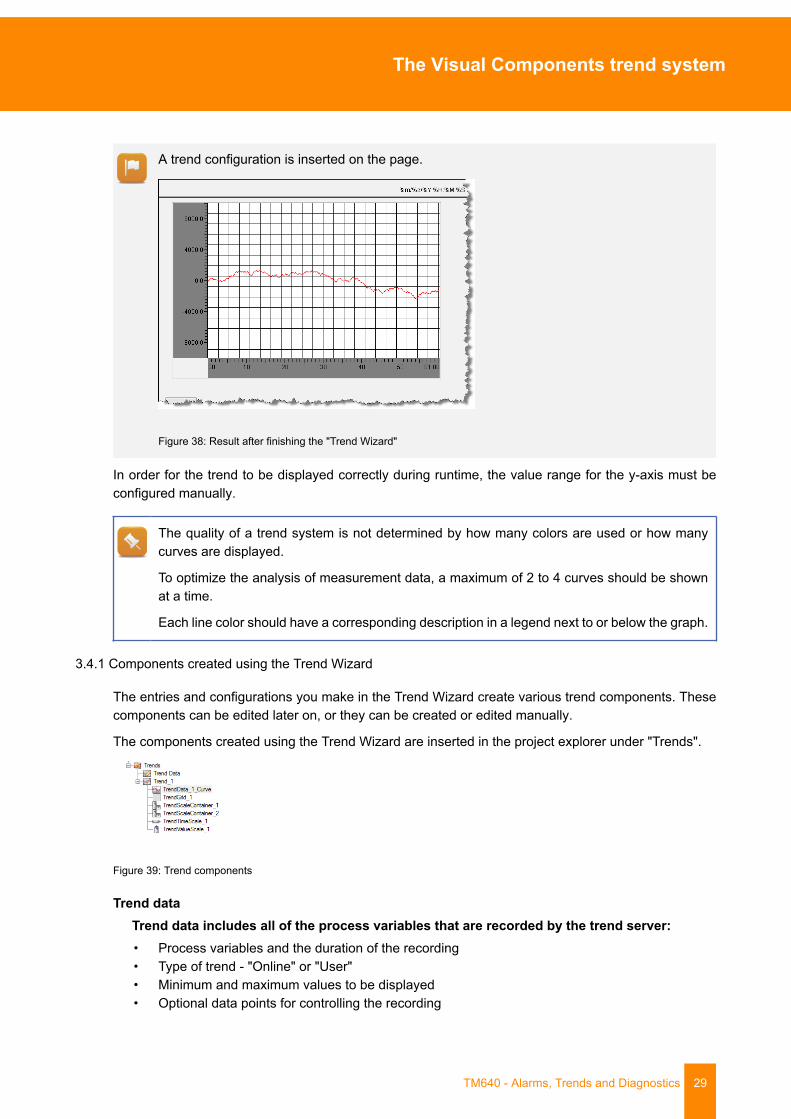
A trend configuration is inserted on the page.
Figure 38: Result after finishing the "Trend Wizard"
In order for the trend to be displayed correctly during runtime, the value range for the y-axis must beconfigured manually.
The quality of a trend system is not determined by how many colors are used or how manycurves are displayed.
To optimize the analysis of measurement data, a maximum of 2 to 4 curves should be shownat a time.
Each line color should have a corresponding description in a legend next to or below the graph.
3.4.1 Components created using the Trend Wizard
The entries and configurations you make in the Trend Wizard create various trend components. Thesecomponents can be edited later on, or they can be created or edited manually.
The components created using the Trend Wizard are inserted in the project explorer under "Trends".
Figure 39: Trend components
Trend dataTrend data includes all of the process variables that are recorded by the trend server:• Process variables and the duration of the recording• Type of trend - "Online" or "User"• Minimum and maximum values to be displayed• Optional data points for controlling the recording
The Visual Components trend system
30 TM640 - Alarms, Trends and Diagnostics
One or more entries from this trend data are connected to a curve in the trend container.
newTrendTrend_1 contains all of the objects for displaying a trend curve (trend container)• Curve(s) connected to a trend data value• Scaling of the x and y axes• Trend container grid
The trend container is connected to the trend control to display the curves and scaled values it contains.
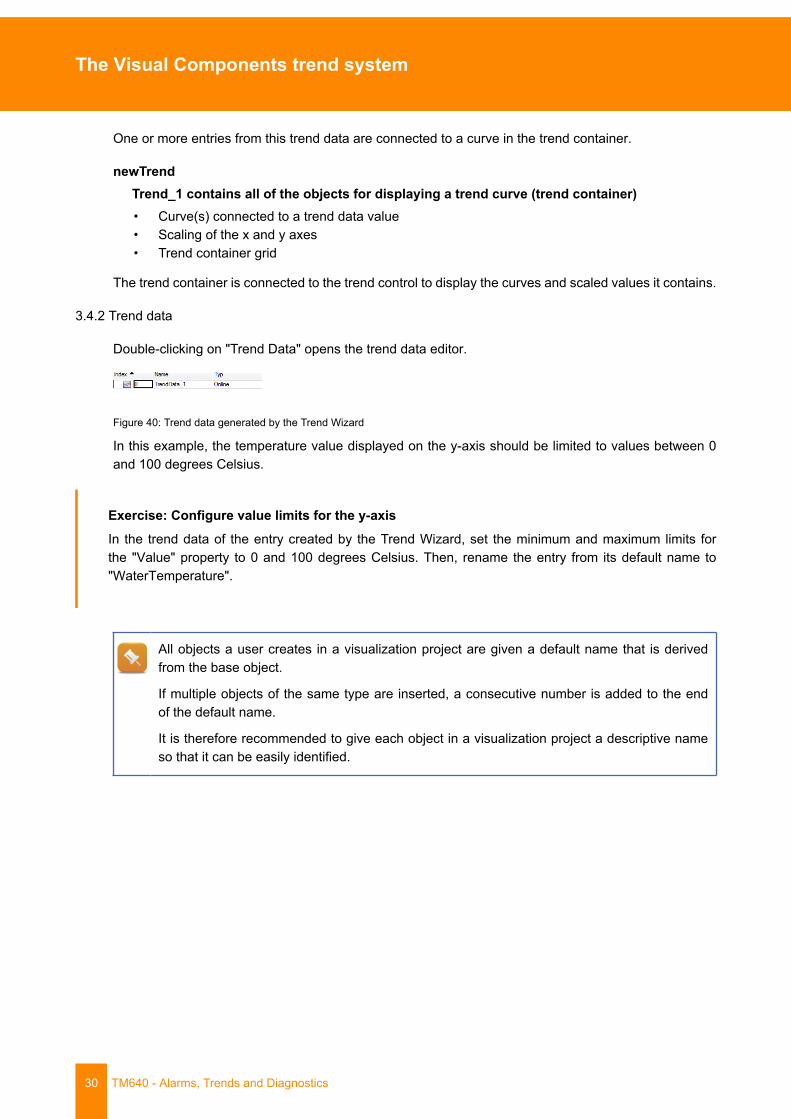
3.4.2 Trend data
Double-clicking on "Trend Data" opens the trend data editor.
Figure 40: Trend data generated by the Trend Wizard
In this example, the temperature value displayed on the y-axis should be limited to values between 0and 100 degrees Celsius.
Exercise: Configure value limits for the y-axisIn the trend data of the entry created by the Trend Wizard, set the minimum and maximum limits forthe "Value" property to 0 and 100 degrees Celsius. Then, rename the entry from its default name to"WaterTemperature".
All objects a user creates in a visualization project are given a default name that is derivedfrom the base object.
If multiple objects of the same type are inserted, a consecutive number is added to the endof the default name.
It is therefore recommended to give each object in a visualization project a descriptive nameso that it can be easily identified.
The Visual Components trend system
TM640 - Alarms, Trends and Diagnostics 31
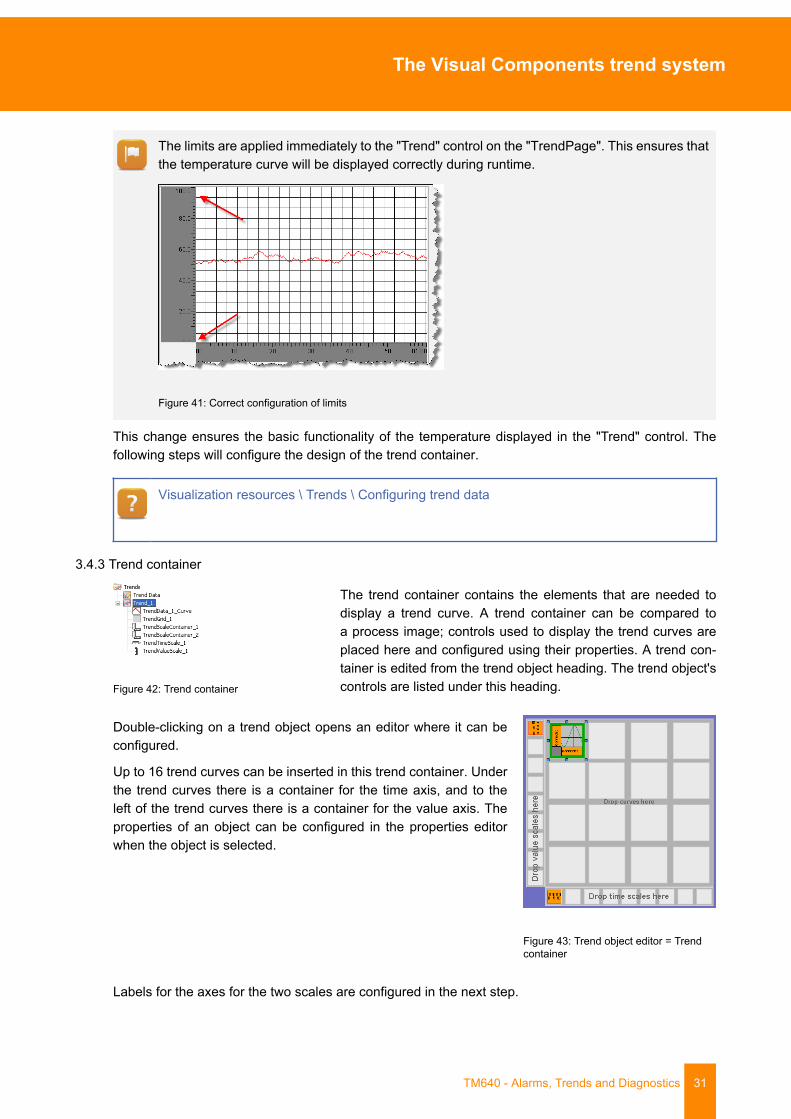
The limits are applied immediately to the "Trend" control on the "TrendPage". This ensures thatthe temperature curve will be displayed correctly during runtime.
Figure 41: Correct configuration of limits
This change ensures the basic functionality of the temperature displayed in the "Trend" control. Thefollowing steps will configure the design of the trend container.
Visualization resources \ Trends \ Configuring trend data
3.4.3 Trend container
Figure 42: Trend container
The trend container contains the elements that are needed todisplay a trend curve. A trend container can be compared toa process image; controls used to display the trend curves areplaced here and configured using their properties. A trend con-tainer is edited from the trend object heading. The trend object'scontrols are listed under this heading.
Double-clicking on a trend object opens an editor where it can beconfigured.
Up to 16 trend curves can be inserted in this trend container. Underthe trend curves there is a container for the time axis, and to theleft of the trend curves there is a container for the value axis. Theproperties of an object can be configured in the properties editorwhen the object is selected.
Figure 43: Trend object editor = Trendcontainer
Labels for the axes for the two scales are configured in the next step.
The Visual Components trend system
32 TM640 - Alarms, Trends and Diagnostics
Exercise: Adjust the background color for the x and y axisThe default background color for the label axes is dark gray. To make the axes match the backgroundcolor of the process image, select a light gray with color index 252.
Make this change for the "TrendValueScale" and "TrendTimeScale" axes.
1) Open the trend container by double clicking on the trend object.
2) Select the "TrendValueScale" and "TrendTimeScale" objects.
3) Change the Backcolor property in the appearance properties.
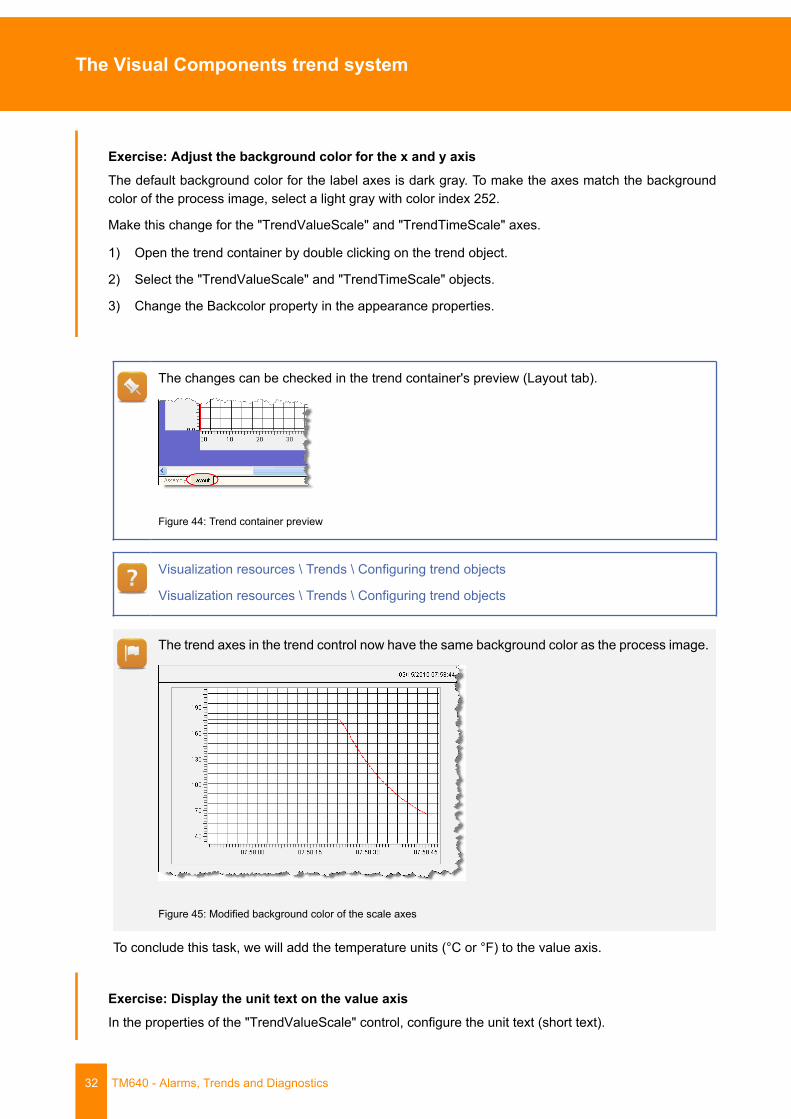
The changes can be checked in the trend container's preview (Layout tab).
Figure 44: Trend container preview
Visualization resources \ Trends \ Configuring trend objects
Visualization resources \ Trends \ Configuring trend objects
The trend axes in the trend control now have the same background color as the process image.
Figure 45: Modified background color of the scale axes
To conclude this task, we will add the temperature units (°C or °F) to the value axis.
Exercise: Display the unit text on the value axisIn the properties of the "TrendValueScale" control, configure the unit text (short text).
The Visual Components trend system
TM640 - Alarms, Trends and Diagnostics 33
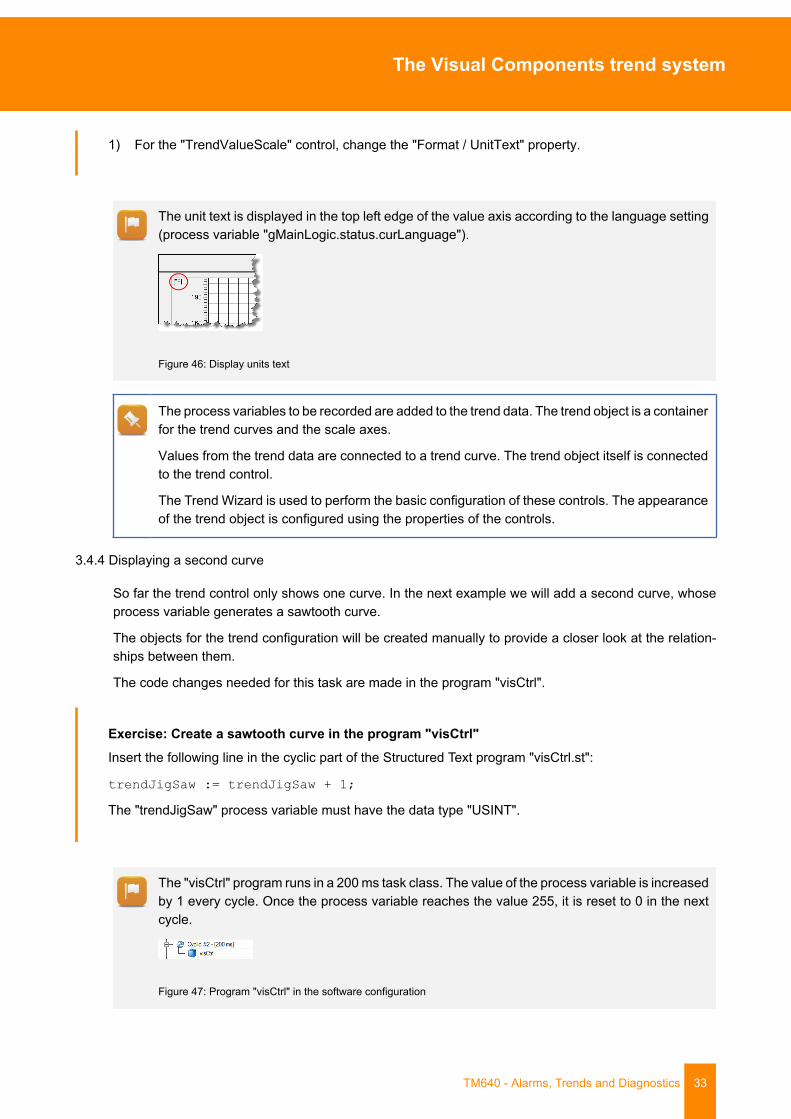
1) For the "TrendValueScale" control, change the "Format / UnitText" property.
The unit text is displayed in the top left edge of the value axis according to the language setting(process variable "gMainLogic.status.curLanguage").
Figure 46: Display units text
The process variables to be recorded are added to the trend data. The trend object is a containerfor the trend curves and the scale axes.
Values from the trend data are connected to a trend curve. The trend object itself is connectedto the trend control.
The Trend Wizard is used to perform the basic configuration of these controls. The appearanceof the trend object is configured using the properties of the controls.
3.4.4 Displaying a second curve
So far the trend control only shows one curve. In the next example we will add a second curve, whoseprocess variable generates a sawtooth curve.
The objects for the trend configuration will be created manually to provide a closer look at the relation-ships between them.
The code changes needed for this task are made in the program "visCtrl".
Exercise: Create a sawtooth curve in the program "visCtrl"Insert the following line in the cyclic part of the Structured Text program "visCtrl.st":
trendJigSaw := trendJigSaw + 1;
The "trendJigSaw" process variable must have the data type "USINT".
The "visCtrl" program runs in a 200 ms task class. The value of the process variable is increasedby 1 every cycle. Once the process variable reaches the value 255, it is reset to 0 in the nextcycle.
Figure 47: Program "visCtrl" in the software configuration
The Visual Components trend system
34 TM640 - Alarms, Trends and Diagnostics
If a program is edited while the Visual Components editor is open and a new process variableis inserted in the program, the data points under "Data Sources / Local" must be refreshed bypressing the <F5> key.
From this point on, the new process variable can then be used in the visualization application.
In order for the process variable to be recorded by the trend server, it must be added to the trend data(under "TrendData").
Exercise: Add the process variable to the trend dataUnder "Trend Data", insert a new object and name it "JigSaw".• The duration of the recording will be 60 seconds with a sample rate of 100 ms.• Insert the "trendJigSaw" process variable for the "Value" property.
1) Open the editor for "Trend Data".
2) Insert a new trend object with the name "JigSaw".
3) The type of the trend object must be "Online", which is recorded continuously (Continuous mode).
4) The duration of the recording is determined by the "SampleRate" and "SampleCount" settings.
5) Connect the process variable "trendJigSaw".
The new trend object must be connected to a trend curve in the trend container where the curve isdisplayed.
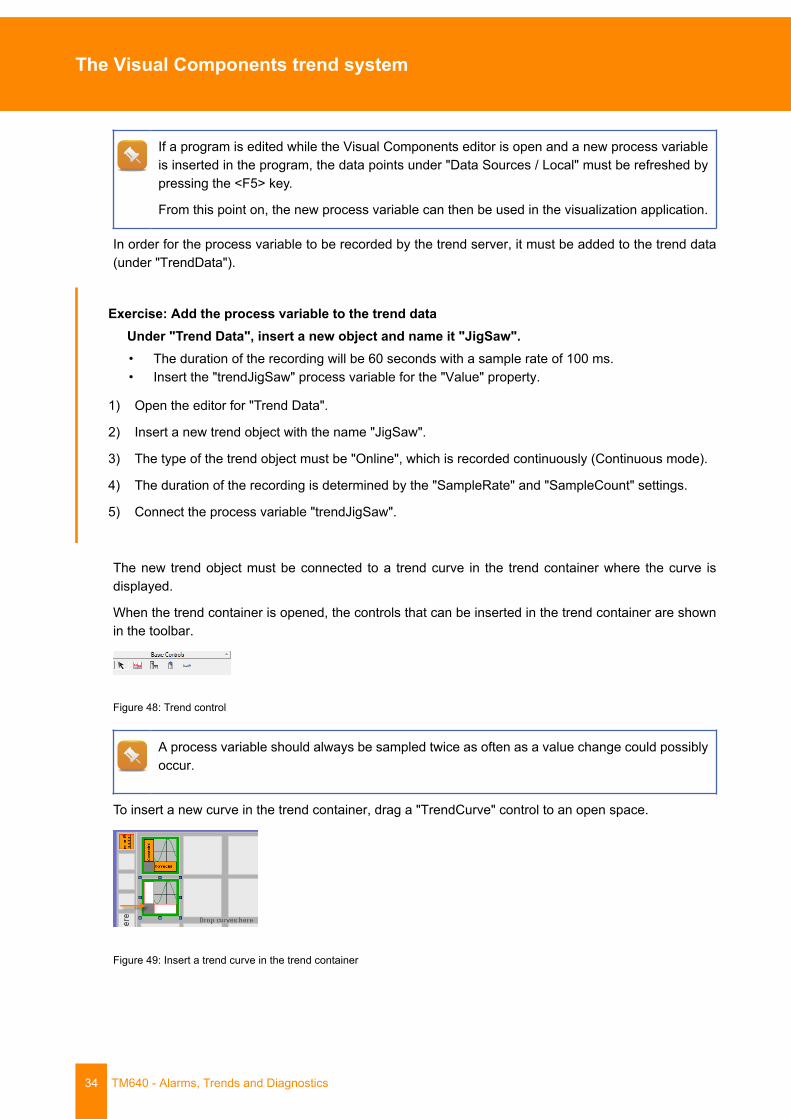
When the trend container is opened, the controls that can be inserted in the trend container are shownin the toolbar.
Figure 48: Trend control
A process variable should always be sampled twice as often as a value change could possiblyoccur.
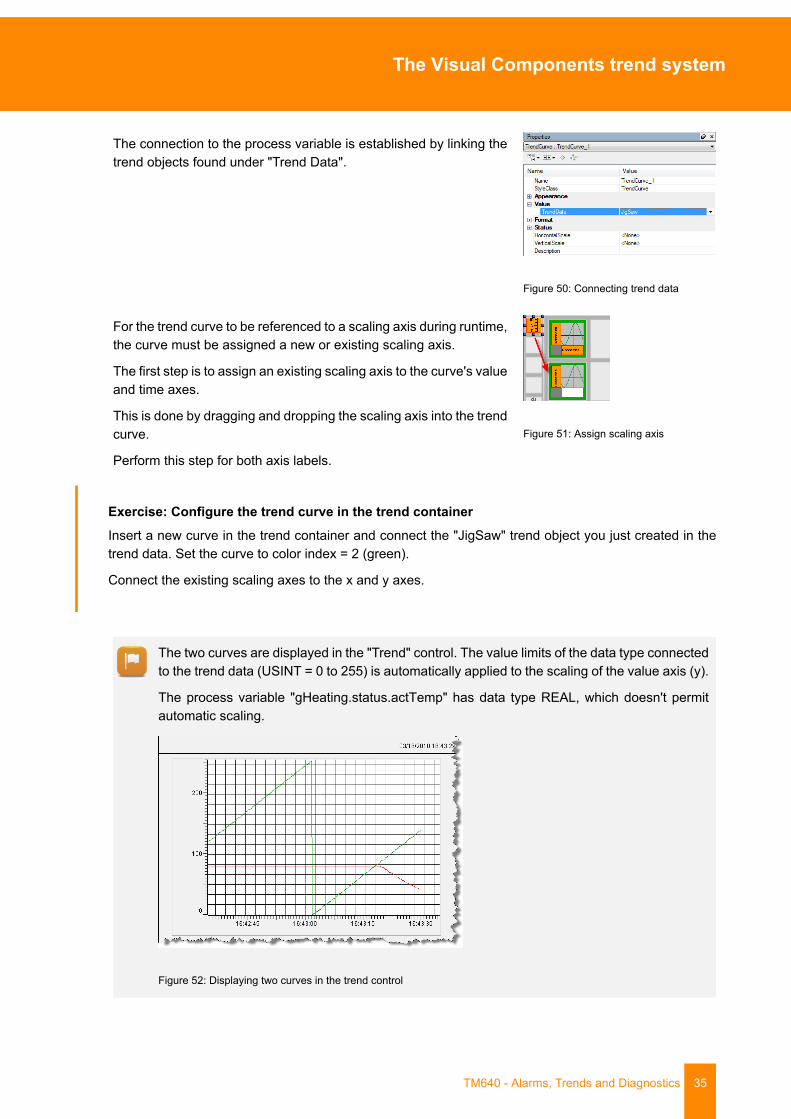
To insert a new curve in the trend container, drag a "TrendCurve" control to an open space.
Figure 49: Insert a trend curve in the trend container
The Visual Components trend system
TM640 - Alarms, Trends and Diagnostics 35
The connection to the process variable is established by linking thetrend objects found under "Trend Data".
Figure 50: Connecting trend data
For the trend curve to be referenced to a scaling axis during runtime,the curve must be assigned a new or existing scaling axis.
The first step is to assign an existing scaling axis to the curve's valueand time axes.
This is done by dragging and dropping the scaling axis into the trendcurve.
Perform this step for both axis labels.
Figure 51: Assign scaling axis
Exercise: Configure the trend curve in the trend containerInsert a new curve in the trend container and connect the "JigSaw" trend object you just created in thetrend data. Set the curve to color index = 2 (green).
Connect the existing scaling axes to the x and y axes.
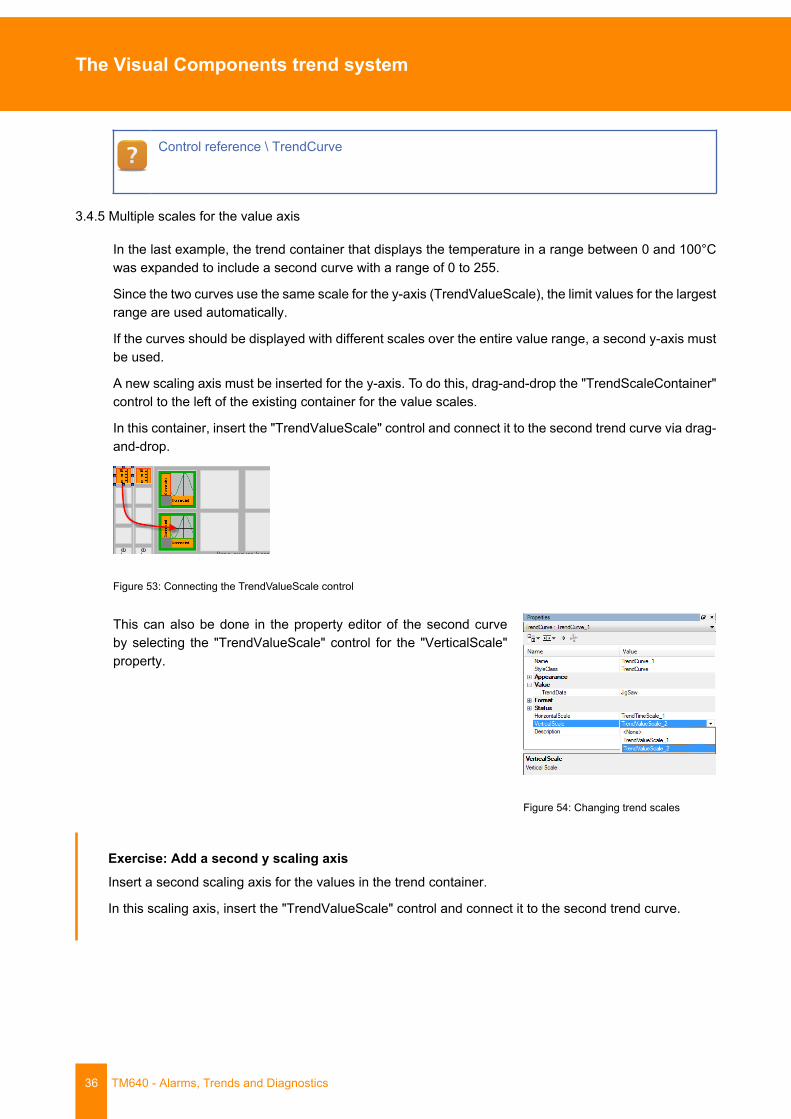
The two curves are displayed in the "Trend" control. The value limits of the data type connectedto the trend data (USINT = 0 to 255) is automatically applied to the scaling of the value axis (y).
The process variable "gHeating.status.actTemp" has data type REAL, which doesn't permitautomatic scaling.
Figure 52: Displaying two curves in the trend control
The Visual Components trend system
36 TM640 - Alarms, Trends and Diagnostics
Control reference \ TrendCurve
3.4.5 Multiple scales for the value axis
In the last example, the trend container that displays the temperature in a range between 0 and 100°Cwas expanded to include a second curve with a range of 0 to 255.
Since the two curves use the same scale for the y-axis (TrendValueScale), the limit values for the largestrange are used automatically.
If the curves should be displayed with different scales over the entire value range, a second y-axis mustbe used.
A new scaling axis must be inserted for the y-axis. To do this, drag-and-drop the "TrendScaleContainer"control to the left of the existing container for the value scales.
In this container, insert the "TrendValueScale" control and connect it to the second trend curve via drag-and-drop.
Figure 53: Connecting the TrendValueScale control
This can also be done in the property editor of the second curveby selecting the "TrendValueScale" control for the "VerticalScale"property.
Figure 54: Changing trend scales
Exercise: Add a second y scaling axisInsert a second scaling axis for the values in the trend container.
In this scaling axis, insert the "TrendValueScale" control and connect it to the second trend curve.
The Visual Components trend system
TM640 - Alarms, Trends and Diagnostics 37
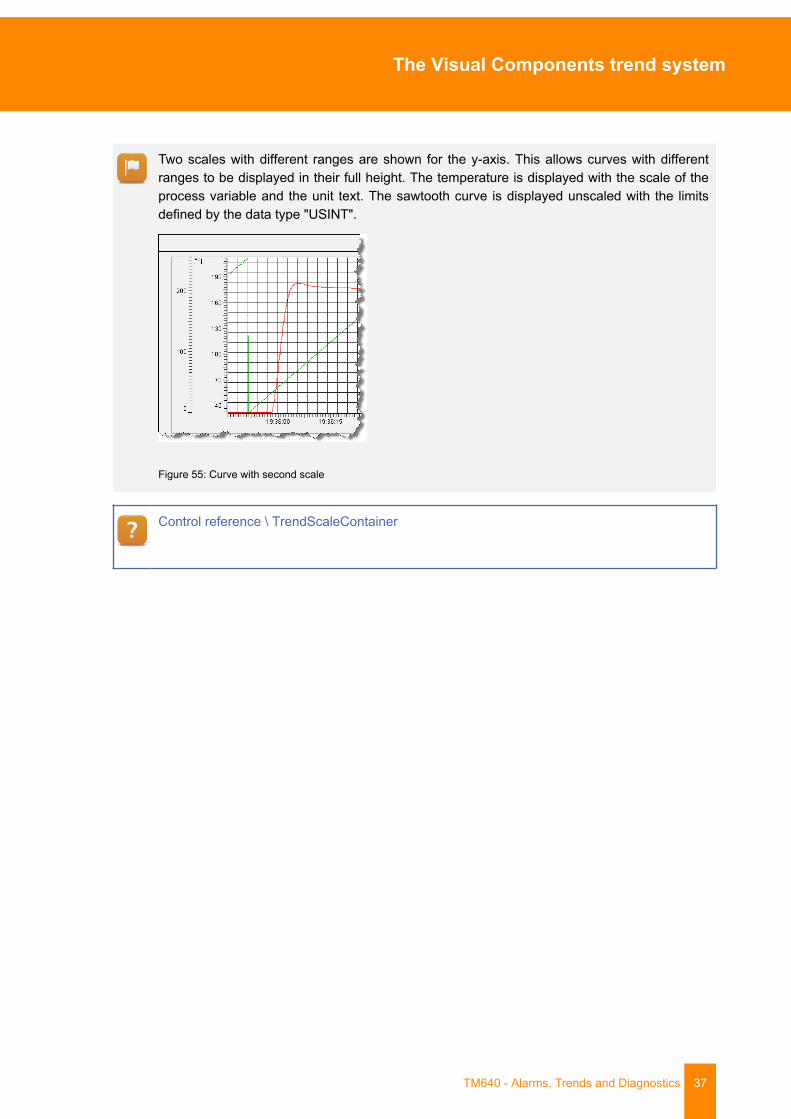
Two scales with different ranges are shown for the y-axis. This allows curves with differentranges to be displayed in their full height. The temperature is displayed with the scale of theprocess variable and the unit text. The sawtooth curve is displayed unscaled with the limitsdefined by the data type "USINT".
Figure 55: Curve with second scale
Control reference \ TrendScaleContainer
The Visual Components trend system
38 TM640 - Alarms, Trends and Diagnostics
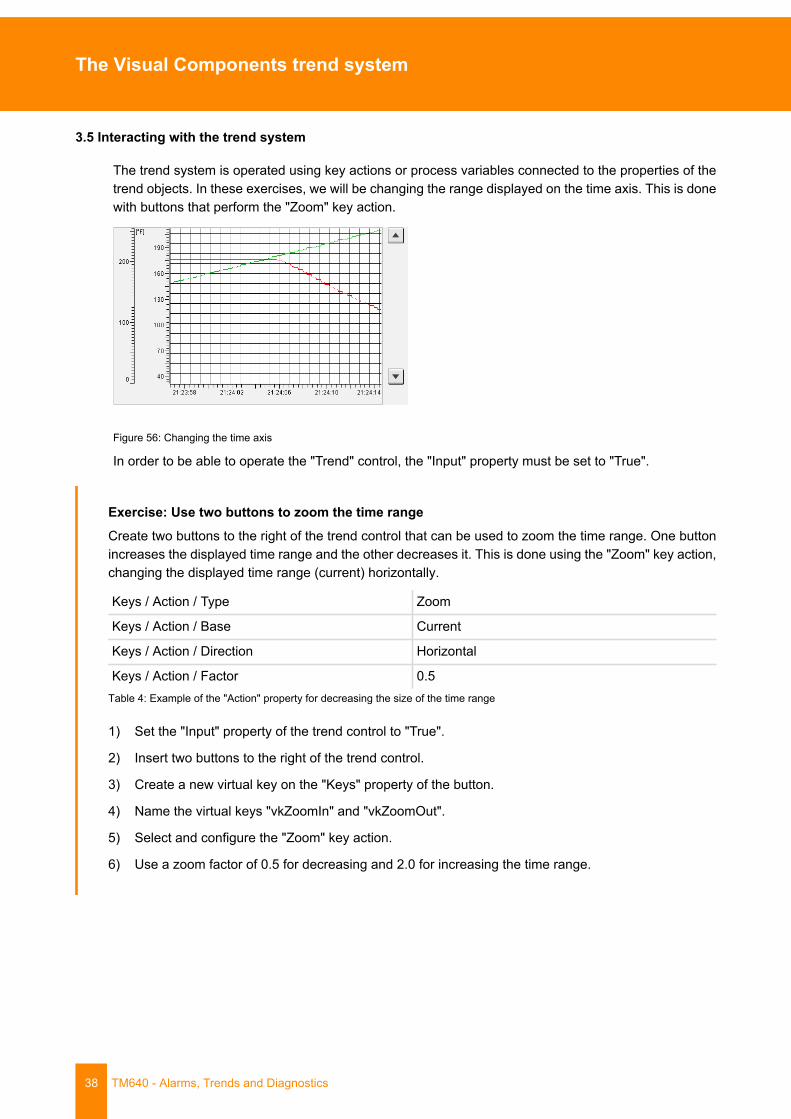
3.5 Interacting with the trend system
The trend system is operated using key actions or process variables connected to the properties of thetrend objects. In these exercises, we will be changing the range displayed on the time axis. This is donewith buttons that perform the "Zoom" key action.
Figure 56: Changing the time axis
In order to be able to operate the "Trend" control, the "Input" property must be set to "True".
Exercise: Use two buttons to zoom the time rangeCreate two buttons to the right of the trend control that can be used to zoom the time range. One buttonincreases the displayed time range and the other decreases it. This is done using the "Zoom" key action,changing the displayed time range (current) horizontally.
Keys / Action / Type Zoom
Keys / Action / Base Current
Keys / Action / Direction Horizontal
Keys / Action / Factor 0.5Table 4: Example of the "Action" property for decreasing the size of the time range
1) Set the "Input" property of the trend control to "True".
2) Insert two buttons to the right of the trend control.
3) Create a new virtual key on the "Keys" property of the button.
4) Name the virtual keys "vkZoomIn" and "vkZoomOut".
5) Select and configure the "Zoom" key action.
6) Use a zoom factor of 0.5 for decreasing and 2.0 for increasing the time range.
The Visual Components trend system
TM640 - Alarms, Trends and Diagnostics 39
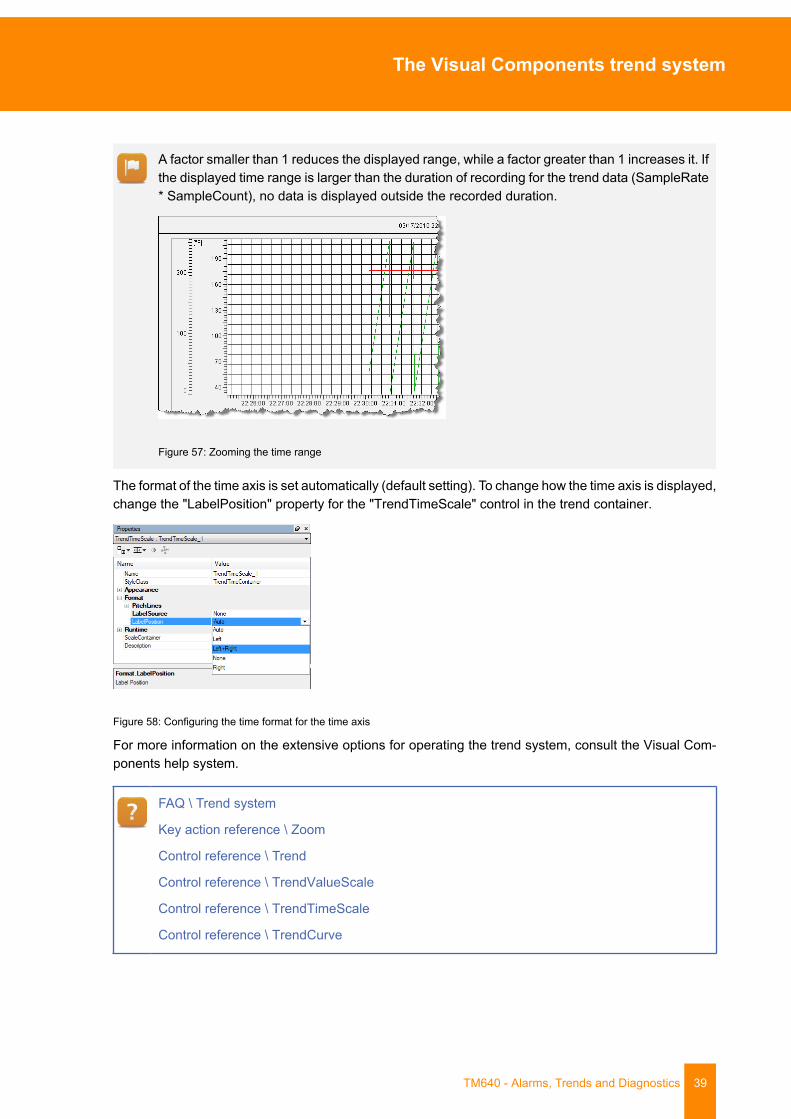
A factor smaller than 1 reduces the displayed range, while a factor greater than 1 increases it. Ifthe displayed time range is larger than the duration of recording for the trend data (SampleRate* SampleCount), no data is displayed outside the recorded duration.
Figure 57: Zooming the time range
The format of the time axis is set automatically (default setting). To change how the time axis is displayed,change the "LabelPosition" property for the "TrendTimeScale" control in the trend container.
Figure 58: Configuring the time format for the time axis
For more information on the extensive options for operating the trend system, consult the Visual Com-ponents help system.
FAQ \ Trend system
Key action reference \ Zoom
Control reference \ Trend
Control reference \ TrendValueScale
Control reference \ TrendTimeScale
Control reference \ TrendCurve
Diagnostics using the System Diagnostics Manager (SDM)
40 TM640 - Alarms, Trends and Diagnostics
4 Diagnostics using the System Diagnostics Manager (SDM)
Automation Runtime can diagnose the controller using the System Diagnostics Manager (SDM) inte-grated in the operating system.
SDM pages are HTML-based and can be easily displayed in Visual Components using the "HTMLView"control.
Full SDM functionality is automatically available on the Automation Runtime system without making anychanges to the visualization application.
The System Diagnostics Manager can be used in any Visual Components application that is based onan SG4 target system.
On the "PC-based Simulation Runtime" system, SDM pages can be accessed via Visual Com-ponents.
This training module will only show the procedure for configuring SDM in Visual Components.With Automation Studio, these tasks can be completed using an SG4 target system.
Diagnostics and service \ Diagnostics tools \ System Diagnostics Manager
Diagnostics using the System Diagnostics Manager (SDM)
TM640 - Alarms, Trends and Diagnostics 41
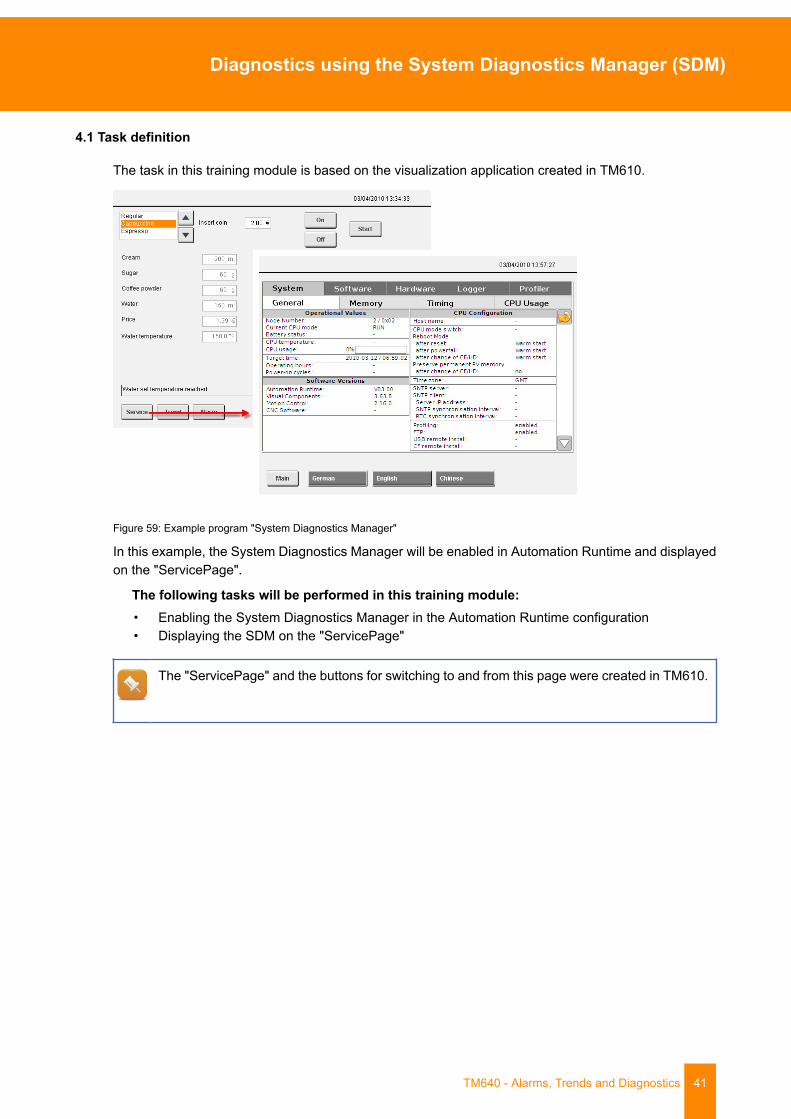
4.1 Task definition
The task in this training module is based on the visualization application created in TM610.
Figure 59: Example program "System Diagnostics Manager"
In this example, the System Diagnostics Manager will be enabled in Automation Runtime and displayedon the "ServicePage".
The following tasks will be performed in this training module:• Enabling the System Diagnostics Manager in the Automation Runtime configuration• Displaying the SDM on the "ServicePage"
The "ServicePage" and the buttons for switching to and from this page were created in TM610.
Diagnostics using the System Diagnostics Manager (SDM)
42 TM640 - Alarms, Trends and Diagnostics
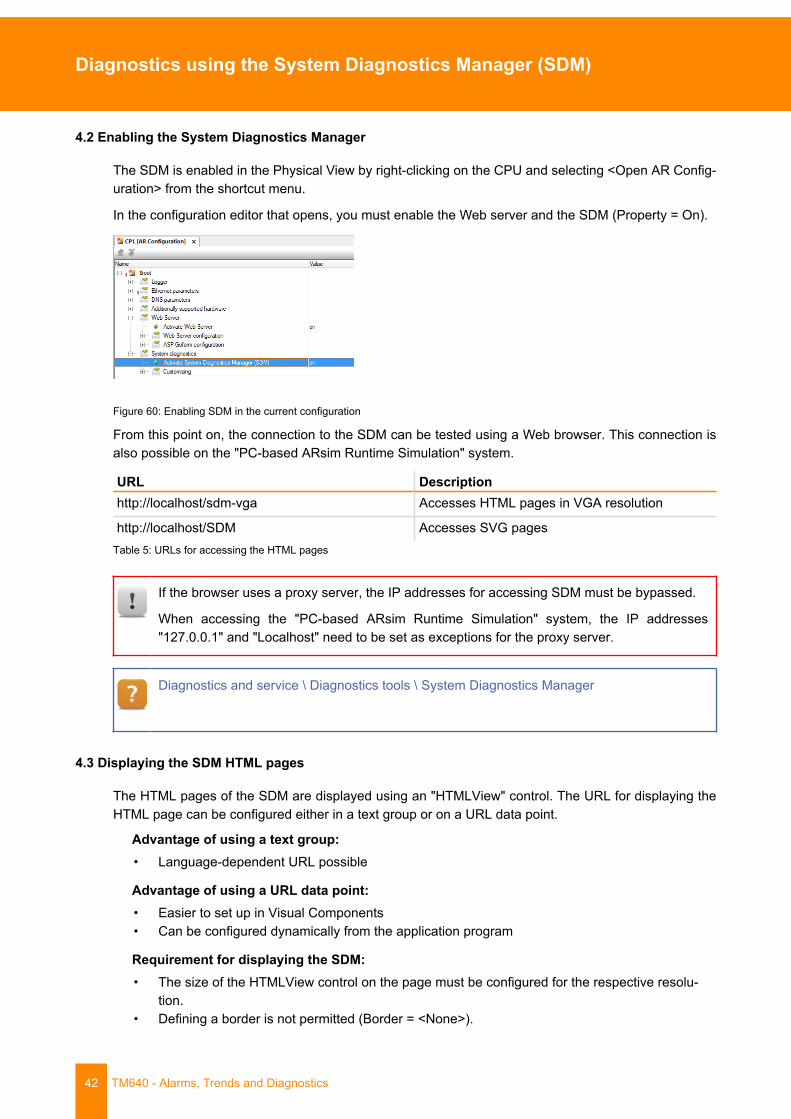
4.2 Enabling the System Diagnostics Manager
The SDM is enabled in the Physical View by right-clicking on the CPU and selecting <Open AR Config-uration> from the shortcut menu.
In the configuration editor that opens, you must enable the Web server and the SDM (Property = On).
Figure 60: Enabling SDM in the current configuration
From this point on, the connection to the SDM can be tested using a Web browser. This connection isalso possible on the "PC-based ARsim Runtime Simulation" system.
URL Descriptionhttp://localhost/sdm-vga Accesses HTML pages in VGA resolution
http://localhost/SDM Accesses SVG pagesTable 5: URLs for accessing the HTML pages
If the browser uses a proxy server, the IP addresses for accessing SDM must be bypassed.
When accessing the "PC-based ARsim Runtime Simulation" system, the IP addresses"127.0.0.1" and "Localhost" need to be set as exceptions for the proxy server.
Diagnostics and service \ Diagnostics tools \ System Diagnostics Manager
4.3 Displaying the SDM HTML pages
The HTML pages of the SDM are displayed using an "HTMLView" control. The URL for displaying theHTML page can be configured either in a text group or on a URL data point.
Advantage of using a text group:• Language-dependent URL possible
Advantage of using a URL data point:• Easier to set up in Visual Components• Can be configured dynamically from the application program
Requirement for displaying the SDM:• The size of the HTMLView control on the page must be configured for the respective resolu-
tion.• Defining a border is not permitted (Border = <None>).
Diagnostics using the System Diagnostics Manager (SDM)
TM640 - Alarms, Trends and Diagnostics 43
Panel size HTMLView size URLQVGA 316 x 191 http://IP-Adresse/sdm-qvga/qvga.cgi
VGA 620 x 339 http://IP-Adresse/sdm-vga/vga.cgi
XGA 1004 x 567 http://IP-Adresse/sdm-xga/xga.cgiTable 6: Supported display sizes
The text for the URL "http://IP-Adresse/sdm-vga/vga.cgi" should be defined in a text group for all availablelanguages.
Exercise: Enable the SDM and display the HTML pageYour task is to enable the SDM in the Automation Runtime configuration.
Enter the URL in a new text group named "URL_SDM" for the configured languages.
Insert an HTMLView control on the "ServicePage" with the correct size (620 x 339 pixels) and connectthe text group "URL_SDM" to the "Value" property.
1) Create a new text group and name it "URL_SDM".
2) Insert text with the URL.
3) Insert an HTMLView control on the "ServicePage" with the necessary size.
4) Connect the newly created text group to "Value / DefaultURLs" property.
It is important to ensure that Index 0 in the text group is reserved for specifying a file deviceif one exists.
If a file device is not being used, then Index 0 is ignored and the URL is entered at Index 1.
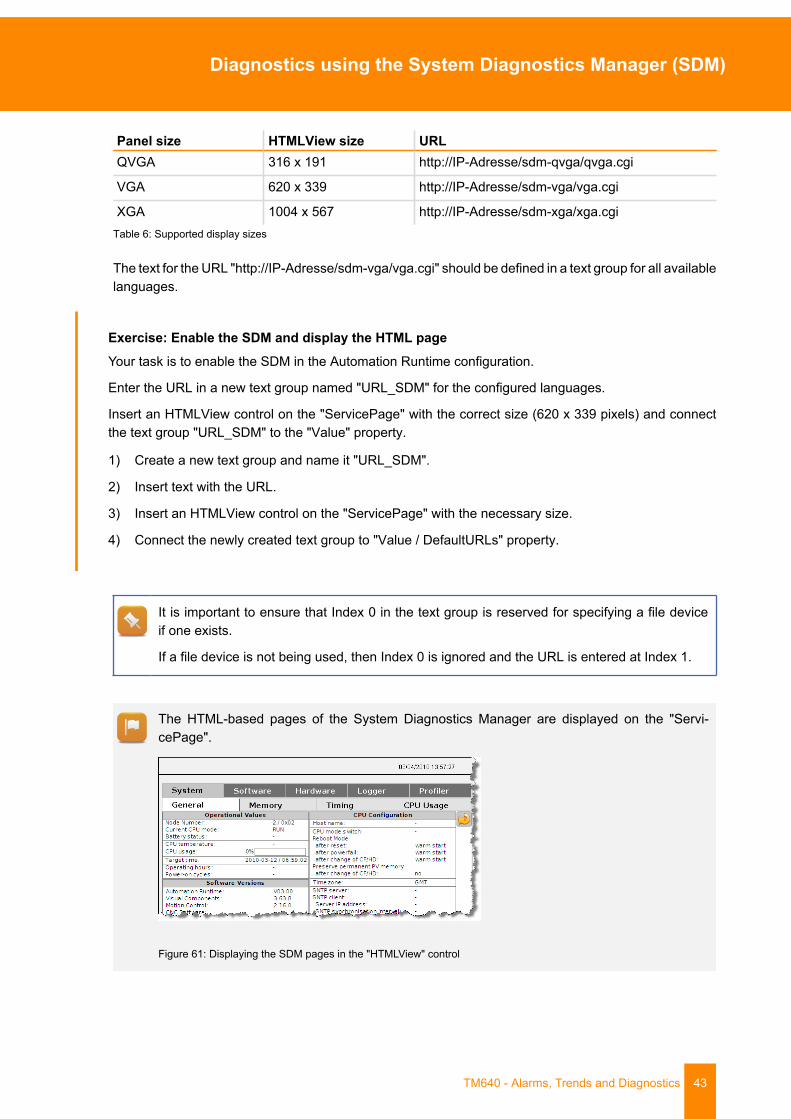
The HTML-based pages of the System Diagnostics Manager are displayed on the "Servi-cePage".
Figure 61: Displaying the SDM pages in the "HTMLView" control
Diagnostics using the System Diagnostics Manager (SDM)
44 TM640 - Alarms, Trends and Diagnostics
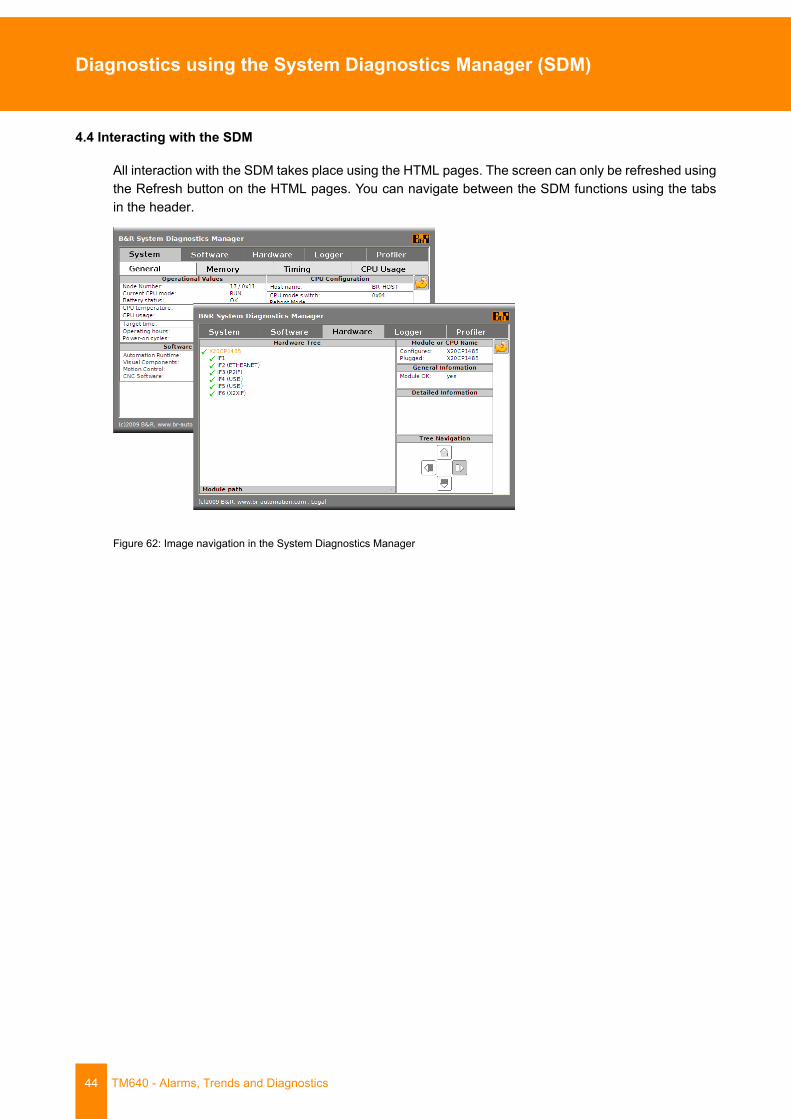
4.4 Interacting with the SDM
All interaction with the SDM takes place using the HTML pages. The screen can only be refreshed usingthe Refresh button on the HTML pages. You can navigate between the SDM functions using the tabsin the header.
Figure 62: Image navigation in the System Diagnostics Manager
Summary
TM640 - Alarms, Trends and Diagnostics 45
5 Summary
The alarm and trend systems record events in the process sequence and changes to process data overtime. This data is then displayed in Visual Components using corresponding controls.
Figure 63: Visual Components - Alarms, trends and diagnostics
With the freely configurable alarm properties and the various possibilities for display, the alarm systemis an important Visual Components function that can be used in all of your visualization applications.
The trend system also provides extensive options for displaying curves. Wizards assist the user in cre-ating a basic trend configuration.
The SDM integrated in Automation Runtime provides basic system diagnostic functions for every visu-alization application.
Seminars and Training Modules
46 TM640 - Alarms, Trends and Diagnostics
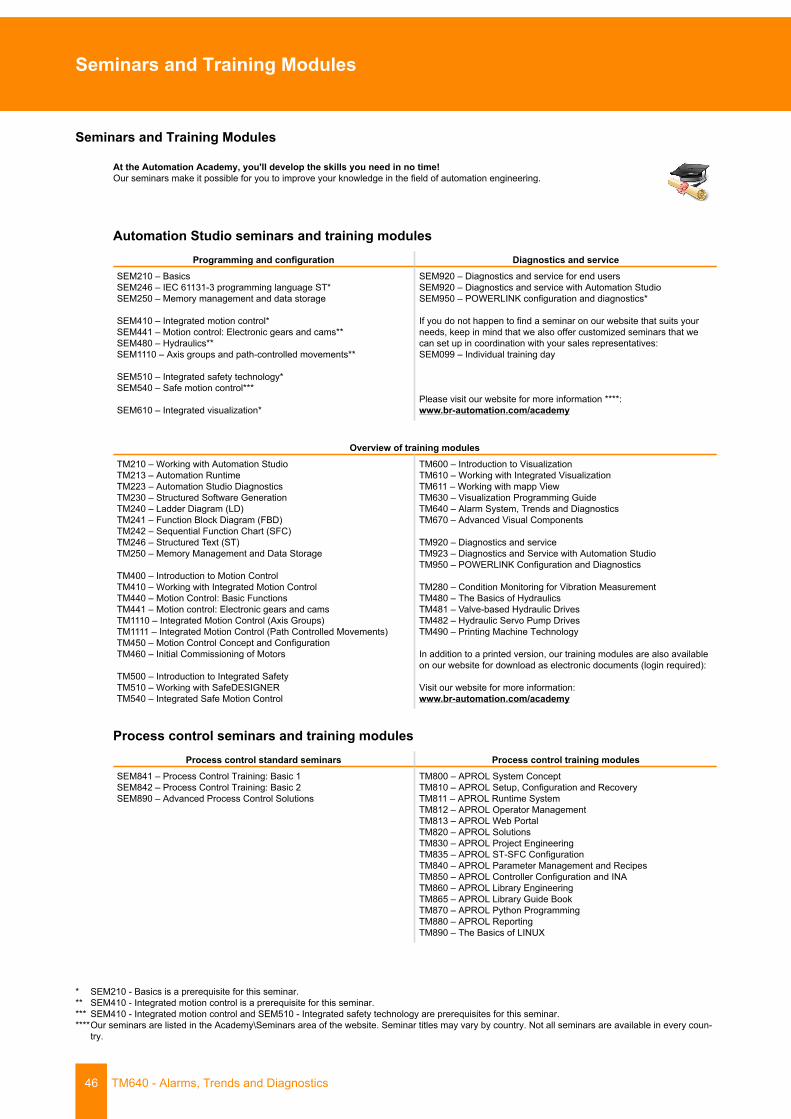
Seminars and Training Modules
At the Automation Academy, you'll develop the skills you need in no time!Our seminars make it possible for you to improve your knowledge in the field of automation engineering.
Automation Studio seminars and training modulesProgramming and configuration Diagnostics and service
SEM210 – BasicsSEM246 – IEC 61131-3 programming language ST*SEM250 – Memory management and data storage
SEM410 – Integrated motion control*SEM441 – Motion control: Electronic gears and cams**SEM480 – Hydraulics**SEM1110 – Axis groups and path-controlled movements**
SEM510 – Integrated safety technology*SEM540 – Safe motion control***
SEM610 – Integrated visualization*
SEM920 – Diagnostics and service for end usersSEM920 – Diagnostics and service with Automation StudioSEM950 – POWERLINK configuration and diagnostics*
If you do not happen to find a seminar on our website that suits yourneeds, keep in mind that we also offer customized seminars that wecan set up in coordination with your sales representatives:SEM099 – Individual training day
Please visit our website for more information ****:www.br-automation.com/academy
Overview of training modulesTM210 – Working with Automation StudioTM213 – Automation RuntimeTM223 – Automation Studio DiagnosticsTM230 – Structured Software GenerationTM240 – Ladder Diagram (LD)TM241 – Function Block Diagram (FBD)TM242 – Sequential Function Chart (SFC)TM246 – Structured Text (ST)TM250 – Memory Management and Data Storage
TM400 – Introduction to Motion ControlTM410 – Working with Integrated Motion ControlTM440 – Motion Control: Basic FunctionsTM441 – Motion control: Electronic gears and camsTM1110 – Integrated Motion Control (Axis Groups)TM1111 – Integrated Motion Control (Path Controlled Movements)TM450 – Motion Control Concept and ConfigurationTM460 – Initial Commissioning of Motors
TM500 – Introduction to Integrated SafetyTM510 – Working with SafeDESIGNERTM540 – Integrated Safe Motion Control
TM600 – Introduction to VisualizationTM610 – Working with Integrated VisualizationTM611 – Working with mapp ViewTM630 – Visualization Programming GuideTM640 – Alarm System, Trends and DiagnosticsTM670 – Advanced Visual Components
TM920 – Diagnostics and serviceTM923 – Diagnostics and Service with Automation StudioTM950 – POWERLINK Configuration and Diagnostics
TM280 – Condition Monitoring for Vibration MeasurementTM480 – The Basics of HydraulicsTM481 – Valve-based Hydraulic DrivesTM482 – Hydraulic Servo Pump DrivesTM490 – Printing Machine Technology
In addition to a printed version, our training modules are also availableon our website for download as electronic documents (login required):
Visit our website for more information:www.br-automation.com/academy
Process control seminars and training modulesProcess control standard seminars Process control training modules
SEM841 – Process Control Training: Basic 1SEM842 – Process Control Training: Basic 2SEM890 – Advanced Process Control Solutions
TM800 – APROL System ConceptTM810 – APROL Setup, Configuration and RecoveryTM811 – APROL Runtime SystemTM812 – APROL Operator ManagementTM813 – APROL Web PortalTM820 – APROL SolutionsTM830 – APROL Project EngineeringTM835 – APROL ST-SFC ConfigurationTM840 – APROL Parameter Management and RecipesTM850 – APROL Controller Configuration and INATM860 – APROL Library EngineeringTM865 – APROL Library Guide BookTM870 – APROL Python ProgrammingTM880 – APROL ReportingTM890 – The Basics of LINUX
* SEM210 - Basics is a prerequisite for this seminar.** SEM410 - Integrated motion control is a prerequisite for this seminar.*** SEM410 - Integrated motion control and SEM510 - Integrated safety technology are prerequisites for this seminar.****Our seminars are listed in the Academy\Seminars area of the website. Seminar titles may vary by country. Not all seminars are available in every coun-
try.
Seminars and Training Modules
TM640 - Alarms, Trends and Diagnostics 47

V1.2
.1.3
©20
16/0
9/22
by
B&R
. All
right
s re
serv
ed.
All r
egis
tere
d tra
dem
arks
are
the
prop
erty
of t
heir
resp
ectiv
e ow
ners
.W
e re
serv
e th
e rig
ht to
mak
e te
chni
cal c
hang
es.


![Car Alarms & Smoke Alarms [Monitorama]](https://img.pdfslide.net/doc/110x75/54b6cdf94a7959d84d8b45a5/car-alarms-smoke-alarms-monitorama.jpg)