Embed Size (px)
Citation preview

1
TMCD Working Paper: TMD-WP-70
The Impact of China-Africa Trade on the Productivity of
African Firms: Evidence from Ghana
Xiaolan Fu
University of Oxford
Jun Hou
University of Oxford
Pierre Mohnen
University of Maastricht
November 2015
ISSN 2045-5119

2
The Impact of China-Africa Trade on the Productivity of
African Firms: Evidence from Ghana
Xiaolan Fu - TMCD, ODID, University of Oxford
3 Mansfield Road, OX1 3TB, Oxford, UK. Email: [email protected]
Jun Hou - TMCD, ODID, University of Oxford
3 Mansfield Road, OX1 3TB, Oxford, UK. Email: [email protected]
Pierre Mohnen – UNU-MERIT, University of Maastricht
Tongersestraat 53, 6211 LM Maastricht, Netherlands. Email: [email protected]
Abstract: Using both firm-level and industrial-regional panel analysis, this study investigates
the impact of the Ghana-China trade engagement on the total factor productivity of Ghanaian
manufacturing firms and compares that to the impact induced by Ghana-OECD trade. The
main findings suggest that there have been evident learning effects emerging after the
Ghanaian manufacturing firms engaged in international trade activities. Yet, the strength of
such effects depends on the type of trading partners and industry characteristics. The
empirical results show that higher intensities of exports and imports with China, yield TFP
gains. The learning effects are found to be greater in industries in which the country has
comparative advantage than those further away from its comparative advantage.
Key words: Trade, productivity growth, China, Africa

3
1. Introduction
Against the sluggish recovery of the world economy in recent years, newly emerging
economies have been acknowledged as the major force pushing forward the world’s
economic development. In particular, the deepened Africa-China trade engagement has
attracted much attention. By the end of 2010, China concluded bilateral investment treaties
with 31 African countries (Ofodile, 2013). Two years afterward, China has become the
largest trade partner for Africa and, at the same time, Africa emerges as an important import
source and one of the major investment destinations for China. China’s rapidly growing
presence in Africa has also proliferated geographically, in particular to West African
countries. In 2012, the imports from China by West Africa reached USD 18.1 billion while
export to China was worth USD 4.3 billion (Agyekum et al., 2015). Accompanied with the
this trend, increasing studies (eg. Kaplinsky and Morris, 2009) started moving their focus on
the effect of South-South trade on knowledge spillovers and productivity gains. There are,
nevertheless, few studies on the firm-level impact of bilateral trade. Especially studies
comparing the impact of the trade links between Africa-South and Africa-North are scarce
(Elu et al., 2010; He, 2013).
The forging of closer trade links between China and Ghana has become a topic of debate
among researchers and policy analysts. In Ghana, imports of Chinese goods moved from 3.7
per cent share of total imports in 2000 to 18.16 per cent in 2012 (Ministry of Trade and
Industry, 2012). The total volume of imports from China increased more than ten–fold, from
USD 160.5 million to USD 2.2 billion (Ministry of Trade and Industry, 2012). In 2005, China
overtook the US as Ghana’s second largest trading partner after Nigeria. The bilateral trade
between the two countries reached USD 2.8 billion in 2012.
While it is evident that openness to trade has had significant impacts on the economic
development of Africa (Edward and Jenkins, 2013), not much has been written about the
extent to which Ghana is benefiting from this increased trade. Given the fact that productivity
is relatively low and input capital is relatively scarce in the Africa context, the current study
attempts to investigate whether China-Africa integration through trade is more beneficial than
OECD-African trade as regard to its impact on productivity improvement by recipient
economies. First, we explore whether the trade engagement has brought about some positive
impact on the productivity improvement of Ghanaian manufacturing firms by merging a firm-
level panel with industrial-level trade data. While there are some studies analysing the impact
of trade and on productivity in Africa based on sector level analyses (eg. Edwards and
Jenkins, 2013; He, 2013; Kaplinsky and Morris, 2009; Amighini and Sanfilippo, 2014), firm-
level study is scare in the Africa context. Sector-level analyses, nonetheless, have been
criticized for being too aggregated and for ignoring important specific impacts that can be
revealed with firm-level methodologies. With firm-level data, we are able to minimize the
possible bias and measurement errors with controlling for the firm heterogeneities. As far as
we aware, Elu et al. (2010) is one of the few empirical studies in this area based on firm level
data. However, they measure trade openness using an aggregate trade-GDP ratio at country
level, which failed to distinguish the effects of different trading partners and industry
characteristics. Second, we compare the trade between Ghana-China with Ghana-OECD to
understand whether trading with different countries at different levels of development exert
similar impacts on TFP performance. By differentiate trade partners, this paper contributes to
the extant literature by further investigating the productivity effects of trade based on the
technology gap theory and the theory of appropriate technology (Fransman, 1984). Third, we
also test whether the impact of trade on TFP is contingent on industry heterogeneity, in
particular, whether an industry is one that enjoys a country’s comparative advantage. While
4
the literature has distinguished the differences in technology transfer between high- and low-
technology industries, little has been done to examine whether firms in industries that a
country enjoys comparative advantage benefits more from greater trade (imports and exports)
openness of the country, and how this varies by trading with different partners. Firms in
industries with comparative advantage have greater productive efficiency due to and easier to
make a breakthrough in international markets because they are closer to the world productive
frontier than firms in other industries in general (Lin, 2013). Translating foreign knowledge
embedded products into local production would be more difficult especially in industries that
are far away from the country’s comparative advantage. For example knowledge diffusion in
high skilled labour-intensive industries would be difficult, since the technical requirements
are high and local firms possess low degree of technical competencies. Thus, industrial
context should also be considered when testing the impacts of trade on TFP.
The empirical analysis relies on a unique dataset that created by compiling firm level and
trade-based industry level datasets in Ghana. Therefore, the intensity of trade is measured not
using aggregate country level indicator, but instead using firm- and industrial-level trade
indicators. The empirical evidence suggest that the TFP of African firms benefits from the
trade activities but the effects are subject to conditions such as trading partners and industrial
context. Through forming trading relations with China, strong learning effects are uncovered
in regard to the productivity improvement. For instance, the findings show that the importing
of Chinese products has significantly enhanced the TFP of Ghanaian manufacturing firms.
Similarly, exporting to China also enlarges the production capacity and eventually benefits
the domestic manufacturing productivity. Regarding the industrial heterogeneity, the learning
effects are found to be greater in industries in which the country has comparative advantage
than those further away from its comparative advantage.
The rest of the paper is organised as follow. Section 2 reviews the literature on the South-
South trade and productivity growth. Sector 3 lays out the model specification. Data
description is given in section 4 and section 5 discusses the empirical results. The last section
concludes the findings.
2. Literature review
Trade flows increase the likelihood of learning and productivity growth (Grossman and
Helpman, 1991; Dollar, 1992; Fu, 2005; Schiff and Wang, 2006). A high level of openness
and integrating in the global production chain allow firms in developing and least developed
countries to better access the strategic asset (such as technology, skilled personnel and market
etc.) that would eventually lead to higher total factor productivity (TFP) and economic
development (Grossman and Helpman, 1991). On the one hand, when exporting to the global
market, firms are provided with more incentives to upgrade production capacity and improve
competitiveness. On the other hand, importing the advanced technology embedded goods
creates potential spillovers for the recipient firms. Moreover, internalisation also brings in
foreign assets to the developing countries which create another channel for spillovers (Narula
and Driffield, 2012). Through interaction with foreign companies, advanced technological or
efficient managerial practices are expected to be absorbed by local actors, whereas the
presence of foreign competitors also forces domestic firms to improve their productivity and
efficiency (Fu, 2012).
Specifically, trade liberalization can affect firm-level productivity through three main
channels. Firstly, trade openness allows the in-flow of imported products and exposes

5
domestic producers to foreign competition. The imported capital equipment may be directly
used for machinery upgrading and eventually contributes to the productivity improvement in
LDCs (Habiyaremye, 2013). Trade increases the availability of intermediate inputs which
lead to the change of productivity levels of local firms. A greater variety of intermediate
inputs allow domestic producers to choose cheaper, production compatible and technology
appropriate inputs that facilitate the improvement of efficiency and productivity (Feenstra et
al., 1999; Bernard et al., 2003; De Hoyos and Iacovone, 2012). Incorporating the
technologically advanced tangible intermediate inputs gained from exposure to exports into
local production process enables firms in developing countries to learn the embedded
intangible ideas (Keller, 2004). A group of studies has focused on the rising availability of
inputs that may encourage the creation of new domestic varieties in developing countries,
such as in the case of Indian (Goldberg et al., 2010) and Chinese (Feng et al., 2012) firms.
These authors argue that expanding the set of available inputs will directly influence the
productivity level through a quality upgrading effect due to the presence of more diversified
imported inputs (Bas and Strauss-Kahn, 2013). A recent study of firms in Ghana finds that
imports are reported to be the most important source of external knowledge for African firms
(Fu, et al., 2014).
Secondly, with the presence of foreign competition, domestic producers have to seek ways
(e.g. technological upgrading) to enhance productivity and cut down the average cost.
Increasing competitive pressures would reduce the gap between actual productivity and the
maximum productivity (Martin and Page, 1983). Various empirical studies have focused on
this channel and shown that the firm-level productivity is positively associated with the level
of exposure of the domestic market to foreign competitors. (Pavcnik, 2002; Fernandes, 2007).
Pavcnik (2002) investigated the productivity impact of trade liberalization using Chilean
plant-level panel data and found evidence of plant productivity improvements due to the
competition from abroad during the late 1970s and early 1980s. Using Colombian
manufacturing plant-level data, Fernandes (2007) also verifies that exposure to foreign
competition generates productivity gains. After controlling for observed and unobserved
plant characteristics and industry heterogeneity, the author found a strong negative impact of
nominal tariffs on plant productivity. In the model developed by Melitz and Ottaviano (2008),
firms’ productivity is allowed to respond to import competition with the presence of firm
heterogeneities and they show that the increased competition from foreign competitors
accelerates the exit of less productive firms and motivates the expansion of more productive
ones. Of course, most of these studies are carried out based on an assumption of a well-
developed market with effective market entry and exit mechanism. When such a well
developed market is not present and when some firms have soft budget constraint, exports
and foreign competition may not result in an aggregate productivity growth at the industry
level (Fu, 2005).
Yet, foreign competition is a two-edged sword. The economic development of LCDs may
also suffer from the intensified trade relation with the South. The economic booming of
China and other emerging economies (EEs) will intensify competition in global markets and
induce negative impacts on the manufacturing industries in Africa. Without adequate
resources and efforts to catch up with EEs, African countries may rather be pushed out from
both domestic and global market. Additionally, to sustain the rapid growth of EEs, there have
been increased demands for natural resources, and the nature of exporting raw materials does
not facilitate the diversification of industries in LDCs. A stream of literature suggests that the
imports of Chinese projects to African countries have trivial negative impacts on local
employment (Kaplinsky et al., 2007; Alvarez and Claro, 2008; Edwards & Jenkins, 2013) and
sector productivity (Stevens & Kennan, 2006; World Bank, 2004). Kaplinsky et al. (2007)

6
illustrate that a high percentage of locally produced goods in countries like Ghana, South
Africa and Ethiopia are experiencing a decline or are being forced to exit the market by
imports from China. Such displacement of local production by imported goods also resulted
in a significant loss of job. At the plant level, Alvarez and Claro (2008) find that increases in
China’s market share has negatively affected employment growth and the probability of
surviving of manufacturing plants. At firm level, Elu et al. (2010) estimate a panel of the
manufacturing firms of five sub-Saharan African countries between 1992 and 2004 and find
no direct association between total factor productivity enhancement and trade openness with
China. The relevance of this finding may be limited by the fact that the trade ratio is
constructed as percentage of the GDP at country level, instead of using trade indicators at the
sector or firm level.
Thirdly, learning-by-exporting (Arrow, 1962) is another channel to explain the firm
productivity improvement through the engagement of trade (Grossman and Helpman, 1991).
Apart from market exploration skills, exporting requires exporters to offer competitive
products that meet the quality standards set up by the importing countries. While exporting,
firms in developing countries are able to upgrade their technological capability and
production efficiencies through acquiring the feedbacks and technical assistances from
importers in advanced economies. Through the expansion to foreign market, firms may start
exploiting economies of scale and increase their productivity (Fu and Balasubramanyam,
2003; Fu, 2005; Alvarez and Claro, 2008; Amighini and Sanfilippo, 2014). Relying on
foreign markets can also help firms to better avoid shocks deriving from domestic demands.
In addition, the high degree of competition in the global market will increase the firms’
incentive to innovate and become more productive.
Although importing new products provides learning opportunities for importing countries, the
extent of knowledge that can be translated into local use would be a function the levels of
technology content a trading partner provide, and the technology gap between domestic and
frontier firms (Kokko, 1992; Amighini and Sanfilippo, 2014). Compared to the trade with
advanced economies, the South-South trade potentially brings much more positive effects to
the host economies given that the developing country firms are likely to provide the goods
and service that are more accessible to other developing countries (Lipsey and Sjoholm,
2011), providing at the same time more effective technological spillovers due to the smaller
‘technology gap’ (Gelb, 2005). When African countries follow this pattern in building their
knowledge capabilities, similar challenges would appear throughout the process. The
technologies produced in the South, such as from China, naturally become easier to adapt for
countries from the South (UNCTAD, 2012). In this regard, when the technology gap between
domestic and frontier firms is too wide, the knowledge embedded in imported goods may be
too advanced for local firms to unwrap and might contribute less to local economic growth
(Greenaway and Milner, 1990). Existing studies have already demonstrated that the South-
South trade has a greater economic potential than the South-North one, suggesting that it may
accommodate dynamic and longer-term benefits to developing countries (Amsden, 1986). He
(2013) uses the COMTRADE panel data to illustrate that the impacts of the imports from
China, in comparison with those from United States and France, on sub-Saharan African
manufactured exports are in general stronger and significantly positive across all sectors. The
author suggests that, when the absorptive capacity of the importing country is limited and a
sizeable substitution effect of importing intermediate goods on the importing country is
present, it is better to import from a Southern country with a superior technology than from a
Northern country with a very advanced technology. However, a closer technology gap
between trading partners may also means less learning potentials to offer. Therefore, the low
level of technological content embedded in the Chinese products may limit the extent of TFP

7
spillovers, especially to firms which aim to catch up and leapfrog the world technological
frontier. In such circumstances, a trade off has been emerged between China and OECD
counterparts: whether choosing sophisticate but difficult ones from OECD counties or
relatively easy but less technological potential ones from China.
Previous literature also emphasized that industry heterogeneity may shape the probability and
intensity of trade induced learning (Melitz, 2003; Bernard et al., 2007). In industries where a
country is likely to have comparative advantages, relatively more capital and production
resources are allocated. The learning effects from trade therefore are likely to be higher
especially when technological distance with trading partner is closer. In Ghana, industries
with comparative advantages also receive greater policy supports from the government for
instance food processing, textile and wood production etc. These industries are normally
characterized as low skilled labour-intensive and less knowledge components. Manufacturers
in these industries in general have already accumulated production experiences and possessed
some degree of technical competencies. Together with the fact that technical requirements in
these industries are relatively lower compare to for example high-tech industries, translating
the foreign knowledge embedded imports and intermediate inputs into local production
would be easier. Edward and Jenkis (2013) founds out that Firms in the labour-intensive
industries are more severely affected by the competition effects caused from Chinese imports
and may be more responsive to the increased competition through learning that raises
productivity. Regarding the exporting firms in these industries, they have built up certain
capability to compete with foreign producers and for better responding to external market
shocks. Therefore, the learning effect will be greater in industries in which the country has a
comparative advantage than those further away from its comparative advantage.
3. Model specifications
3.1 Firm level Productivity
The central question here is to investigate the productivity impact of trade activities.
Following the existing literature on trade and productivity, the productivity measure is
measured by the total factor productivity (TFP) at firm level. We rely on the approach
introduced by Olley and Pakes (1996), further developed Levinsohn and Petrin (2004) to
construct the TFP for firms in the sample. Such a method takes into account the potential
correlation between unobserved productivity shocks and input choice. Assuming that
production takes the form of a Cobb-Douglas production function,
𝑌𝑖𝑡 = 𝐴𝑖𝑡𝐶𝑎𝑝𝑖𝑡𝑎𝑙𝑖𝑡𝛽𝑘𝐿𝑎𝑏𝑜𝑢𝑟𝑖𝑡
𝛽𝑙𝑀𝑎𝑡𝑒𝑟𝑖𝑎𝑙𝑖𝑡𝛽𝑚 (1)
where Y represents the physical output of firm i in period t, Capital, Labour and Material are
the inputs of capital, labour and materials, respectively, and A is the Hicksian neutral
efficiency level of firm i in period t. Although the values of output and inputs are all observed
by economist, the total factor productivity term A remains unknown. Taking natural logs of
equation (1) gives a linear production function,
𝑦𝑖𝑡 − 𝛽𝑚𝑚𝑎𝑡𝑒𝑟𝑖𝑎𝑙𝑖𝑡 = 𝑣𝑎𝑙𝑢𝑒𝑎𝑑𝑑𝑖𝑡 = 𝑎0 + 𝛽𝑘𝑐𝑎𝑝𝑖𝑡𝑎𝑙𝑖𝑡 + 𝛽𝑙𝑙𝑎𝑏𝑜𝑢𝑟𝑖𝑡 + 𝑣𝑖𝑡 + 𝑒𝑖𝑡 (2)

8
where lower-case letters in equation (2) represent the values after natural logarithm
transformation. Material input is subtracted from the output and value added therefore
constructed. a0 measures the average TFP level across all firms i and time periods t. The
transmitted productivity comprises two components, vit and eit. eit is an i.i.d term that is
uncorrelated with input choices and represents productivity shocks that even the firm does
not observe, while vit reflect shocks that are known to the firm when it decides on the level of
the inputs and which therefore are correlated to the inputs. It is not observed and may lead to
the simultaneity bias in production function estimation. Estimators ignoring this correlation
between inputs and this unobservable factor, such as OLS, will yield inconsistent results.1
Olley and Pakes (1996) suggested to find a proxy variable that is monotonically related to vit
and that also depends on the quasi-fixed input capital and then to invert this relationship to
express vit as a function ∅𝑖𝑡 of capital and the proxy variable. They used investment as a
proxy. Given the fact that investment levels are not always non-zero, we shall follow
Levinsohn and Petrin (2004) and use materials as a proxy. Materials are thus a function of
capital, labor and 𝑣𝑖𝑡. Assuming the relationship between 𝑣𝑖𝑡 and materials to be monotonic,
we can invert the function and write 𝑣𝑖𝑡 as a function ∅𝑖𝑡 of labor, materials and capital.
Equation (1) can now be rewritten as:
𝑣𝑎𝑙𝑢𝑒𝑎𝑑𝑑𝑖𝑡 = 𝛽𝑙𝑙𝑎𝑏𝑜𝑢𝑟𝑖𝑡 + Φit (𝑐𝑎𝑝𝑖𝑡𝑎𝑙𝑖𝑡, 𝑀𝑎𝑡𝑒𝑟𝑖𝑎𝑙𝑖𝑡) + 𝑒𝑖𝑡 (3)
Φit is a third-order polynomial approximation of capital (k) and material (m) plus the
exogenous productivity term a0. The estimation then proceeds in two stages. First regress 𝑦𝑖𝑡
on a third-order polynomial of capital (k) and labor (l), and then retrieve
𝑣𝑖𝑡(𝛽𝑘, 𝛽𝑚) = Φ̂it (𝑐𝑎𝑝𝑖𝑡𝑎𝑙𝑖𝑡, 𝑀𝑎𝑡𝑒𝑟𝑖𝑎𝑙𝑖𝑡) − 𝛽𝑘𝑐𝑎𝑝𝑖𝑡𝑎𝑙𝑖𝑡 − 𝑎0. (4)
Assume that 𝑣𝑖𝑡 follows a first-order Markov process:
𝑣𝑖𝑡 = 𝐸[𝑣𝑖𝑡|𝑣𝑖𝑡−1] + 𝜉𝑖𝑡. (5)
We can now estimate the model by GMM by exploiting the orthogonality between 𝜉𝑖𝑡 and
𝑐𝑎𝑝𝑖𝑡𝑎𝑙𝑖𝑡. TFP can be retrieved as 𝑎0̂ + 𝑣𝑖�̂�.
3.2 Trade engagement and total factor productivity
The dynamic process of productivity is determined by trade and other factors. Using the
logarithm of TFP obtained in equation (2), the second stage estimation relates TFP to the
firm-level trade, industrial-level trade and industrial characteristics.
itiit
o
utq
c
utp
o
uto
c
utc
uthhutfdiitf
n
iten
a
iteaitit
uXCompCompEXIEXI
HHFDIIMPEXEXTFPTFP
1 (6)
where TFP is computed in the first step. The TFP follows a dynamic process in which several
determinants are involved such as the firm’s past TFP level, the percentage of foreign asset at
industrial level (FDI), competition (HH) and both firm and industrial level trade variables.
EX is the firm-level export to sales ratio of firm i in year t, distinguished by the exporting to
African countries (EXa) and to non-African countries (EX
n). The percentage of imported input
1 See Olley and Pakes (1996) and Levinsohn and Petrin (2004).

9
material is captured by variable IMP for firm i in year t. FDI measures the asset ratio of
foreign owned firms in industry u and year t. HH denotes the Herfindahl index in industry u.
EXI is export to value added ratio of the industry u that firm i belongs to, the superscripts c
and o denote exports to China and OECD market, respectively. Comp is the import
penetration ratio (in industrial value added) in industry u, c and o denote the imports from
China and the OECD countries, respectively. X is a vector of firm and industry level control
variables. ξ, β and φ are the corresponding coefficients to be estimated. Then the TFP can be
computed by following
(6)
Where ωit = a0 + vit represents the firm’s TFP level. a0 and vit are defined in function (3). In
order to broaden the comparison to Ghana-South and Ghana-North trade, we will also use the
ratio of exports and imports in industrial value added between Ghana and four emerging
economies including Brazil, China, India, Russia and South Africa to compare with that of
Ghana-OECD.
3.3 Estimation methodology
There are several econometric issues here. First, the knowledge contained in foreign assets
and traded goods may take time to diffuse (Jaffe and Trajtenberg, 1998). Firms’ adjustment to
the intensity of industry competition also takes time. Lagged trade therefore are used as
explanatory variables. Second, there may be omitted variables problem due to data
availability. We use a dynamic model including lagged dependent variable as one of the
explanatory variables to reduce this problem because the lagged dependent variable is likely
to capture the effects of many of the omitted variables. Third, bringing industry level data
into firm level estimation may result in downwardness of the estimated standard error.
Therefore, the standard errors will be clustered at the industry level.
Because of the likely endogeneity of trade and the omitted variables due to unobserved firm-
specific effects, equation (3) cannot produce consistent estimates using the ordinary least
squares method. It is reasonable to assume that firms with higher productivity levels have
strong competitive advantages which allow them to engage in international trade. Thus,
industry-level imports and exports volumes are not independently chosen, but rather
determined by the characteristics of the industry, including the efficiency of firms in the
industry. This endogeneity problem or simultaneity bias is defined as the correlation between
the level of trade and unobserved productivity shocks (De Loecker, 2007). To control for this
problem, several estimation approaches can be adopted.
By assuming that ui is firm or/and industry specific, but time-invariant, using fixed effects
estimator (FE) would remove the omitted variable bias (Pavcnik, 2002; Levinsohn and Petrin,
2004). Therefore, equation (5) can be estimated in levels using a least square dummy variable
estimator or in the first (or mean) differences. Provided unobserved factors ui do not vary
over time, FE will overcome the simultaneity bias and yield consistent results on estimated
coefficients. However, in spite of the wide usage of the FE estimator, it does not perform well
in practice (Olley and Pakes, 1996; Wooldridge, 2009; Van Bevern, 2010) due to the strict
exogeneity condition imposed on the covariates and idiosyncratic errors at any time t.
An alternative method to achieve consistency of coefficients in equation (5) is to instrument
the independent variables (IV) that cause the endogeneity problems (i.e. the trade,
ititmitkitlitit emkly 0
10
competition and trade). Unlike the fixed effect estimator, IV methods do not rely on strict
exogeneity of the inputs for consistent estimation (Wooldridge, 2009). The empirical
estimation of the current study will mainly rely on the generalized method of moments
(GMM) in which both lagged levels and the lagged first-difference of the dependent variables
will be chosen as instruments. In empirical practice, using only lagged inputs to instrument
for changes in inputs often causes the endogenous coefficient to be biased downwards (and
often insignificant) and leads to unreasonably low estimates. Blundell and Bond (1999)
suggest that the system GMM estimator using lagged first-differences of the variables as
instruments in the level equations often yields more reasonable parameter estimates.
Furthermore, in order the test the consistency of estimating TFP and the effect of trade on
TFP separately, a one step estimation approach will be used in the robustness check session.
4. Data and variables
4.1 Firm-level panel
The firm-level panel used in the empirical analysis are from two sources: the firm-level data
introduced in this section and the aggregated trade data in section 4.3. The firm-level data
comprises the manufacturing firms operating in Ghana. The survey was conducted by the
Centre for the Study of African Economies (CSAE) at the University of Oxford, in
conjunction with the University of Ghana, Legon and the Ghana Statistical Office2. It covers
12 waves and was collected in seven rounds over the period 1991-2002. The sample was
intended to be broadly representative of the size distribution of firms across the major sectors
of Ghana’s manufacturing industry. These sectors include food processing, textiles and
garments, wood products and furniture, metal products and machinery. The original sample
had a size of 312 firms, for nearly quarter (85 firms) was obtained throughout all waves and
the rest (227 firms) only appears in certain segment of the survey period. In light of the
estimation methodology requirement, we keep firms that were present for at least three
consecutive waves. After cleaning the missing values, we are left with an unbalanced panel
consisting of 201 firms and 1710 observations during the period under survey. 3
The CSAE data covers critical indicators with which the TPF estimation would be able to
compute. The dependent variable of function (2) is the output of a firm, which is computed at
the real value of the manufactured output at 1991 firms-specific output price (in logarithm).
The output of a firm is a function of a series of inputs including physical capital, labour and
materials. Reflecting the production capability, physical capital is imputed as the replacement
value of plant and machinery (deflated in 1991 price, in logarithm). The total number of
employees represents the scales of the firms. Intermediate inputs, material, here is to proxy
for unobserved productivity in function (2) and computed as the total costs of raw material at
1991 price (in logarithm).4 Provided the Levinsohn and Petrin (2004) framework, firm TFP
will be constructed and the impact of trade on China-Africa trade on TFP will be extended to
function (5).
2 The data can be found at the CSAE website: www.csae.ox.ac.uk
3 There are 2019 observations from 312 firms included in the sample across the survey period. 228 observations
are dropped due to missing values among firm level variables in equation (3) and (5), and another 81
observations are removed because of appearing less than three consecutive years. The estimation results only
include 1464 observations because of lags were included and 246 observation are dropped. 4 Material inputs here is a function of capital and productivity and subject to a monotonicity condition. Inverting
ф in function (2) allows one to express unobserved productivity as a function of observables: capital and
materials.

11
To better control the firm heterogeneity, an extra group of firm-level indicators from CSAE is
also employed in the estimation of function (5). Firms were asked to give the percentages of
output exported within and outside of Africa. Including the trade variables at the firm level,
in particular the exports distinguished by the geographical proximity, allows us to find out the
effect of intra- and inter- regional trade on the productivity growth of Ghanaian firms. A
competitive industry environment would either reinforce the productive firms to become
more competitive or crowd the less productive firms out of the market. Thus, the Herfindahl
index is to indicate the levels of domestic competition, and is calculated as the sum of
squared share of a firm output in the total industrial outputs of sample firms. High degrees of
competition are expected to frustrate firms with a low technological capability but encourage
the productive firms to become more efficient. Therefore, a mixed effect is expected between
Herfindahl and TFP. In addition, the presence of foreign capital would stimulate the
technology spillovers and hence foster the growth of productivity of recipient countries.
Using the ratio of total assets owned by foreign firms in total industrial assets of the sample
firms, we construct the FDI indicator for each industry.
4. 2. Regional-industrial panel
To extend the empirical analysis to more present time period, we have employed additional
data sources from World Bank (WB) Investment Survey - Ghana 2006 and 2012 – to
construct a regional-industrial panel during 1992 -2012.5
The WB data includes two waves in Ghana, 616 firms from 2006 and 720 firms from 2012.
The survey covers critical indicators, including capital stock, material input, the total number
of employees, and the annual turnover. These indicators can be used to compute TFP based
on equation (2). Since the survey in 2013 did not distinguish the trade destinations, we will
not use the trade indicators at the firm level. Based on the number of foreign owned firms and
the total number of firms in each industry, FDI and the Herfindahl index at industrial level
can be calculated. The estimation will follow the same routine in which TFP will be
computed in the first stage and the second stage will evaluate the impact of trade activities on
productivity.
Given the fact that the firms included in the WB survey are different from that in the CSAE
survey, matching two datasets and conducting a firm-level study therefore does not seem to
be feasible. One option is to construct a regional-industrial level data in which the sample
firms are aggregated according to the industry and region they belong to. The regional-
industrial mean values will be calculated for each variable in equation (2). 6 In total, 11
industries and 4 regions can be identified. After aggregating and merging the CSAE data in
year 1992, 1995, 1999 and 2002 with the WB data in year 2006 and 2012, the regional-
industrial sample comprises an unbalanced panel with 100 observations across 6 waves.
5 The regional-industrial panel covers the period 1992-2012 but does not include every year in between. It has at
least three years gap between each wave and including total 6 waves, comprising year 1992, 1995, 1999, 2002,
2006 and 2012. More information about the WB data can be found at http://www.enterprisesurveys.org/. 6 The reason that aggregated sums of variables are not used is because the blown-up factors cannot be found for
the CSAE dataset. Without the blown-up factors, one would not be able to get the percentage of sample firms in
the total population, therefore using the aggregated sums to represent the regional-industrial sums would be
biased. The mean values in this case will be more representative if the sample firms are randomly and
consistently chosen.

12
4.3 Industry-level trade indicators
The aggregated trade dataset is a set of bilateral commodity-level trade data collected from
COMTRADE.7 In line with Feenstra et al. (2005), we have taken the importers’ reports as the
primary source assuming that these are more accurate than reports by the exporter. The
exporters’ volume will be used only when the corresponding importer volume is unavailable.
Specifically, imports of Ghana record the volume from every country in the world, but the
exports will use the trading partners reported imports from Ghana rather than the Ghanaian
reported exports whenever possible. To match the firm level data, the current study mainly
uses the COMTRADE Ghanaian import and export data from the period 1991-2012.
Table 1. Definition of variables and summary statistics: firm-level panel
Variables Definition Mean S.D Min Max
For computing
firm TFP
Output Real value of manufactured output (1991 Firm-specific output
price), in logarithm
17.27 2.17 11.49 25.49
Capital Imputed replacement value of plant and machinery (deflator
1991 Cedis, million), in logarithm
16.13 3.09 9.54 23.64
Material Total cost of raw materials (1991 Firm-specific output price), in
logarithm
3.19 1.39 0.00 7.50
Worker Total number of employees, in logarithm 16.43 2.16 8.92 24.49
For estimating
TFP on trade
Expfirm_Africa Percentage of output exported within Africa 0.02 0.09 0.00 1.00
Expfirm_nonAfrica Percentage of output exported outside Africa 0.06 0.21 0.00 1.00
Impfirm Percentage of raw materials imported 0.24 0.36 0.00 1.00
Industrial level
trade variables
FDI Ratio of total assets owned by foreign firms in total industrial
assets, calculated with sample firms
0.41 0.29 0.00 0.91
Herfindahl The sum of squared share of firm output/industrial output,
calculated with sample firms
0.30 0.18 0.09 1.00
Exp_China Industrial level exports volume from Ghana to China, as ratio of
industrial value added
0.23 0.43 0.00 4.32
Exp_EE8 Industrial level exports volume from Ghana to the emerging
economies, as ratio of industrial value added
0.40 0.63 0.00 5.56
Exp_OECD Industrial level exports volume from Ghana to the OECD
economies, as ratio of industrial value added
2.64 6.61 0.00 49.17
Imp_China Industrial level imports volume from China to Ghana, as ratio of
industrial value added
0.25 0.06 0.00 0.44
Imp_EE Industrial level imports volume from the emerging economies to
Ghana, as ratio of industrial value added
0.12 0.29 0.00 3.26
Imp_OECD Industrial level exports volume from the OECD economies to
Ghana, as ratio of industrial value added
8.83 11.16 0.00 57.18
7 For the detailed commodity-level data construction, please see Feenstra et al. (2005). The data can be found
from www.nber.org/data (International Trade Data, NBER-UN world trade data).Feenstra et al. have oarganize
the data by the 4-digit Standard International Trade Classification, Revision 2. We have further aggregate the
data into SITC 3-digit level in order to match the firm-level data from CSAE industry classification. 8 EE include BRICS countries: Brazil, Russia, India, China and South Africa

13
One difficulty here lies in constructing the trade intensity at the industry-level. To do so,
aggregated output for each industry is needed. However, only data for 2003 can be found.9
With the UN Industrial Production Index and the outputs from 2003, it is possible to calculate
the aggregated outputs for each industry.10
Using the ratio of trade volumes in industrial-level
outputs will efficiently remove the bias caused by ignoring the weights of each industry in the
total manufacturing sectors. Therefore the ratio of trade to output across each industry in the
sample will be adopted rather than using the absolute values of trade volume alone.
The industrial trade shares were obtained by aggregating the commodity trade to SITC Rev. 2
using COMTRADE data. Estimating the impact of trade activities on TFP performance
(equation 6) considers the TFP as a function of a dynamic process in which the lag TFP level
and other lagged trade indicators are present. Exp_China, Exp_EE and Exp_OECD denote
the industrial export volumes from Ghana to China, emerging economies and the OECD
economies respectively, while Imp_China, Imp_EE and Imp_OECD are the corresponding
industrial imports. Differentiating the trade with China/EEs from with the OECD economies
allows us to compare the productivity gains of forming trade activities with South and North.
The definition and summary statistics of variables are given in table 1.
5. Empirical results and discussions
5.1 Obtaining firm-level TFP indices
Table 2 presents the results of computing TFP by using different approaches for Ghanaian
manufacturing firms for the years 1991 - 2002. All reported estimators are obtained from the
unbalanced panel and performed in Stata 13.11
In line with the productivity literature (Olley
and Pakes, 1996; Levinsohn and Petrin, 2003; ABBP, 2007), the fixed effects estimator
(Model 1 in Table 2) is expected to control for time invariants and the coefficients on the
captial inputs are lower compared to the OLS results (Model 2 in Table 2). The last column in
table 2 displays the production function coefficients for the semi-parametric estimators of LP.
Comparing LP estimates to the OLS estimates in the second column, the coefficients on both
capital and labour are lower compared to both FE and LP.12
Having obtained the coefficients
of the production function, the next step is to calculate the firm-level TFP for each firm
across the sample years by following equation (4).13
9 The value added 2003 data at industry-level can be found in the UNIDO database. It is the only year that
available for Ghana. http://www.unido.org/en/resources/statistics/statistical-databases.html 10
For the detailed computation of industrial outputs, please see appendix A. 11
Estimators are generated by using built-in commands reg, xtreg and levpet. 12
In the estimation of TFP using LP approach, constant term is integrated into the productivity approximation
and therefore the estimation results does not give the constant term. Meanwhile, material inputs coefficients are
not reported since the value added is used as the dependent variable. The reason to use value added instead of
revenue is because of the data availability. More details of the derivation of TFP can be found in Levinsohn and
Petrin (2003). 13
To verify whether these different estimators yield consistent results, we have also checked the correlations
between the different TFP estimates. It is evident that the TFP measures obtained using by using OLS, fixed
effects (FE) and LP are different but highly correlated. The correlation between FE and LP is about 0.877 and
the correlation between OLS and LP is around 0.849. The highest correlation is found between OLS and FE,
0.997..

14
Table 2. Comparison of estimated coefficients of TFP computation, 1991-2002
(1) (2) (3)
Variables OLS FE LP
Worker 0.829*** 0.708*** 0.367***
(0.037) (0.048) (0.059)
Capital 0.289*** 0.322*** 0.233***
(0.016) (0.025) (0.082)
Constant14
8.915*** 8.792***
(0.183) (0.339)
Observations 1,710 1,710 1,710
R-squared 0.743 0.981
Number of firm 201 201 201
Standard errors in parentheses. *** p<0.01, ** p<0.05, * p<0.1.
5.2 The productivity effects of trading with China/EE vs. OECD
The following analysis is to understand how the effect of trade with China/EE differs from
the trade with the OECD economies in fostering the TFP of Ghanaian manufacturing firms.
We estimate the firm level TFP on (i) the past TFP performance to capture the dynamic
nature of the process; (ii) the scale of firms that expect to determine the production capacity;
(iii) the firm level trade indicators including the exports to African and Non-African countries,
as well as imports intensity; (iv) the industrial level indicators including FDI, industrial
competition and the industrial-level trade variables. The estimation results are reported in
Table 3.
Model 1 to Model 3 in Table 3 present the estimators of the full sample. Although estimated
results from three models are in general consistent, differences among coefficients appear due
to the potential bias in using OLS and FE. Given the fact that GMM produce more consistent
results, the main interpretation will be based on Model 3. As shown in these three models, the
past TFP level is significantly associated with the present TFP performance. OLS and GMM
generate similar estimated coefficients regarding L.lnTFP (around 0.6). Compared to the
panel approach, the corresponding coefficient generated by OLS is slightly higher, about 0.65
per cent of current productivity is explained by TFP in the previous year. The scale effect
appears in both OLS and GMM specifications and the positive signs of estimated coefficients
imply that there are slightly increasing returns to scale. It seems that engaging in exporting to
Africa countries does not create strong impacts on the TFP of Ghana manufacturing firms.
Nonetheless, exporting to Africa countries produces a positive impact (at 0.1 per cent
significance level) on the improvement of TFP as shown in the GMM. As the estimators of
FDI show, the large ratio of total assets owned by foreign firms in the total asset of an
industry is positively related with the TFP performance. A high level of foreign assets in an
industry enlarges the knowledge pool of domestic market, regarding both technological and
managerial knowledge, and provides spillovers for the local firms operating in the same
industry. However, the presence of the foreign producers will not necessarily intensify the
competition and push the local firms to advance their productivity. Such a competition effect
has not been verified by the estimates of Herfindahl, although the coefficients are all positive.
A larger number of firms operating in one industry aggravate the competition among the
firms in the same industry. Ghanaian manufacturing firms have to rely on TFP improvement
14
The constant of LP was absorbed in unobserved productivity when taking the third-order approximation of
material and capital, while identifying the coefficient of labour.

15
and innovation to stand out of the competition. As regards the impacts of industrial level
trade on TFP performance, it is shown that only exporting to China creates a channel for
Ghana manufacturing firms to improve TFP performance while trade engagement with
OECD countries does not produce any impacts.
Table 3 The impact of trade on TFP: comparing Ghana-China with Ghana-OECD economies from
1991 to 2002
Total Sample GMM
OLS FE GMM Ind. group 1 Ind. group 2
VARIABLES Model 1 Model 2 Model 3 Model 4 Model 5
L.lnTFP (L: lags) 0.645*** 0.342*** 0.595*** 0.655*** 0.487***
(0.023) (0.048) (0.057) (0.053) (0.090)
Worker 0.016*** 0.009 0.019*** 0.016*** 0.025***
(0.002) (0.008) (0.004) (0.003) (0.007)
L. Exp_Africa Firm 0.030 0.007 0.031* 0.013 0.056*
(0.024) (0.021) (0.017) (0.019) (0.029)
L.Exp_nonAfrica F. 0.006 0.031 -0.016 -0.001 -0.323
(0.015) (0.024) (0.028) (0.018) (0.249)
Imp_Firm 0.009 0.007 0.009 0.004 0.005
(0.007) (0.010) (0.011) (0.014) (0.015)
FDI 0.037** 0.041** 0.037*** 0.037** 0.003
(0.017) (0.016) (0.014) (0.017) (0.113)
Herfindahl 0.025 0.026 0.024 0.002 0.049
(0.019) (0.019) (0.016) (0.021) (0.051)
Imp_China -0.003 0.005 -0.000 0.043* -0.013
(0.011) (0.010) (0.008) (0.026) (0.008)
Imp_OECD 0.001 0.001 0.001 0.046* 0.002*
(0.001) (0.001) (0.001) (0.024) (0.001)
Exp_China 0.187*** 0.166*** 0.180*** 0.200*** 0.199**
(0.057) (0.055) (0.063) (0.069) (0.097)
Exp_OECD -0.000 -0.000 -0.000 -0.000 -0.000
(0.001) (0.001) (0.001) (0.002) (0.001)
Constant 0.735*** 1.528*** 0.850*** 0.748*** 1.125***
(0.069) (0.117) (0.130) (0.129) (0.213)
R-squared 0.584 0.123
Observations 1,464 1,464 1,464 928 536
Notes: * significant at 10%; ** significant at 5%; *** significant at 1%. Industry dummies are included.
Instruments for the system GMM are industry dummies, lagged levels and differenced values of the right hand
side variables. Robust standard errors are in parentheses. The Hansen test of over-identifying restrictions does
not reject the validity of the instruments for the GMM models. Arellano-Bond AR tests also indicate that there
are no problems relating to serial correlation of the error terms. Ind.group1 includes 928 observations across five
traditional industries in Ghana: Food, Furniture, Garment, Textile and Wood. The rest of the sample firms (536)
are included in Ind.group2.
Attempting to capture the effects caused by industry heterogeneity, the full sample is divided
into two subgroups, taking into account whether the industry belongs to traditional industries
in Ghana.15
The GMM approaches are adopted to estimate both subgroups and results are
15
The choice of industries with comparative advantages is based on whether the industry is one of the
traditional industries in Ghana because these industries normally receive great policy support and possess
abundant production resources. Industry contributed about 30 per cent of the GDP in 1999 and absorbed about
15 per cent of the nation’s work-force. According to the industrialization policy the following industries are
categorized as traditional industry in Ghana and almost all of them began as state-owned enterprises: producing
food products, beverages, tobacco, textiles, clothes, footwear, timber and wood products, chemicals and

16
displayed in Model 4 – Model 5 in Table 3. Ind.group1 includes 928 observations across five
traditional industries in Ghana: Food, Furniture, Garment, Textile and Wood. The rest 536
firms are included in Ind.group2. As shown in the comparison of Ind.group 1 and Ind.group 2,
the dynamic nature of TFP is more manifest among the traditional industries where
approximately 0.65 percentages of the current TFP is explained by the previous period. The
differences in the scale effects between two groups suggest that large number of employees
would have a higher increasing to scale in the non-traditional industries. The impact of the
firm level trade intensity, exporting to non-African countries, on TFP was only confirmed in
the non-traditional industries as well. Clear differences are also exhibited between the two
groups regarding the FDI and Competition indices. With more capital and resources
allocating in the traditional industries, the TFP spillovers engendered by the presence of
foreign firms would be more likely to diffuse since firms in these traditional industries have
already obtained relatively rich production experiences and are equipped with higher learning
capabilities compared to other firms. In the non-traditional industries, where technology and
production resources are scarce, local firms tend to be crowded out by the presence of foreign
competition as reflecting from the insignificant estimate of FDI in Model 5. The existing
resources structure and the policy orientation from the Ghanaian government at that time tend
to promote the development of traditional industries. In such circumstances, more
opportunities are created for new firms among those industries to acquire better technologies
from foreign companies and upgrade their production capability, eventually pushing up the
TFP level.
After differentiating the industry heterogeneity, the impact of the industrial level trade
intensity has exhibited an interesting pattern. Forming trading partnership, regardless with
China or OECD, significantly contribute to the TFP performance of Ghanaian firms. In
particular, trading with China in general create a higher productivity effect comparing trading
with OECD countries, reflecting by the greater coefficients in Model 4. Such finding is in
line with the previous literature, arguing that the learning effects from trade engagement are
likely to be higher in the industries where a country has comparative advantages because of
accumulated know-how, learning by doing, possibly related to the abundance of some
resource endowments to begin with (Bernard et al., 2007). Among these traditional industries,
translating the imports embedded foreign knowledge and intermediate inputs into local
production, or learning from exporting activities, would be more straightforward since the
technical requirement is relatively low and firms in these industries normally have already
established some technical competencies. With respect to the impacts of trade on the TFP
across non-traditional industry group, exporting to China performs as a stimulus in fostering
TFP growth while the impacts of trading with OECD are faded. It is worth noting that
Imp_China and Imp_OECD (Model 5) becomes negative, indicating that the non-traditional
industries with less governmental policy supports are likely to be hindered by the present of
foreign imports.
One interesting finding is that the trade with China yields broad gains on TFP in a sense the
positive gains are derived from both importing and exporting engagements (Model 4), despite
pharmaceuticals, and metals, including steel and steel products. Considering the industry structure of CSAE data,
we chose the top five industries (928 observations from a total of 1464 observations) on the list as industries
with comparative advantages in the current study since they were all listed as primarily promoted industries in
the industrialization policy in 1999 and, therefore, more capital and resources were expected to flow into these
industries. They are Food, Furniture, Garment, Textile and Wood industries. Source:
http://www.nationsencyclopedia.com/economies/Africa/Ghana-INDUSTRY.html
17
such pattern only appears in tradition industries. However, trade with OECD economies does
not always bring positive impacts for example, exporting to OECD. Compared to trade with
OECD countries, forming the trading relation with China creates greater potentials for
Ghanaian firms to enhance their TFP performance as shown by the differences in magnitudes
of coefficients compared to Ghana-OECD trade. This finding is consistent with the previous
literature (Kaplinsky and Morris, 2009; He, 2013), suggesting that South-South trade can
promote economic development, which is particularly true for African countries. Trade
between countries at similar levels of development is relatively more diversified (in terms of
the range of products and activities) and translating these products into the domestic
production system would be easier compared to trade between countries with greater gaps of
the development levels.
The results have shown that importing from both China and OECD has helped the Ghanaian
firms to advance their TFP level. Although a greater variety of imports allows domestic
producers to choose cheaper, production compatible and technology appropriate inputs that
benefit the improvement of productivity, the importing country also matters considering the
technology gap between trading partners and the levels of technology content a trading
partner provide (Kokko, 1992). On the one hand, the Chinese goods exported to Africa are
generally of decent quality and well–priced, and match the consumption needs of the local
market. The relatively closer technology gap with China allows Ghanaian firms to gain a
higher potential to acquire the Chinese products’ embedded technologies (Lipsey and
Sjoholm, 2011). On the other hand, goods from OECD countries contain more of
technological advances which would better fulfil the technology needs of the local firms than
the Chinese counterpart. The similar magnitudes of Imp_OECD compared to Imp_China (in
Model 4) suggest that Ghanaian firms in the traditional industries tend to benefit from both
knowledge intensive imports from OECD and the Chinese ones. Meanwhile, it is worth
noting that exporting to China yields consistent impact on the TFP for both industrial groups.
Through the expansion to Chinese markets, Ghanaian manufacturing firms start exploiting
economies of scale and increase their productivity.
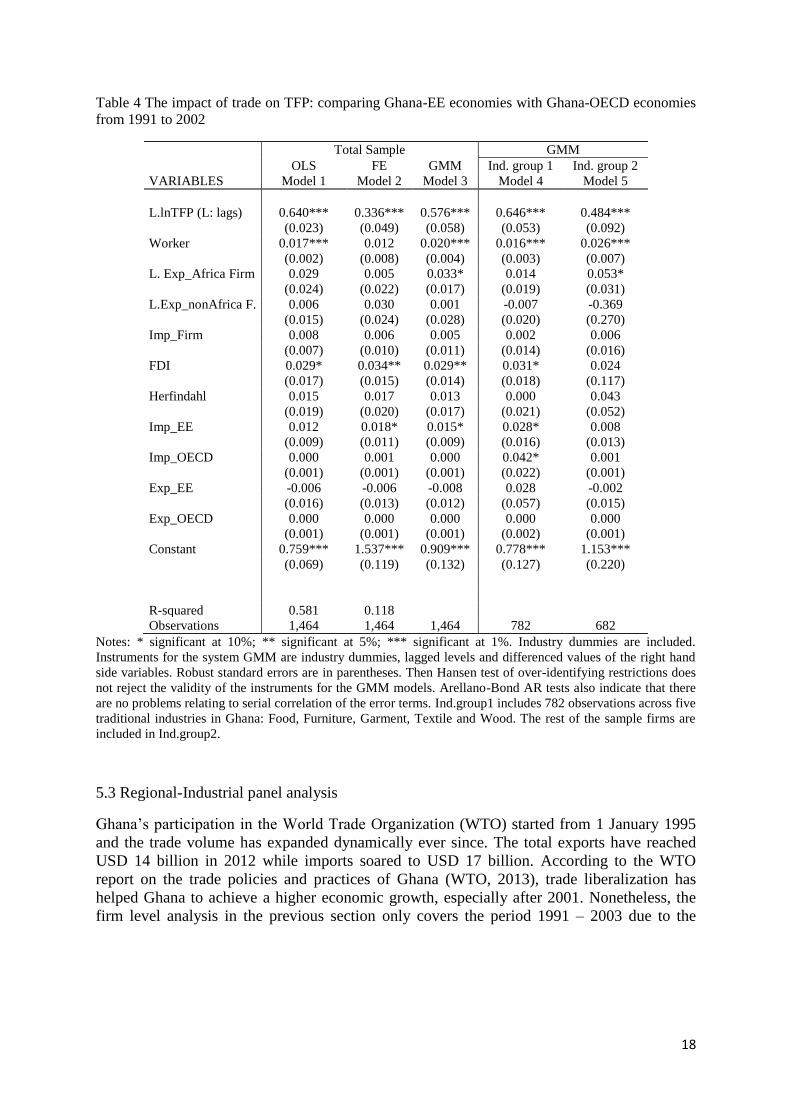
The same estimations have been replicated for the specification in which Ghana-China trade
variables are replaced with Ghana-EE16
and the results are given in Table 4. The objective is
to cross check the impacts of South-South trade on TFP and comparing such impacts to that
of impacts generated by South-North trade. The results based on the whole sample, as shown
in Model 1 to Model 3 in Table 4, are in general consistent with the results in Table 3, except
that only Imp_EE is positive and significant in FE and GMM specifications. Again it
confirms the positive productivity returns from engaging in trade with emerging economies.
When the sample is divided into the traditional and non-tradition industries, similar patterns
are revealed. The findings verify the argument that the trade significantly contributes to the
TFP of Ghanaian manufacturing firms, but such effects are only observed among firms in the
traditional industry where a country has built up the comparative advantages. Regarding
whether trading with EE or OECD, the results suggest importing from OECD countries turns
out yielding the greatest TFP gains and the positive TFP gains from exporting to South
countries disappeared.
16
EE group includes five emerging countries: Brazil, China, India, Russia and South Africa. The trade data
between Ghana and EE are obtained by following the same approach discussed in the previous section.
18
Table 4 The impact of trade on TFP: comparing Ghana-EE economies with Ghana-OECD economies
from 1991 to 2002
Total Sample GMM
OLS FE GMM Ind. group 1 Ind. group 2
VARIABLES Model 1 Model 2 Model 3 Model 4 Model 5
L.lnTFP (L: lags) 0.640*** 0.336*** 0.576*** 0.646*** 0.484***
(0.023) (0.049) (0.058) (0.053) (0.092)
Worker 0.017*** 0.012 0.020*** 0.016*** 0.026***
(0.002) (0.008) (0.004) (0.003) (0.007)
L. Exp_Africa Firm 0.029 0.005 0.033* 0.014 0.053*
(0.024) (0.022) (0.017) (0.019) (0.031)
L.Exp_nonAfrica F. 0.006 0.030 0.001 -0.007 -0.369
(0.015) (0.024) (0.028) (0.020) (0.270)
Imp_Firm 0.008 0.006 0.005 0.002 0.006
(0.007) (0.010) (0.011) (0.014) (0.016)
FDI 0.029* 0.034** 0.029** 0.031* 0.024
(0.017) (0.015) (0.014) (0.018) (0.117)
Herfindahl 0.015 0.017 0.013 0.000 0.043
(0.019) (0.020) (0.017) (0.021) (0.052)
Imp_EE 0.012 0.018* 0.015* 0.028* 0.008
(0.009) (0.011) (0.009) (0.016) (0.013)
Imp_OECD 0.000 0.001 0.000 0.042* 0.001
(0.001) (0.001) (0.001) (0.022) (0.001)
Exp_EE -0.006 -0.006 -0.008 0.028 -0.002
(0.016) (0.013) (0.012) (0.057) (0.015)
Exp_OECD 0.000 0.000 0.000 0.000 0.000
(0.001) (0.001) (0.001) (0.002) (0.001)
Constant 0.759*** 1.537*** 0.909*** 0.778*** 1.153***
(0.069) (0.119) (0.132) (0.127) (0.220)
R-squared 0.581 0.118
Observations 1,464 1,464 1,464 782 682
Notes: * significant at 10%; ** significant at 5%; *** significant at 1%. Industry dummies are included.
Instruments for the system GMM are industry dummies, lagged levels and differenced values of the right hand
side variables. Robust standard errors are in parentheses. Then Hansen test of over-identifying restrictions does
not reject the validity of the instruments for the GMM models. Arellano-Bond AR tests also indicate that there
are no problems relating to serial correlation of the error terms. Ind.group1 includes 782 observations across five
traditional industries in Ghana: Food, Furniture, Garment, Textile and Wood. The rest of the sample firms are
included in Ind.group2.
5.3 Regional-Industrial panel analysis
Ghana’s participation in the World Trade Organization (WTO) started from 1 January 1995
and the trade volume has expanded dynamically ever since. The total exports have reached
USD 14 billion in 2012 while imports soared to USD 17 billion. According to the WTO
report on the trade policies and practices of Ghana (WTO, 2013), trade liberalization has
helped Ghana to achieve a higher economic growth, especially after 2001. Nonetheless, the
firm level analysis in the previous section only covers the period 1991 – 2003 due to the
19
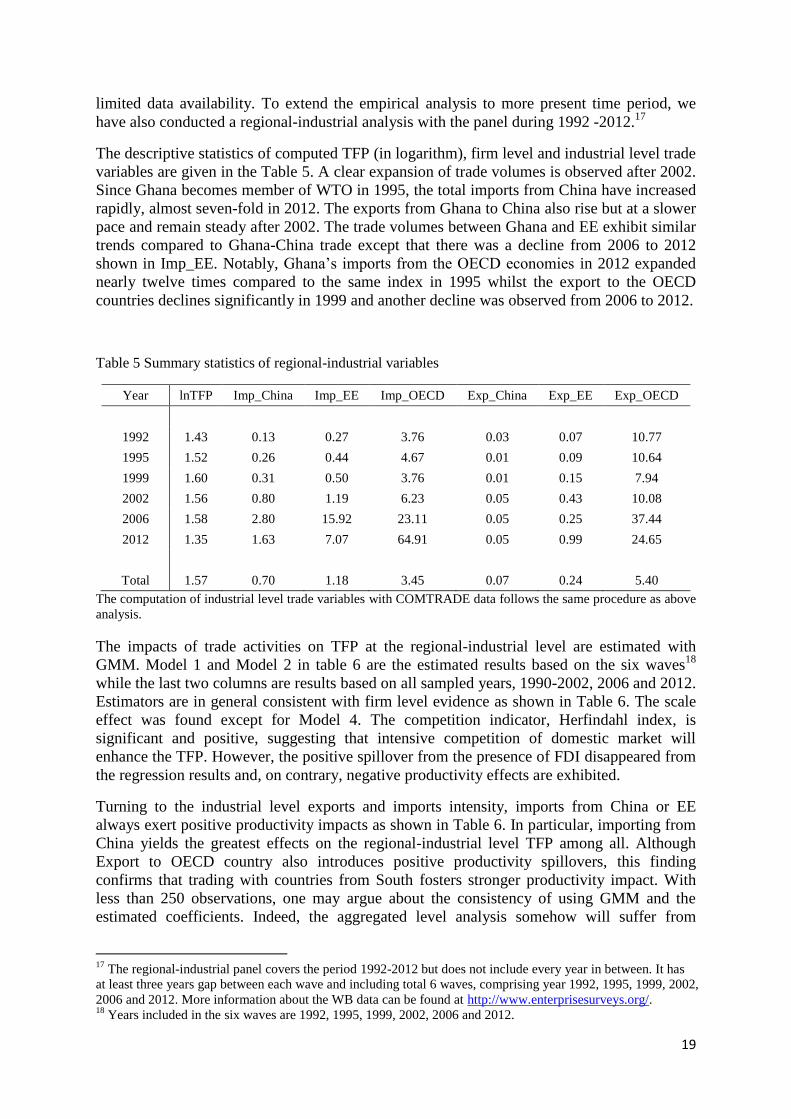
limited data availability. To extend the empirical analysis to more present time period, we
have also conducted a regional-industrial analysis with the panel during 1992 -2012.17
The descriptive statistics of computed TFP (in logarithm), firm level and industrial level trade
variables are given in the Table 5. A clear expansion of trade volumes is observed after 2002.
Since Ghana becomes member of WTO in 1995, the total imports from China have increased
rapidly, almost seven-fold in 2012. The exports from Ghana to China also rise but at a slower
pace and remain steady after 2002. The trade volumes between Ghana and EE exhibit similar
trends compared to Ghana-China trade except that there was a decline from 2006 to 2012
shown in Imp_EE. Notably, Ghana’s imports from the OECD economies in 2012 expanded
nearly twelve times compared to the same index in 1995 whilst the export to the OECD
countries declines significantly in 1999 and another decline was observed from 2006 to 2012.
Table 5 Summary statistics of regional-industrial variables
Year lnTFP Imp_China Imp_EE Imp_OECD Exp_China Exp_EE Exp_OECD
1992 1.43 0.13 0.27 3.76 0.03 0.07 10.77
1995 1.52 0.26 0.44 4.67 0.01 0.09 10.64
1999 1.60 0.31 0.50 3.76 0.01 0.15 7.94
2002 1.56 0.80 1.19 6.23 0.05 0.43 10.08
2006 1.58 2.80 15.92 23.11 0.05 0.25 37.44
2012 1.35 1.63 7.07 64.91 0.05 0.99 24.65
Total 1.57 0.70 1.18 3.45 0.07 0.24 5.40
The computation of industrial level trade variables with COMTRADE data follows the same procedure as above
analysis.
The impacts of trade activities on TFP at the regional-industrial level are estimated with
GMM. Model 1 and Model 2 in table 6 are the estimated results based on the six waves18
while the last two columns are results based on all sampled years, 1990-2002, 2006 and 2012.
Estimators are in general consistent with firm level evidence as shown in Table 6. The scale
effect was found except for Model 4. The competition indicator, Herfindahl index, is
significant and positive, suggesting that intensive competition of domestic market will
enhance the TFP. However, the positive spillover from the presence of FDI disappeared from
the regression results and, on contrary, negative productivity effects are exhibited.
Turning to the industrial level exports and imports intensity, imports from China or EE
always exert positive productivity impacts as shown in Table 6. In particular, importing from
China yields the greatest effects on the regional-industrial level TFP among all. Although
Export to OECD country also introduces positive productivity spillovers, this finding
confirms that trading with countries from South fosters stronger productivity impact. With
less than 250 observations, one may argue about the consistency of using GMM and the
estimated coefficients. Indeed, the aggregated level analysis somehow will suffer from
17
The regional-industrial panel covers the period 1992-2012 but does not include every year in between. It has
at least three years gap between each wave and including total 6 waves, comprising year 1992, 1995, 1999, 2002,
2006 and 2012. More information about the WB data can be found at http://www.enterprisesurveys.org/. 18
Years included in the six waves are 1992, 1995, 1999, 2002, 2006 and 2012.

20
potential bias since the regional-industrial specification ignores the important firm
characteristics. Nevertheless, using the thirteen waves panel, the findings in general are
consistent with the firm level results. Trade helps the manufacturing industry in Ghana to
achieve better TFP performance. Forming the trade relations with South, where technological
distance is relatively small, will benefit the manufacturing TFP in comparison to trading with
North economies.
Table 6 GMM The impact of trade on TFP: comparing Ghana-EE economies with Ghana-OECD
economies at regional-industrial level, 1992-2012
6 waves 13 waves
China EE China EE
VARIABLES Model 1 Model 2 Model 3 Model 4
Worker 0.160*** 0.098*** 0.072** 0.051
(0.033) (0.017) (0.035) (0.037)
FDI -0.014*** -0.010*** -0.010*** -0.009***
(0.002) (0.002) (0.002) (0.002)
Herfindahl 0.608*** 0.557*** 0.353*** 0.237**
(0.104) (0.090) (0.135) (0.103)
Imp_China 0.095*** 0.044**
(0.018) (0.020)
Imp_EE 0.010*** 0.010***
(0.002) (0.002)
Imp_OECD -0.001 -0.000 -0.000 -0.000
(0.001) (0.000) (0.001) (0.001)
Exp_China -0.404* -0.050
(0.241) (0.182)
Exp_ EE 0.003 0.027
(0.015) (0.023)
Exp_OECD -0.000 0.001** 0.001** 0.001
(0.001) (0.000) (0.000) (0.001)
Constant 0.436*** 0.792*** 0.994*** 1.166***
(0.168) (0.073) (0.205) (0.200)
Observations 100 100 237 237
Notes: * significant at 10%; ** significant at 5%; *** significant at 1%. Instruments for the system GMM are
industry dummies, lagged levels and differenced values of the right hand side variables. Robust standard errors
are in parentheses. The Hansen test of over-identifying restrictions does not reject the validity of the instruments
for the GMM models. Arellano-Bond AR tests also indicate that there are no problems relating to serial
correlation of the error terms. 6-waves includes year 1992, 1995, 1999, 2002, 2006, and 2012; 13-waves
includes year 1992-2002, 2006, and 2012.
6. Conclusions
This research attempts to investigate the impact of trade on the TFP performance of the
Ghanaian manufacturing firms and explain why trading with Southern countries creates
greater TFP spillovers for less developed economies. In general, internationalization via trade
opens up effective channels for the firms in African countries to achieve productivity
progress. By engaging in the global production chain, local firms are allowed to better access
advanced technologies (Fu 2012). Via importing activities, African firms will be able to
enhance TFP by directly applying the imported machinery and equipment into local
production. Meanwhile, imports also bring technology embedded goods and services, as well
as the technological assistance from actors in the global supply chain. Furthermore, learning

21
can also occur through decomposing the imported products. By means of exporting and
exposing to foreign markets, firms in African countries may start exploiting economies of
scale that foster productivity growth. Competition in the international market also pushes
firms from the South to reinforce their comparative advantages through productivity
upgrading.
Using the firm level and trade-based industry level datasets from Ghana, evidence from the
empirical analysis has shown that trading with countries sharing similar production
capabilities stimulates stronger productivity effects because of the closer technological
distance. Compared to the trade with advanced economies, the South-South trade potentially
brings much more positive effects to the host economies given that the developing country
firms are likely to provide the goods and service that are more accessible to other developing
countries. The results also show that importing the technology- embedded goods from China
or EE economies is likely to yield stronger TFP spillovers and allows recipient firms to
upgrade their technological capability. Although the trade engagement with the OECD
economies also produces TFP spillovers, it does not come without conditions. Findings
suggest that industry heterogeneity may determine the probability and intensity of learning
induced by trade engagement. The learning effects tend to be greater in the traditional
industry where relatively more resources are allocated. Firms from the traditional industries
in Ghana are found to benefit more from international trade than those belonging to the non-
traditional industries.
From the policy perspective, a different set of policy responses is needed to stimulate the TFP
spillovers under the trend of intensified international trade. Given the inevitable technology
distance from trading partners, the policy-makers of African countries are suggested to
instigate effective trade schemes that not only consider the potential knowledge pools and
learning opportunities provided by the partner countries, but also, take into account the
industrial context such as the production capability and comparative advantages. Foreign
competition is a two-edged sword. Promoting learning and upgrading technological
capability of both the domestic industries should be considered a priority when designing the
industry and trade policies. The productivity growth that is mainly promoted by the exit of
unproductive firms (reallocation of resources), but lacks more broad-based driving force from
technology upgrading, may fail to sustain the economic growth in the longer term.
Regarding methodology, the estimators generated by different estimation approaches are
highly consistent. Adding extra datasets from the WB investment survey allows us to
construct a longer panel and extend the analysis to a more present time period. Similar
findings are uncovered, and again suggest that trade triggers the TFP spillovers and the
trading activities with China yield greater productivity effects on Ghanaian manufacturing
firms than that with the OECD economies. It is worth emphasizing that the regional-industrial
level results may suffer from potential bias given the small sample size. Larger and more
present data sources are required if one attempts to address more robust and recent policy
implications. Another limitation of the current research lies in the strong assumption that the
share of value added of each industry in the total manufacturing sector remains unchanged
during the period under survey. Industrial structure has gone through a dynamic change due
to the integration of global value chain and the reallocation of domestic production resources.
Ignoring this important issue is likely to reduce the reliability of the empirical findings.
Future studies in similar specification should call for a complete data in which the industrial
level outputs are used to normalize the trade intensity.

22
References
Ackerberg, D., Benkard, C.L., Berry, S. and Pakes, A. (2007) Econometric tools for analyzing market outcomes.
In J. Heckman and E. Leamer (eds), Handbook of Econometrics (Vol. 6(1), pp. 4171–4276).
Amsterdam: North-Holland.
Ackerberg, D., K. Caves and G. Frazer (2006), “Structural identification of production functions”, mimeo
Aitken, B., Hanson, G.H., and Harrison, A.E. (1997). Spillovers, foreign investment and export behavior.
Journal of International Economics 43: 103-132
Alessia A, M. Sanfilippob (2014). Impact of South–South FDI and Trade on the Export Upgrading of African
Economies, World Development, 64:1–17.
Amsden, A.H. (1986). The direction of trade – past and present – and the „learning effects‟ of exports to
different directions. Journal of Development Economics, 23(1986), 249-274.
Bas, M. & Strauss-Kahn, V. (2013). Input-trade liberalization, export prices and quality upgrading. Sciences Po
Economis Discussion Papers 2013-13.
Blomström, M., and Kokko, A. (1998). Multinational corporations and spillovers. Journal of Economic Surveys
12(2): 1-31.
Blundell, R. and Bond, S. (1999) GMM estimation with persistent panel data: an application to production
functions. IFS Working Paper W99/4.
Cantwell, J. 1989. Technological innovation and multinational corporations. Basil Blackwell, Oxford.
Chuang, Y. C., and Lin, C. M. (1999). Foreign direct investment, R&D and spillover efficiency: Evidence from
Taiwan's manufacturing firms. Journal of Development Studies 35: 117- 137.
Cohen and Levinthal (1989), Innovation and learning: The two faces of R&D, The Economic Journal, Volume
99, September pg. 569-596.
De Loecker, J. (2007) Product differentiation, multi-product firms and estimating the impact of trade
liberalization on productivity. National Bureau of Economic Research Working Paper Series 13155.
Dollar, D. (1992). Outward-oriented Developing Economies Really Do Grow More Rapidly: Evidence from 95
LDCs, 1976-1985. Economic Development and Cultural Change, 40(3), 523-44.
Eaton, J. and Kortum, S. (1996). Trade in Ideas: Productivity and Patenting in the OECD, Journal of
International Economics, 40 , 251-278.
Edwards, C., & Jenkins, R. (2005). The Effect of China and India's growth and trade liberalization on poverty
in Africa. IDS/Enterplan.
Elu, J. U., Gregory, N., & Price, G. N. (2010). Does China transfer productivity enhancing technology to Sub-
Saharan Africa? evidence from manufacturing firms. African Development Review, 22(1), 587–598.
Glass, A., and Saggi, K.(1998). International technology transfer and the technology gap. Journal of
Development Economics 55: 369-398.
Griliches, Z. and Mairesse, J. (1995) Production functions: the search for identification. National Bureau of
Economic Research Working Paper Series 5067.
He, Yong (2013) Does China’s Trade Expansion Help African Development? – An Empirical Estimation. China
Economic Review, 26, 28-38.
Feenstra, R.C., Lipsey, R.E., Deng, H., Ma, A.C. and H. Mo, (2005). World Trade Flows: 1962-2000. NBER
Working Paper no. 11040, National Bureau of Economic Research.
Feng, L., Li, Z. & Swenson, D.L. (2012). The Connection between Imported Intermediate Inputs and Exports:
Evidence from Chinese Firms, NBER Working Paper N. 18260.
Fernandes, A. M. (2007). Trade policy, trade volumes and plant-level productivity in Colombian manufacturing
industries. Journal of International Economics, 71(1), 52–71.

23
Fransman, M. (1984). Technological capability in the Third World: An overview and introduction to some of
the issues raised in this book, in M. Fransman and K. King (eds.), Technological capability in the third
world, London, Macmillan Press.
Fu, X. (2012) Foreign Direct Investment and Managerial Knowledge Spillovers through the Diffusion of
Management Practices, Journal of Management Studies, 49(5), 970-999.
Fu, X. (2005). Exports, Technical Progress and Productivity Growth in a Transition Economy: a Non-parametric
Approach for China, Applied Economics, 37(7), 725-739.
Fu X. and Balasubramanyam, (2003). Township and Village Enterprises in China, Journal of Development
Studies, 39( 4): 27-46.
Fu, X., Zanello, G., Essegby, G., Hou, J. and Mohnen, P. 2014 (2014). Innovation in low-income countries,
report of ESRC/DFID funded project. TMCD.
Geda, A. and A. G. Meskel (2008). China and India’s Growth Surge: Is it a Curse or Blessing for Africa? The
Case of Manufactured Exports, African Development Review, Vol. 20, pp. 247–72.
Gelb, S. (2005). South-South Investment: the case of Africa in Africa in the World Economy – the National,
Regional and International Challenges. The Hague: Fondad
Githinji, M. W. (2010). Is That a Dragon or Elephant on your Ladder? The Potential Impact of China and India
on Export-Led Growth in African Countries, in D. Seck and S. Boko (eds.), Back on Track: Sector-Led
Growth in African and Implication for Development, pp. 167–94, Africa World Press, Asmara, Eritrea.
Goldberg, P.K., Khandelwal, A.K., Pavcnik, N. & Topalova, P. (2010). Imported Intermediate Inputs and
Domestic Product Growth: Evidence from India. Quarterly Journal of Economics, November 2010,
1727-1767.
Gorg, H. & Greenaway, D. (2004). Much Ado about Nothing? Do Domestic Firms Really Benefit from Foreign
Direct Investment? World Bank Research Observer, 19(2), 171-97.
Greenaway, D. & Milner, C. (1990). South-South Trade: Theory, Evidence, and Policy. The World Bank
Research Observer, 5(1), 47-68.
Grossman, G.M. & Helpman, E. (1991). Quality Ladders in the Theory of Growth. NBER Working Paper N.
3099.
Idun-Arkhurst, Isaac (2008). Ghana's Relations with China. Johannesburg: South African Institute of
International Affairs. ISBN 1-919969-32-2.
Jaffe, A.B., and Trajtenberg, M. 1998. International knowledge flows: Evidence from patent citations, NBER
Working Paper No. 6507, April 1998.
Lall, S. & Narula, R. (2004). Foreign Direct Investment and Its Role in Economic Development: Do We Need a
New Agenda? The European Journal of Development Research, 16(3), 447-464.
Levinsohn, J. and Petrin, A. (2003) Estimating production functions using inputs to control for unobservables.
Review of Economic Studies 70: 317–341.
Lin, J. (2012). New Structural Economics: A Framework for Rethinking Development and Policy. The World
Bank.
Lipsey, R.E. & Sjoholm, F. (2011). South-South FDI and Development in East Asia. Asian Development Review,
28(2), 11-31.
Melitz, M. J., & Ottaviano, G. I. P. (2008). Market size, trade, and productivity. Review of Economic Studies,
75(1), 295–316.
Morrisey, O. (2012). FDI in Sub-Saharan Africa: Few Linkages, Fewer Spillovers. The European Journal of
Development Research, 24(1), 26–31.
Kaplinsky, R. & Morris, M. (2009). Chinese FDI in Sub-Saharan Africa: Engaging with Large Dragons. The
European Journal of Development Research. 21(4), 551-69.
Kaplinsky, R., McCormick, D., & Morris, M. (2007). The impact of China on Sub Saharan Africa. Institute of
Development Studies (IDS), Working paper 291.
Narula, R. & Driffield, N. (2012). Does FDI Cause Development? The Ambiguity of the Evidence and Why it
Matters. European Journal of Development Research, 24(1), 1-7.
24
Olley, S.G. and Pakes, A. (1996) The dynamics of productivity in the telecommunications equipment industry.
Econometrica 64: 1263–1297.
Pavcnik, N. (2002). Trade liberalization, exit and productivity improvements: evidence from Chilean plants.
Review of Economic Studies, 69(1), 245–276.
Schiff, M. & Wang, Y. (2006). North-South and South-South trade-related technology diffusion: an industry-
level analysis of direct and indirect effects. Canadian Journal of Economics, 39(3), 831-44.
Stevens, C., & Kennan, J. (2006). How to identify the trade impact of China on small countries. In R. Kaplinsky
(Ed.), Asian drivers: opportunity and threat. Special issue of IDS Bulletin.
Uche E. Ofodile, (2013) Africa-China Bilateral Investment Treaties: A critique. Journal of International Law
131(1).
UNCTAD (2012). Technology and Innovation Report – Innovation, Technology and South South Collaboration.
Geneva: United Nations Conference on Trade and Development.
Van Beveren, I. (2010). Total Factor Productivity Estimation: A Practical Review. Journal of Economic Surveys,
Wang, J.-Y., and Blomström, M. 1992. Foreign investment and technology transfer: A simple model. European
Economic Review 36: 137-155.
World Bank (2004). Patterns of Africa–Asia trade and investment potential for ownership and partnership. New
York: World Bank.
Wooldridge, J.M. (2009) On estimating firm-level production functions using proxy variables to control for
unobservables. Economics Letters 104(3): 112–114.

25
Appendix A: computing the outputs of each industries in the sample
This section explains how the outputs for each industry during the period under survey were
constructed. Computing the trade intensity at the industry-level, which is the ratio of trade
volume at each industry in the total industrial output of the corresponding industry, will need
the aggregated outputs for each industry. However, only data for the year of 2003 were
found.19
Given the limited data sources, we will use the UN Industrial Production Index (IPI)
obtained from the Ghana statistic service to calculate the outputs of each industry for other
years.
Comparing to using the aggregated outputs of all industries, adopting the ratio of trade
volumes in industrial-level outputs will efficiently remove the bias caused by ignoring the
weights of each industry in the total manufacturing sectors. With the UN Industrial
Production Index during 1990-2008 and the industrial-level outputs in 2003, calculating the
aggregated outputs for each industry becomes possible.
Converting industrial production index (IPI) to industrial output volume (1990-2008)
The UN Industrial Production Index is defined as the change in quantities (or volumes) of a
specified basket of goods and services valued at the prices of the reference period 0, the
computation of IPI is given as:
𝐼𝑃𝐼𝑖,𝑡 =∑ 𝑝𝑖,0𝑞𝑖,𝑡𝑖
∑ 𝑝𝑖,0𝑞𝑖,0𝑖=
𝑂𝑢𝑡𝑝𝑢𝑡𝑖,𝑞𝑢𝑎𝑛𝑡𝑖𝑡𝑦 𝑡,𝑝𝑟𝑖𝑐𝑒 0
𝑂𝑢𝑡𝑝𝑢𝑡𝑖,𝑞𝑢𝑎𝑛𝑡𝑖𝑡𝑦 0,𝑝𝑟𝑖𝑐𝑒 0
where pi,0 denotes prices of products for industry i at the base period 0. qi,0 denotes quantity
of products for industry i at the base period 0 whereas qi,t is quantity for industry i at period t.
The aim here is to calculate the aggregate output for industry i at price t. First, we convert the
‘Outputi,q=2003, p=2003’ at the 2003 price into the base year, 1977 price20
(Outputi,q=2003,
p=1977), then the ‘Outputi, quantity 0, price 0’ will be computed based on the ‘IPIi,2003 and
‘Outputi, quantity 2003, price 1977’.
𝑂𝑢𝑡𝑝𝑢𝑡𝑖,𝑞=1977,𝑝=1977 =𝑂𝑢𝑡𝑝𝑢𝑡𝑖,𝑞=2003,𝑝=1977
𝐼𝑃𝐼𝐼,𝑡=2003
Second, with ‘IPIi,t’and ‘Outputi, q=1977, p=1977’, ‘Outputi, q=t, p=1977’ can be
calculated as:
𝑂𝑢𝑡𝑝𝑢𝑡𝑖,𝑞=𝑡,𝑝=1977 = 𝐼𝑃𝐼𝑖,𝑡 × 𝑂𝑢𝑡𝑝𝑢𝑡𝑖,𝑞=1977,𝑝=1977
19
The value added 2003 data at industry-level can be found in the UNIDO database. It is the only year that
available for Ghana. http://www.unido.org/en/resources/statistics/statistical-databases.html 20
1997 was chosen as base year because it was given as the reference year in the data obtained from Ghana
Statistic Service.

26
Last, ‘Outputi, quantity t, price t’ can be obtained by taking into account the inflation rates of
each year and the currency will be converted to US dollar.
Industrial outputs if each sample industry (2008-2013)
However, the IPI were only available to the year of 2008. For the following years, we have
adopted another method to compute the industrial outputs. A gross value output of
manufacturing for each industry was obtained from The Ghana Statistic Service. It was given
in quarterly from 2006 to 2014 and only included data on sampled firms. This means not all
the firms in the manufacturing sector were covered. With such given information, we are able
to calculate the outputs in after 2008 by taking into account the growth ratios of industrial
outputs of sampled firms.
𝑂𝑢𝑡𝑝𝑢𝑡𝑖,𝑡 = 𝑂𝑢𝑡𝑝𝑢𝑡𝑖,𝑡−1 × {1 +(𝑂𝑢𝑡𝑝𝑢𝑡𝑠𝑎𝑚𝑝𝑙𝑒 𝑖,𝑡 − 𝑂𝑢𝑡𝑝𝑢𝑡𝑠𝑎𝑚𝑝𝑙𝑒 𝑖,𝑡−1)
𝑂𝑢𝑡𝑝𝑢𝑡𝑠𝑎𝑚𝑝𝑙𝑒 𝑖,𝑡−1}
‘Outputi, t’ denotes the outputs of industry i in year t (t ≥ 2009) and ‘Outputsample i, t’
denotes the outputs of industry i with sampled firms in year t. ‘Outputsample i, t’ is
proportional to ‘Outputi, t’ and such computation requires that ‘Outputsample i, t’ will well
represent ‘Outputi, t’.