Embed Size (px)
Citation preview

TMSI/IDM/SISMER Sept 2000
SISMERSISMER Systèmes d’Informations Scientifiques pour la Mer
F-NODC
Quality Control Procedure at IFREMER
Argo data management meeting
Brest 03-05/10/2000

2
Quality Checks : Automatic + Visual
QC0 : Format, Codes, Completeness of Information
QC1 : Date, Time, Location, Duplicates
QC2 : Data PointsResult : Elimination or Quality Flag from GTSPP Scale
References UNESCO/COI/IODE : Manual of Quality Control Procedures for validation of
Oceanographic Data - Manuals and Guides 26 - (GTSPP chapter) ICES -GETADE Formatting Guidelines for Oceanographic Data Exchange
(http://www.ices.dk/ocean/) ICES -MDM QA Guidelines - CTD - Marine Data Management working Group (CIEM)
Reports UNESCO/IOC/IODE : GF3 A General Formatting System for Geo-Referenced Data -
Manual and Guides 17
0 1 2 3 4 5 9
No QC Correct Inconsistent Doubtful Bad Changed Missing

3
QC0 - FORMATS, CODES, INFORMATION
Check of Meta-Data/Information : RDBS - ORACLE
Present Input Format for full QC : autodescriptive ASCII (MEDATLAS) NetCDF (in preparation) Other input formats (Via conversion interfaces)

4
QC1 Control of the location and Date - Data collected in station
Automatic Checks Results - Flag
Duplicate data sets EliminationDate Elimination or 5
Ship/Platform velocity Elimination or 5
Location/shoreline Elimination or 5
Bottom sounding (ETOPO5) Elimination or 3
5 = Correction/Interpolation 3 = doubtfull depth

5
QC2 - Control of the Data points
Automatic Checks
Results/Flag Pressure record only Elimination
Out of the regional scale 4
(min & max values)
Non Increasing pressure 4
Data below the bottom depth 4
Coherence with pre-existing statistics
(LEVITUS, REYNAUD, MEDATLAS) 2
Constant profiles 4
Spikes - Gradient 3
Vertical instability > noise 4

6
QC2 - Control of the Data pointsMinimum & Maximum - Broad Range Check
0
200
2000
6000

7
QC2 - Control of the Data pointsRegional Adjustment for Broad Range Checks

8
QC2- Vertical Stability Check
Threshold noise for instability detection 0.03 in sigma-t for high resolution deep water
stations 0.05 to 0.1 for coastal or low resolution stations
4 data points to be checked : 2 levels T, S Automatic seach for further anomaly
if any flag=4 at this point if none flag=4 at the 4 points and manual
decision

9
QC2 - Spike and Gradient Checks
On 2 consecutive points at the top and bottom
On 3 consecutive points in between
Threshold for detection adjustable in geographical
subregions and vertical layers

10
QC2- Climatological Checks
Several available climatologies : Levitus 94, 98, Reynaud, Medatlas, MODB
Default Climatology is Levitus 98 1x1 degree Allowed Variability
Shallow water stations bottom < 100 m : 5 standard deviations
Shelf Stations 200< bottom < 400 : 4 standard deviations
Deep Stations bottom > 400 m : 3 standard deviations

11
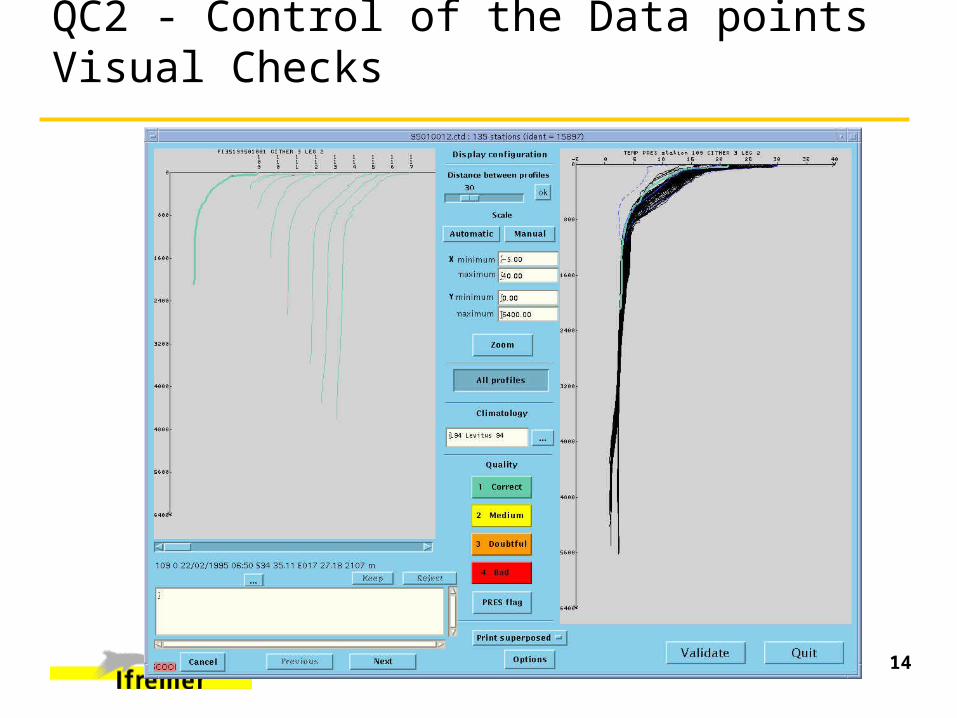
Visual Checks
Check of the Internal Coherence QC1 : Check of the route or trajectory QC2 : Internal coherence of the values and search for shifts or
gaps Check of the External Coherence
QC1 : Display of all the profiles of another cruise/trajectory if at least one station is in the space/time vicinity
QC2 : Possibility of superposing the profiles made during another experiment in the same region
Removing Doubts Vertical intabilities Spikes Climatological test (Erroneous climatological standard deviations)

12
QC1 Control of the location and Date VISUAL CHECKS - Data collected in station

13
QC1: Control of the location and Date - Time series on fixed mooring
14
QC2 - Control of the Data pointsVisual Checks

15
QC2 - Control of the Data pointsVisual Checks - case of problematic climatology