Embed Size (px)
Citation preview
Southern Africa Soy Roadmap –Zimbabwe value chain analysisNovember 2010 – February 2011
00
• The disruption of 70% of all non-communal agricultural land and extreme economic decline led to 58% decrease in agricultural production from 2000 to 2010
• Land reform disrupted most commercial farming in the country during the 2000’s• The economic decline that led to hyperinflation dissipated liquidity, creating a situation where credit is mostly non-existent or too expensive for agricultural production
• Without demand for inputs (due to lack of credit), the input supply chain disappeared (although it is re-gaining strength, partly due to NGO support) and a lack of financing also prevented investment in crucial infrastructure (e.g., Irrigation systems)
• As a result of the decline in agricultural production, Zimbabwe’s soy demand far outstrips its production, with demand at 125K MT per annum and production at 50K MT per annum
• The current market is met with imports of oil from South Africa, beans and cake from Zambia, beans from Malawi, and (recently) cake from India
• Both small and commercial farmers can produce for under $300/MT, which is competitive against the current
Executive Summary (1/2)
11
• Both small and commercial farmers can produce for under $300/MT, which is competitive against the current import parity for non-GMO cake of $730/MT (and would be competitive against GMO cake, which is usually around 10% cheaper than non-GMO, although more easily available)
• Most of the production in Zimbabwe occurs in the areas surrounding Harare, the major processing center• Processing capacity is at 460K MT but current utilization is at 16%; two of the four major processing plants are
therefore mothballed because of a lack of supply of soybean• Surface Investments is one of the most sophisticated processors in the region, with a production cost of $40-
50/MT• Growth of the livestock industry (especially poultry and fish, driven by low cost of and preference for white
protein over beef, continued presence of large producers and shorter financing cycle) is being constrained by the lack of supply of soya meal

• Soy production has declined from 171K MT in 2001 due to the decline of commercial farming, and a lack of financing and agronomy training, but traders are seeing a trend of smallholders substituting soy for maize because of the current high prices
• Commercial farmers produce 65% of production, while smallholders produce 35% of production (previously this breakdown was 90%/10%)
• There enough land available to meet demand as most of the land previously planted with soy remains unused• There is sufficient supply of inputs, but farmers (both smallholder and commercial) lack financing to obtain them• Farmers in Zimbabwe are educated and sophisticated and can farm soy effectively given credit, inputs and
training• While smallholders can help increase production, medium-sized and commercial farmers will need to increase
production if Zimbabwe is to meet future soyabean demand through domestic production in the short-medium term
• While private investment is unlikely to return in sufficient amounts to finance soy production in the near-
Executive Summary (2/2)
22
• While private investment is unlikely to return in sufficient amounts to finance soy production in the near-term, financing could be provided by industry players through a contract farming model which would also provide an avenue for skill transfer
• In the short-term, the re-establishment of a national soy association could allow industry players to agree on a coordinated approach for increasing production
• Increasing small-farmer production and yields and utilizing university and agricultural research land for soy growing could reduce the gap in production
• Strengthening agricultural extension services will help farmers gain increased yields• In the medium-term, non-communal farmers – who occupy the majority of soy-growing land – may have a
significant role to play• There is the potential to increase the incomes of 35k smallholders by $138 p.a.
• In addition, increased soy production will enable faster growth of livestock and processing industries, creating additional jobs in these sectors

•Zimbabwe only produces ~30% of its demand for soy, but considerable scope exists for growth of production
•Background
• Production
•Demand
• Trade
•Despite strong market demand, sophisticated processing capabilities and capacity, and the ability for commercial farmers to grow soy competitively, the soy industry is held back by a lack of financing and land complexities
Agenda
33
complexities
•Opportunities for near-term actions to improve production exist, but full production capacity will likely only be unleashed over a longer time horizon, as key macro issues such as liquidity and land ease or are resolved
• There is the potential to increase the incomes of 35k smallholders by $138 p.a.
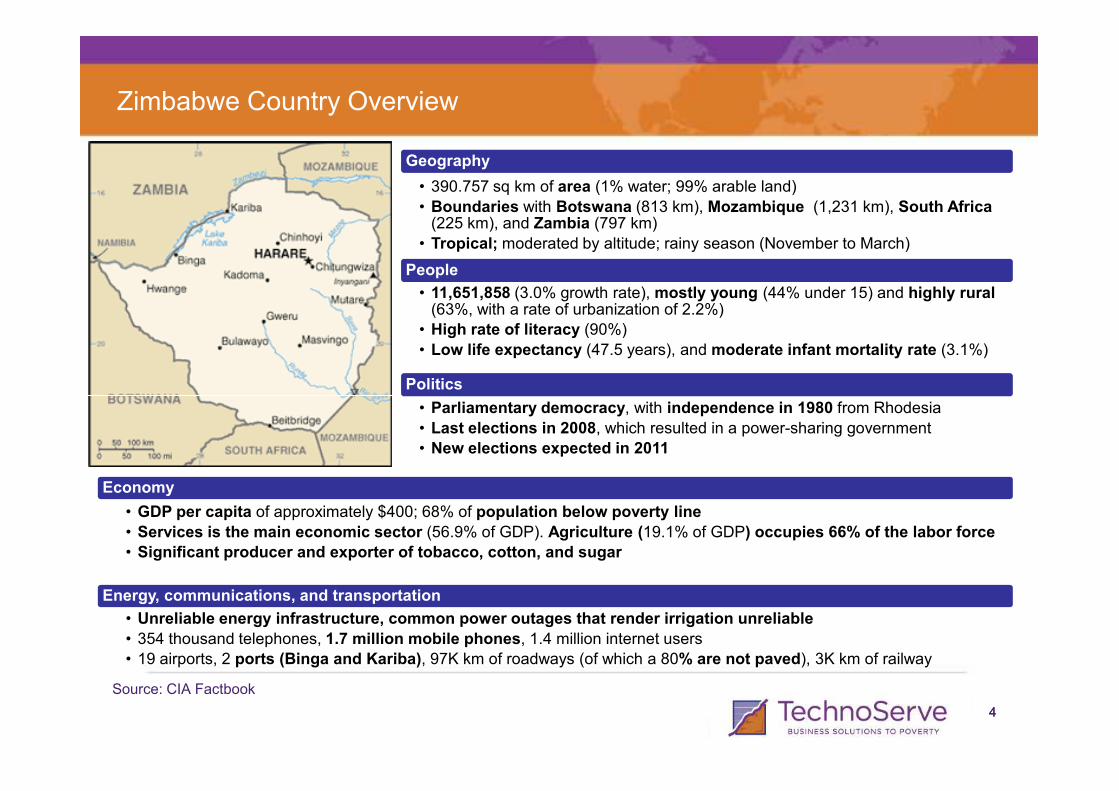
Geography
• 390.757 sq km of area (1% water; 99% arable land)
• Boundaries with Botswana (813 km), Mozambique (1,231 km), South Africa (225 km), and Zambia (797 km)
• Tropical; moderated by altitude; rainy season (November to March)
People
• 11,651,858 (3.0% growth rate), mostly young (44% under 15) and highly rural (63%, with a rate of urbanization of 2.2%)
• High rate of literacy (90%)
• Low life expectancy (47.5 years), and moderate infant mortality rate (3.1%)
Politics
Zimbabwe Country Overview
44
• Parliamentary democracy, with independence in 1980 from Rhodesia
• Last elections in 2008, which resulted in a power-sharing government
• New elections expected in 2011
Source: CIA Factbook
Economy
• GDP per capita of approximately $400; 68% of population below poverty line
• Services is the main economic sector (56.9% of GDP). Agriculture (19.1% of GDP) occupies 66% of the labor force
• Significant producer and exporter of tobacco, cotton, and sugar
Energy, communications, and transportation
• Unreliable energy infrastructure, common power outages that render irrigation unreliable
• 354 thousand telephones, 1.7 million mobile phones, 1.4 million internet users
• 19 airports, 2 ports (Binga and Kariba), 97K km of roadways (of which a 80% are not paved), 3K km of railway
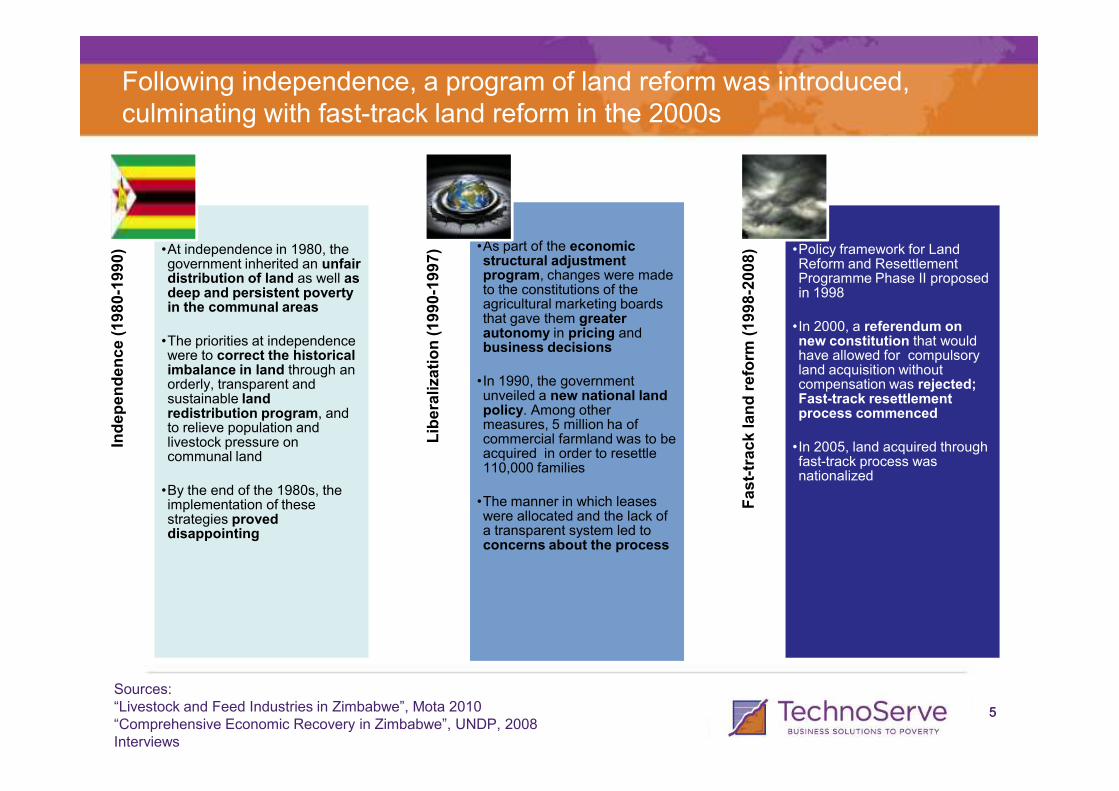
Following independence, a program of land reform was introduced, culminating with fast-track land reform in the 2000s
Independence (1980-1990) •At independence in 1980, the
government inherited an unfair distribution of land as well as deep and persistent poverty in the communal areas
•The priorities at independence were to correct the historical imbalance in land through an orderly, transparent and sustainable land
Liberalization (1990-1997) •As part of the economic
structural adjustment program, changes were made to the constitutions of the agricultural marketing boards that gave them greater autonomy in pricing and business decisions
•In 1990, the government unveiled a new national land
track land reform
(1998-2008) •Policy framework for Land
Reform and Resettlement Programme Phase II proposed in 1998
•In 2000, a referendum on new constitution that would have allowed for compulsory land acquisition without compensation was rejected; Fast-track resettlement
55
Independence (1980
sustainable land redistribution program, and to relieve population and livestock pressure on communal land
•By the end of the 1980s, the implementation of these strategies proved disappointing
Liberalization (1990
unveiled a new national land policy. Among other measures, 5 million ha of commercial farmland was to be acquired in order to resettle 110,000 families
•The manner in which leases were allocated and the lack of a transparent system led to concerns about the process
Fast-track land reform
(1998
Fast-track resettlement process commenced
•In 2005, land acquired through fast-track process was nationalized
Sources: “Livestock and Feed Industries in Zimbabwe”, Mota 2010“Comprehensive Economic Recovery in Zimbabwe”, UNDP, 2008Interviews
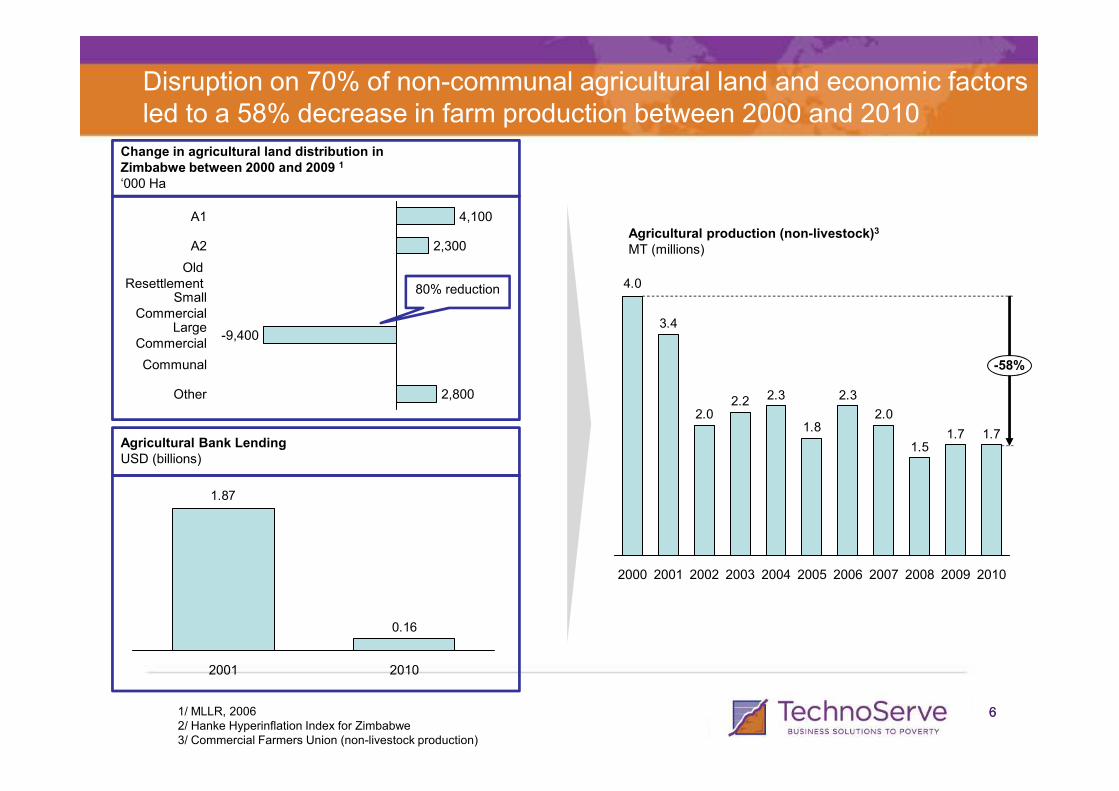
Disruption on 70% of non-communal agricultural land and economic factors led to a 58% decrease in farm production between 2000 and 2010
Change in agricultural land distribution in Zimbabwe between 2000 and 2009 1
‘000 Ha
-9,400
Agricultural production (non-livestock)3
MT (millions)
Other 2,800
Communal
LargeCommercial
-9,400
SmallCommercial
Old Resettlement
A2 2,300
A1 4,100
80% reduction
2.32.32.2
3.4
4.0
-58%
661/ MLLR, 20062/ Hanke Hyperinflation Index for Zimbabwe3/ Commercial Farmers Union (non-livestock production)
Other 2,800
0.16
1.87
2001 2010
Agricultural Bank LendingUSD (billions)
1.71.71.5
2.0
2.3
1.8
2.32.22.0
20102009200820072006200520042003200220012000
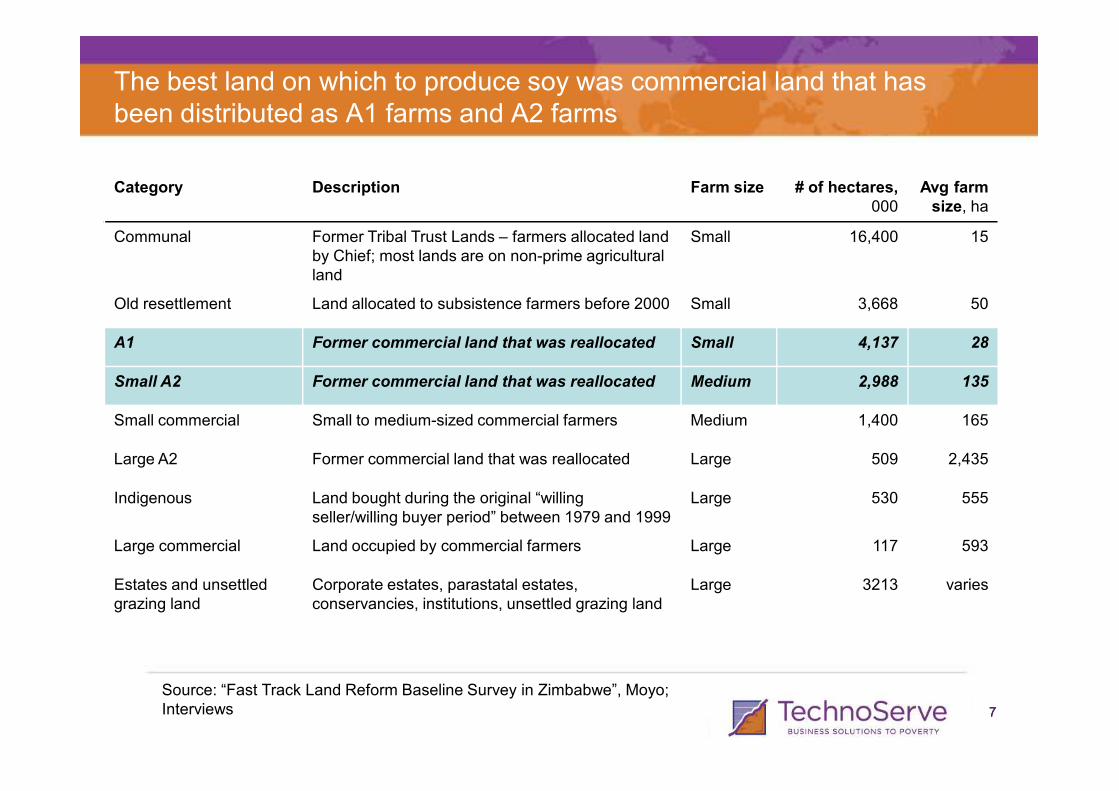
The best land on which to produce soy was commercial land that has been distributed as A1 farms and A2 farms
Category Description Farm size # of hectares,000
Avg farmsize, ha
Communal Former Tribal Trust Lands – farmers allocated land by Chief; most lands are on non-prime agricultural land
Small 16,400 15
Old resettlement Land allocated to subsistence farmers before 2000 Small 3,668 50
A1 Former commercial land that was reallocated Small 4,137 28
Small A2 Former commercial land that was reallocated Medium 2,988 135
77
Small commercial Small to medium-sized commercial farmers Medium 1,400 165
Large A2 Former commercial land that was reallocated Large 509 2,435
Indigenous Land bought during the original “willing seller/willing buyer period” between 1979 and 1999
Large 530 555
Large commercial Land occupied by commercial farmers Large 117 593
Estates and unsettledgrazing land
Corporate estates, parastatal estates, conservancies, institutions, unsettled grazing land
Large 3213 varies
Source: “Fast Track Land Reform Baseline Survey in Zimbabwe”, Moyo; Interviews

Maize and cash crops currently dominate Zimbabwe; tobacco, cotton and sugar are the main cash crops
8%
Barley
2%
Soya2%Groundnuts
3%Sorghum
5%
Tobacco
4%
Other
Maize
Main crops produced, 2010100%=1.7 million MT
Main staple crop
Non-livestock agricultural production breakdown, %
16 20
6
Traditional Export Crops
9
15
3,989k MT
Oil Seeds
17
1,668k MT
Plantation & Industrial Exports
88
Source: Commercial Farmers Union (CFU)
49%
Cotton 9%
Sugar
18%
Main cash cropsMain cash cropsMain cash crops
60 57
20102000
Grain and Cereals
• Staples lost share to traditional export crops (tobacco and cotton) and sugar
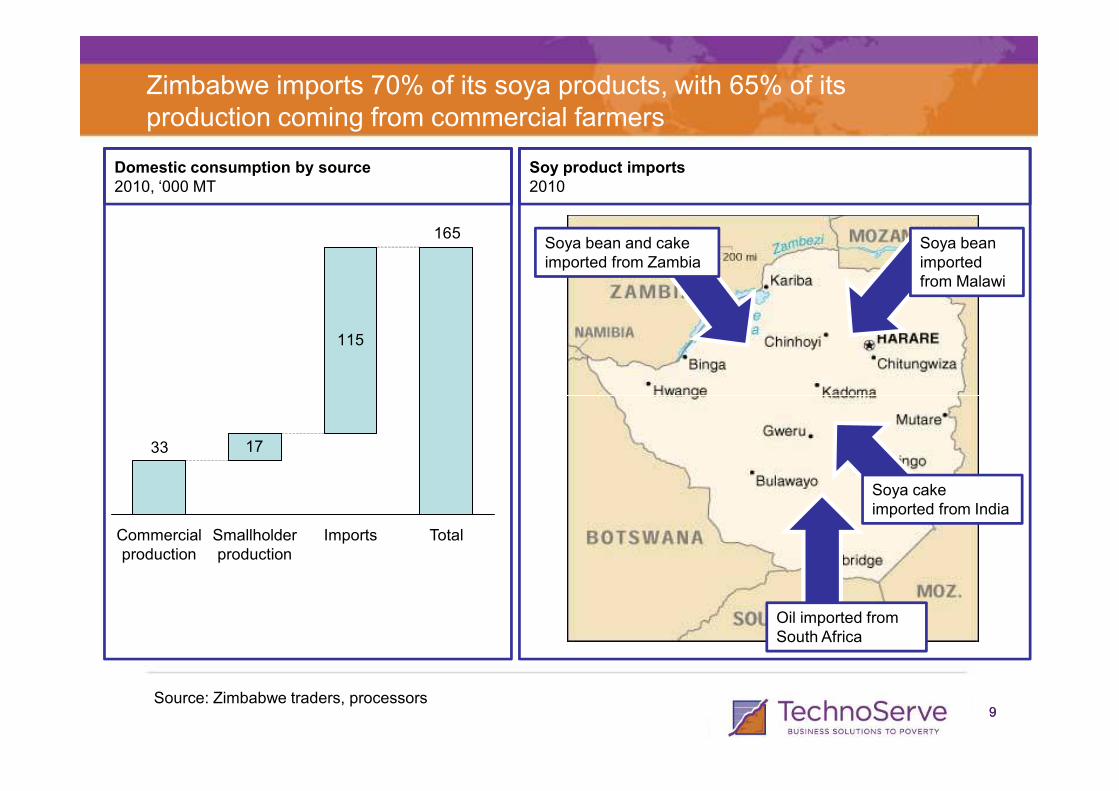
Zimbabwe imports 70% of its soya products, with 65% of its production coming from commercial farmers
Domestic consumption by source2010, ‘000 MT
165
115
Soy product imports2010
Soya bean and cake imported from Zambia
Soya bean imported from Malawi
99Source: Zimbabwe traders, processors
1733
Commercial production
TotalSmallholder production
Imports
Soya cake imported from India
Oil imported from South Africa
•Zimbabwe only produces ~30% of its demand for soy, but considerable scope exists for growth of production
• Background
•Production
• Demand
• Trade
•Despite strong market demand, sophisticated processing capabilities and capacity, and the ability for commercial farmers to grow soy competitively, the soy industry is held back by a lack of financing and land complexities
Agenda
1010
complexities
•Opportunities for near-term actions to improve production exist, but full production capacity will likely only be unleashed over a longer time horizon, as key macro issues such as liquidity and land ease or are resolved
• There is the potential to increase the incomes of 35k smallholders by $138 p.a.
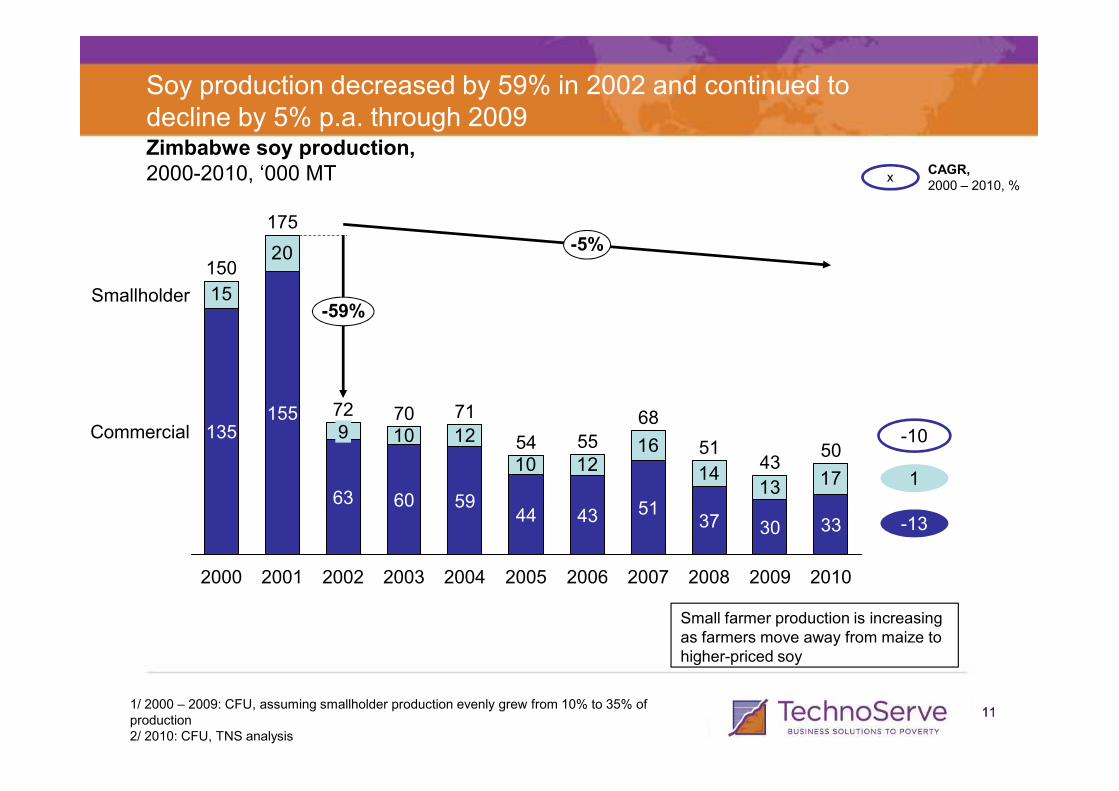
Soy production decreased by 59% in 2002 and continued to decline by 5% p.a. through 2009
CAGR, 2000 – 2010, %
15
20
175
-59%
-5%
150
Smallholder
Zimbabwe soy production,2000-2010, ‘000 MT x
11111/ 2000 – 2009: CFU, assuming smallholder production evenly grew from 10% to 35% of production2/ 2010: CFU, TNS analysis
Small farmer production is increasing as farmers move away from maize to higher-priced soy
12
1216
1413 17
10
10
2003
9
2004
72 70
20062005 20082007 2010
71
54
2000 2001 2002 2009
60
55
63
68155
51135
43
Commercial50
5944 43 51
37 30 33 -13
1
-10
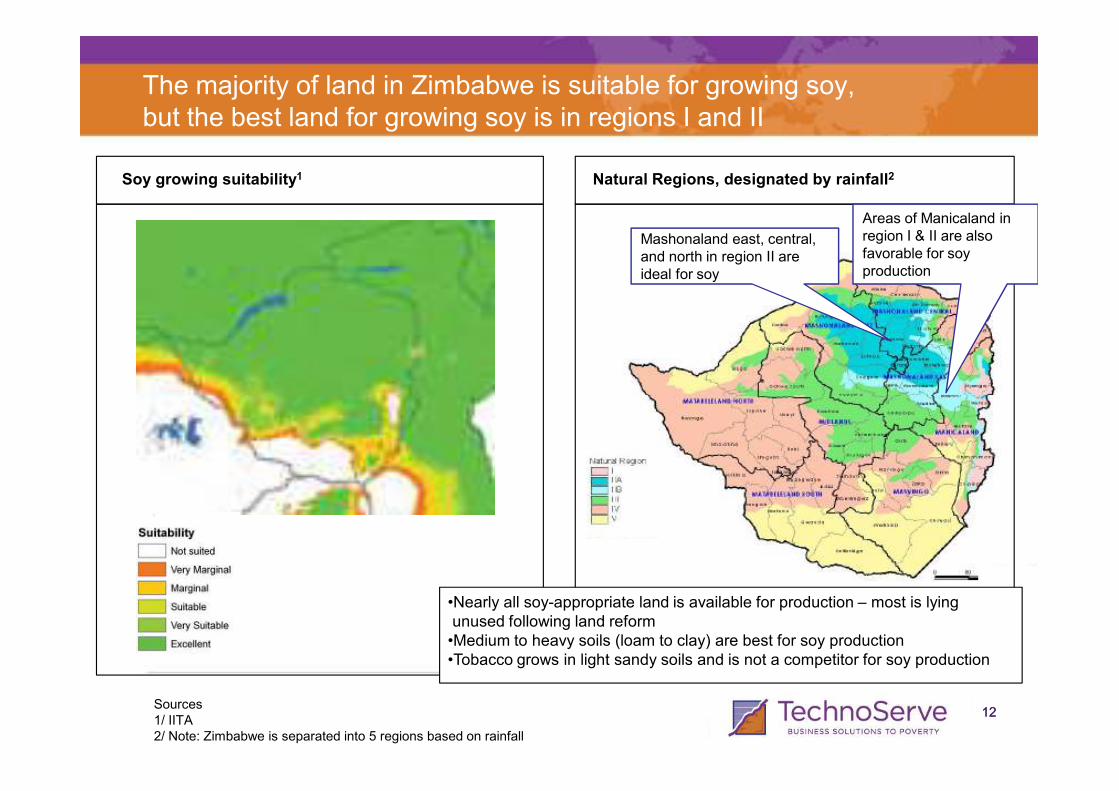
The majority of land in Zimbabwe is suitable for growing soy, but the best land for growing soy is in regions I and II
Soy growing suitability1 Natural Regions, designated by rainfall2
Mashonaland east, central, and north in region II are ideal for soy
Areas of Manicaland in region I & II are also favorable for soy production
1212Sources1/ IITA2/ Note: Zimbabwe is separated into 5 regions based on rainfall
•Nearly all soy-appropriate land is available for production – most is lying unused following land reform•Medium to heavy soils (loam to clay) are best for soy production•Tobacco grows in light sandy soils and is not a competitor for soy production
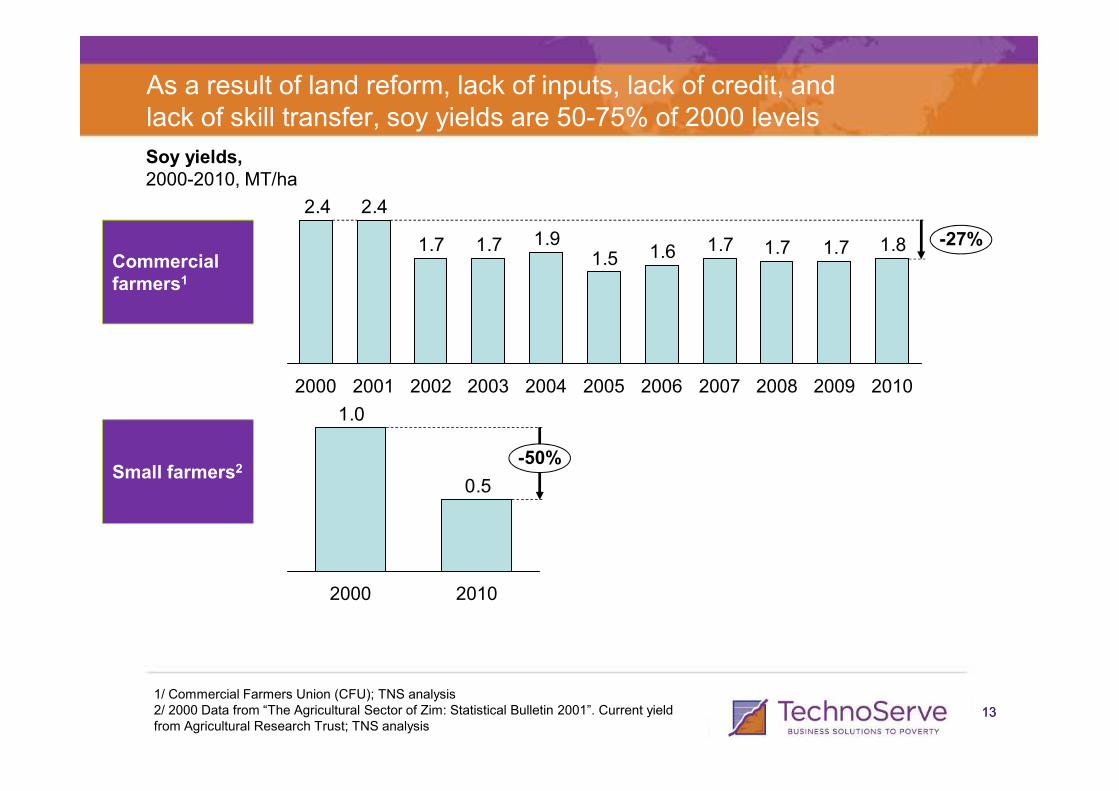
As a result of land reform, lack of inputs, lack of credit, and lack of skill transfer, soy yields are 50-75% of 2000 levels
Soy yields,2000-2010, MT/ha
Commercial farmers1
1.81.71.71.71.61.51.91.71.7
2.42.4
-27%
2009200820072006200520042003200220012000 2010
1313
1/ Commercial Farmers Union (CFU); TNS analysis2/ 2000 Data from “The Agricultural Sector of Zim: Statistical Bulletin 2001”. Current yield from Agricultural Research Trust; TNS analysis
Small farmers2
2009200820072006200520042003200220012000 2010
0.5
1.0
-50%
20102000
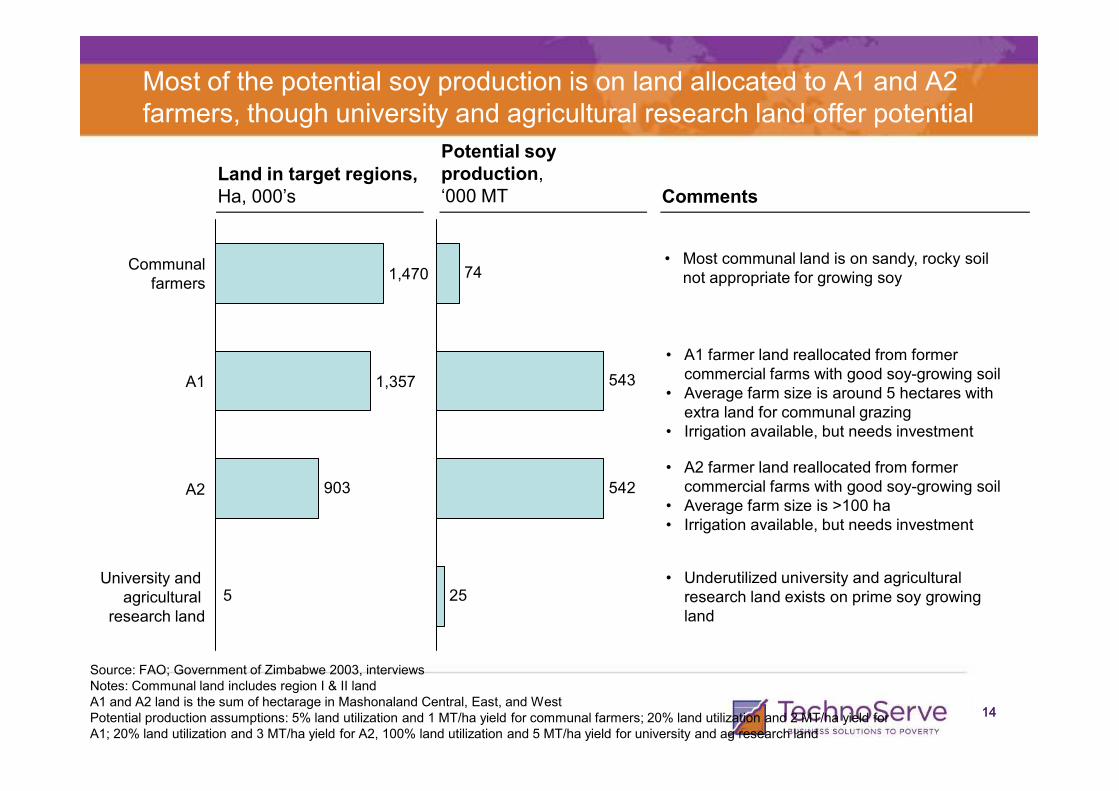
Most of the potential soy production is on land allocated to A1 and A2 farmers, though university and agricultural research land offer potential
• Most communal land is on sandy, rocky soil not appropriate for growing soy
• A1 farmer land reallocated from former commercial farms with good soy-growing soil
• Average farm size is around 5 hectares with
Land in target regions,Ha, 000’s
Potential soy production, ‘000 MT
Communalfarmers
A1
1,470
1,357 543
74
Comments
1414
• Average farm size is around 5 hectares with extra land for communal grazing
• Irrigation available, but needs investment
• A2 farmer land reallocated from former commercial farms with good soy-growing soil
• Average farm size is >100 ha• Irrigation available, but needs investment
Source: FAO; Government of Zimbabwe 2003, interviewsNotes: Communal land includes region I & II landA1 and A2 land is the sum of hectarage in Mashonaland Central, East, and WestPotential production assumptions: 5% land utilization and 1 MT/ha yield for communal farmers; 20% land utilization and 2 MT/ha yield for A1; 20% land utilization and 3 MT/ha yield for A2, 100% land utilization and 5 MT/ha yield for university and ag research land
• Underutilized university and agricultural research land exists on prime soy growing land
5
903A2
University and agricultural
research land
25
542

•Zimbabwe only produces ~30% of its demand for soy, but considerable scope exists for growth of production
• Background
•Production
•Demand
• Trade
•Despite strong market demand, sophisticated processing capabilities and capacity, and the ability for commercial farmers to grow soy competitively, the soy industry is held back by a lack of financing and land complexities
Agenda
1515
complexities
•Opportunities for near-term actions to improve production exist, but full production capacity will likely only be unleashed over a longer time horizon, as key macro issues such as liquidity and land ease or are resolved
• There is the potential to increase the incomes of 35k smallholders by $138 p.a.
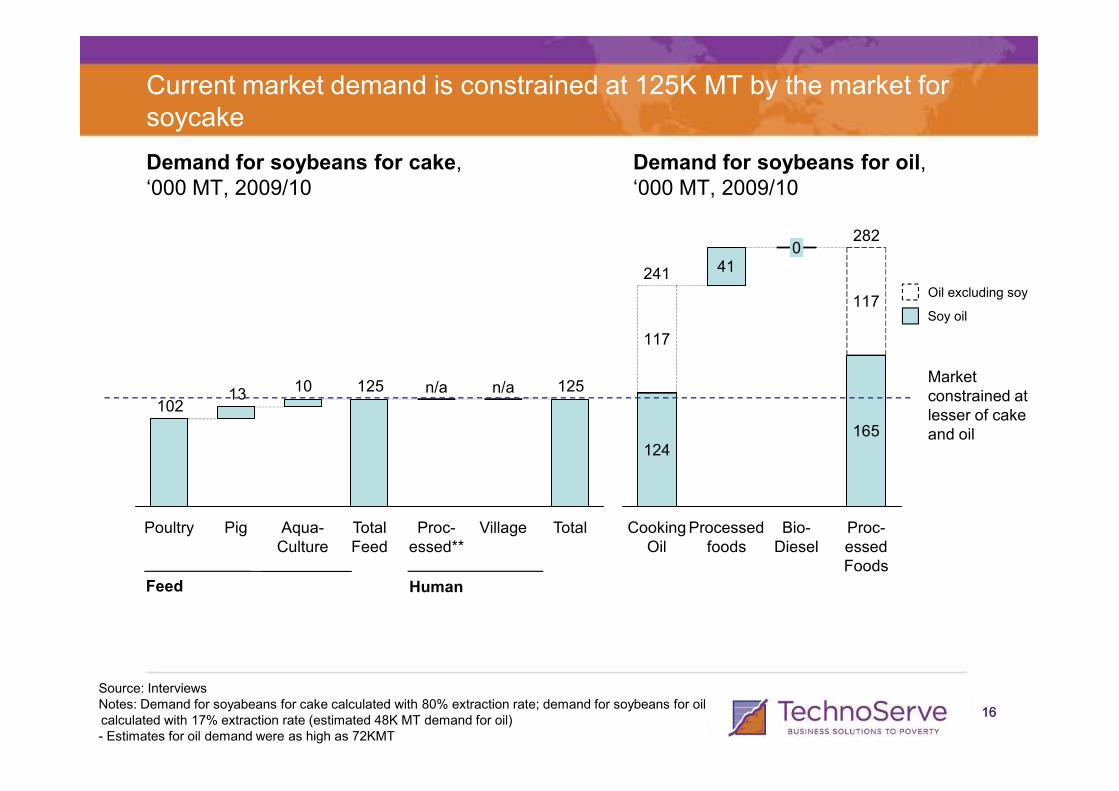
Current market demand is constrained at 125K MT by the market for soycake
Demand for soybeans for cake,‘000 MT, 2009/10
1251251013 n/an/a
Demand for soybeans for oil,‘000 MT, 2009/10
41
117
117
0282
241
Market constrained at
Oil excluding soy
Soy oil
1616
Source: InterviewsNotes: Demand for soyabeans for cake calculated with 80% extraction rate; demand for soybeans for oil calculated with 17% extraction rate (estimated 48K MT demand for oil)- Estimates for oil demand were as high as 72KMT
13102
TotalVillage
n/a
Proc-essed**
n/a
Total Feed
Aqua-Culture
PigPoultry
Feed Human
124165
Processed foods
Bio-Diesel
Proc-essedFoods
CookingOil
constrained at lesser of cake and oil

106
208
102
Market growth is expected to continue, creating a 208K MT market by 2020Projected demand for soybeans,‘000 MT, 2020
International market excluded; potential upside could be even greater
1717
2020 potentialIncrease in domestic market
Current market
Source: TechnoServe analysis
A
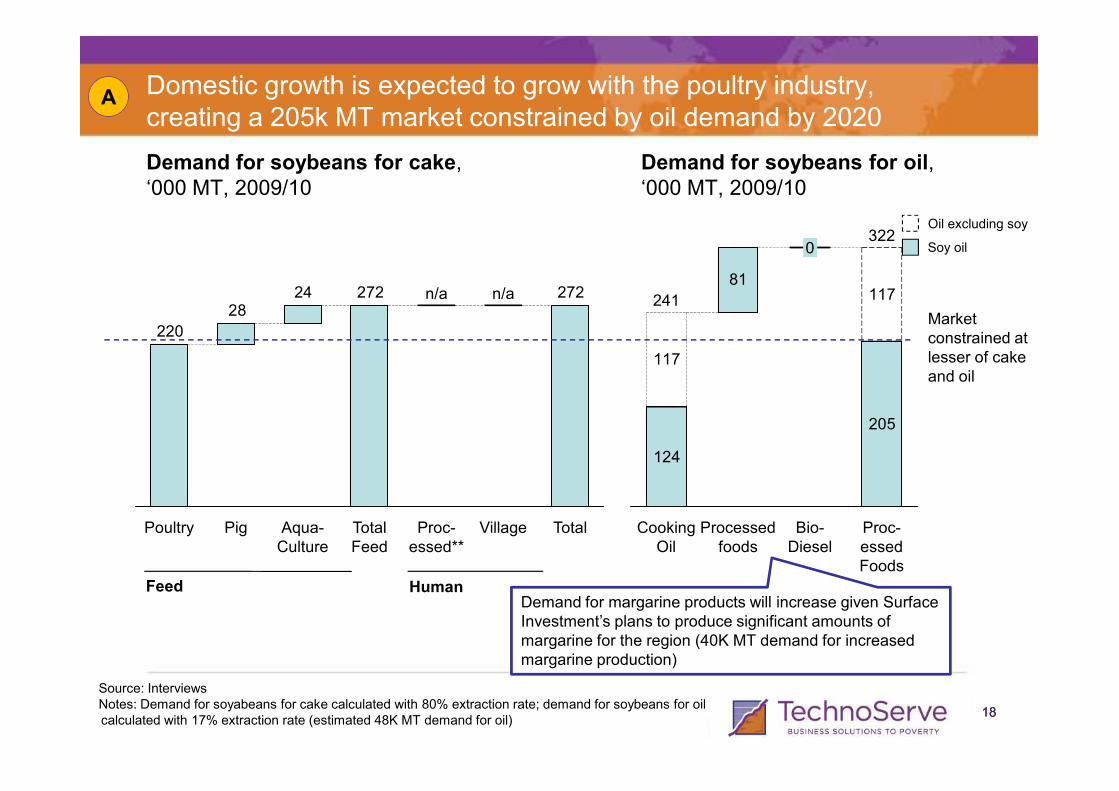
Domestic growth is expected to grow with the poultry industry, creating a 205k MT market constrained by oil demand by 2020
Demand for soybeans for cake,‘000 MT, 2009/10
2722722428
220
n/an/a
Demand for soybeans for oil,‘000 MT, 2009/10
81117
117
3220
241Market constrained at lesser of cake and oil
Oil excluding soy
Soy oil
A
1818
Source: InterviewsNotes: Demand for soyabeans for cake calculated with 80% extraction rate; demand for soybeans for oil calculated with 17% extraction rate (estimated 48K MT demand for oil)
TotalVillageProc-essed**
Total Feed
Aqua-Culture
PigPoultry
Feed Human
124
205
Proc-essedFoods
Bio-Diesel
Processed foods
CookingOil
Demand for margarine products will increase given Surface Investment’s plans to produce significant amounts of margarine for the region (40K MT demand for increased margarine production)
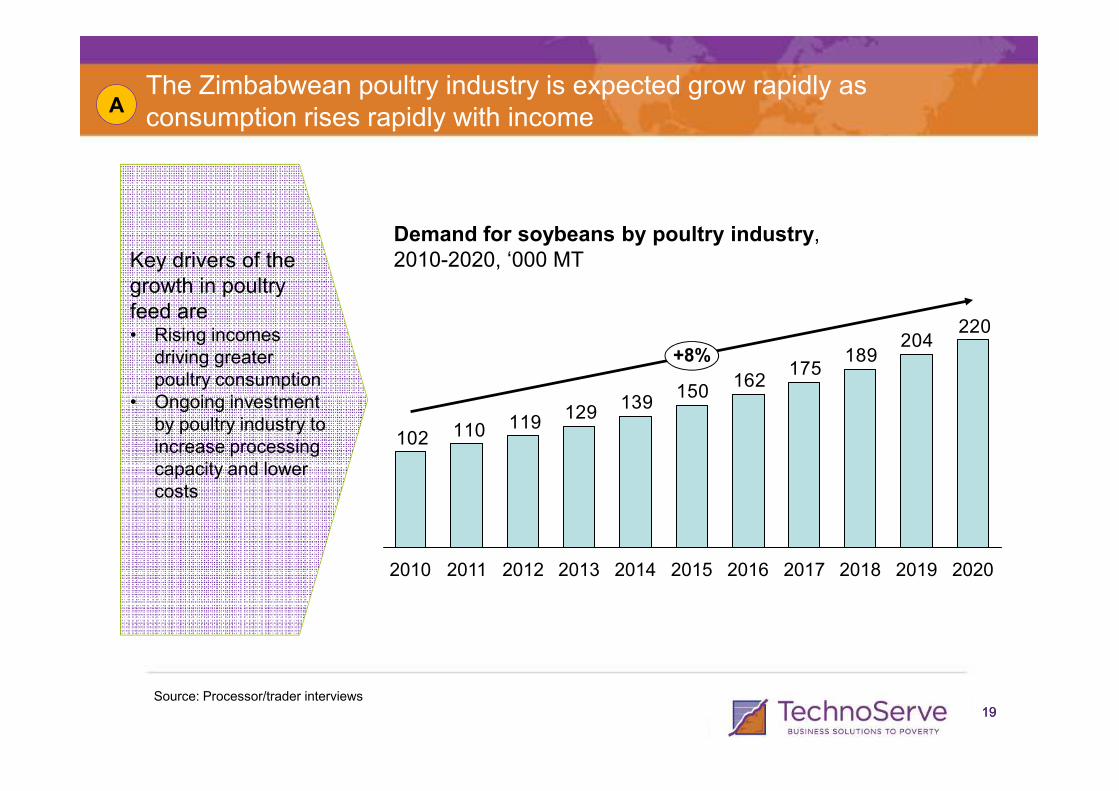
The Zimbabwean poultry industry is expected grow rapidly as consumption rises rapidly with income
A
Key drivers of the growth in poultry feed are• Rising incomes
driving greater poultry consumption
• Ongoing investment
220204
189175
162150
139
+8%
Demand for soybeans by poultry industry,2010-2020, ‘000 MT
1919
• Ongoing investment by poultry industry to increase processing capacity and lower costs
Source: Processor/trader interviews
150139
129119110102
201220112010 20202019201820172016201520142013
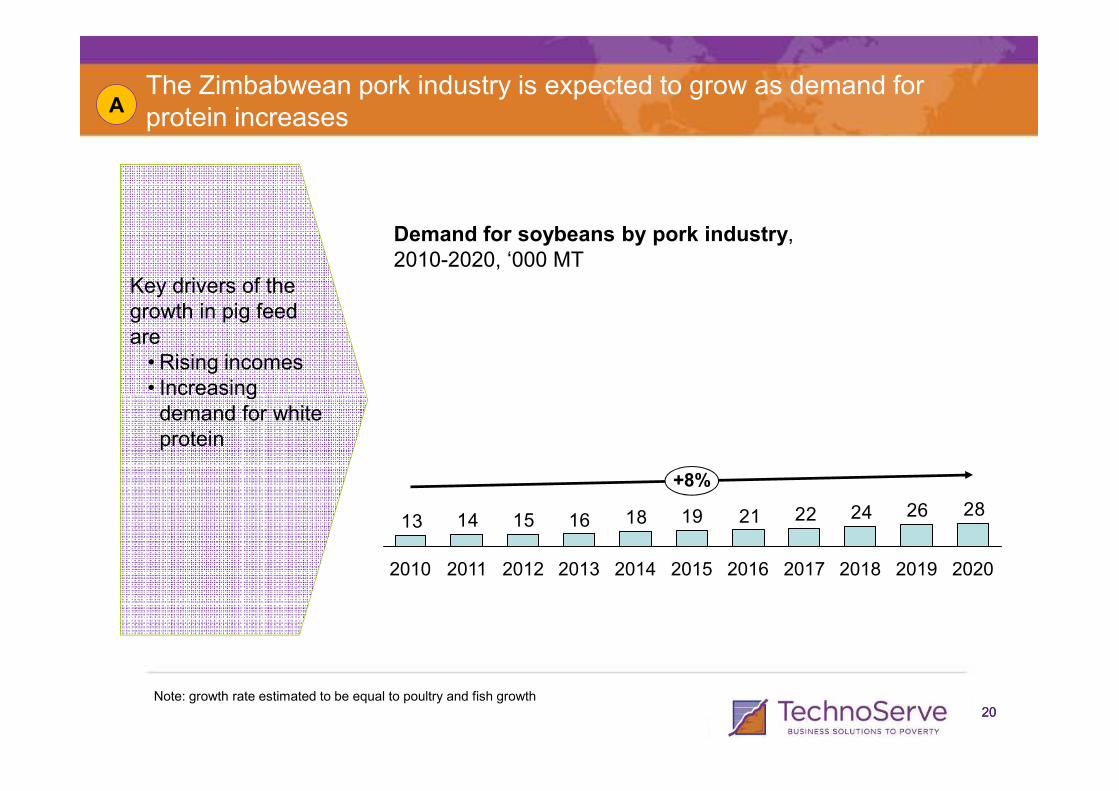
The Zimbabwean pork industry is expected to grow as demand for protein increases
A
Key drivers of the growth in pig feedare
• Rising incomes• Increasing
Demand for soybeans by pork industry,2010-2020, ‘000 MT
2020
• Increasing demand for white protein
Note: growth rate estimated to be equal to poultry and fish growth
2826242221191816151413
+8%
20202019201820172016201520142013201220112010
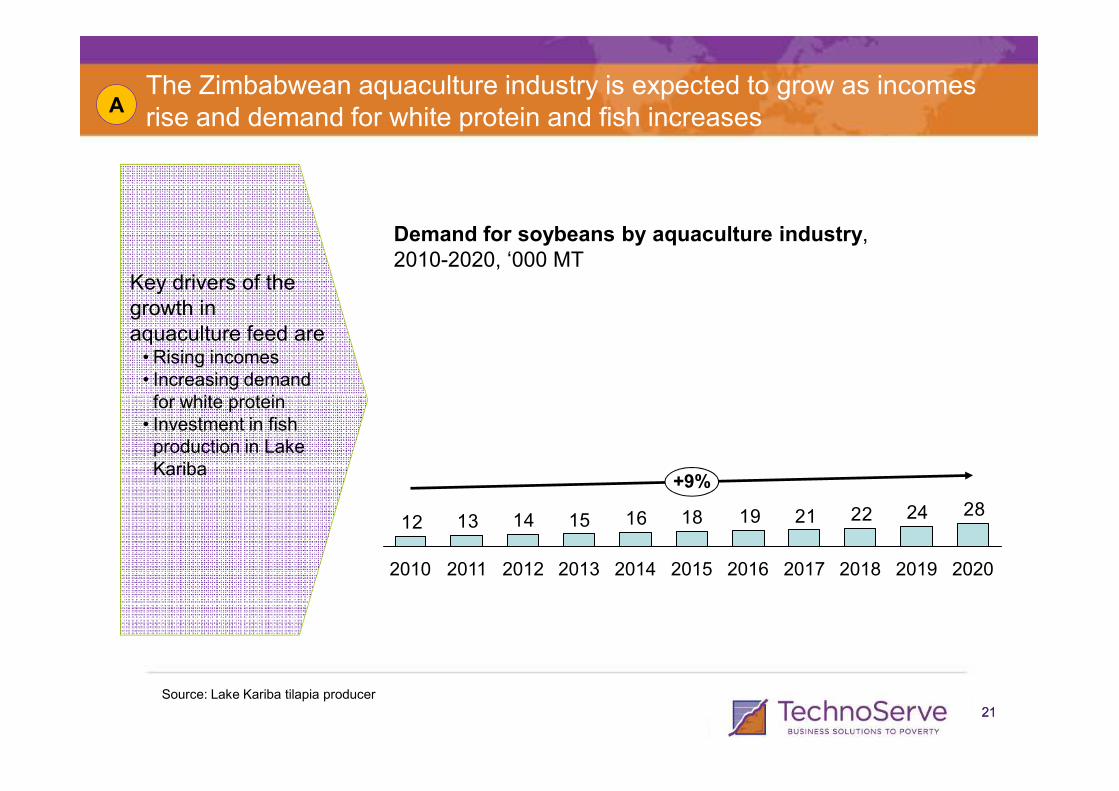
The Zimbabwean aquaculture industry is expected to grow as incomes rise and demand for white protein and fish increases
A
Key drivers of the growth in aquaculture feed are• Rising incomes• Increasing demand for white protein
Demand for soybeans by aquaculture industry,2010-2020, ‘000 MT
2121
for white protein• Investment in fish production in Lake Kariba
Source: Lake Kariba tilapia producer
2824222119181615141312
2018
+9%
2020201920172016201520142013201220112010
•Zimbabwe only produces ~30% of its demand for soy, but considerable scope exists for growth of production
• Background
•Production
•Demand
•Trade
• Despite strong market demand, sophisticated processing capabilities and capacity, and the ability for commercial farmers to grow soy competitively, the soy industry is held back by a lack of financing and land complexities
Agenda
2222
complexities
•Opportunities for near-term actions to improve production exist, but full production capacity will likely only be unleashed over a longer time horizon, as key macro issues such as liquidity and land ease or are resolved
• There is the potential to increase the incomes of 35k smallholders by $138 p.a.

Zimbabwe is currently in a position to import beans to process for cake and in the future, could be a competitive exporter to South Africa
Opportunities for trade
• Zimbabwe is a net importer of soyabeans, cake, and oil• Zimababwe, however, was a net exporter in the early 2000’s• When production increases Zimbabwe is well situated to export to the region
o Zimbabwe’s central location means it is well placed to export to South Africa (soybeans and soy cake)
o Zimbabwe’s sophisticated processing ($40-50 per ton at Surface Investments vs. $120-140 in the region) should allow Zimbabwe to import beans and export cake competitively
2323
Source: Interviews
export cake competitivelyo Zimbabwe also has some of the best highways in the region, allowing for
reliable transportation
• Zimbabwe only produces ~30% of its demand for soy, but considerable scope exists for growth of production
•Despite strong market demand, sophisticated processing capabilities and capacity, and the ability for commercial farmers to grow soy competitively, the soy industry is held back by a lack of financing and land complexities
•Opportunities for near-term actions to improve production exist, but full production capacity will likely only be unleashed over a longer time horizon, as key macro issues such as liquidity and land ease or are resolved
• There is the potential to increase the incomes of 35k smallholders by $138 p.a.
Agenda
2424
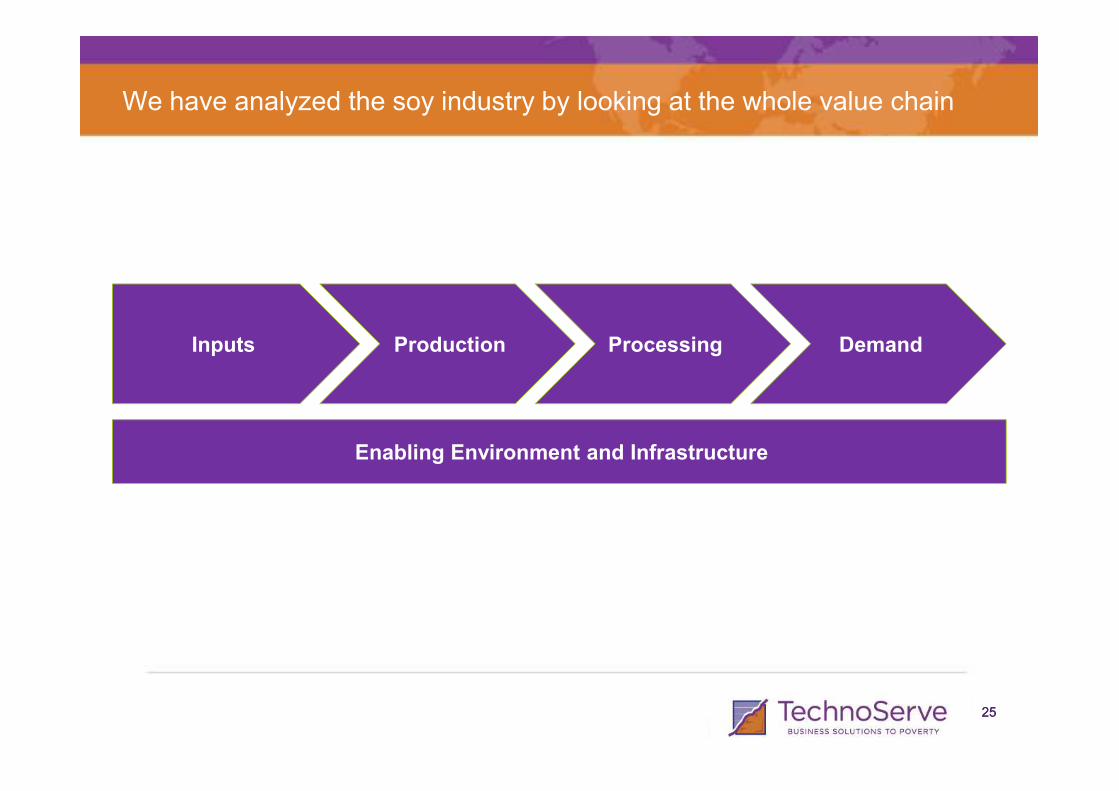
We have analyzed the soy industry by looking at the whole value chain
Inputs Production Processing Demand
2525
Enabling Environment and Infrastructure
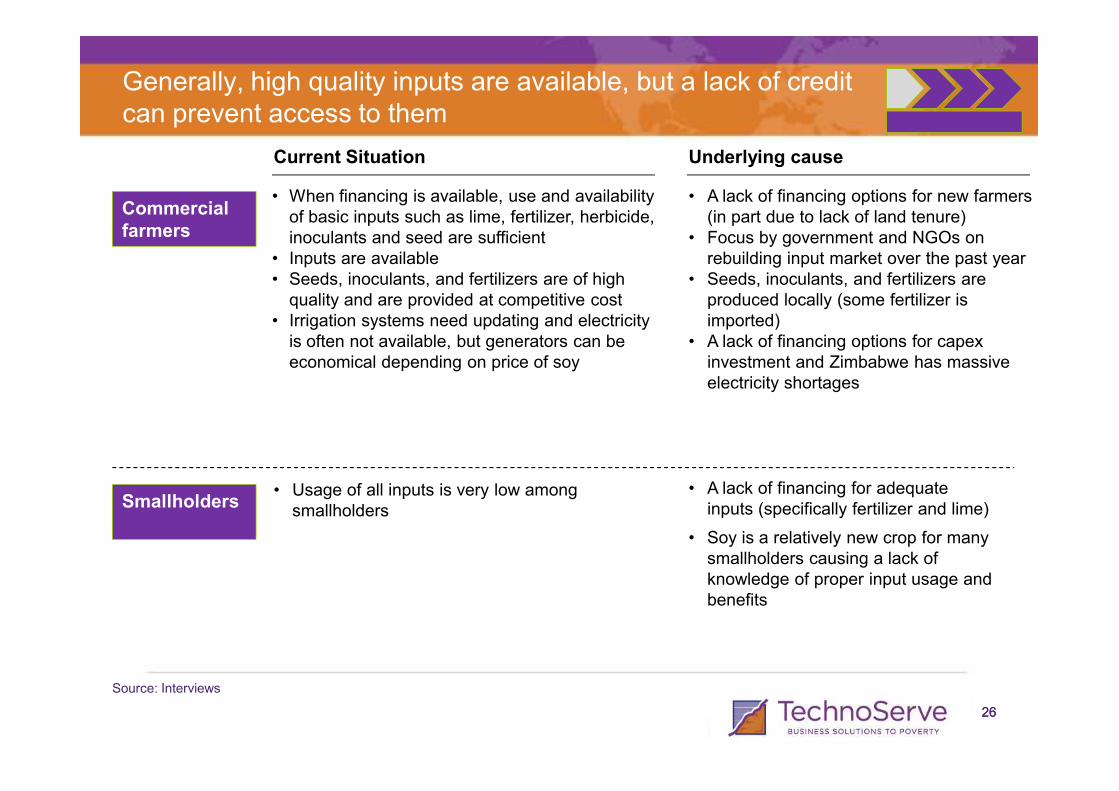
Generally, high quality inputs are available, but a lack of credit can prevent access to them
Commercial farmers
• When financing is available, use and availability of basic inputs such as lime, fertilizer, herbicide, inoculants and seed are sufficient
• Inputs are available• Seeds, inoculants, and fertilizers are of high
quality and are provided at competitive cost• Irrigation systems need updating and electricity
is often not available, but generators can be economical depending on price of soy
• A lack of financing options for new farmers (in part due to lack of land tenure)
• Focus by government and NGOs on rebuilding input market over the past year
• Seeds, inoculants, and fertilizers are produced locally (some fertilizer is imported)
• A lack of financing options for capexinvestment and Zimbabwe has massive electricity shortages
Current Situation Underlying cause
2626
Smallholders• Usage of all inputs is very low among
smallholders
• A lack of financing for adequate inputs (specifically fertilizer and lime)
• Soy is a relatively new crop for many smallholders causing a lack of knowledge of proper input usage and benefits
Source: Interviews
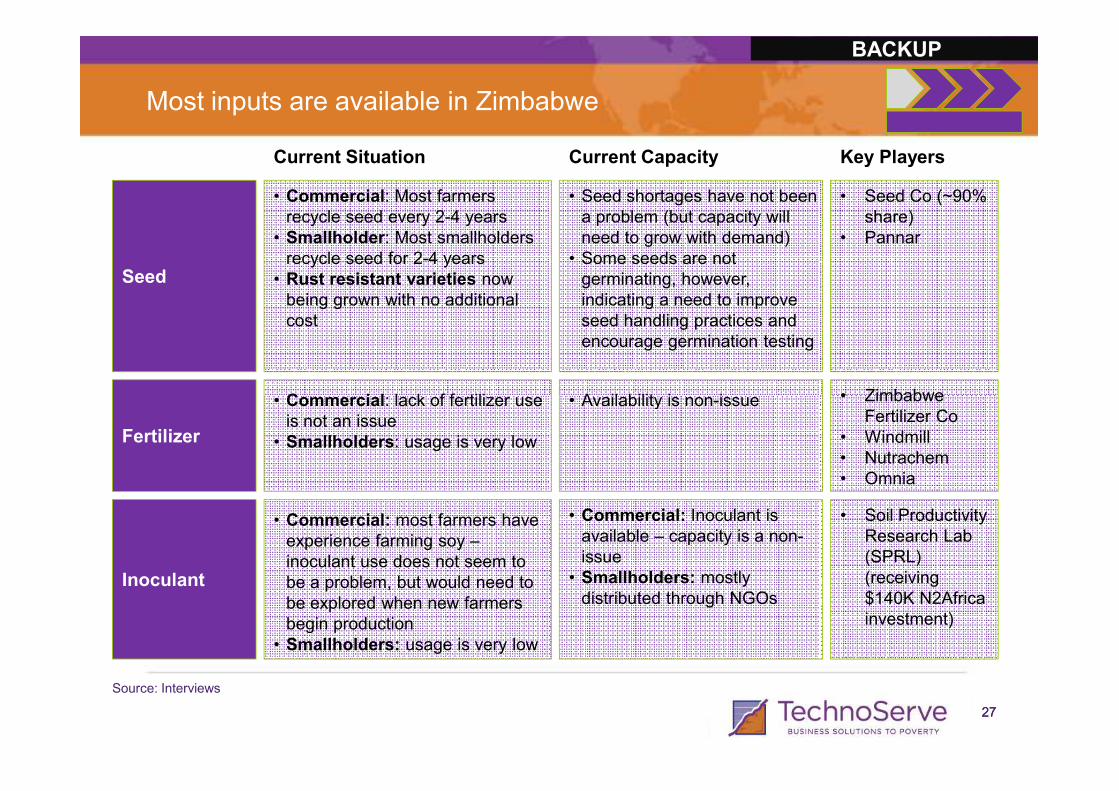
Most inputs are available in Zimbabwe
Seed
• Commercial: Most farmers recycle seed every 2-4 years
• Smallholder: Most smallholders recycle seed for 2-4 years
• Rust resistant varieties now being grown with no additional cost
• Commercial: lack of fertilizer use
• Seed shortages have not been a problem (but capacity will need to grow with demand)
• Some seeds are not germinating, however, indicating a need to improve seed handling practices and encourage germination testing
• Availability is non-issue
• Seed Co (~90% share)
• Pannar
• Zimbabwe
Current Situation Current Capacity Key Players
BACKUP
2727
Fertilizer
Inoculant
• Commercial: lack of fertilizer use is not an issue
• Smallholders: usage is very low
• Commercial: most farmers have experience farming soy –inoculant use does not seem to be a problem, but would need to be explored when new farmers begin production
• Smallholders: usage is very low
• Availability is non-issue
• Commercial: Inoculant is available – capacity is a non-issue
• Smallholders: mostly distributed through NGOs
• Zimbabwe Fertilizer Co
• Windmill• Nutrachem• Omnia
• Soil Productivity Research Lab (SPRL) (receiving $140K N2Africa investment)
Source: Interviews

Tractors, combines and irrigation systems need updating, but the financing needed for investment is unavailable
BACKUP
Lime
• Commercial: farmers test soil and adjust where necessary
• Smallholders: Very little soil testing or lime usage
• As long as companies are notified in advance they can supply sufficient lime
• Circle Lime• Early Worm• Alaska
Dynamite
Herbicide / Chemicals
• Commercial: 90% of existing farmers use herbicides and chemicals fully
• Smallholders: 50% of smallholders use herbicides and chemicals
• Herbicide is widely available to both commercial farmers and smallholders
• Windmill• Zimb Fert Co.• Citchem• Agricura• Polarchem
Current Situation Current Capacity Key Players
2828
Mechanization
• Commercial: 100% of commercial farmers utilize mechanization; 50% of equipment is old, needs updating
• Smallholders: little to no mechanization
• Limited availability• Lack of financing limits
access
• Farmec• Bain• Munted Motors• Other small
players
Source: Interviews
Irrigation
• Commercial: 90% of commercial farmers use irrigation
• Smallholders: No irrigation for soy
• Equipment is old • Capex investment needed,
but financing is lacking
• Center irrigation• Right Rain• Dore Input
Chemicalsuse herbicides and chemicals • Polarchem
• Other small players
Unreliable electricity situation limits effective irrigation
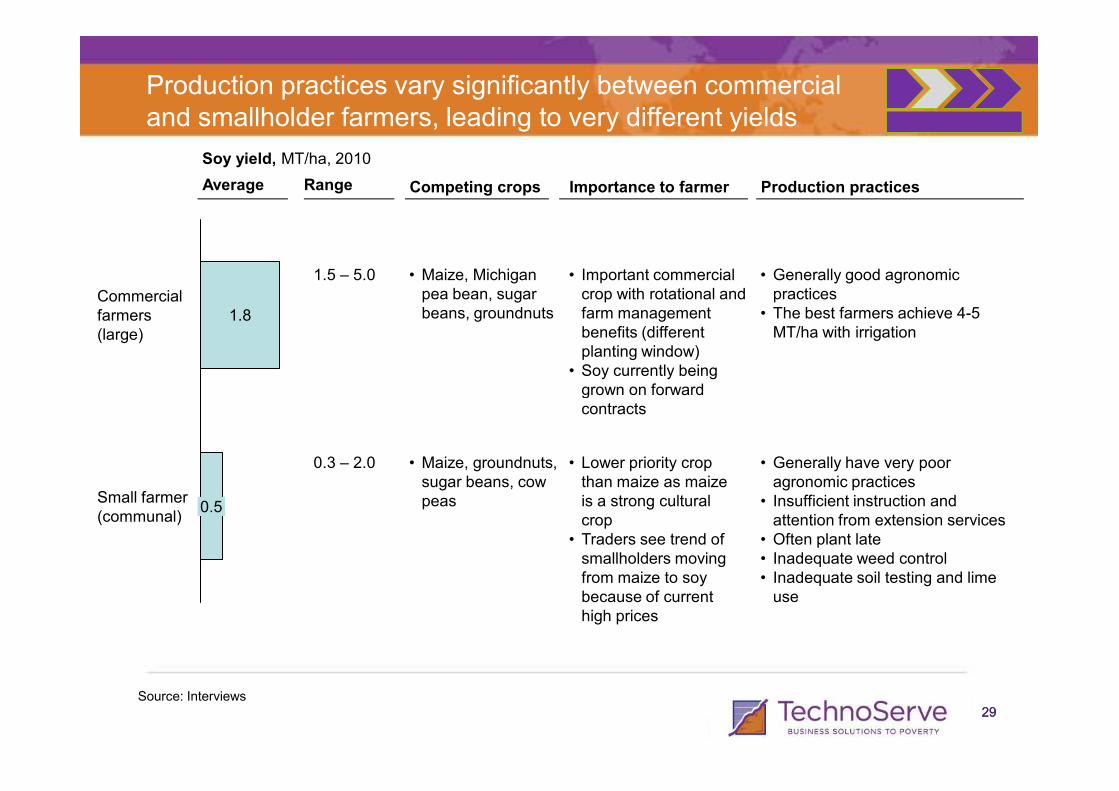
Production practices vary significantly between commercial and smallholder farmers, leading to very different yields
• Maize, Michigan pea bean, sugar beans, groundnuts
Soy yield, MT/ha, 2010
1.8Commercial farmers(large)
Average Competing crops Importance to farmer Production practices
• Important commercial crop with rotational and farm management benefits (different planting window)
• Soy currently being grown on forward
• Generally good agronomic practices
• The best farmers achieve 4-5 MT/ha with irrigation
Range
1.5 – 5.0
2929
Small farmer(communal)
0.5
• Maize, groundnuts, sugar beans, cow peas
grown on forward contracts
• Lower priority crop than maize as maize is a strong cultural crop
• Traders see trend of smallholders moving from maize to soy because of current high prices
• Generally have very poor agronomic practices
• Insufficient instruction and attention from extension services
• Often plant late• Inadequate weed control• Inadequate soil testing and lime
use
Source: Interviews
0.3 – 2.0

Land use is constrained and government extension agents are under-resourced
Land
Agronomic practices
• Most soy-land laying fallow following land reform
• Commercial: Strong agronomics among experienced farmers; weak agronomics among many new farmers
• Smallholder: Very weak agronomics (e.g., late planting,
• Virtually unlimited land available in region II for soy production
• Government extensionists(Agritex) are under-resourced - in numbers, training and transportation
• Government• New farmers
• Government extension services (Agritex)
• Foundations for Farming (conservation
Current Situation Current Capacity Key Players
BACKUP
3030
practices
Competing crops
agronomics (e.g., late planting, insufficient weeding & disease control) as they are inexperienced in soy production and soy requires more work to produce than maize
• Maize is the main competitor, but trend is towards soy because of higher prices and more availability of inputs
• Tobacco is grown in same areas, but on different soils so is not a direct competitor
(conservation agriculture)
• Consultants (former farmers)
• Numerous NGOs
Source: Interviews
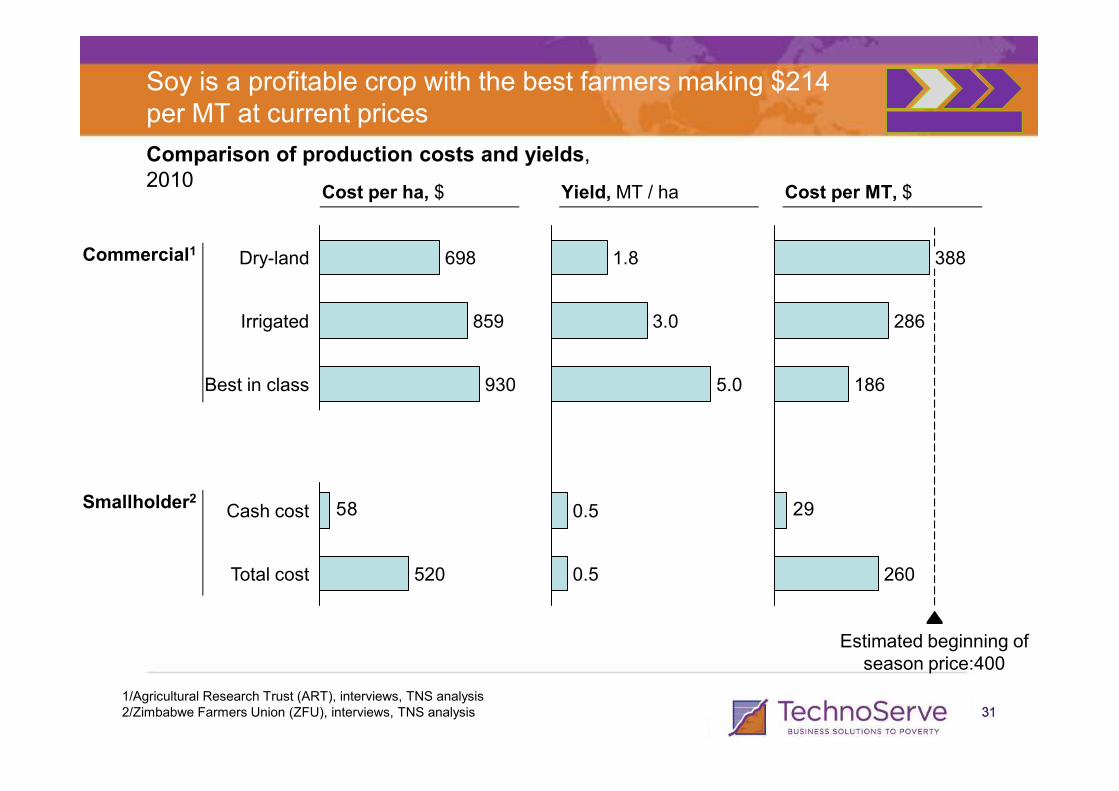
Soy is a profitable crop with the best farmers making $214 per MT at current prices
Comparison of production costs and yields,2010
Best in class 930
Irrigated 859
Dry-land 698Commercial1
Cost per ha, $ Yield, MT / ha Cost per MT, $
5.0
3.0
1.8
186
286
388
3131
58
Total cost
Cash cost
520
Smallholder2
1/Agricultural Research Trust (ART), interviews, TNS analysis2/Zimbabwe Farmers Union (ZFU), interviews, TNS analysis
0.5
0.5
29
260
Estimated beginning ofseason price:400
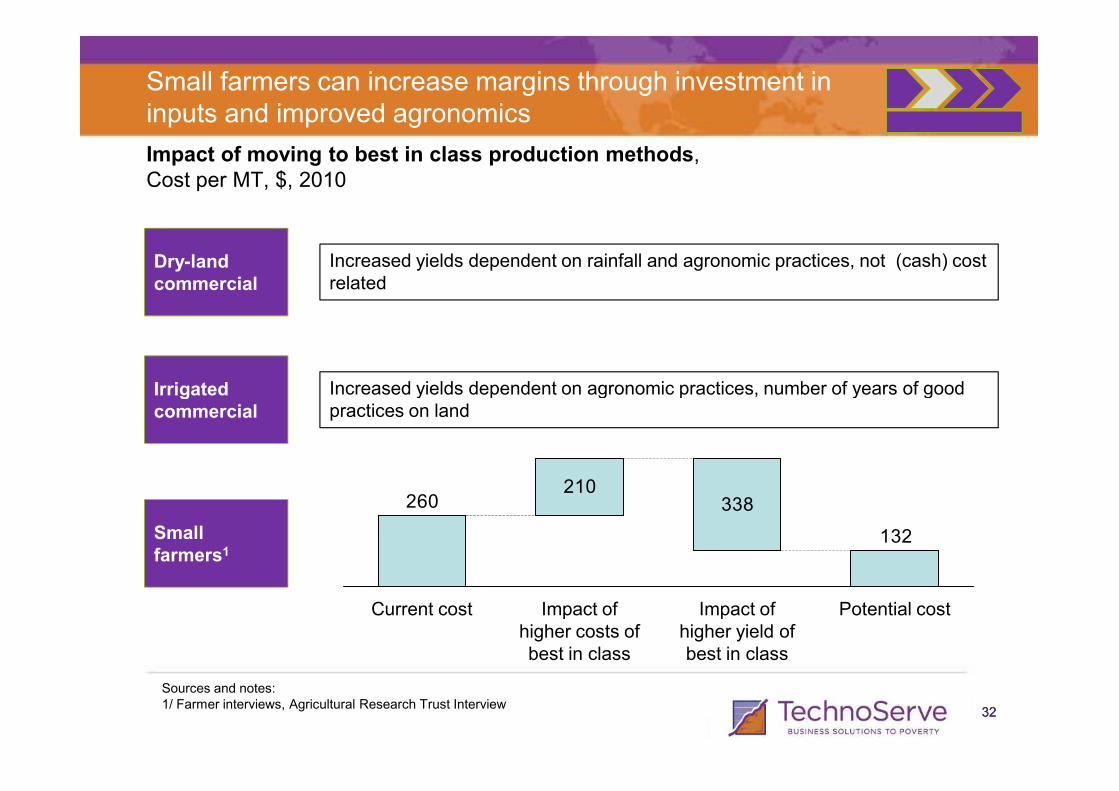
Small farmers can increase margins through investment in inputs and improved agronomics
Impact of moving to best in class production methods,Cost per MT, $, 2010
Dry-land commercial
Irrigated
Increased yields dependent on rainfall and agronomic practices, not (cash) cost related
Increased yields dependent on agronomic practices, number of years of good
3232
210338
132
260
Potential costImpact of higher yield of best in class
Impact of higher costs of best in class
Current cost
Irrigated commercial
Small farmers1
Sources and notes:1/ Farmer interviews, Agricultural Research Trust Interview
Increased yields dependent on agronomic practices, number of years of good practices on land

Average cost of irrigated production for commercial soybean farmers1
$/MT, 2010
30
26
25
300
275
20
Financing can greatly affect profitability for commercial farmers as it can account for 9% of variable cost
Break-even price = $300
IRRIGATED COMMERCIAL
2010/11 Estimated beginning of season price = $400
Farmers re-use seed for 2-4 seasons. Seed
3333
41
19
16
57
39
23
Fertilizer and lime
Seed
12
2
Herbicides Total costs
Fixed costs
Total VCsFinanceLeviesInsuranceTransport / delivery
Bags / silos
Irrigation & drying
Cultivation & Harvest
LaborFung-icides
8
Insect-icides
for 2-4 seasons. Seed cost ($105) is split between 3 seasons.
1/Agricultural Research Trust (ART), interviews2/No land costs exist in most circumstances. In situations with leasing agreements, payment is usually 5-10% of revenues. Breakeven calculated with 7.5% payment on $400 price.
•Financing from non-bank sources is ~24%.•Financing from banks is ~15%, but with fees amounts to ~+20%.
YIELD = 3.0 MT/HA Fixed costs include machinery repair, building maintenance, certain finance costs
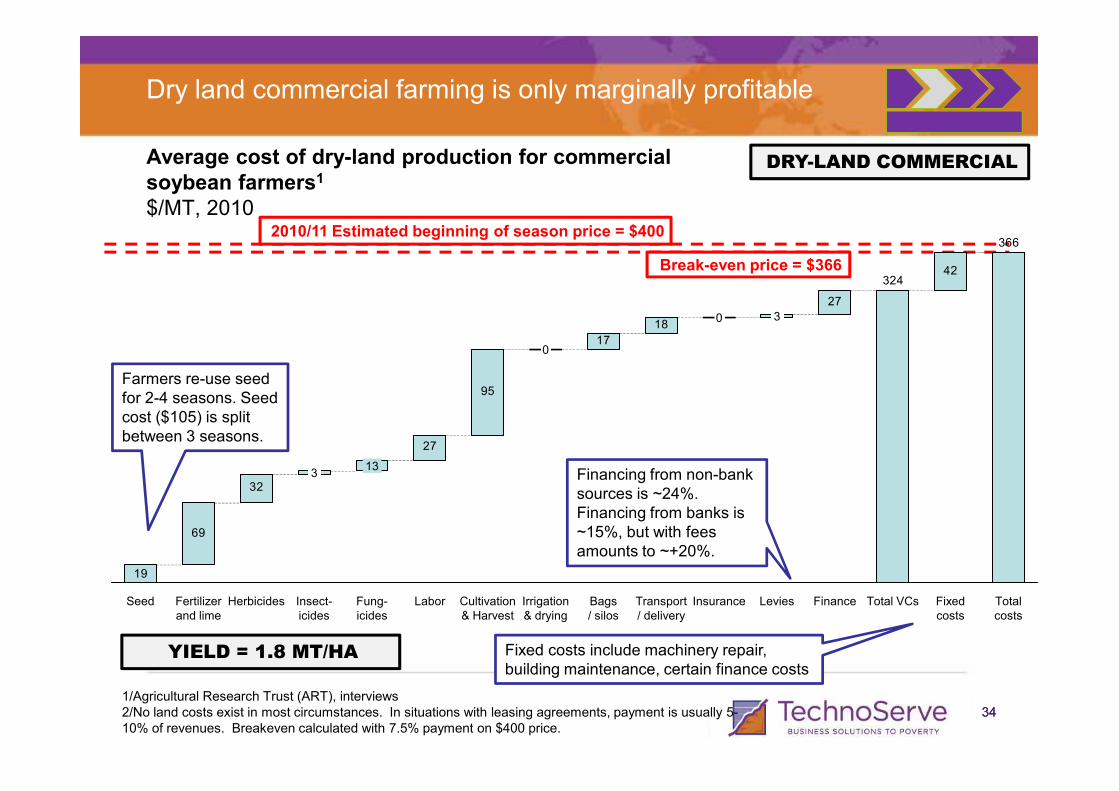
Average cost of dry-land production for commercial soybean farmers1
$/MT, 2010
Dry land commercial farming is only marginally profitable
Break-even price = $366
DRY-LAND COMMERCIAL
2010/11 Estimated beginning of season price = $400
Farmers re-use seed for 2-4 seasons. Seed
95
17
18
27
42
366
324
3
0
0
3434
for 2-4 seasons. Seed cost ($105) is split between 3 seasons.
1/Agricultural Research Trust (ART), interviews2/No land costs exist in most circumstances. In situations with leasing agreements, payment is usually 5-10% of revenues. Breakeven calculated with 7.5% payment on $400 price.
Financing from non-bank sources is ~24%. Financing from banks is ~15%, but with fees amounts to ~+20%.
YIELD = 1.8 MT/HA Fixed costs include machinery repair, building maintenance, certain finance costs
69
32
27
95
19
Total costs
Fixed costs
Irrigation & drying
Cultivation & Harvest
Bags / silos
LaborFung-icides
13
Insect-icides
3
HerbicidesFertilizer and lime
Seed Levies FinanceInsurance Total VCsTransport / delivery

Average cost of production for best in class commercial soybean farmers1
$/MT, 2010
At current prices, the best commercial farmers can make significant profit
Break-even price = $229
BEST COMMERCIAL
Farmers re-use seed for 2-4 seasons. Seed
2010/11 Estimated beginning of season price = $400
50
15
15
229
214
10
3535
for 2-4 seasons. Seed cost ($105) is split between 3 seasons.
1/Agricultural Research Trust (ART), interviews2/No land costs exist in most circumstances. In situations with leasing agreements, payment is usually 5-10% of revenues. Breakeven calculated with 7.5% payment on $400 price.
Financing from non-bank sources is ~24%. Financing from banks is ~15%, but with fees amounts to ~+20%.
YIELD = 5.0 MT/HA Fixed costs include machinery repair, building maintenance, certain finance costs
25
12
34
23
31
50
Levies Total costs
Fixed costs
Total VCsFinanceInsuranceTransport / delivery
Bags / silos
Irrigation & drying
Cultivation & Harvest
Labor
10
Fung-icides
5
Insect-icides
1
HerbicidesFertilizer and lime
Seed
7
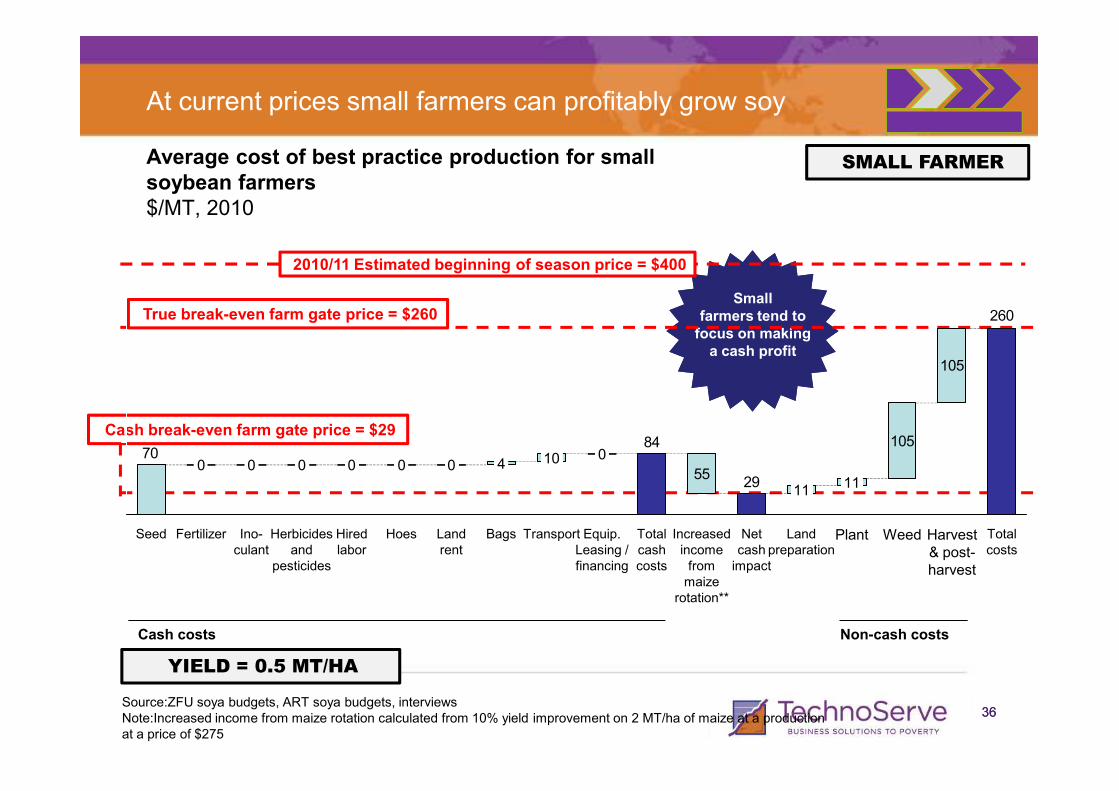
At current prices small farmers can profitably grow soy
SMALL FARMERAverage cost of best practice production for small soybean farmers$/MT, 2010
Small farmers tend to focus on making a cash profit
True break-even farm gate price = $260
2010/11 Estimated beginning of season price = $400
260
105
3636Source:ZFU soya budgets, ART soya budgets, interviewsNote:Increased income from maize rotation calculated from 10% yield improvement on 2 MT/ha of maize at a production at a price of $275
Cash break-even farm gate price = $29
Cash costs Non-cash costs
YIELD = 0.5 MT/HA
105
2955
8470
WeedTotal cash costs
Total costs
Land preparation
Increased income from maize
rotation**
Harvest & post-harvest
Equip. Leasing / financing
Plant
1111
Net cash
impact
0
Transport
10
Bags
4
Land rent
0
Hoes
0
Hired labor
0
Herbicides and
pesticides
0
Ino-culant
0
Fertilizer
0
Seed

Small farmer profits will increase with improved yields
SMALL FARMERAverage cost of best practice production for smallholder soybean farmers$/MT, 2010
Break-even farm gate price = $132
2010/11 Estimated beginning of season price = $400
Small farmers tend to focus on making a cash profit
132
103
3737
Cash costs Non-cash costs
YIELD = 2 MT/HA
Cash break-even farm gate price = $48
Source:ZFU soya budgets, ART soya budgets, interviewsNote:Increased income from maize rotation calculated from 10% yield improvement on 2 MT/ha of maize at a production cost of [x] and price of [x]
5526
53
6848
103
18
Total costs
Harvest & post-harvest
Weed
3
Total cash costs
Equip. Leasing / financing
0
Transport
10
Bags
8
Land rent
0
Hoes
0
Hired labor
Increased income from maize
rotation**
Herbicides and
pesticides
0
Ino-culant
0
Fertilizer
0
Seed Net cash
impact
3
Land preparation
Plant
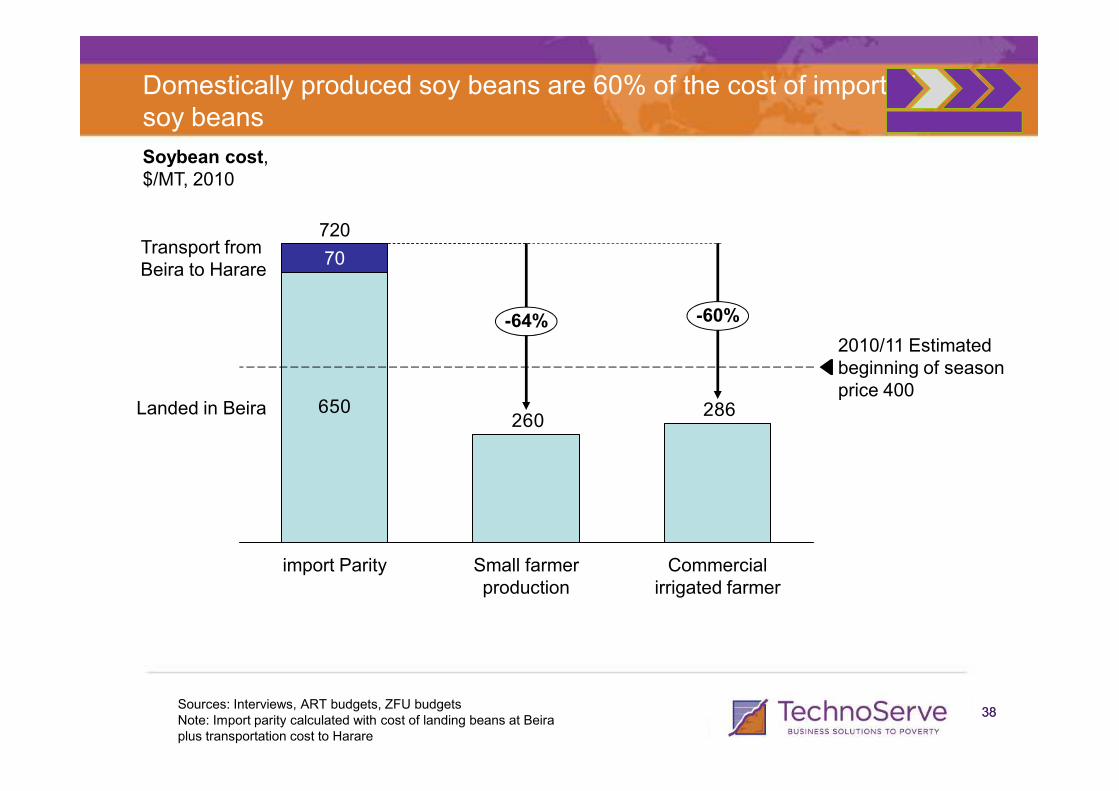
Domestically produced soy beans are 60% of the cost of imported soy beans
Soybean cost,$/MT, 2010
2010/11 Estimated beginning of season price 400
-60%-64%
Transport from Beira to Harare
720
70
3838Sources: Interviews, ART budgets, ZFU budgetsNote: Import parity calculated with cost of landing beans at Beira plus transportation cost to Harare
650 286260
price 400Landed in Beira
Commercial irrigated farmer
Small farmer production
import Parity
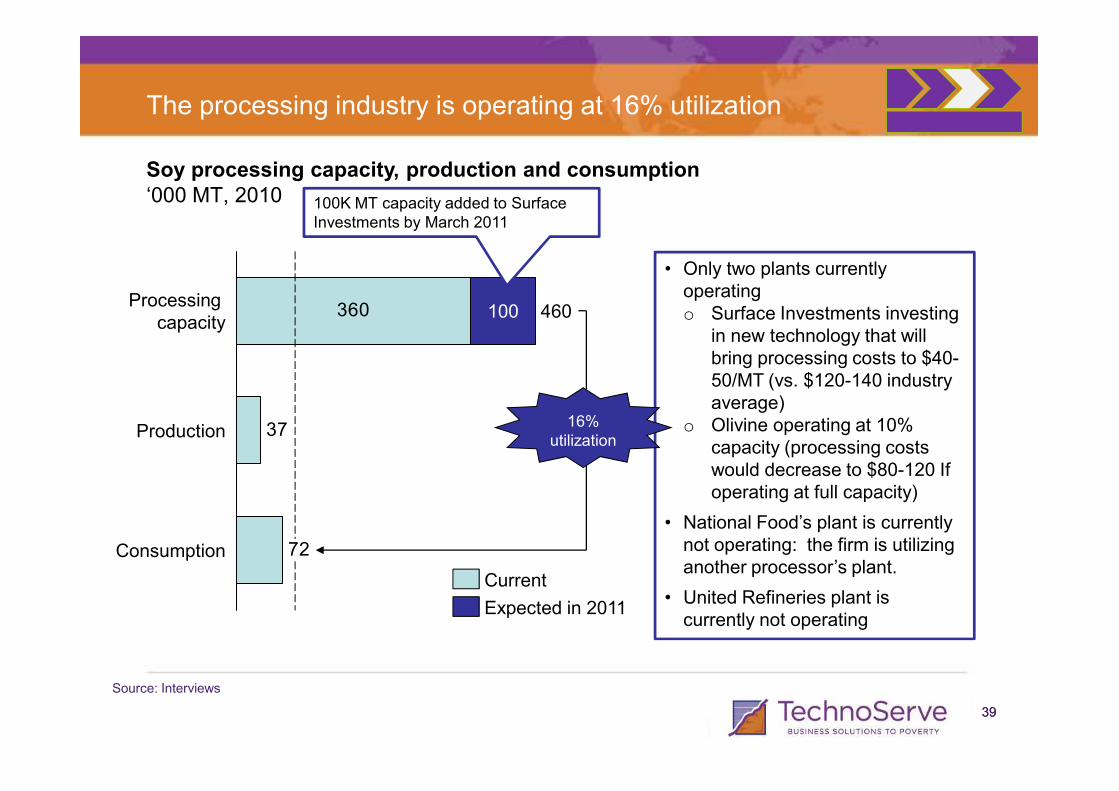
The processing industry is operating at 16% utilization
• Only two plants currently operatingo Surface Investments investing
in new technology that will bring processing costs to $40-50/MT (vs. $120-140 industry average)
Soy processing capacity, production and consumption‘000 MT, 2010
360 100Processing
capacity460
100K MT capacity added to Surface Investments by March 2011
3939
Source: Interviews
average)o Olivine operating at 10%
capacity (processing costs would decrease to $80-120 If operating at full capacity)
• National Food’s plant is currently not operating: the firm is utilizing another processor’s plant.
• United Refineries plant is currently not operating
72
37 -84%
Consumption
Production
Current
Expected in 2011
16% utilization

Solvent extraction dominates processing in Zimbabwe, although a number of small mechanical players exist
• 97% of processing is done using solvent extractorso Four plants exist (Surface Investments, Olivine, National Foods and
United Refineries)o Only Surface Investments and Olivine are currently operatingo All plants except Surface Investments need upgradeso Surface Investments’ processing costs are $40-50 MT in contrast to
$120-140 MT at other plants• Imports make up 60% of the cooking oil market, composed of Olivine,
Surface Investments, and National Foods• Surface Investments and Olivine market their own oil and sell cake to feed
Industry players
4040
• Surface Investments and Olivine market their own oil and sell cake to feed manufacturers
• National Foods markets its oil and also produces feed
Mechanical vs.solvent extraction
Source: Interviews
• Small mechanical processors exist near production, producing full fat feed (utilized independently and sold to feed producers) and crude oil (sold in local rural areas)
• Mechanical production estimated to be 3% of the market

Some of the largest feed end-users produce their own feed, but also procure feed from other players
Inputs Production Processing Demand
Seed Co
Pannar
National Foods
Surface Investment
Olivine
Zimbabwe Fertilizer Co.
Windmill
Smallholder farmers
Commercial farmers
Colcom
Feed/Oil End-market
4141
National Foods and Agrifoods are estimated to hold over 70% of the feed market
Windmill
Nutrachem
Soil Productivity Research Lab
Irvines
Colcom
Source: InterviewsLake Harvest
Others
Agrifoods
John Cameron
Feed Mix
Profeeds
Windmill
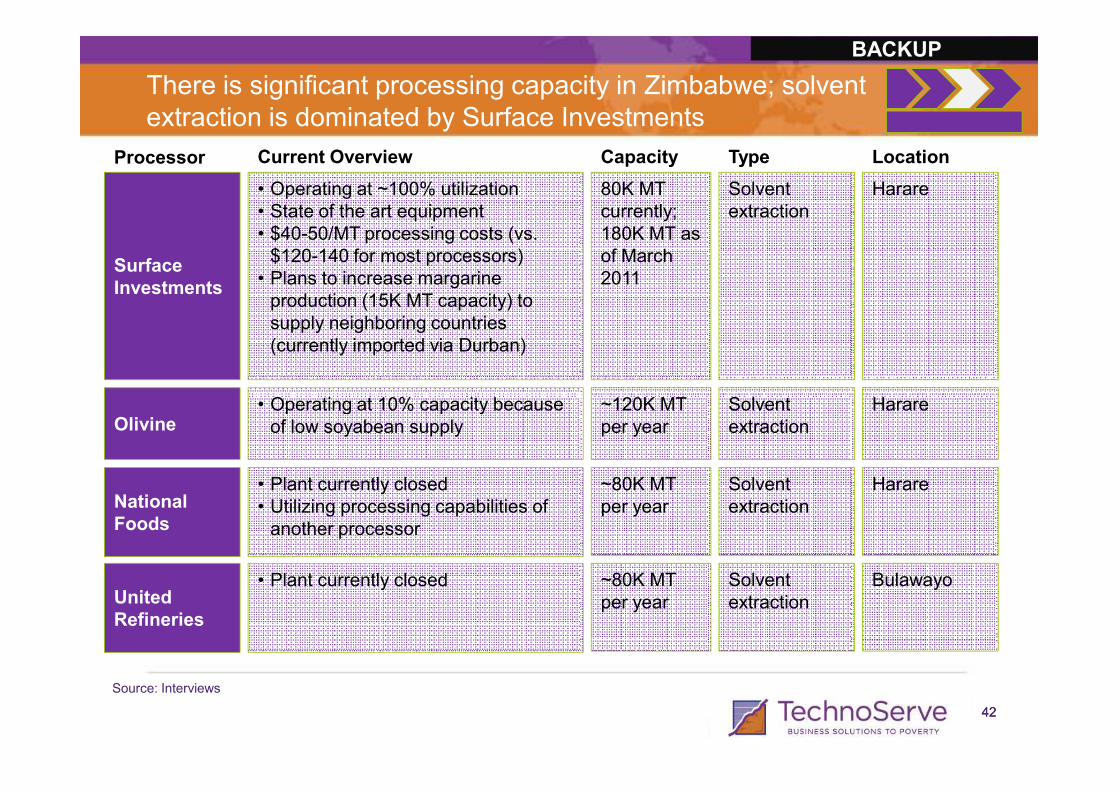
There is significant processing capacity in Zimbabwe; solvent extraction is dominated by Surface Investments
Surface Investments
• Operating at ~100% utilization• State of the art equipment• $40-50/MT processing costs (vs. $120-140 for most processors)
• Plans to increase margarine production (15K MT capacity) to supply neighboring countries (currently imported via Durban)
• Operating at 10% capacity because
80K MT currently; 180K MT as of March 2011
~120K MT
Solvent extraction
Solvent
Current Overview Capacity Type
Harare
Harare
LocationProcessor
BACKUP
4242
National Foods
Olivine
• Plant currently closed• Utilizing processing capabilities of another processor
• Operating at 10% capacity because of low soyabean supply
~80K MT per year
~120K MT per year
Solventextraction
Solvent extraction
Harare
Harare
Source: Interviews
United Refineries
• Plant currently closed ~80K MT per year
Solventextraction
Bulawayo
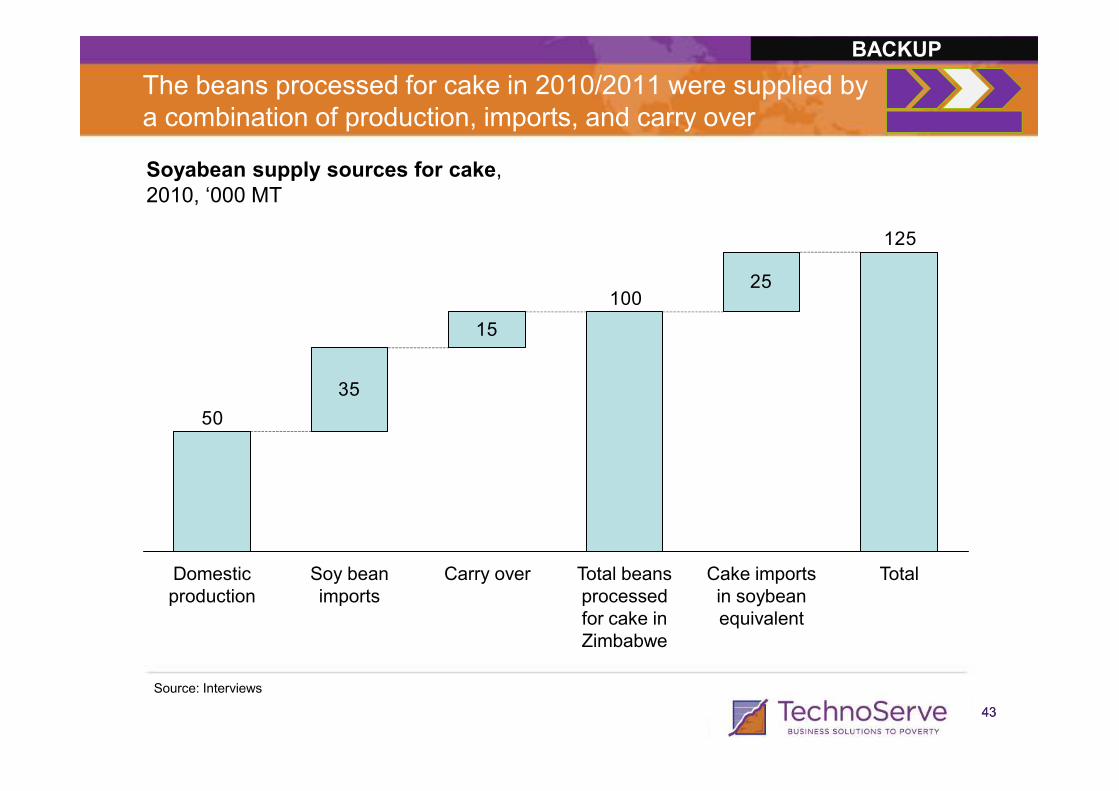
The beans processed for cake in 2010/2011 were supplied by a combination of production, imports, and carry over
Soyabean supply sources for cake,2010, ‘000 MT
25100
35
125
15
BACKUP
4343
Source: Interviews
35
50
Cake imports in soybean equivalent
TotalTotal beans processed for cake in Zimbabwe
Domestic production
Soy bean imports
Carry over
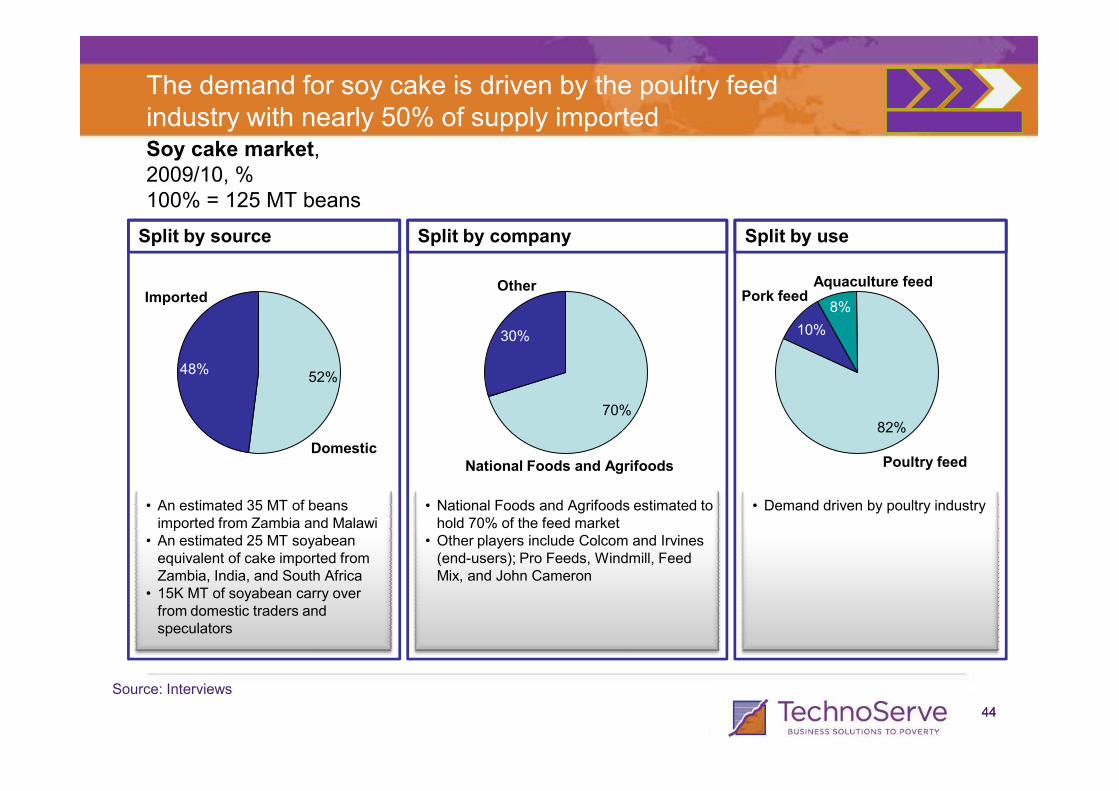
The demand for soy cake is driven by the poultry feed industry with nearly 50% of supply importedSoy cake market,2009/10, %100% = 125 MT beans
Split by source Split by useSplit by company
30%
52%
Imported
48%
Other
30% 10%
Pork feedAquaculture feed
8%
4444
• An estimated 35 MT of beans imported from Zambia and Malawi
• An estimated 25 MT soyabeanequivalent of cake imported from Zambia, India, and South Africa
• 15K MT of soyabean carry over from domestic traders and speculators
• National Foods and Agrifoods estimated to hold 70% of the feed market
• Other players include Colcom and Irvines(end-users); Pro Feeds, Windmill, Feed Mix, and John Cameron
• Demand driven by poultry industry
Source: Interviews
DomesticNational Foods and Agrifoods
70%
Poultry feed
82%

The domestic market for soy oil is dominated by Surface, National Foods and Olivine; however, most oil is imported
Largest players:• Surface Investments• National Foods• Olivine
Soya cooking oil market,%, 2009/10100% = 165 MT oil
Split by source Split by useSplit by company
Domestic
40%
60%
Margarine and processed
food products
25%
4545
• The majority of imports are from South Africa
• Imports are of refined oil
• Current market demand is ~48K MT of oil (total) and ~28K MT for soy oil
• About 25% of soy oil is used for margarine and processed foods
Source: Interviews
Imported
60%
Cooking Oil
75%
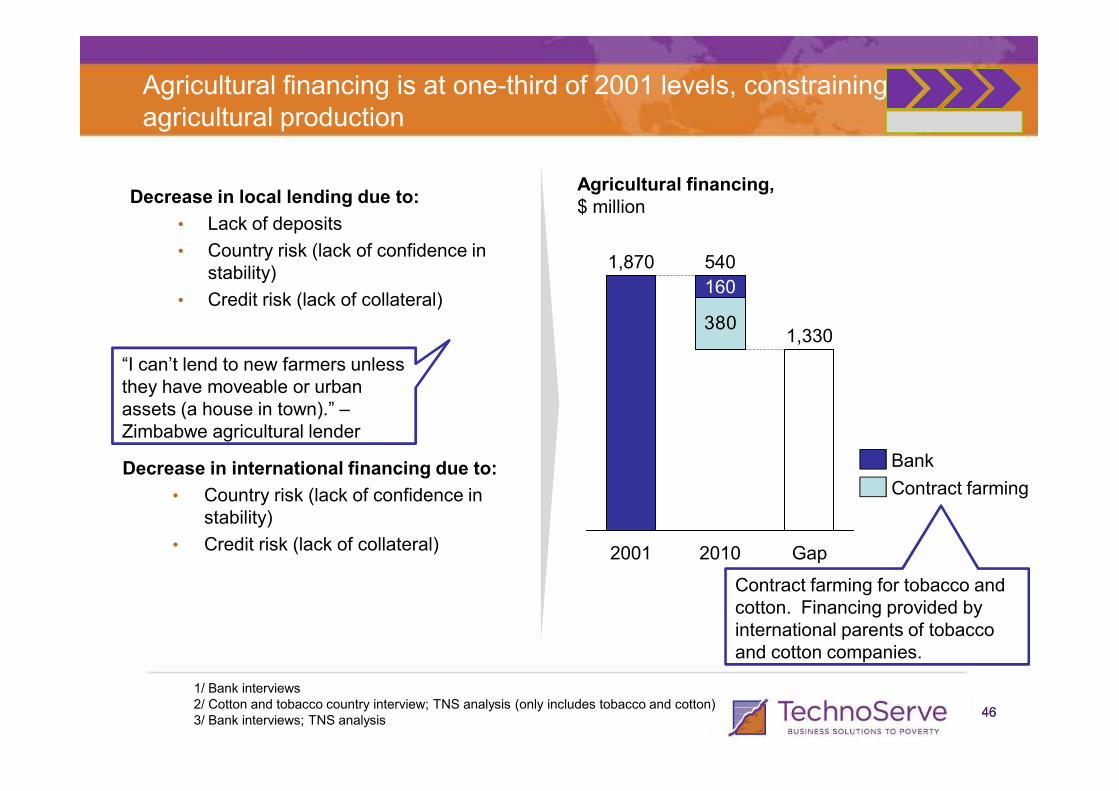
Agricultural financing is at one-third of 2001 levels, constraining agricultural production
Decrease in local lending due to:
• Lack of deposits
• Country risk (lack of confidence in stability)
• Credit risk (lack of collateral)
“I can’t lend to new farmers unless they have moveable or urban
Agricultural financing,$ million
3801,330
160
5401,870
4646
Decrease in international financing due to:
• Country risk (lack of confidence in stability)
• Credit risk (lack of collateral)
1/ Bank interviews2/ Cotton and tobacco country interview; TNS analysis (only includes tobacco and cotton)3/ Bank interviews; TNS analysis
they have moveable or urban assets (a house in town).” –Zimbabwe agricultural lender
Contract farming for tobacco and cotton. Financing provided by international parents of tobacco and cotton companies.
Gap20102001
Contract farming
Bank
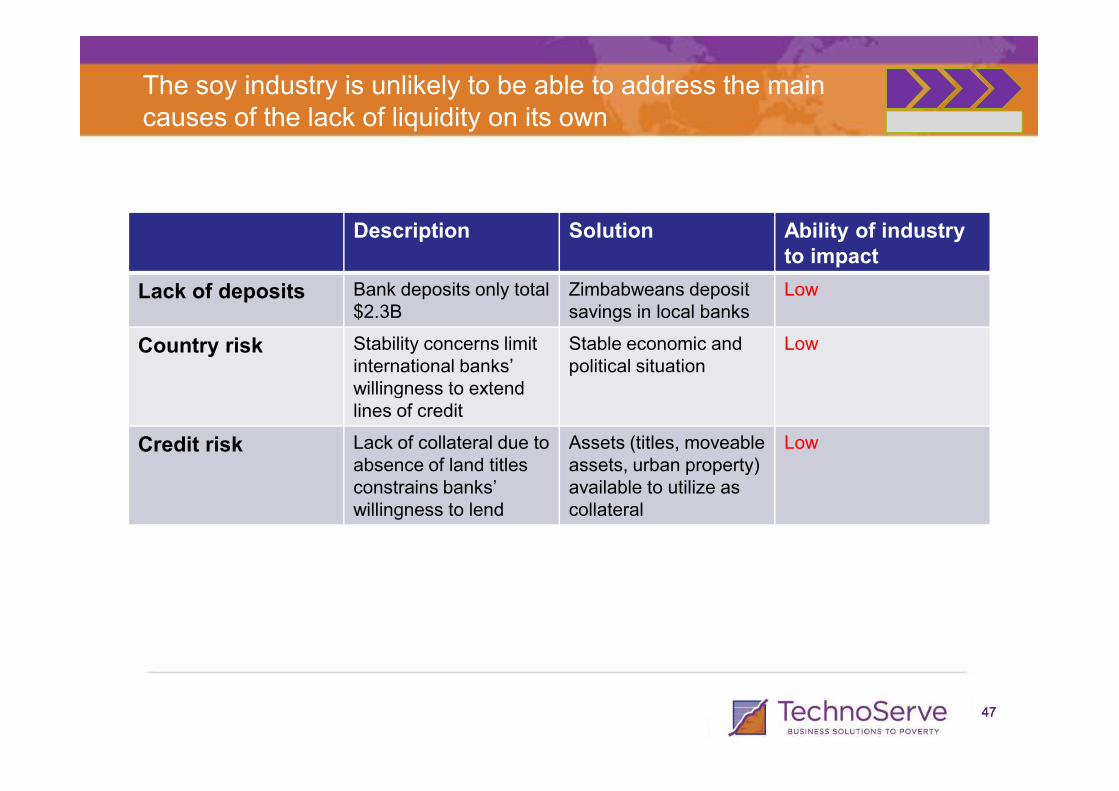
Description Solution Ability of industry to impact
Lack of deposits Bank deposits only total $2.3B
Zimbabweans deposit savings in local banks
Low
Country risk Stability concerns limit international banks’ willingness to extend
Stable economic and political situation
Low
The soy industry is unlikely to be able to address the main causes of the lack of liquidity on its own
4747
willingness to extend lines of credit
Credit risk Lack of collateral due to absence of land titles constrains banks’ willingness to lend
Assets (titles, moveable assets, urban property) available to utilize as collateral
Low
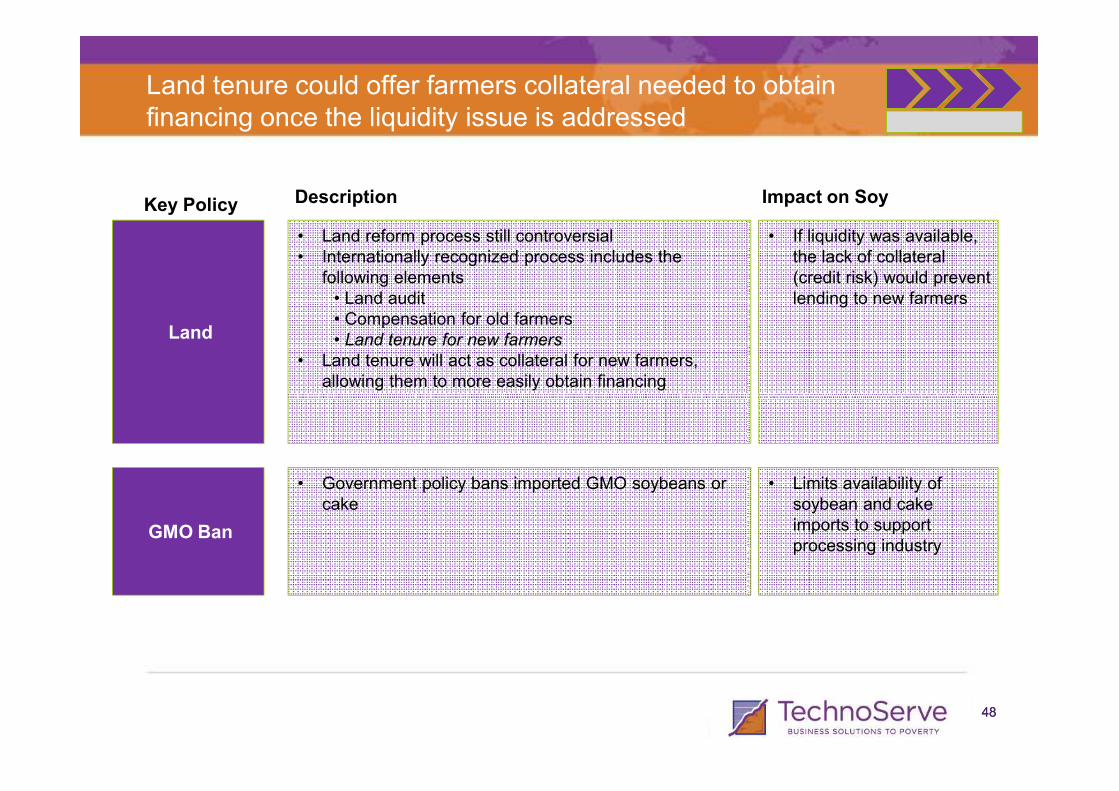
Land tenure could offer farmers collateral needed to obtain financing once the liquidity issue is addressed
Land
• Land reform process still controversial• Internationally recognized process includes the
following elements• Land audit• Compensation for old farmers• Land tenure for new farmers
• Land tenure will act as collateral for new farmers, allowing them to more easily obtain financing
• If liquidity was available, the lack of collateral (credit risk) would prevent lending to new farmers
Description Impact on SoyKey Policy
4848
GMO Ban
• Government policy bans imported GMO soybeans or cake
• Limits availability of soybean and cake imports to support processing industry
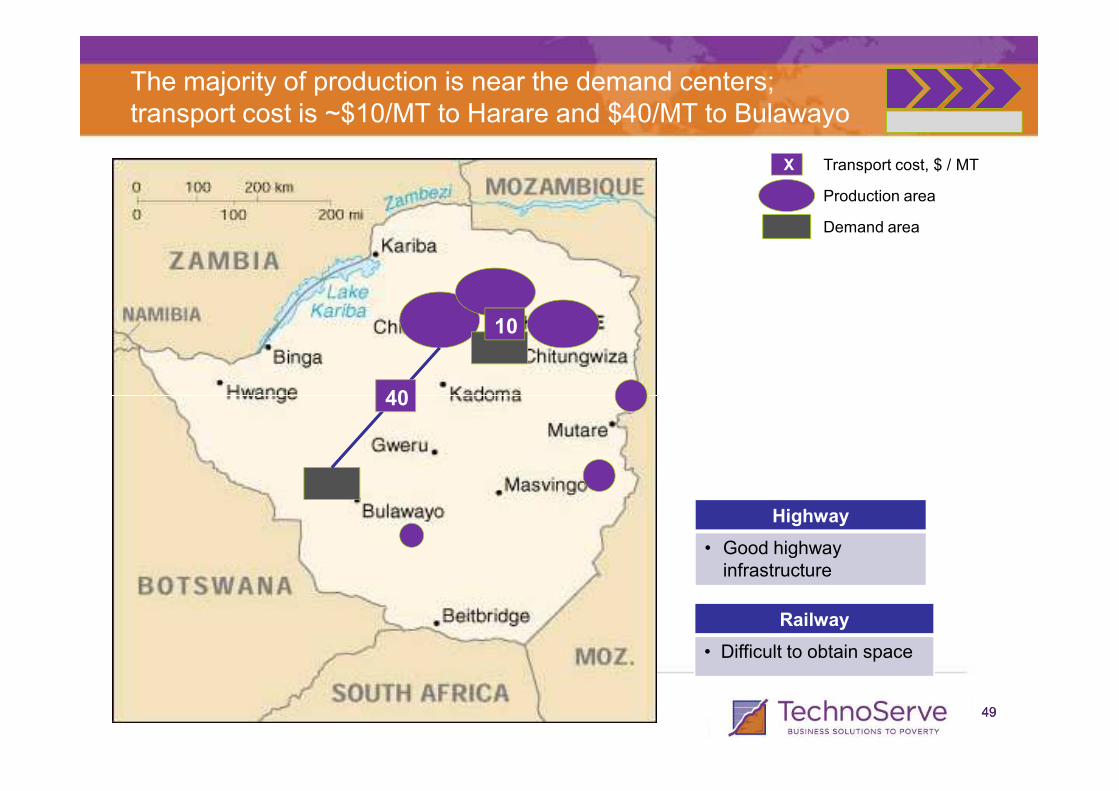
The majority of production is near the demand centers; transport cost is ~$10/MT to Harare and $40/MT to Bulawayo
Production area
10
Demand area
X Transport cost, $ / MT
40
4949
Highway
• Good highwayinfrastructure
Railway
• Difficult to obtain space
40

• Zimbabwe only produces ~30% of its demand for soy, but considerable scope exists for growth of production
•Despite strong market demand, sophisticated processing capabilities and capacity, and the ability for commercial farmers to grow soy competitively, the soy industry is held back by a lack of financing and land complexities
•Opportunities for near-term actions to improve production exist, but full production capacity will likely only be unleashed over a longer time horizon, as key macro issues such as liquidity and land ease or are resolved
• There is the potential to increase the incomes of 35k smallholders by $138 p.a.
Agenda
5050
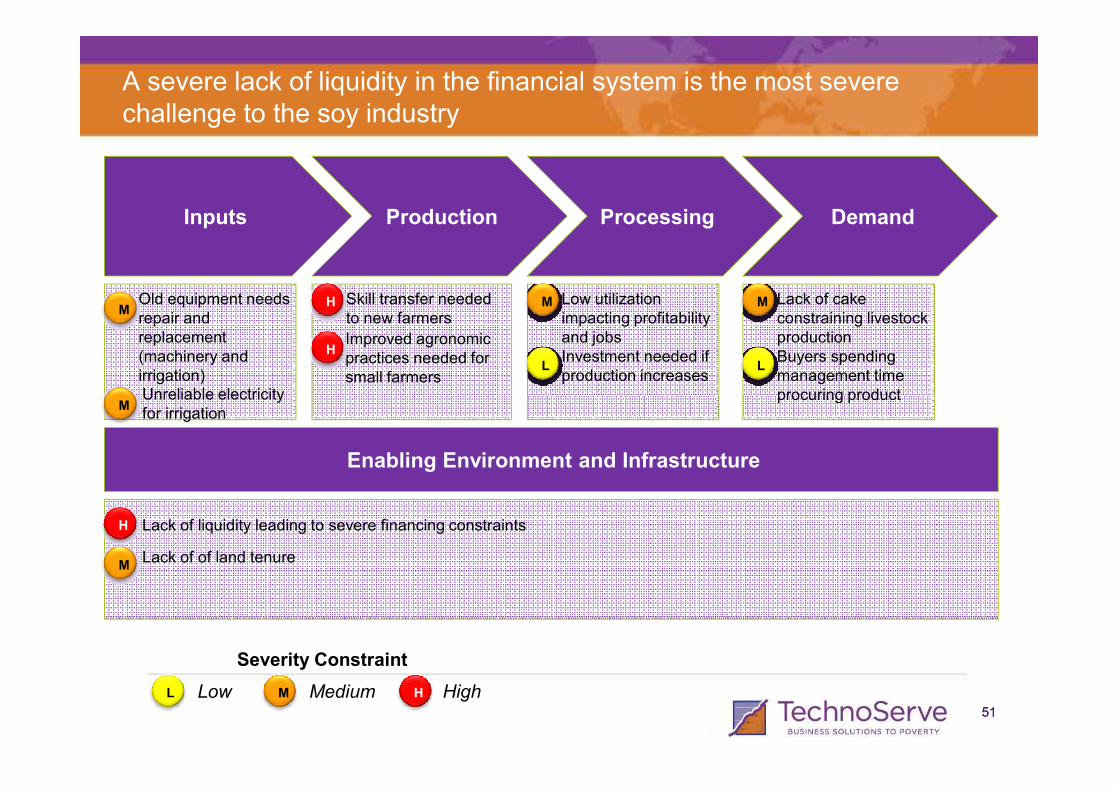
A severe lack of liquidity in the financial system is the most severe challenge to the soy industry
Inputs Production Processing Demand
• Old equipment needs repair and replacement (machinery and irrigation)
• Skill transfer needed to new farmers
HM
Unreliable electricity
HImproved agronomic practices needed for small farmers
• Low utilization impacting profitability and jobs
• Investment needed if production increases
M • Lack of cake constraining livestock production
• Buyers spending management time procuring product
M
LL
5151
Enabling Environment and Infrastructure
L M H
Severity Constraint
Low HighMedium
H
M
Lack of liquidity leading to severe financing constraints
Lack of of land tenure
MUnreliable electricity for irrigation
procuring product
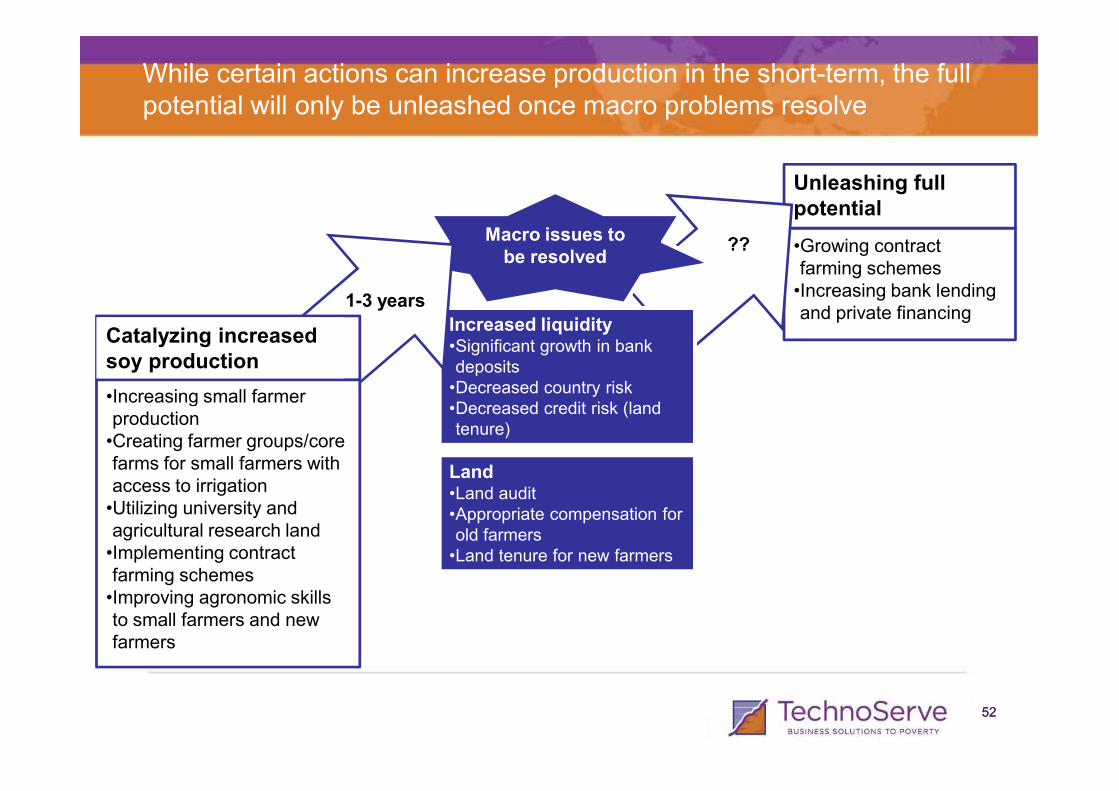
•Growing contract farming schemes•Increasing bank lending and private financing
Unleashing full potential
Increased liquidity•Significant growth in bank deposits
•Decreased country risk
Macro issues to be resolved
While certain actions can increase production in the short-term, the full potential will only be unleashed once macro problems resolve
•Increasing small farmer
1-3 years
Catalyzing increased soy production
??
5252
Land•Land audit•Appropriate compensation for old farmers
•Land tenure for new farmers
•Decreased country risk•Decreased credit risk (land tenure)
•Increasing small farmer production•Creating farmer groups/core farms for small farmers with access to irrigation•Utilizing university and agricultural research land•Implementing contract farming schemes•Improving agronomic skills to small farmers and new farmers
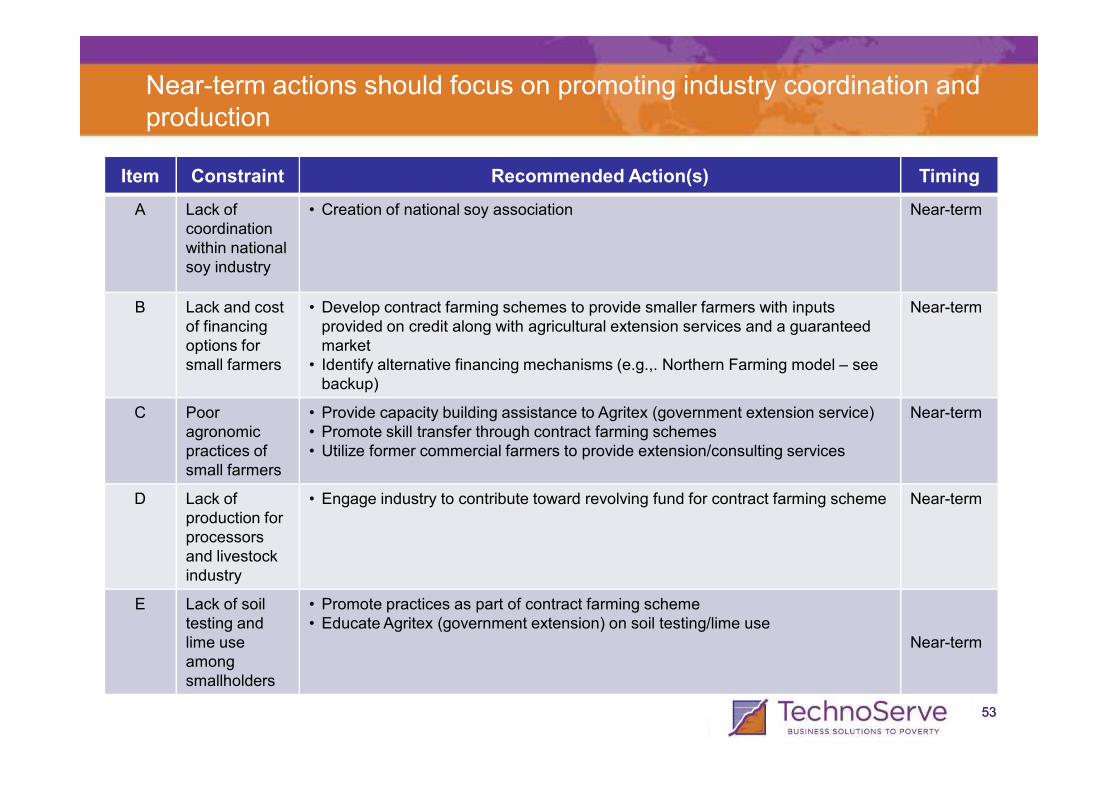
Near-term actions should focus on promoting industry coordination and production
Item Constraint Recommended Action(s) Timing
A Lack of coordinationwithin national soy industry
• Creation of national soy association Near-term
B Lack and cost of financing options for small farmers
• Develop contract farming schemes to provide smaller farmers with inputs provided on credit along with agricultural extension services and a guaranteed market
• Identify alternative financing mechanisms (e.g.,. Northern Farming model – see backup)
Near-term
5353
C Pooragronomic practices of small farmers
• Provide capacity building assistance to Agritex (government extension service)• Promote skill transfer through contract farming schemes• Utilize former commercial farmers to provide extension/consulting services
Near-term
D Lack of production for processors and livestock industry
• Engage industry to contribute toward revolving fund for contract farming scheme Near-term
E Lack of soil testing and lime use among smallholders
• Promote practices as part of contract farming scheme• Educate Agritex (government extension) on soil testing/lime use
Near-term
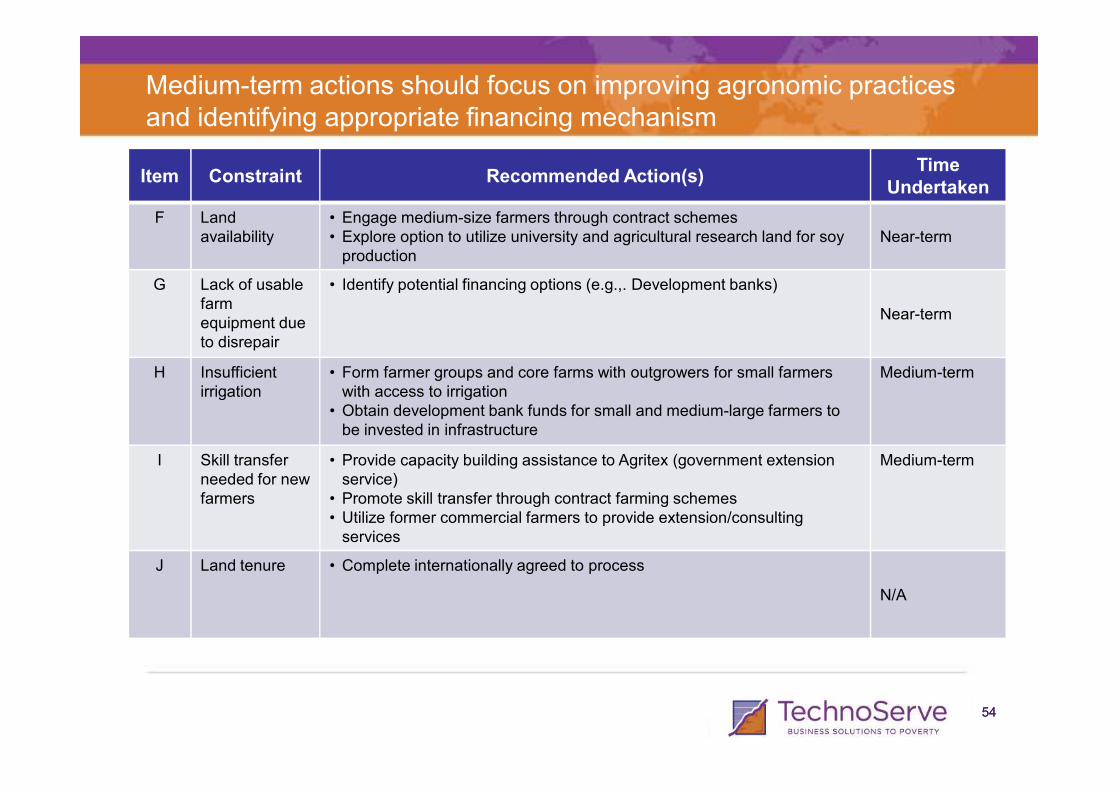
Medium-term actions should focus on improving agronomic practices and identifying appropriate financing mechanism
Item Constraint Recommended Action(s)Time
Undertaken
F Land availability
• Engage medium-size farmers through contract schemes • Explore option to utilize university and agricultural research land for soy
productionNear-term
G Lack of usable farm equipment due to disrepair
• Identify potential financing options (e.g.,. Development banks)
Near-term
H Insufficient irrigation
• Form farmer groups and core farms with outgrowers for small farmers with access to irrigation
Medium-term
5454
irrigation with access to irrigation• Obtain development bank funds for small and medium-large farmers to
be invested in infrastructure
I Skill transfer needed for new farmers
• Provide capacity building assistance to Agritex (government extension service)
• Promote skill transfer through contract farming schemes• Utilize former commercial farmers to provide extension/consulting
services
Medium-term
J Land tenure • Complete internationally agreed to process
N/A
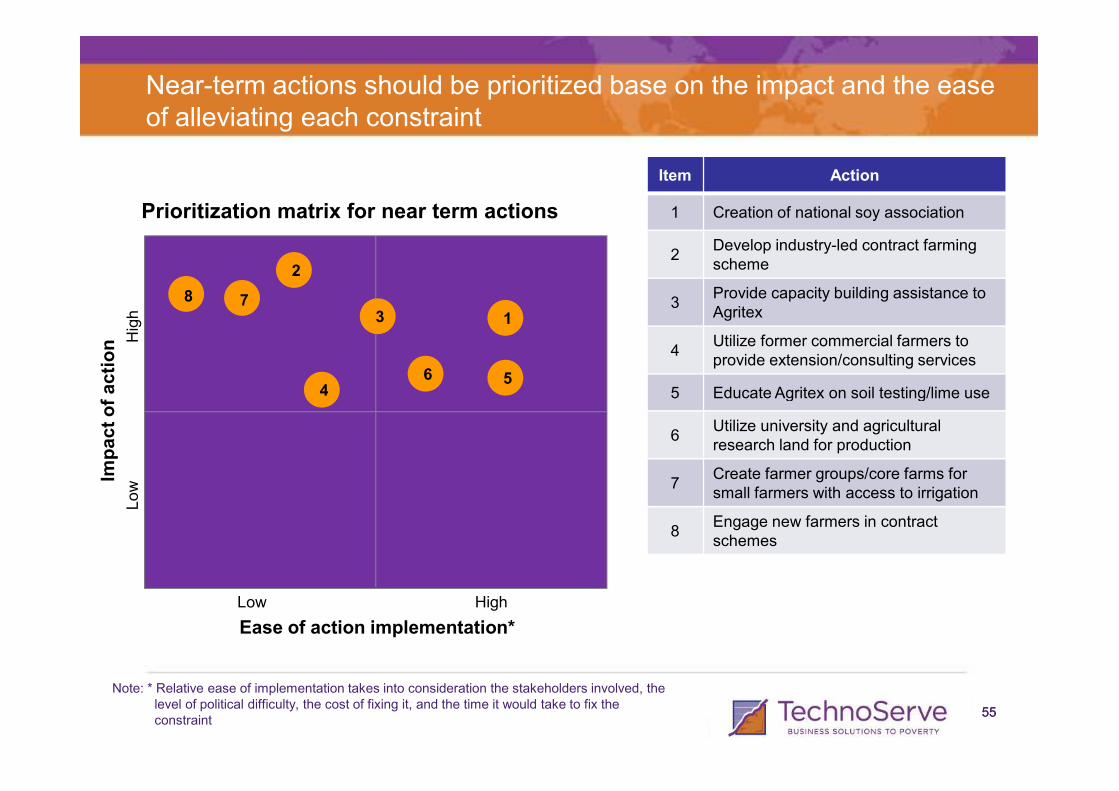
Near-term actions should be prioritized base on the impact and the ease of alleviating each constraint
Prioritization matrix for near term actions
Item Action
1 Creation of national soy association
2Develop industry-led contract farming scheme
3Provide capacity building assistance to Agritex
4Utilize former commercial farmers to provide extension/consulting services
5 Educate Agritex on soil testing/lime use
Impact of action H
igh
4
3
2
1
56
78
5555
5 Educate Agritex on soil testing/lime use
6Utilize university and agricultural research land for production
7Create farmer groups/core farms for small farmers with access to irrigation
8Engage new farmers in contract schemes
Ease of action implementation*
Low High
Impact of action
Low
4
Note: * Relative ease of implementation takes into consideration the stakeholders involved, the level of political difficulty, the cost of fixing it, and the time it would take to fix the constraint
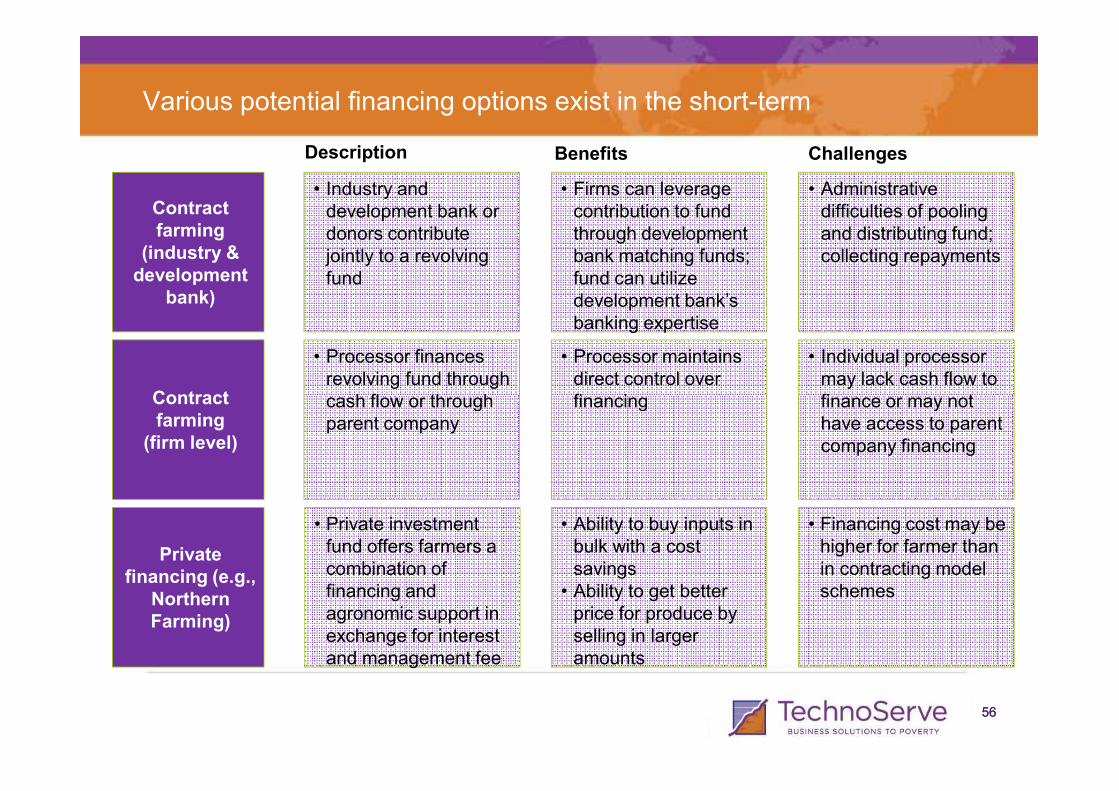
Various potential financing options exist in the short-term
Contractfarming
(industry & development
bank)
Contract
• Industry and development bank or donors contribute jointly to a revolving fund
• Firms can leverage contribution to fund through development bank matching funds; fund can utilize development bank’s banking expertise
• Administrative difficulties of pooling and distributing fund; collecting repayments
• Processor finances revolving fund through cash flow or through
• Processor maintains direct control over financing
• Individual processor may lack cash flow to finance or may not
Description Benefits Challenges
5656
Contract farming
(firm level)
Privatefinancing (e.g.,
Northern Farming)
cash flow or through parent company
financing finance or may not have access to parent company financing
• Private investment fund offers farmers a combination of financing and agronomic support in exchange for interest and management fee
• Ability to buy inputs in bulk with a cost savings
• Ability to get better price for produce by selling in larger amounts
• Financing cost may be higher for farmer than in contracting model schemes

• Zimbabwe only produces ~30% of its demand for soy, but considerable scope exists for growth of production
•Despite strong market demand, sophisticated processing capabilities and capacity, and the ability for commercial farmers to grow soy competitively, the soy industry is held back by a lack of financing and land complexities
•Opportunities for near-term actions to improve production exist, but full production capacity will likely only be unleashed over a longer time horizon, as key macro issues such as liquidity and land ease or are resolved
•There is the potential to increase the incomes of 35k smallholders by $138 p.a.
Agenda
5757
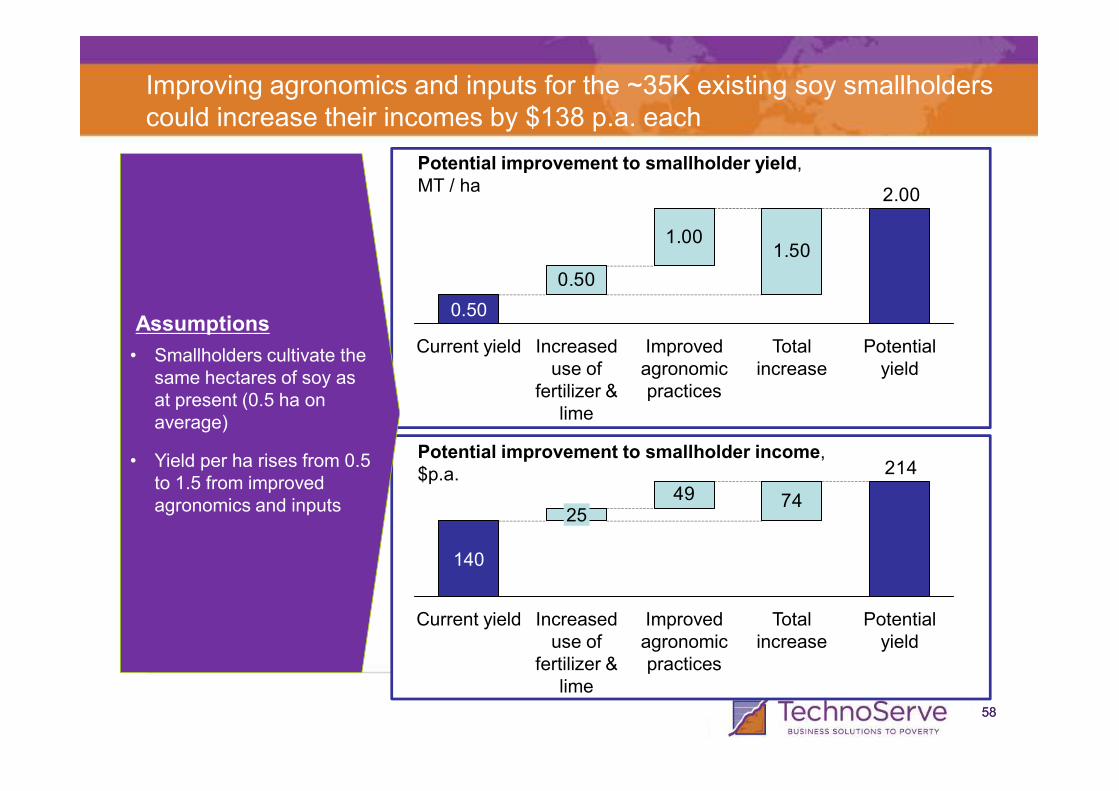
Improving agronomics and inputs for the ~35K existing soy smallholders could increase their incomes by $138 p.a. each
0.50
1.001.50
2.00
Current yield
0.50
Potential yield
Total increase
Improved agronomic practices
Increased use of
fertilizer &
Potential improvement to smallholder yield, MT / ha
Assumptions
• Smallholders cultivate the same hectares of soy as at present (0.5 ha on
5858
practicesfertilizer & lime
at present (0.5 ha on average)
• Yield per ha rises from 0.5 to 1.5 from improved agronomics and inputs
Potential improvement to smallholder income, $p.a.
7449
214
Potential yield
Total increase
Improved agronomic practices
Increased use of
fertilizer & lime
25
Current yield
140