Embed Size (px)
Citation preview

Vol. 13(2), pp. 106-118, April-June 2021
DOI: 10.5897/JDAE2021.1260
Article Number: C3628A666390
ISSN 2006-9774
Copyright ©2021
Author(s) retain the copyright of this article
http://www.academicjournals.org/JDAE
Journal of Development and Agricultural
Economics
Full Length Research Paper
To be or not to be a win-win situation, as Zimbabwe diversifies its agricultural exports in the Chinese
market: The GTAP dynamic approach
Rutendo Happy Jonga, Huang Delin*, Christopher Belford and Yosri Nasr Ahmed
Institute of Agricultural Economics and Development, Graduate School of the Chinese Academy of Agricultural
Sciences, China.
Received 2 February, 2021; Accepted 26 February, 2021
To assess the win-win of both China and Zimbabwe if Zimbabwe diversifies its agricultural exports into the Chinese market, this study employs a Computable General Equilibrium (CGE) model that is becoming popular in analyzing economic issues. With Zimbabwe having been in a constant financial and economic crisis and the major sector not contributing much to the economic growth, a bilateral Free Trade Agreement on Agriculture and Agri-based commodities between China and Zimbabwe was proposed based on the Forum for China-Africa Cooperation Action Plan (2019-2021). To evaluate the policy change, the study used a CGE and Dynamic Global Trade Analysis Project (GTAP) model 2011 and employed two policy scenarios of baseline and that of zero tariffs. By comparing the baseline and policy simulation results for the periods (2020-2030), the research found that the policy would be a win-win to both countries but with more negative impacts on Zimbabwe. The study therefore proposed some recommendations aimed at sustaining the policy change should the two countries engage in it. The recommendations included the need for agricultural research and development to boost agricultural production and exports in Zimbabwe. Key words: Computable general equilibrium dynamic model, global trade analysis project, bilateral free trade agreement, Zimbabwe, China.
INTRODUCTION Zimbabwe is a Southern African developing country classified as a low-income state since 1991-2017 (The World Bank, 2019). According to Government of Zimbabwe (2012, 2018), the agricultural sector is vital contributing 15-18% to Gross Domestic Product (GDP)
and with at least 70% of the population relying on. Therefore, its poor performance implies low economic growth and low standards of living. The country’s constant state of macroeconomic instability has resulted in depletion of foreign reserves and has led to low
*Corresponding author. E-mail: [email protected]. Tel: +86 186 1210 5186.
Author(s) agree that this article remain permanently open access under the terms of the Creative Commons Attribution
License 4.0 International License
productivity and production and importation of most of necessity goods (The World Bank 2019c). Local currencies such as Bond notes and the Zimbabwean dollar have been introduced to stabilize the exchange rate and restore the country’s competitiveness but are volatile and a black market has emerged depreciating them in the parallel market. As a result, real household incomes have decreased, price of imports has increased as the custom duties are demanded in US Dollars and a hyperinflation rate was standing at 176% as at June (Trading Economics, 2019).
According to The World Bank (2019c), one way to subside inflation is to earn more foreign currency and since the agricultural sector performance determines the overall level of people’s standards of living (Government of Zimbabwe, 2012, 2018), a rebound on that key sector would reduce the inflationary pressures and lead to economic recovery. Lamaj (2015), suggest that developing countries should use trade to build up their own economies and to improve living standards, therefore the need to liberalize trade between Zimbabwe and its trading partners. On one hand Zimbabwe has been aiming to expand its agricultural produce in the Chinese market since 2017 and to achieve its Vision 2030 of becoming a middle-income state (The Herald, 2017). China on the other hand reflected the willingness to import Zimbabwe’s agricultural products and stated that it had a ready market (Yurou, 2017). Based on the Forum for China-Africa Cooperation (FOCAC) Action Plan (2019-2021) which was established in September 2018, China vowed to build Bilateral Free Trade Agreements (FTA) with interested African countries. There lies an opportunity for Zimbabwe to engage in a bilateral FTA with China as one of its major trading partners to achieve its goals (China Daily, 2017, 2018). Therefore, the objective of this study was to assess if the bilateral FTA would be a win-win situation for both countries with the main concern being on Zimbabwe’s economy.
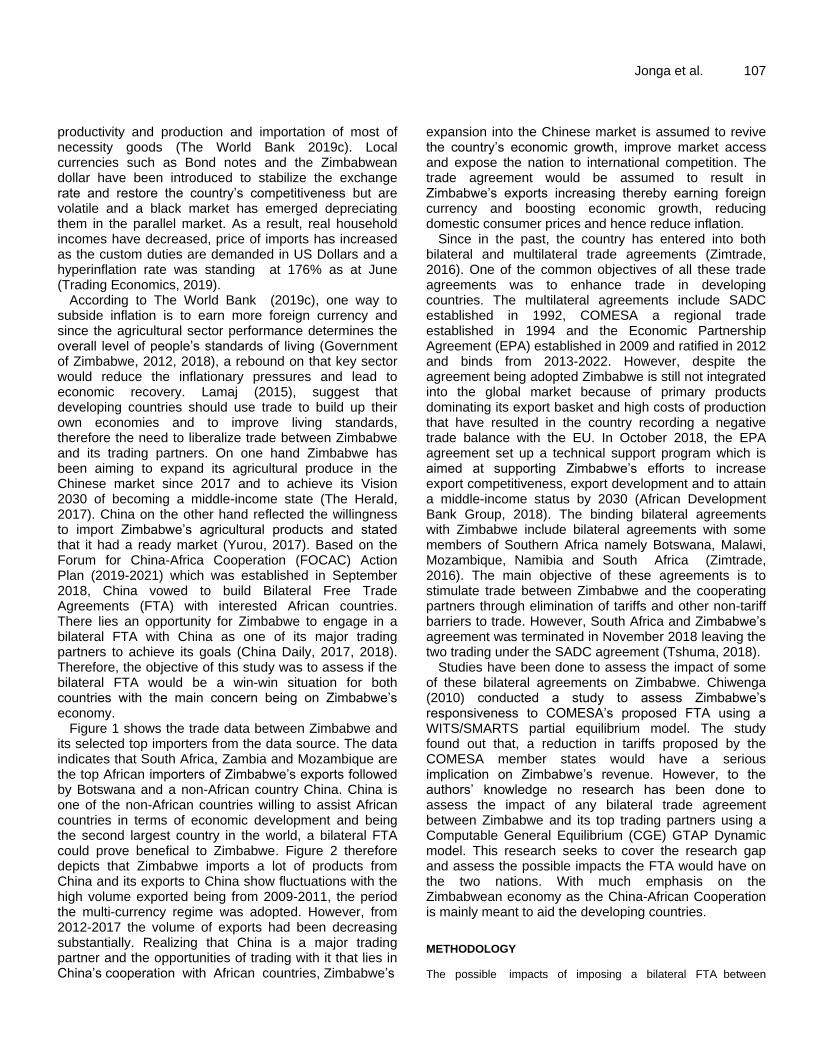
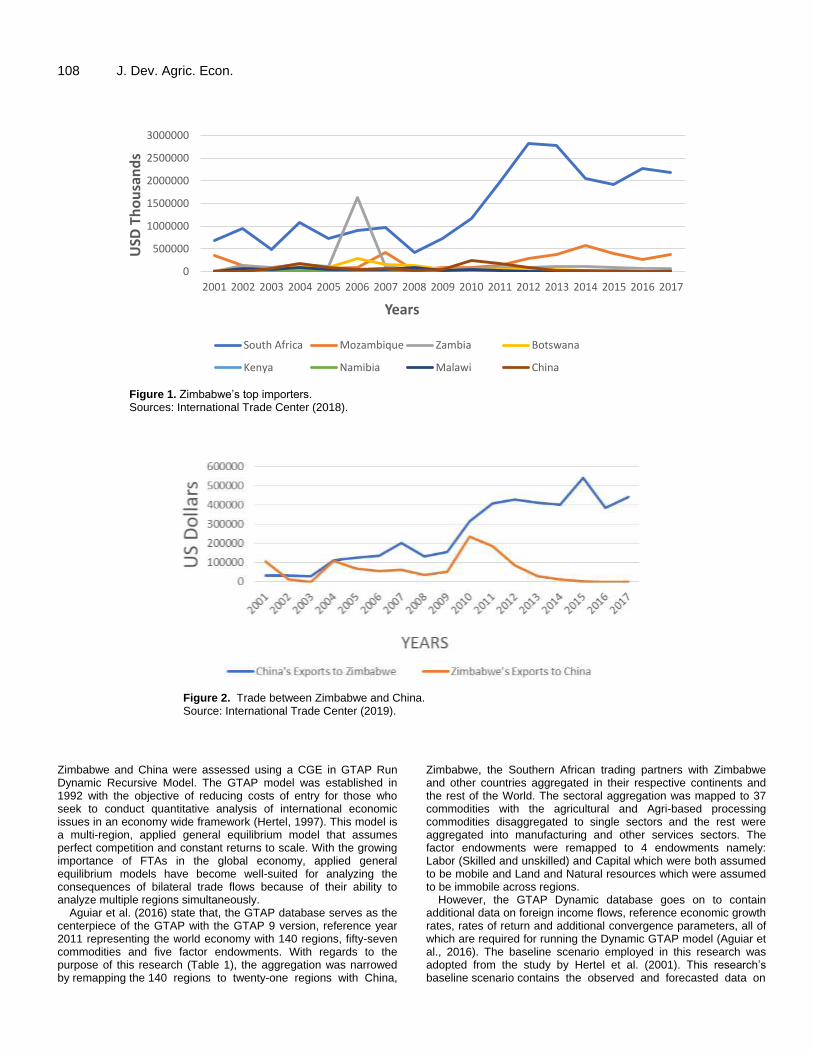
Figure 1 shows the trade data between Zimbabwe and its selected top importers from the data source. The data indicates that South Africa, Zambia and Mozambique are the top African importers of Zimbabwe’s exports followed by Botswana and a non-African country China. China is one of the non-African countries willing to assist African countries in terms of economic development and being the second largest country in the world, a bilateral FTA could prove benefical to Zimbabwe. Figure 2 therefore depicts that Zimbabwe imports a lot of products from China and its exports to China show fluctuations with the high volume exported being from 2009-2011, the period the multi-currency regime was adopted. However, from 2012-2017 the volume of exports had been decreasing substantially. Realizing that China is a major trading partner and the opportunities of trading with it that lies in China’s cooperation with African countries, Zimbabwe’s
Jonga et al. 107 expansion into the Chinese market is assumed to revive the country’s economic growth, improve market access and expose the nation to international competition. The trade agreement would be assumed to result in Zimbabwe’s exports increasing thereby earning foreign currency and boosting economic growth, reducing domestic consumer prices and hence reduce inflation.
Since in the past, the country has entered into both bilateral and multilateral trade agreements (Zimtrade, 2016). One of the common objectives of all these trade agreements was to enhance trade in developing countries. The multilateral agreements include SADC established in 1992, COMESA a regional trade established in 1994 and the Economic Partnership Agreement (EPA) established in 2009 and ratified in 2012 and binds from 2013-2022. However, despite the agreement being adopted Zimbabwe is still not integrated into the global market because of primary products dominating its export basket and high costs of production that have resulted in the country recording a negative trade balance with the EU. In October 2018, the EPA agreement set up a technical support program which is aimed at supporting Zimbabwe’s efforts to increase export competitiveness, export development and to attain a middle-income status by 2030 (African Development Bank Group, 2018). The binding bilateral agreements with Zimbabwe include bilateral agreements with some members of Southern Africa namely Botswana, Malawi, Mozambique, Namibia and South Africa (Zimtrade, 2016). The main objective of these agreements is to stimulate trade between Zimbabwe and the cooperating partners through elimination of tariffs and other non-tariff barriers to trade. However, South Africa and Zimbabwe’s agreement was terminated in November 2018 leaving the two trading under the SADC agreement (Tshuma, 2018).
Studies have been done to assess the impact of some of these bilateral agreements on Zimbabwe. Chiwenga (2010) conducted a study to assess Zimbabwe’s responsiveness to COMESA’s proposed FTA using a WITS/SMARTS partial equilibrium model. The study found out that, a reduction in tariffs proposed by the COMESA member states would have a serious implication on Zimbabwe’s revenue. However, to the authors’ knowledge no research has been done to assess the impact of any bilateral trade agreement between Zimbabwe and its top trading partners using a Computable General Equilibrium (CGE) GTAP Dynamic model. This research seeks to cover the research gap and assess the possible impacts the FTA would have on the two nations. With much emphasis on the Zimbabwean economy as the China-African Cooperation is mainly meant to aid the developing countries.
METHODOLOGY
The possible impacts of imposing a bilateral FTA between
108 J. Dev. Agric. Econ.
Figure 1. Zimbabwe’s top importers. Sources: International Trade Center (2018).
Figure 2. Trade between Zimbabwe and China. Source: International Trade Center (2019).
Zimbabwe and China were assessed using a CGE in GTAP Run Dynamic Recursive Model. The GTAP model was established in 1992 with the objective of reducing costs of entry for those who seek to conduct quantitative analysis of international economic issues in an economy wide framework (Hertel, 1997). This model is a multi-region, applied general equilibrium model that assumes perfect competition and constant returns to scale. With the growing importance of FTAs in the global economy, applied general equilibrium models have become well-suited for analyzing the consequences of bilateral trade flows because of their ability to analyze multiple regions simultaneously.
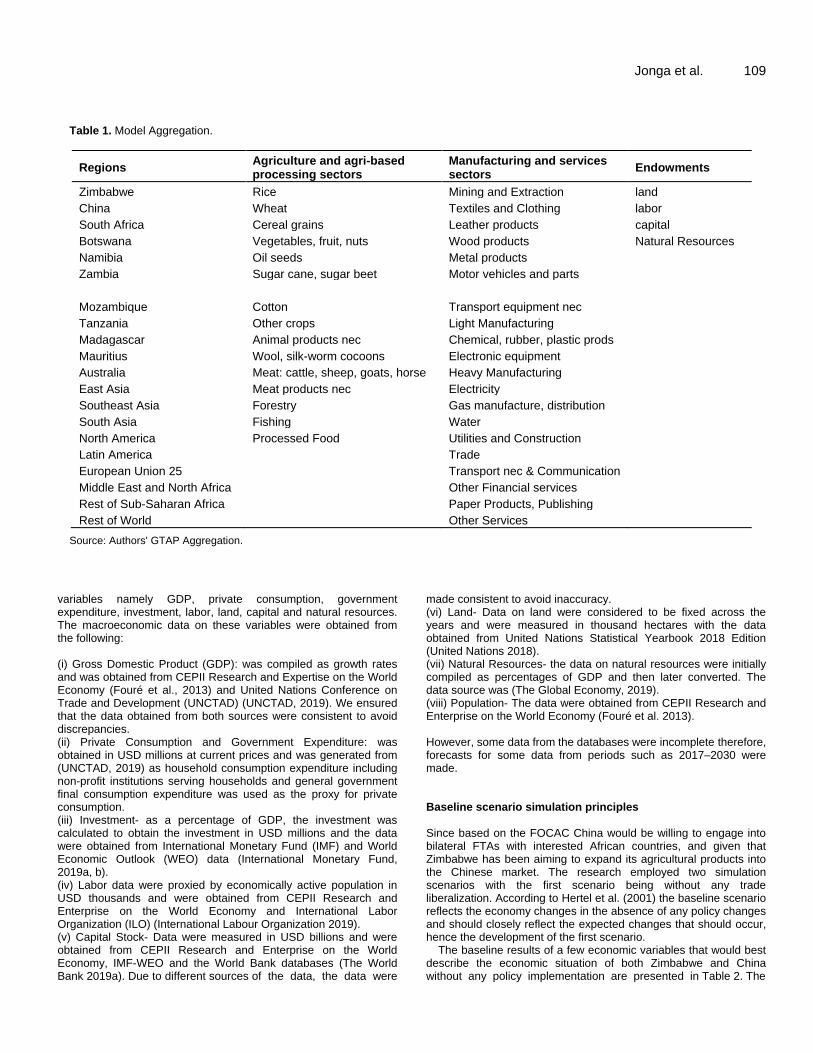
Aguiar et al. (2016) state that, the GTAP database serves as the centerpiece of the GTAP with the GTAP 9 version, reference year 2011 representing the world economy with 140 regions, fifty-seven commodities and five factor endowments. With regards to the purpose of this research (Table 1), the aggregation was narrowed by remapping the 140 regions to twenty-one regions with China,
Zimbabwe, the Southern African trading partners with Zimbabwe and other countries aggregated in their respective continents and the rest of the World. The sectoral aggregation was mapped to 37 commodities with the agricultural and Agri-based processing commodities disaggregated to single sectors and the rest were aggregated into manufacturing and other services sectors. The factor endowments were remapped to 4 endowments namely: Labor (Skilled and unskilled) and Capital which were both assumed to be mobile and Land and Natural resources which were assumed to be immobile across regions.
However, the GTAP Dynamic database goes on to contain additional data on foreign income flows, reference economic growth rates, rates of return and additional convergence parameters, all of which are required for running the Dynamic GTAP model (Aguiar et al., 2016). The baseline scenario employed in this research was adopted from the study by Hertel et al. (2001). This research’s baseline scenario contains the observed and forecasted data on
0
500000
1000000
1500000
2000000
2500000
3000000
2001 2002 2003 2004 2005 2006 2007 2008 2009 2010 2011 2012 2013 2014 2015 2016 2017
USD
Th
ou
san
ds
Years
Zimbabwe's Top Trading Partners
South Africa Mozambique Zambia Botswana
Kenya Namibia Malawi China
Jonga et al. 109
Table 1. Model Aggregation.
Regions Agriculture and agri-based processing sectors
Manufacturing and services sectors
Endowments
Zimbabwe Rice Mining and Extraction land
China Wheat Textiles and Clothing labor
South Africa Cereal grains Leather products capital
Botswana Vegetables, fruit, nuts Wood products Natural Resources
Namibia Oil seeds Metal products
Zambia Sugar cane, sugar beet Motor vehicles and parts
Mozambique Cotton Transport equipment nec
Tanzania Other crops Light Manufacturing
Madagascar Animal products nec Chemical, rubber, plastic prods
Mauritius Wool, silk-worm cocoons Electronic equipment
Australia Meat: cattle, sheep, goats, horse Heavy Manufacturing
East Asia Meat products nec Electricity
Southeast Asia Forestry Gas manufacture, distribution
South Asia Fishing Water
North America Processed Food Utilities and Construction
Latin America Trade
European Union 25 Transport nec & Communication
Middle East and North Africa Other Financial services
Rest of Sub-Saharan Africa Paper Products, Publishing
Rest of World Other Services
Source: Authors' GTAP Aggregation.
variables namely GDP, private consumption, government expenditure, investment, labor, land, capital and natural resources. The macroeconomic data on these variables were obtained from the following: (i) Gross Domestic Product (GDP): was compiled as growth rates and was obtained from CEPII Research and Expertise on the World Economy (Fouré et al., 2013) and United Nations Conference on Trade and Development (UNCTAD) (UNCTAD, 2019). We ensured that the data obtained from both sources were consistent to avoid discrepancies. (ii) Private Consumption and Government Expenditure: was obtained in USD millions at current prices and was generated from (UNCTAD, 2019) as household consumption expenditure including non-profit institutions serving households and general government final consumption expenditure was used as the proxy for private consumption. (iii) Investment- as a percentage of GDP, the investment was calculated to obtain the investment in USD millions and the data were obtained from International Monetary Fund (IMF) and World Economic Outlook (WEO) data (International Monetary Fund, 2019a, b). (iv) Labor data were proxied by economically active population in USD thousands and were obtained from CEPII Research and Enterprise on the World Economy and International Labor Organization (ILO) (International Labour Organization 2019). (v) Capital Stock- Data were measured in USD billions and were obtained from CEPII Research and Enterprise on the World Economy, IMF-WEO and the World Bank databases (The World Bank 2019a). Due to different sources of the data, the data were
made consistent to avoid inaccuracy. (vi) Land- Data on land were considered to be fixed across the years and were measured in thousand hectares with the data obtained from United Nations Statistical Yearbook 2018 Edition (United Nations 2018). (vii) Natural Resources- the data on natural resources were initially compiled as percentages of GDP and then later converted. The data source was (The Global Economy, 2019). (viii) Population- The data were obtained from CEPII Research and Enterprise on the World Economy (Fouré et al. 2013). However, some data from the databases were incomplete therefore, forecasts for some data from periods such as 2017–2030 were made. Baseline scenario simulation principles Since based on the FOCAC China would be willing to engage into bilateral FTAs with interested African countries, and given that Zimbabwe has been aiming to expand its agricultural products into the Chinese market. The research employed two simulation scenarios with the first scenario being without any trade liberalization. According to Hertel et al. (2001) the baseline scenario reflects the economy changes in the absence of any policy changes and should closely reflect the expected changes that should occur, hence the development of the first scenario.
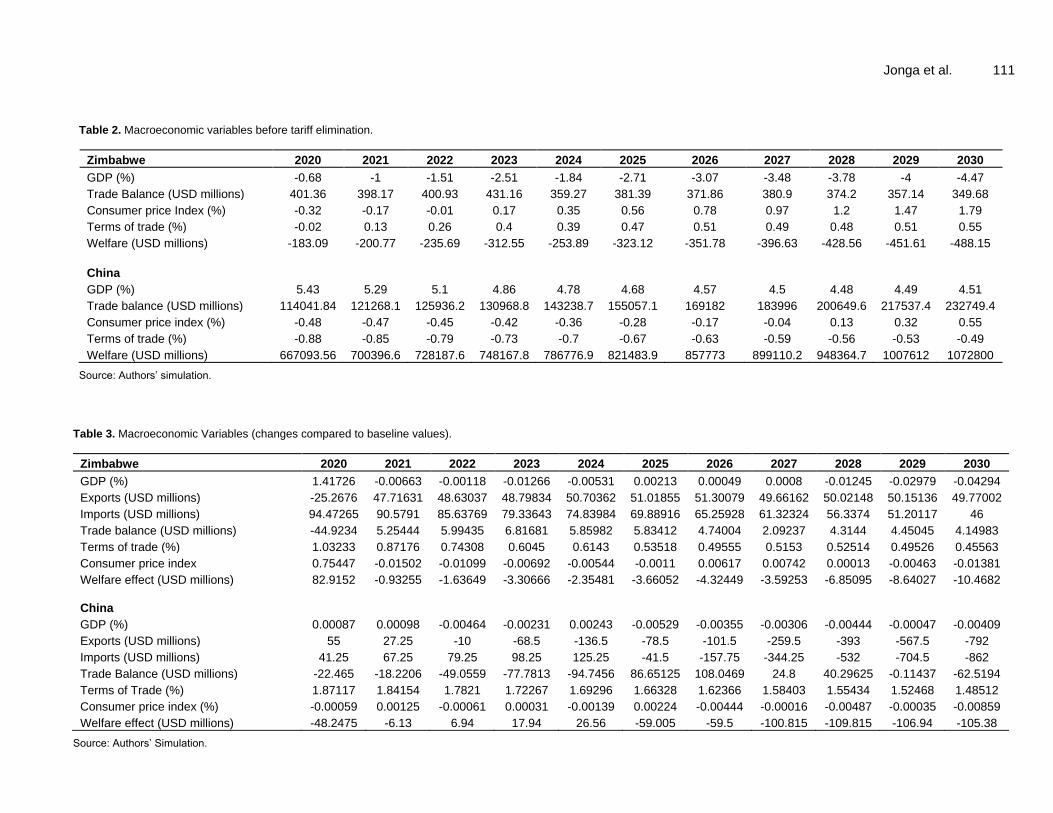
The baseline results of a few economic variables that would best describe the economic situation of both Zimbabwe and China without any policy implementation are presented in Table 2. The
110 J. Dev. Agric. Econ. GDP for Zimbabwe shows a decrease as the growth rate would be negative for the 11 successive years. That of China also indicates a decrease but the region is assumed to experience positive GDP growth rate throughout the 11 years. The trade balance for the two regions is expected to remain positive and increase for China with Zimbabwe facing a decrease from 2028-2030. The cost of buying for consumers in Zimbabwe is predicted to increase causing a high inflation in the economy however, that of China would decrease at a stable rate and then increase from 2028-2030. Terms of trade for China would be entirely negative and that of Zimbabwe would be positive. In terms of welfare, Zimbabwe is predicted to be decreasing for all the years whilst that of China indicates an increase in each of the 11 years.
Policy scenario simulation principles
The second scenario was a 100% Trade Liberalization on Agricultural and Agri-based Processing Sectors. This scenario was solely developed from the fact that Zimbabwe is willing to diversify and expand its agricultural products into its potential market, the Chinese market. The simulations were arranged in order to achieve a comparative research on whether a bilateral FTA would be a win-win situation for both the Zimbabwean and the Chinese economy. This is because according to Lamaj (2015), FTAs allow economies to specialize and to trade in commodities in which they have comparative advantage in. Therefore, the results from the policy scenario when compared to the baseline scenario were assumed to identify the gains and losses of each country.
The study then shocked an exogenous variable denoted by tms (i, r, s) which represents the change in tax on imports of a commodity. However, in order to eliminate the tariffs in the aggregated sectors the research assumed that 100% trade liberalization would imply that the import of a commodity at domestic market price (VIMS) would be equal to the import of that commodity at the world price (VIWS). Such that a division of the two (VIMS/VIWS) would yield a value of 1, which was then used as the sectoral liberalization value. The study therefore focused on these key equations:
( , , ) ( , , ) ( , ) ( , , ) ( , , )i r s i r s i s i r s i r sTMS pms tm notms pcif
(1)
(2)
(3)
(4) Where:
( , , )i r sTMS is the source specific change in tax on imports of i from
region r into region s; ( , , )i r spms represents the domestic price for
a good i supplied from r to region s; ( , )i stm is the source general
change in tax on imports of i from region r into region s;
( , , )i r snotms represents the change in non-tariff tax on imports of I
from r into s; ( , , )i r spcif being the CIF world price of a commodity
supplied from r to s; ( , , )i r sVIMS is the imports of i from r to s at
domestic market prices; ( , , )i r sVIWS the imports of i from r to s at
world prices and ( , , )i r sqxs the export sales of commodity i from r to
region s.
POST SIMULATION RESULTS
Macroeconomic impact
In analyzing the impacts of the proposed bilateral FTA on Zimbabwe and China’s economies, (Table 3) displays the changes in different macroeconomic variables from the baseline scenario. GDP is a macroeconomic variable that reflects the economic well-being of a country and international trade contributes to the GDP. When the policy is implemented, the GDP for Zimbabwe would be slightly negatively impacted as the growth rate is predicted to continue decreasing for most of the years except for the years 2020 and (2025-2027). This might be because even though agriculture is regarded as the key sector, it currently contributes 15-18% to GDP. Hence, the main focus of the nation should be trying to fully develop its agricultural sector to produce more, employ more and contribute more to the export basket and economic growth. In the case of China, there would be fluctuations on GDP with most of the years experiencing decreasing growth rates except for the years (2020, 2021 and 2024). Unlike this bilateral FTA between China and Zimbabwe a developing country, Adams (2003) and Wanlu and Jun (2012) conducted studies on the economic impacts of China’s tariff reduction on the Least Developed Countries (LDAC) and the effects of FTA between Australia and United States of America (USA) respectively. Their findings contrast with this study’s findings as they found out that their prospective bilateral FTAs would increase GDP of countries involved in FTA for all the policy simulation years.
Trade liberalization is identified as being positively related to the volume of exports and imports. An increase in the volume of exports and imports is what Zimbabwe currently needs and the proposed bilateral FTA indicates increases in both the volume of exports to China and that of imports from China. The policy would see the imports increasing but not as much as the exports, thereby allowing the nation to maintain trade surplus for all. The increase in both exports and imports might imply that the cost of importing necessities and intermediate inputs for production would have decreased allowing for more imports. Decreased import prices for intermediate inputs
( , , ) ( , , ) ( , , )*i r s i r s i r sVIMS pms qxs
( , , ) ( , , ) ( , , )*i r s i r s i r sVIWS pcif qxs
( , , )
( , , )
1i r s
i r s
VIMSVIWS
Jonga et al. 111
Table 2. Macroeconomic variables before tariff elimination.
Zimbabwe 2020 2021 2022 2023 2024 2025 2026 2027 2028 2029 2030
GDP (%) -0.68 -1 -1.51 -2.51 -1.84 -2.71 -3.07 -3.48 -3.78 -4 -4.47
Trade Balance (USD millions) 401.36 398.17 400.93 431.16 359.27 381.39 371.86 380.9 374.2 357.14 349.68
Consumer price Index (%) -0.32 -0.17 -0.01 0.17 0.35 0.56 0.78 0.97 1.2 1.47 1.79
Terms of trade (%) -0.02 0.13 0.26 0.4 0.39 0.47 0.51 0.49 0.48 0.51 0.55
Welfare (USD millions) -183.09 -200.77 -235.69 -312.55 -253.89 -323.12 -351.78 -396.63 -428.56 -451.61 -488.15
China
GDP (%) 5.43 5.29 5.1 4.86 4.78 4.68 4.57 4.5 4.48 4.49 4.51
Trade balance (USD millions) 114041.84 121268.1 125936.2 130968.8 143238.7 155057.1 169182 183996 200649.6 217537.4 232749.4
Consumer price index (%) -0.48 -0.47 -0.45 -0.42 -0.36 -0.28 -0.17 -0.04 0.13 0.32 0.55
Terms of trade (%) -0.88 -0.85 -0.79 -0.73 -0.7 -0.67 -0.63 -0.59 -0.56 -0.53 -0.49
Welfare (USD millions) 667093.56 700396.6 728187.6 748167.8 786776.9 821483.9 857773 899110.2 948364.7 1007612 1072800
Source: Authors’ simulation.
Table 3. Macroeconomic Variables (changes compared to baseline values).
Zimbabwe 2020 2021 2022 2023 2024 2025 2026 2027 2028 2029 2030
GDP (%) 1.41726 -0.00663 -0.00118 -0.01266 -0.00531 0.00213 0.00049 0.0008 -0.01245 -0.02979 -0.04294
Exports (USD millions) -25.2676 47.71631 48.63037 48.79834 50.70362 51.01855 51.30079 49.66162 50.02148 50.15136 49.77002
Imports (USD millions) 94.47265 90.5791 85.63769 79.33643 74.83984 69.88916 65.25928 61.32324 56.3374 51.20117 46
Trade balance (USD millions) -44.9234 5.25444 5.99435 6.81681 5.85982 5.83412 4.74004 2.09237 4.3144 4.45045 4.14983
Terms of trade (%) 1.03233 0.87176 0.74308 0.6045 0.6143 0.53518 0.49555 0.5153 0.52514 0.49526 0.45563
Consumer price index 0.75447 -0.01502 -0.01099 -0.00692 -0.00544 -0.0011 0.00617 0.00742 0.00013 -0.00463 -0.01381
Welfare effect (USD millions) 82.9152 -0.93255 -1.63649 -3.30666 -2.35481 -3.66052 -4.32449 -3.59253 -6.85095 -8.64027 -10.4682
China
GDP (%) 0.00087 0.00098 -0.00464 -0.00231 0.00243 -0.00529 -0.00355 -0.00306 -0.00444 -0.00047 -0.00409
Exports (USD millions) 55 27.25 -10 -68.5 -136.5 -78.5 -101.5 -259.5 -393 -567.5 -792
Imports (USD millions) 41.25 67.25 79.25 98.25 125.25 -41.5 -157.75 -344.25 -532 -704.5 -862
Trade Balance (USD millions) -22.465 -18.2206 -49.0559 -77.7813 -94.7456 86.65125 108.0469 24.8 40.29625 -0.11437 -62.5194
Terms of Trade (%) 1.87117 1.84154 1.7821 1.72267 1.69296 1.66328 1.62366 1.58403 1.55434 1.52468 1.48512
Consumer price index (%) -0.00059 0.00125 -0.00061 0.00031 -0.00139 0.00224 -0.00444 -0.00016 -0.00487 -0.00035 -0.00859
Welfare effect (USD millions) -48.2475 -6.13 6.94 17.94 26.56 -59.005 -59.5 -100.815 -109.815 -106.94 -105.38
Source: Authors’ Simulation.
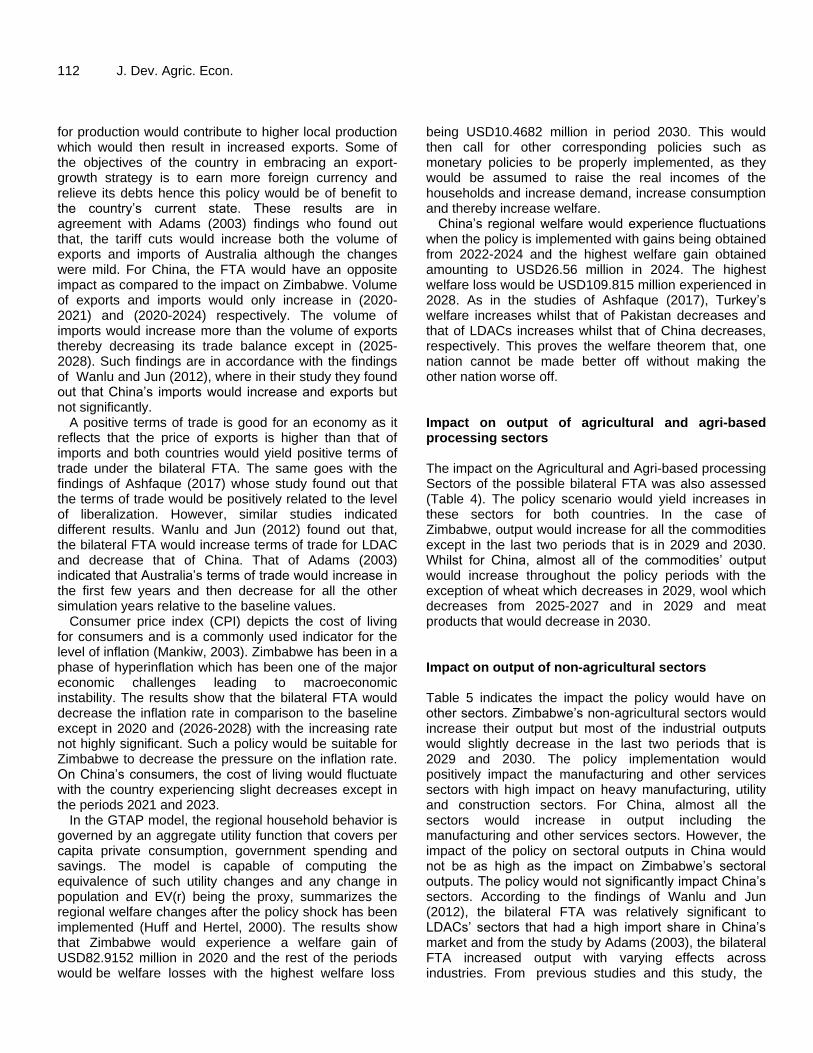
112 J. Dev. Agric. Econ. for production would contribute to higher local production which would then result in increased exports. Some of the objectives of the country in embracing an export-growth strategy is to earn more foreign currency and relieve its debts hence this policy would be of benefit to the country’s current state. These results are in agreement with Adams (2003) findings who found out that, the tariff cuts would increase both the volume of exports and imports of Australia although the changes were mild. For China, the FTA would have an opposite impact as compared to the impact on Zimbabwe. Volume of exports and imports would only increase in (2020-2021) and (2020-2024) respectively. The volume of imports would increase more than the volume of exports thereby decreasing its trade balance except in (2025-2028). Such findings are in accordance with the findings of Wanlu and Jun (2012), where in their study they found out that China’s imports would increase and exports but not significantly.
A positive terms of trade is good for an economy as it reflects that the price of exports is higher than that of imports and both countries would yield positive terms of trade under the bilateral FTA. The same goes with the findings of Ashfaque (2017) whose study found out that the terms of trade would be positively related to the level of liberalization. However, similar studies indicated different results. Wanlu and Jun (2012) found out that, the bilateral FTA would increase terms of trade for LDAC and decrease that of China. That of Adams (2003) indicated that Australia’s terms of trade would increase in the first few years and then decrease for all the other simulation years relative to the baseline values.
Consumer price index (CPI) depicts the cost of living for consumers and is a commonly used indicator for the level of inflation (Mankiw, 2003). Zimbabwe has been in a phase of hyperinflation which has been one of the major economic challenges leading to macroeconomic instability. The results show that the bilateral FTA would decrease the inflation rate in comparison to the baseline except in 2020 and (2026-2028) with the increasing rate not highly significant. Such a policy would be suitable for Zimbabwe to decrease the pressure on the inflation rate. On China’s consumers, the cost of living would fluctuate with the country experiencing slight decreases except in the periods 2021 and 2023.
In the GTAP model, the regional household behavior is governed by an aggregate utility function that covers per capita private consumption, government spending and savings. The model is capable of computing the equivalence of such utility changes and any change in population and EV(r) being the proxy, summarizes the regional welfare changes after the policy shock has been implemented (Huff and Hertel, 2000). The results show that Zimbabwe would experience a welfare gain of USD82.9152 million in 2020 and the rest of the periods would be welfare losses with the highest welfare loss
being USD10.4682 million in period 2030. This would then call for other corresponding policies such as monetary policies to be properly implemented, as they would be assumed to raise the real incomes of the households and increase demand, increase consumption and thereby increase welfare.
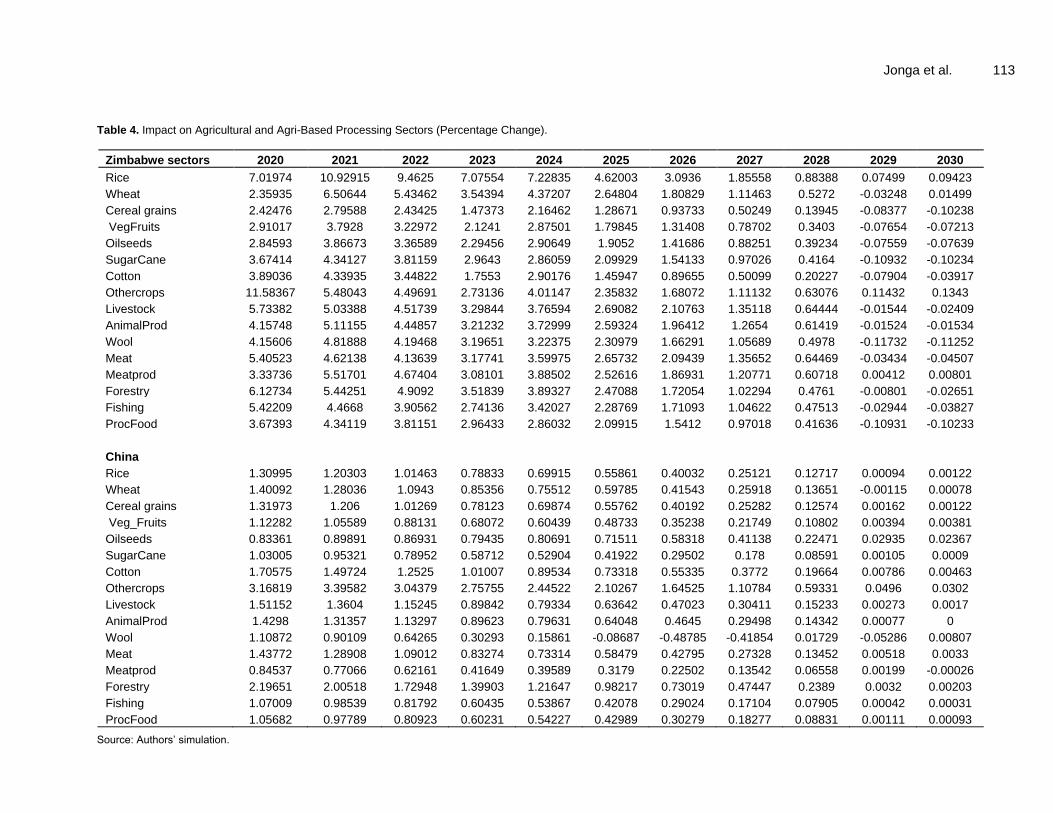
China’s regional welfare would experience fluctuations when the policy is implemented with gains being obtained from 2022-2024 and the highest welfare gain obtained amounting to USD26.56 million in 2024. The highest welfare loss would be USD109.815 million experienced in 2028. As in the studies of Ashfaque (2017), Turkey’s welfare increases whilst that of Pakistan decreases and that of LDACs increases whilst that of China decreases, respectively. This proves the welfare theorem that, one nation cannot be made better off without making the other nation worse off. Impact on output of agricultural and agri-based processing sectors The impact on the Agricultural and Agri-based processing Sectors of the possible bilateral FTA was also assessed (Table 4). The policy scenario would yield increases in these sectors for both countries. In the case of Zimbabwe, output would increase for all the commodities except in the last two periods that is in 2029 and 2030. Whilst for China, almost all of the commodities’ output would increase throughout the policy periods with the exception of wheat which decreases in 2029, wool which decreases from 2025-2027 and in 2029 and meat products that would decrease in 2030. Impact on output of non-agricultural sectors Table 5 indicates the impact the policy would have on other sectors. Zimbabwe’s non-agricultural sectors would increase their output but most of the industrial outputs would slightly decrease in the last two periods that is 2029 and 2030. The policy implementation would positively impact the manufacturing and other services sectors with high impact on heavy manufacturing, utility and construction sectors. For China, almost all the sectors would increase in output including the manufacturing and other services sectors. However, the impact of the policy on sectoral outputs in China would not be as high as the impact on Zimbabwe’s sectoral outputs. The policy would not significantly impact China’s sectors. According to the findings of Wanlu and Jun (2012), the bilateral FTA was relatively significant to LDACs’ sectors that had a high import share in China’s market and from the study by Adams (2003), the bilateral FTA increased output with varying effects across industries. From previous studies and this study, the
Jonga et al. 113
Table 4. Impact on Agricultural and Agri-Based Processing Sectors (Percentage Change).
Zimbabwe sectors 2020 2021 2022 2023 2024 2025 2026 2027 2028 2029 2030
Rice 7.01974 10.92915 9.4625 7.07554 7.22835 4.62003 3.0936 1.85558 0.88388 0.07499 0.09423
Wheat 2.35935 6.50644 5.43462 3.54394 4.37207 2.64804 1.80829 1.11463 0.5272 -0.03248 0.01499
Cereal grains 2.42476 2.79588 2.43425 1.47373 2.16462 1.28671 0.93733 0.50249 0.13945 -0.08377 -0.10238
VegFruits 2.91017 3.7928 3.22972 2.1241 2.87501 1.79845 1.31408 0.78702 0.3403 -0.07654 -0.07213
Oilseeds 2.84593 3.86673 3.36589 2.29456 2.90649 1.9052 1.41686 0.88251 0.39234 -0.07559 -0.07639
SugarCane 3.67414 4.34127 3.81159 2.9643 2.86059 2.09929 1.54133 0.97026 0.4164 -0.10932 -0.10234
Cotton 3.89036 4.33935 3.44822 1.7553 2.90176 1.45947 0.89655 0.50099 0.20227 -0.07904 -0.03917
Othercrops 11.58367 5.48043 4.49691 2.73136 4.01147 2.35832 1.68072 1.11132 0.63076 0.11432 0.1343
Livestock 5.73382 5.03388 4.51739 3.29844 3.76594 2.69082 2.10763 1.35118 0.64444 -0.01544 -0.02409
AnimalProd 4.15748 5.11155 4.44857 3.21232 3.72999 2.59324 1.96412 1.2654 0.61419 -0.01524 -0.01534
Wool 4.15606 4.81888 4.19468 3.19651 3.22375 2.30979 1.66291 1.05689 0.4978 -0.11732 -0.11252
Meat 5.40523 4.62138 4.13639 3.17741 3.59975 2.65732 2.09439 1.35652 0.64469 -0.03434 -0.04507
Meatprod 3.33736 5.51701 4.67404 3.08101 3.88502 2.52616 1.86931 1.20771 0.60718 0.00412 0.00801
Forestry 6.12734 5.44251 4.9092 3.51839 3.89327 2.47088 1.72054 1.02294 0.4761 -0.00801 -0.02651
Fishing 5.42209 4.4668 3.90562 2.74136 3.42027 2.28769 1.71093 1.04622 0.47513 -0.02944 -0.03827
ProcFood 3.67393 4.34119 3.81151 2.96433 2.86032 2.09915 1.5412 0.97018 0.41636 -0.10931 -0.10233
China
Rice 1.30995 1.20303 1.01463 0.78833 0.69915 0.55861 0.40032 0.25121 0.12717 0.00094 0.00122
Wheat 1.40092 1.28036 1.0943 0.85356 0.75512 0.59785 0.41543 0.25918 0.13651 -0.00115 0.00078
Cereal grains 1.31973 1.206 1.01269 0.78123 0.69874 0.55762 0.40192 0.25282 0.12574 0.00162 0.00122
Veg_Fruits 1.12282 1.05589 0.88131 0.68072 0.60439 0.48733 0.35238 0.21749 0.10802 0.00394 0.00381
Oilseeds 0.83361 0.89891 0.86931 0.79435 0.80691 0.71511 0.58318 0.41138 0.22471 0.02935 0.02367
SugarCane 1.03005 0.95321 0.78952 0.58712 0.52904 0.41922 0.29502 0.178 0.08591 0.00105 0.0009
Cotton 1.70575 1.49724 1.2525 1.01007 0.89534 0.73318 0.55335 0.3772 0.19664 0.00786 0.00463
Othercrops 3.16819 3.39582 3.04379 2.75755 2.44522 2.10267 1.64525 1.10784 0.59331 0.0496 0.0302
Livestock 1.51152 1.3604 1.15245 0.89842 0.79334 0.63642 0.47023 0.30411 0.15233 0.00273 0.0017
AnimalProd 1.4298 1.31357 1.13297 0.89623 0.79631 0.64048 0.4645 0.29498 0.14342 0.00077 0
Wool 1.10872 0.90109 0.64265 0.30293 0.15861 -0.08687 -0.48785 -0.41854 0.01729 -0.05286 0.00807
Meat 1.43772 1.28908 1.09012 0.83274 0.73314 0.58479 0.42795 0.27328 0.13452 0.00518 0.0033
Meatprod 0.84537 0.77066 0.62161 0.41649 0.39589 0.3179 0.22502 0.13542 0.06558 0.00199 -0.00026
Forestry 2.19651 2.00518 1.72948 1.39903 1.21647 0.98217 0.73019 0.47447 0.2389 0.0032 0.00203
Fishing 1.07009 0.98539 0.81792 0.60435 0.53867 0.42078 0.29024 0.17104 0.07905 0.00042 0.00031
ProcFood 1.05682 0.97789 0.80923 0.60231 0.54227 0.42989 0.30279 0.18277 0.08831 0.00111 0.00093
Source: Authors’ simulation.
114 J. Dev. Agric. Econ.
Table 5. Impact on manufacturing and other services sectors (percentage change).
Zimbabwe sectors 2020 2021 2022 2023 2024 2025 2026 2027 2028 2029 2030
Extraction 5.77761 5.44929 4.44242 2.73537 3.58049 2.14419 1.4912 0.9487 0.48127 0.01708 0.01542
TextWapp 4.84502 5.10432 4.43157 3.29884 3.65499 2.6238 2.00268 1.29559 0.63002 -0.01684 -0.02157
Leather 2.79774 5.14334 4.33845 3.01069 3.37431 2.26572 1.62978 1.00259 0.44157 -0.08706 -0.07009
Wood_Paper 4.57788 5.52851 4.7684 3.82119 4.08143 3.08592 2.35901 1.5735 0.79196 -0.0239 -0.0193
Metals 3.39231 4.39631 3.476 2.6223 2.11873 1.54385 1.04028 0.80687 0.51562 0.07856 0.0826
Vehicles 8.38091 7.79504 6.71429 5.21226 5.17582 3.82131 2.87044 1.88338 0.93894 0.01896 0.02711
TransEquip 6.06503 5.89726 4.88645 3.53192 3.67675 2.52634 1.7847 1.13072 0.55362 0.01427 0.08288
LightMnfc 5.20866 5.36271 4.61484 3.4505 3.56742 2.54931 1.87109 1.19803 0.55316 -0.0851 -0.08606
Petro_coal 6.12818 5.80131 5.0078 3.89272 3.70441 2.68523 1.94661 1.29162 0.64372 0.01406 0.0115
Chemicals 6.07151 5.571 4.43697 3.46161 3.06933 2.23898 1.5636 1.0552 0.58388 0.03178 0.02601
Electric Equip 7.90346 7.42446 6.29939 4.77423 4.71108 3.40634 2.48461 1.62899 0.8108 0.00117 0.05782
HeavyMnfc 10.22609 10.32804 8.75964 6.94918 6.28757 4.70126 3.40627 2.30174 1.19546 0.0427 0.1245
Electricity 3.46737 3.95047 3.49542 2.95883 2.47682 2.09072 1.59633 1.2219 0.71603 0.07053 0.06447
GasManuf 3.34574 4.97273 4.00522 4.14786 1.83583 1.86609 1.30548 1.18014 0.81672 0.15753 0.15017
Water 5.2805 4.45682 3.9388 2.99833 3.33453 2.45355 1.90936 1.25933 0.6247 -0.00611 -0.02194
Util_Cons 47.39375 45.18111 43.03262 38.98549 39.72738 35.04133 30.89078 24.8668 15.69375 -1.83934 -8.96701
Trade 6.92685 5.74903 4.94646 3.45928 4.16727 2.80967 2.08341 1.26385 0.55241 -0.06722 -0.07662
Transports 3.73668 3.30867 2.68499 1.64117 2.09092 1.23177 0.82469 0.46681 0.19321 -0.01824 -0.02119
TransComm 2.60189 2.36262 1.88924 1.22822 1.30726 0.81169 0.5241 0.3059 0.14079 0.00146 0.00034
Finance 4.22652 3.48919 2.84075 1.57061 2.50126 1.3768 0.92747 0.56548 0.28312 -0.00481 -0.0037
OthServices 4.85766 4.01655 3.49856 2.47494 3.01563 2.06878 1.56963 1.00235 0.48114 -0.01893 -0.03292
China
Extraction 2.6018 2.41065 2.17801 1.81508 1.57337 1.3034 0.98593 0.65271 0.32458 0.001 0.00071
TextWapp 0.84904 0.72756 0.54164 0.35643 0.35321 0.2745 0.20236 0.12854 0.06731 0.00282 0.00075
Leather 1.06173 0.90747 0.74441 0.52039 0.46636 0.38241 0.29859 0.20142 0.1038 0.00683 0.00395
Wood_Paper 2.00265 1.8163 1.56196 1.26016 1.09566 0.88403 0.66132 0.43274 0.21863 0.00303 0.00153
Metals 2.5206 2.26602 1.92796 1.59109 1.41879 1.15617 0.86321 0.57938 0.30589 -0.00069 -0.00079
Vehicles 3.0848 2.83591 2.51684 2.16602 1.89944 1.55781 1.16955 0.78324 0.40135 -0.00016 0.0002
TransEquip 2.92037 2.62711 2.29317 1.94204 1.69538 1.38629 1.05533 0.72217 0.38119 0.00402 0.00352
LightMnfc 2.0927 1.88876 1.66069 1.38911 1.20395 0.98374 0.75896 0.51448 0.26463 0.00151 0.00076
Petro_coal 1.68698 1.52774 1.30515 1.0324 0.91298 0.73066 0.5312 0.34047 0.1686 0.0007 0.00057
Chemicals 2.00192 1.78719 1.49481 1.17815 1.03348 0.8214 0.60356 0.39139 0.19969 0.00226 0.00155
Electric Equip 1.51827 1.34827 1.02364 0.70182 0.63076 0.469 0.31769 0.18831 0.09916 -0.00138 -0.00105
HeavyMnfc 3.13663 2.8565 2.47496 2.09347 1.84615 1.5064 1.13321 0.76401 0.39988 -0.00585 -0.00366
Electricity 1.88096 1.70091 1.45135 1.16071 1.0226 0.82153 0.60212 0.38997 0.19592 0.00058 0.00039

Jonga et al. 115
Table 5. Cont’d.
GasManuf 0.67365 0.5665 0.3985 0.24256 0.24205 0.15909 0.0849 0.03552 0.01302 0.00029 0.00038
Water 1.37915 1.24174 1.04195 0.79376 0.69251 0.53977 0.37913 0.23176 0.10862 0.00065 0.00039
Util_Cons 4.0591 3.80139 3.50661 3.14731 2.78468 2.34205 1.80773 1.2493 0.64995 -0.00245 -0.00165
Trade 1.69217 1.53346 1.30035 1.0153 0.89007 0.70208 0.49842 0.3103 0.149 0.00017 0.00027
Transports 2.0199 1.84806 1.61576 1.33621 1.17235 0.94947 0.70005 0.45684 0.22789 6E-05 0.00017
TransComm 1.59143 1.4435 1.22924 0.97238 0.85329 0.67806 0.48979 0.31036 0.15172 0.0005 0.00062
Finance 1.6901 1.52783 1.29578 1.01725 0.88968 0.70438 0.50641 0.31956 0.15548 0.00045 0.00047
OthServices 1.29868 1.17659 0.99153 0.74382 0.64752 0.49942 0.34265 0.20219 0.08967 0.00049 0.00057
Source: Authors’ simulation.
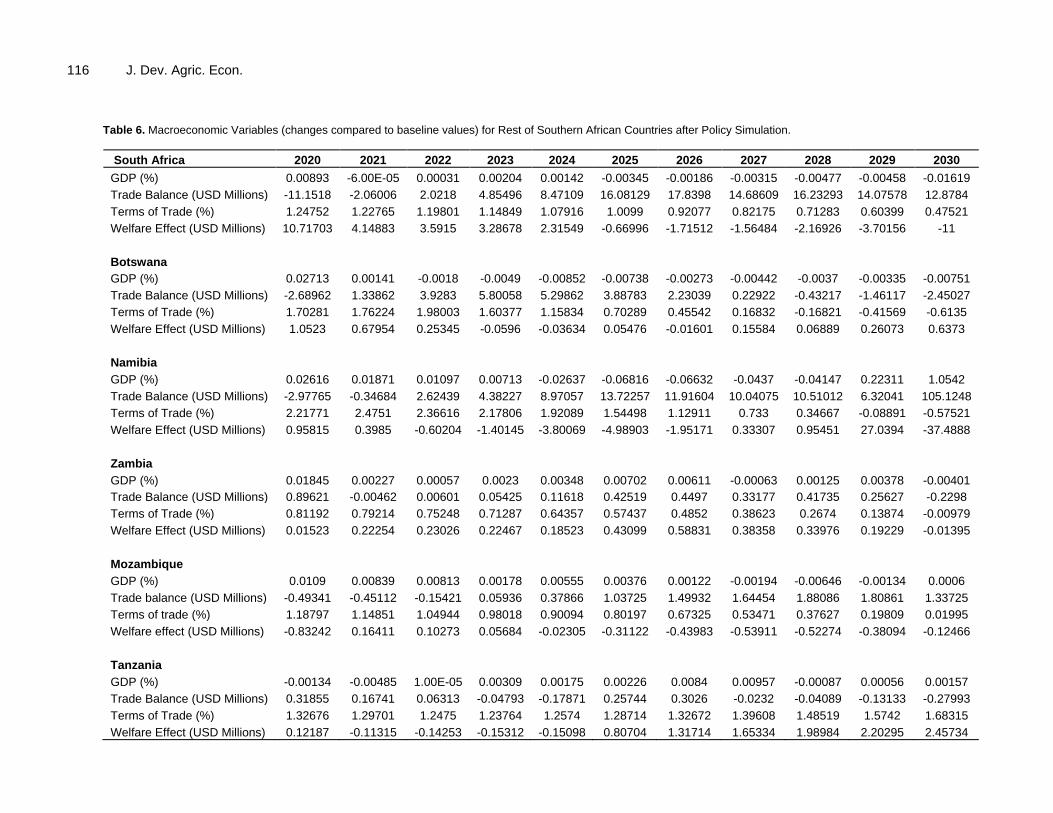
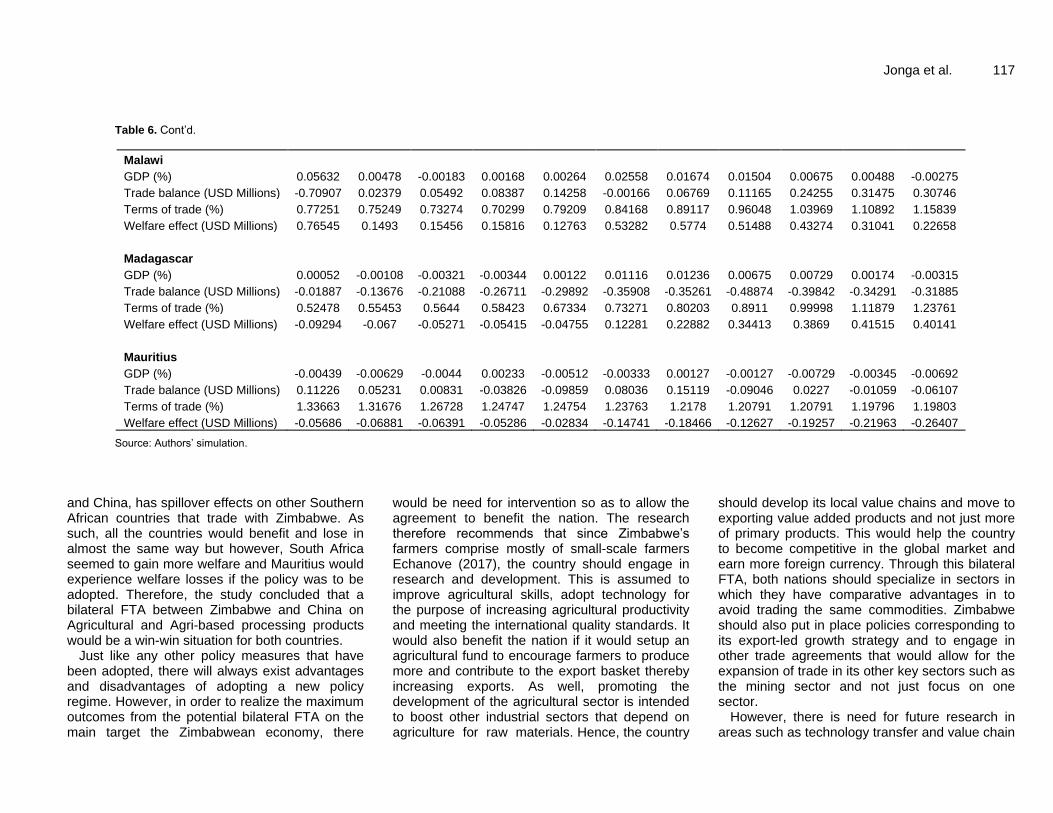
results indicate that some other industries would decrease in the long run and the other sectors not liberalized would be mildly impacted. The rest of Southern African countries The assumed bilateral FTA between Zimbabwe and China does not only impact the two nations (Table 6). The FTA would impact on the rest of Southern African countries as they are some of Zimbabwe’s trading partners involved in the FOCAC. In terms of GDP, all countries would benefit but some would experience fluctuations in the growth rates. The countries that would experience positive growth rates for most of the periods include Zambia, Mozambique, Tanzania, Malawi, Madagascar and Mauritius. South Africa, Botswana, Namibia, Zambia, Mozambique and Mauritius all experience an increase in the trade balance after the policy is implemented. Madagascar would be the only region that would experience trade deficits throughout the 11 periods. All countries would have their export prices higher than import prices as they all show a positive Terms of trade.
In terms of regional welfare, almost all the countries would experience fluctuations and obtain gains and losses as the periods pass by. South Africa would gain much welfare than other Southern African countries when the policy is adopted. With the country experiencing welfare gains from 2020-2024 and USD10.71703 million being the highest welfare gain in 2020. Namibia although it would face fluctuations, it is the only country that would gain an amount as much as USD27.04 million in 2029 and experience the highest loss of USD37.4888 million in 2030. However, Mauritius would obtain welfare losses throughout the periods when the policy is implemented. The study conducted by Hertel et al. (2001) found that, the welfare of all the other countries would decrease and this contrasts with this study’s findings as it found out that all the countries’ welfare would fluctuate with the exception of Mauritius which would face welfare loses throughout the simulation years. CONCLUSION AND RECOMMENDATIONS Trade liberalization is a phenomenon expected to
benefit the countries involved in the trade agreement. However, as is shown by the analysis of this bilateral FTA between China and Zimbabwe, not just a single trade agreement is capable of fully developing an economy to its desired state. The results of this study found that, both countries would experience more negative than positive growth rates on their economic growth. In terms of the trade components, although China would experience a decrease in the trade surplus than Zimbabwe, the policy would have a positive influence on both nations’ volume of exports and imports. The cost of living would end up being cheaper for all consumers in China and Zimbabwe as it indicates a reduction of the inflation rate. Zimbabwe however, would experience welfare losses throughout the periods except in the first period and China’s welfare would fluctuate and experience welfare gains and huge losses if the policy was implemented. The policy would positively influence all the Agricultural, Agri-based processing sectors and other manufacturing and services sectors as they all increased in output with those that decreased in the last two periods decreasing insignificantly. This bilateral FTA though aimed at Zimbabwe
116 J. Dev. Agric. Econ.
Table 6. Macroeconomic Variables (changes compared to baseline values) for Rest of Southern African Countries after Policy Simulation.
South Africa 2020 2021 2022 2023 2024 2025 2026 2027 2028 2029 2030
GDP (%) 0.00893 -6.00E-05 0.00031 0.00204 0.00142 -0.00345 -0.00186 -0.00315 -0.00477 -0.00458 -0.01619
Trade Balance (USD Millions) -11.1518 -2.06006 2.0218 4.85496 8.47109 16.08129 17.8398 14.68609 16.23293 14.07578 12.8784
Terms of Trade (%) 1.24752 1.22765 1.19801 1.14849 1.07916 1.0099 0.92077 0.82175 0.71283 0.60399 0.47521
Welfare Effect (USD Millions) 10.71703 4.14883 3.5915 3.28678 2.31549 -0.66996 -1.71512 -1.56484 -2.16926 -3.70156 -11
Botswana
GDP (%) 0.02713 0.00141 -0.0018 -0.0049 -0.00852 -0.00738 -0.00273 -0.00442 -0.0037 -0.00335 -0.00751
Trade Balance (USD Millions) -2.68962 1.33862 3.9283 5.80058 5.29862 3.88783 2.23039 0.22922 -0.43217 -1.46117 -2.45027
Terms of Trade (%) 1.70281 1.76224 1.98003 1.60377 1.15834 0.70289 0.45542 0.16832 -0.16821 -0.41569 -0.6135
Welfare Effect (USD Millions) 1.0523 0.67954 0.25345 -0.0596 -0.03634 0.05476 -0.01601 0.15584 0.06889 0.26073 0.6373
Namibia
GDP (%) 0.02616 0.01871 0.01097 0.00713 -0.02637 -0.06816 -0.06632 -0.0437 -0.04147 0.22311 1.0542
Trade Balance (USD Millions) -2.97765 -0.34684 2.62439 4.38227 8.97057 13.72257 11.91604 10.04075 10.51012 6.32041 105.1248
Terms of Trade (%) 2.21771 2.4751 2.36616 2.17806 1.92089 1.54498 1.12911 0.733 0.34667 -0.08891 -0.57521
Welfare Effect (USD Millions) 0.95815 0.3985 -0.60204 -1.40145 -3.80069 -4.98903 -1.95171 0.33307 0.95451 27.0394 -37.4888
Zambia
GDP (%) 0.01845 0.00227 0.00057 0.0023 0.00348 0.00702 0.00611 -0.00063 0.00125 0.00378 -0.00401
Trade Balance (USD Millions) 0.89621 -0.00462 0.00601 0.05425 0.11618 0.42519 0.4497 0.33177 0.41735 0.25627 -0.2298
Terms of Trade (%) 0.81192 0.79214 0.75248 0.71287 0.64357 0.57437 0.4852 0.38623 0.2674 0.13874 -0.00979
Welfare Effect (USD Millions) 0.01523 0.22254 0.23026 0.22467 0.18523 0.43099 0.58831 0.38358 0.33976 0.19229 -0.01395
Mozambique
GDP (%) 0.0109 0.00839 0.00813 0.00178 0.00555 0.00376 0.00122 -0.00194 -0.00646 -0.00134 0.0006
Trade balance (USD Millions) -0.49341 -0.45112 -0.15421 0.05936 0.37866 1.03725 1.49932 1.64454 1.88086 1.80861 1.33725
Terms of trade (%) 1.18797 1.14851 1.04944 0.98018 0.90094 0.80197 0.67325 0.53471 0.37627 0.19809 0.01995
Welfare effect (USD Millions) -0.83242 0.16411 0.10273 0.05684 -0.02305 -0.31122 -0.43983 -0.53911 -0.52274 -0.38094 -0.12466
Tanzania
GDP (%) -0.00134 -0.00485 1.00E-05 0.00309 0.00175 0.00226 0.0084 0.00957 -0.00087 0.00056 0.00157
Trade Balance (USD Millions) 0.31855 0.16741 0.06313 -0.04793 -0.17871 0.25744 0.3026 -0.0232 -0.04089 -0.13133 -0.27993
Terms of Trade (%) 1.32676 1.29701 1.2475 1.23764 1.2574 1.28714 1.32672 1.39608 1.48519 1.5742 1.68315
Welfare Effect (USD Millions) 0.12187 -0.11315 -0.14253 -0.15312 -0.15098 0.80704 1.31714 1.65334 1.98984 2.20295 2.45734
Jonga et al. 117
Table 6. Cont’d.
Malawi
GDP (%) 0.05632 0.00478 -0.00183 0.00168 0.00264 0.02558 0.01674 0.01504 0.00675 0.00488 -0.00275
Trade balance (USD Millions) -0.70907 0.02379 0.05492 0.08387 0.14258 -0.00166 0.06769 0.11165 0.24255 0.31475 0.30746
Terms of trade (%) 0.77251 0.75249 0.73274 0.70299 0.79209 0.84168 0.89117 0.96048 1.03969 1.10892 1.15839
Welfare effect (USD Millions) 0.76545 0.1493 0.15456 0.15816 0.12763 0.53282 0.5774 0.51488 0.43274 0.31041 0.22658
Madagascar
GDP (%) 0.00052 -0.00108 -0.00321 -0.00344 0.00122 0.01116 0.01236 0.00675 0.00729 0.00174 -0.00315
Trade balance (USD Millions) -0.01887 -0.13676 -0.21088 -0.26711 -0.29892 -0.35908 -0.35261 -0.48874 -0.39842 -0.34291 -0.31885
Terms of trade (%) 0.52478 0.55453 0.5644 0.58423 0.67334 0.73271 0.80203 0.8911 0.99998 1.11879 1.23761
Welfare effect (USD Millions) -0.09294 -0.067 -0.05271 -0.05415 -0.04755 0.12281 0.22882 0.34413 0.3869 0.41515 0.40141
Mauritius
GDP (%) -0.00439 -0.00629 -0.0044 0.00233 -0.00512 -0.00333 0.00127 -0.00127 -0.00729 -0.00345 -0.00692
Trade balance (USD Millions) 0.11226 0.05231 0.00831 -0.03826 -0.09859 0.08036 0.15119 -0.09046 0.0227 -0.01059 -0.06107
Terms of trade (%) 1.33663 1.31676 1.26728 1.24747 1.24754 1.23763 1.2178 1.20791 1.20791 1.19796 1.19803
Welfare effect (USD Millions) -0.05686 -0.06881 -0.06391 -0.05286 -0.02834 -0.14741 -0.18466 -0.12627 -0.19257 -0.21963 -0.26407
Source: Authors’ simulation.
and China, has spillover effects on other Southern African countries that trade with Zimbabwe. As such, all the countries would benefit and lose in almost the same way but however, South Africa seemed to gain more welfare and Mauritius would experience welfare losses if the policy was to be adopted. Therefore, the study concluded that a bilateral FTA between Zimbabwe and China on Agricultural and Agri-based processing products would be a win-win situation for both countries.
Just like any other policy measures that have been adopted, there will always exist advantages and disadvantages of adopting a new policy regime. However, in order to realize the maximum outcomes from the potential bilateral FTA on the main target the Zimbabwean economy, there
would be need for intervention so as to allow the agreement to benefit the nation. The research therefore recommends that since Zimbabwe’s farmers comprise mostly of small-scale farmers Echanove (2017), the country should engage in research and development. This is assumed to improve agricultural skills, adopt technology for the purpose of increasing agricultural productivity and meeting the international quality standards. It would also benefit the nation if it would setup an agricultural fund to encourage farmers to produce more and contribute to the export basket thereby increasing exports. As well, promoting the development of the agricultural sector is intended to boost other industrial sectors that depend on agriculture for raw materials. Hence, the country
should develop its local value chains and move to exporting value added products and not just more of primary products. This would help the country to become competitive in the global market and earn more foreign currency. Through this bilateral FTA, both nations should specialize in sectors in which they have comparative advantages in to avoid trading the same commodities. Zimbabwe should also put in place policies corresponding to its export-led growth strategy and to engage in other trade agreements that would allow for the expansion of trade in its other key sectors such as the mining sector and not just focus on one sector.
However, there is need for future research in areas such as technology transfer and value chain
118 J. Dev. Agric. Econ. development to boost the Zimbabwean agricultural sector. This is because, trade liberalization might help boost economic growth but if the country does not have the capacity to produce more and to add value to its products then it might not be able to fully potentialize the China-African Cooperation. CONFLICT OF INTERESTS The authors have not declared any conflict of interests. ACKNOWLEDGEMENTS The authors appreciate the Funding project and Dr Saidatulakmal Mohd for her sentiments to ensure the quality of this research article. REFERENCES Adams PD (2003). The Effects of a Free Trade Agreement Between
Australia and the USA with Special Reference to the Victorian Economy.Main Report. Centre of Policy Studies/Impact Centre of Working Papers:Victoria University. https://ideas.repec.org/.
African Development Bank (2018). Zimbabwe Economic Brief. https://www.afdb.org.
Aguiar A, Badri NG, McDougall R (2016). An Overview of the GTAP 9 Data Base. Journal of Global Economic Analysis 1(1):181-208.
Ashfaque A (2017). A CGE Analysis of Pakistan-Turkey Free Trade Agreement. University Library of Munich, Germany.
China Daily (2017). China vows to deepen bilateral ties with new Zimbabwean Government. China Daily News, November 30. http://www.chinadaily.com.cn.
China Daily (2018). Zimbabwe seeks deeper economic ties with China to boost economy. China Daily News, April 2. http://www.chinadaily.com.cn.
Chiwenga E (2010). Zimbabwe Responsiveness to Comesa CET. GTAP Resources. https://www.gtap.agecon.purdue.edu.
Echanove J (2017). Zimbabwe Policy Analysis. www.fanrpan.org Fouré J, Bénassy-Quéré A, Fontagné L (2013). Modelling the world
economy at the 2050 horizon. Economics of Transition and Institutional Change 21(4):617-654.
Government of Zimbabwe (2012). Comprehensive Agricultural Policy Framework.
Government of Zimbabwe (2018). National Agriculture Policy framework
2018-30. Hertel TW (1997). Global Trade Analysis: Modeling and
Applications.Purdue.: Cambridge Press University. Hertel TW, Walmsley T, Itakura K (2001). Dynamic Effects of the New
Age Free Trade Agreement between Japan and Singapore. GTAP Resources. https://www.gtap.agecon.purdue.edu.
Huff KM, Hertel T (2000). Decomposing Welfare Changes in the GTAP Model. GTAP Technical Paper. https://www.gtap.agecon.purdue.edu.
International Monetary Fund (2019). World Economic Outlook database. https://www.imf.org.
International Trade Center (2018). List of Improting Markets for a Product Exported by Zimbabwe.https://www.trademap.org.
International Trade Center (2019). Bilateral trade between China and Zimbabwe. https://www.trademap.org.
Labour Organization (2019). ILOSTAT database. https://ilostat.ilo.org/data/
Lamaj J (2015). The Impact of International Trade and Competition Market on Developing Countries,Albania.: Marin Barleti.
Mankiw GN (2003). Macroeconomics 5th edition New York.: Worth Publishers.
The Global Economy (2019). Economic growth by country. https://www.theglobaleconomy.com
The Herald (2017). Zim eyes Chinese markets for farm products. The Herald,January 17. https://www.herald.co.zw
The World Bank (2019a). Economy and Growth. https://data.worldbank.org/
The World Bank (2019b). New country classifications by income level. www.worldbank.org
The World Bank (2019c). Zimbabwe:Recent Developments. http://pubdocs.worldbank.org/
Trading Economics (2019). Zimbabwe Inflation Rate. https://tradingeconomics.com
Tshuma E (2018). Termination of the South Africa-Zimbabwe bilateral trade agreement: What does it mean for South Africa-Zimbabwe trade? Tralac Blog, November 20. https://www.tralac.org
UNCTAD (2019). Database. https://unctadstat.unctad.org/ United Nations (2018). Statistical Yearbook 2018 Edition. New York. Wanlu D, Jun Y (2012). Economic Impacts on the Least Developed
African countries by China’s Tariff Reduction: an Analysis Based on General Equilibrium Model. Paper presented at the 16th Annual Conference on Global Economic Analysis, Shanghai, China.
Yurou (2017). Chinese envoy urges Zimbabwe to tap Chinese market for its agricultural produce. Xinhua Net, August 29. http://www.xinhuanet.com.
Zimtrade (2016). Energising Zimbabwe’s export growth. http://www.tradezimbabwe.com.