Embed Size (px)
Citation preview
Date: Feb 9, 2018 From: Nuclear Waste Watch (John Jackson) To: Lucia Abellan, Environmental Assessment Officer Canadian Nuclear Safety Commission By email: [email protected] Subject line: Questions on CNL's NPDCP project CEAA Reference number: 80121 Comments: Dear Ms Abellan Attached is our submission for the public comment period open until February 13. John

1
February 9, 2018 Ms. Lucia Abellan Environmental Assessment Officer Canadian Nuclear Safety Commission Box 1046 Station B 280 Slater Street Ottawa K1P 5S9 Via e-mail: [email protected] Re: Comments Regarding adequacy of information in CNL’s Proposal for a Nuclear Power Demonstration Closure Project [EIS September 2017] Dear Ms. Abellan, I am writing to you on behalf of Nuclear Waste Watch and the Old Fort William Cottagers’ Association who are a funded participant for this environmental assessment process. In this submission, you will find preliminary comments and questions from Dr. Frank Greening, our expert, who is reviewing the radionuclide waste inventory aspect of the NPDC project. Dr. Greening’s preliminary questions and comments point out that the information that CNL has made available on the radionuclide waste inventory has serious flaws and underestimates. Notably, the EIS concludes: “The assessment has shown that the effectiveness of the engineering barriers over time and as they progressively degrade is adequate to protect the ever-decreasing radiological hazard at any given point in time” [Environmental Impact Statement (EIS) –Nuclear Power Demonstration (NPD) Closure Project, September 2017, p. 2-23]. This is the basis for CNL’s conclusion that “there are no adverse residual effects predicted” [EIS, p 2.22].

2
Correcting the flaws in CNL’s radionuclide waste inventory, which Dr. Greening has amply laid out, could produce results that would change CNL’s conclusions. Therefore, we urge CNSC to find that CNL’s EIS of September 2017 is deficient and should not proceed to a hearing. If you have any questions, don’t hesitate to contact me. Yours truly,
John Jackson Project Coordinator
<Personal Information Redacted>
<Personal Information Redacted>
3
The NPD Decommissioning Radionuclide Waste Inventory Prepared by Dr. Frank Greening
For Nuclear Waste Watch & Old Fort William Cottagers’ Association January 23, 2018
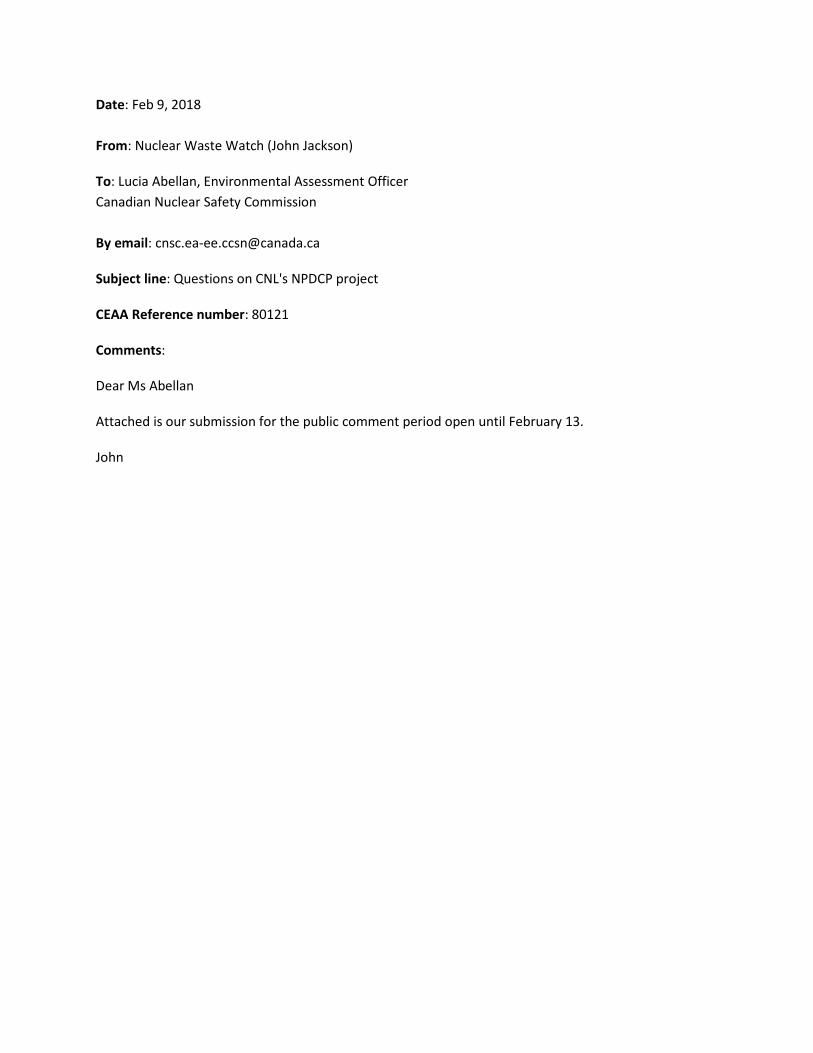
The comments and questions in this submission are based on Section 4.4.1.1 of Canadian Nuclear Laboratories (CNL) Environmental Impact Statement (EIS), which describes the “Existing Radiological Inventory.” I have attached excerpts from this section in the Appendix with this report to make it easier for the reader of this submission to refer to. From the information provided in the appendix, (taken from Section 4.4.1.1 of CNL’s Nuclear Power Demonstration (NPD) Decommissioning Report 64-509200-ENA-004), a number of generalized statements may be made concerning the nature of, and procedures used to characterize the NPD radionuclide inventory: 1. The radionuclides are expected to be primarily associated with reactor
system components such as pressure tubes, calandria, and associated structures.
2. The radionuclides are expected to be present in these materials in two forms:
a. Radionuclides embedded within metals and other materials that are
present due to neutron activation of the reactor structures. And,
b. Radioactive contamination on surfaces, mainly resulting from the handling of failed fuel elements which enables the release of radionuclides.
3. In 1988, W. M. Smith at the AECL Sheridan Park facility estimated the radionuclide inventory of the NPD reactor using neutron activation calculations, although some direct measurements of removed components have also been made. Nevertheless, according to CNL, modelled values have been used to compile the data in Table 4.4.1 in preference to measured values.

4
4. Surface contamination by fission products and actinides of items of plant, and of the building structure, has been estimated based on measurements reported by A. Gillespie in August 2017.
This intervention is based on an assessment of these points, and in particular points 3 and 4: namely, (i) The reliability of CNL’s neutron activation calculations and (ii) The reliability of CNL’s estimates of surface contamination, as discussed below:
(i) The Reliability of CNL’s Neutron Activation Calculations By way of a useful example, I have compared the data for the radionuclide content of NPD’s Zircaloy-2 pressure tubes, (as reported by W. M. Smith in his 1988 study), with the equivalent data provided in CNL’s Table 4.4.1 in the appendix. This comparison is summarized in Table 1. Table 1: Estimates of NPD’s Pressure Tube Radionuclide Inventory: Smith’s 1988 Decay Corrected Data vs. CNL’s Current (2017) Evaluation
Radionuclide
Smith’s 1988 Estimate (Decay Corrected to
2017) (Bq)
CNL’s Current Estimate (Decay Corrected to
2017) (Bq)
H-3 1.85 × 10⁸ 2.11× 10¹¹
C-14 1.13 × 10¹² 1.13 × 10¹²
Cl-36 2.53 × 10¹⁰ 2.53 × 10¹⁰
Co-60 6.70 × 10¹² 6.70 × 10¹²
Ni-63 2.68 × 10¹³ 2.63 × 10¹³
Ni-59 1.71 × 10¹¹ 1.71 × 10¹¹
Zr-93 2.00 × 10¹¹ 2.00 × 10¹¹
Nb-93m 1.66 × 10¹¹ 1.66 × 10¹¹
Ag-108m 3.24 × 10⁶ 3.24 × 10⁶

5
Sn-121m 3.98 × 10¹¹ 3.98 × 10¹¹ In comparing the activity data in columns 2 and 3 of Table 1, we see that the values for each radionuclide are essentially identical with the exception of one species: tritium, H-3. The data show that the current CNL value is 1140 times higher than Smith’s original 1988 estimated value. CNL offer no comment on, or explanation for this discrepancy. However, it is very instructive to look at other estimates of the concentration of H-3 in irradiated pressure tube material, for example, data compiled by the Canadian Nuclear Waste Management Organization (NWMO). As with the approach currently being used by CNL, in the period prior to 2015 the NWMO and Ontario Power Generation (OPG) relied solely on calculated values to estimate inventories of individual radionuclides in pressure tube waste, even though measured values of many species in a variety of irradiated pressure tube sample were readily available at that time. What is more, as explained below, measured tritium concentrations are orders of magnitude higher than the values predicted by the first-order neutron activation calculations used by NWMO to estimate radioactive waste inventories. The term “first-order calculations” refers to theoretical estimates involving only one tritium production pathway, namely neutron activation of deuterium impurities in pressure tubes via the D-2(n,γ)H-3 reaction. As installed in a CANDU reactor, pressure tubes are specified to contain less than 20 mg/kg of hydrogen. It follows that the initial concentration of deuterium in a pressure tube is very low because the natural abundance of deuterium relative to hydrogen is only 0.016 %. Nevertheless, deuterium is produced by neutron activation of hydrogen at a significant rate because of the moderate (0.33 barn) cross section of the H-1(n,γ)D-2 reaction. This leads to a slow build up of deuterium in operating pressure tubes. A pressure tube containing an initial hydrogen concentration of 10 mg/kg hydrogen will attain, (by neutron activation of hydrogen), a deuterium concentration of 0.625 mg/kg after 30 years of irradiation in a neutron flux of 1 × 10¹⁴ neutrons/cm2/s. This deuterium will itself undergo further neutron activation to produce tritium which may be calculated to attain an activity of 5.2 ×10⁶ Bq/kg at the end of 30 years. OPG’s 2010 Deep Geological Repository (DGR) Inventory Report gave its pressure tube waste
6
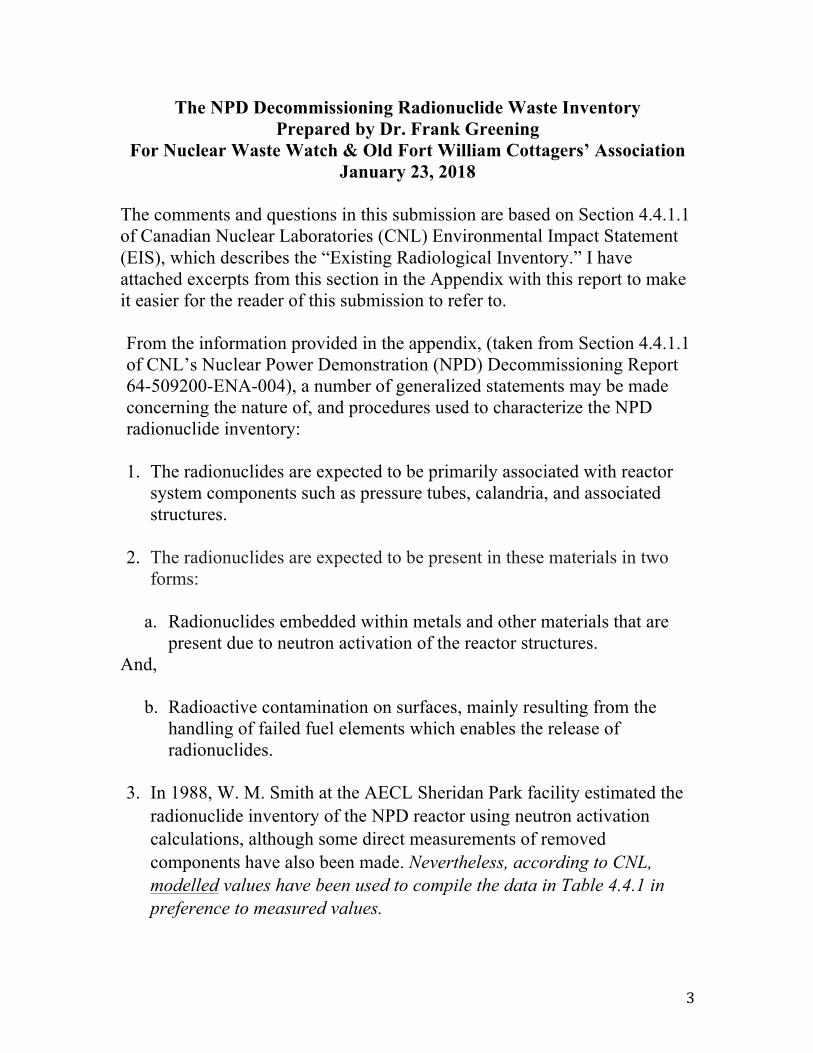
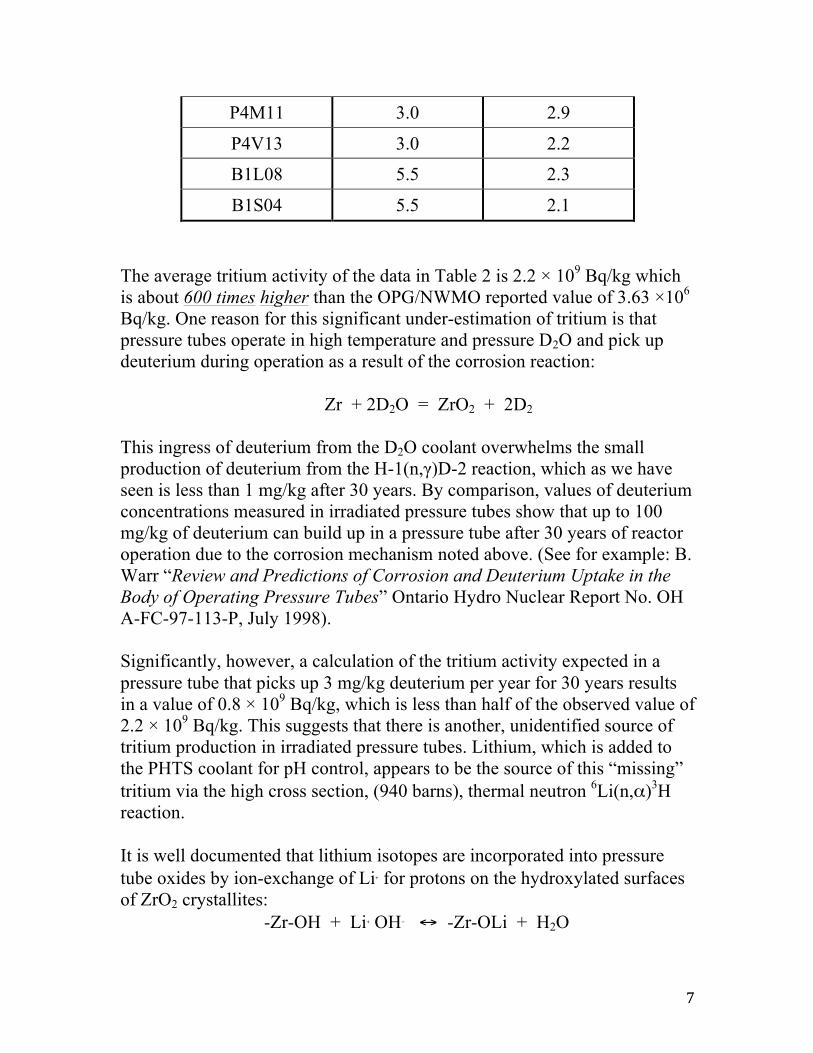
activities after a 5-year decay period to account for cooling of waste before transfer to a DGR. With this 5 years decay, first-order calculations predict a tritium activity of 3.90 ×10⁶ Bq/kg in typical pressure tube waste. This compares well with the OPG/NWMO reported value of 3.63 ×10⁶ Bq/kg. This level of agreement is encouraging; however, it becomes a moot point when we look at actual measurements of tritium in irradiated pressure tubes such as the data found in: ● A. W. Tarr et al. “Measurement of Carbon-14 and Other Long-Lived Radionuclides in Irradiated Zr-2.5 % Nb Pressure Tubes”. Proceedings of the Waste Management ‘94 Conference held in Tucson, Arizona, February 1994. ● G. R. Grant et al. “Measurement of C-14 and other Long-Lived Radionuclides in CANDU Pressure Tubes” Whiteshell Laboratory Report RC-697, November 1991 ● D. L. Moir et al. “Activities of Carbon-14 and Other Long-Lived Radionuclides on the Surface and in the Metal of Irradiated Zr-2.5Nb Pressure Tubes from the Pickering Unit 4 Reactor” CANDU Owners Group Report No. COG-94-105, June 1994 Examples of measured tritium activities in pressure tubes taken from these reports are presented in Table 2 below in units of GBq/kg, (= 1 × 10⁹ Bq/kg). Table 2: Tritium Activities Measured in Pressure Tube Samples
Pressure Tube Sample ID
Axial Location (meters)
Tritium Activity (GBq/kg ZrNb)
P3J09 2.9 2.8
P3F13 3.2 2.9
P4K10 3.2 1.7
P4N16 3.2 1.5
P4B17 3.0 1.6
7
P4M11 3.0 2.9
P4V13 3.0 2.2
B1L08 5.5 2.3
B1S04 5.5 2.1 The average tritium activity of the data in Table 2 is 2.2 × 10⁹ Bq/kg which is about 600 times higher than the OPG/NWMO reported value of 3.63 ×10⁶ Bq/kg. One reason for this significant under-estimation of tritium is that pressure tubes operate in high temperature and pressure D2O and pick up deuterium during operation as a result of the corrosion reaction: Zr + 2D2O = ZrO2 + 2D2 This ingress of deuterium from the D2O coolant overwhelms the small production of deuterium from the H-1(n,γ)D-2 reaction, which as we have seen is less than 1 mg/kg after 30 years. By comparison, values of deuterium concentrations measured in irradiated pressure tubes show that up to 100 mg/kg of deuterium can build up in a pressure tube after 30 years of reactor operation due to the corrosion mechanism noted above. (See for example: B. Warr “Review and Predictions of Corrosion and Deuterium Uptake in the Body of Operating Pressure Tubes” Ontario Hydro Nuclear Report No. OH A-FC-97-113-P, July 1998). Significantly, however, a calculation of the tritium activity expected in a pressure tube that picks up 3 mg/kg deuterium per year for 30 years results in a value of 0.8 × 10⁹ Bq/kg, which is less than half of the observed value of 2.2 × 10⁹ Bq/kg. This suggests that there is another, unidentified source of tritium production in irradiated pressure tubes. Lithium, which is added to the PHTS coolant for pH control, appears to be the source of this “missing” tritium via the high cross section, (940 barns), thermal neutron 6Li(n,α)3H reaction. It is well documented that lithium isotopes are incorporated into pressure tube oxides by ion-exchange of Li+ for protons on the hydroxylated surfaces of ZrO2 crystallites: -Zr-OH + Li+ OH− ↔ -Zr-OLi + H2O

8
(See for example: B. Cox et al. “Mechanisms of LiOH Degradation and H3BO3 Repair of ZrO2 Films” Eleventh International Symposium on Zirconium in the Nuclear Industry, September 1995). Secondary Ion Mass Spectrometry (SIMS) depth-profiling of isotopes of H, Li and Be has been carried out on the inside surface oxides of samples of irradiated pressure tube from high flux mid-channel locations. These consistently show evidence for neutron induced processes involving the transmutation sequence: 9Be → 6Li → 3H Where the underlying nuclear reactions are: 9Be(n,α)6He → 6Li And, 6Li(n,α)3H Beryllium is found at significant concentrations in the oxide scales of irradiated pressure tubes and is undoubtedly derived from the braze used to attach bearing pads to the fuel sheathing. (See for example: F.R. Greening. “The Characterization of Thick Oxide Patches on Removed Pressure Tubes: New Results for B3U11” OHT Memorandum to P. Ellis, OHN, February 1999) From available SIMS data it is possible to estimate the tritium activity in the B3U11 pressure tube oxide as a result of neutron activation of 6Li as follows: Average [6Li] ≈ 5 x 10¹⁷ atoms/cm3 in an oxide of thickness ≈ 35 µm Hence, the surface concentration of 6Li in B3U11 is 1.75 x 10¹⁵ at/cm2. 25-year activation of 6Li via the 6Li(n,α)3H reaction → 3H surface activity of 6.7 × 10⁶ Bq /cm2 1 cm2 of oxide covers ~ 2.6 g of pressure tube so the effective tritium activity is 2.5 × 10⁹ Bq/kg

9
This predicted level of tritium in the B3U11 pressure tube confirms that tritium production from Lithium-6 significantly exceeds its production from deuterium even allowing for deuterium ingress from the zirconium corrosion reaction. Furthermore, the tritium concentration measured by high temperature oxidation of the B3U11 pressure tube sample was ~ 7 × 10⁶ Bq
/cm2, in excellent agreement with the calculated tritium surface activity of 6.7 × 10⁶ Bq /cm2. But let’s look at how these considerations apply to NPD pressure tubes, and in particular, how the predicted tritium activities compare to the tritium activities proposed by CNL. First of all, if we use the measured average tritium activity of 2.2 GBq/kg reported in Table 2 and apply it to the 3830 kg of NPD pressure tube waste, we arrive at a tritium inventory of 8.4 × 10¹² Bq which is about 40 times higher than CNL’s current estimate in Table 1 of 2.11 × 10¹¹ Bq. However, we need to apply a correction factor of 0.184 for the 30 years decay of the tritium activity between the shutdown of NPD in 1987 and the date used in the CNL report, namely 2017. In this way we arrive at a predicted tritium inventory for the NPD reactor of 1.55 × 10¹² Bq, which is still more than 7 times higher than CNL’s estimate. This discrepancy needs to be resolved.
(ii) The Reliability of CNL’s Surface Contamination Estimates The radioactive contamination of NPD reactor surfaces has been estimated by CNL in Table 4.4.1 of its NPD Decommissioning Report 64-509200-ENA-004, issued in March 2016. And, as noted above, CNL’s surface contamination estimates are based on the assumption that all of the internal, and external, radioactive contamination present on surfaces of the NPD reactor stems from the escape of irradiated UO2 particulate from defective fuel bundles that are known to have been present from time to time in the NPD reactor core. Other potential sources of radioactive surface contamination are simply not considered in CNL’s report. It is certainly true that irradiated UO2 contains variable quantities of fission products, such as cesium and strontium isotopes, and transuranic species, such as plutonium, americium and curium isotopes. And these radioactive species are consistent with the radionuclides listed in column 9 of Table 4.4.1. However, surface contamination in CANDU reactors invariably also includes activated corrosion products such as Co-60, as well as tritium and carbon-14 produced by neutron activation of deuterium, oxygen and
10
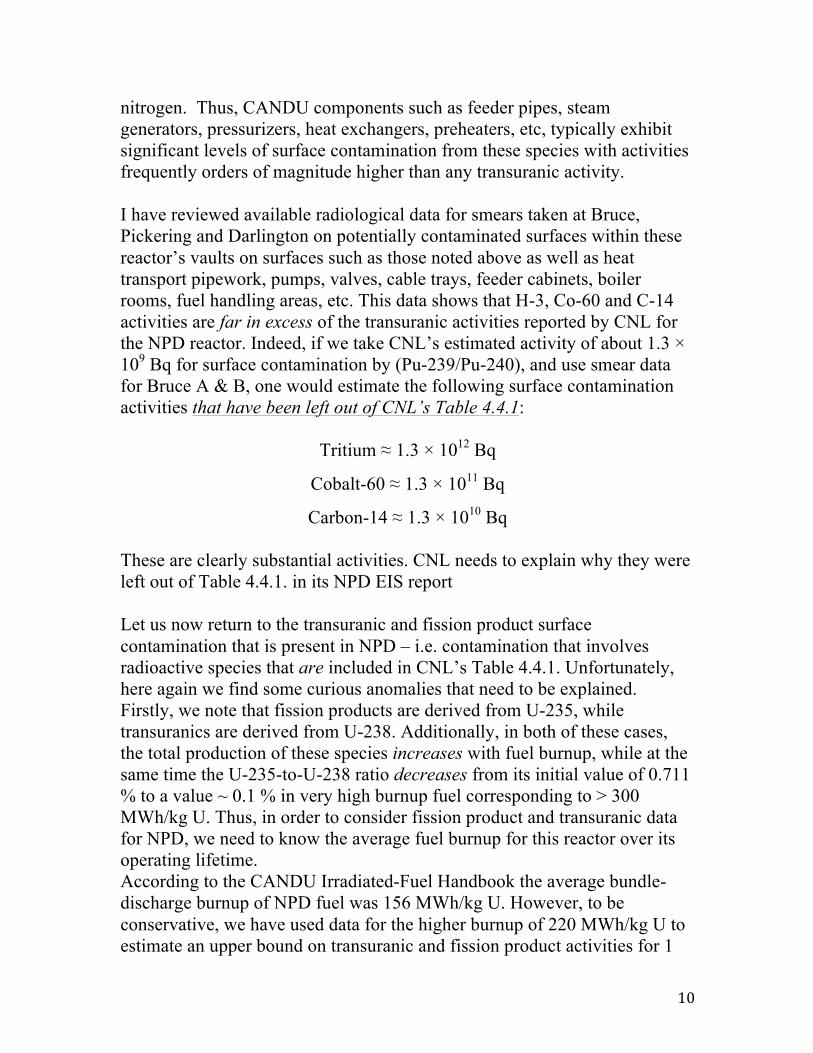
nitrogen. Thus, CANDU components such as feeder pipes, steam generators, pressurizers, heat exchangers, preheaters, etc, typically exhibit significant levels of surface contamination from these species with activities frequently orders of magnitude higher than any transuranic activity. I have reviewed available radiological data for smears taken at Bruce, Pickering and Darlington on potentially contaminated surfaces within these reactor’s vaults on surfaces such as those noted above as well as heat transport pipework, pumps, valves, cable trays, feeder cabinets, boiler rooms, fuel handling areas, etc. This data shows that H-3, Co-60 and C-14 activities are far in excess of the transuranic activities reported by CNL for the NPD reactor. Indeed, if we take CNL’s estimated activity of about 1.3 × 10⁹ Bq for surface contamination by (Pu-239/Pu-240), and use smear data for Bruce A & B, one would estimate the following surface contamination activities that have been left out of CNL’s Table 4.4.1:
Tritium ≈ 1.3 × 10¹² Bq
Cobalt-60 ≈ 1.3 × 10¹¹ Bq
Carbon-14 ≈ 1.3 × 10¹⁰ Bq These are clearly substantial activities. CNL needs to explain why they were left out of Table 4.4.1. in its NPD EIS report Let us now return to the transuranic and fission product surface contamination that is present in NPD – i.e. contamination that involves radioactive species that are included in CNL’s Table 4.4.1. Unfortunately, here again we find some curious anomalies that need to be explained. Firstly, we note that fission products are derived from U-235, while transuranics are derived from U-238. Additionally, in both of these cases, the total production of these species increases with fuel burnup, while at the same time the U-235-to-U-238 ratio decreases from its initial value of 0.711 % to a value ~ 0.1 % in very high burnup fuel corresponding to > 300 MWh/kg U. Thus, in order to consider fission product and transuranic data for NPD, we need to know the average fuel burnup for this reactor over its operating lifetime. According to the CANDU Irradiated-Fuel Handbook the average bundle-discharge burnup of NPD fuel was 156 MWh/kg U. However, to be conservative, we have used data for the higher burnup of 220 MWh/kg U to estimate an upper bound on transuranic and fission product activities for 1

11
kg of irradiated natural uranium. The equivalent data for the NPD reactor have been determined from the inventory values reported by CNL in its Table 4.1.1 which indicates there are 15.94 grams of U-238 present in the NPD reactor in the form of surface contamination derived from defective fuel. Hence, multiplication of the NPD data by a factor of 62.7 puts the values in Table 4.4.1 on a per kilogram uranium basis. The results of compiling such data are presented in Table 3 below. Table 3: NPD Surface Contamination Inventory Compared to High Burnup CANDU Fuel
After normalization to the activity of U-238, we see that many of the isotope inventories estimated by CNL for the NPD reactor surface contamination are anomalous. Thus, for example, the isotopes of uranium, when ratioed to U-238, should be identical to the ratios found in irradiated natural uranium fuel – meaning that the uranium isotope ratios listed in column eight under the heading “Ratio (NPD/Fuel)” should be equal to 1; however, clearly this is not the case. Furthermore, in the case of the three fission products listed in Table 3 – namely, Sr-90, Sb-125 and Cs-137 – we see an obvious problem with Sb-125, whose activity is orders of magnitude higher than its activity in high burnup fuel. It is suspected that the Sb-125 value reported by CNL is too high because it was not decay corrected. However, regardless of such errors for short-lived isotopes, decay corrections cannot be a major source of error for most of the other species in Table 3 because their half-lives are typically > 50 years.
Half Life Decay Constant Contam. Invent. Contam. Invent. by wt. NPD Inventory High Burnup Fuel Ratio(Years) (s-‐1) (Bq) (grams) (Bq/kg U) (Bq/kg U) (NPD/Fuel)
Sr-‐90 2.88E+01 7.62E-‐10 2.63E+10 5.157E-‐03 1.650E+12 3.476E+11 4.75Sb-‐125 2.76 7.96E-‐09 2.69E+10 7.021E-‐04 1.688E+12 5.070E+07 33285Cs-‐137 3.02E+01 7.27E-‐10 6.77E+10 2.119E-‐02 4.247E+12 5.421E+11 7.83U-‐234 2.46E+05 8.93E-‐14 5.14E+05 8.609E-‐04 3.225E+07 9.724E+06 3.32U-‐235 7.04E+08 3.12E-‐17 1.55E+03 1.940E-‐02 9.724E+04 1.390E+05 0.70U-‐236 2.34E+07 9.38E-‐16 3.75E+05 1.567E-‐01 2.353E+07 1.865E+06 12.62U-‐238 4.47E+09 4.91E-‐18 1.98E+05 1.594E+01 1.217E+07 1.212E+07 1.00Pu-‐238 8.77E+01 2.50E-‐10 1.55E+09 2.447E-‐03 9.724E+10 4.107E+09 23.68Pu-‐239 2.41E+04 9.11E-‐13 5.07E+08 2.209E-‐01 3.181E+10 6.164E+09 5.16Pu-‐240 6.56E+03 3.35E-‐12 8.05E+08 9.588E-‐02 5.050E+10 1.033E+10 4.89Pu-‐241 1.44E+01 1.52E-‐09 8.05E+09 2.113E-‐03 5.050E+11 4.444E+11 1.14Am-‐241 4.32E+02 5.08E-‐11 1.28E+09 1.008E-‐02 8.030E+10 1.480E+10 5.43Cm-‐244 1.81E+01 1.21E-‐09 9.57E+06 3.197E-‐06 6.004E+08 1.231E+09 0.49
Radionuclide
12
Conclusions In this NPD Closure Project intervention, the review for Nuclear Waste Watch and Old Fort Williams Cottagers’ Association looked at the radionuclide inventory proposed by CNL for the NPD reactor facility and identified a number of problems/errors. The most important of these are as follows:
(i) The value quoted for tritium in the reactor’s Zircaloy pressure tubes.
(ii) The omission of data for H-3, C-14 and Co-60 as surface
contaminants on reactor pipework, feeders, steam generators, pressurizers, heat exchangers, preheaters, etc.
(iii) The anomalous surface activity of Sb-125.
(iv) The anomalous surface activities of uranium and transuranic
isotopes. Questions/Requests to CNL These four problems/errors need to be dispositioned, which leads to our request that CNL provide additional information on these issues in the form of reports, memoranda, tables of data or emails, as well as factual commentary as follows: 1. Please provide the report by Gillespie, A. 2017. Waste Management Plan
for the Nuclear Power Demonstration (NPD) Closure Project. 64-508600-WMP-001. Issued Aug, 2017.
2. Please provide the report by Smith, W.M. 1988. Calculated Radioactive Inventory of NPD. 64-01631-021. Issued April, 2017.
3. Please provide the report by New Millennium Nuclear Technologies International, Inc. (NMNTI). 2017. Final Report for the Characterization of NPD Reactor Using Tru-Pro®- Technology. 64-509410-REPT-004. Issued May 2017.

13
4. Please provide a list of the assumptions and all input parameters
(including estimated masses, impurity concentrations, full-power thermal, resonance and fast neutron fluxes, cross-sections and power histories from 1962 to 1987), used in neutron activation calculations for the NPD reactor facility.
5. Please provide all hydrogen/deuterium pickup data that have been determined from the analysis of removed pressure tubes over the operating life of the NPD reactor.
6. Please provide fuel usage, fuel burnup and defect data for the NPD reactor from 1962 to 1987.
7. Please provide all available quantitative radiometric data – including data for tritium, carbon-14, activated corrosion product, fission product, uranium and transuranics – derived from direct measurements of NPD pressure tubes, garter springs, calandria tubes, calandria shells and walls, end reflectors, end fittings, tube end supports, closure plugs, fuel latch assemblies, concrete shielding, steam generators, etc.
8. Please provide all available analytical data, including gross alpha, and gross beta/gamma measurements, for smears that have been taken on contaminated surfaces within the NPD reactor vault including fuel handling areas.
9. Please provide estimates, with an associated rationale, of the uncertainties in all of the inventory data provided thus far by CNL for the NPD facility.
10. Please provide current values for the airborne and waterborne emissions from the NPD facility of tritium, C-14 and radon + radon daughters in units of Becquerels per annum.
11. It is noted in Table 9.7-4 of CNL’s EIS for the NPD facility that airborne tritium is monitored using passive air samplers. Please provide evidence

14
for the reliability of such measurements including comparisons with equivalent data collected using active tritium monitors.
15
Appendix: Excerpt from NPD Closure Project, Environmental Impact Statement 4.4.1.1 Existing Radiological Inventory The radiological inventory comprises the radionuclides that would remain in NPDWF as part of the in-situ decommissioning strategy. These will primarily be associated with the reactor system pressure tubes, calandria, and associated structures, as well as contamination within the heat transfer system, equipment for spent fuel storage and handling, facility structure and historic drummed waste. Radionuclides will be present in these materials in two forms: · radionuclides embedded within metals and other materials, present due to the interaction of neutrons from the reactor operation with the structures; and · as contamination on surfaces, mainly resulting from the handling of fuel elements which had suffered failure of their protective cladding, enabling the release of some radionuclides. The radionuclide inventory of the reactor was estimated using mathematical models representing the reactor materials and geometry (Smith 1988). CNL has also taken samples of reactor components to verify the estimated inventory (NMNTI 2017). Contamination in other items of plant, and of the building structure, has been estimated based on previous measurements (Gillespie 2017). These data have been combined with estimates of the amount of material that is contaminated in each room to derive an inventory for the main system, components or stored waste in NPDWF. The majority of the radioactivity, i.e., 75%, is contained in the reactor vault, mainly associated with the disused reactor vessel, the calandria. It is necessary to distinguish between the various materials present, as they differ in both radionuclide inventory and in terms of the mode and rate of release of radionuclides. In particular, radionuclides embedded in metals will only be released at the rate at which the metals themselves corrode, which can be very slow for materials such as zircaloy. The radiological inventory of the reactor system is therefore categorized as being associated with: · concrete (containing characteristic activation products such as Cl-36, released on contact with groundwater due to the porous nature of the material); · stainless steel (containing activation products such as Co-60, Ni-59, Ni-63 and C-14, released gradually as corrosion occurs); · carbon steel (with similar activation products to stainless steel but missing some key isotopes such as Ni-59 and Ni-63, also released by corrosion); · aluminum (with specific activation products, likely to corrode rapidly depending on water chemistry); · zircaloy (with specific activation products such as Zr-93, released very slowly by corrosion); and · surface contamination (fission products and actinides, primarily within the primary circuit) which are released instantaneously on contact with water. Table 4.4-1 presents the reference radionuclide inventory that is used in the Post SA TSD and is considered conservative. It is based on the highest estimates that have been made of radionuclide concentrations, whether by measurement or by modelling. Typically, the modelled values (from neutron activation calculations) are used in preference to measurement data for the reactor systems. For other facility systems, components and structures, measurement data has been used but includes uncertainty factors to account for measurement uncertainties.

16
References: Gillespie, A. 2017. Waste Management Plan for the Nuclear Power Demonstration (NPD) Closure Project. 64-508600-WMP-001. Prepared for CNL. Aug Smith, W.M. 1988. Calculated Radioactive Inventory of NPD. 64-01631-021. April. New Millennium Nuclear Technologies International, Inc. (NMNTI). 2017. Final Report for the Characterization of NPD Reactor Using Tru-Pro®- Technology. 64-509410-REPT-004. May