Embed Size (px)
DESCRIPTION
8,990 good reasons. …to discuss child poverty in Stockton. 1. Impact of poverty (on health). 2. Two practical examples of response. Child poverty % aged 0-15 living in income deprived households, 2010. Child poverty % aged 0-15 living in income deprived households, 2010. England = 21.8. - PowerPoint PPT Presentation
Citation preview

…to discuss child poverty in Stockton
8,990good reasons
1. Impact of poverty (on health)
2. Two practical examples of response
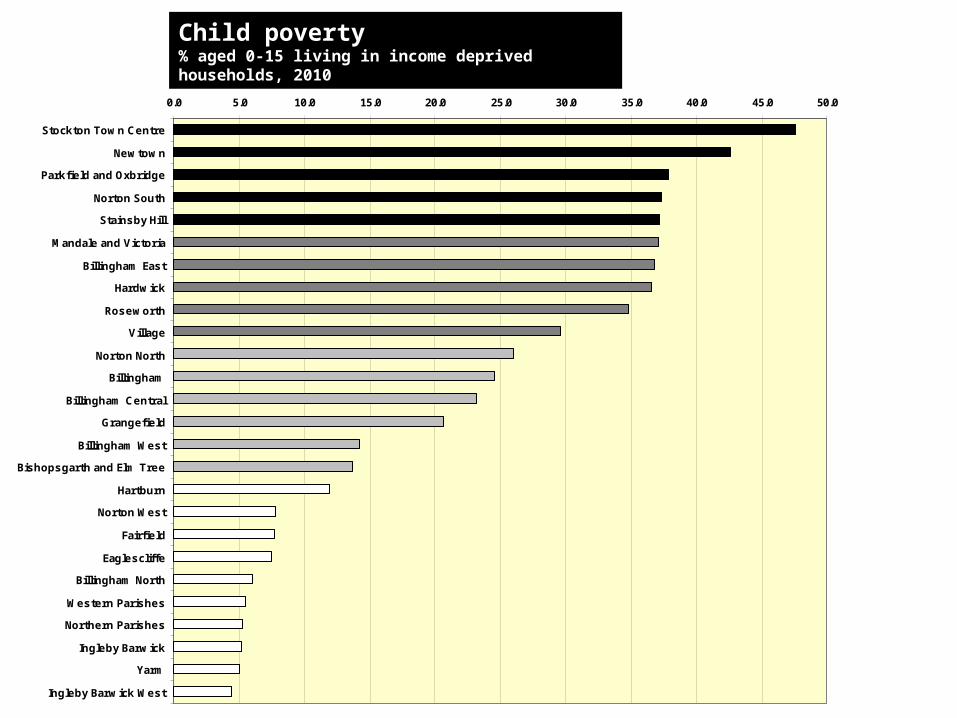
0.0 5.0 10.0 15.0 20.0 25.0 30.0 35.0 40.0 45.0 50.0
Stockton Town Centre
Newtown
Parkfield and Oxbridge
Norton South
Stainsby Hill
Mandale and Victoria
Billingham East
Hardwick
Roseworth
Village
Norton North
Billingham
Billingham Central
Grangefield
Billingham West
Bishopsgarth and Elm Tree
Hartburn
Norton West
Fairfield
Eaglescliffe
Billingham North
Western Parishes
Northern Parishes
Ingleby Barwick
Yarm
Ingleby Barwick West
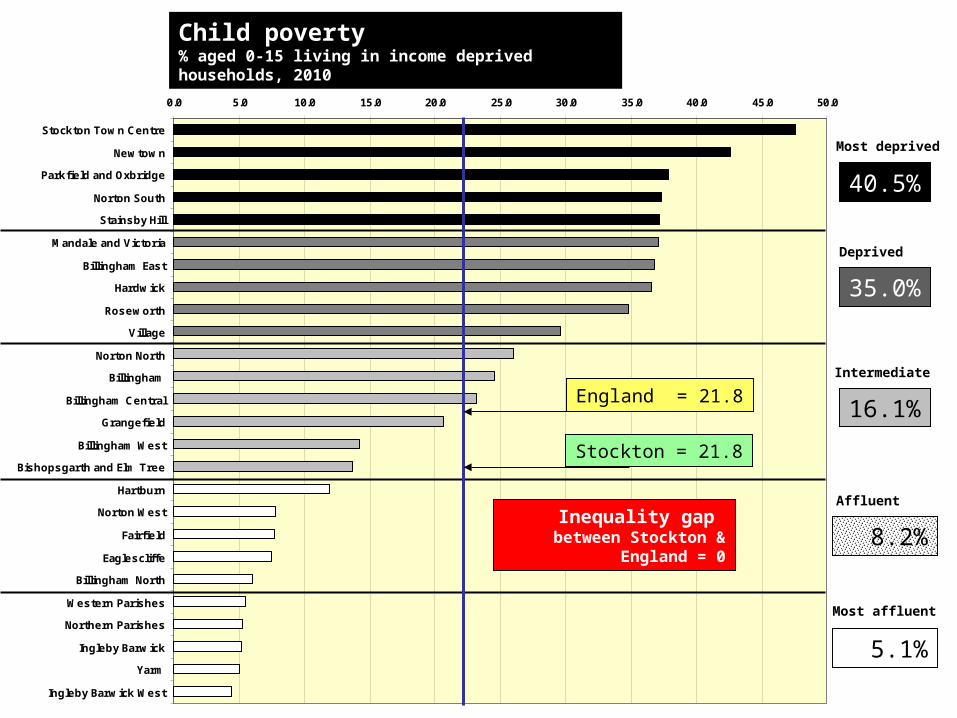
Child poverty% aged 0-15 living in income deprived households, 2010
0.0 5.0 10.0 15.0 20.0 25.0 30.0 35.0 40.0 45.0 50.0
Stockton Town Centre
Newtown
Parkfield and Oxbridge
Norton South
Stainsby Hill
Mandale and Victoria
Billingham East
Hardwick
Roseworth
Village
Norton North
Billingham
Billingham Central
Grangefield
Billingham West
Bishopsgarth and Elm Tree
Hartburn
Norton West
Fairfield
Eaglescliffe
Billingham North
Western Parishes
Northern Parishes
Ingleby Barwick
Yarm
Ingleby Barwick West
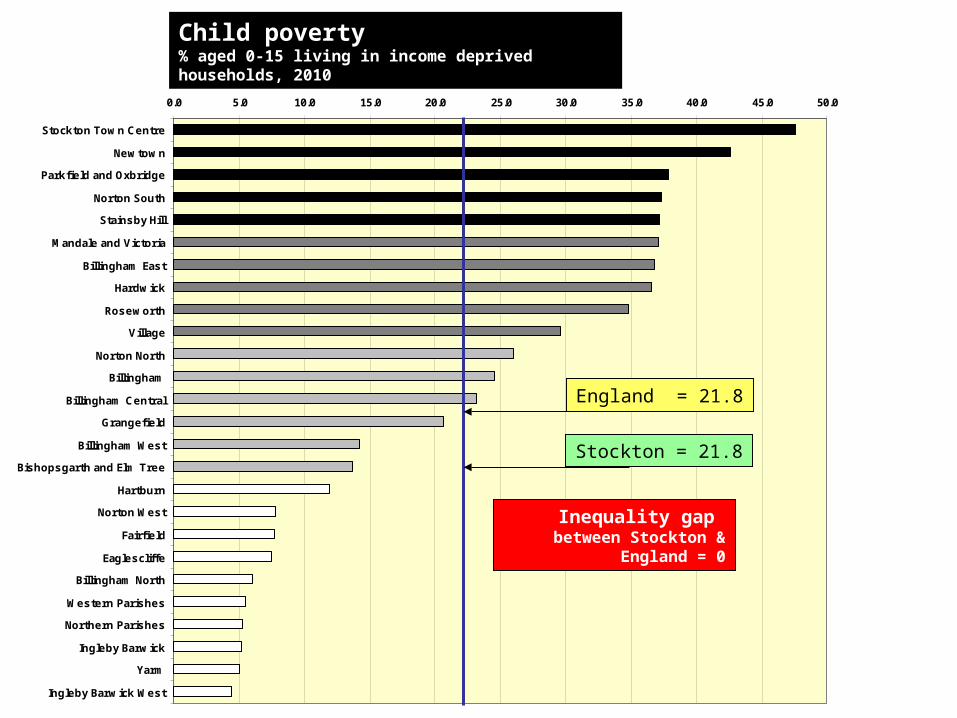
Child poverty% aged 0-15 living in income deprived households, 2010
England = 21.8
Stockton = 21.8
Inequality gap between Stockton & England
= 0

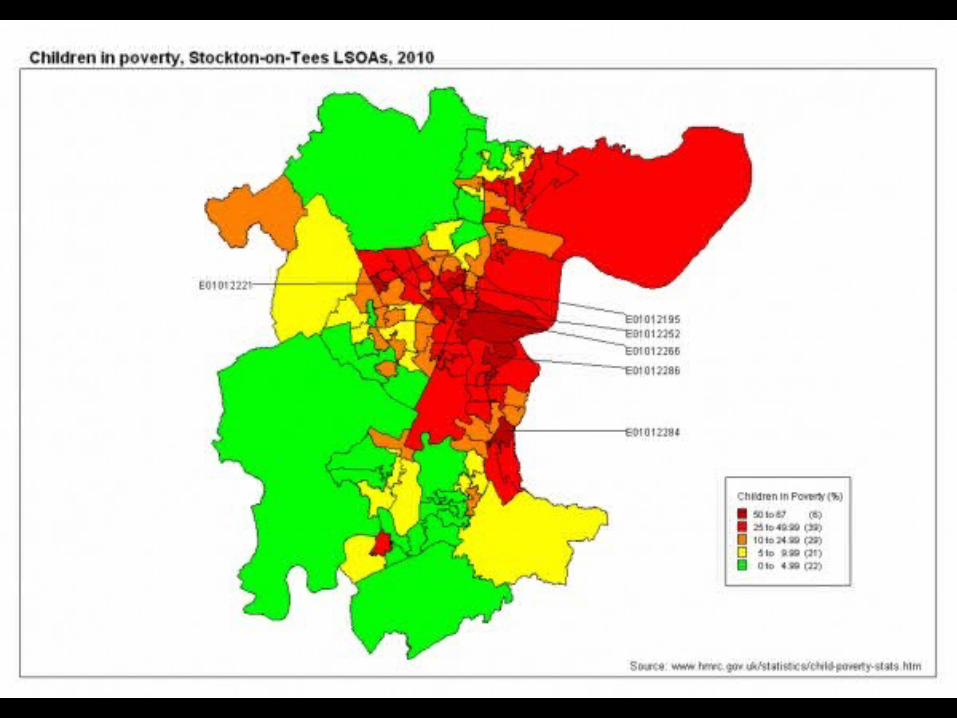
Child poverty in Teesside
Wards aboveEngland mean
Stockton Town
Centre

0.0 5.0 10.0 15.0 20.0 25.0 30.0 35.0 40.0 45.0 50.0
Stockton Town Centre
Newtown
Parkfield and Oxbridge
Norton South
Stainsby Hill
Mandale and Victoria
Billingham East
Hardwick
Roseworth
Village
Norton North
Billingham
Billingham Central
Grangefield
Billingham West
Bishopsgarth and Elm Tree
Hartburn
Norton West
Fairfield
Eaglescliffe
Billingham North
Western Parishes
Northern Parishes
Ingleby Barwick
Yarm
Ingleby Barwick West
Child poverty% aged 0-15 living in income deprived households, 2010
England = 21.8
Stockton = 21.8
Inequality gap between Stockton & England
= 0
0.0 5.0 10.0 15.0 20.0 25.0 30.0 35.0 40.0 45.0 50.0
Stockton Town Centre
Newtown
Parkfield and Oxbridge
Norton South
Stainsby Hill
Mandale and Victoria
Billingham East
Hardwick
Roseworth
Village
Norton North
Billingham
Billingham Central
Grangefield
Billingham West
Bishopsgarth and Elm Tree
Hartburn
Norton West
Fairfield
Eaglescliffe
Billingham North
Western Parishes
Northern Parishes
Ingleby Barwick
Yarm
Ingleby Barwick West
40.5%
35.0%
16.1%
8.2%
5.1%
England = 21.8
Child poverty% aged 0-15 living in income deprived households, 2010
Stockton = 21.8
Inequality gap between Stockton & England
= 0
Most affluent
Affluent
Intermediate
Deprived
Most deprived

0.0 5.0 10.0 15.0 20.0 25.0 30.0 35.0 40.0 45.0 50.0
Stockton Town Centre
Newtown
Parkfield and Oxbridge
Norton South
Stainsby Hill
Mandale and Victoria
Billingham East
Hardwick
Roseworth
Village
Norton North
Billingham
Billingham Central
Grangefield
Billingham West
Bishopsgarth and Elm Tree
Hartburn
Norton West
Fairfield
Eaglescliffe
Billingham North
Western Parishes
Northern Parishes
Ingleby Barwick
Yarm
Ingleby Barwick West
40.5%
35.0%
16.1%
8.2%
5.1%
Inequality gap within Stockton
= 7.9
England = 21.8
Child poverty% aged 0-15 living in income deprived households, 2010
Stockton = 21.8
Inequality gap between Stockton & England
= 0
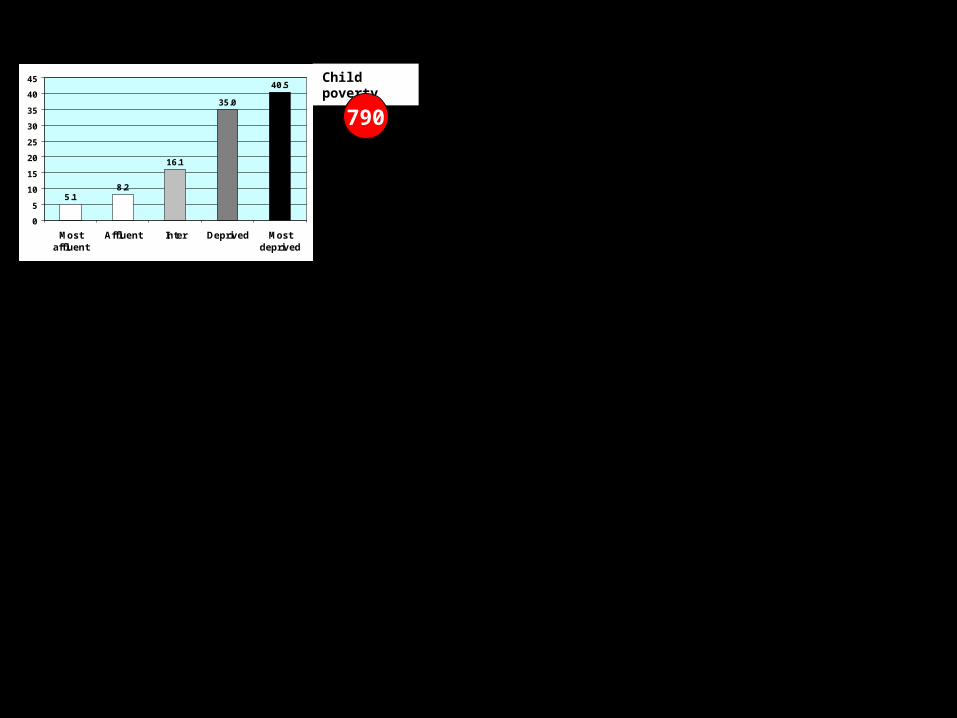
5.1
8.2
16.1
35.0
40.5
0
5
10
15
20
25
30
35
40
45
Most affluent Affluent Intermediate Deprived Most deprived
Most deprived
Deprived
Intermediate
Affluent
Most affluent
5.18.2
16.1
35.0
40.5
0
5
10
15
20
25
30
35
40
45
Mostaffluent
Affluent Inter Deprived Mostdeprived
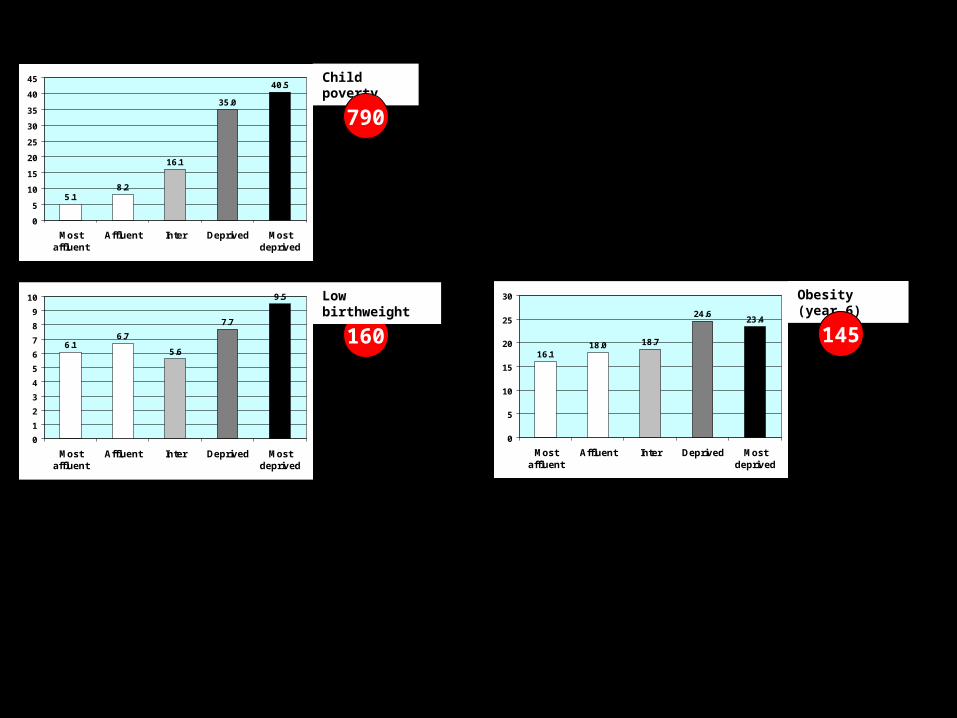
Child poverty
790
5.18.2
16.1
35.0
40.5
0
5
10
15
20
25
30
35
40
45
Mostaffluent
Affluent Inter Deprived Mostdeprived
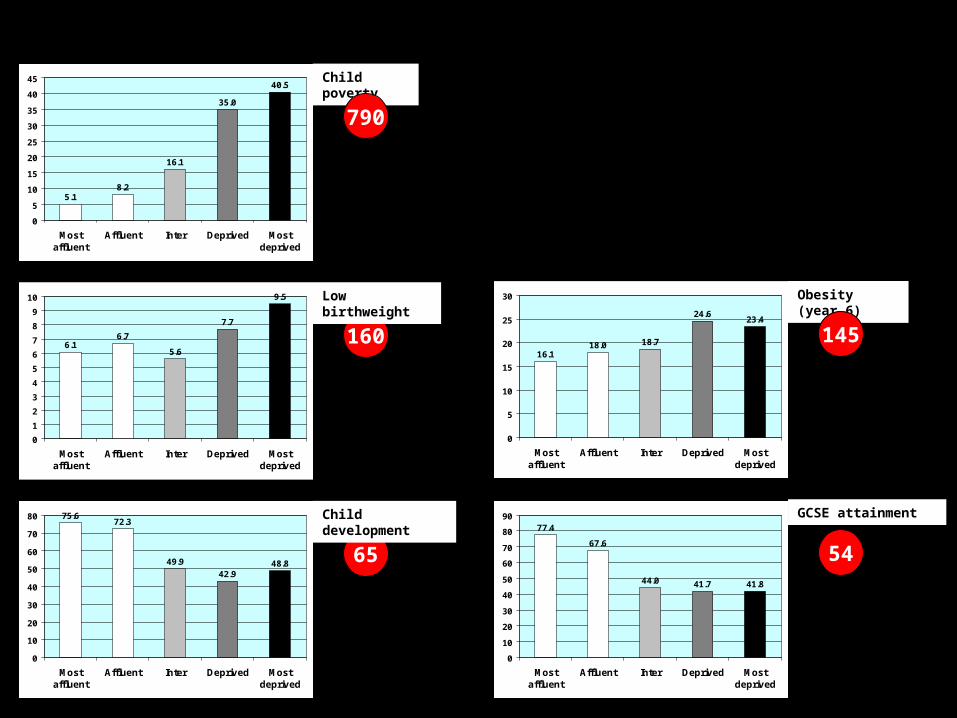
6.16.7
5.6
7.7
9.5
0
1
2
3
4
5
6
7
8
9
10
Mostaffluent
Affluent Inter Deprived Mostdeprived
Child poverty
790
160
Low birthweight
16.118.0 18.7
24.623.4
0
5
10
15
20
25
30
Mostaffluent
Affluent Inter Deprived Mostdeprived
Obesity (year 6)
145
5.18.2
16.1
35.0
40.5
0
5
10
15
20
25
30
35
40
45
Mostaffluent
Affluent Inter Deprived Mostdeprived
6.16.7
5.6
7.7
9.5
0
1
2
3
4
5
6
7
8
9
10
Mostaffluent
Affluent Inter Deprived Mostdeprived
Child poverty
790
160
Low birthweight
75.672.3
49.9
42.948.8
0
10
20
30
40
50
60
70
80
Mostaffluent
Affluent Inter Deprived Mostdeprived
65
Child development
16.118.0 18.7
24.623.4
0
5
10
15
20
25
30
Mostaffluent
Affluent Inter Deprived Mostdeprived
77.4
67.6
44.0 41.7 41.8
0
10
20
30
40
50
60
70
80
90
Mostaffluent
Affluent Inter Deprived Mostdeprived
Obesity (year 6)
145
54
GCSE attainment
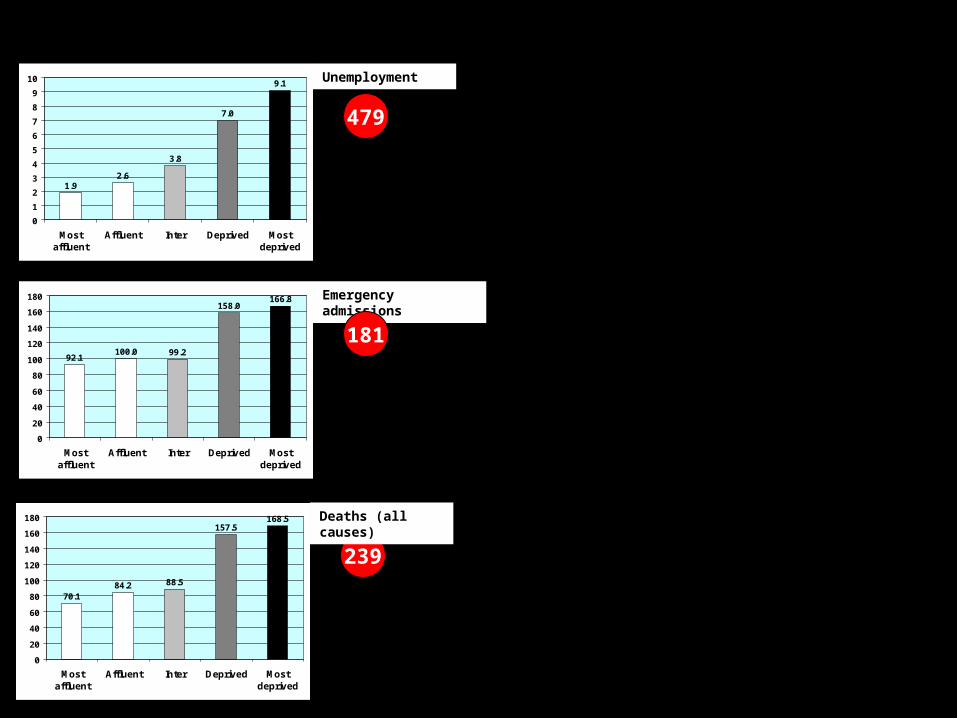
92.1100.0 99.2
158.0166.8
0
20
40
60
80
100
120
140
160
180
Mostaffluent
Affluent Inter Deprived Mostdeprived
Emergency admissions
181
70.184.2 88.5
157.5168.5
0
20
40
60
80
100
120
140
160
180
Mostaffluent
Affluent Inter Deprived Mostdeprived
239
Deaths (all causes)
1.92.6
3.8
7.0
9.1
0
1
2
3
4
5
6
7
8
9
10
Mostaffluent
Affluent Inter Deprived Mostdeprived
479
Unemployment

790
479
239
181
160
145
65
54
0 100 200 300 400 500 600 700 800 900
Child poverty
Unemployment
Deaths (all causes)
Emergency admissions
Low birthweight
Obesity (Year 6)
Child development
GCSE attainment
Inequality gaps within Stockton
RatioMost affluent to most deprived quintiles of child poverty
Values above 100 mean that rates are HIGHER
in the most deprived wards
Values below 100 mean that rates are LOWER
in the most deprived wards
Value of 100 means that there is NO DIFFERENCE
between affluent and deprived wards
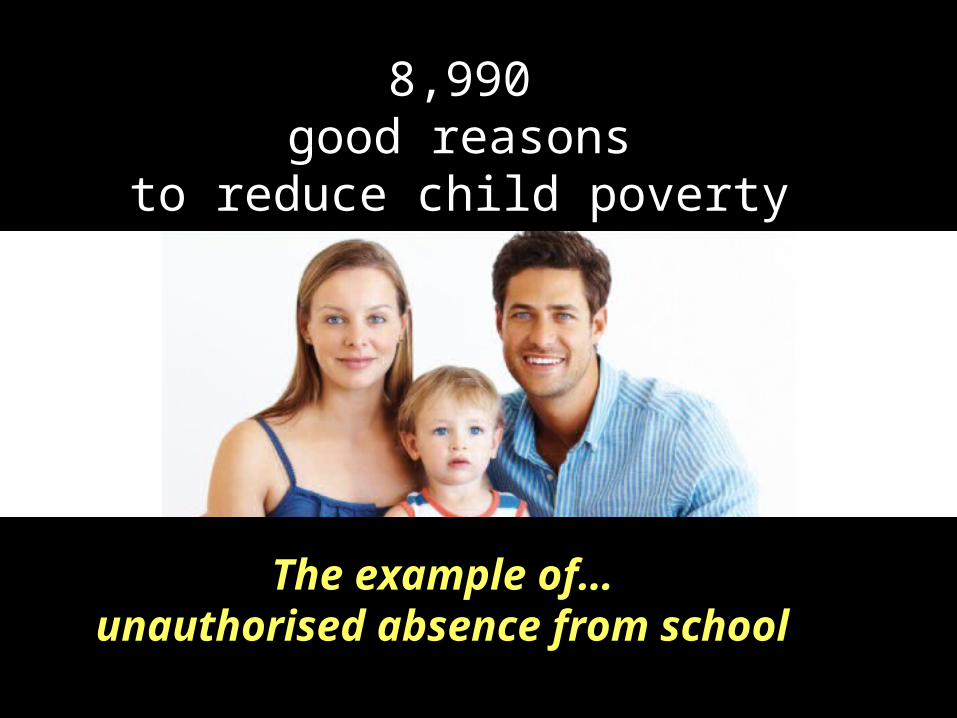
The example of… unauthorised absence from school
8,990good reasons
to reduce child poverty
Trying to get every child into school every day

‘The best days of our lives…?

Persistent absence is when a child is not in school
for more than 20% of the time(15% from October 2011)
We know that some childrenare persistently absent from school…
1,345 childrenwere persistently absentfor more than 1 day in 6in Stockton in 2011/12
Absence from schoolis strongly associatedwith young people not being in being further education or employment.
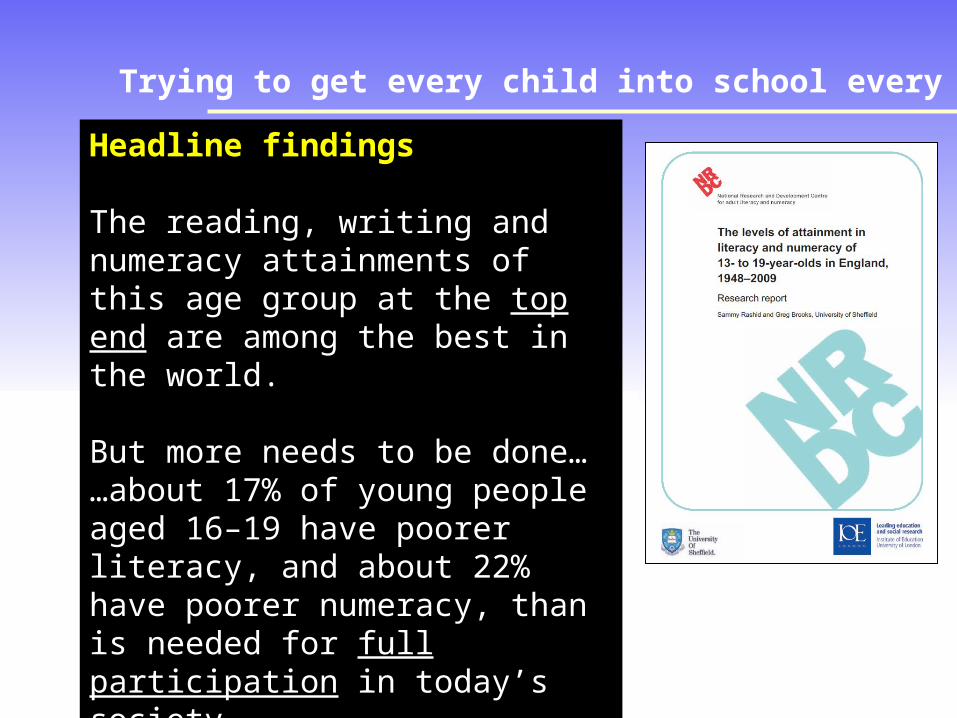
Trying to get every child into school every day
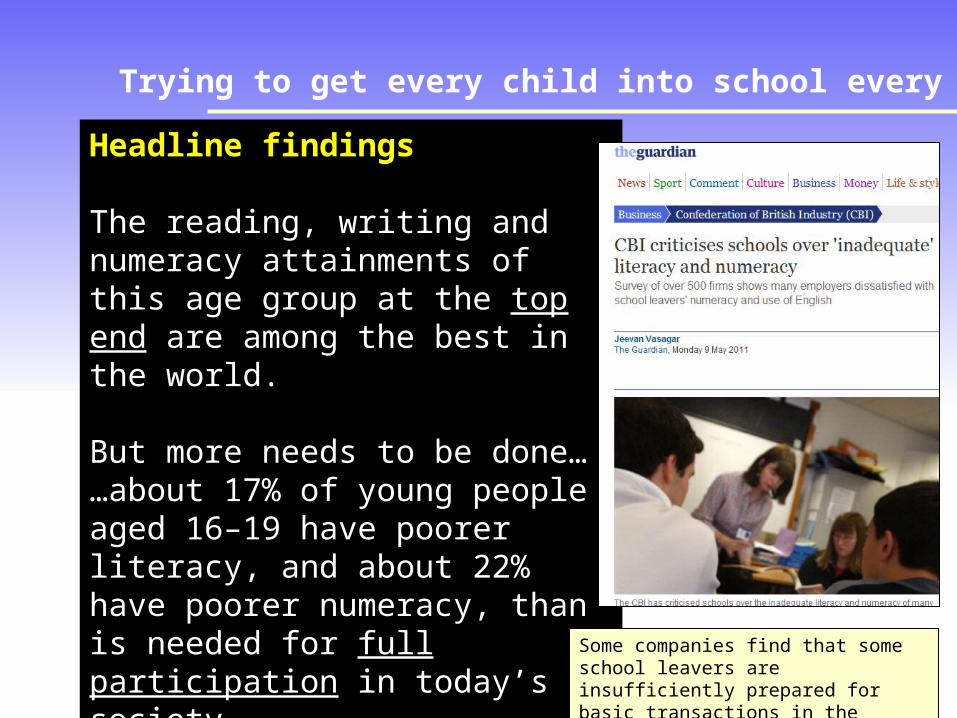
Headline findings
The reading, writing and numeracy attainments of this age group at the top end are among the best in the world.
But more needs to be done… …about 17% of young people aged 16–19 have poorer literacy, and about 22% have poorer numeracy, than is needed for full participation in today’s society.
Trying to get every child into school every day
Headline findings
The reading, writing and numeracy attainments of this age group at the top end are among the best in the world.
But more needs to be done… …about 17% of young people aged 16–19 have poorer literacy, and about 22% have poorer numeracy, than is needed for full participation in today’s society.
Some companies find that some school leavers are insufficiently prepared for basic transactions in the workplace.
Trying to get every child into school every day
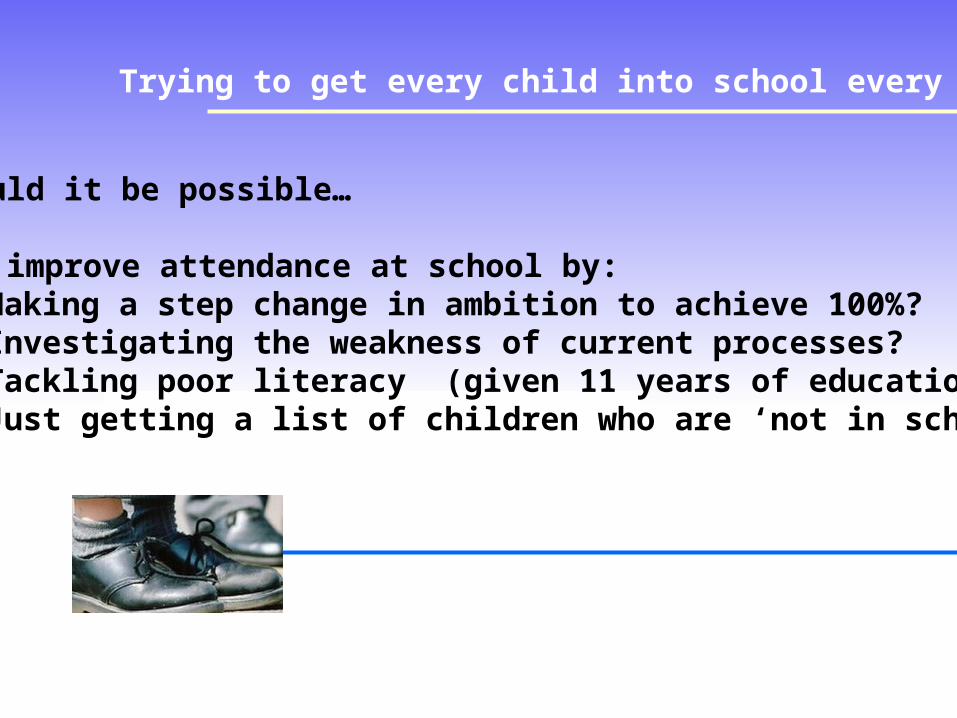
Would it be possible…
To improve attendance at school by:• Making a step change in ambition to achieve 100%?• Investigating the weakness of current processes?• Tackling poor literacy (given 11 years of education)?• Just getting a list of children who are ‘not in school’?

If we can’t get all children to school every day,we won’t break the cycle of child poverty
8,990good reasons
to reduce child poverty
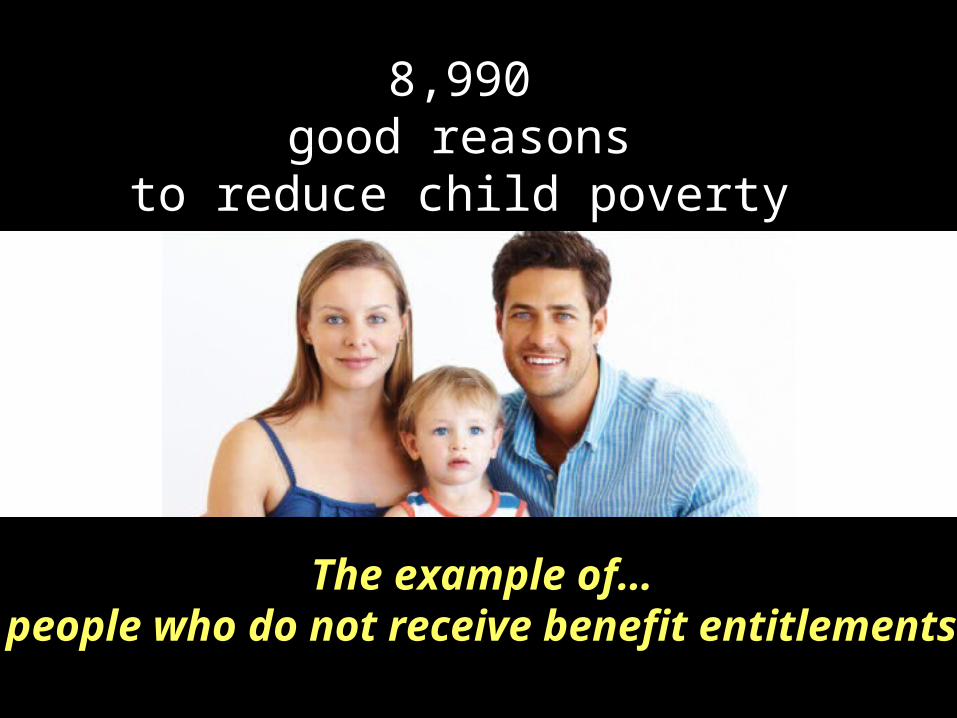
The example of… people who do not receive benefit entitlements
8,990good reasons
to reduce child poverty

Trying to increase income for people in need
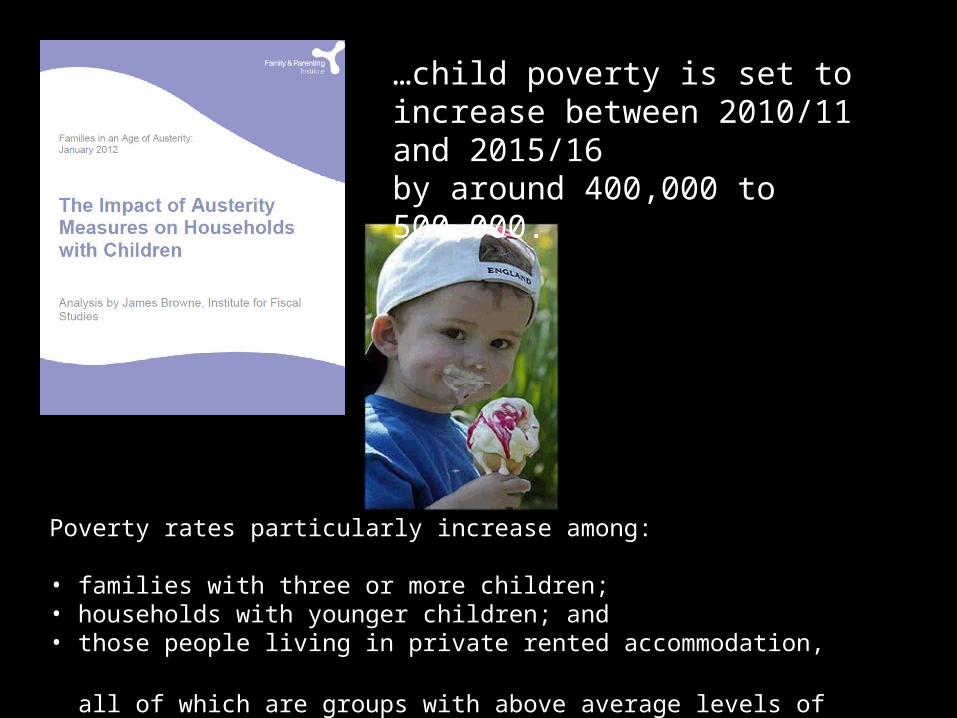
Poverty rates particularly increase among:
• families with three or more children; • households with younger children; and • those people living in private rented accommodation,
all of which are groups with above average levels of child poverty already.
…child poverty is set to increase between 2010/11 and 2015/16 by around 400,000 to 500,000.

Trying to increase income for people in need
Unclaimed benefitsin Teesside alone
could total£65 - 100 million
per year
Vast amounts of money that are allocated to people with legitimate needs and entitlements remain unclaimed every year.
It would be cost-effective to allocate resources locally to maximise the uptake of benefits in all localities.
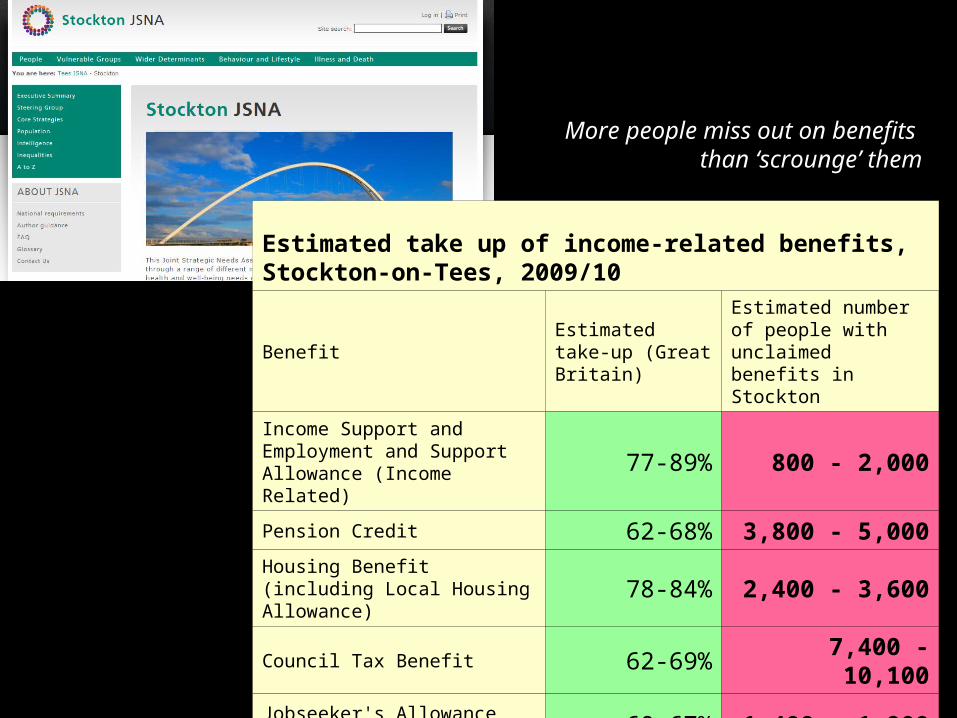
Estimated take up of income-related benefits, Stockton-on-Tees, 2009/10
BenefitEstimated take-up (Great Britain)
Estimated number of people with unclaimed benefits in Stockton
Income Support and Employment and Support Allowance (Income Related)
77-89% 800 - 2,000
Pension Credit 62-68% 3,800 - 5,000
Housing Benefit (including Local Housing Allowance) 78-84% 2,400 - 3,600
Council Tax Benefit 62-69% 7,400 - 10,100
Jobseeker's Allowance (Income-based) 60-67% 1,400 - 1,900
Source: DWP, 2012
More people miss out on benefits than ‘scrounge’ them
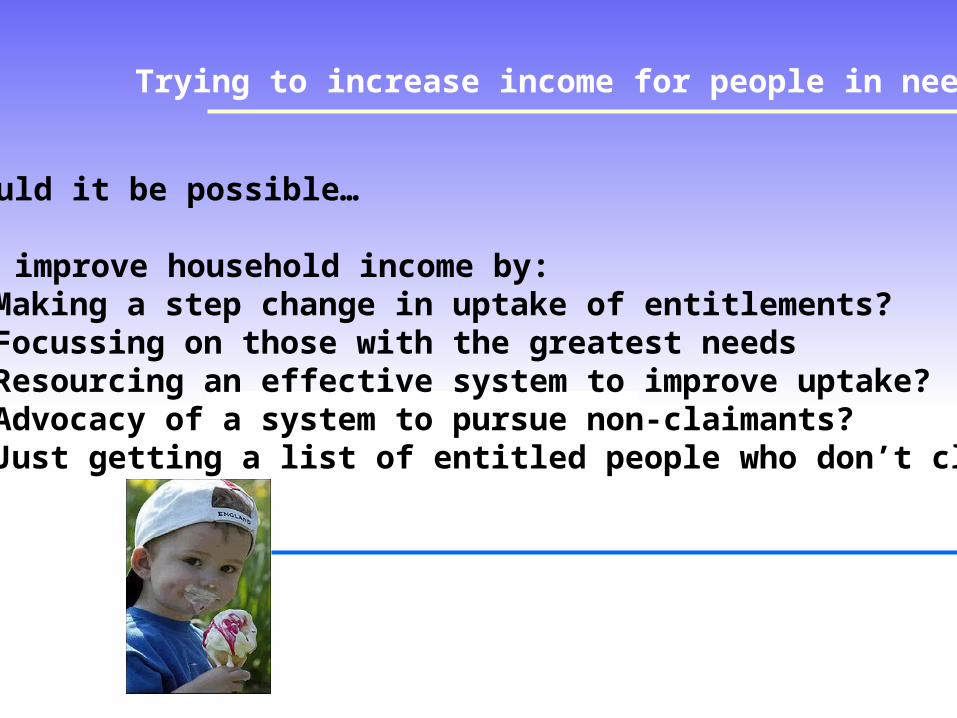
Trying to increase income for people in need
Would it be possible…
To improve household income by:• Making a step change in uptake of entitlements?• Focussing on those with the greatest needs• Resourcing an effective system to improve uptake?• Advocacy of a system to pursue non-claimants?• Just getting a list of entitled people who don’t claim?
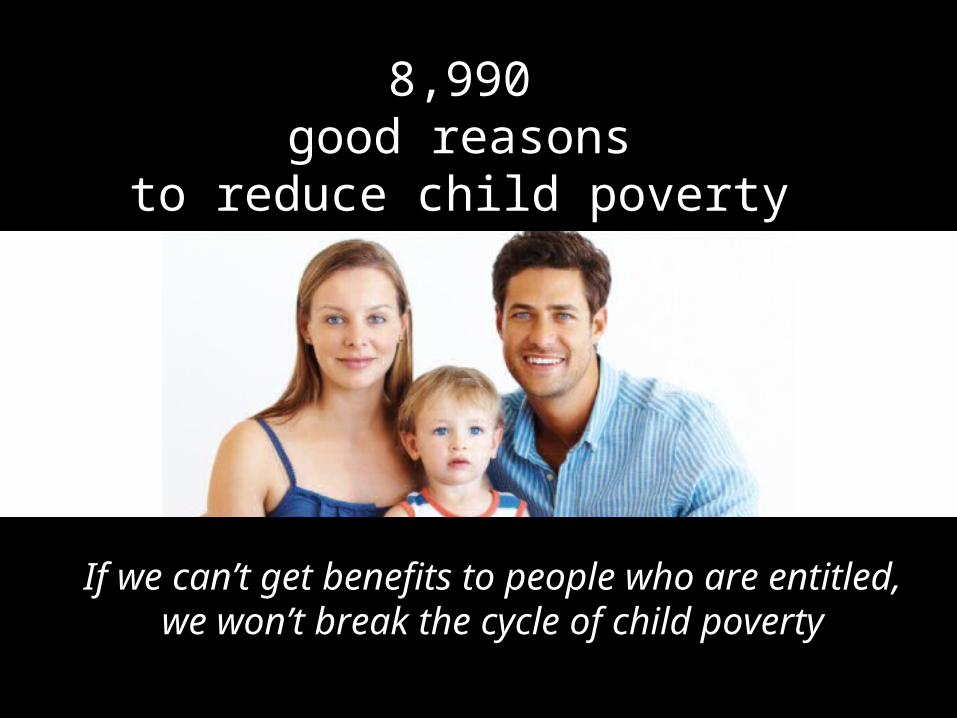
If we can’t get benefits to people who are entitled,we won’t break the cycle of child poverty
8,990good reasons
to reduce child poverty
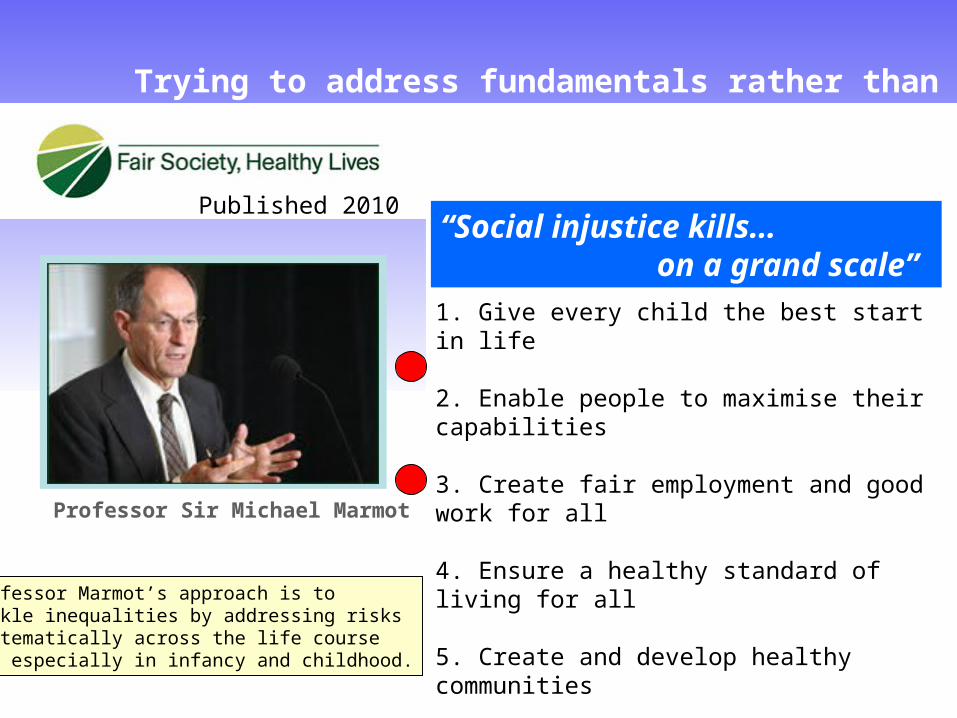
Professor Sir Michael Marmot
The Marmot Principles
1. Give every child the best start in life
2. Enable people to maximise their capabilities
3. Create fair employment and good work for all
4. Ensure a healthy standard of living for all
5. Create and develop healthy communities
6. Strengthen the role and impact of prevention
“Social injustice kills… on a grand scale”
Trying to address fundamentals rather than fads
Published 2010
Professor Marmot’s approach is to tackle inequalities by addressing riskssystematically across the life courseand especially in infancy and childhood.
‘No bird soars too high…if he soars on his own wings’William Blake
8,990good reasons
to reduce child poverty