Embed Size (px)
Citation preview

International Journal of Business and Social Science Vol. 5, No. 10; September 2014
27
To Dye or Not to Dye: A Comparison of Gen Y Consumers’ Perceived Value of
Salon Hair Coloring in China and the United States
Xin Zhao
School of Business
University of Redlands USA
Abstract
This study examines how Generation Y (Gen Y) consumers perceive the value of salon hair coloring in China
versus in the United States. Findings from a qualitative study and the previous literature were used to develop a
survey measuring Gen Y consumers’ perceptions of quality value, emotional value, epistemic value, social value,
monetary cost, time/effort cost, and health risk cost of salon hair coloring in the United States and China.
Quality value, emotional value, and social value appeared to have a stronger influence on US Gen Y consumers,
while epistemic value, monetary cost, and health risk cost appeared to have a stronger influence on Chinese Gen
Y consumers. In addition, time/effort costs turned out to have the same level of influence on the two samples. The
study results imply that retailers targeting China and the United States may need to use different marketing
strategies in the two countries to ensure that the perceived value dimensions most salient to their consumers in
each country could be emphasized.
Keywords: consumer perceived value (CPV), Generation Y (Gen Y), salon hair coloring, China
1. Introduction
Hair has always been considered an important part of the body with strong social and cultural significance
(Kaiser, 1997). Previous research has found that virtually all societies, from less advanced to highly advanced
cultures, have dealt with hair as a form of expression (Hoebel, 1958). Thus, it is not surprising that in modern
societies, hair care activities are multifarious and prevalent across cultures, and it has become an industry with
multi billion dollars in annual sales (Weber & Villebonne, 2002). Hair coloring itself was the third largest
category of hair care in 2011, right after shampoo and conditioner (Euromonitor, 2013). Given the importance of
hair care in all cultures and the global nature of today’s markets across product categories, it is important to
understand the hair care industry on a global level. Yet, little is known about this important product category, and
even less is known about hair coloring and its value to consumers from a cross-cultural perspective.
According to Euromonitor (2013), the global Beauty and Personal Care industry reached total sales of US$ 433
billion in 2012, which was back to the pre-recession level. In that year, the hair care industry, a segment of the
beauty and personal care industry, was the 2nd
largest category, following the skin care segment. Despite the large
drop in spending during the great recession, the global hair care market grew on average by 4% annually between
2006 and 2012 (Euromonitor 2013).
Hair care category includes the following products: shampoos (anti-dandruff, baby, etc.), 2-in-1 products, perms
and relaxants, salon hair care, all conditioners (traditional and intensive), hair coloring (bleachers, permanents,
and semi-permanents), and styling agents (gel, sprays, waxes, creams, etc.). Specifically, in 2011, it reached US
$13.5 billion and is expected to grow to US$ 15.8 billion by the year 2016 (Euromonitor 2013). The sector was
also one of the main drivers of growth in Beauty and Personal Care industry during the year, with sales increasing
by over 10%. Growth was driven by the strong performance of key emerging markets, such as Brazil, China, and
India.
2. Literature Review
With hundreds of brands to choose from, consumers may find it increasingly difficult as to which product has the
right value to best meet their needs. Hence, the study of consumer perceived value relative to hair coloring is
particularly warranted. One way of better understanding the broader, or international, scope of hair coloring is to
consider its relevance to Eastern versus Western consumers such as China and the United States.
© Center for Promoting Ideas, USA www.ijbssnet.com
28
Investigating and comparing these large and impactful societies on the issue of hair coloring offers the
opportunity to expand our understanding of both cultural and business issues (Pan, Chaffee, Chu, & Ju, 1994).
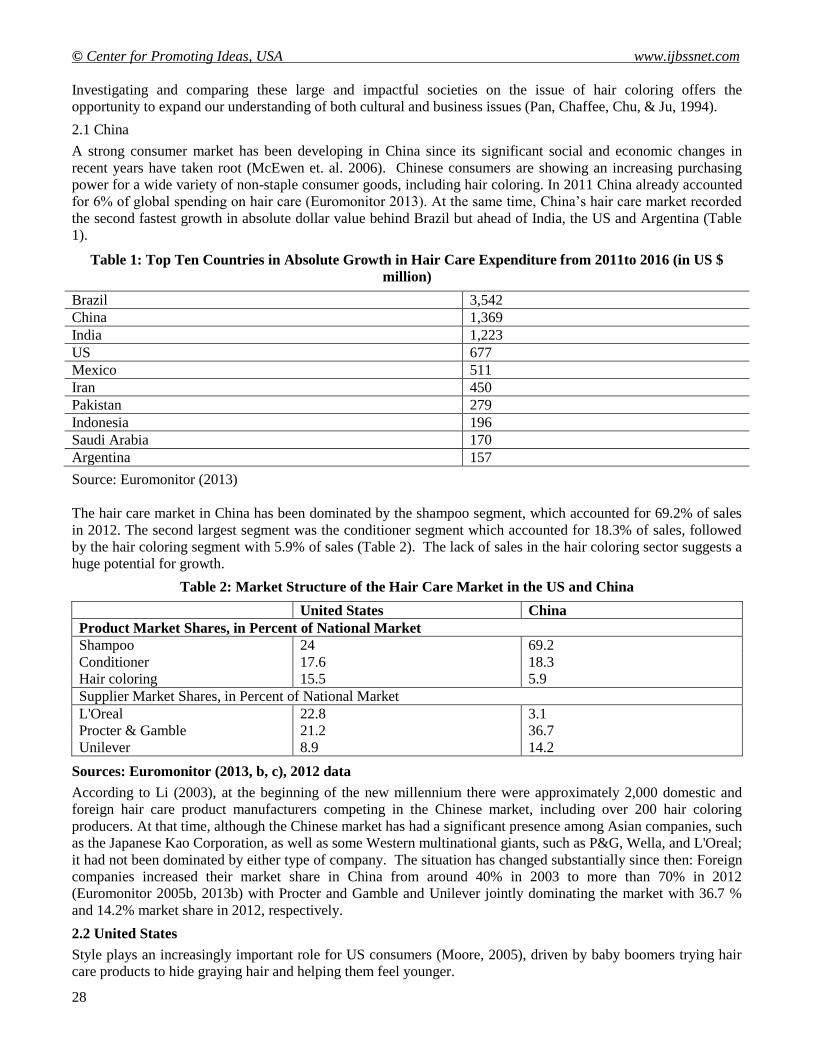
2.1 China
A strong consumer market has been developing in China since its significant social and economic changes in
recent years have taken root (McEwen et. al. 2006). Chinese consumers are showing an increasing purchasing
power for a wide variety of non-staple consumer goods, including hair coloring. In 2011 China already accounted
for 6% of global spending on hair care (Euromonitor 2013). At the same time, China’s hair care market recorded
the second fastest growth in absolute dollar value behind Brazil but ahead of India, the US and Argentina (Table
1).
Table 1: Top Ten Countries in Absolute Growth in Hair Care Expenditure from 2011to 2016 (in US $
million)
Brazil 3,542
China 1,369
India 1,223
US 677
Mexico 511
Iran 450
Pakistan 279
Indonesia 196
Saudi Arabia 170
Argentina 157
Source: Euromonitor (2013)
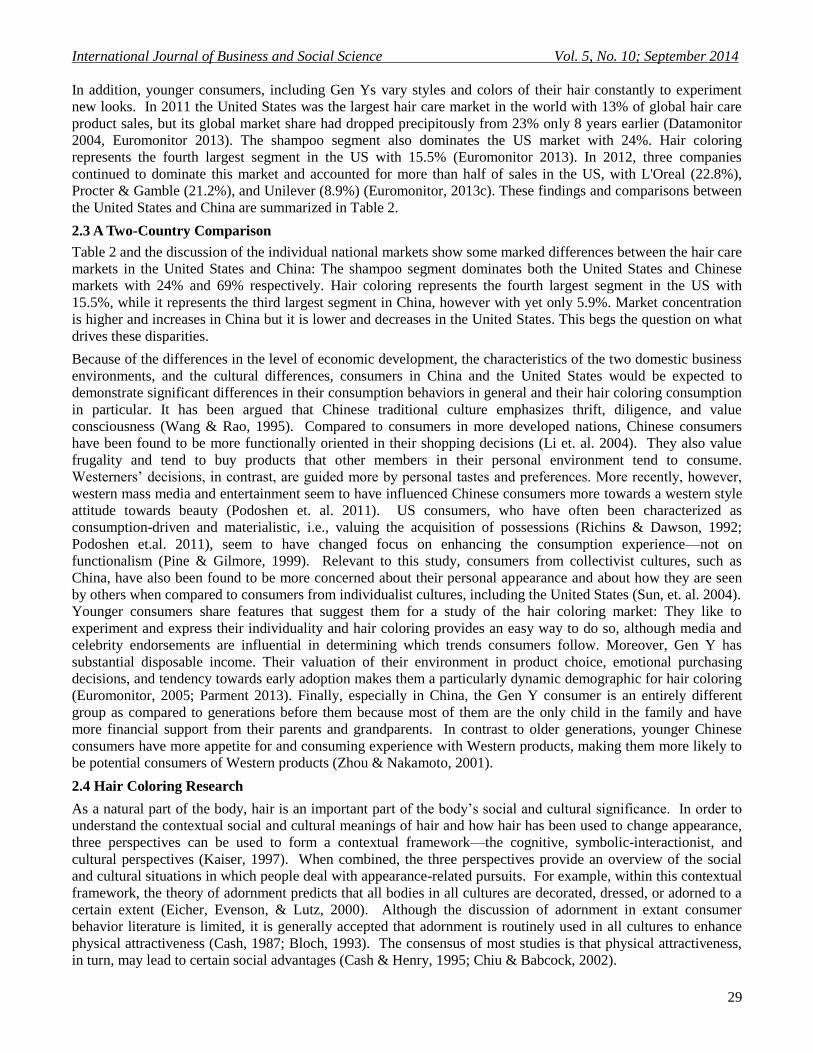
The hair care market in China has been dominated by the shampoo segment, which accounted for 69.2% of sales
in 2012. The second largest segment was the conditioner segment which accounted for 18.3% of sales, followed
by the hair coloring segment with 5.9% of sales (Table 2). The lack of sales in the hair coloring sector suggests a
huge potential for growth.
Table 2: Market Structure of the Hair Care Market in the US and China
United States China
Product Market Shares, in Percent of National Market
Shampoo 24 69.2
Conditioner 17.6 18.3
Hair coloring 15.5 5.9
Supplier Market Shares, in Percent of National Market
L'Oreal 22.8 3.1
Procter & Gamble 21.2 36.7
Unilever 8.9 14.2
Sources: Euromonitor (2013, b, c), 2012 data
According to Li (2003), at the beginning of the new millennium there were approximately 2,000 domestic and
foreign hair care product manufacturers competing in the Chinese market, including over 200 hair coloring
producers. At that time, although the Chinese market has had a significant presence among Asian companies, such
as the Japanese Kao Corporation, as well as some Western multinational giants, such as P&G, Wella, and L'Oreal;
it had not been dominated by either type of company. The situation has changed substantially since then: Foreign
companies increased their market share in China from around 40% in 2003 to more than 70% in 2012
(Euromonitor 2005b, 2013b) with Procter and Gamble and Unilever jointly dominating the market with 36.7 %
and 14.2% market share in 2012, respectively.
2.2 United States
Style plays an increasingly important role for US consumers (Moore, 2005), driven by baby boomers trying hair
care products to hide graying hair and helping them feel younger.
International Journal of Business and Social Science Vol. 5, No. 10; September 2014
29
In addition, younger consumers, including Gen Ys vary styles and colors of their hair constantly to experiment
new looks. In 2011 the United States was the largest hair care market in the world with 13% of global hair care
product sales, but its global market share had dropped precipitously from 23% only 8 years earlier (Datamonitor
2004, Euromonitor 2013). The shampoo segment also dominates the US market with 24%. Hair coloring
represents the fourth largest segment in the US with 15.5% (Euromonitor 2013). In 2012, three companies
continued to dominate this market and accounted for more than half of sales in the US, with L'Oreal (22.8%),
Procter & Gamble (21.2%), and Unilever (8.9%) (Euromonitor, 2013c). These findings and comparisons between
the United States and China are summarized in Table 2.
2.3 A Two-Country Comparison
Table 2 and the discussion of the individual national markets show some marked differences between the hair care
markets in the United States and China: The shampoo segment dominates both the United States and Chinese
markets with 24% and 69% respectively. Hair coloring represents the fourth largest segment in the US with
15.5%, while it represents the third largest segment in China, however with yet only 5.9%. Market concentration
is higher and increases in China but it is lower and decreases in the United States. This begs the question on what
drives these disparities.
Because of the differences in the level of economic development, the characteristics of the two domestic business
environments, and the cultural differences, consumers in China and the United States would be expected to
demonstrate significant differences in their consumption behaviors in general and their hair coloring consumption
in particular. It has been argued that Chinese traditional culture emphasizes thrift, diligence, and value
consciousness (Wang & Rao, 1995). Compared to consumers in more developed nations, Chinese consumers
have been found to be more functionally oriented in their shopping decisions (Li et. al. 2004). They also value
frugality and tend to buy products that other members in their personal environment tend to consume.
Westerners’ decisions, in contrast, are guided more by personal tastes and preferences. More recently, however,
western mass media and entertainment seem to have influenced Chinese consumers more towards a western style
attitude towards beauty (Podoshen et. al. 2011). US consumers, who have often been characterized as
consumption-driven and materialistic, i.e., valuing the acquisition of possessions (Richins & Dawson, 1992;
Podoshen et.al. 2011), seem to have changed focus on enhancing the consumption experience—not on
functionalism (Pine & Gilmore, 1999). Relevant to this study, consumers from collectivist cultures, such as
China, have also been found to be more concerned about their personal appearance and about how they are seen
by others when compared to consumers from individualist cultures, including the United States (Sun, et. al. 2004).
Younger consumers share features that suggest them for a study of the hair coloring market: They like to
experiment and express their individuality and hair coloring provides an easy way to do so, although media and
celebrity endorsements are influential in determining which trends consumers follow. Moreover, Gen Y has
substantial disposable income. Their valuation of their environment in product choice, emotional purchasing
decisions, and tendency towards early adoption makes them a particularly dynamic demographic for hair coloring
(Euromonitor, 2005; Parment 2013). Finally, especially in China, the Gen Y consumer is an entirely different
group as compared to generations before them because most of them are the only child in the family and have
more financial support from their parents and grandparents. In contrast to older generations, younger Chinese
consumers have more appetite for and consuming experience with Western products, making them more likely to
be potential consumers of Western products (Zhou & Nakamoto, 2001).
2.4 Hair Coloring Research
As a natural part of the body, hair is an important part of the body’s social and cultural significance. In order to
understand the contextual social and cultural meanings of hair and how hair has been used to change appearance,
three perspectives can be used to form a contextual framework—the cognitive, symbolic-interactionist, and
cultural perspectives (Kaiser, 1997). When combined, the three perspectives provide an overview of the social
and cultural situations in which people deal with appearance-related pursuits. For example, within this contextual
framework, the theory of adornment predicts that all bodies in all cultures are decorated, dressed, or adorned to a
certain extent (Eicher, Evenson, & Lutz, 2000). Although the discussion of adornment in extant consumer
behavior literature is limited, it is generally accepted that adornment is routinely used in all cultures to enhance
physical attractiveness (Cash, 1987; Bloch, 1993). The consensus of most studies is that physical attractiveness,
in turn, may lead to certain social advantages (Cash & Henry, 1995; Chiu & Babcock, 2002).
© Center for Promoting Ideas, USA www.ijbssnet.com
30
Not surprisingly, adornment of the body and hair has been used in the pursuit of physical attractiveness across the
centuries and across cultures (Bloch & Richins, 1992).
Beauty and personal care products in general are a widespread way of adorning the body. However, little
attention has been directed to this product group, despite its extensive usage in consumers’ daily lives and the
increasing use of hair care products. Male consumers have been ignored almost entirely1 in terms of their
cosmetics consumption although male consumers could be an important potential market for cosmetic products,
particularly hair care products. Hair and its potential for adornment and the creation of social advantage thus
suggest large benefits of studying how consumers perceive the value of hair coloring.
The review of relevant literature indicated the following gaps in the literature: appearance-related product
categories, including cosmetics, jewelry, and clothing, especially with male consumers have not received
appropriate attention in academic research. The same is true for Gen Y cohorts in general and even more so for
Chinese Gen Y cohorts. In the consumer perceived value research area, there is no study of Chinese consumers in
the beauty and personal care industry, and there have been very few cross-cultural studies in CPV in service
industries (see e.g. Kim et. al. 2010 for an exception)
This study therefore analyzes the question on what dimensions of perceived value most influence Gen Y
consumers’ overall perceptions of value for salon hair coloring relative to what they benefit versus what they
sacrifice in the US and Chinese markets. In particular, we ask: Do Gen Y consumers perceive the value of salon
hair coloring differently in China versus the United States and on what dimensions do they differ?
3. Methodology
We approach our research question in two steps (Zhao, 2014). The first step comprises qualitative analysis using
in-depth interviews because little research on CPV of salon hair coloring could be found and exploratory work
was needed in order to achieve proper survey design. The qualitative research produced preliminary results that
were used to compare with previous findings in the literature and to generate the conceptual framework for CPV
in this case. In the second step, a set of hypotheses were developed and tested by the survey technique to obtain
quantitative results.
Zeithaml (1988) introduced perceived value as a “trade-off” structure, which we develop our conceptual model
upon and sort components of consumer perceived value for salon hair coloring into benefits and sacrifices (see
Figure 1). We expect the components in the “benefits” category to have a positive effect on CPV, while the
components in the “sacrifices” category should have a negative effect on CPV. We employed those six value
components produced by our literature review that were closely associated with repeatedly mentioned topics
resulting from the interviews: quality value, emotional value, epistemic value, social value, monetary costs, and
time/effort costs. We also included health risk costs as this component repeatedly emerged in the interviews, but
has not yet found its way into the literature.
1 See Souiden and Diagne 2009 for an exception.

International Journal of Business and Social Science Vol. 5, No. 10; September 2014
31
Figure 1 Conceptual Model of CPV for Salon Hair Coloring
Benefits
Sacrifices
Note: * indicates the sources of dimensions
3.1 Hypotheses
H1: The quality value of salon hair coloring will be perceived as higher by Chinese Gen Y consumers than by US
Gen Y consumers.
H2: The emotional value of salon hair coloring will be perceived as lower by Chinese Gen Y consumers than by
US Gen Y consumers.
H3: The epistemic value of salon hair coloring will be perceived as higher by Chinese Gen Y consumers than by
US Gen Y consumers.
H4: The social value of salon hair coloring will be perceived as higher by Chinese Gen Y consumers than by US
Gen Y consumers.
H5: The monetary costs of salon hair coloring will be perceived as lower by Chinese Gen Y consumers than by
US Gen Y consumers.
H6: The time/effort costs of salon hair coloring will be perceived as lower by Chinese Gen Y consumers than by
US Gen Y consumers.
H7: The health risk costs of salon hair coloring will be perceived as higher by Chinese Gen Y consumers than by
US Gen Y consumers.
3.2 Sample
Although this study defines Gen Y consumers as people born between 1977 and 1994, only Gen Ys attending
college were selected for this study due to this sub-segment’s increased purchasing power, its ability to purchase
independently, and its relative freedom to express itself without parental control.
Quality
Value
(QV) Emotional
Value
(EV)
Epistemic
Value
(EPV)
Social
Value
(SV)
Health
Risk Cost
(HC)
Monetary
Cost (MC)
Time/Effo
rt Cost
(TC)
Consumer
Perceived
Value
(CPV)
Literatu
re
Review *
Interview *

© Center for Promoting Ideas, USA www.ijbssnet.com
32
This appears to be true for both Chinese and US Gen Y consumers. According to Gardyn (2002), in the US alone
over 15 million older Gen Ys then between the ages of 19 and 25 attended college and enjoyed a collective
purchasing power of $105 billion, with full-time students spending approximately $300 per month on personal or
discretionary items, especially food, personal care, and music items. China started the one-child policy in the late
1970s in response to its swelling population. This resulted in the “little emperor” family structure in which nearly
every child is supported by “six-pockets” (i.e. two parents and four grandparents) (Wysocki, 1997). Relative to
older generations, these “little emperors” have been found to be less tradition-bound, more conscious about brand
symbolism, and more oriented towards brands, success, and self-gratification—with six pockets to finance the
spending (Salzman, 1999).
Specifically, the Gen Y participants recruited for this study, 249 Chinese Gen Y consumers and 200 US Gen Y
consumers, were drawn from college students, including both part-time and full-time, enrolled in four
universities, three in China and one in the United States.
3.3 Data Analysis Techniques
The hypotheses were tested by the Independent Samples T-Test, using SPSS. Given that many statistical
procedures to be used during this study assume that data are normally distributed. Prior to proceeding with the
analyses strictly associated with this study, a review of all variables was conducted in order to examine departures
from normality and to check for the existence of univariate outliers. Before testing the hypotheses, SPSS was
used to calculate descriptive statistics, such as means, standard deviations, skewness, and Kurtosis of each item
variable and inter-item correlations, to describe the profile of the two samples. An absolute value of the skewness
coefficient or (excess) kurtosis larger than one indicates that a variable does not follow a normal distribution and
needs to be further investigated. If necessary, the Kolmogorov-Smirnov test would be performed for specific
variables, comparing the observed cumulative distribution function for the variable with a specified distribution,
i.e. a normal distribution. The value of the Kolmogorov-Smirnov’s statistic being significant suggests that the
variable in question is approximately normally distributed and could be used in further statistical analyses. For
the purposes of this study, all statistical tests were considered significant at an alpha level ≤ 0.05.
Initially, a data reduction process was conducted in order to collapse the constructs employed in this study into
composite variables because the comparative analysis between the two Gen Y consumer groups was conducted on
constructs rather than individual measurement items. Eight constructs were investigated in the study, including
seven exogenous latent constructs (quality value, emotional value, epistemic value, social value, monetary cost,
time/effort cost, health risk); and one endogenous latent construct, consumer perceived value (CPV). All eight
constructs were subjected to validity and reliability tests before a single composite score could be calculated to
represent each construct (Zhao, 2014). According to Hair, Anderson, Tatham, & Black (1998), validity is defined
as the extent to which a scale measures the concept under discussion. The validity of constructs can be assessed
in different ways, for example, face validity, convergent validity, and divergent validity. If the constructs or the
variables lack validity, interpretation is jeopardized and researchers might draw incorrect conclusions. This
particular study itself is a construct validation process. Moreover, the face validity in this study was confirmed by
the results obtained from the pre-test of the surveys. Face validity refers to whether the survey constructs
logically appear to the researcher to measure what they are intended to measure. Reliability is the extent of
consistency between various measurements of a variable (Hair et al., 1998). Reliability was analyzed in this study
by calculating Cronbach’s alpha in SPSS for each construct. The Cronbach’s alpha criterion set for the study’s
eight constructs was the threshold point of 0.7, as suggested by Nunnally (1978). Having met the requirements of
construct validity and reliability, the composite measure of each construct was then measured by calculating the
mean value (Hair et al., 1998). Subsequently, some descriptive statistics such as frequency distributions, means,
standard deviation, skewness, and kurtosis of each construct were calculated for both samples individually.
As pointed out in the literature, there are many problems with conducting cross-cultural comparative studies, one
of which is whether the instruments designed to measure the relevant constructs are cross-culturally invariant
(Steenkamp & Baumgartner, 1998). Measurement invariance is defined as “whether or not, under different
conditions of observing and studying phenomena, measurement operations yield measures of the same attribute”
(Horn & McArdle, 1992, p. 117). It has been argued that analyses of the differences between constructs can only
be meaningful when the items measure the same thing and to the same degree in each context (Steenkamp &
Baumgartner 2000).
International Journal of Business and Social Science Vol. 5, No. 10; September 2014
33
Therefore, the establishment of measurement invariance across cultural settings is a logical prerequisite for testing
the difference of structural parameter estimates. The procedure of the comparative test followed the hierarchical
steps of multi-sample data analysis given in Mullen (1995), using SEM.
To test measurement invariance, the most restrictive format would be testing the assumption of equality of
covariance matrices between the two samples. Major goodness of fit statistics include Minimum Fit Function
Chi-Square (χ2), Root Mean Square Error of Approximation (RMSEA), Goodness of Fit Index (GFI), and Non-
Normed Fit Index (NNFI). As suggested by Browne & Cudeck (1993), chi-square statistics are too sensitive to
sample size. For models with more than 200 cases, such as in this study, the chi-square is almost always
statistically significant, which rejects proposed assumptions. Therefore, although this study reported chi-square
statistics in its results, more weight was put on the other goodness of fit indices when interpreting the results. To
support the assumption, RMSEA should be 0.05 or smaller. Ideally, the lower value of the 90% confidence
interval of RMSEA includes or is very near zero and the upper value is not very large, i.e., less than 0.08.
Furthermore, GFI as well as NNFI should be 0.90 or larger. However, GFI only tends to have stable properties
for sample sizes of 250 or larger (Hu & Bentler, 1995), which means GFI probably would not be a powerful
indicator for this study because the size of each sample was smaller than 250.
After the establishment of measurement invariance and/or partial measurement invariance, CFA was conducted in
SEM for both samples, and comparisons of the statistics were made to investigate which sample the proposed
model fit better.
3.4 Results
The Cronbach’s alpha was calculated for the eight constructs (Zhao, 2006). Except for the construct of epistemic
value (EPV) in the Chinese sample having a lower reliability of 0.63, all the other constructs showed high internal
reliability, with an alpha coefficient greater than 0.80. The measurement scale for the epistemic value construct
was adapted from Pura’s (2004) study conducted in Finland, where the scale demonstrated a good reliability of
0.80.
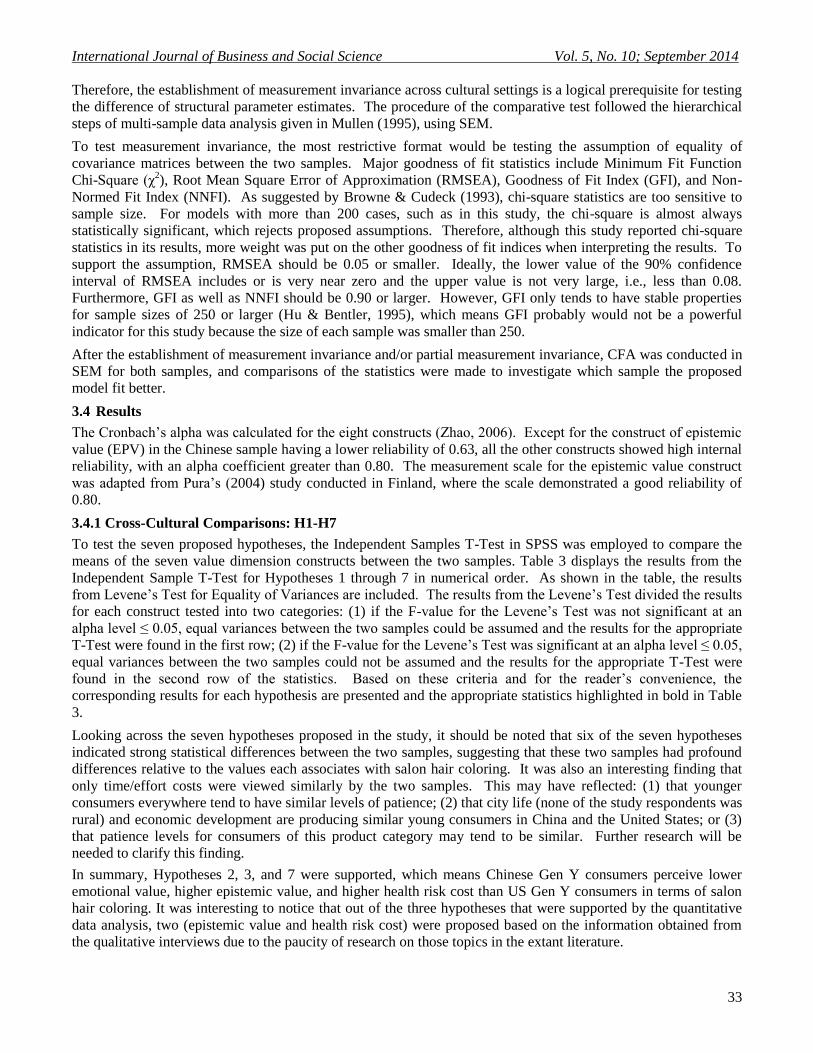
3.4.1 Cross-Cultural Comparisons: H1-H7
To test the seven proposed hypotheses, the Independent Samples T-Test in SPSS was employed to compare the
means of the seven value dimension constructs between the two samples. Table 3 displays the results from the
Independent Sample T-Test for Hypotheses 1 through 7 in numerical order. As shown in the table, the results
from Levene’s Test for Equality of Variances are included. The results from the Levene’s Test divided the results
for each construct tested into two categories: (1) if the F-value for the Levene’s Test was not significant at an
alpha level ≤ 0.05, equal variances between the two samples could be assumed and the results for the appropriate
T-Test were found in the first row; (2) if the F-value for the Levene’s Test was significant at an alpha level ≤ 0.05,
equal variances between the two samples could not be assumed and the results for the appropriate T-Test were
found in the second row of the statistics. Based on these criteria and for the reader’s convenience, the
corresponding results for each hypothesis are presented and the appropriate statistics highlighted in bold in Table
3.
Looking across the seven hypotheses proposed in the study, it should be noted that six of the seven hypotheses
indicated strong statistical differences between the two samples, suggesting that these two samples had profound
differences relative to the values each associates with salon hair coloring. It was also an interesting finding that
only time/effort costs were viewed similarly by the two samples. This may have reflected: (1) that younger
consumers everywhere tend to have similar levels of patience; (2) that city life (none of the study respondents was
rural) and economic development are producing similar young consumers in China and the United States; or (3)
that patience levels for consumers of this product category may tend to be similar. Further research will be
needed to clarify this finding.
In summary, Hypotheses 2, 3, and 7 were supported, which means Chinese Gen Y consumers perceive lower
emotional value, higher epistemic value, and higher health risk cost than US Gen Y consumers in terms of salon
hair coloring. It was interesting to notice that out of the three hypotheses that were supported by the quantitative
data analysis, two (epistemic value and health risk cost) were proposed based on the information obtained from
the qualitative interviews due to the paucity of research on those topics in the extant literature.
© Center for Promoting Ideas, USA www.ijbssnet.com
34
From a methodological perspective, the results indicated that the preliminary qualitative research was a very
important factor in formulating hypotheses for the quantitative phase of the research, especially in a case where
little relevant research has been conducted. From a theoretical perspective, these results provided new knowledge
about CPV and about salon hair coloring, filling some of the gaps in the literature and providing a possible
foundation for future research in related areas.
Table 3: Independent Sample T-Test Results for Hypotheses 1-7
Note: * negative values indicate lower means for the Chinese sample
** positive values indicate higher means for the Chinese sample
Hypotheses 1, 4, 5, and 6 were not supported, which means Chinese Gen Y consumers do not necessarily perceive
higher quality value, higher social value, lower monetary cost, and lower time/effort cost than US Gen Y
consumers.
Levene's Test
for Equality of
Variances
T-Test for Equality of Means
F Sig. t df Std. Error
Difference Mean
Difference Sig. (2-tailed)
H1:QV Equal variances
assumed 1.337 .248 -4.775 447 .1132 -.5407 * .000
Equal variances
not assumed -4.729 408.316 .1143 -.5407 .000
H2:EV Equal variances
assumed 3.399 .066 -10.595 447 .1179 -1.2489 * .000
Equal variances
not assumed -10.725 441.874 .1164 -1.2489 .000
H3:EPV Equal variances
assumed 53.789 .000 2.974 447 .091 .270 .003
Equal variances
not assumed 2.809 297.121 .096 .270 ** .005
H4:SV Equal variances
assumed .072 .789 -5.906 447 .121 -.717 * .000
Equal variances
not assumed -5.911 427.525 .121 -.717 .000
H5:MC Equal variances
assumed 4.127 .043 3.054 447 .12348 .37716 .002
Equal variances
not assumed 3.090 441.275 .12207 .37716 ** .002
H6:TC Equal variances
assumed 10.941 .001 -.729 447 .1401 -.1021 .466
Equal variances
not assumed -.741 444.821 .1379 -.1021 * .459
H7:HC Equal variances
assumed 3.849 .050 13.166 447 .1140 1.5015 .000
Equal variances
not assumed 13.085 415.462 .1147 1.5015 ** .000

International Journal of Business and Social Science Vol. 5, No. 10; September 2014
35
Among the four, the two hypotheses dealing with social value and time/effort cost were formulated solely on
previous research because no direction for making predictions on these two values emerged from the qualitative
interview data. The other two hypotheses dealing with quality value and monetary cost were designed based on
both information from the previous literature and information that emerged from the qualitative interview data.
Given that the predictions for the perceived levels of these values were not supported by the quantitative results,
each of them warrants a detailed explanation.
3.4.2 Model Fit
Measurement invariance and/or partial invariance was confirmed for the two samples under discussion (Zhao,
2006) before a CFA in SEM was conducted to investigate the overall fit of the proposed conceptual model for
both samples respectively.
Figure 2 represents the fit of the proposed model for the Chinese sample. The evidence provided by the path
coefficients in Figure 2 (effects of the seven exogenous latent variables on the one endogenous latent variable)
revealed that except for time/effort cost (TC), the other exogenous latent variables all had the predicted influence
on CPV. Specifically, the effects of quality value (QV), emotional value (EV), epistemic value (EPV), and social
value (SV) on CPV were all positive as predicted and reflect the “benefit” constructs that would be anticipated for
CPV. Conversely, the effects of monetary cost (MC) and health risk cost (HC) were negative as predicated and
reflected the “sacrifice” constructs that would be anticipated for CPV. Note that time/effort cost (TC) had a
positive effect on CPV for the Chinese sample, which was surprising and not consistent with the prediction.
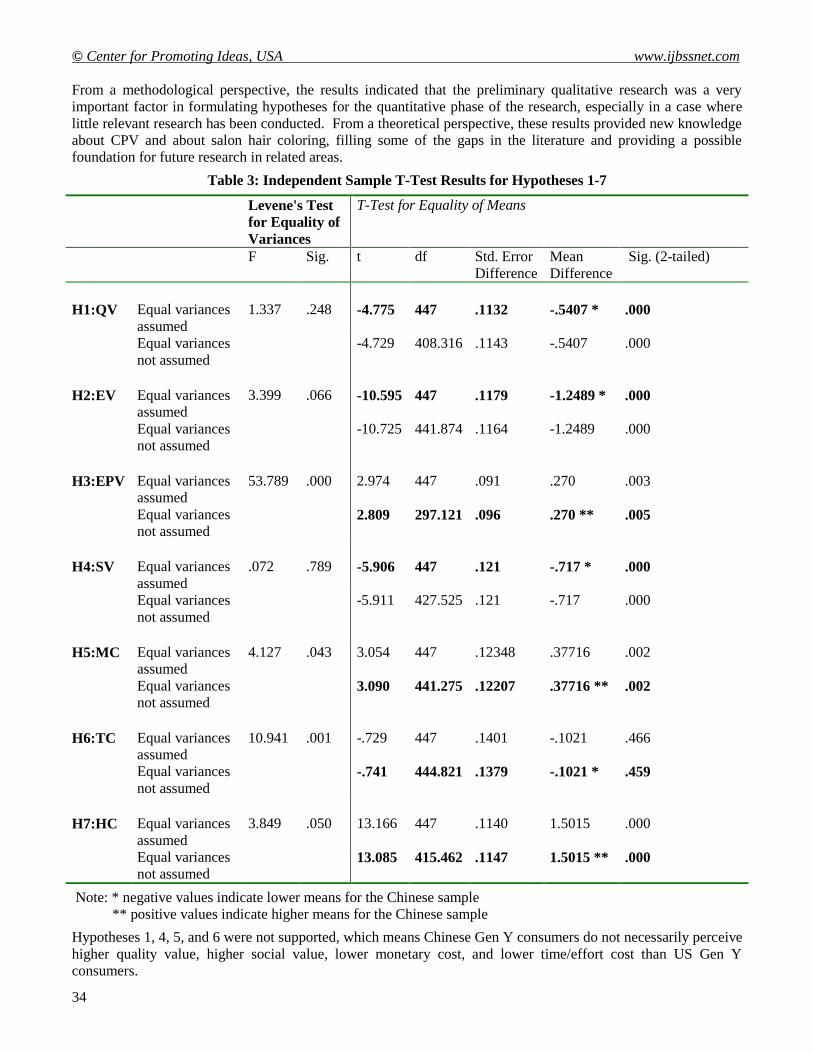
Figure 3 presents the fit of the proposed model for the US sample. Results of the analysis of the path coefficients
in Figure 3 (effects of the seven exogenous latent variables on the one endogenous latent variable) showed that
except for health risk cost (HC), the other exogenous latent variables all demonstrated the predicted influence on
CPV. Specifically, the effects of quality value (QV), emotional value (EV), epistemic value (EPV), and social
value (SV) on CPV were all positive as predicted and reflected the “benefit” constructs associated with CPV.
Conversely, the effects of monetary cost (MC), and time/effort cost (TC) were negative as predicated and
reflected the negative “sacrifice” constructs related to CPV. It should be noted that the health risk cost (HC)
construct had an unexpected positive effect on CPV - but consistent with the finding from the qualitative study
that American Gen Y consumers do not seem to care.
Figure 2: Path Diagram of the Proposed Model for Chinese Gen Y Consumers
© Center for Promoting Ideas, USA www.ijbssnet.com
36
Figure 3: Path Diagram of the Proposed Model for the US Gen Y consumers
For the Chinese sample, the model yielded a statistically significant chi-square statistic, which did not support
good fit for the model based on the data. The value of RMSEA being 0.055 and its Confidence Interval capturing
acceptable values, i.e. lower than 0.80, however, did indicate the model was a good fit for the data. A GFI lower
than the ideal criterion, 0.90, showed insufficient support while a satisfactory value of NNFI showed strong
support for the model being a good fit. Thus, according to the limits accepted for a good fit, the proposed model
appeared to demonstrate an acceptable fit for the Chinese sample.
For the US sample, the model also yielded a statistically significant chi-square statistic, which did not support the
model being a good fit for the data. The value of the RMSEA being 0.074 and its Confidence Interval not
capturing acceptable values, i.e. lower than 0.80, again indicated that the model might not be a very good fit for
the data. The GFI being lower than the ideal criterion of 0.90, showed insufficient support, while only the
satisfactory value of the NNFI showed strong support for the model being a good fit. According to the limits
accepted for a good fit, the proposed model appeared to demonstrate a fair fit for the US sample. Obviously, by
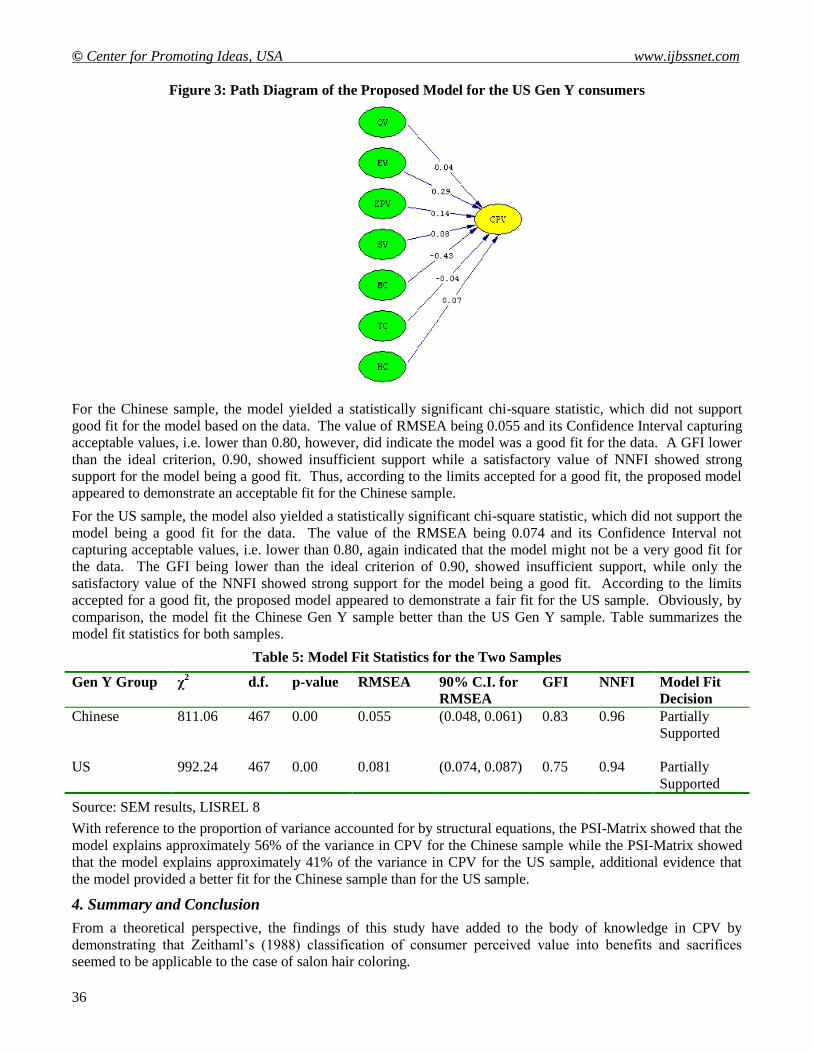
comparison, the model fit the Chinese Gen Y sample better than the US Gen Y sample. Table summarizes the
model fit statistics for both samples.
Table 5: Model Fit Statistics for the Two Samples
Gen Y Group χ2 d.f. p-value RMSEA 90% C.I. for
RMSEA
GFI NNFI Model Fit
Decision
Chinese 811.06 467 0.00 0.055 (0.048, 0.061) 0.83 0.96 Partially
Supported
US 992.24 467 0.00 0.081 (0.074, 0.087) 0.75 0.94 Partially
Supported
Source: SEM results, LISREL 8
With reference to the proportion of variance accounted for by structural equations, the PSI-Matrix showed that the
model explains approximately 56% of the variance in CPV for the Chinese sample while the PSI-Matrix showed
that the model explains approximately 41% of the variance in CPV for the US sample, additional evidence that
the model provided a better fit for the Chinese sample than for the US sample.
4. Summary and Conclusion
From a theoretical perspective, the findings of this study have added to the body of knowledge in CPV by
demonstrating that Zeithaml’s (1988) classification of consumer perceived value into benefits and sacrifices
seemed to be applicable to the case of salon hair coloring.
International Journal of Business and Social Science Vol. 5, No. 10; September 2014
37
Results from both the qualitative and the quantitative research suggested that consumers perceive hair coloring as
a tradeoff between what they “receive” (i.e. quality, emotional value, epistemic value, and social value) and what
they have to “give up” (i.e. health risk, monetary cost, and time/effort). Furthermore, this study suggested that the
model which was originally developed in a Western cultural setting, i.e., the United States, could also be applied
to an Eastern cultural setting, i.e., China.
A methodological contribution of this study is the adaptation of three scales, including the scales for epistemic
value (EPV), time/effort costs (TC), and health risk costs (HC), which were not originally developed for
consumer perceived value studies. The three scales proved to have satisfactory internal reliability (Cronbach’s
alpha between 0.81 and 0.92) except for the application of the EPV scale in the case of the Chinese data
(Cronbach’s alpha being 0.63). It could be that the EPV scale’s low reliability is due to a ceiling effect, an effect
whereby data cannot take on a value higher than some “ceiling,” that is respondents may have given consistently
higher responses on this construct resulting in reduced variation. A possible solution would be to add more items
to this scale to improve its reliability. Overall, the high performance of these adapted scales not only showed the
credibility of the translation procedure used in this study, but also added possible tools to examine the role of
EPV, TC, and HC further in subsequent studies. In addition, due to the establishing of partial invariance and the
strong Cronbach’s alpha levels for the constructs, the set of scales used in this study may prove helpful for future
cross-cultural studies that are concerned with consumer perceived value.
From a practical perspective, this study contributed by providing two pieces of insightful knowledge to the
business world: (1) Gen Y consumers appeared to perceive the value of salon hair coloring differently in China
versus the United States. Specifically, except for the perception of time/effort cost, Chinese Gen Y consumers
appeared to perceive a higher level of epistemic value, monetary cost, and health risk cost, as well as a lower level
of quality value, emotional value, and social value than their US counterparts; and (2) The dimensions of
perceived value that are most influential to Chinese Gen Y consumers’ overall perception of what they give
versus what they receive for salon hair coloring are not the same as for US Gen Y consumers. In particular,
monetary costs turned out to be influential costs for both Chinese and US Gen Y consumers. However, the most
influential value for Chinese Gen Y consumers seemed to be quality value while the most influential value for US
Gen Y consumers appeared to be emotional value. The study results suggest that marketers may want to rethink
the communication channels appropriate for promoting salon hair coloring to Gen Y. Some of the most effective
mass media for advertising to younger generations include internet, magazine, and TV. Relative to hair coloring,
all of these techniques have been used mainly for advertising self hair coloring products, instead of salon hair
coloring. In China, billboards are used, if not widely popular yet, for salon hair coloring advertisements, while in
the United States, salon hair coloring businesses seem to rely on word-of-mouth primarily. Finding the right
advertising approach and designing specific commercials tailored to each Gen Y group, whether in China or the
United States, may be critical for success in promoting salon hair coloring.
As with all studies, when interpreting the results of this research, its limitations should be taken into account.
First, the scales were drawn from the extant literature and modified successfully for application in this study.
However, the epistemic value construct did fall below Nunnally’s (1978) criterion. Second, the respondents were
primarily full-time students and may not be as representative of older Gen Y consumers as they are of younger
Gen Y consumers. Finally, the samples consisted of only Gen Y consumers enrolled in colleges. Even though
there has been no evidence showing any significant differences existing between Gen Ys going to college and
Gen Ys not enrolled in college, the findings of this study should be applied with caution to a general population.
References
Bloch, P. H. (1993). Involvement with adornment as leisure behavior: an exploratory study. Journal of Leisure
Research, 25(3), 245-262.
Bloch, P. H. & Richins, M. L. (1992). You look “Marvelous”: the pursuit of beauty and the marketing concept.
Psychology and Marketing, 9(1), 3-15.
Cash, T. F. (1987). The psychology of cosmetics: A review of the scientific literature. Social and Behavioral
Sciences Documents, 17(1), MS No. 2800.
Cash, T. F. & Henry, P. E. (1995). Women’s body images: The results of a national survey in the U.S.A. Sex
Roles, 33, 19-28.
© Center for Promoting Ideas, USA www.ijbssnet.com
38
Chiu, R. K. & Babcock, R.D. (2002). The relative importance of facial attractiveness and gender in Hong Kong
selection decisions. International Journal of Human Resource Management, 13(1), 141-155.
Datamonitor (2004). Haircare in the United States. Datamonitor USA, Reference Code: 0072-2242. Retrieved
September 2, 2005 from http://www.datamonitor.com
Denzin, N., & Lincoln, Y. (1994). Handbook of Qualitative Research. Thousand Oaks: Sage.
Eicher, J., Evenson, S., & Lutz, H. (2000). The Visible Self. Global Perspectives on Dress, Culture, and Society.
New York: Fairchild.
Euromonitor (2005). The World Market for Cosmetics and Toiletries. Euromonitor International. Retrieved
October 1, 2005 from http://libproxy.uncg.edu:2798/Reports.aspx
Euromonitor (2013). The Divergent Worlds of Hair Care: Global Strategies for Growth. Euromonitor Passport.
February, Retrieved April 16, 2014 from http://www.euromonitor.com.
Euromonitor (2013a). Rethinking Beauty: Exploring New Growth Models. Euromonitor Passport. October,
Retrieved May 12th, 2014 from http://www.euromonitor.com.
Euromonitor (2013b). Hair Care in China. Euromonitor Passport. April, Retrieved May 12th, 2014 from
http://www.euromonitor.com.
Euromonitor (2013c). Hair Care in the US. Euromonitor Passport. July, Retrieved May 12th, 2014 from
http://www.euromonitor.com.
Gardyn, R. (2002). Educated Consumers. American Demographics, 24(10), 18-19.
Hair, J.F., Anderson, R.E., Tatham, R.L. and Black, W.C. (1998). Multivariate Data Analysis. Prentice-Hall,
Upper Saddle River, NJ.
Hoebel, E. A. (1958). Clothing and Ornament, in Man in the Primitive World. New York: McGraw-Hill Book
Co.
Horn & McArdle (1992). A practical and theoretical guide to measurement invariance in aging research.
Experimental Aging Research, 18(4), 117-144.
Hu, L., & Bentler, P.M. (1995). Evaluating model fit. In R. H. Hoyle, Ed. Structural equation modeling:
Concepts, issues and applications. Thousand Oaks: Sage.
Kaiser, S. B. (1997). The Social Psychology of Clothing: Symbolic Appearances in Context. New York:
Fairchild Publications.
Kim, D., Wen, L., & Doh, K. (2010). Does cultural difference affect customers’ response in a crowded restaurant
environment? A comparison of American versus Chinese customers. Journal of Hospitality and Tourism
Research, 43(1), 103-123.
Li, F., Zhou, N., Nicholls, J. A. F., Zhuang, G., & Kranendonk, C. (2004). Interlinear or inscription? A
comparative study of Chinese and American mall shoppers’ behavior. Journal of Consumer Marketing,
21(1), 51-61.
Li, S. (2003). China Cosmetics Market. U.S. & Foreign Commercial Service and U.S. Department of State.
Retrieved March 19, 2005 from http://strategis.ic.gc.ca/epic/internet/inimr-ri.nsf/en/gr10999le.html
McEwen, W., Fang, X., Zhang, C. & Burkholder, R. (2006). Inside the Mind of the Chinese Consumer. Harvard
Business Review, March, 68-76.
Moore, L. (2005). The Personal Beauty Care Market Outlook: NPD and Consumer Trends in Haircare and
Skincare. Business Insights.
Nunnally, J. (1978). Psychometric Theory. McGraw-Hill, New York, NY.
Pan, Z. D., Chaffee, S. H., Chu, G. C., & Ju, Y. N. (1994). To See Ourselves: Comparing Traditional Chinese and
American Cultural Values. Boulder, San Francisco, Oxford: Westview Press.
Parment, A. (2013). Materialism and conspicuous consumption in China: a cross-cultural examination. Journal
of Retailing and Consumer Services, 20, 189-199.
Pine, B. J., & Gilmore, J. H. (1999). The Experience Economy: Work is Theater & Every Business a Stage.
Harvard Business School Press: Boston.
Podoshen, J. S., Li, L., & Zhang, J. (2011). Materialism and conspicuous consumption in China: a cross-cultural
examination. International Journal of Consumer Studies, 35, 17-25.
Richins, M. L., & Dawson, S. (1992). A consumer value orientation for materialism and its measurement: scale
development and validation. Journal of Consumer Research, 19(3), 303-316.
Salzman, M. (1999). Spoiled squirts sprouting. Brandweek, 40(27), 14.
International Journal of Business and Social Science Vol. 5, No. 10; September 2014
39
Souiden, N., & Diagne, M. (2009). Canadian and French men’s consumption of cosmetics: a comparison of their
attitudes and motivations. Journal of Consumer Marketing, 22 (2), 97-109.
Steenkamp, J-B. E. M., & Baumgartner, H. (1998). Assessing measurement invariance in cross-national
consumer research. Journal of Consumer Research, 25, 78–90.
Steenkamp, J-B. E. M. and Baumgartner, H. (2000). On the use of Structural Equation Models for marketing
modeling. International Journal of Research in Marketing, 17(2/3), 195-202.
Sun, T., Horn, M., & Merritt, D. (2004). Values and lifestyles of individualists and collectivists: a study on
Chinese, Japanese, British, and US consumers. Journal of Consumer Marketing, 21(5), 318-331.
Trueb, R. M. (2005). Understanding Hair Biology. European Hair Research Society, 11th Meeting, Zurich, July
2005: Abstracts and Selected Reviews.
Wang, Z. & Rao, C. P. (1995). Personal values and shopping behavior: a structural equation test of the RVs in
China. Advances in Consumer Research, 22(3), 373-380.
Weber, J. M., & Villebonne, J. K. (2002). Differences in purchase behavior between France and the USA: the
cosmetics industry. Journal of Fashion Marketing and Management, 6(4), 396-407.
Woodruff, R. B. (1997). Customer value: the next source of competitive advantage. Journal of the Academy of
Marketing Science, 25(1), 139-153.
Wysocki, B. (1997). The global mall: in developing nations, many youths splurge, mainly on US goods – flush
with cash and plastic, they load up on Levi’s and tune in to MTV – a lot of ‘Little Emperors’. The Wall
Street Journal, 26 June, A1.
Zaithaml, V. A. (1988). Consumer perceptions of price, quality, and value: a means-end model and synthesis of
evidence. Journal of Marketing, 52(3), 2-22.
Zhao, X. (2006). Consumer Perceived Value of Salon Hair Coloring: A Cross-cultural Comparison of Gen Y
Cohorts in China and the United States. Unpublished doctorate dissertation, University of North Carolina,
Greensboro.
Zhao, X. (2014). Salon Hair Coloring in the United States: a Consumer Perceived Value Analysis of Gen Y
Consumers. International Journal of Arts and Commerce, 3(6), pp. 105-115
Zhou, Z., & Nakamoto, K. (2001). Price perceptions: a cross-national study between American and Chinese
Young consumers. Advances in Consumer Research, 28, 161-168.