Embed Size (px)
Citation preview
SPRAWLING TOWARDS CLIMATE CHANGE:
Connecting U.S. Patterns of Land Development to Greenhouse Gas Emissions
Prepared by Amy Shatzkin Cities for Climate Protection-US®
ICLEI-US Berkeley, CA
Fall 2004
This project was made possible by: The Edna Bailey Sussman Fund
The Hixon Center for Urban Ecology
SPRAWLING TOWARDS CLIMATE CHANGE - ICLEI Local Governments for Sustainability Fall 2004
2
TABLE OF CONTENTS
THE SPRAWL-GHG CONNECTION
Introduction 1 Sprawling Forward: America Today 1 Defining Smart Growth 4 Municipalities Can Slow Sprawl 6 Solving Sprawl = Multiple Benefits 7 The Problem: It’s Where We Build 10 Developing Solutions 12 The Problem: It’s How We Build 14 Building Solutions 16
LAND USE PLANNING FOR CO2 REDUCTION: Examples from 5 CCP Communities Central Connecticut Communities 20 New Haven, CT 21 Austin, TX 21 San Diego, CA 21 Sacramento, CA 22 RESOURCE GUIDE Municipal Friendly Tools 23 Smart Growth Organizations 24 Online Smart Growth Glossaries 25 Transportation-related Organizations 25 Green Building Information and Organizations 25 Online Smart Growth Bibliographies 26 Online Publications 26 Print Publications 28 GLOSSARY 29 ENDNOTES 33 ACKNOWLEDGEMENTS 35
SPRAWLING TOWARDS CLIMATE CHANGE - ICLEI Local Governments for Sustainability Fall 2004
3
THE SPRAWL-GREENHOUSE GAS CONNECTION
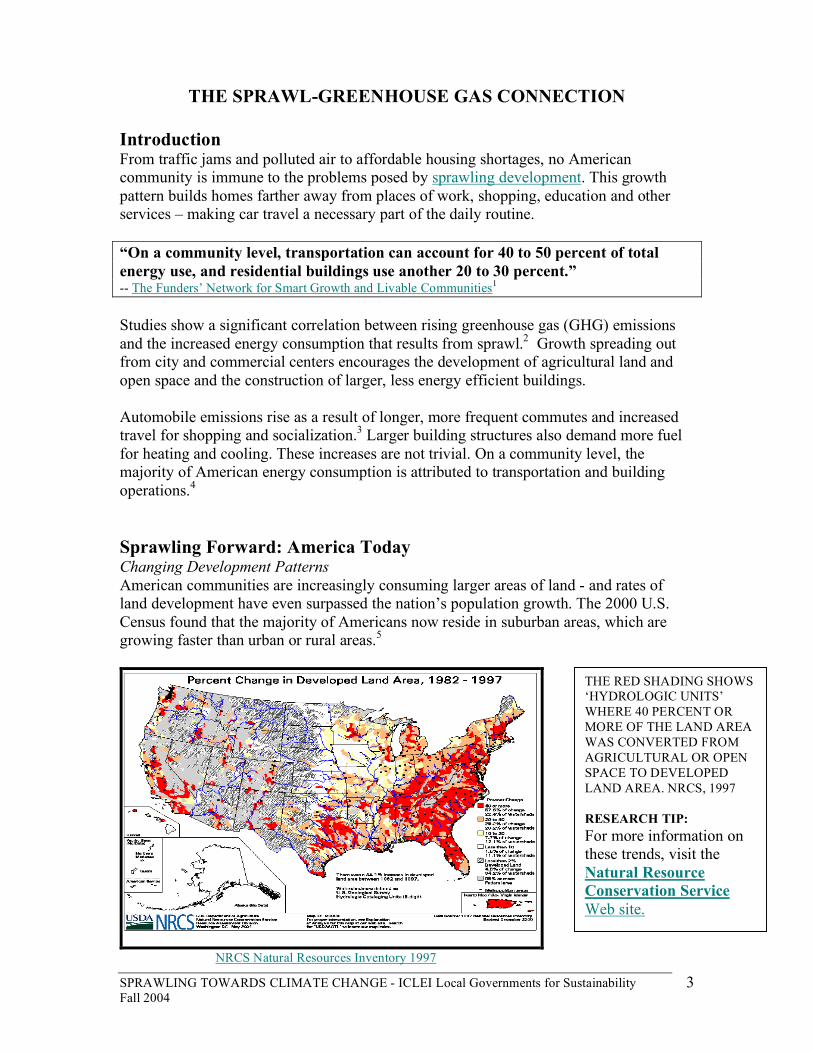
Introduction From traffic jams and polluted air to affordable housing shortages, no American community is immune to the problems posed by sprawling development. This growth pattern builds homes farther away from places of work, shopping, education and other services – making car travel a necessary part of the daily routine. “On a community level, transportation can account for 40 to 50 percent of total energy use, and residential buildings use another 20 to 30 percent.” -- The Funders’ Network for Smart Growth and Livable Communities1 Studies show a significant correlation between rising greenhouse gas (GHG) emissions and the increased energy consumption that results from sprawl.2 Growth spreading out from city and commercial centers encourages the development of agricultural land and open space and the construction of larger, less energy efficient buildings. Automobile emissions rise as a result of longer, more frequent commutes and increased travel for shopping and socialization.3 Larger building structures also demand more fuel for heating and cooling. These increases are not trivial. On a community level, the majority of American energy consumption is attributed to transportation and building operations.4 Sprawling Forward: America Today Changing Development Patterns American communities are increasingly consuming larger areas of land - and rates of land development have even surpassed the nation’s population growth. The 2000 U.S. Census found that the majority of Americans now reside in suburban areas, which are growing faster than urban or rural areas.5
NRCS Natural Resources Inventory 1997
THE RED SHADING SHOWS ‘HYDROLOGIC UNITS’ WHERE 40 PERCENT OR MORE OF THE LAND AREA WAS CONVERTED FROM AGRICULTURAL OR OPEN SPACE TO DEVELOPED LAND AREA. NRCS, 1997 RESEARCH TIP: For more information on these trends, visit the Natural Resource Conservation Service Web site.
SPRAWLING TOWARDS CLIMATE CHANGE - ICLEI Local Governments for Sustainability Fall 2004
4
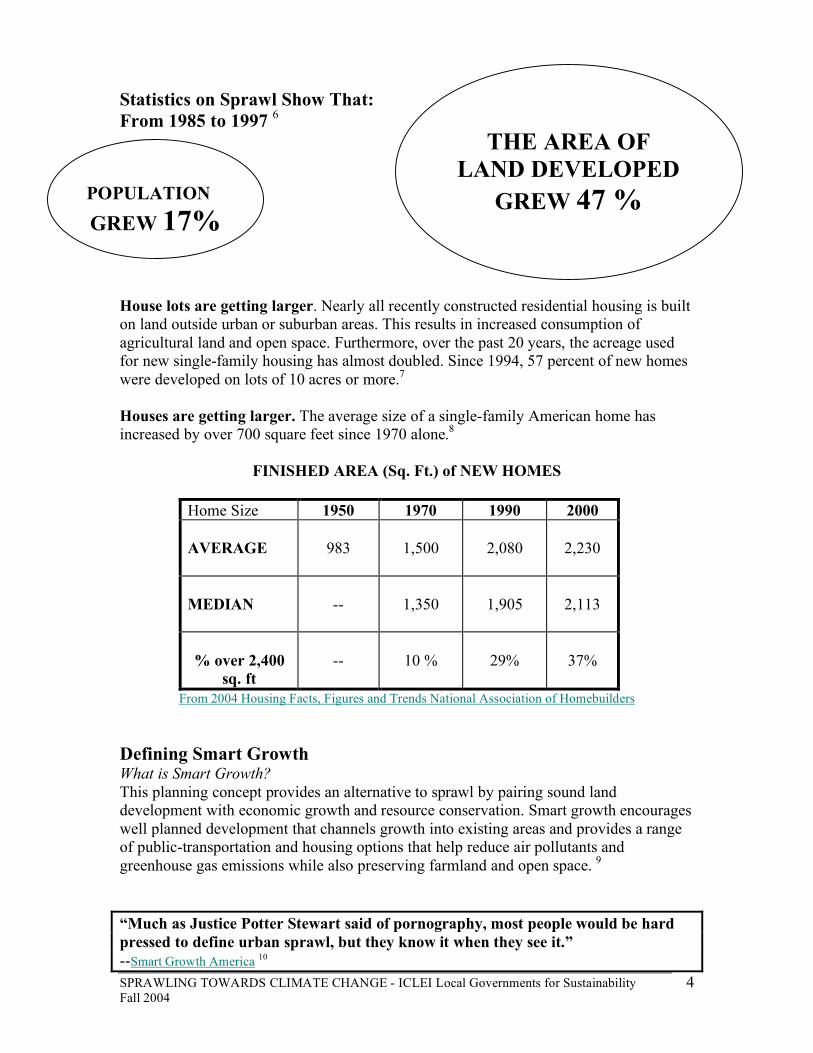
Statistics on Sprawl Show That: From 1985 to 1997 6
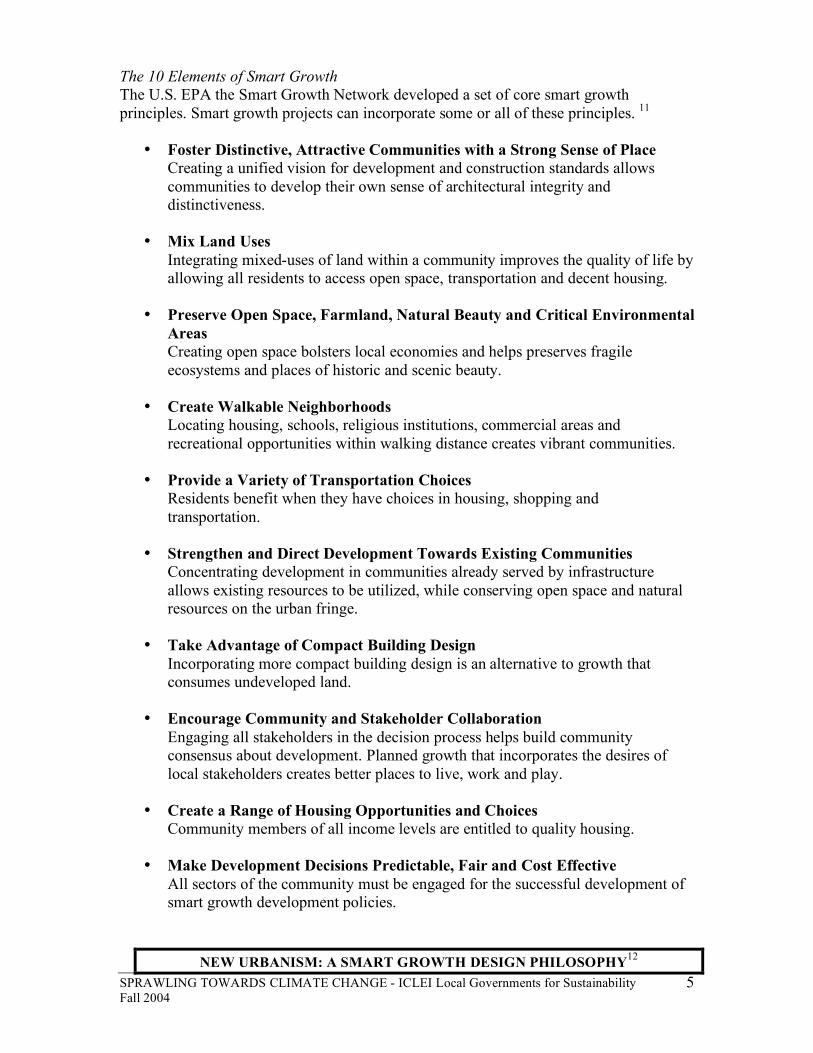
House lots are getting larger. Nearly all recently constructed residential housing is built on land outside urban or suburban areas. This results in increased consumption of agricultural land and open space. Furthermore, over the past 20 years, the acreage used for new single-family housing has almost doubled. Since 1994, 57 percent of new homes were developed on lots of 10 acres or more.7 Houses are getting larger. The average size of a single-family American home has increased by over 700 square feet since 1970 alone.8
FINISHED AREA (Sq. Ft.) of NEW HOMES
Home Size 1950 1970 1990 2000 AVERAGE
983
1,500
2,080
2,230
MEDIAN
--
1,350
1,905
2,113
% over 2,400
sq. ft
--
10 %
29%
37%
From 2004 Housing Facts, Figures and Trends National Association of Homebuilders Defining Smart Growth What is Smart Growth? This planning concept provides an alternative to sprawl by pairing sound land development with economic growth and resource conservation. Smart growth encourages well planned development that channels growth into existing areas and provides a range of public-transportation and housing options that help reduce air pollutants and greenhouse gas emissions while also preserving farmland and open space. 9 “Much as Justice Potter Stewart said of pornography, most people would be hard pressed to define urban sprawl, but they know it when they see it.” --Smart Growth America 10
POPULATION
GREW 17%
THE AREA OF
LAND DEVELOPED GREW 47 %
SPRAWLING TOWARDS CLIMATE CHANGE - ICLEI Local Governments for Sustainability Fall 2004
5
The 10 Elements of Smart Growth The U.S. EPA the Smart Growth Network developed a set of core smart growth principles. Smart growth projects can incorporate some or all of these principles. 11
• Foster Distinctive, Attractive Communities with a Strong Sense of Place Creating a unified vision for development and construction standards allows communities to develop their own sense of architectural integrity and distinctiveness.
• Mix Land Uses
Integrating mixed-uses of land within a community improves the quality of life by allowing all residents to access open space, transportation and decent housing.
• Preserve Open Space, Farmland, Natural Beauty and Critical Environmental
Areas Creating open space bolsters local economies and helps preserves fragile ecosystems and places of historic and scenic beauty.
• Create Walkable Neighborhoods Locating housing, schools, religious institutions, commercial areas and recreational opportunities within walking distance creates vibrant communities.
• Provide a Variety of Transportation Choices
Residents benefit when they have choices in housing, shopping and transportation.
• Strengthen and Direct Development Towards Existing Communities
Concentrating development in communities already served by infrastructure allows existing resources to be utilized, while conserving open space and natural resources on the urban fringe.
• Take Advantage of Compact Building Design
Incorporating more compact building design is an alternative to growth that consumes undeveloped land.
• Encourage Community and Stakeholder Collaboration
Engaging all stakeholders in the decision process helps build community consensus about development. Planned growth that incorporates the desires of local stakeholders creates better places to live, work and play.
• Create a Range of Housing Opportunities and Choices Community members of all income levels are entitled to quality housing.
• Make Development Decisions Predictable, Fair and Cost Effective
All sectors of the community must be engaged for the successful development of smart growth development policies.
NEW URBANISM: A SMART GROWTH DESIGN PHILOSOPHY12
SPRAWLING TOWARDS CLIMATE CHANGE - ICLEI Local Governments for Sustainability Fall 2004
6
New Urbanism is a design movement that was created by architects and planners in the late 1980s and early 1990s to reform all aspects of real estate development. According to the Congress for New Urbanism, development should:13 Rule out projects that are gated, lack sidewalks or have tree-like street systems,
rather than a grid network. The project should connect with surrounding neighborhoods, developments or towns, while protecting regional open space.
Rule out "single-use" projects that only provide housing, retail or office space. Building types should be integrated, and one neighborhood should include different types of housing, workplaces and stores.
The project should have a neighborhood center that is an easy and safe walk from all neighborhood homes. Buildings should be designed to make the street feel safe and inviting by having front doors, porches, and windows facing the street.
The project, and particularly the neighborhood center, should include formal civic spaces and squares.
Finally, there is the "Popsicle test," a principle developed by urban planner Jane Jacobs. An eight-year-old in the neighborhood should be able to bike to a store to buy a Popsicle without having to cross highways or speeding traffic.
RESEARCH TIP: For more information on New Urbanism, visit The Congress for New Urbanism Web site or go on a virtual tour of New Urbanism (Flash needed to view site).
Municipalities Can Slow Sprawl and Reduce CO2 Emissions Land use is a local issue, and development decisions are often made on a community by-community basis. Municipal governments are uniquely poised to provide alternatives to sprawl by legislating “where” and “how” communities are designed and built.14 Land use planning to efficiently locate an array of services in a neighborhood, coupled with green design, could “lessen air pollution associated with fossil fuel combustion, reduce greenhouse gas emissions, and increase the affordability of housing and commercial space by reducing operating costs.”15 Local officials across the country are integrating these measures into smart growth policies that reduce their community’s GHG emissions while improving their residents’ standard of living. “Where” to build – Design neighborhoods so residents are less automobile-reliant by:
• Creating more transportation choices • Developing denser neighborhoods that increase access to shopping and services • Ensuring the availability of affordable housing • Developing parks and preserving open space
“How” to build – Create energy efficient residential and commercial buildings by: • Implementing green building codes for construction and landscaping that
incorporate energy efficiency standards • Encouraging incentives for energy efficient measures and retrofits in existing
homes and businesses Solving Sprawl = Multiple benefits
SPRAWLING TOWARDS CLIMATE CHANGE - ICLEI Local Governments for Sustainability Fall 2004
7
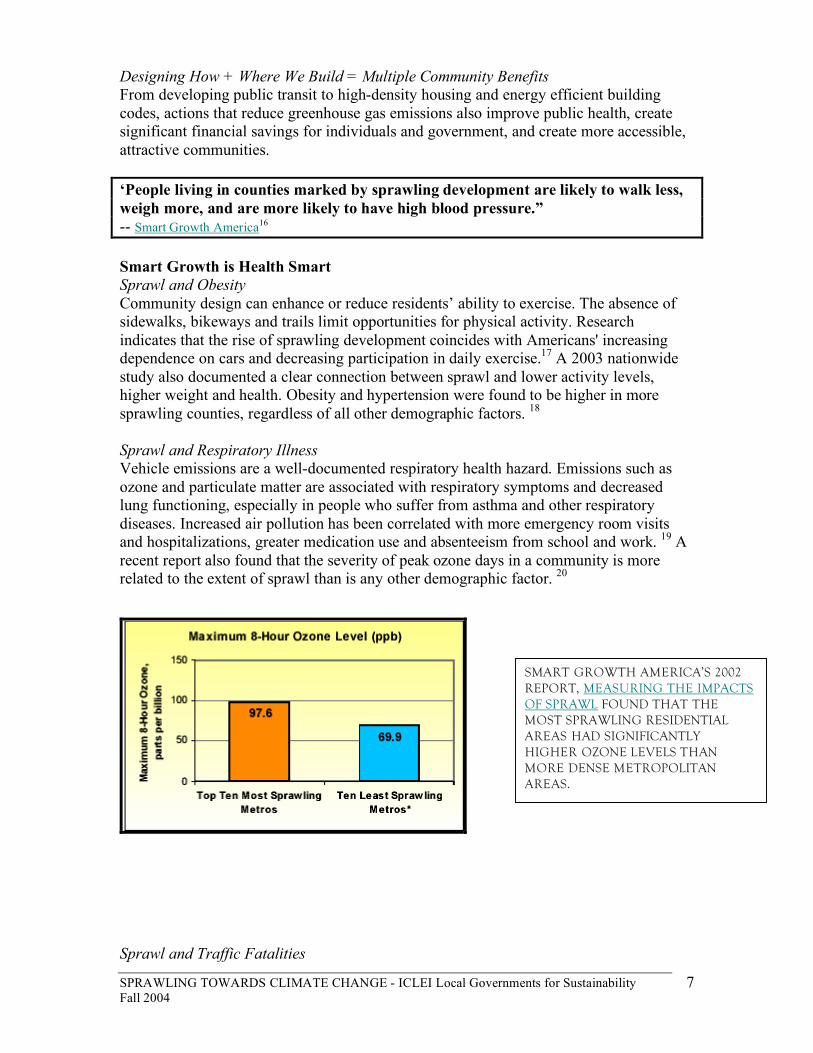
Designing How + Where We Build = Multiple Community Benefits From developing public transit to high-density housing and energy efficient building codes, actions that reduce greenhouse gas emissions also improve public health, create significant financial savings for individuals and government, and create more accessible, attractive communities. ‘People living in counties marked by sprawling development are likely to walk less, weigh more, and are more likely to have high blood pressure.” -- Smart Growth America16 Smart Growth is Health Smart Sprawl and Obesity Community design can enhance or reduce residents’ ability to exercise. The absence of sidewalks, bikeways and trails limit opportunities for physical activity. Research indicates that the rise of sprawling development coincides with Americans' increasing dependence on cars and decreasing participation in daily exercise.17 A 2003 nationwide study also documented a clear connection between sprawl and lower activity levels, higher weight and health. Obesity and hypertension were found to be higher in more sprawling counties, regardless of all other demographic factors. 18 Sprawl and Respiratory Illness Vehicle emissions are a well-documented respiratory health hazard. Emissions such as ozone and particulate matter are associated with respiratory symptoms and decreased lung functioning, especially in people who suffer from asthma and other respiratory diseases. Increased air pollution has been correlated with more emergency room visits and hospitalizations, greater medication use and absenteeism from school and work. 19 A recent report also found that the severity of peak ozone days in a community is more related to the extent of sprawl than is any other demographic factor. 20
Sprawl and Traffic Fatalities
SMART GROWTH AMERICA’S 2002 REPORT, MEASURING THE IMPACTS OF SPRAWL FOUND THAT THE MOST SPRAWLING RESIDENTIAL AREAS HAD SIGNIFICANTLY HIGHER OZONE LEVELS THAN MORE DENSE METROPOLITAN AREAS.
SPRAWLING TOWARDS CLIMATE CHANGE - ICLEI Local Governments for Sustainability Fall 2004
8
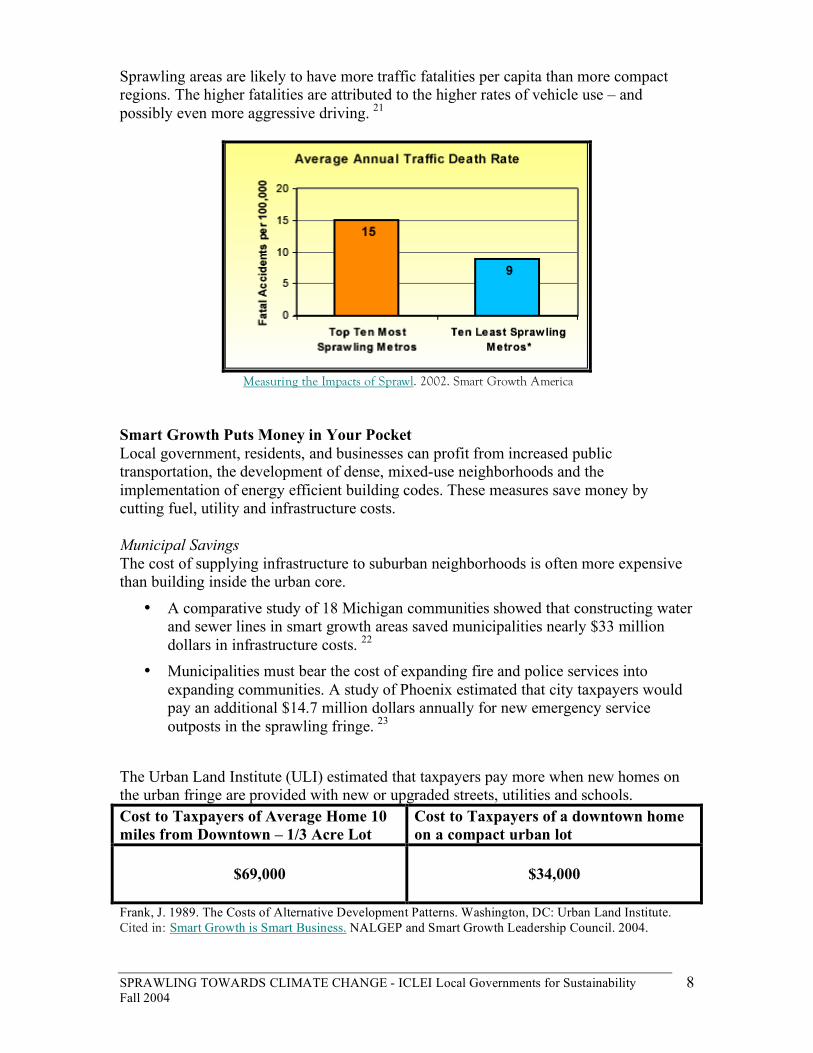
Sprawling areas are likely to have more traffic fatalities per capita than more compact regions. The higher fatalities are attributed to the higher rates of vehicle use – and possibly even more aggressive driving. 21
Measuring the Impacts of Sprawl. 2002. Smart Growth America
Smart Growth Puts Money in Your Pocket Local government, residents, and businesses can profit from increased public transportation, the development of dense, mixed-use neighborhoods and the implementation of energy efficient building codes. These measures save money by cutting fuel, utility and infrastructure costs. Municipal Savings The cost of supplying infrastructure to suburban neighborhoods is often more expensive than building inside the urban core.
• A comparative study of 18 Michigan communities showed that constructing water and sewer lines in smart growth areas saved municipalities nearly $33 million dollars in infrastructure costs. 22
• Municipalities must bear the cost of expanding fire and police services into expanding communities. A study of Phoenix estimated that city taxpayers would pay an additional $14.7 million dollars annually for new emergency service outposts in the sprawling fringe. 23
The Urban Land Institute (ULI) estimated that taxpayers pay more when new homes on the urban fringe are provided with new or upgraded streets, utilities and schools. Cost to Taxpayers of Average Home 10 miles from Downtown – 1/3 Acre Lot
Cost to Taxpayers of a downtown home on a compact urban lot
$69,000
$34,000
Frank, J. 1989. The Costs of Alternative Development Patterns. Washington, DC: Urban Land Institute. Cited in: Smart Growth is Smart Business. NALGEP and Smart Growth Leadership Council. 2004.
SPRAWLING TOWARDS CLIMATE CHANGE - ICLEI Local Governments for Sustainability Fall 2004
9
The chart below shows relative construction costs for infrastructure projects to create single-family dwellings and apartment complexes. (The cost is in dollars at 1987 rates.)
Infrastructure
Single family (3 units/acre)
Moderate density condos (30 units/acre)
Streets and roads
7,083 $/unit 1,843 $/unit
Schools
12,313 $/unit 3,786 $/unit
Utilities
11,388 $/unit 1,997 $/unit
Frank, J. 1989. The Costs of Alternative Development Patterns. Washington, DC: Urban Land Institute. Table 8. Cited in: Curbing Sprawl to Stop Global Warming, Sierra Club Personal Savings at Home. The average household spends about $1400 on energy costs yearly. 24
• The cost of satisfying a home’s heating and cooling needs can be reduced by up to 30% by investing a few hundred dollars in insulation and weatherization.25
• A Colorado subdivision of single-family homes reduced heating bills by 50 percent by maximizing each housing unit’s insulation and solar exposure.26
• The U.S. Department of Energy estimates that energy efficient design and technologies could save 100 billion dollars in energy costs if they were implemented in the 25 million housing units and 17 billion square feet of commercial development that is projected to be built in the next 15 years. 27
Local Governments Drive National Transit Projects
State and local governments are the main investors in transportation infrastructure. Improving municipal transportation often means that local governments need to work with state and regional entities to get projects off the ground. Local governments own about 75 percent of the nearly 4 million-mile highways and road network and more than half of the nearly 600,000 bridges in this country.28 • Public transportation is funded through capital funds and operating fees. • Capital funds finance infrastructure needs such as new construction and
rehabilitation of existing facilities. The federal government contributes between 44% and 80% for some projects. The balance is made up of a combination of state and local government funds, with states averaging contributions of 10% and local governments, 13%.
• Operating funds provide income for operating expenses. Approximately 74% of these funds come from local sources. 29
Personal Savings On the Road The more often Americans drive, the more Americans spend time idling in traffic, burning up gas and money. According to the Texas Transportation Institute:
SPRAWLING TOWARDS CLIMATE CHANGE - ICLEI Local Governments for Sustainability Fall 2004
10
• Highway travel times increased between 1990 and 2000 in 70 of 75 urban areas studied. Over this ten-year period, it took 39 percent longer to make a trip in an urban area during peak travel times than it would during off-peak hours. 30
• 5.7 billion gallons of fuel were wasted in the 75 urban areas. This amount of fuel would fill 114 super-tankers or 570,000 gasoline tank trucks. 31
• The total cost of waiting in traffic (based on time and fuel wasted) in 85 urban areas was $63.2 billion dollars, or an average of $829 per person, yearly.32
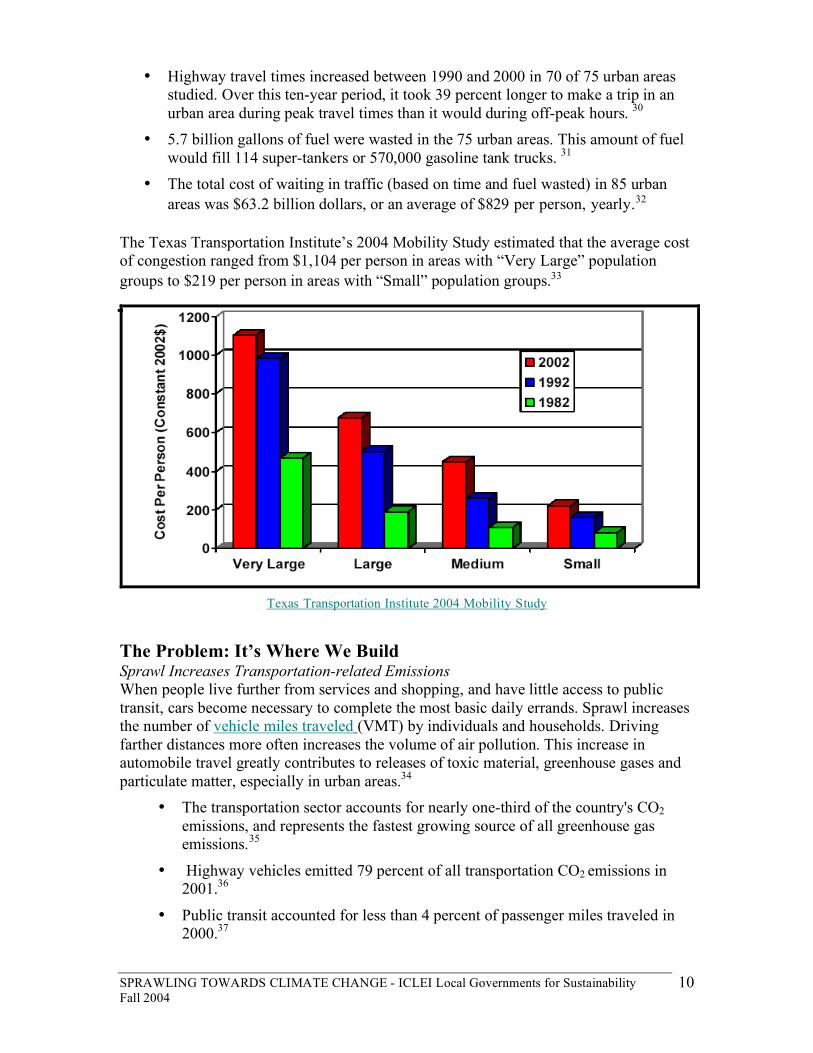
The Texas Transportation Institute’s 2004 Mobility Study estimated that the average cost of congestion ranged from $1,104 per person in areas with “Very Large” population groups to $219 per person in areas with “Small” population groups.33
Texas Transportation Institute 2004 Mobility Study The Problem: It’s Where We Build Sprawl Increases Transportation-related Emissions When people live further from services and shopping, and have little access to public transit, cars become necessary to complete the most basic daily errands. Sprawl increases the number of vehicle miles traveled (VMT) by individuals and households. Driving farther distances more often increases the volume of air pollution. This increase in automobile travel greatly contributes to releases of toxic material, greenhouse gases and particulate matter, especially in urban areas.34
• The transportation sector accounts for nearly one-third of the country's CO2 emissions, and represents the fastest growing source of all greenhouse gas emissions.35
• Highway vehicles emitted 79 percent of all transportation CO2 emissions in 2001.36
• Public transit accounted for less than 4 percent of passenger miles traveled in 2000.37
SPRAWLING TOWARDS CLIMATE CHANGE - ICLEI Local Governments for Sustainability Fall 2004
11
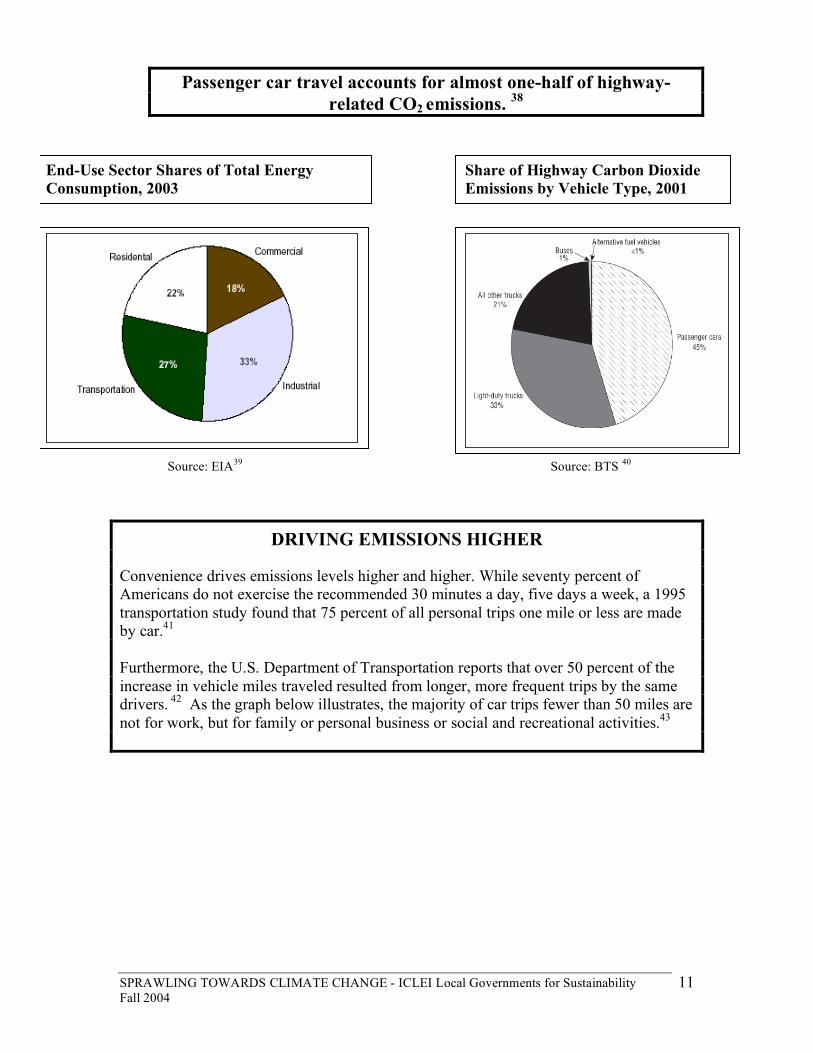
Passenger car travel accounts for almost one-half of highway-related CO2 emissions. 38
Source: EIA39 Source: BTS 40
DRIVING EMISSIONS HIGHER
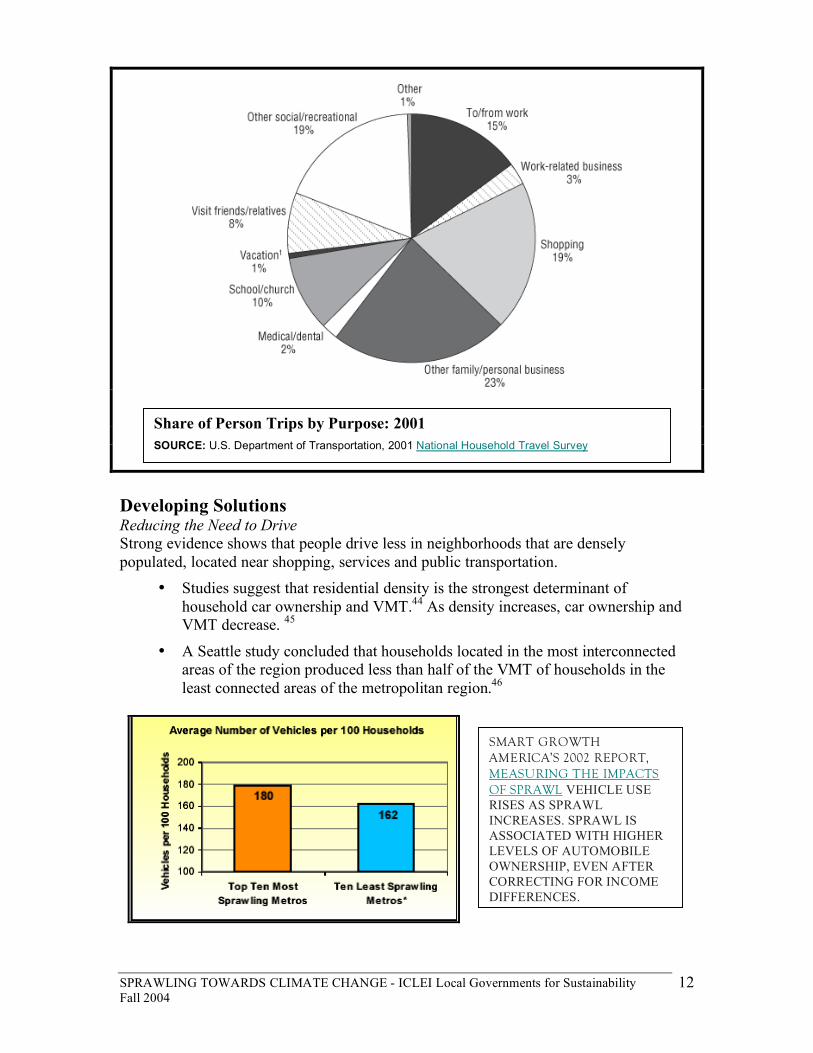
Convenience drives emissions levels higher and higher. While seventy percent of Americans do not exercise the recommended 30 minutes a day, five days a week, a 1995 transportation study found that 75 percent of all personal trips one mile or less are made by car.41 Furthermore, the U.S. Department of Transportation reports that over 50 percent of the increase in vehicle miles traveled resulted from longer, more frequent trips by the same drivers. 42 As the graph below illustrates, the majority of car trips fewer than 50 miles are not for work, but for family or personal business or social and recreational activities.43
End-Use Sector Shares of Total Energy Consumption, 2003
Share of Highway Carbon Dioxide Emissions by Vehicle Type, 2001
SPRAWLING TOWARDS CLIMATE CHANGE - ICLEI Local Governments for Sustainability Fall 2004
12
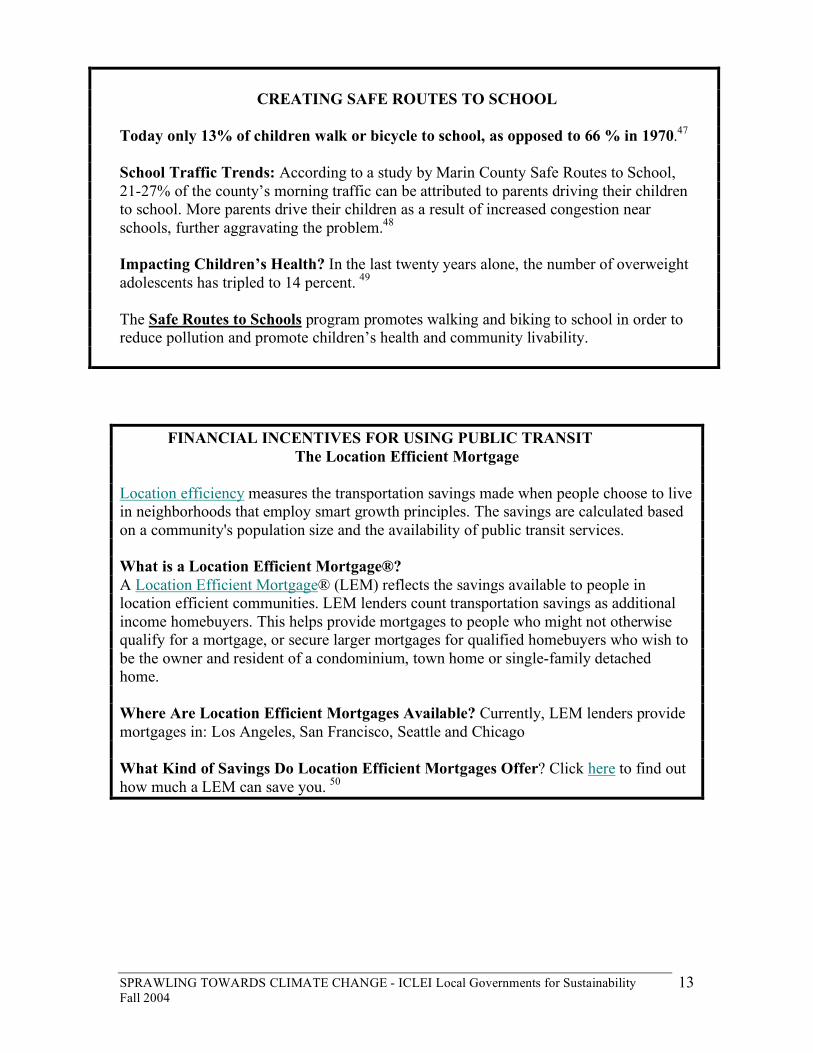
Developing Solutions Reducing the Need to Drive Strong evidence shows that people drive less in neighborhoods that are densely populated, located near shopping, services and public transportation.
• Studies suggest that residential density is the strongest determinant of household car ownership and VMT.44 As density increases, car ownership and VMT decrease. 45
• A Seattle study concluded that households located in the most interconnected areas of the region produced less than half of the VMT of households in the least connected areas of the metropolitan region.46
Share of Person Trips by Purpose: 2001 SOURCE: U.S. Department of Transportation, 2001 National Household Travel Survey
SMART GROWTH AMERICA’S 2002 REPORT, MEASURING THE IMPACTS OF SPRAWL VEHICLE USE RISES AS SPRAWL INCREASES. SPRAWL IS ASSOCIATED WITH HIGHER LEVELS OF AUTOMOBILE OWNERSHIP, EVEN AFTER CORRECTING FOR INCOME DIFFERENCES.
SPRAWLING TOWARDS CLIMATE CHANGE - ICLEI Local Governments for Sustainability Fall 2004
13
CREATING SAFE ROUTES TO SCHOOL
Today only 13% of children walk or bicycle to school, as opposed to 66 % in 1970.47 School Traffic Trends: According to a study by Marin County Safe Routes to School, 21-27% of the county’s morning traffic can be attributed to parents driving their children to school. More parents drive their children as a result of increased congestion near schools, further aggravating the problem.48 Impacting Children’s Health? In the last twenty years alone, the number of overweight adolescents has tripled to 14 percent. 49 The Safe Routes to Schools program promotes walking and biking to school in order to reduce pollution and promote children’s health and community livability.
FINANCIAL INCENTIVES FOR USING PUBLIC TRANSIT The Location Efficient Mortgage
Location efficiency measures the transportation savings made when people choose to live in neighborhoods that employ smart growth principles. The savings are calculated based on a community's population size and the availability of public transit services. What is a Location Efficient Mortgage®? A Location Efficient Mortgage® (LEM) reflects the savings available to people in location efficient communities. LEM lenders count transportation savings as additional income homebuyers. This helps provide mortgages to people who might not otherwise qualify for a mortgage, or secure larger mortgages for qualified homebuyers who wish to be the owner and resident of a condominium, town home or single-family detached home. Where Are Location Efficient Mortgages Available? Currently, LEM lenders provide mortgages in: Los Angeles, San Francisco, Seattle and Chicago What Kind of Savings Do Location Efficient Mortgages Offer? Click here to find out how much a LEM can save you. 50
SPRAWLING TOWARDS CLIMATE CHANGE - ICLEI Local Governments for Sustainability Fall 2004
14
Land Preservation and Zoning Preserving open space can avert the release of GHG emissions by maintaining the environment’s capacity to store CO2 and channeling new development into existing, denser areas. Development and deforestation decrease the land’s potential to absorb and store carbon. Roughly one-half of the carbon stored on earth is found in forest vegetation and soils.51 Local governments can institute regulations that:
• Preserve and increase tree canopies in urban areas. This cools neighborhoods so that less energy is consumed in the summertime.
• Create zoning ordinances and comprehensive plans that minimize the impact of development on open space.
• Develop with open space easements within their community. • Promote municipal bond issues to promote open space preservation.
Examples of zoning measures that encourage dense, mix-use development include:• Brownfield re-development • Cluster Development • Compact Building Design • Conservation Easement • Impact Fees • Incentive Zoning • Location Efficient Mortgage • Mixed Use Development • Planned Unit Development • Traditional Neighborhood Design (TND) • Transfer of Development Rights • Transit-oriented Development (TOD) • Transit-Overlay District • Urban Growth Boundary • Urban Infilling
RESEARCH TIP: Find out about how your community can adopt one of these smart growth measures by searching a checklist of 100 Smart Growth Policies for Implementation
The Problem: It’s How We Build Buildings Are Energy Intensive Building operations such as heating and cooling account for 25 to 30 percent of the nation’s energy consumption.52 Modifying both residential and commercial building design provides many opportunities to save energy and reduce greenhouse gas emissions.
• A recent California study found that improved solar orientation, passive solar heating and cooling, and the development of narrower streets, could achieve energy reductions 20 percent above state suggested requirements. 53
• 40 billion pounds of CO2 would be prevented from entering the atmosphere each year if only 10 percent of the country’s homes met the government’s Energy Star
SPRAWLING TOWARDS CLIMATE CHANGE - ICLEI Local Governments for Sustainability Fall 2004
15
efficiency standards (this achieves nearly a 30 percent reduction in energy use, which is the equivalent of removing 3.5 million cars from the road).54
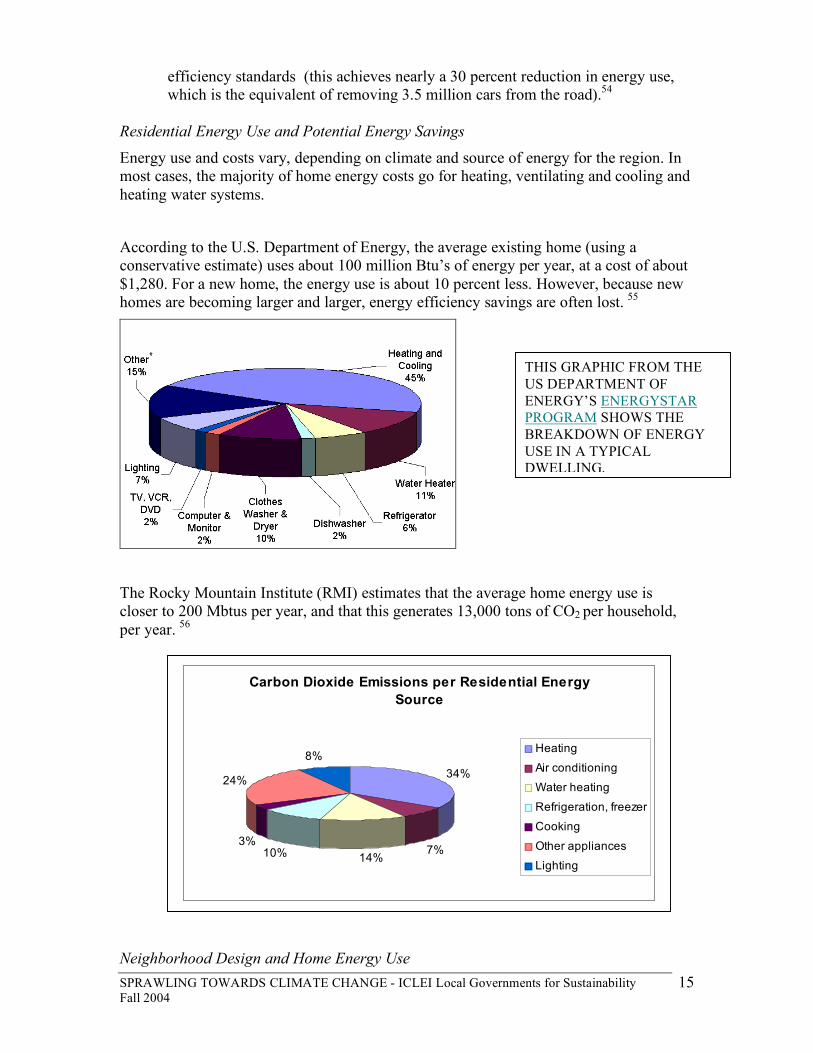
Residential Energy Use and Potential Energy Savings Energy use and costs vary, depending on climate and source of energy for the region. In most cases, the majority of home energy costs go for heating, ventilating and cooling and heating water systems.
According to the U.S. Department of Energy, the average existing home (using a conservative estimate) uses about 100 million Btu’s of energy per year, at a cost of about $1,280. For a new home, the energy use is about 10 percent less. However, because new homes are becoming larger and larger, energy efficiency savings are often lost. 55
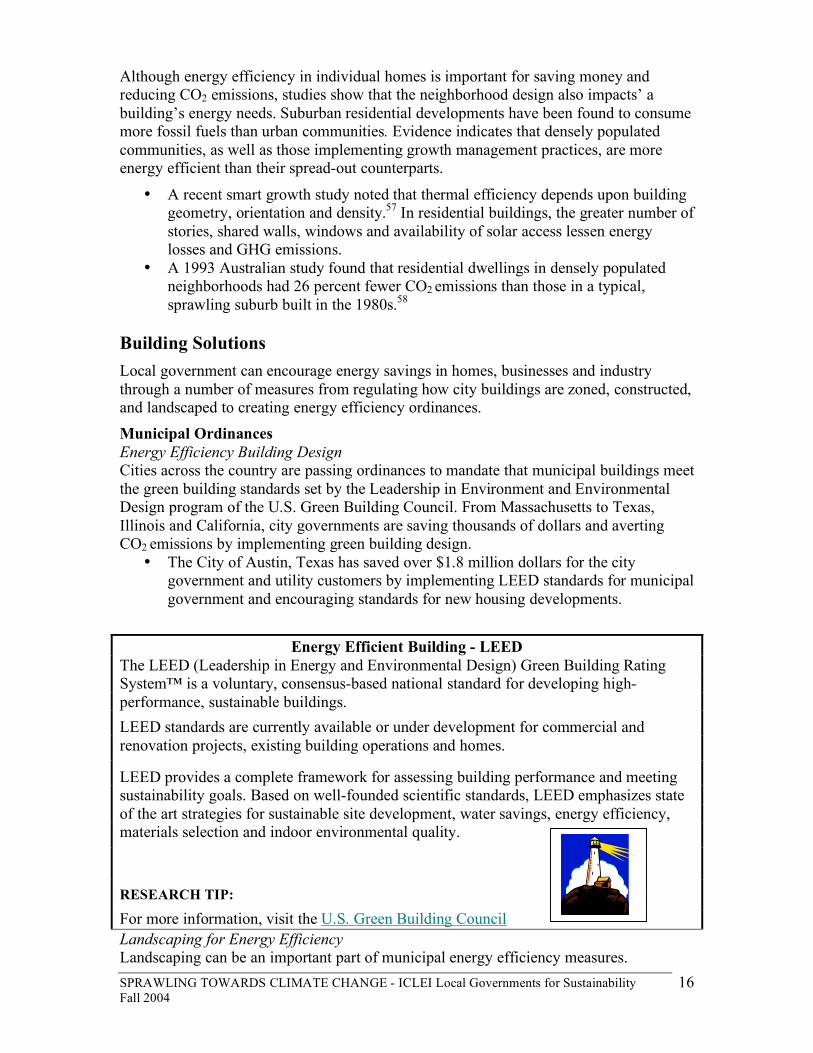
The Rocky Mountain Institute (RMI) estimates that the average home energy use is closer to 200 Mbtus per year, and that this generates 13,000 tons of CO2 per household, per year. 56
Neighborhood Design and Home Energy Use
THIS GRAPHIC FROM THE US DEPARTMENT OF ENERGY’S ENERGYSTAR PROGRAM SHOWS THE BREAKDOWN OF ENERGY USE IN A TYPICAL DWELLING.
Carbon Dioxide Emissions per Residential Energy
Source
34%
7%14%10%
3%
24%
8%Heating
Air conditioning
Water heating
Refrigeration, freezer
Cooking
Other appliances
Lighting
SPRAWLING TOWARDS CLIMATE CHANGE - ICLEI Local Governments for Sustainability Fall 2004
16
Although energy efficiency in individual homes is important for saving money and reducing CO2 emissions, studies show that the neighborhood design also impacts’ a building’s energy needs. Suburban residential developments have been found to consume more fossil fuels than urban communities. Evidence indicates that densely populated communities, as well as those implementing growth management practices, are more energy efficient than their spread-out counterparts.
• A recent smart growth study noted that thermal efficiency depends upon building geometry, orientation and density.57 In residential buildings, the greater number of stories, shared walls, windows and availability of solar access lessen energy losses and GHG emissions.
• A 1993 Australian study found that residential dwellings in densely populated neighborhoods had 26 percent fewer CO2 emissions than those in a typical, sprawling suburb built in the 1980s.58
Building Solutions Local government can encourage energy savings in homes, businesses and industry through a number of measures from regulating how city buildings are zoned, constructed, and landscaped to creating energy efficiency ordinances. Municipal Ordinances Energy Efficiency Building Design Cities across the country are passing ordinances to mandate that municipal buildings meet the green building standards set by the Leadership in Environment and Environmental Design program of the U.S. Green Building Council. From Massachusetts to Texas, Illinois and California, city governments are saving thousands of dollars and averting CO2 emissions by implementing green building design.
• The City of Austin, Texas has saved over $1.8 million dollars for the city government and utility customers by implementing LEED standards for municipal government and encouraging standards for new housing developments.
Energy Efficient Building - LEED
The LEED (Leadership in Energy and Environmental Design) Green Building Rating System™ is a voluntary, consensus-based national standard for developing high-performance, sustainable buildings. LEED standards are currently available or under development for commercial and renovation projects, existing building operations and homes.
LEED provides a complete framework for assessing building performance and meeting sustainability goals. Based on well-founded scientific standards, LEED emphasizes state of the art strategies for sustainable site development, water savings, energy efficiency, materials selection and indoor environmental quality.
RESEARCH TIP:
For more information, visit the U.S. Green Building Council Landscaping for Energy Efficiency Landscaping can be an important part of municipal energy efficiency measures.
SPRAWLING TOWARDS CLIMATE CHANGE - ICLEI Local Governments for Sustainability Fall 2004
17
Green roofs. Surfacing the roofs of municipal buildings with greenery can not only reduce stormwater runoff, but also create large energy savings. The degree of savings depends on the type of roof and the climate. Warmer climates offer greater energy savings because green roofs reduce air conditioning costs more efficiently than they lower heating bills.59
• The City of Chicago found that installing a green roof on city hall lowered the temperature by 3 to 7 degrees Fahrenheit, which translated into a 10% reduction in air conditioning requirements. While the green roof were 90 degrees on the summer’s hottest days, neighboring roofs measured over 160 degrees Fahrenheit. 60
Parking Lot Shade-Tree Ordinances. Requiring shade trees to be planted in parking lots and along streets can greatly reduce the "heat island effect." This phenomenon where cities are 3-10 degrees (Fahrenheit) warmer than rural areas occurs when the natural landscape is covered with pavement, buildings, and other infrastructure.
• Urban greening, especially the planting of trees, cools city air and cuts down on the amount of fossil fuels needed to generate electricity, thereby reducing CO2 emissions. 61
• Research shows that tree coverage over parking lots have also improved local air quality by lowering the hydrocarbon emissions from vehicles that contribute to smog and global warming. 62
• Sacramento, CA has a parking lot tree shading ordinance that requires all new parking lots to include tree that are designed to result in 50 percent shading of parking lot surface areas within 15 years.63
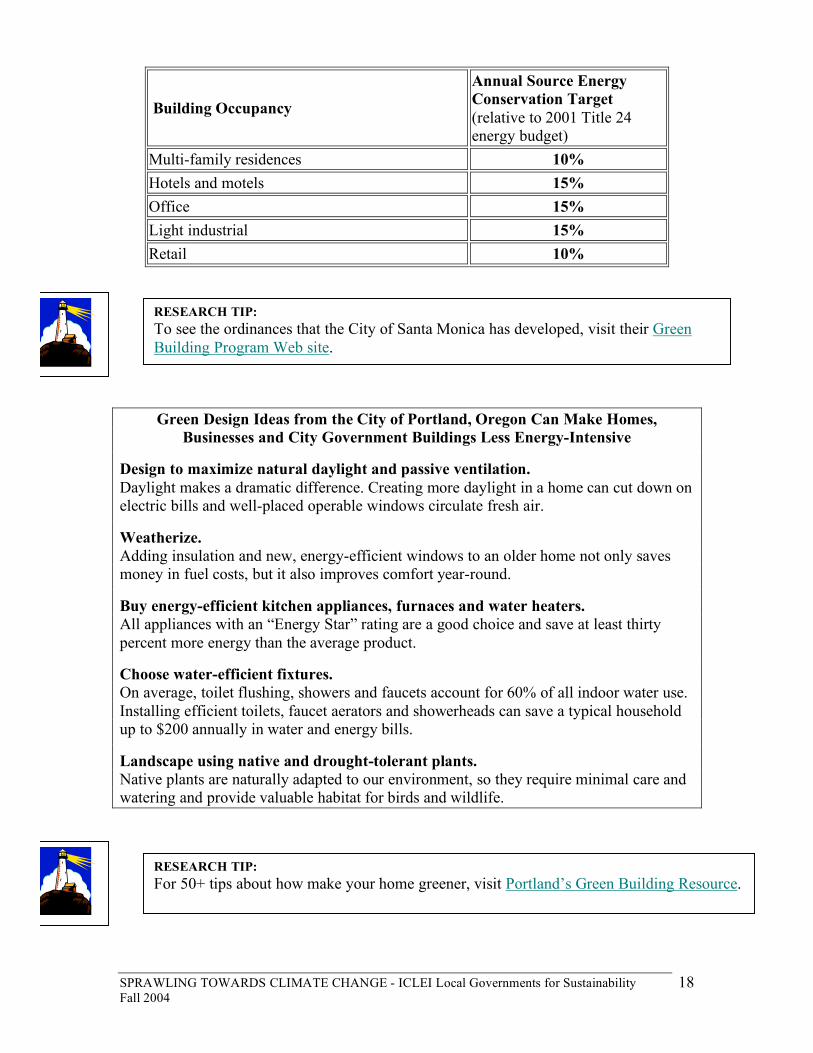
Energy Efficiency Codes Creating performance ordinances can also encourage greener community design. These municipal regulations can attain higher environmental standards than state or federal standards by requiring building projects to meet or exceed energy efficiency performance targets that can be met by a flexible set of methods.
The City of Santa Monica, CA has implemented a municipal code ordinance to implement further energy savings. The city requires lower annual energy consumption than California’s current standards.
The following are the reductions mandated by the city:64
RESEARCH TIP: To find out more about Green Roofs, visit Pennsylvania State University’s Green Roof Research Center.
SPRAWLING TOWARDS CLIMATE CHANGE - ICLEI Local Governments for Sustainability Fall 2004
18
Building Occupancy
Annual Source Energy Conservation Target (relative to 2001 Title 24 energy budget)
Multi-family residences 10% Hotels and motels 15% Office 15% Light industrial 15% Retail 10%
Green Design Ideas from the City of Portland, Oregon Can Make Homes, Businesses and City Government Buildings Less Energy-Intensive
Design to maximize natural daylight and passive ventilation. Daylight makes a dramatic difference. Creating more daylight in a home can cut down on electric bills and well-placed operable windows circulate fresh air.
Weatherize. Adding insulation and new, energy-efficient windows to an older home not only saves money in fuel costs, but it also improves comfort year-round.
Buy energy-efficient kitchen appliances, furnaces and water heaters. All appliances with an “Energy Star” rating are a good choice and save at least thirty percent more energy than the average product.
Choose water-efficient fixtures. On average, toilet flushing, showers and faucets account for 60% of all indoor water use. Installing efficient toilets, faucet aerators and showerheads can save a typical household up to $200 annually in water and energy bills.
Landscape using native and drought-tolerant plants. Native plants are naturally adapted to our environment, so they require minimal care and watering and provide valuable habitat for birds and wildlife.
-
RESEARCH TIP: To see the ordinances that the City of Santa Monica has developed, visit their Green Building Program Web site.
RESEARCH TIP: For 50+ tips about how make your home greener, visit Portland’s Green Building Resource.
SPRAWLING TOWARDS CLIMATE CHANGE - ICLEI Local Governments for Sustainability Fall 2004
19
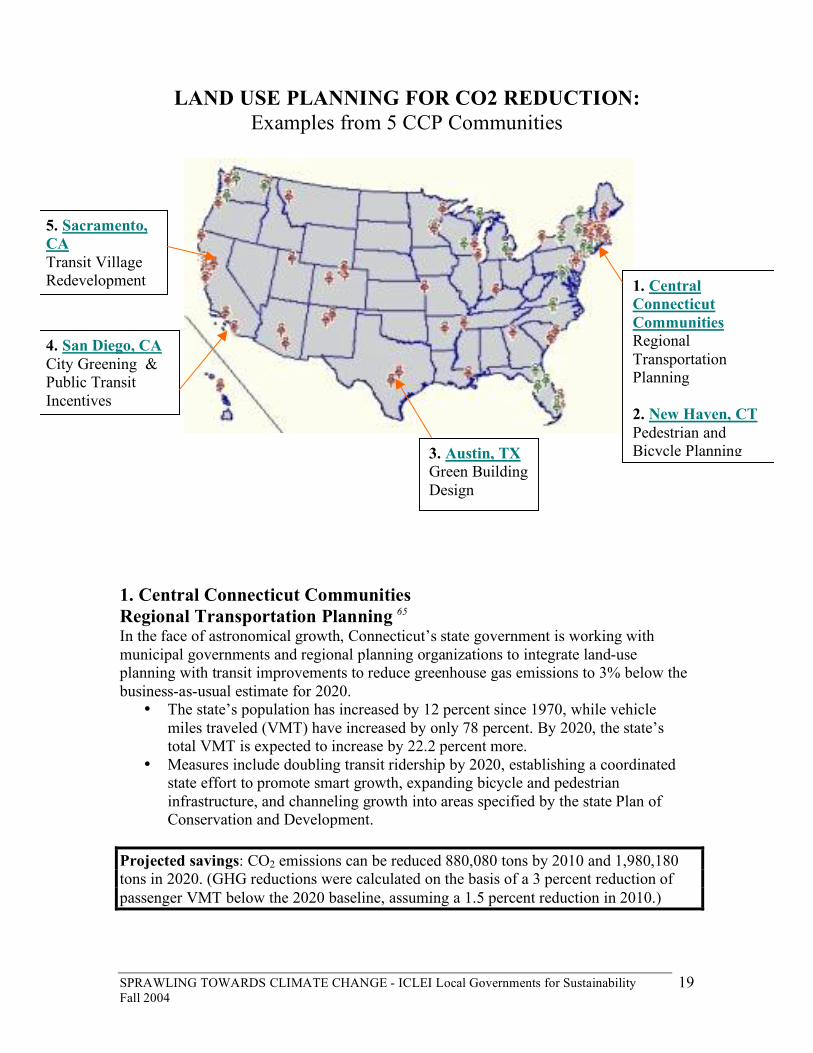
LAND USE PLANNING FOR CO2 REDUCTION:
Examples from 5 CCP Communities
1. Central Connecticut Communities Regional Transportation Planning 65 In the face of astronomical growth, Connecticut’s state government is working with municipal governments and regional planning organizations to integrate land-use planning with transit improvements to reduce greenhouse gas emissions to 3% below the business-as-usual estimate for 2020.
• The state’s population has increased by 12 percent since 1970, while vehicle miles traveled (VMT) have increased by only 78 percent. By 2020, the state’s total VMT is expected to increase by 22.2 percent more.
• Measures include doubling transit ridership by 2020, establishing a coordinated state effort to promote smart growth, expanding bicycle and pedestrian infrastructure, and channeling growth into areas specified by the state Plan of Conservation and Development.
Projected savings: CO2 emissions can be reduced 880,080 tons by 2010 and 1,980,180 tons in 2020. (GHG reductions were calculated on the basis of a 3 percent reduction of passenger VMT below the 2020 baseline, assuming a 1.5 percent reduction in 2010.)
3. Austin, TX Green Building Design
4. San Diego, CA City Greening & Public Transit Incentives
5. Sacramento, CA Transit Village Redevelopment 1. Central
Connecticut Communities Regional Transportation Planning 2. New Haven, CT Pedestrian and Bicycle Planning
SPRAWLING TOWARDS CLIMATE CHANGE - ICLEI Local Governments for Sustainability Fall 2004
20
2. New Haven, CT Pedestrian and Bicycle Planning 66 The city is developing a series of greenways and bicycle paths to meet a variety of transportation, economic, environmental, public health and safety needs. Alternative transportation better serves the existing population of pedestrian and bicycle commuters and will encourage more people to get to work on foot. Savings achieved: • The city’s current population of bicycle and pedestrian commuters is estimated to
avert the emission of 718 tons of CO2 yearly. • Local residents also avert an estimated 364 tons of CO2 emissions yearly by walking
and bicycling for non-work related activities. 3. Austin, TX Green Building Design Whether remodeling a home or building an office tower, Austin’s Green Building program helps community members, governments and businesses build more energy efficient, environmentally sound structures. 67
• Since 2000, the city council mandates that all new municipal buildings achieve a LEED silver rating. LEED accreditation ensures sustainable site development, water savings, energy efficiency and green materials selection.
• In 2003, 22 percent of new homes and four commercial projects totaling 145,000 sq ft. in the Austin Energy utility district were built in accordance with the program’s guidelines
Savings achieved: Overall, the program has reduced 9.15MW of peak load energy use. The total 21,600 megawatt-hour savings equals a $1.8 million savings for utility customers. In terms of pollution reduction, this means yearly reductions of: 68 CO2 = 18, 343 tons NOx = 31.3 tons SOx = 69 tons
4. San Diego, CA Public Transit Incentives By 2030, the population of the San Diego-Tijuana region is expected to double to 8 million. City officials’ concern about GHG emissions is part of larger efforts to ensure that growth does not outpace current infrastructure planning, financial capabilities and available land.
• The city’s Transportation Alternatives program encourages municipal government staff to take public transit, vanpool or carpool to work. The program reduces air pollution and traffic congestion and lightens parking demand by subsidizing up to 75 percent of an employees’ commute.
• 1,500 Employees commute via public transit, including buses and trolleys. 44 Employees commute via vanpool.
SPRAWLING TOWARDS CLIMATE CHANGE - ICLEI Local Governments for Sustainability Fall 2004
21
50 Employees commute via carpool.
Savings achieved: 1,357 tons of CO2 yearly. City Greening In 2003, American Forests reported that 27% of San Diego’s tree-cover had been lost in the previous seventeen years. Trees absorb and store atmospheric carbon, and when development replaces vegetation with impervious surfaces, such as roads and buildings, increasing volumes of greenhouse gases are released into the atmosphere.69
• The city’s trees sequester about 9,000 tons of CO2 per year and store a total of 1.2 million tons.
• The city’s trees remove 4.3 million pounds of pollutants, such as carbon monoxide and ozone, from the air each year, which amounts to a savings of $10.8 million dollars yearly.
Projected savings: The city’s Community Forest Initiative will plant 100,000 trees by the year 2020. These trees would absorb 33,333 tons of CO2 annually.70 5. Sacramento, CA Transit Village Redevelopment The City of Sacramento’s 65th Street/Transit Village redevelopment project provides a 20-25 year plan for mix use, transit-oriented development in East Sacramento. The goal of this project is to improve pedestrian and bicycle circulation, increase residents, shoppers and workers access to the city’s light rail system and strengthen this neighborhood’s connection to the nearby California State University, Sacramento. The proposed development was examined using the PLACE3S model, which estimates the transportation and energy needs of varying development scenarios.
• The project was examined using six different scenarios: Existing uses, existing zoning, trend, low-density mixed used development, transit-oriented development that focused on creating employment in the area, and transit-oriented development that focused on creating more residential housing in the area.
• The model estimated that the use of the light rail system would increase by 10 percent under the low density, mixed-use scenario and between 40 and 50 percent for the transit-oriented development scenarios.
Projected savings: The residentially focused, transit-oriented model predicted that households would drive 2,000 miles less per year compared to the existing zoning and existing use scenarios. This reduces each household’s emissions household by one ton of CO2 yearly. 71
SPRAWLING TOWARDS CLIMATE CHANGE - ICLEI Local Governments for Sustainability Fall 2004
22
RESOURCE GUIDE
• Municipal Friendly Tools • Smart Growth Information and
Organizations
• Transportation-related Organizations
• Green Building Info and
Organizations
• Online Publications
• Online Bibliographies
• Print Publications
Municipal-Friendly Tools PLACE3S <http://www.energy.ca.gov/places/ > Planning for Community, Energy and Environmental and Economic sustainability is an innovative planning method that fully integrates focused public participation, community development and design, and computer-assisted quantification tools (GIS) to help communities produce plans that retain dollars in the local economy, save energy, attract jobs and development, reduce pollution and traffic congestion and conserve open space. Equating Pollution Calculator < http://www.usctcgateway.net/tool/ > This online tool allows users to calculate greenhouse gas emission from a known quantity of kilowatt-hours or gallons of gasoline, or a given number of cars and trucks not driven for one year. Green Building Design Advisor < http://greenbuildings.santa-monica.org/GBDA.htm > Find out what are the recommended green building requirements for a variety of structures, both new and old. Green Building Checklist < http://www.ci.austin.tx.us/greenbuilder/checklist.htm > This checklist will help you make a more informed choice about your present or future home or office building. Interactive Introduction to New Urbanism (Flash required) <http://www.cnu.org/about/index.cfm?formAction=tour&CFID=7361547&CFTOKEN=6297945 > What is the New Urbanism movement? Find out with this visual introduction to this urban design movement. A Teacher’s Guide to Smart Growth <http://www.dnr.state.md.us/education/growfromhere/Home.htm >
SPRAWLING TOWARDS CLIMATE CHANGE - ICLEI Local Governments for Sustainability Fall 2004
23
Where do we grow from here? This basic guide to smart growth issues focuses on Maryland as a case study, but includes complete lesson plans that provide clear and concise introduction to the basic issues.
Smart Growth Organizations EPA Info for Public Officials and Global Warming <http://yosemite.epa.gov/oar/globalwarming.nsf/content/VisitorCenterPublicOfficials.html> Information for state and local officials interested in additional information about improving air quality, increasing energy efficiency, saving costs, and voluntary greenhouse gas reductions. The Funders’ Network for Smart Growth and Livable Communities <http://www.fundersnetwork.org > Since 1999 a grassroots support system for smart growth has formed, with backing from some of the country's most influential foundations -- Surdna, MacArthur, Irvine, Turner, Ford, Packard and others. Known as the Funders' Network for Smart Growth and Livable Communities, it now operates in every region of the country -- indeed it's performed a dozen regional assessments of smart growth goals, strengths and strategies, involving 31 states, some 500 leaders and 40 foundations. Sprawlwatch <http://www.sprawlwatch.org > Resource guide for books, reports, websites, and organizations. Sierra Club – Sprawl <http://www.sierraclub.com/sprawl/> The Challenge to the Sprawl Campaign works to fight poorly planned runaway development and promotes smart growth communities that increase transportation choices, reduce air and water pollution, and protect our natural places. Smart Growth America <www.smartgrowthamerica.com > A coalition of nearly 100 advocacy organizations that have a stake in how metropolitan expansion affects our environment, quality of life and economic sustainability. Smart Growth Online <www.smartgrowth.org > In 1996, the U.S. Environmental Protection Agency joined with several non-profit and government organizations to form the Smart Growth Network (SGN). The Network's partners include environmental groups, historic preservation organizations, professional organizations, developers, real estate interests; local and state government entities. Congress for New Urbanism <http://www.cnu.org/ >
SPRAWLING TOWARDS CLIMATE CHANGE - ICLEI Local Governments for Sustainability Fall 2004
24
New Urbanists aim to reform all aspects of real estate development. Their work affects regional and local plans. They are involved in new development, urban retrofits, and suburban infill. In all cases, New Urbanist neighborhoods are walkable, and contain a diverse range of housing and jobs. New Urbanists support regional planning for open space, appropriate architecture and planning, and the balanced development of jobs and housing. Online Smart Growth Glossaries Neighborhood Planning Glossary <http://www.ci.austin.tx.us/test/zoning/glossary.htm > Smart Growth Glossary <http://www.smartgrowthgateway.org/glossary.shtml> Transportation-related Organizations Surface Transportation Policy Project <http://www.transact.org > The Surface Transportation Policy Project is a diverse, nationwide coalition working to ensure safer communities and smarter transportation choices that enhance the economy, improve public health, promote social equity, and protect the environment. Texas Transportation Institute <http://tti.tamu.edu/> TTI is an official research agency for the Texas Department of Transportation and the Texas Railroad Commission. TTI works closely with many state and federal agencies as well as the private sector to improve the safety and efficiency of the transportation system. Bureau of Transportation Statistics <http://www.bts.gov/ > The Bureau of Transportation Statistics collects data, analyze and report on transportation-monitoring resources. Center for Transportation Research http://www-cta.ornl.gov/data/Index.html The Oak Ridge National Laboratory (ORNL) prepares a Transportation Energy Conservation Data Book to be used by TEC staff in their evaluation of current and proposed conservation strategies. The major purposes of the data book are to draw together, under one cover, transportation data from diverse sources, to resolve data conflicts and inconsistencies, and to produce a comprehensive document. Green Building Information and Organizations Manage It Green, Green Building Program, Austin Texas < http://www.ci.austin.tx.us/greenbuilder/mig_4.htm >
SPRAWLING TOWARDS CLIMATE CHANGE - ICLEI Local Governments for Sustainability Fall 2004
25
Manage it Green is a comprehensive package of products created specifically for utilities and government agencies. It helps establish strategic programs that reduce energy consumption in new and remodeled homes and commercial structures. Green-Rated: Portland’s Green Building Resource < http://www.green-rated.org/default.asp > This site is the portal to the city of Portland’s comprehensive guide to green building including resources for residential and commercial development. < http://www.green-rated.org/take_action.asp?md=residential > “Take Action” is a collection of 50+ actions and strategies designed to inform homeowners on the various steps and processes of building green. Green Affordable Housing Coalition <http://www.greenaffordablehousing.org/ > The Green Affordable Housing Coalition is a coalition of San Francisco Bay Area public-sector and private-sector professionals committed to incorporating green building practices into the design, construction, operation, and maintenance of affordable housing. LEED – Leadership in Energy and Environmental Design Green Building Rating System <http://www.usgbc.org/leed/leed_main.asp > The LEED (Leadership in Energy and Environmental Design) Green Building Rating System® is a voluntary, consensus-based national standard for developing high-performance, sustainable buildings. Members of the U.S. Green Building Council representing all segments of the building industry developed LEED and continue to contribute to its evolution U.S. Green Building Council <http://www.usgbc.org/AboutUs/mission_facts.asp > The U.S. Green Building Council is the nation’s foremost coalition of leaders from across the building industry working to promote buildings that are environmentally responsible, profitable and healthy places to live and work. Online Bibliographies Smart Growth Reports and On-line Resources <http://www-rcf.usc.edu/~vasishth/Smart_Growth_Reports-biblio.htm > Smart Growth Online Bibliography <http://www-rcf.usc.edu/~vasishth/Smart_Growth+Sprawl-biblio.htm > Online Publications Center for Neighborhood Technologies. 2000. Location-Efficient Mortgage Project. <http://www.cnt.org> Ewing, Reid & Rolf Pendall & Don Chen. 2002. Measuring Sprawl and Its Impact. Smart Growth America. <http://www.smartgrowthamerica.org/sprawlindex/sprawlreport.html>
SPRAWLING TOWARDS CLIMATE CHANGE - ICLEI Local Governments for Sustainability Fall 2004
26
Friedman, Naomi. “Energy and Smart Growth: It’s about how and where we build.” Funders’ Network for Smart Growth and Livable Communities. June 2004. <http://www.fundersnetwork.org/usr_doc/Energy_and_Smart_Growth.pdf > Heart, Bennet & Biringer, Jennifer. 2000. The Smart Growth – Climate Change Connection. Conservation Law Foundation <http://www.clf.org/pubs/Smart_Growth_Climate_Change_Connection.html> Holtzclaw, John. 2000. “Smart Growth As Seen From the Air, Convenient Neighborhood, Skip the Car.” Paper presented at the Air and Waste Management Associations 93 rd annual meeting and exhibition (June), Salt Lake City. This publication can be found at < http://www.sierraclub.org/sprawl/transportation/holtzclaw-awma.pdf > Holtzclaw, John. 1994. Using Residential Patterns and Transit To Decrease Auto Dependence and Costs. Natural Resources Defense Council, San Francisco, and California Home Energy Efficiency Rating Systems, Costa Mesa, California, 1994. International City/County Management Association. DATE? Why Smart Growth: A Primer. Washington, DC: ICMA; Smart Growth America. <http://www.epa.gov/livability/pdf/WhySmartGrowth_bk.pdf > McCann, Barbara & Reid Ewing. 2003. Measuring the Health Effects of Sprawl: A National Analysis of Physical Activity, Obesity and Chronic Disease. Washington, DC: Smart Growth America; Surface Transportation Policy Project. < http://www.smartgrowth.umd.edu/pdf/HealthSprawl8.03.pdf > National Governors Association. 2002. Growing With Less Greenhouse Gases: State Growth Management Policies That Reduce GHG Emissions. Washington, DC: Center for Best Practices, national Governors Association. < http://www.nga.org/cda/files/112002GHG.pdf > NALGEP and Smart Growth Leadership Council. 2004. Smart Growth is Smart Business. Washington, D.C. < http://www.sgli.org/SGisSBfinal.pdf > Sierra Club. 2000. Sprawl Cost Us All: How Your Taxes Fuel Suburban Growth. San Francisco: Sierra Club. < http://www.sierraclub.org/sprawl/report00/ > Smart Growth Network. 2003. Getting to Smart Growth II: 100 More Policies for Implementation. International City/County Management Association (ICMA) and the Smart Growth Network. < http://www.smartgrowth.org/pdf/gettosg2.pdf >.
SPRAWLING TOWARDS CLIMATE CHANGE - ICLEI Local Governments for Sustainability Fall 2004
27
Print Publications Benfield, F. K., Matthew D. Raimi, Donald D.T. Chen. 1999. Once There Were Greenfields. Natural Resources Defense Council & Surface Transportation Policy Project. Duany, Andres & Elizabeth Plater-Zyberk & Jeff Speck. 2000. Suburban Nation: The Rise of Sprawl and the Decline of the American Dream. New York: North Point Press. Gillham, Oliver. 2002. The Limitless City: A Primer On The Urban Sprawl Debate. Washington, DC: Island Press Danielsen, K.A. & R.E. Lang & W. Fulton. 1999. "Retracting suburbia: Smart Growth and the Future of Housing," Housing Policy Debate, 10, 513-540. Katz, Bruce (ed.). 2000. Reflections On Regionalism. Washington, D.C.: Brookings Institution Press Studies in Chicago, Los Angeles and San Francisco", National Research Council. 2000. Transportation Land Use and Smart Growth. Washington, D.C.: National Academy Press. Neal, Peter (ed.). 2003. Urban Villages and the Making of Communities. London; New York: Spon Press. Newman and Kenworthy. 1999. Sustainability and Cities: Overcoming Automobile Dependence. Island Press, Washington, D.C., p. 100. Orfield, Myron. 2002. American Metropolitics: The New Suburban Reality. Washington, D.C.: Brookings Institution Press
SPRAWLING TOWARDS CLIMATE CHANGE - ICLEI Local Governments for Sustainability Fall 2004
28
GLOSSARY Content in the glossary has been adapted from various sources, which are attributed at the end of each definition. Brownfield: “A piece of property, where the expansion, redevelopment, or reuse of which may be complicated by the presence or potential presence of a hazardous substance, pollutant, or contaminant.” From: http://www.epa.gov/brownfields/glossary.htm Cluster Development: “A pattern of development in which industrial and commercial facilities, and homes are grouped together on parcels of land in order to leave parts of the land undeveloped. Cluster development is often used in areas that require large lot sizes, and typically involves density transfer. Zoning ordinances permit cluster development by allowing smaller lot sizes when part of the land is left as open space.” From: http://www.smartgrowthgateway.org/glossary.shtml Compact Building Design: “The act of constructing buildings vertically rather than horizontally, and configuring them on a block or neighborhood scale that makes efficient use of land and resources, and is consistent with neighborhood character and scale. Compact building design reduces the footprint of new construction, thus preserving greenspace to absorb and filter rain water, reduce flooding and stormwater drainage needs, and lower the amount of pollution washing into our streams, rivers and lakes. Compact building design is necessary to sustain transit ridership at levels necessary to make public transit a viable transportation option.” From: http://www.smartgrowthgateway.org/glossary.shtml Conservation Easements: “Voluntary, legally binding agreements for landowners that limit parcels of land or pieces of property to certain uses. Land under conservation easements remains privately owned, and most easements are permanent.” From: http://www.smartgrowthgateway.org/glossary.shtml Greenfield: “Land on which no urban development has previously taken place; usually understood to be on the periphery, of an existing built-up area.” From: http://glossary.eea.eu.int/EEAGlossary/G/greenfield_site Green Design: “An architectural design that conforms to environmentally sound principles of building, material and energy use. A green building, for example, might make use of solar panels, skylights, and recycled building materials.” From: www.nrdc.org/reference/glossary/g.asp Green Building: “Refers to a new way of designing and constructing buildings to increase performance and enhance the health and experience for people who work, live and play in these structures.”
A green building:
SPRAWLING TOWARDS CLIMATE CHANGE - ICLEI Local Governments for Sustainability Fall 2004
29
o Saves energy and water o Reduces material use o Protects the site o Uses low-impact materials o Maximizes longevity and durability o Minimizes waste o Makes the building healthier o Recycles existing buildings
From: http://www.green-rated.org/basics.asp?md=residential&vu=2 Greenhouse Gases: Are gases responsible for making our atmosphere warm enough for human habitation. Water vapor, carbon dioxide, methane and ozone are all naturally occurring greenhouse gases, but human activities further add to these levels in the atmosphere. Fossil fuel combustion from power plants, vehicle transportation and industrial facilities are the major sources of greenhouse gas emissions. From: http://www.iclei.org/SB1.HTM Impact Fees: “Costs imposed on new development to fund public facility improvements required by new development and ease fiscal burdens on localities.” http://www.smartgrowthgateway.org/glossary.shtml Incentive Zoning: This zoning “provides for give and take compromise on zoning restrictions, allowing for more flexibility to provide environmental protection. Incentive zoning allows a developer to exceed a zoning ordinance's limitations if the developer agrees to fulfill conditions specified in the ordinance. The developer may be allowed to exceed height limits by a specified amount in exchange for providing open spaces or plazas adjacent to the building.” From: http://www.smartgrowthgateway.org/glossary.shtml Infill Development: “Is development on vacant or underused sites in a developed area.” www.brownfieldscenter.org/big/glossary.shtml Land Use Planning: “Local development of a plan for the future use of land within its jurisdiction, established by zoning laws.” From: www.tenantlawcenter.com/terms/l.htm “This activity is generally conducted by a local government, which provides public and private land use recommendations consistent with community policies. It is generally used to guide decisions on zoning.” From: www.virtuallytoronto.on.ca/l1.html Location Efficiency: “Measures the transportation savings made when people choose to live in neighborhoods that employ smart growth principles. The savings are calculated based on a community's population size and the availability of public transit services.” From: www.locationefficiency.com/faq
SPRAWLING TOWARDS CLIMATE CHANGE - ICLEI Local Governments for Sustainability Fall 2004
30
Location Efficient Mortgage: “A lending program that allows homebuyers to borrow more money based on the transportation cost savings of living near mass transit.” From: http://www.smartgrowthgateway.org/glossary.shtml Mixed Use Development: “Development that is created in response to patterns of separate uses that are typical in suburban areas necessitating reliance on cars. Mixed use developments include residential, commercial, and business accommodations in one area.” From: http://www.smartgrowthgateway.org/glossary.shtml Open Space: The “portion of a site which is permanently set aside for public or private use and will not be developed. The space may be used for passive or active recreation, or may be reserved to protect or buffer natural areas.” From: www.epa.gov/watertrain/protection/glossary.html Planned Unit Development (PUD): “PUDs are areas that are planned and developed as one entity, by a single group. Planned unit developments usually include a variety of uses, including different housing types of varying densities, open space, and commercial uses. Project planning and density is calculated for the entire development rather than individual lots.” From: http://www.smartgrowthgateway.org/glossary.shtml Smart Growth: “A planning concept that pairs sound land development with economic growth and resource conservation. Smart growth provides well-planned development that channels growth into existing areas, provides a range of public-transportation and housing options while also preserving farmland and open space.” From: http://www.sierraclub.org/sprawl/report00 Sprawl: “A haphazard and disorderly form of urban development. There are several elements that characterize sprawl: Residences far removed from stores, parks, and other activity centers Scattered or “leapfrog” development that leaves large tracts of undeveloped land between developments Commercial strip development along major streets Large expanses of low-density or single use development such as commercial centers with no office or residential uses, or residential areas with no nearby commercial centers Major form of transportation is the automobile Uninterrupted and contiguous low- to medium-density (one to six du/ac) urban development Walled residential subdivisions that do not connect to adjacent residential development.” From: www.ci.austin.tx.us/test/zoning/glossary.htm Traditional Neighborhood Design (TND): “Refers to a development pattern that reflects the characteristics of small, older communities of the late 19th and early 20th centuries. The focus of the community shifts from the automobile to the pedestrian. Traditional communities are characterized by mixed land uses, grid street patterns, pedestrian circulation, intensively used open spaces, architectural character, and a sense of community.” From: http://www.dnr.state.md.us/education/growfromhere/GLOSSARY.HTM
SPRAWLING TOWARDS CLIMATE CHANGE - ICLEI Local Governments for Sustainability Fall 2004
31
Transfer of Development Rights: A system that assigns development rights to parcels of land and gives landowners the option of using those rights to develop or to sell their land. TDRs are used to promote conservation and protection of land by giving landowners the right to transfer the development rights of one parcel to another parcel. By selling development rights, a landowner gives up the right to develop his/her property, but the buyer could use the rights to develop another piece of land at a greater intensity than would otherwise be permitted. http://www.smartgrowthgateway.org/glossary.shtml Transit Oriented Development (TOD): “A pedestrian friendly development focused around a major transit access point. Elements usually include compact, mixed use development, and facilities and design that enhance the environment for pedestrians.” From: www.envisionutah.org/glossary.htm Vehicle Miles Traveled (VMT): “An average number that describes the total number of miles traveled in an automobile per individual for a particular area. An increase in VMT’s within urbanized areas generally indicates more traffic and worsening of air quality.” From: www.envisionutah.org/glossary.htm .
SPRAWLING TOWARDS CLIMATE CHANGE - ICLEI Local Governments for Sustainability Fall 2004
32
ENDNOTES
1 Friedman, Naomi. 2004. Energy and Smart Growth: It’s about how and where we build. Funders’ Network for Smart Growth and Livable Communities. < http://www.fundersnetwork.org/info-url_nocat2778/info-url_nocat_show.htm?doc_id=229179 > 2 CLF, E&SG, Sierra Club, Measuring Sprawl and it’s impact 3 Sierra Club. Stop Sprawl: Sprawl overview. Retrieved from: http://www.sierraclub.com/sprawl/overview/, August 2004. 4 Ibid 5 Lucy, William H. & Phillips, David. I 2001. Suburbs and the Census: Patterns of Growth and Decline. Brookings Institution, Center on Urban and Metropolitan Policy. < http://www.brookings.org/metro/projects/census/lucyexsum.htm> 6 Natural Resources Conservation Service. 1997. National Resources Inventory. Percent Change in Developed Land Area, 1982 – 1997. Retrieved from: http://www.nrcs.usda.gov/technical/land/meta/m5008.html, August 2004. 7 USDA Economic Research Service. 2002. Briefing Room – Land Use, Value and Management: Urbanization and Agriculture. Retrieved from: http://www.ers.usda.gov/Briefing/LandUse/urbanchapter.htm, September 2004. 8 National Association of Homebuilders. 2004. Housing Facts, Figures and Trends. <http://www.nahb.org/fileUpload_details.aspx?contentTypeID=7&contentID=20> 9 Sierra Club. 2000. Sprawl Costs Us All. < http://www.sierraclub.org/sprawl/report00/sprawl.pdf> 10 Ewing , Reid, Rolf Pendall, and Don Chen. 2002. Measuring Sprawl and Its Impact. < http://www.smartgrowthamerica.com/sprawlindex/MeasuringSprawl.PDF > 11 Smart Growth Online. Sustainable Communities Network. Retrieved from: http://www.smartgrowth.org/about/principles/default.asp, July 2004. 12 Congress for New Urbanism. FAQs. Retrieved from: http://www.cnu.org/about/index.cfm, July 2004. 13 Ibid 14 Friedman, Naomi. 2004. Energy and Smart Growth: It’s about how and where we build. Funders’ Network for Smart Growth and Livable Communities. < http://www.fundersnetwork.org/info-url_nocat2778/info-url_nocat_show.htm?doc_id=229179 > 15 Ibid 16 Ewing, Reid and McCann, Barbara. 2003. Measuring the Health Impacts of Sprawl. Smart Growth America & Surface Transportation Policy Project. < http://www.smartgrowthamerica.org/report/HealthSprawl8.03.pdf > 17 Ibid 18 Ibid 19 Frumkin, Howard. 2001. Urban Sprawl and Health. Public Health Reports. Vol. 117 < http://www.publichealthgrandrounds.unc.edu/urban/frumkin.pdf> 20 Ewing , Reid, Rolf Pendall, and Don Chen. 2002. Measuring Sprawl and Its Impact. < http://www.smartgrowthamerica.com/sprawlindex/MeasuringSprawl.PDF > 21 Ibid 22 Sierra Club. 2000. Sprawl Costs Us All. < http://www.sierraclub.org/sprawl/report00/sprawl.pdf> 23 Ibid 24 US EPA. Energy Star: Appliances. Retrieved from: http://www.energystar.gov/index.cfm?c=appliances.pr_appliances, August 2004. 25 US DOE. Office of Energy Efficiency and Renewable Energy: Insulation and Weatherization. Retrieved from: http://www.eere.energy.gov/consumerinfo/energy_savers/insulation.html, July 2004. 26 Friedman, Naomi. 2004. Energy and Smart Growth: It’s about how and where we build. Funders’ Network for Smart Growth and Livable Communities. < http://www.fundersnetwork.org/info-url_nocat2778/info-url_nocat_show.htm?doc_id=229179 > 27 Ibid 28 Daley, Richard. 2003. Transit Investment Pays for Itself. U.S. Conference of Mayors. Retrieved from: http://www.usmayors.org/uscm/us_mayor_newspaper/documents/05_12_03/transit.asp, October 2004. 29 Texas Transit Institute. Transit Facts. Retrieved from, http://www.texastransit.org/resources/transitFacts.html, October, 2004. 30 Shrank, David and Tim Lomax. 2003. News Release: New congestion study shows remedies working, but traffic jams still growing. Texas Transportation Institute. Retrieved from: http://tti.tamu.edu/media/releases/2003/mobility.stm, October 2004. 31 Shrank, David and Tim Lomax. 2004. The 2004 Urban Mobility Report. Texas Transportation Institute. < http://tti.tamu.edu/documents/mobility_report_2004.pdf > 32 Ibid 33 Ibid
SPRAWLING TOWARDS CLIMATE CHANGE - ICLEI Local Governments for Sustainability Fall 2004
33
34 US EPA. Mobile Source Emissions: Past, present and future. Retrieved from: http://www.epa.gov/otaq/invntory/overview/pollutants/index.htm, August, 2004. 35 Winkelman, Steven. 2003. State and Local Leadership on Climate Change. Center for Clean Air Policy. < http://www.ccap.org/pdf/2003-Jan-state_transport_climate.pdf > 36 Ibid 37 Bureau of Transportation Statistics. 2003. Transportation Statistics Annual Report: Chapter 2, Transportation Indicators. Retrieved from: http://www.bts.gov/publications/transportation_statistics_annual_report/2003/html/chapter_02/index.html, July 2004. 38 Ibid 39 Energy Information Agency. 2003. Annual Energy Outlook. Retrieved from: http://www.eia.doe.gov/emeu/aer/pdf/pages/sec2_2.pdf, August, 2004. 40 Bureau of Transportation Statistics. 2003. Transportation Statistics Annual Report: Chapter 2, Transportation Indicators. Retrieved from: http://www.bts.gov/publications/transportation_statistics_annual_report/2003/html/chapter_02/index.html, July 2004. 41Robert Wood Johnson Foundation – UNC School of Public Health. Active Living By Design. Retrieved from: http://www.activelivingbydesign.org/index.php?id=219 42 Surface Transportation Policy Project. Transportation and Climate Change. Retrieved from: http://www.transact.org/library/factsheets/climate.asp, August 2004. 43Bureau of Transportation Statistics. 2003. Transportation Statistics Annual Report: Chapter 2, Transportation Indicators. Retrieved from: http://www.bts.gov/publications/transportation_statistics_annual_report/2003/html/chapter_02/figure_028.html, July 2004. 44 Heart, Bennet & Biringer, Jennifer. 2000. The Smart Growth – Climate Change Connection. Conservation Law Foundation. Boston, MA. < http://www.clf.org/general/index.asp?id=355 > 45 Ibid 46 Frank, L.D.and G. Pivo. 1994. Relationship Between Land Use and Travel Behavior in the Puget Sound Region. Washington Department of Transportation. Seattle. 47 Ibid 48 Safe Routes to School. Why Safe Routes Are Important. Retrieved from: http://www.saferoutestoschools.org/about.html#Why, September 2004. 49 Brendenberg, Jeff. Designing Activity in Our Daily Lives. Robert Wood Johnson Foundation. Retrieved from: www.rwjf.org/news/special/design.jhtml, October 2004. 50 www.locationefficiency.com 51 Murray et al. 2004. Estimating Leakage From Carbon Sequestration Programs. Land Economics. 80 (1): 109-124. 52 Friedman, Naomi. 2004. Energy and Smart Growth: It’s about how and where we build. Funders’ Network for Smart Growth and Livable Communities. < http://www.fundersnetwork.org/info-url_nocat2778/info-url_nocat_show.htm?doc_id=229179 > 53 Ibid 54 Ibid 55 U.S. Department of Energy, Energy Star Program. “What Does My Energy Bill Pay For?” Retrieved from: http://www.EnergyStar.gov, December, 2004. 56 Rocky Mountain Institute. “Household Greenhouse Gas Emissions and Savings Measures.” Retrieved from: http://www.rmi.org/sitepages/pid341.php, December, 2004. 57 Friedman, Naomi. 2004. Energy and Smart Growth: It’s about how and where we build. Funders’ Network for Smart Growth and Livable Communities. < http://www.fundersnetwork.org/info-url_nocat2778/info-url_nocat_show.htm?doc_id=229179 > 58 ICLEI Local Governments for Sustainability. 1993 Case Study 32 - Connecting Land Use and Energy Victoria, Australia.Melbourne. 59 Handwerk, Brian. “Landscaped Roofs have Chicago Mayor Seeing Green” Retrieved from: http://news.nationalgeographic.com/news/2004/11/1115_041115_green_roofs.html#main, December, 2004. 60City of Chicago. “Green Roof Fact Sheet.” Retreived from: http://egov.cityofchicago.org/webportal/COCWebPortal/COC_ATTACH/Green_Roof_Fact_Sheet.pdf, December 2004. 61 US EPA. “Heat Island Effect.” Retrieved from; http://www.epa.gov/heatisland/about/index.html, December, 2004.
SPRAWLING TOWARDS CLIMATE CHANGE - ICLEI Local Governments for Sustainability Fall 2004
34
62 McPherson, et al. “Where Are All The Cool Parking Lots?” US Forest Service, PSW Research Station Center. Retrieved from: http://plone.urbanforestrysouth.org/Resources/Library/Citation.2004-05-27.5317/file_name/ , December 2004. 63 City of Sacramento, CA. “Tree Shading Guide. Retrieved from: http://www.cityofsacramento.org/planning/longrange/shading_guide.pdf, December, 2004. 64City of Santa Monica. “Green Building Program – Performance Ordinances.” Retrieved from: http://greenbuildings.santa-monica.org/introduction/introperformanceordinance.html, December, 2004. 65 Connecticut Climate Change Stakeholders Dialogue. 2004. Recommendations to the Governor's Steering Committee. Chapter 3.1: Transportation and Land Use. <http://www.ctclimatechange.com/pdf/03_1_Transportation.pdf > 66 New Haven City Plan Department. 2004. Plan for Greenways and Cycling Systems. Retreived from: http://www.cityofnewhaven.com/govt/greenways/Index.htm, August 2004. 67 City of Austin Green Building Program. 2004. Green Building by the Numbers, January Newsletter. Retreived from: http://www.ci.austin.tx.us/greenbuilder/nl_04jan_newsletter.htm, August 2004. 68 Ibid 69 American Forests. 2003. Urban Ecosystem Analysis, San Diego, California: Calculating the Value of Nature. <http://www.americanforests.org/downloads/rea/AF_SanDiego.pdf > 70 Pratt, Linda. 2003. City of San Diego Climate Action Plan. 70 American Forests. 2003. Urban Ecosystem Analysis, San Diego, California: Calculating the Value of Nature. <http://www.americanforests.org/downloads/rea/AF_SanDiego.pdf > 71 MacDonald, Jim. 2004. City of Sacramento Long Range Planning Department. (Slide from personal presentation). ACKNOWLEDGMENTS I would like to thank the support of the Edna Bailey Sussman Fund and the Hixon Center for Urban Ecology. As an organization, ICLEI Local Governments for Sustainability provided an incredibly supportive atmosphere for me to conduct my research, and Ryan Bell and Abby Young have been excellent guides through this process. This document would not be possible with out the help of Melissa Royael Capria, who provided outstanding assistance and support – and from whom I have learned so much.