Embed Size (px)
Citation preview
To: Gulf Coast Workforce Board Members
From: Mike Temple
Carol Kimmick
David Baggerly
Michelle Ramirez
Date: June 1, 2016
Subj: Board Meeting Materials for Tuesday, June 7, 2016
The next meeting of the Gulf Coast Workforce Board is scheduled for 10:00 a.m.,
Tuesday, June 7, 2016 in H-GAC’s second floor conference rooms A, B and C,
3555 Timmons Lane, Houston.
We again have a short agenda, and there are no action items coming to the Board this
month.
Reports. Chair Guthrie will provide his update to members on items of interest.
Audit/Monitoring Committee Chair Joe Garcia will report on the committee’s May
meeting, held at the Cypress Station career office. We want to thank all the Board
members who led and participated in the five Report Card community events throughout
May. We have a summary of the common themes that emerged from these community
conversations.
Information. We will report on our performance and expenditures to-date. We’ll also
provide information on several items, including upcoming committee meetings, our
expectations for 2017 revenues, and expanding our service for workers dislocated from
the energy industry.
Ron Borski will discuss the latest employment numbers, and Parker Harvey will provide
information about older workers.
We look forward to seeing you on June 7th. As always, please call or email us if you
have questions, or if we can be of assistance.
MINUTES OF
THE GULF COAST WORKFORCE BOARD
TUESDAY, APRIL 5, 2016
_________________________________________________________________
MEMBERS PRESENT:
Ray Aguilar Willie Alexander Gerald Andrews
Betty Baitland Peter Beard Sara Bouse
Carl Bowles Joe Garcia Cheryl Guido
Mark Guthrie Bobbie Henderson Alan Heskamp
Eduardo Honold Guy Robert Jackson David Joost
Birgit Kamps Doug Karr Paulette King
Jeff Labroski Steve Mechler Jerry Nevlud
Linda O’Black Dale Pillow Allene Schmitt
Richard Shaw Connie Smith Gil Staley
Evelyn Timmins Shunta Williams Sarah Wrobleski
H-GAC STAFF MEMBERS PRESENT
Mike Temple
David Baggerly
Ron Borski
Mr. Mark Guthrie, Chairman, called the meeting to order at approximately 10:00 a.m., on
Tuesday, April 5, 2016, in the 2nd floor, H-GAC Conference Rooms A/B/C, at 3555
Timmons Lane, Houston, Texas. Chair Guthrie determined a quorum was present.
ADOPTION OF AGENDA
Chair Guthrie asked for adoption of the agenda as presented. A motion was made and
seconded to adopt the agenda. The motion carried and the agenda was adopted as
presented.
PUBLIC COMMENT
No one signed up for public comment.
MINUTES FROM FEBRUARY 2, 2016 MEETING
Chair Guthrie asked if there were any additions or corrections to minutes for the
February 2, 2016 Board meeting and if not, for approval of the minutes as presented. A
motion was made and seconded to approve the minutes as presented. The motion carried.
Gulf Coast Workforce Board Minutes
April 5, 2016
Page 2 of 12
DECLARE CONFLICTS OF INTEREST
Chair Guthrie asked for a declaration of any conflicts of interest with items on the agenda.
No one declared a conflict of interest. Chair Guthrie reminded the members that they
also were welcome to declare conflicts with items as they are considered.
CONSIDER REPORTS
Chair’s Report
Chair Guthrie reported that the past two months have been busy and that he and Mr.
Temple attended the National Association of Workforce Boards Annual Conference in
Washington, DC. Chair Guthrie noted that the opening keynote speaker was Mr. Vivek
Wadhwa who is a Stanford University Fellow and the Director of Research at the Center
for Entrepreneurship and Research Commercialization at the Pratt School of Engineering
at Duke University. Mr. Wadhwa had interesting comments regarding computers that Mr.
Guthrie shared. Moore’s law states that the power of computers doubles every two years.
In 1969 the Apolo mission on board had the computing capacity of a musical Hallmark
greeting card and by 2023 a $1000 computer will have the computing power of a human
brain. By 2050 a $1000 computer will have the computing power of all humans
combined. Mr. Wadhwa also spoke about robots – this year it became cheaper to
manufacture in the United States as opposed to China due to robots.
Chair Guthrie said that Mr. Christopher Lu, Deputy Secretary of the Department of Labor
spoke at the NAWB conference and said that the current administration would be taking
steps to double the amount of apprenticeships in the United States. Mr. Lu noted that for
every dollar spent on apprenticeship programs it returned $27 in benefits and that the
average graduate of an apprenticeship program earns $300,000 more over a career than
they would otherwise.
Chair Guthrie also noted that much of the NAWB conference was devoted to the
implementation of the new WIOA requirements.
Chair Guthrie reported that on March 21, 2016 there was a new member orientation
meeting and long standing Board member, Dr. Bobbie Henderson attended and
contributed much to the discussion. Mr. Guthrie stated that he was pleased the
orientation was well attended and the discussions were good.
He next reported that on March 23, 2016 he attended the Education Provider Forum –
sponsored by the Board’s Education Industry Group. Presenters at the event discussed
best practices in and the future of teacher education, and Parker Harvey presented an
updated report on the Education Industry.
Chair Guthrie explained that we have hosted two of the Report Card Roundtables –
Northline and Rosenberg. Both events were well attended by state representatives, local
Gulf Coast Workforce Board Minutes
April 5, 2016
Page 3 of 12
school districts and employers and many good ideas were discussed. He reported that at
the Northline Roundtable Dr. Sanborn, President of Children at Risk raised the idea to
ask TWC to provide subsidized early childhood education as opposed to subsidized
childcare. Chair Guthrie explained that he felt it was a good idea and he would like to
emphasize the early education component.
Chair Guthrie said that it is becoming clear to him from the Roundtable discussions that
having a formal structure for businesses to interact with school districts regarding
business needs and curriculum is vital. Other states, including Pennsylvania are now
requiring regional economic driver industries to formally interact with school districts on
their curriculum and to work with educators.
Chair Guthrie noted that the Board’s new outreach contractor, Outreach Strategies in his
opinion has been doing a good job with the Report Card roundtable events and that he
was very impressed with the quality of the support.
Chair Guthrie concluded his report and no action was taken.
Audit/Monitoring Committee Report
Chair Joe Garcia reported that the committee met on Tuesday, March 22, 2016 at 10:00
am at the Southwest Career Office. Representatives from Interfaith of The Woodlands
and Neighborhood Centers, Inc. addressed issues discussed at the committee’s January
meeting regarding the Financial Aid Call Center, the Southwest Career Office and the
Cypress Station Career Office.
Chair Garcia explained that he has received positive feedback from committee members
regarding holding the committee meetings at various career offices. Chair Garcia noted
that future committee meetings will be held at different career offices throughout our
region for 2016.
Chair Garcia reported on the following new business covered in the committee meeting:
Operations Reviews.
o Career Offices. The QA team reviewed five offices: Astrodome, Northline,
(operated by NCI), Humble, Westheimer, and Willowbrook (operated by
Interfaith). Astrodome and Westheimer earned above average ratings.
Northline, Humble and Willowbrook earned average ratings.
At Astrodome and Westheimer, the team noted the staff at these offices
were consistently providing good customer service at all levels; the
Greeters, the Resource Room Specialists, the Employment Counselors, the
Personal Service Representatives and the Manager and Supervisors. There
were two minor accessibility issues noted at Westheimer.
Gulf Coast Workforce Board Minutes
April 5, 2016
Page 4 of 12
The remaining offices: Northline, Humble and Willowbrook were
generally providing good customer service. But, the QA team identified
areas at each office where there were opportunities to improve the quality
of service.
At Northline the QA team recommended:
A greeter improves her communication with the customers entering
the office.
Resource Room Specialists do a better job balancing between
providing extensive personal assistance and being available to the
other customers in the Resource Room.
Reduce the number of times customers are assisted by staff and
then have to wait to be seen again on the same day.
At Humble the QA team did not find documentation of eligibility for a
customer where we provided support service.
At Willowbrook the QA team recommended staff improve greeting skills.
The QA team noted that all offices should increase their efforts at placing
customers in jobs listed by Workforce Solutions and improve support to
customers in training activities.
o Financial Aid Payment Office. From October 2015 through March 15, 2016,
the QA team checked on 604 child care providers out of a total of 1,511 active
vendors. The QA team followed-up on the one vendor with a service
improvement agreement imposed because the vendor was holding automated
attendance cards. The vendor passed our review.
State Monitoring
All issues identified on the 2014 state monitoring visit have been resolved and staff is
working with the state to resolve issues from the 2015 state monitoring visit.
The unresolved issues include:
Ensure Trade Adjustment Assistance waiver requirements are met. The state will
visit us in early April to provide additional training and to review customer
records for compliance.
Ensure customers meet eligibility requirements. Staff provided documentation
and additional information to resolve this issue.
Strengthen internal control of support service expenditures. We are planning to
change our current process of providing pre-paid vendor cards and cash cards to
Gulf Coast Workforce Board Minutes
April 5, 2016
Page 5 of 12
customers for authorized support services. We are working with our contractors
to test the new processes before implementing system wide.
Chair Garcia concluded his report and no action was taken.
Report Card Committee
Chair Richard Shaw stated that the Report Card Committee met on Wednesday, February
24, 2016 at the Houston-Galveston Area Council offices. Chair Shaw noted the
committee members in attendance – Co-Chair Linda O’Black, Board Chair Mark Guthrie,
Willie Alexander, Karlos Allen, Gerald Andrews, Betty Baitland, Sarah Janes and Allene
Schmitt. The Committee discussed and approved plans for sharing the 2015 Workforce
Report Card with the community.
Chair Shaw noted that in February 2016, the Gulf Coast Workforce Board approved
release of the 2015 Workforce Report Card. To emphasize the continued importance of
an educated and trained workforce, this Report Card features a special focus section on
education that discusses the full spectrum – from early education to post-secondary
training and beyond. The report also includes recommendations for improvement in the
regional education system as well as a full discussion of the regional comparison
indicators.
Chair Shaw explained that in order to engage key stakeholders in communities across the
region, the Gulf Coast Workforce Board will host a series of local roundtable discussions
designed to:
Deepen relationships in each of the communities we serve
Engage Workforce Board members in meaningful interactions with local leaders
Create opportunities for both stakeholders and the people we serve to better
understand key findings in the Report Card
Illustrate the vital role of Workforce Solutions in the regional economy.
Each roundtable will be a 90-minute session that includes discussion of key areas from
the Report Card, followed by potential media interviews with Workforce Board members,
invited speakers, and staff. The schedule is as follows:
Date Location Board Member
Participants
Thursday, March 31, 2016
10 – 11:30 am
Workforce Solutions –
Northline
Mark Guthrie (facilitator)
Linda O’Black, Sarah
Janes
Gulf Coast Workforce Board Minutes
April 5, 2016
Page 6 of 12
Monday, April 4, 2016
9 – 10:30 am
Workforce Solutions –
Rosenberg
Betty Baitland (facilitator)
Allene Schmidt, Sarah
Janes, Richard Shaw, Ray
Aguilar
Monday, April 11, 2016
10 – 11:30 am
Workforce Solutions –
Baytown
Guy Robert Jackson (facilitator)
Monday, April 18, 2016
10 – 11:30 am
Brazosport College Gerald Andrews (facilitator)
Willie Alexander, Richard
Shaw
Monday, April 25, 2016
10 – 11:30 am
Workforce Solutions –
Conroe
Gil Staley (facilitator)
Sarah Janes, Richard Shaw
Board members are invited to attend any of the roundtable discussions. Chair Shaw
asked members to please advise Joshua Shideler if they planned to attend.
In addition to the roundtable discussions, Board members continue to share the Report
Card in their local communities and through their professional networks. The materials
used for the roundtable discussions (presentations, handouts, etc.) will be available to all
Board members.
Several Board members that attended the roundtables spoke about how well attended the
meetings were and about the good discussions that resulted.
Mr. Temple noted that the Report Card Committee has received requests from Pearland
and Bay City to have a presentation in those communities.
Chair Shaw concluded his report and no action was taken
THERE WERE NO ACTION ITEMS ON THE AGENDA.
RECEIVE INFORMATION
System Performance
Mr. David Baggerly reviewed the Year End System Performance measures for October
2015 through February 2016. These measures gauge progress toward meeting the results
set out in the Board’s strategic plan. There are two sets of measures: one for the entire
regional workforce system and one for the Board’s operating affiliate, Workforce
Solutions.

Gulf Coast Workforce Board Minutes
April 5, 2016
Page 7 of 12
For Workforce Solutions
More Competitive Employers –
Employers Receiving Services (Market Share) – We expected to provide services to
25,757 employers this year. We provided services to 13,637 employers through February
2016.
Employer Loyalty – Our performance indicates our employer customers value our
services and return to us for additional services. Of a possible 24,235 employers, 8,770
returned to The Workforce Solutions for additional services through February 2016.
More and Better Jobs –
New jobs created – New jobs created in the region as a result of Workforce Solutions
partnering with economic development organizations.
This information is captured quarterly and reflects a two year average through December
2015.
Customers employed by the 1st Quarter after exit – 113,796 of the 141,283 customers
who exited service in the two quarters ending March 2015 were employed by the quarter
after exit.
Higher Real Incomes –
Exiters with Earnings Gains of at least 20% - 52,873 of the 150,240 customers who
exited in the two quarters ending September 2014 had earnings gains of at least 20%.
A Better Educated and Skilled Workforce –
Customers pursuing education diploma, degree or certificate who achieve one -
396 of 825 customers pursuing an education diploma, degree or certificate attained a
diploma, degree or certificate by the end of the quarter after exit.
In addition to the Board’s measures, Workforce Solutions works to meet the state’s
expectations for performance on indicators related to the money we received from the
Texas Workforce Commission.
For the performance year that began October 1, 2015, we are meeting or exceeding the
target for six of nine common measures. The common measures we are not meeting are:
Claimant Reemployment within 10 weeks – The target for this measure is
53.59%. Our performance through February 2016 was 47.8%.
Youth Literacy/Numeracy – The target for this measure is 53%. Our performance
though January 2016 was 39.5%.

Gulf Coast Workforce Board Minutes
April 5, 2016
Page 8 of 12
Choices Full Work Rate - The target for this measure is 47%. Our performance
through January was 43.09%.
The adult education consortium has multiple measures for production and outcomes. We
count beginning in July of each year.
Enrollments. Total enrollments are the number of individuals who begin an adult
education class. 12+ hour enrollments count the number of individuals who are in
class 12 or more clock hours. Transitions enrollments count the number of
individuals in adult education classes designed to lead to further post-secondary
training. Career Pathways enrollments counts the number of individuals in
contextualized learning (basic education and occupational skills at the same time)
classes.
Target
Year to Date
Actual
Total Enrollments N/A 21,288
12+ Hour Enrollments 25,151 19,375
Transitions 1,257 501
Career Pathways 1,377 410
Outcomes. There are 11 outcome measures. All customers who complete at least
12 hours instruction count in the denominator.
Measure Target Year to Date
Actual
Adult Basic Education – Beginning Literacy 75% 41.7%
Adult Basic Education – Beginning Basic Education 63% 31.3%
Adult Basic Education – Intermediate Low 63% 33.5%
Adult Basic Education – Intermediate High 56% 26.7%
English as a Second Language – Beginning Literacy 64% 30.1%
English as a Second Language – Beginning Low 70% 34.5%
English as a Second Language – Beginning High 72% 37.1%
English as a Second Language – Intermediate Low 74% 34.2%
English as a Second Language – Intermediate High 64% 24.5%
Advanced English as a Second Language 66% 17.6%
Adult Secondary Education 64% 30.3%
Mr. Baggerly concluded his report and no action was taken.
Expenditure Report
Mr. Mike Temple reviewed the Financial Status Report for two months ending February
29, 2016 and stated that the budget is on target and looks good. Mr. Temple also noted

Gulf Coast Workforce Board Minutes
April 5, 2016
Page 9 of 12
that a Budget Committee meeting will be scheduled in July for any mid-year adjustments
or updates.
Mr. Temple concluded his report and no action was taken.
Information Updates
Mr. Temple gave an update on the progress and timelines for the vocational rehabilitation
services transition. On September 1, 2016, employees currently with DARS that have
been identified (Blind Services and Rehabilitation Services) will transfer to TWC and
become TWC employees. Those employees will remain doing their same job
requirements and in the same locations throughout the region.
By September 1, 2017 the Blind Services Division and the Rehabilitation Services
Division will be consolidated into one designated state unit.
By September 1, 2018 any movement of office location or staff into career offices or
career office staff into locations that are currently Vocational Rehabilitation offices will
be completed.
Mr. Temple explained that there is approximately a 2 year period for making the
complete transition which will occur in stages over time. Staff will keep the Board
updated regarding locations, efforts to combine staff, etc. Mr. Temple also noted that
there have been regular and ongoing meetings with Cheryl Guido’s group - Blind
Services staff and Ron Fleming - Rehabilitation staff regarding efforts to connect and
work together on this transition.
Mr. Temple noted the proposed timelines for 2017 contract renewals. Usual practice is to
have a combined Procurement Committee and Audit/Monitoring Committee meeting in
July regarding contract renewals and to bring the recommendations to the Board in
August.
Mr. Temple explained that recommendations for system procurements, including adult
education are to reprocure for the entire system beginning October 1, 2017. The Request
for Proposals (RFP) should be released in the spring 2017. Adult Education
procurements may be on a different timeline and staff should know more soon.
Mr. Temple also mentioned that once the Report Card Roundtables conclude staff will be
contacting all the committee chairs to schedule various committee meetings to discuss a
variety of topics and ideas related to information gathered from the roundtables.
Several Board members had questions or comments and discussion followed.
Gulf Coast Workforce Board Minutes
April 5, 2016
Page 10 of 12
Mr. Temple concluded his report and no action was taken
LOOK AT THE ECONOMY
Mr. Ron Borski explained that the rate of unemployment in the Houston-The Woodlands-
Sugar Land Metropolitan Statistical Area (H-W-S MSA) dropped one-tenth of a
percentage point to 4.7 percent in February. The unemployment rate for Texas also
dropped one-tenth of a percentage point in February to 4.3 percent and the national rate
dropped one-tenth of a percentage point in February to 5.2 percent. The H-W-S MSA
added 10,100 jobs to payrolls in February. Mr. Borski explained the 0.3 percent in
February was the weakest on record since 2009 during the Great Recession. Most of the
job growth has been in population driven sectors of the economy such as Leisure &
Hospitality, Educational & Health Services, and Local Government. A number of
industry sectors were reporting over-the-year losses. Deepest declines have been in
Mining, Durable Goods Manufacturing, and Financial Activities. The overall outlook for
2016 is for continued weakness in sectors supporting the energy industry with a high
probability of a slowing trend to spread across other sectors as more consumers are faced
with reduced discretionary spending.
Mr. Borski concluded his report and no action was taken.
Health Care Industry Occupations by Skill Level – Gulf Coast Region
Mr. Borski reported that the Health Care Industry has historically been a stable career
choice and continues to offer a wide range of opportunities. Healthy job growth is
projected for numerous occupations throughout the industry, from nursing assistants to
medical physicians. Education and training requirements range from short term on-the-
job training to post-secondary degrees and professional licenses with wages increasing
accordingly.
Technological advances are changing the skills required from healthcare workers.
Complex medical treatments, quality and safety of patient care, and health informatics,
which all affect delivery of care, are prompting upgrades in training and education in
many health occupations. New roles, responsibilities and specializations are being
created throughout healthcare.
Each detailed Health Care Industry has unique staffing patterns; not all are equal which
we demonstrate in our tables. For the purposes of this report occupations have been
grouped into seven detailed industries:
Offices of Physicians, Dentists, and Other Healthcare Practitioners
Clinics and Outpatient Care Centers
Medical and Diagnostic Laboratories
Hospitals
Other Ambulatory Health Care Services

Gulf Coast Workforce Board Minutes
April 5, 2016
Page 11 of 12
Home Health Services
Nursing and Residential Care Facilities
From the wide variety of healthcare career opportunities, not all provide direct patient
care. For this reason the accompanying occupational data is broken into two categories
for each industry.
Health care occupations – occupations providing direct diagnosing and treatment.
Health care support occupations – occupations providing office and administrative
support, building and equipment maintenance, and other services supporting the
day-to-day operations not involving direct patient care.
The definitions used in this document are as follows:
Low-skill occupations – those with requirements up to and including a high
school diploma and short-term on-the-job training plus others not meeting middle-
skill wage criteria.
Middle-skill occupations – those with requirements of an associate’s degree or
high school diploma and one of the following PLUS median wage equal to or
greater than the median for all occupations in the region: $17.68:
o Moderate-term on-the-job training
o Long-term on-the-job training
o Apprenticeship
o One year or more experience
o Some college, no degree
o Postsecondary non-degree award
High-skill occupations – those with requirements of a bachelor’s degree or higher.
The Gulf Coast region includes the following 13 Texas counties: Austin,
Brazoria, Chambers, Colorado, Fort Bend, Galveston, Harris, Liberty, Matagorda,
Montgomery, Walker, Waller and Wharton.
In recent years, numerous research and analysis reports have explored the demand for and
importance of middle skill occupations. The impetus behind the reports is to emphasize to
policymakers and job candidates the importance of postsecondary education and training
for success in these occupations.
Most middle skill studies focus on education, training, and/or on-the-job training data as
criteria. Modification was made to our criteria by adding the wage requirement above:
the occupation must pay a median wage equal to or above the median wage for all
occupations in the Gulf Coast Region ($17.68). Adding this wage requirement
encourages individuals to pursue achievable career goals that raise family income to a
self-sufficient level.
Gulf Coast Workforce Board Minutes
April 5, 2016
Page 12 of 12
Gulf Coast career exploration resources for in-demand occupations:
http://www.wrksolutions.com/for-individuals/career-exploration .
Included are (labor market information or LMI) about salaries, job openings, job growth
and education and training requirements about selected jobs.
Occupations in demand
Industry and occupation profiles
Career videos
Choices planner - helps individuals build comprehensive portfolios based on
interests, values, skills and experience to explore potential career matches and
locate training and employment opportunities
Career/personality match
Mr. Borski concluded his report and no action was taken.
OTHER BUSINESS
No one presented other business.
ADJOURN
There was no further business to come before the Board, and Chair Guthrie adjourned the
meeting at approximately 10:45 am.

Item 6b
Page 1 of 2
Audit/Monitoring Committee
Update for June 2016
The Audit/Monitoring Committee met Tuesday, May 24, 2016 at the Cypress Station office.
Operations
Career Offices. The regional monitoring team reviewed three offices: East End,
Huntsville, and Conroe. The East End office received an above average rating and
Huntsville and Conroe both received average ratings.
o The East End office sees an average of 450 customers daily. We particularly noted
the efforts this office has made in serving individuals experiencing homelessness and
its partnerships with SER, the Houston Food Bank and the Homeless Coalition to
provide work-based learning opportunities.
o The Huntsville office has shown a 30% increase of daily customer visits since the
last review at an average of 140 customers. We noted improvements in office layout
(changing location of greeter stations), changes to resource room computer station
layout, cross training for staff and increased staff recognition.
o The Conroe office averages about 375 visits daily, a 12% increase from the previous
annual visit. This is a busy office for its location. As with most offices we have
reviewed this year, we continue to stress the need to increase the direct placement of
customers into jobs and continuing support for customers engaged in education or
training activities to ensure their successful completion and credentialing.
Financial Aid Payment Office. From October 2015 through April 30, 2016, we checked
on 693 child care providers out of a total of 1,511 active vendors. This included
following-up on three vendors with service improvement agreements.
Financial Aid Call Center. We completed our quarterly review of eligibility at the Call
Center, looking at 100 financial aid applications. We had no findings. We also continue
to provide technical assistance on Call Center operations and to follow up on an
improvement plan for this year. The Call Center has eliminated backlogs, reduced the
time to process applications and is making progress on each of the elements in the
improvement plan.

Item 6b
Page 2 of 2
Financial Reviews
Knowledge First. In February, we told you that a preliminary report from a review at
Knowledge First indicated issues with documentation of services, staffing, and service
delivery. At that time, we suspended payments to this contractor pending resolution of
the monitoring findings.
As you may remember, Knowledge First is one of five agreements the Board authorized
last year to test a different approach to fund community programs serving youth. For
these five organizations, we looked to augment an existing program with demonstrated
effectiveness by providing limited funds to leverage those programs’ other resources.
Our goal was to expand the number of youth each community organization was able to
serve – but not by creating a stand-alone Workforce Solutions project or location.
As we worked through resolution of issues the financial monitor identified, we also
visited Knowledge First several times, providing technical assistance on issues related to
documentation of service, financial systems, and payments. We are now satisfied that
Knowledge First has addressed the financial monitor’s concerns and that Knowledge
First’s subsequent requests for payments adequately reflect the service delivered. We
have resumed payments for the service at this contractor.
Workforce Commission Annual Reviews
We have resolved all issues which the Texas Workforce Commission identified in its
2015 review. This includes the findings related to proper documentation in records for
customers using Trade Act benefits. We have made changes to our financial aid process
and procedures in both the career offices and the Payment Office to ensure better internal
controls on use of funds by our customers.
Commission monitors will return to conduct the 2016 review in mid- and late- June. We
normally see the report of these annual visits in December of the year of the review.
H-GAC Comprehensive Annual Financial Report
H-GAC, the Board’s fiscal and administrative agent, has completed its 2015 agency-
wide, comprehensive financial audit. There are no findings. When the report is made
final, we will make copies available to Board members, as we normally do.
Item 6c
Page 1 of 2
Report Card Committee
Regional Round-table Discussions
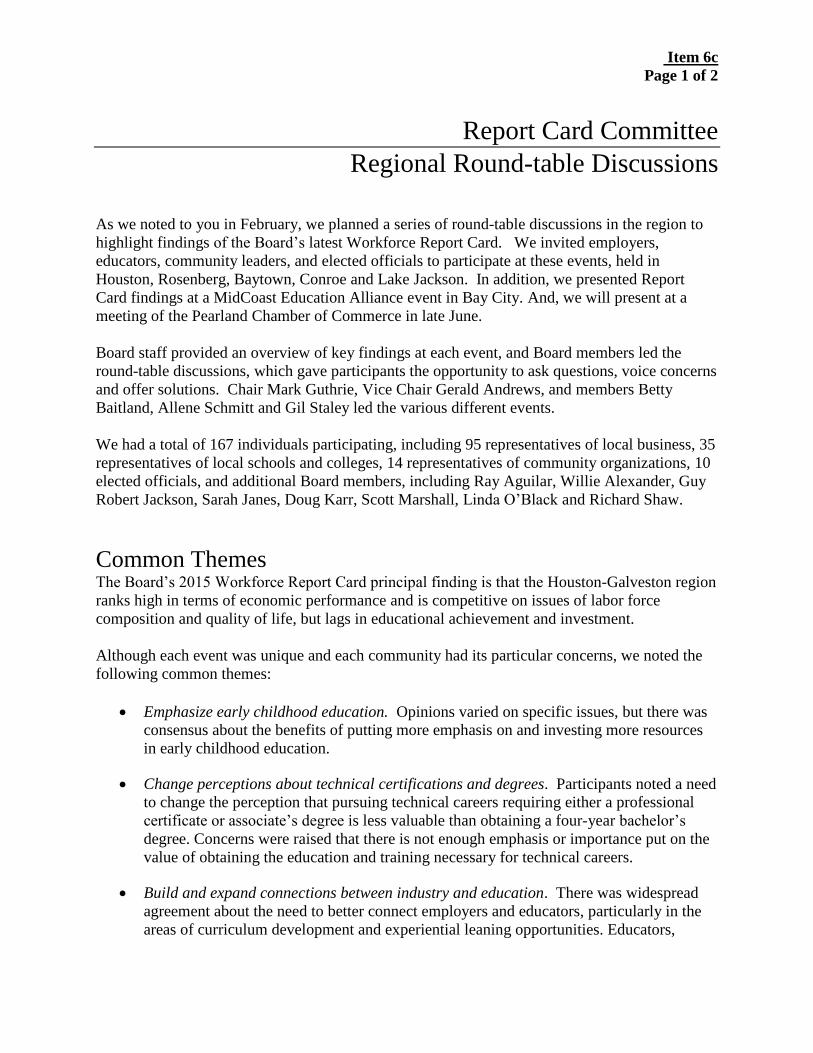
As we noted to you in February, we planned a series of round-table discussions in the region to
highlight findings of the Board’s latest Workforce Report Card. We invited employers,
educators, community leaders, and elected officials to participate at these events, held in
Houston, Rosenberg, Baytown, Conroe and Lake Jackson. In addition, we presented Report
Card findings at a MidCoast Education Alliance event in Bay City. And, we will present at a
meeting of the Pearland Chamber of Commerce in late June.
Board staff provided an overview of key findings at each event, and Board members led the
round-table discussions, which gave participants the opportunity to ask questions, voice concerns
and offer solutions. Chair Mark Guthrie, Vice Chair Gerald Andrews, and members Betty
Baitland, Allene Schmitt and Gil Staley led the various different events.
We had a total of 167 individuals participating, including 95 representatives of local business, 35
representatives of local schools and colleges, 14 representatives of community organizations, 10
elected officials, and additional Board members, including Ray Aguilar, Willie Alexander, Guy
Robert Jackson, Sarah Janes, Doug Karr, Scott Marshall, Linda O’Black and Richard Shaw.
Common Themes The Board’s 2015 Workforce Report Card principal finding is that the Houston-Galveston region
ranks high in terms of economic performance and is competitive on issues of labor force
composition and quality of life, but lags in educational achievement and investment.
Although each event was unique and each community had its particular concerns, we noted the
following common themes:
Emphasize early childhood education. Opinions varied on specific issues, but there was
consensus about the benefits of putting more emphasis on and investing more resources
in early childhood education.
Change perceptions about technical certifications and degrees. Participants noted a need
to change the perception that pursuing technical careers requiring either a professional
certificate or associate’s degree is less valuable than obtaining a four-year bachelor’s
degree. Concerns were raised that there is not enough emphasis or importance put on the
value of obtaining the education and training necessary for technical careers.
Build and expand connections between industry and education. There was widespread
agreement about the need to better connect employers and educators, particularly in the
areas of curriculum development and experiential leaning opportunities. Educators,
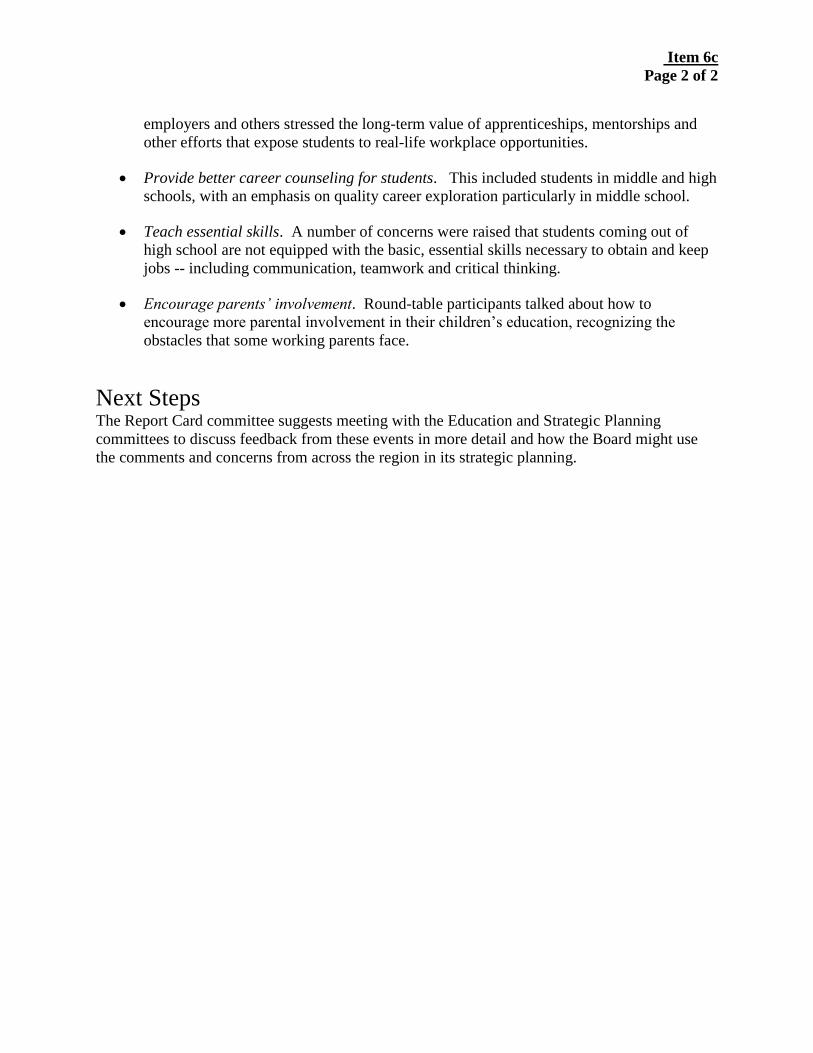
Item 6c
Page 2 of 2
employers and others stressed the long-term value of apprenticeships, mentorships and
other efforts that expose students to real-life workplace opportunities.
Provide better career counseling for students. This included students in middle and high
schools, with an emphasis on quality career exploration particularly in middle school.
Teach essential skills. A number of concerns were raised that students coming out of
high school are not equipped with the basic, essential skills necessary to obtain and keep
jobs -- including communication, teamwork and critical thinking.
Encourage parents’ involvement. Round-table participants talked about how to
encourage more parental involvement in their children’s education, recognizing the
obstacles that some working parents face.
Next Steps The Report Card committee suggests meeting with the Education and Strategic Planning
committees to discuss feedback from these events in more detail and how the Board might use
the comments and concerns from across the region in its strategic planning.
Item 6d
Page 1 of 1
Career Office Committee Customer Service Award
Background As we have noted to you in previous meetings, our contractors regularly identify staff members
they believe best exhibit the I AM Workforce Solutions principles of excellent customer service.
The Regional Management Team—made up of Board staff and contractor management—
reviews nominations and selects one or more individuals for recognition.
I AM Workforce Solutions Flor Lopez, Staffing Specialist
Workforce Solutions – East End
As a staffing specialist Flor takes on any task that will get the job done. She recruits
and refers candidates to open postings, often using creative means such as social media
to get the word out. She also uses her connections with local education institutions to
network and attract candidates to the office. Flor organizes and schedules in house
hiring events at times that will give employers the best experience, and goes the extra
mile to insure that employers’ needs are met. She consistently exceeds the expectations
of employers and her peers by thinking of them as the most important customers. Flor
is dedicated, reliable, and a valued member of the Employer Service team.
Tamara Reed, Resource Specialist
Workforce Solutions - Southeast
Tamara has been in workforce since 1995, so she recently celebrated 20 years of
contributions to Houston’s economy. Her customers and colleagues describe her as
“friendly, courteous, and knowledgeable.” She has received numerous compliments
from customers for her willingness to help them to become job ready, revamp their
skills, and re-enter the workforce with confidence. Although her main job is to help
manage the Resource Room, she also makes sure she engages customers directly about
their job needs, beginning and ending the conversation with employment. Tamara is
the employment-minded Resource Specialist we want to have in all our offices.
Item 7a
Page 1 of 4
Gulf Coast Workforce Board
System Performance October 2015 to April 2016
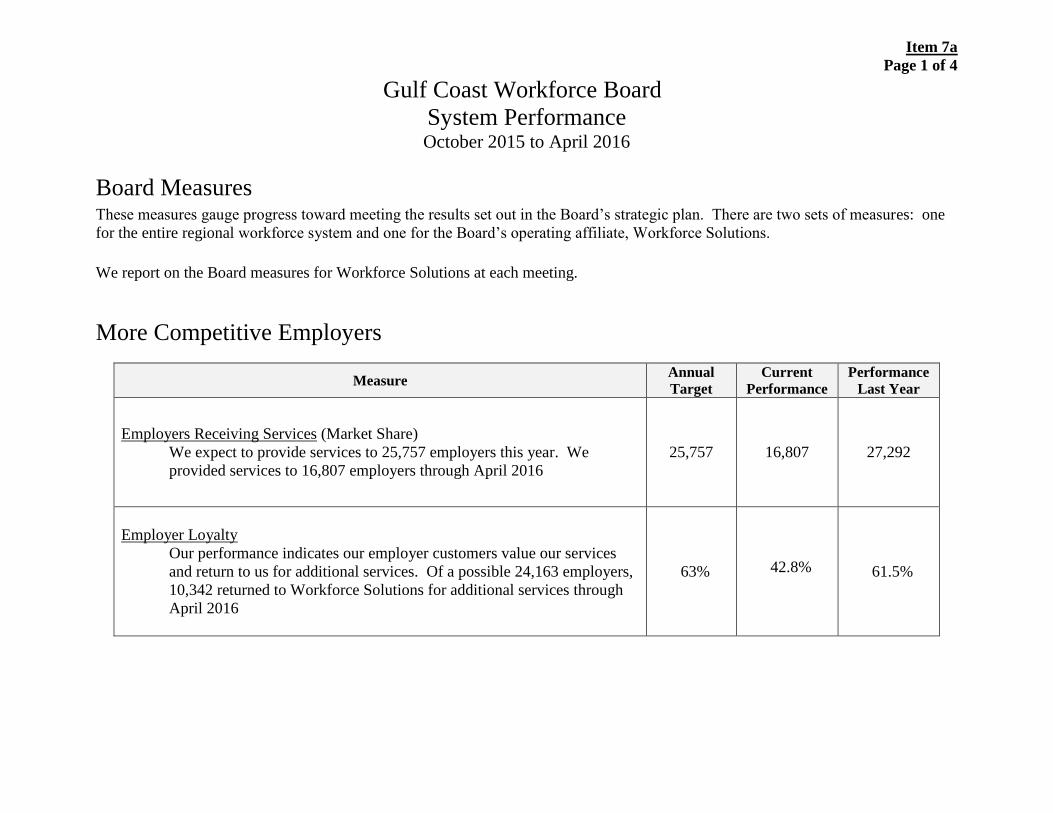
Board Measures These measures gauge progress toward meeting the results set out in the Board’s strategic plan. There are two sets of measures: one
for the entire regional workforce system and one for the Board’s operating affiliate, Workforce Solutions.
We report on the Board measures for Workforce Solutions at each meeting.
More Competitive Employers
Measure Annual
Target
Current
Performance
Performance
Last Year
Employers Receiving Services (Market Share)
We expect to provide services to 25,757 employers this year. We
provided services to 16,807 employers through April 2016
25,757 16,807 27,292
Employer Loyalty
Our performance indicates our employer customers value our services
and return to us for additional services. Of a possible 24,163 employers,
10,342 returned to Workforce Solutions for additional services through
April 2016
63% 42.8% 61.5%
Item 7a
Page 2 of 4
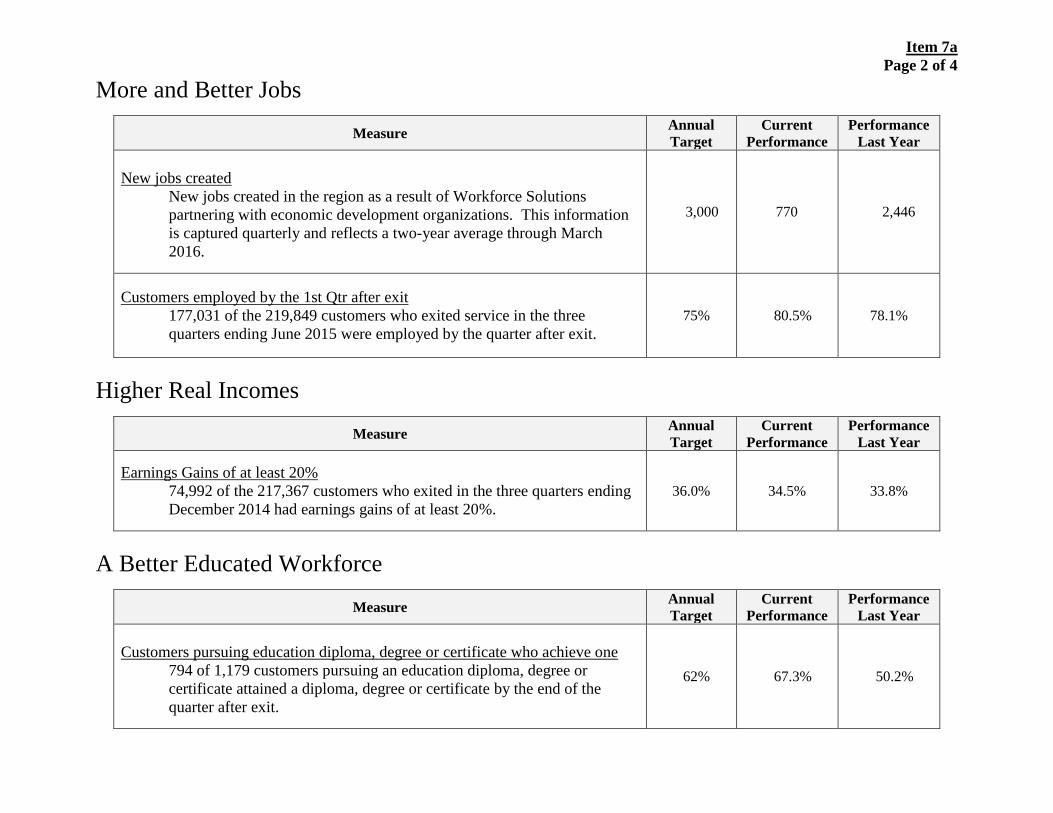
More and Better Jobs
Measure Annual
Target
Current
Performance
Performance
Last Year
New jobs created
New jobs created in the region as a result of Workforce Solutions
partnering with economic development organizations. This information
is captured quarterly and reflects a two-year average through March
2016.
3,000 770 2,446
Customers employed by the 1st Qtr after exit
177,031 of the 219,849 customers who exited service in the three
quarters ending June 2015 were employed by the quarter after exit.
75% 80.5% 78.1%
Higher Real Incomes
Measure Annual
Target
Current
Performance
Performance
Last Year
Earnings Gains of at least 20%
74,992 of the 217,367 customers who exited in the three quarters ending
December 2014 had earnings gains of at least 20%.
36.0% 34.5% 33.8%
A Better Educated Workforce
Measure Annual
Target
Current
Performance
Performance
Last Year
Customers pursuing education diploma, degree or certificate who achieve one
794 of 1,179 customers pursuing an education diploma, degree or
certificate attained a diploma, degree or certificate by the end of the
quarter after exit.
62% 67.3% 50.2%

Item 7a
Page 3 of 4
Production In addition to the Board’s measures, Workforce Solutions works to meet Texas Workforce Commission expectations for production.
For the performance year that began October 1, 2015, we are meeting or exceeding the target for seven of nine common measures.
The common measures we are not meeting are:
Claimant Reemployment within 10 weeks - The target for this measure is 53.59%. Our performance through January 2016
was 47.2%.
Youth Literacy/ Numeracy - The target for this measure is 53%. Our performance through March 2016 was 41.1%.
The adult education consortium has multiple measures for production and outcomes. We count beginning in July of each year.
Enrollments. Total enrollments are the number of individuals who begin an adult education class. 12+ hour enrollments count
the number of individuals who are in class 12 or more clock hours. Transitions enrollments count the number of individuals in
adult education classes designed to lead to further post-secondary training. Career Pathways enrollments counts the number of
individuals in contextualized learning (basic education and occupational skills at the same time) classes.
Target
Year to Date
Actual
Total Enrollments N/A 21,288
12+ Hour Enrollments 25,151 19,375
Transitions 1,257 501
Career Pathways 1,377 410
Outcomes. There are 11 outcome measures. All customers who complete at least 12 hours instruction count in the
denominator.

Item 7a
Page 4 of 4
Measure Target Year to Date
Actual
Adult Basic Education – Beginning Literacy 75% 41.7%
Adult Basic Education – Beginning Basic Education 63% 31.3%
Adult Basic Education – Intermediate Low 63% 33.5%
Adult Basic Education – Intermediate High 56% 26.7%
English as a Second Language – Beginning Literacy 64% 30.1%
English as a Second Language – Beginning Low 70% 34.5%
English as a Second Language – Beginning High 72% 37.1%
English as a Second Language – Intermediate Low 74% 34.2%
English as a Second Language – Intermediate High 64% 24.5%
Advanced English as a Second Language 66% 17.6%
Adult Secondary Education 64% 30.3%
Item 7b
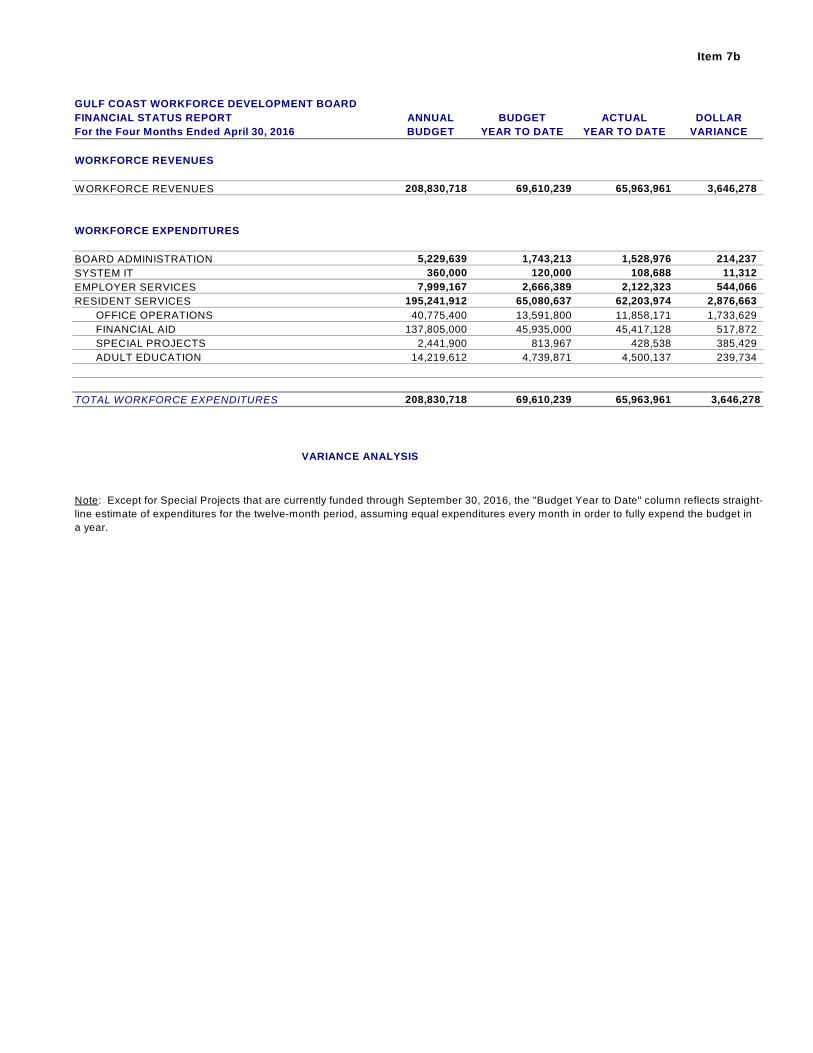
GULF COAST WORKFORCE DEVELOPMENT BOARD
FINANCIAL STATUS REPORT ANNUAL BUDGET ACTUAL DOLLAR
For the Four Months Ended April 30, 2016 BUDGET YEAR TO DATE YEAR TO DATE VARIANCE
WORKFORCE REVENUES
WORKFORCE REVENUES 208,830,718 69,610,239 65,963,961 3,646,278
WORKFORCE EXPENDITURES
BOARD ADMINISTRATION 5,229,639 1,743,213 1,528,976 214,237
SYSTEM IT 360,000 120,000 108,688 11,312
EMPLOYER SERVICES 7,999,167 2,666,389 2,122,323 544,066
RESIDENT SERVICES 195,241,912 65,080,637 62,203,974 2,876,663
OFFICE OPERATIONS 40,775,400 13,591,800 11,858,171 1,733,629
FINANCIAL AID 137,805,000 45,935,000 45,417,128 517,872
SPECIAL PROJECTS 2,441,900 813,967 428,538 385,429
ADULT EDUCATION 14,219,612 4,739,871 4,500,137 239,734
TOTAL WORKFORCE EXPENDITURES 208,830,718 69,610,239 65,963,961 3,646,278
VARIANCE ANALYSIS
Note: Except for Special Projects that are currently funded through September 30, 2016, the "Budget Year to Date" column reflects straight-
line estimate of expenditures for the twelve-month period, assuming equal expenditures every month in order to fully expend the budget in
a year.
05.26.2016
1
Labor Market Information
APRIL 2016 Employment Data
HOUSTON-THE WOODLANDS-SUGAR LAND METROPOLITAN STATISTICAL AREA (H-W-S MSA) Visit our website at www.wrksolutions.com
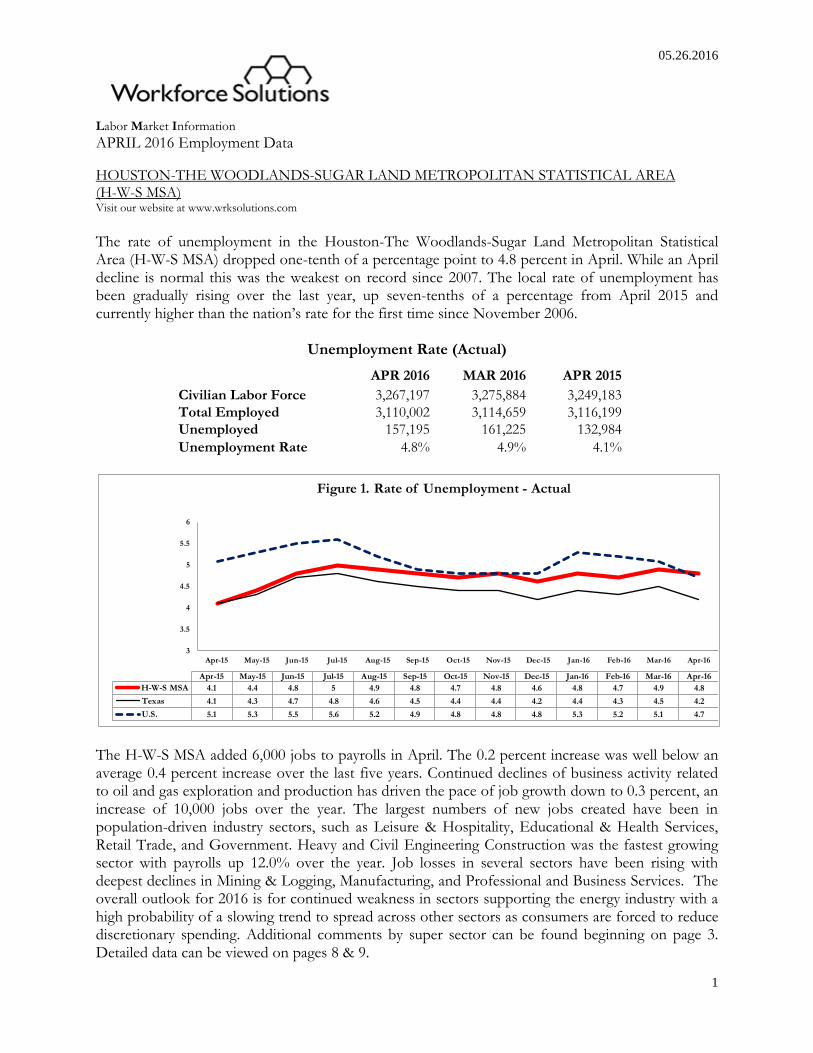
The rate of unemployment in the Houston-The Woodlands-Sugar Land Metropolitan Statistical Area (H-W-S MSA) dropped one-tenth of a percentage point to 4.8 percent in April. While an April decline is normal this was the weakest on record since 2007. The local rate of unemployment has been gradually rising over the last year, up seven-tenths of a percentage from April 2015 and currently higher than the nation’s rate for the first time since November 2006.
Unemployment Rate (Actual)
APR 2016 MAR 2016 APR 2015
Civilian Labor Force 3,267,197 3,275,884 3,249,183
Total Employed 3,110,002 3,114,659 3,116,199
Unemployed 157,195 161,225 132,984
Unemployment Rate 4.8% 4.9% 4.1%
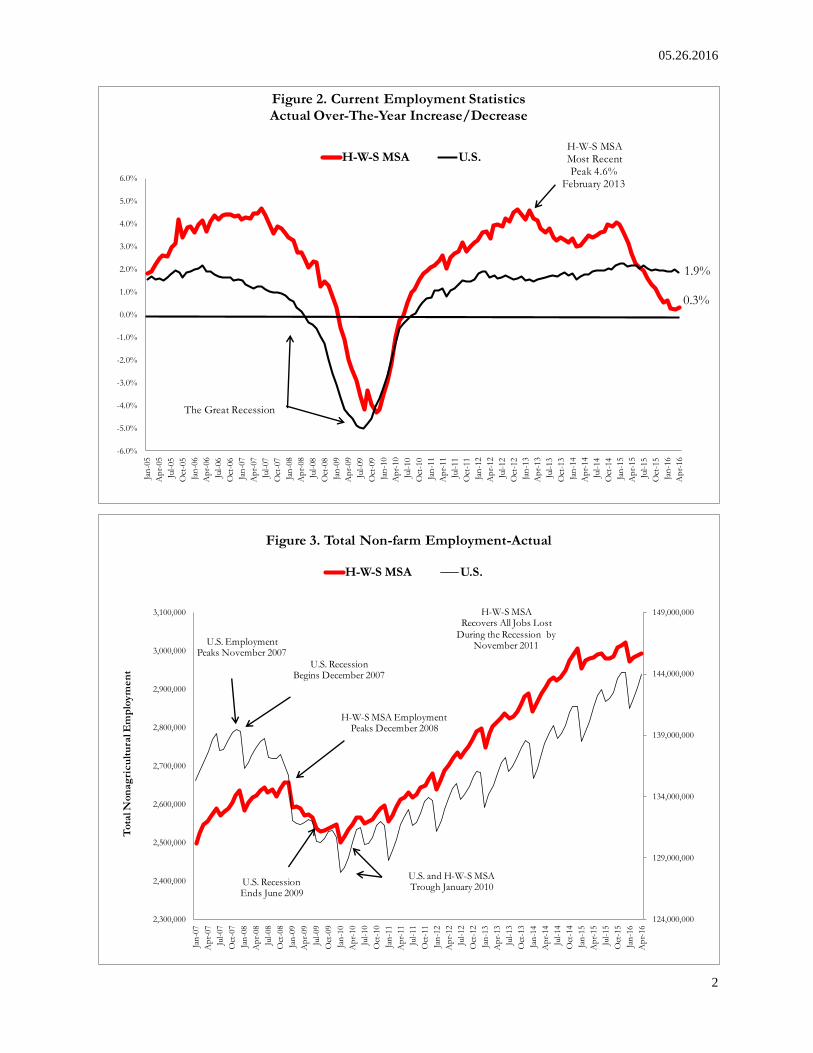
The H-W-S MSA added 6,000 jobs to payrolls in April. The 0.2 percent increase was well below an average 0.4 percent increase over the last five years. Continued declines of business activity related to oil and gas exploration and production has driven the pace of job growth down to 0.3 percent, an increase of 10,000 jobs over the year. The largest numbers of new jobs created have been in population-driven industry sectors, such as Leisure & Hospitality, Educational & Health Services, Retail Trade, and Government. Heavy and Civil Engineering Construction was the fastest growing sector with payrolls up 12.0% over the year. Job losses in several sectors have been rising with deepest declines in Mining & Logging, Manufacturing, and Professional and Business Services. The overall outlook for 2016 is for continued weakness in sectors supporting the energy industry with a high probability of a slowing trend to spread across other sectors as consumers are forced to reduce discretionary spending. Additional comments by super sector can be found beginning on page 3. Detailed data can be viewed on pages 8 & 9.
3
3.5
4
4.5
5
5.5
6
Apr-15 May-15 Jun-15 Jul-15 Aug-15 Sep-15 Oct-15 Nov-15 Dec-15 Jan-16 Feb-16 Mar-16 Apr-16
Apr-15 May-15 Jun-15 Jul-15 Aug-15 Sep-15 Oct-15 Nov-15 Dec-15 Jan-16 Feb-16 Mar-16 Apr-16
H-W-S MSA 4.1 4.4 4.8 5 4.9 4.8 4.7 4.8 4.6 4.8 4.7 4.9 4.8
Texas 4.1 4.3 4.7 4.8 4.6 4.5 4.4 4.4 4.2 4.4 4.3 4.5 4.2
U.S. 5.1 5.3 5.5 5.6 5.2 4.9 4.8 4.8 4.8 5.3 5.2 5.1 4.7
Figure 1. Rate of Unemployment - Actual
05.26.2016
2
0.3%
1.9%
-6.0%
-5.0%
-4.0%
-3.0%
-2.0%
-1.0%
0.0%
1.0%
2.0%
3.0%
4.0%
5.0%
6.0%
Jan
-05
Ap
r-05
Jul-
05
Oct
-05
Jan
-06
Ap
r-06
Jul-
06
Oct
-06
Jan
-07
Ap
r-07
Jul-
07
Oct
-07
Jan
-08
Ap
r-08
Jul-
08
Oct
-08
Jan
-09
Ap
r-09
Jul-
09
Oct
-09
Jan
-10
Ap
r-10
Jul-
10
Oct
-10
Jan
-11
Ap
r-11
Jul-
11
Oct
-11
Jan
-12
Ap
r-12
Jul-
12
Oct
-12
Jan
-13
Ap
r-13
Jul-
13
Oct
-13
Jan
-14
Ap
r-14
Jul-
14
Oct
-14
Jan
-15
Ap
r-15
Jul-
15
Oct
-15
Jan
-16
Ap
r-16
Figure 2. Current Employment StatisticsActual Over-The-Year Increase/Decrease
H-W-S MSA U.S.H-W-S MSAMost Recent Peak 4.6%
February 2013
The Great Recession
124,000,000
129,000,000
134,000,000
139,000,000
144,000,000
149,000,000
2,300,000
2,400,000
2,500,000
2,600,000
2,700,000
2,800,000
2,900,000
3,000,000
3,100,000
Jan
-07
Ap
r-07
Jul-
07
Oct
-07
Jan
-08
Ap
r-08
Jul-
08
Oct
-08
Jan
-09
Ap
r-09
Jul-
09
Oct
-09
Jan
-10
Ap
r-10
Jul-
10
Oct
-10
Jan
-11
Ap
r-11
Jul-
11
Oct
-11
Jan
-12
Ap
r-12
Jul-
12
Oct
-12
Jan
-13
Ap
r-13
Jul-
13
Oct
-13
Jan
-14
Ap
r-14
Jul-
14
Oct
-14
Jan
-15
Ap
r-15
Jul-
15
Oct
-15
Jan
-16
Ap
r-16
Tota
l Non
ag
ricu
ltu
ral E
mp
loym
en
t
Figure 3. Total Non-farm Employment-Actual
H-W-S MSA U.S.
U.S. Employment Peaks November 2007
U.S. RecessionBegins December 2007
H-W-S MSA EmploymentPeaks December 2008
U.S. RecessionEnds June 2009
U.S. and H-W-S MSA Trough January 2010
H-W-S MSARecovers All Jobs Lost
During the Recession by November 2011
05.26.2016
3
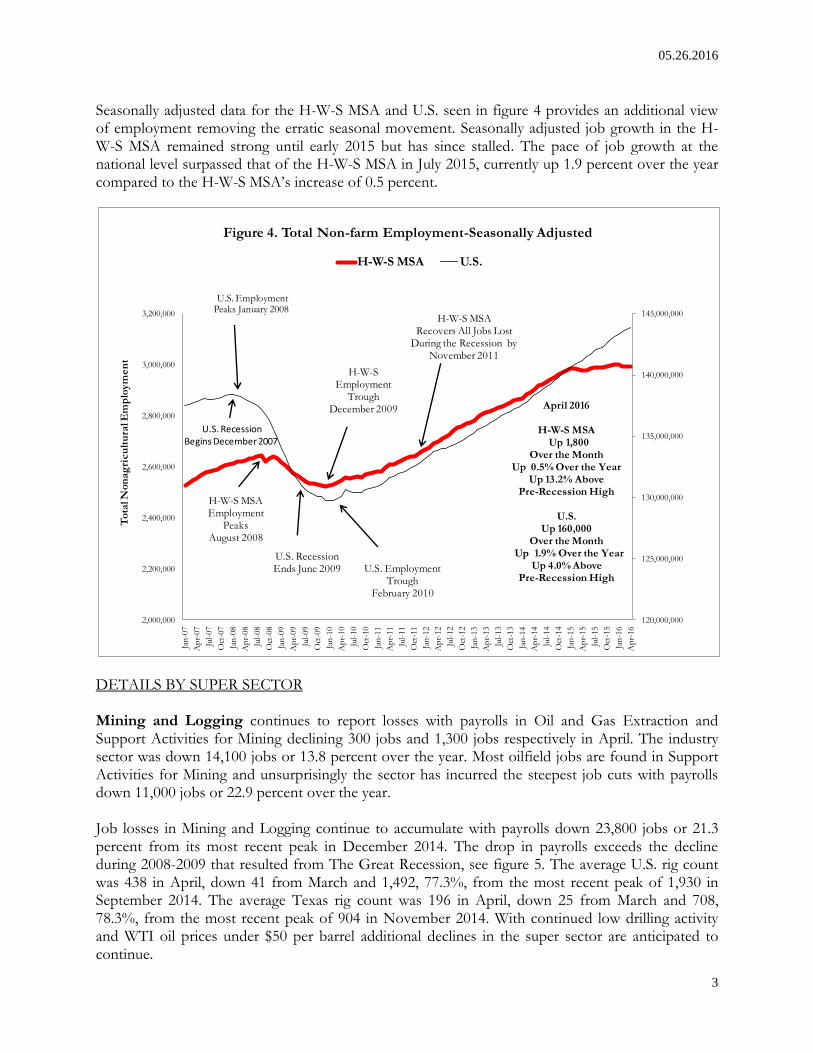
Seasonally adjusted data for the H-W-S MSA and U.S. seen in figure 4 provides an additional view of employment removing the erratic seasonal movement. Seasonally adjusted job growth in the H-W-S MSA remained strong until early 2015 but has since stalled. The pace of job growth at the national level surpassed that of the H-W-S MSA in July 2015, currently up 1.9 percent over the year compared to the H-W-S MSA’s increase of 0.5 percent.
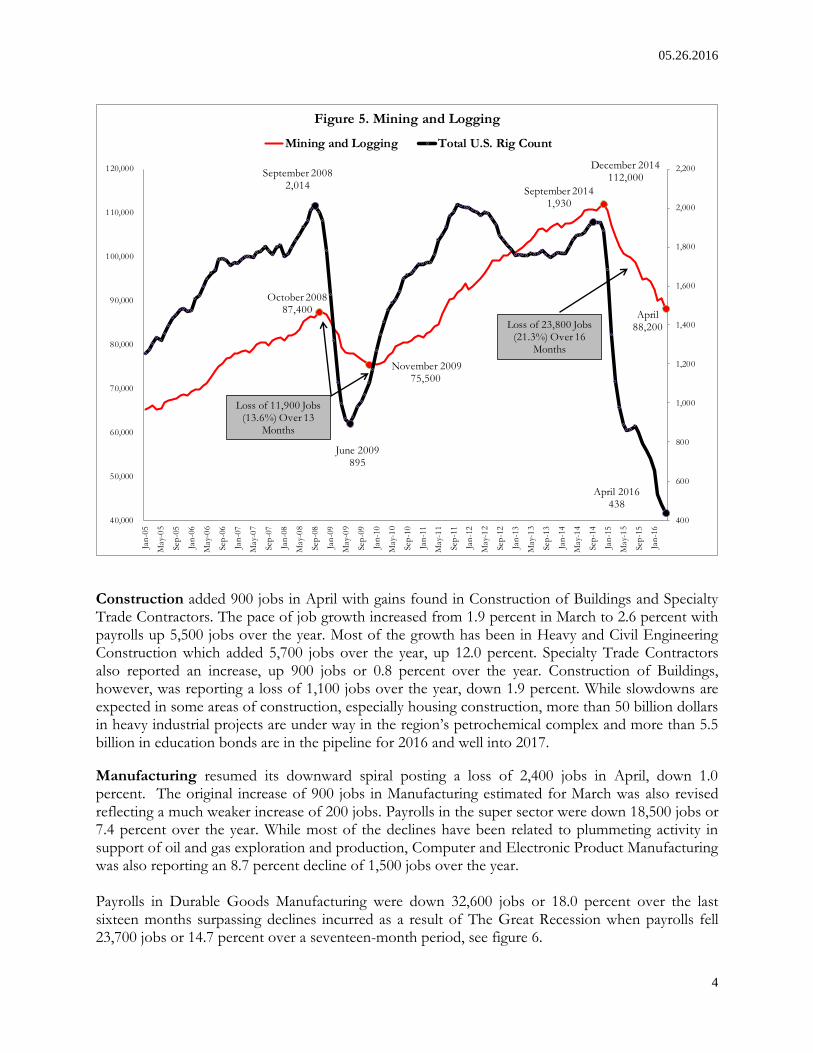
DETAILS BY SUPER SECTOR Mining and Logging continues to report losses with payrolls in Oil and Gas Extraction and Support Activities for Mining declining 300 jobs and 1,300 jobs respectively in April. The industry sector was down 14,100 jobs or 13.8 percent over the year. Most oilfield jobs are found in Support Activities for Mining and unsurprisingly the sector has incurred the steepest job cuts with payrolls down 11,000 jobs or 22.9 percent over the year. Job losses in Mining and Logging continue to accumulate with payrolls down 23,800 jobs or 21.3 percent from its most recent peak in December 2014. The drop in payrolls exceeds the decline during 2008-2009 that resulted from The Great Recession, see figure 5. The average U.S. rig count was 438 in April, down 41 from March and 1,492, 77.3%, from the most recent peak of 1,930 in September 2014. The average Texas rig count was 196 in April, down 25 from March and 708, 78.3%, from the most recent peak of 904 in November 2014. With continued low drilling activity and WTI oil prices under $50 per barrel additional declines in the super sector are anticipated to continue.
120,000,000
125,000,000
130,000,000
135,000,000
140,000,000
145,000,000
2,000,000
2,200,000
2,400,000
2,600,000
2,800,000
3,000,000
3,200,000
Jan
-07
Ap
r-07
Jul-
07
Oct
-07
Jan
-08
Ap
r-08
Jul-
08
Oct
-08
Jan
-09
Ap
r-09
Jul-
09
Oct
-09
Jan
-10
Ap
r-10
Jul-
10
Oct
-10
Jan
-11
Ap
r-11
Jul-
11
Oct
-11
Jan
-12
Ap
r-12
Jul-
12
Oct
-12
Jan
-13
Ap
r-13
Jul-
13
Oct
-13
Jan
-14
Ap
r-14
Jul-
14
Oct
-14
Jan
-15
Ap
r-15
Jul-
15
Oct
-15
Jan
-16
Ap
r-16
Tota
l Non
ag
ricu
ltu
ral E
mp
loym
en
t
Figure 4. Total Non-farm Employment-Seasonally Adjusted
H-W-S MSA U.S.
U.S. EmploymentPeaks January 2008
U.S. RecessionBegins December 2007
H-W-S MSAEmployment
PeaksAugust 2008
H-W-S Employment
Trough December 2009
U.S. RecessionEnds June 2009 U.S. Employment
TroughFebruary 2010
H-W-S MSARecovers All Jobs Lost
During the Recession by November 2011
April 2016
H-W-S MSAUp 1,800
Over the MonthUp 0.5% Over the Year
Up 13.2% AbovePre-Recession High
U.S. Up 160,000
Over the MonthUp 1.9% Over the Year
Up 4.0% Above Pre-Recession High
05.26.2016
4
Construction added 900 jobs in April with gains found in Construction of Buildings and Specialty Trade Contractors. The pace of job growth increased from 1.9 percent in March to 2.6 percent with payrolls up 5,500 jobs over the year. Most of the growth has been in Heavy and Civil Engineering Construction which added 5,700 jobs over the year, up 12.0 percent. Specialty Trade Contractors also reported an increase, up 900 jobs or 0.8 percent over the year. Construction of Buildings, however, was reporting a loss of 1,100 jobs over the year, down 1.9 percent. While slowdowns are expected in some areas of construction, especially housing construction, more than 50 billion dollars in heavy industrial projects are under way in the region’s petrochemical complex and more than 5.5 billion in education bonds are in the pipeline for 2016 and well into 2017.
Manufacturing resumed its downward spiral posting a loss of 2,400 jobs in April, down 1.0 percent. The original increase of 900 jobs in Manufacturing estimated for March was also revised reflecting a much weaker increase of 200 jobs. Payrolls in the super sector were down 18,500 jobs or 7.4 percent over the year. While most of the declines have been related to plummeting activity in support of oil and gas exploration and production, Computer and Electronic Product Manufacturing was also reporting an 8.7 percent decline of 1,500 jobs over the year. Payrolls in Durable Goods Manufacturing were down 32,600 jobs or 18.0 percent over the last sixteen months surpassing declines incurred as a result of The Great Recession when payrolls fell 23,700 jobs or 14.7 percent over a seventeen-month period, see figure 6.
October 200887,400
November 200975,500
400
600
800
1,000
1,200
1,400
1,600
1,800
2,000
2,200
40,000
50,000
60,000
70,000
80,000
90,000
100,000
110,000
120,000
Jan
-05
May-
05
Sep
-05
Jan
-06
May-
06
Sep
-06
Jan
-07
May-
07
Sep
-07
Jan
-08
May-
08
Sep
-08
Jan
-09
May-
09
Sep
-09
Jan
-10
May-
10
Sep
-10
Jan
-11
May-
11
Sep
-11
Jan
-12
May-
12
Sep
-12
Jan
-13
May-
13
Sep
-13
Jan
-14
May-
14
Sep
-14
Jan
-15
May-
15
Sep
-15
Jan
-16
Figure 5. Mining and Logging
Mining and Logging Total U.S. Rig Count
September 20082,014
June 2009895
December 2014112,000
April88,200
September 20141,930
April 2016438
Loss of 11,900 Jobs(13.6%) Over 13
Months
Loss of 23,800 Jobs(21.3%) Over 16
Months

05.26.2016
5
Nondurable Goods Manufacturing added 3,800 jobs over the year, up 4.7 percent, largely due to strong fourth quarter gains in 2015. The Houston Purchasing Managers Index fell from 45.9 in March to 44.2% in April. Any index below 50 generally indicates contraction near term.
Trade Transportation & Utilities increased payrolls by 1,900 jobs over the month. April increases were driven by gains in Retail Trade and Transportation Warehousing & Utilities. Job growth remains weak but positive in the super sector with payrolls up 6,300 jobs or 1.0 percent over the year. All of the job growth was due to gains in Retail Trade, up 10,400 jobs or 3.5 percent. More than half of the new jobs have been at General Merchandise Stores and Food and Beverage Stores which have added a combined total of 6,200 jobs over the year. Fastest growth has been at Building Material and Garden Equipment and Supplies Dealers, up 1,500 jobs or 6.8 percent. Weak global demand and a strong dollar has impacted Wholesale Trade, down 3,000 jobs or 1.7 percent over the year, and Transportation, Warehousing, and Utilities, down 1,100 jobs or 0.8 percent over the year. Truck transportation companies have been hit particularly hard with payrolls down 1,100 jobs or 4.2 percent over the year.
Information added 700 jobs in April and over the year, up 2.2 percent. About half of the MSA’s employment in information resides in telecommunications where payrolls were up 200 jobs or 1.4 percent over the year. The remainder of jobs in the industry sector are found in newspaper and periodical publishing, software publishing, motion picture and sound recording, and data processing hosting and related services.
Financial Activities reported a loss of 400 jobs in April resulting from declines in Real Estate and Rental and Leasing. The super sector added 1,300 jobs over the year representing a 0.9 percent
August 2008161,400
January 2010137,700
April 2016148,300
April 2016438
400
600
800
1,000
1,200
1,400
1,600
1,800
2,000
2,200
100,000
120,000
140,000
160,000
180,000
200,000
220,000
Jan
-05
May-
05
Sep
-05
Jan
-06
May-
06
Sep
-06
Jan
-07
May-
07
Sep
-07
Jan
-08
May-
08
Sep
-08
Jan
-09
May-
09
Sep
-09
Jan
-10
May-
10
Sep
-10
Jan
-11
May-
11
Sep
-11
Jan
-12
May-
12
Sep
-12
Jan
-13
May-
13
Sep
-13
Jan
-14
May-
14
Sep
-14
Jan
-15
May-
15
Sep
-15
Jan
-16
Figure 6. Durable Goods Manufacturing
Durable Goods Manufacturing Total U.S. Rig Count
September 20082,014
June 2009895
December 2014180,900
September 20141,930
Loss of 23,700 Jobs(14.7%) Over 17 Months Loss of 32,600 Jobs
(18.0%) Over 16 Months
05.26.2016
6
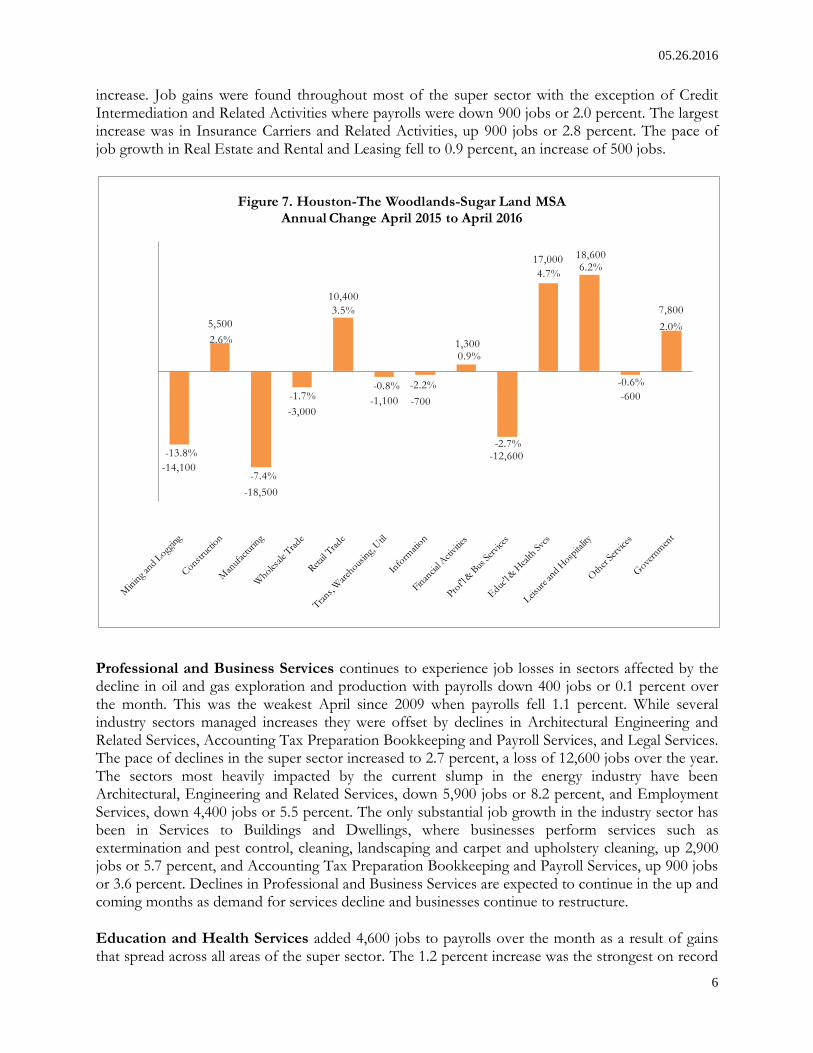
increase. Job gains were found throughout most of the super sector with the exception of Credit Intermediation and Related Activities where payrolls were down 900 jobs or 2.0 percent. The largest increase was in Insurance Carriers and Related Activities, up 900 jobs or 2.8 percent. The pace of job growth in Real Estate and Rental and Leasing fell to 0.9 percent, an increase of 500 jobs.
Professional and Business Services continues to experience job losses in sectors affected by the decline in oil and gas exploration and production with payrolls down 400 jobs or 0.1 percent over the month. This was the weakest April since 2009 when payrolls fell 1.1 percent. While several industry sectors managed increases they were offset by declines in Architectural Engineering and Related Services, Accounting Tax Preparation Bookkeeping and Payroll Services, and Legal Services. The pace of declines in the super sector increased to 2.7 percent, a loss of 12,600 jobs over the year. The sectors most heavily impacted by the current slump in the energy industry have been Architectural, Engineering and Related Services, down 5,900 jobs or 8.2 percent, and Employment Services, down 4,400 jobs or 5.5 percent. The only substantial job growth in the industry sector has been in Services to Buildings and Dwellings, where businesses perform services such as extermination and pest control, cleaning, landscaping and carpet and upholstery cleaning, up 2,900 jobs or 5.7 percent, and Accounting Tax Preparation Bookkeeping and Payroll Services, up 900 jobs or 3.6 percent. Declines in Professional and Business Services are expected to continue in the up and coming months as demand for services decline and businesses continue to restructure.
Education and Health Services added 4,600 jobs to payrolls over the month as a result of gains that spread across all areas of the super sector. The 1.2 percent increase was the strongest on record
-14,100
5,500
-18,500
-3,000
10,400
-1,100 -700
1,300
-12,600
17,000 18,600
-600
7,800
-13.8%
2.6%
-7.4%
-1.7%
3.5%
-0.8% -2.2%
0.9%
-2.7%
4.7%6.2%
-0.6%
2.0%
Figure 7. Houston-The Woodlands-Sugar Land MSAAnnual Change April 2015 to April 2016
Information is the only sector reporting a loss, down 1,500 jobs. Information is the only sector reporting a loss, down 1,500 jobs.
05.26.2016
7
dating back to 1990. Education and Health Services is the second largest contributor of job growth in the H-W-S MSA with payrolls up 17,000 jobs or 4.7 percent over the year. All subsectors were reporting healthy over-the-year increases with strongest gains at Hospitals, up 5,200 jobs or 6.4 percent. Leisure and Hospitality added 4,000 jobs in April. The 1.3 percent seasonal increase was slightly weaker than a 1.5 percent increase in 2015. Leisure and Hospitality continues to be the fastest growing super sector in the H-W-S MSA although the pace of job growth has fallen nearly two percent from 8.0 percent in January to 6.2 percent. The super sector is also the largest contributor of new jobs with payrolls up 18,600 jobs over the year. While all subsectors were reporting increases, most of the new jobs are found in Food Services and Drinking Places, up 15,700 jobs or 6.5 percent.
Employment in Other Services was unchanged in April with payrolls down 600 jobs or 0.6 percent over the year. Other Services is partially comprised of various repair service companies (industrial equipment, mining machinery and equipment, and many others related to the oil and gas industry). Additional establishments in this category include personal care services, dry cleaning and laundry services, and religious and social advocacy organizations.
Government reduced payrolls by 600 in April as a result of declines in Local Government Educational Services. Government payrolls were up 7,800 jobs or 2.0 percent over the year. Most of the increase has been in Local Government Educational Services with payrolls up 6,100 jobs or 3.1 percent over the year.
05.26.2016
8
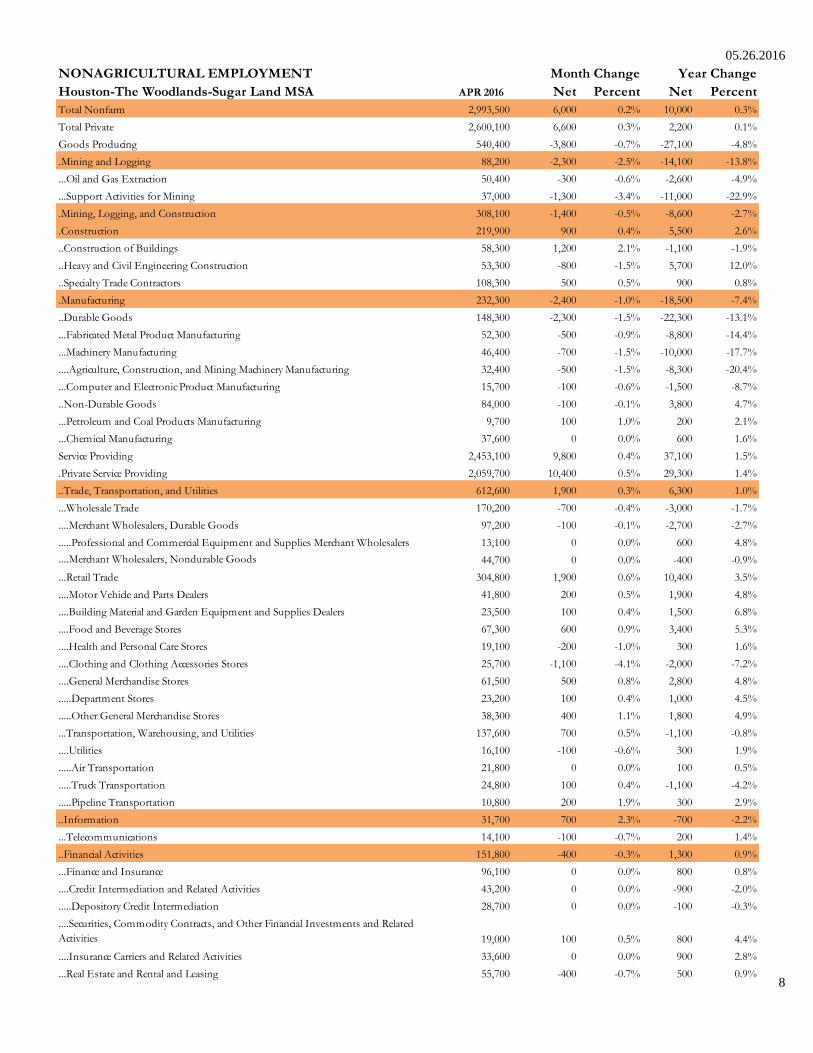
NONAGRICULTURAL EMPLOYMENT
Houston-The Woodlands-Sugar Land MSA APR 2016 Net Percent Net Percent
Total Nonfarm 2,993,500 6,000 0.2% 10,000 0.3%
Total Private 2,600,100 6,600 0.3% 2,200 0.1%
Goods Producing 540,400 -3,800 -0.7% -27,100 -4.8%
.Mining and Logging 88,200 -2,300 -2.5% -14,100 -13.8%
...Oil and Gas Extraction 50,400 -300 -0.6% -2,600 -4.9%
...Support Activities for Mining 37,000 -1,300 -3.4% -11,000 -22.9%
.Mining, Logging, and Construction 308,100 -1,400 -0.5% -8,600 -2.7%
.Construction 219,900 900 0.4% 5,500 2.6%
..Construction of Buildings 58,300 1,200 2.1% -1,100 -1.9%
..Heavy and Civil Engineering Construction 53,300 -800 -1.5% 5,700 12.0%
..Specialty Trade Contractors 108,300 500 0.5% 900 0.8%
.Manufacturing 232,300 -2,400 -1.0% -18,500 -7.4%
..Durable Goods 148,300 -2,300 -1.5% -22,300 -13.1%
...Fabricated Metal Product Manufacturing 52,300 -500 -0.9% -8,800 -14.4%
...Machinery Manufacturing 46,400 -700 -1.5% -10,000 -17.7%
....Agriculture, Construction, and Mining Machinery Manufacturing 32,400 -500 -1.5% -8,300 -20.4%
...Computer and Electronic Product Manufacturing 15,700 -100 -0.6% -1,500 -8.7%
..Non-Durable Goods 84,000 -100 -0.1% 3,800 4.7%
...Petroleum and Coal Products Manufacturing 9,700 100 1.0% 200 2.1%
...Chemical Manufacturing 37,600 0 0.0% 600 1.6%
Service Providing 2,453,100 9,800 0.4% 37,100 1.5%
.Private Service Providing 2,059,700 10,400 0.5% 29,300 1.4%
..Trade, Transportation, and Utilities 612,600 1,900 0.3% 6,300 1.0%
...Wholesale Trade 170,200 -700 -0.4% -3,000 -1.7%
....Merchant Wholesalers, Durable Goods 97,200 -100 -0.1% -2,700 -2.7%
.....Professional and Commercial Equipment and Supplies Merchant Wholesalers 13,100 0 0.0% 600 4.8%
....Merchant Wholesalers, Nondurable Goods 44,700 0 0.0% -400 -0.9%
...Retail Trade 304,800 1,900 0.6% 10,400 3.5%
....Motor Vehicle and Parts Dealers 41,800 200 0.5% 1,900 4.8%
....Building Material and Garden Equipment and Supplies Dealers 23,500 100 0.4% 1,500 6.8%
....Food and Beverage Stores 67,300 600 0.9% 3,400 5.3%
....Health and Personal Care Stores 19,100 -200 -1.0% 300 1.6%
....Clothing and Clothing Accessories Stores 25,700 -1,100 -4.1% -2,000 -7.2%
....General Merchandise Stores 61,500 500 0.8% 2,800 4.8%
.....Department Stores 23,200 100 0.4% 1,000 4.5%
.....Other General Merchandise Stores 38,300 400 1.1% 1,800 4.9%
...Transportation, Warehousing, and Utilities 137,600 700 0.5% -1,100 -0.8%
....Utilities 16,100 -100 -0.6% 300 1.9%
.....Air Transportation 21,800 0 0.0% 100 0.5%
.....Truck Transportation 24,800 100 0.4% -1,100 -4.2%
.....Pipeline Transportation 10,800 200 1.9% 300 2.9%
..Information 31,700 700 2.3% -700 -2.2%
...Telecommunications 14,100 -100 -0.7% 200 1.4%
..Financial Activities 151,800 -400 -0.3% 1,300 0.9%
...Finance and Insurance 96,100 0 0.0% 800 0.8%
....Credit Intermediation and Related Activities 43,200 0 0.0% -900 -2.0%
.....Depository Credit Intermediation 28,700 0 0.0% -100 -0.3%
....Securities, Commodity Contracts, and Other Financial Investments and Related
Activities 19,000 100 0.5% 800 4.4%
....Insurance Carriers and Related Activities 33,600 0 0.0% 900 2.8%
...Real Estate and Rental and Leasing 55,700 -400 -0.7% 500 0.9%
Month Change Year Change

05.26.2016
9
Houston-The Woodlands-Sugar Land MSA: Includes Austin, Brazoria, Chambers, Ft. Bend, Galveston, Harris, Liberty, Montgomery, and Waller Counties. All Data is Subject To Revision.
Sources: U.S. Department of Labor, BLS, Texas Workforce Commission, Institute for Supply Management, Baker Hughes Incorporated, Kiley Advisors, Metrostudy, and The Federal Reserve Bank of Dallas.
NONAGRICULTURAL EMPLOYMENT
Houston-The Woodlands-Sugar Land MSA APR 2016 Net Percent Net Percent
..Professional and Business Services 459,100 -400 -0.1% -12,600 -2.7%
...Professional, Scientific, and Technical Services 216,000 -3,700 -1.7% -4,400 -2.0%
....Legal Services 23,700 -700 -2.9% -600 -2.5%
....Accounting, Tax Preparation, Bookkeeping, and Payroll Services 25,900 -300 -1.1% 900 3.6%
....Architectural, Engineering, and Related Services 66,400 -2,100 -3.1% -5,900 -8.2%
....Computer Systems Design and Related Services 33,500 100 0.3% 200 0.6%
...Management of Companies and Enterprises 35,200 -100 -0.3% -1,400 -3.8%
...Administrative and Support and Waste Management and Remediation Services 207,900 3,400 1.7% -6,800 -3.2%
....Administrative and Support Services 196,200 3,600 1.9% -7,300 -3.6%
.....Employment Services 76,300 1,800 2.4% -4,400 -5.5%
.....Services to Buildings and Dwellings 53,900 1,800 3.5% 2,900 5.7%
..Educational and Health Services 381,900 4,600 1.2% 17,000 4.7%
...Educational Services 58,600 800 1.4% 2,500 4.5%
...Health Care and Social Assistance 323,300 3,800 1.2% 14,500 4.7%
....Ambulatory Health Care Services 150,300 2,200 1.5% 4,100 2.8%
....Hospitals 86,700 800 0.9% 5,200 6.4%
..Leisure and Hospitality 316,900 4,000 1.3% 18,600 6.2%
...Arts, Entertainment, and Recreation 33,000 900 2.8% 2,100 6.8%
...Accommodation and Food Services 283,900 3,100 1.1% 16,500 6.2%
....Accommodation 25,900 100 0.4% 800 3.2%
....Food Services and Drinking Places 258,000 3,000 1.2% 15,700 6.5%
..Other Services 105,700 0 0.0% -600 -0.6%
Government 393,400 -600 -0.2% 7,800 2.0%
.Federal Government 28,000 -100 -0.4% 100 0.4%
.State Government 74,600 0 0.0% 700 0.9%
..State Government Educational Services 41,000 0 0.0% 600 1.5%
.Local Government 290,800 -500 -0.2% 7,000 2.5%
..Local Government Educational Services 205,300 -700 -0.3% 6,100 3.1%
UNEMPLOYMENT RATE APR 2016 MAR 2016 APR 2015
H-W-S MSA 4.8 4.9 4.1
Texas (Actual) 4.2 4.5 4.1
United States (Actual) 4.7 5.1 5.1
Month Change Year Change
Employment Trends among Workers 65 and Over in the Gulf Coast
Prepared May 2016
Data Source(s):
Data Source(s): EMSI proprietary estimates based on the Quarterly Census of Employment and Wages (QCEW) from the Bureau of Labor Statistics (BLS) and the Bureau of Economic Analysis (BEA).
Census Bureau: Quarterly Workforce Indicators (QWI)
Workforce Solutions is an affiliate of the Gulf Coast Workforce Board, which manages a regional system that helps employers solve their workforce problems and residents build careers so both can compete in the global economy. The workforce system serves the City of Houston
and the surrounding 13 Texas Gulf Coast counties including: Austin, Brazoria, Chambers, Colorado, Fort Bend, Galveston, Harris, Liberty, Matagorda, Montgomery, Walker, Waller, and Wharton.

2 | P a g e
Overview One of the most profound implications for the workforce has been the rise in life expectancy over the last century. According to the Centers for Disease Control, average life expectancy in the United States in 1901 stood at 54.4 years. By 1951 this had risen to 68.4 years and by 2011 had reached a high of 78.7 years. Improvements in living conditions and access to higher quality health care has resulted in individuals living longer and therefore remaining in the workforce beyond what has typically been viewed as “retirement age.” Furthermore, the lingering effects of the 2008 recession on retirement savings has prompted many individuals to continue working out of necessity. Given our awareness of these forces, it is important to understand the role of older individuals in the workforce so that we may identify current and future opportunities for this segment of the population.
Past and Future Population Growth in the Gulf Coast As of 2015 there were 6.8 million residents within the 13-county Gulf Coast region. 1.4 million of these individuals were added between 2005 and 2015 for 10-year growth rate of 26 percent. Estimates produced by Economic Modeling Specialists International (EMSI) predict that our region will be home to 7.5 million residents by 2025 for an 11-percent increase. This indicates that growth is likely to continue yet at a slower pace than over the previous decade. This is reconfirmed by observing past and predicted year-over-year growth rates which indicate that the fastest growth was recorded in 2006 with a 3.6-percent increase, slowing to 1.9 percent in 2015 and projected to further slow to as little as 0.3 percent by 2025 (see Chart 1).
Chart 1. Gulf Coast Region Year-Over-Year Percent Change in Population, 2005 to 2025
20063.6%
20151.9%
20250.3%
0.0%
0.5%
1.0%
1.5%
2.0%
2.5%
3.0%
3.5%
4.0%
3 | P a g e
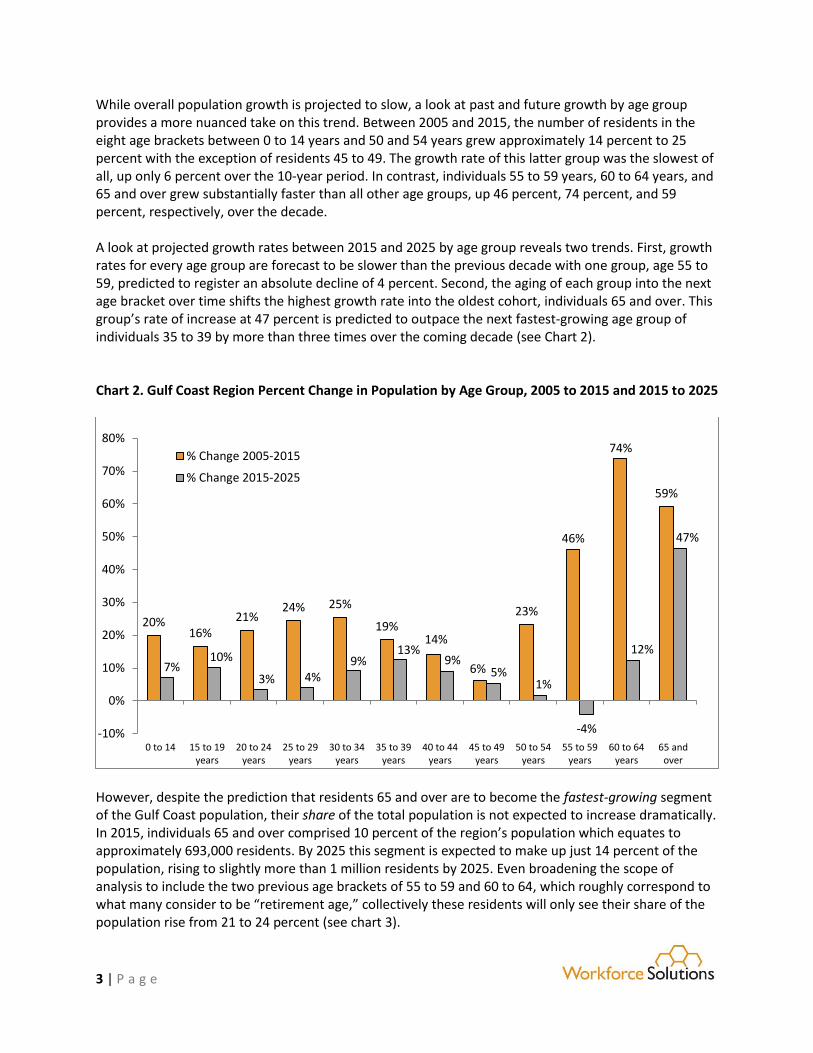
While overall population growth is projected to slow, a look at past and future growth by age group provides a more nuanced take on this trend. Between 2005 and 2015, the number of residents in the eight age brackets between 0 to 14 years and 50 and 54 years grew approximately 14 percent to 25 percent with the exception of residents 45 to 49. The growth rate of this latter group was the slowest of all, up only 6 percent over the 10-year period. In contrast, individuals 55 to 59 years, 60 to 64 years, and 65 and over grew substantially faster than all other age groups, up 46 percent, 74 percent, and 59 percent, respectively, over the decade. A look at projected growth rates between 2015 and 2025 by age group reveals two trends. First, growth rates for every age group are forecast to be slower than the previous decade with one group, age 55 to 59, predicted to register an absolute decline of 4 percent. Second, the aging of each group into the next age bracket over time shifts the highest growth rate into the oldest cohort, individuals 65 and over. This group’s rate of increase at 47 percent is predicted to outpace the next fastest-growing age group of individuals 35 to 39 by more than three times over the coming decade (see Chart 2).
Chart 2. Gulf Coast Region Percent Change in Population by Age Group, 2005 to 2015 and 2015 to 2025
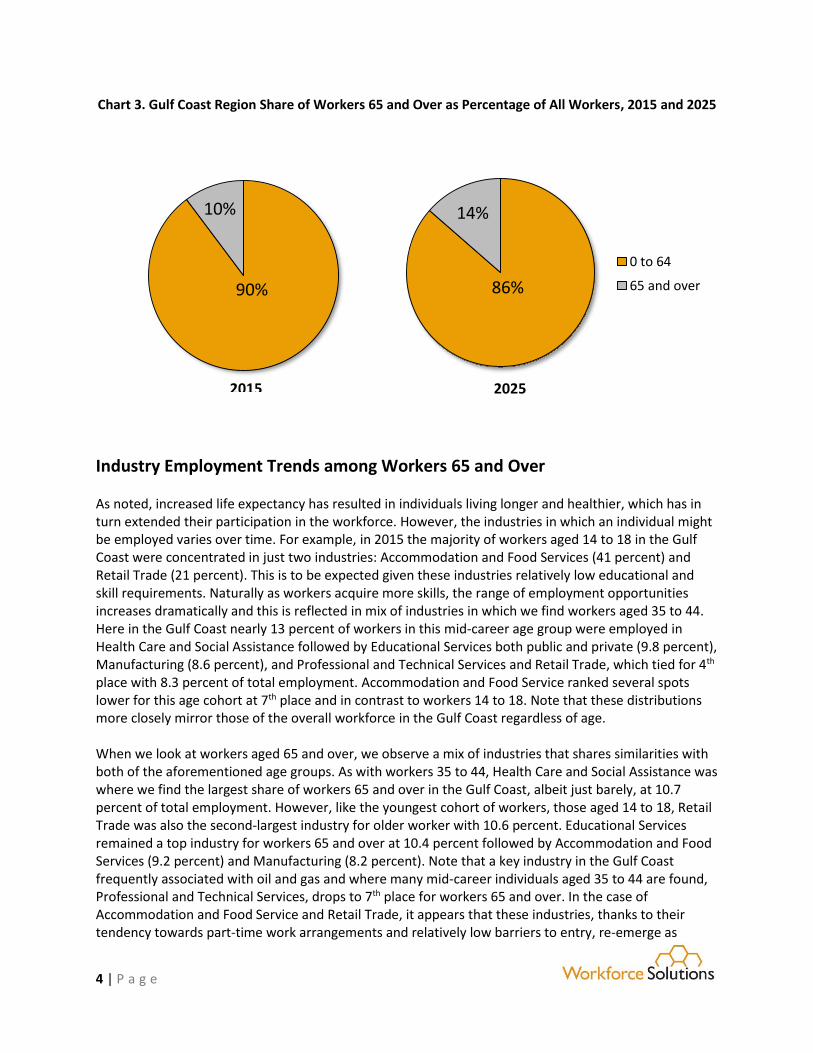
However, despite the prediction that residents 65 and over are to become the fastest-growing segment of the Gulf Coast population, their share of the total population is not expected to increase dramatically. In 2015, individuals 65 and over comprised 10 percent of the region’s population which equates to approximately 693,000 residents. By 2025 this segment is expected to make up just 14 percent of the population, rising to slightly more than 1 million residents by 2025. Even broadening the scope of analysis to include the two previous age brackets of 55 to 59 and 60 to 64, which roughly correspond to what many consider to be “retirement age,” collectively these residents will only see their share of the population rise from 21 to 24 percent (see chart 3).
20%16%
21%24% 25%
19%14%
6%
23%
46%
74%
59%
7%10%
3% 4%9%
13%9%
5%1%
-4%
12%
47%
-10%
0%
10%
20%
30%
40%
50%
60%
70%
80%
0 to 14 15 to 19years
20 to 24years
25 to 29years
30 to 34years
35 to 39years
40 to 44years
45 to 49years
50 to 54years
55 to 59years
60 to 64years
65 andover
% Change 2005-2015
% Change 2015-2025
4 | P a g e
Chart 3. Gulf Coast Region Share of Workers 65 and Over as Percentage of All Workers, 2015 and 2025
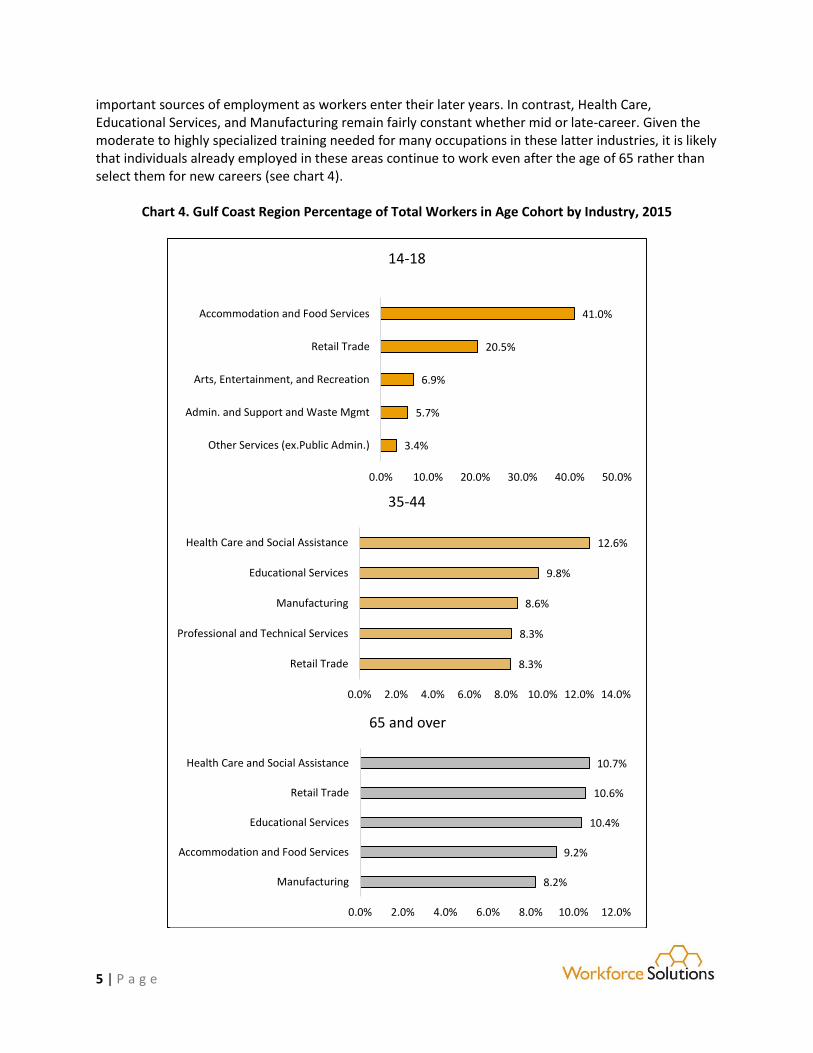
Industry Employment Trends among Workers 65 and Over As noted, increased life expectancy has resulted in individuals living longer and healthier, which has in turn extended their participation in the workforce. However, the industries in which an individual might be employed varies over time. For example, in 2015 the majority of workers aged 14 to 18 in the Gulf Coast were concentrated in just two industries: Accommodation and Food Services (41 percent) and Retail Trade (21 percent). This is to be expected given these industries relatively low educational and skill requirements. Naturally as workers acquire more skills, the range of employment opportunities increases dramatically and this is reflected in mix of industries in which we find workers aged 35 to 44. Here in the Gulf Coast nearly 13 percent of workers in this mid-career age group were employed in Health Care and Social Assistance followed by Educational Services both public and private (9.8 percent), Manufacturing (8.6 percent), and Professional and Technical Services and Retail Trade, which tied for 4th place with 8.3 percent of total employment. Accommodation and Food Service ranked several spots lower for this age cohort at 7th place and in contrast to workers 14 to 18. Note that these distributions more closely mirror those of the overall workforce in the Gulf Coast regardless of age. When we look at workers aged 65 and over, we observe a mix of industries that shares similarities with both of the aforementioned age groups. As with workers 35 to 44, Health Care and Social Assistance was where we find the largest share of workers 65 and over in the Gulf Coast, albeit just barely, at 10.7 percent of total employment. However, like the youngest cohort of workers, those aged 14 to 18, Retail Trade was also the second-largest industry for older worker with 10.6 percent. Educational Services remained a top industry for workers 65 and over at 10.4 percent followed by Accommodation and Food Services (9.2 percent) and Manufacturing (8.2 percent). Note that a key industry in the Gulf Coast frequently associated with oil and gas and where many mid-career individuals aged 35 to 44 are found, Professional and Technical Services, drops to 7th place for workers 65 and over. In the case of Accommodation and Food Service and Retail Trade, it appears that these industries, thanks to their tendency towards part-time work arrangements and relatively low barriers to entry, re-emerge as
90%
10%
2015
86%
14%
0 to 64
65 and over
2025
5 | P a g e
important sources of employment as workers enter their later years. In contrast, Health Care, Educational Services, and Manufacturing remain fairly constant whether mid or late-career. Given the moderate to highly specialized training needed for many occupations in these latter industries, it is likely that individuals already employed in these areas continue to work even after the age of 65 rather than select them for new careers (see chart 4).
Chart 4. Gulf Coast Region Percentage of Total Workers in Age Cohort by Industry, 2015
3.4%
5.7%
6.9%
20.5%
41.0%
0.0% 10.0% 20.0% 30.0% 40.0% 50.0%
Other Services (ex.Public Admin.)
Admin. and Support and Waste Mgmt
Arts, Entertainment, and Recreation
Retail Trade
Accommodation and Food Services
14-18
8.3%
8.3%
8.6%
9.8%
12.6%
0.0% 2.0% 4.0% 6.0% 8.0% 10.0% 12.0% 14.0%
Retail Trade
Professional and Technical Services
Manufacturing
Educational Services
Health Care and Social Assistance
35-44
8.2%
9.2%
10.4%
10.6%
10.7%
0.0% 2.0% 4.0% 6.0% 8.0% 10.0% 12.0%
Manufacturing
Accommodation and Food Services
Educational Services
Retail Trade
Health Care and Social Assistance
65 and over
6 | P a g e
Occupational Employment Trends among Workers 65 and Over Having examined the industries where we find the highest concentrations of workers 65 and over, it is not surprising that we find workers concentrated in occupations that reflect these industries. As before, it is instructive to compare older workers to early and mid-career individuals as context. Roughly half of all workers 65 and over were found in 41 out of a possible 800 or so occupations. In contrast, half of all workers aged 14-18 were found in just 7 occupations, echoing the limited range of opportunities available to this group, while workers 35-44 were relatively more dispersed with around half concentrated in 49 occupations. A recurring challenge when analyzing large numbers of occupations is choosing the appropriate criteria for categorizing them. In the previous section we noted that workers 65 and over tend to be concentrated in two to three types of industries, low-skill and high-skill services and to a lesser extent Manufacturing. We also noted that the educational and skill requirements for these industries vary widely. For workers in the early to mid-stages of their careers, the educational requirements needed to enter a profession are an important consideration as they often dictate the type and amount of education pursued. However, for older workers who likely have many years of experience, the amount of on-the-job training required is a more useful means of evaluating occupations followed by education. Based on the above criteria, a slight majority of the 41 occupations where we find half of all workers 65 and over require only short-term on-the-job training, which is defined as one month or less needed to acquire proficiency. The single-largest occupation for this age group of workers was General Office Clerks at 4.3 percent. Overall, many of these occupations are variations of clerical, retail, food preparation, and maintenance jobs and therefore wages are relatively low ranging from $18,000 per year to $33,000 per year. Nonetheless, for older individuals seeking to re-enter the workforce on a part-time or otherwise limited basis, these occupations may be worthy of consideration given their comparatively minimal time and skill investment in order to achieve proficiency (see chart 5).
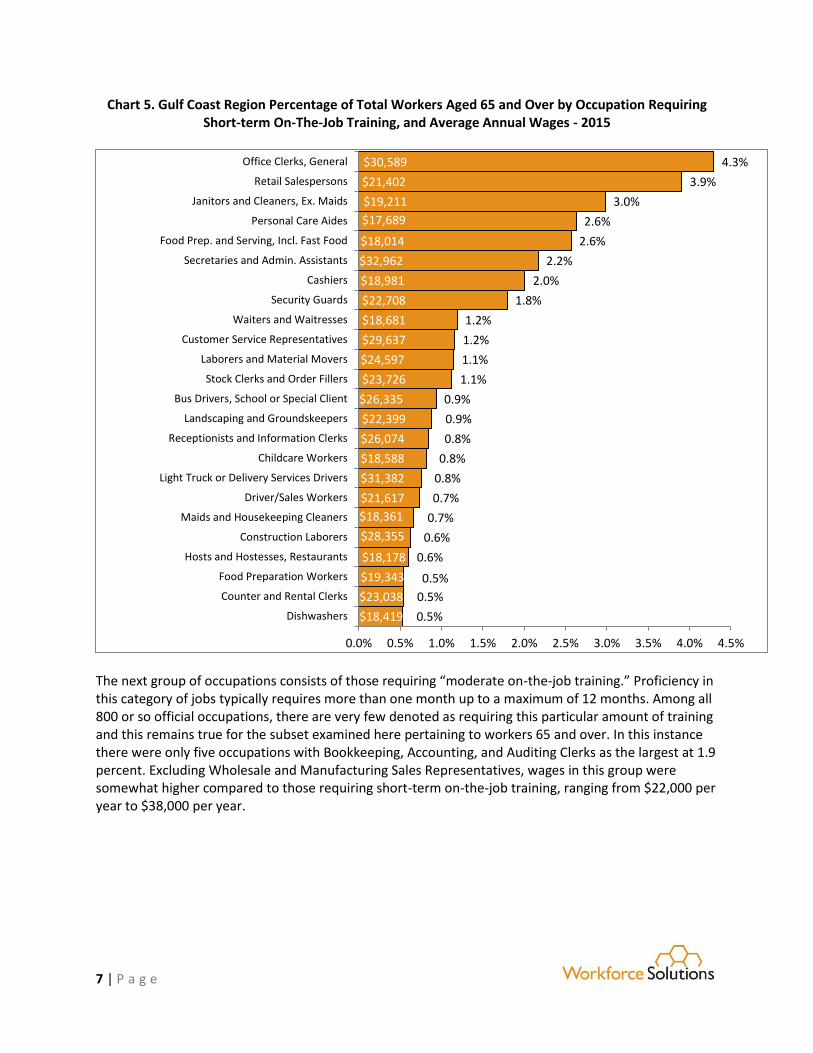
7 | P a g e
Chart 5. Gulf Coast Region Percentage of Total Workers Aged 65 and Over by Occupation Requiring Short-term On-The-Job Training, and Average Annual Wages - 2015
The next group of occupations consists of those requiring “moderate on-the-job training.” Proficiency in this category of jobs typically requires more than one month up to a maximum of 12 months. Among all 800 or so official occupations, there are very few denoted as requiring this particular amount of training and this remains true for the subset examined here pertaining to workers 65 and over. In this instance there were only five occupations with Bookkeeping, Accounting, and Auditing Clerks as the largest at 1.9 percent. Excluding Wholesale and Manufacturing Sales Representatives, wages in this group were somewhat higher compared to those requiring short-term on-the-job training, ranging from $22,000 per year to $38,000 per year.
0.5%
0.5%
0.5%
0.6%
0.6%
0.7%
0.7%
0.8%
0.8%
0.8%
0.9%
0.9%
1.1%
1.1%
1.2%
1.2%
1.8%
2.0%
2.2%
2.6%
2.6%
3.0%
3.9%
4.3%
$18,419
$23,038
$19,343
$18,178
$28,355
$18,361
$21,617
$31,382
$18,588
$26,074
$22,399
$26,335
$23,726
$24,597
$29,637
$18,681
$22,708
$18,981
$32,962
$18,014
$17,689
$19,211
$21,402
$30,589
0.0% 0.5% 1.0% 1.5% 2.0% 2.5% 3.0% 3.5% 4.0% 4.5%
Dishwashers
Counter and Rental Clerks
Food Preparation Workers
Hosts and Hostesses, Restaurants
Construction Laborers
Maids and Housekeeping Cleaners
Driver/Sales Workers
Light Truck or Delivery Services Drivers
Childcare Workers
Receptionists and Information Clerks
Landscaping and Groundskeepers
Bus Drivers, School or Special Client
Stock Clerks and Order Fillers
Laborers and Material Movers
Customer Service Representatives
Waiters and Waitresses
Security Guards
Cashiers
Secretaries and Admin. Assistants
Food Prep. and Serving, Incl. Fast Food
Personal Care Aides
Janitors and Cleaners, Ex. Maids
Retail Salespersons
Office Clerks, General

8 | P a g e
Chart 5. Gulf Coast Region Percentage of Total Workers Aged 65 and Over by Occupation Requiring Moderate On-The-Job Training, and Average Annual Wages - 2015
Occupations requiring long-term on-the-job training, defined as more than 12 months to attain proficiency, and/or some postsecondary education comprised the third and final category. Heavy and Tractor-Trailer Truck Drivers were the largest occupation in this group with 1.5 percent of all workers 65 and over in the Gulf Coast. Other occupations included two related to health care and five related to primary and secondary education with the remaining three representing a more diverse collection, namely Accountants and Auditors, Maintenance and Repair Workers, and Civil Engineers. Excluding the latter occupation given that its wages represent an outlier, wages for the other jobs in this category ranged from $20,000 per year to as much as $75,000 per year. As noted previously, the relatively high concentrations of workers 65 and over in some of these occupations is likely the result of industry professionals continuing in their corresponding fields beyond the age of 65 rather than individuals entering them for the first time. This may also be true of the aforementioned education-related occupations however it is important to acknowledge the shift towards alternative teaching certificates. As an increasingly common tool used to address teacher shortages, these credentials allow for individuals to immediately begin teaching while simultaneously completing required training. As a result, the opportunity cost of achieving gainful employment versus the time spent in training is partially avoided. For workers 65 and over with many years of experience, this may allow them repurpose a lifetime of skills for a new career requiring a relatively short investment of time and resources.
0.6%
0.7%
0.8%
1.3%
1.9%
$37,818
$21,591
$31,328
$62,543
$37,369
0.0% 0.5% 1.0% 1.5% 2.0% 2.5%
Inspectors, Testers, Sorters, Samplers, & Weighers
Cooks, Restaurant
Medical Secretaries
Sales Reps, Wholesale and Mfg, Ex. Tech Products
Bookkeeping, Accounting, & Auditing Clerks
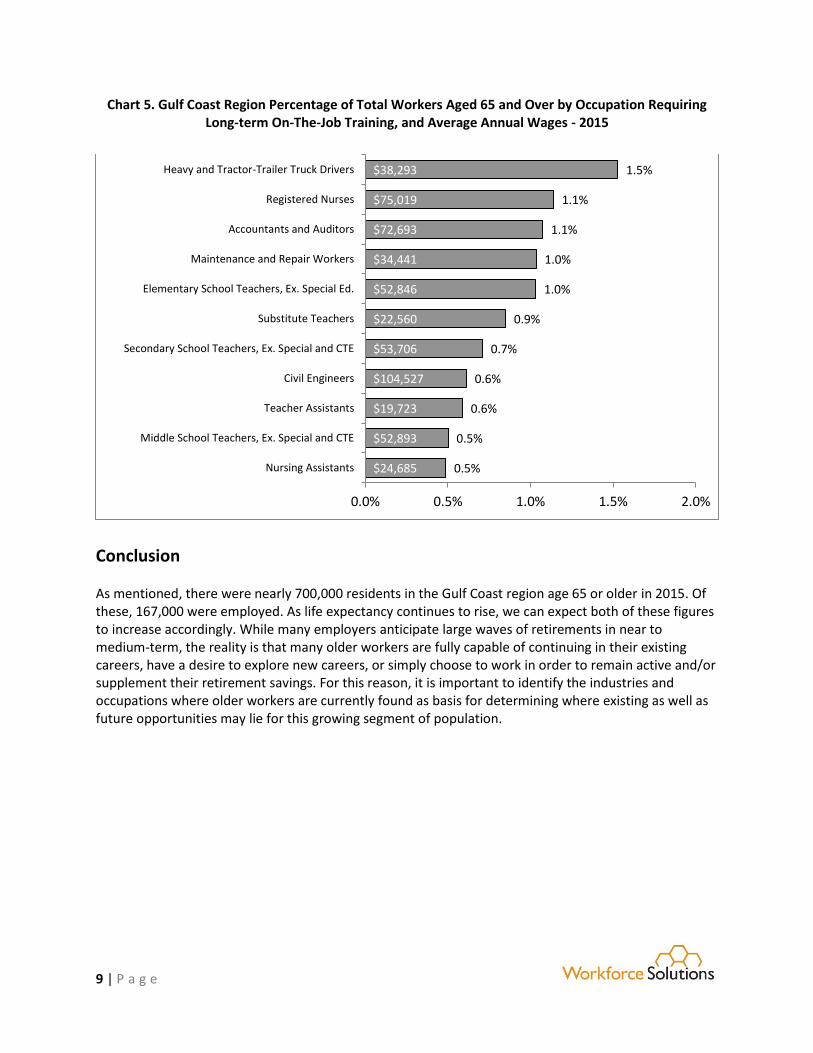
9 | P a g e
Chart 5. Gulf Coast Region Percentage of Total Workers Aged 65 and Over by Occupation Requiring Long-term On-The-Job Training, and Average Annual Wages - 2015
Conclusion As mentioned, there were nearly 700,000 residents in the Gulf Coast region age 65 or older in 2015. Of these, 167,000 were employed. As life expectancy continues to rise, we can expect both of these figures to increase accordingly. While many employers anticipate large waves of retirements in near to medium-term, the reality is that many older workers are fully capable of continuing in their existing careers, have a desire to explore new careers, or simply choose to work in order to remain active and/or supplement their retirement savings. For this reason, it is important to identify the industries and occupations where older workers are currently found as basis for determining where existing as well as future opportunities may lie for this growing segment of population.
0.5%
0.5%
0.6%
0.6%
0.7%
0.9%
1.0%
1.0%
1.1%
1.1%
1.5%
$24,685
$52,893
$19,723
$104,527
$53,706
$22,560
$52,846
$34,441
$72,693
$75,019
$38,293
0.0% 0.5% 1.0% 1.5% 2.0%
Nursing Assistants
Middle School Teachers, Ex. Special and CTE
Teacher Assistants
Civil Engineers
Secondary School Teachers, Ex. Special and CTE
Substitute Teachers
Elementary School Teachers, Ex. Special Ed.
Maintenance and Repair Workers
Accountants and Auditors
Registered Nurses
Heavy and Tractor-Trailer Truck Drivers