Embed Size (px)
Citation preview


TO IMPROVE IS TO CHANGE. IF WE WANT TO CHANGE THINGS FOR THE BETTER, WE HAVE TO TAKE THINGS INTO YOUR OWN HANDS.
CONTENTSWHO WE AREAt a glanceGroup StructureCorporate Information
LEADERSHIPExecutive Chairman’s StatementRemembering a Visionary LeaderBoard of DirectorsExecutive Team
CORPORATE GOVERNANCECorporate Governance Report
STATUTORY DISCLOSURESStatement of ComplianceStatement of Directors’ ResponsibilitiesSecretary’s CertificateDirectors’ ReportOther Statutory DisclosuresList of Directors - Subsidiaries
FINANCIAL STATEMENTSSummary of Published ResultsIndependent Auditor’s ReportFinancial StatementsNotes to the Financial Statements
101213
16202227
30
535455565859
62636874
DEAR SHAREHOLDER
Tommy Ah TeckExecutive Chairman
The Board of Directors is pleased to present to you the Annual Report of Gamma Civic Ltd (“Gamma” or “the Company”) for the year ended 31 December 2020, the contents of which are listed hereafter.
This report was approved by the Board of Directors on 30 March 2021.

QUALITY COMES FROM PASSION OF CREATING.

AT A GLANCE AT A GLANCE
228MRs
Profit after tax
372MRs
EBITDA1.23Rs
Earnings per share
1.50Rs
Dividend per share28.95Rs
Share price
10%Net gearing ratio
4.6%Average cost of debts
4,617MRs
Turnover43MRs 82to NGOs
In 2020, the Group provided support of Rs7M to 46 NGOs, of which Rs3M was via Gamma Foundation.
Since 2011, Gamma Foundation has supported initiatives totalling Rs43M, across 82 partner NGOs.
Employees at 31 December 20201,525
Gamma Construction Ltd
Kolos Cement Ltd
Lottotech Ltd
Gamma Materials Ltd
Hilton Mauritius Resort & Spa (owned by Morning Light Co. Ltd)
Gamma Civic Ltd
41%
5%
8%
25%
19%
2%
Training Hours of staff were in our employment for over 5 years
of staff were in our employment for over 10 years
6,068 45%
26%
10 11

CORPORATE INFORMATION
BOARD OF DIRECTORS
Chian Yew (Carl) Ah Teck, BSc, MPhil Executive Chairman until his demise on 10 April 2020
Chian Tat (Tommy) Ah Teck, BSc, MPhil Non-executive Vice Chairman until his appointment as Executive Chairman on 20 April 2020
Boon Hui Chan, CFA Independent Non-executive Director
Chian Luck (Patrice) Ah Teck, BA Non-executive Director (appointed as Vice Chairman on 7 August 2020)
Jack Michael Jason (Jason) Ah Teck, BEng, MA Executive Director (appointed on 20 April 2020)
Jean-Claude Lam Hung BA, FCA Non-executive Director
Lim Sit Chen (Maurice) Lam Pak Ng, MBA Independent Non-executive Director
Sui Lien (Marie Claire) Chong Ah-Yan, BA, Btech(HRM) Non-executive Director
Paul Halpin, B Comm, FCA Independent Non-executive Director
Twalha Dhunnoo, BA, MA, MEng, FCA Chief Financial Officer/Executive Director
AUDITORS
Ernst & YoungChartered AccountantsLevel 9, Tower 1, NeXTeracomCybercityEbèneMauritius
REGISTERED OFFICE
Royal RoadChapman HillBeau BassinMauritius
PRINCIPAL PLACE OF BUSINESS
4th Floor, HSBC Centre18 Bank Street, CybercityEbène 72201Mauritius
COMPANY SECRETARY
Gamma Corporate Services LtdRoyal Road, Chapman HillBeau BassinMauritius
BANKERS
ABC Banking Corporation LtdAfrAsia Bank LimitedBank One LimitedAbsa Bank (Mauritius) LimitedHongKong and Shanghai Banking Corporation LtdMauBank LtdSBM Bank (Mauritius) LtdThe Mauritius Commercial Bank Ltd
GROUP STRUCTURE
Contracting
Building Materials
Hospitality
Properties & Real Estate
Lottery
Financial Services
(Gamma Civic Ltd)
12 13

CREATING LIFE CHANGING ENTERTAINMENT.

I will move forward with the same drive and valour and will further the vision and the ‘dare-to-dream’ philosophy which Carl inspired us with.
DEAR VALUED SHAREHOLDER
On 10th April 2020, Carl Ah Teck passed away. Carl was my elder brother, Executive Chairman, and co-founder of Gamma Civic Ltd (“Gamma” or the “Company”). The passing away of Carl is the single most painful event in the history of Gamma; further amplified in a year with unforeseen challenges for everyone and putting our business agility and resilience to test in straining circumstances.
My opening statement to you, as your new Executive Chairman, pays a worthy tribute to the visionary leader that Carl was and with a celebration of some of the achievements that he pioneered for Gamma and country. I have been close to Carl since the very beginning of our journey in Gamma. Under Carl’s leadership, Gamma Civic Ltd flourished from a start-up in construction 35 years ago into one of the most important and significant economic operators of Mauritius. Gamma, listed on the Official List of the Stock Exchange of Mauritius Ltd (“SEM”), is consistently in the top 10 best performing investment holding companies since its listing. Our portfolio includes established companies commanding leading market presence in our respective sectors and segments. Gamma’s business principles have allowed us to conclude successful strategic partnerships with leading multinationals such as Holcim Ltd, Colas Group and Hilton International. We have demonstrated our ability to create superior shareholder value with the successfully listing of greenfield projects like Lottotech Ltd and Kolos Cement Ltd on the SEM in recent years.
The above are some of the realisations that we proudly measure Gamma’s drive for success and will epitomise Carl’s legacy for future generations.
It is my pledge to you that I will move forward with the same drive and valour and will further the vision and the “dare-to-dream” philosophy which Carl inspired us with. I fully underwrite the same values and principles; our ability to create value, our hard work and disciplined execution and our integrity and reputation will continue to be our standards of reference.
2020; a Year of Unprecedented Challenges
I took over as Executive Chairman during one of the most challenging times that global markets ever experienced, during a time when economies were in lockdown and when visibility was uncertain. The Mauritian economy was under strain with the tourism sector at a complete stop and with the export industries in crisis.
In such trying circumstances, it was important that I established important priorities to ensure business continuity. Ensuring the well-being of our employees was central to our crisis management together with operational and cashflow resilience of our companies. The quick transformative changes we implemented and the inherent resilience that we had built enabled us to navigate the uncertainty with confidence. Financial and operational metrics were carefully optimised, and I am very pleased with our full year financial results which is a reflection of the sacrifice and efforts we put in. Importantly, these results will enable us to uphold our dividend promise to shareholders.
At the same time as managing the 2020 crisis, I am continuously working with the senior management teams on the more strategic matters to ensure growth and value creation. We are actively looking at new opportunities, both locally and internationally. Achieving further incremental diversification in our portfolio of businesses will be the next milestone I will be reporting to you. Our 2020 results already substantiate the steps we have taken in this direction with 20% contribution to our profit figure arising from a recently acquired re-insurance business with originating capabilities in 32 countries in Africa.
At the time of approving the annual report and accounts, the board of directors will be asked to approve the implementation of a multi-currency notes programme through which the Company may issue up to a maximum of Rs3billion of notes to access longer term funding. This will be a key strategic resource for the investment holding company to implement our strategic growth ambitions.
I have full confidence that we have the expert leadership and the robust governance and risk management to deliver the objectives we are setting ourselves. We remain ready to embrace new innovative business practices and fresh-thinking and to emerge as agile and fast-growing. Gamma has a robust balance sheet and the capabilities and focus to achieve its global ambitions.
Financial and Business Performance
The 2020 pandemic crisis adversely dented the consecutive year on year growth in profitability that Gamma reported between 2017 to 2019, with 2019 being historically the best financial performance on records for Gamma.
Our revenue for the year ended 31 December 2020 was Rs3.7billion, in line with the figure reported for the prior year. This is a validation of the resilience of the Group, emerging from a 10-week national confinement period between 20 March and 6 June 2020, where all activities were stopped.
17

EXECUTIVE CHAIRMAN’S STATEMENT EXECUTIVE CHAIRMAN’S STATEMENT
Our businesses were able successfully to catch-up on their planned activities for 2020 and to honour our commitments to our stakeholders. However, the nature of the fixed overheads inherent in our businesses leveraged during the period of lockdown meant that profitability for 2020 was adversely impacted with a profit after tax of Rs228M compared to Rs596M for 2019, a reduction of 62%.
Building Materials
Our presence in the building materials sector is through Gamma Materials Ltd and Kolos Cement Ltd.
Gamma Materials Ltd is our joint venture with Ingenerie et Participations Financieres (“IPF”), a fully owned subsidiary of Colas SA. Like all other businesses in Mauritius, operational activities ceased during the period of lockdown and this impacted on both revenue and profitability. Despite these challenges, Gamma Materials Ltd reported a profit of Rs134M (2019: Rs252M) whilst revenue reduced to Rs1,632M in 2020 compared to Rs2,162M in 2019.
Kolos Cement Ltd, a subsidiary, reported revenue of Rs1.4 billion in 2020 in line with the 2019 figure of Rs1.5billion. The business faced challenging circumstances with the increasing cost of raw materials driven by a weakening Mauritian currency and increased freight costs. Despite these challenges however, our disciplined approach and sound operational infrastructure resulted in a healthy profitability for 2020 of Rs145M (Rs176M in 2019).
Lottery
Revenue was directly impacted with the suspension of operations in compliance with Government order for national lockdown. This resulted in a reduced revenue figure of Rs 959M in 2020 compared to Rs1,355M in 2019. This revenue reduction and the impact of fixed costs during the lockdown period adversely impacted profitability with a reported profit after tax of Rs61M (Rs156M in 2019). To increase its product range and provide diversification in its activities, Lottotech launched, on 30 October 2020, a modernised version of the Loterie Vert which has been a household brand in Mauritius for decades. The impact of Loterie Vert on the results of the Group will be evident in 2021.
To ensure a more optimum operational infrastructure, the senior management team of Lottotech is engaging proactively with their regulators to launch a ready-made digital platform to the customers which will enhance user-experience as well as ensuring optimum compliance with the objectives of Anti-Money Laundering and the Combating of Financing of Terrorism regulations.
Lottotech remains committed to be an important economic operator of Mauritius and be a key socio-economic promotor through its active CSR involvement, its Responsible Gaming initiatives, and its significant contribution to the Consolidated Fund of the Government of Mauritius.
Construction
Despite the 10-week period of national lockdown, the revenue figure reported for Gamma Construction amounted to Rs1,348M compared to Rs949M in 2019. This was mainly attributable to major public and building projects that were completed in this challenging period. However, honouring our timely commitments to our important customers came at a cost. This and the high fixed-cost structure of this business resulted in an adverse impact on profitability with a loss after tax of Rs21M (2019: profit Rs15M).
Hilton Mauritius Resort & Spa
Our investment in the Hilton Mauritius Resort & Spa through Morning Light Co. Ltd, an associate to the Group, has had the most adverse impact due to the pandemic. The sudden halt to global travelling had a damaging repercussion on the hospitality sector, tourism, one of the pillars of the Mauritian economy. Whilst the visibility on this sector is limited, we have seen a gradual pick-up in tourist arrivals in other similar destinations, like Maldives and Seychelles. To this end, we welcome all the initiatives by the authorities to ensure a gradual and planned re-opening of the borders whilst adhering to the strictest health & safety measures.
Corporate Social Responsibility (CSR)
Our social engagement through a proactive involvement is at the heart of Gamma’s CSR campaign, more so this year as Gamma Foundation celebrated its 10th anniversary, with a contribution to our community with more than Rs30M donated and active participation of the employees and senior management. The Foundation’s core principles echo the United Nation’s Sustainable Development Goals (“SDGs”): reducing poverty, food distribution, better medical conditions for everyone and improvement in education levels.
Gamma contributes through all its clusters to the NGOs such as: Le Vélo vert, Atelier Joie de Vivre, Centre D’Amitié, Ecole des Macons, APRIM, SAPHIRE in collaboration with Federation du Cyclisme and L’école des Flamboyants. We were particularly active during the 2020 lockdown, with the help of the various clusters within the Group, the Foundation has participated in food pack distribution to vulnerable communities and neighbourhoods close to our operations.
Corporate Governance and Risk Management
Upholding the highest levels corporate governance will continue to be high on our agenda as we implement the best decision-making principles in our operations. Our corporate governance report demonstrates our strong adherence to the principles of transparency and disclosure. This will continue to be an ongoing improvement for us as reporting standards and initiatives are evolving globally to ensure that listed companies like Gamma with strong stakeholder engagements reports information, both qualitatively and quantitatively on a reliable and consistent basis.
Our risk management framework is a key component of our governance objectives throughout the Group. This year specifically, more time was devoted to risk management specially in ensuring our operational and financial resilience in such uncertain times. Various initiatives are at different stages of the approval process which will upgrade our strategic outlook and enhance our risk profile.
Outlook
At the time of writing my statement, the Mauritian economy and other economies globally continue to bear the adverse impact of the COVID-19 pandemic. Mauritius is in the middle of a second national lockdown whilst many countries have now faced multiple lockdowns on national scale. The outlook for Mauritius and globally remains uncertain and volatile.
As an important economic operator in Mauritius, we are resolute in our efforts to work even harder for our country and to collaborate with all stakeholders and authorities, and together, we will navigate the tough and uncertain times ahead. We are encouraged by the Government’s national vaccination programme and welcome the careful and gradual opening of our borders in order to bolster the economy on a timely basis.
We however exercise care and prudence in our engagements as we note the negative outlook for the Mauritian economy being echoed by the international rating agencies such as Fitch and Moody’s.
I am overall confident for the future. The maturity and resilience of all our businesses as shown in our financials are the sound fundamentals that any important Group like us can build upon to drive important value creation process in our business segments. The coming years will demonstrate our engagement and drive towards the goals we have set and our “Dare to Dream” mindset.
I am committed to value creation and realisation, and unlocking intrinsic returns to shareholders, stakeholders and the Mauritian economy as a whole.
Acknowledgements
In my own name and on behalf of the board, I would like to express my sincere thanks to the senior management teams and all our employees for their commitment and invaluable contribution during this challenging period.
I am grateful to my fellow board members for their full and undeniable support during the most challenging time that Gamma had experienced. Together we will continue working closely and leveraging on our combined wealth of experience and skills to develop the best future strategy for Gamma and to ensure best execution.
I would like to thank our shareholders, stakeholders, partners, customers and suppliers for their continued support.
Tommy Ah TeckExecutive Chairman
30 March 2021
18 19

A VISIONARY MAN WHO DARED TO DREAM. WHO DARED TO REALISE HIS DREAMS FOR HIS COUNTRY.
ALWAYS REMEMBERED.
CARL AH TECK
“Carl passed away on Good Friday of 2020, 33 years after founding Gamma Civic. He was 63 years of age. From those of us who have lost him forever, we shall never forget him.
Who has known Carl, for even a short while, agrees that he was an exceptional man with a deep sense of humility. It is generally after one would have participated with him in any endeavour, that the deep knowledge of Carl would dawn upon her or him. His humility made him engage with each and everyone equally. He was devoted to his family and ensured that they would all share a moment each year, to ensure that their bond never wears off. He was a true paterfamilias with an ingrained sense of duty towards his family, his friends, his staff and his relations.
In whatever field of his endeavours, be it family, friends or business, he always carried a sense of looking at things from the outside; when in fact he was fully master of facts and events. There are too many occasions to recount his sharp wit and sheer intelligence of persons and situations. One of them was a meeting in Paris when a large group tried to take negotiations to the brink and impose conditions at the very end, thinking that the financial offer on the table was impossible to resist. Carl would not be troubled by such tactics: he asked for a recess, took advice from all present and asked everyone to put his papers back in their bags. When the meeting started anew, the other side’s leader entered the room grinning, persuaded to have imposed its will on a meek side. His smile changed to stupor when he saw empty tables and realised, without a word having been exchanged, that he had gone too far by trying underhand tactics.
It all came from his innate honesty and his wish not to appear to be taking a dominating role which was facilitated by his joviality and ease of communication. It is only after that facts did materialise as predicted that one would come to fully appreciate his formidable insight and reading of persons. All that was a second nature to him.
We all felt a sense of personal loss with his disappearance. A year on, my thoughts are with Diana, his three children, his mother, Marie Claire, Tommy, Patrice and their families, knowing how irreplaceable Carl is to them. But each one of us, of the Gamma family, has shared that grief.
Fare thee well Carl.”
Sir Hamid Moollan QC

BOARD OF DIRECTORS BOARD OF DIRECTORS
CARL AH TECKExecutive Chairman
Appointed: 28 Oct 1988
Executive Chairman: Nov 2016 – Apr 2020
Age: 64
Skills and expertise:• Founded Gamma Construction in 1987 and acted as CEO of Gamma Group until 2011.
• Appointed as Executive Chairman in 2011, before subsequently resigning as an employee of the Company in 2015 to become a non-executive director and Chairman of the Group
• Appointed as Executive Chairman in 2016
• Passed away on 10 April 2020
Qualifications:• BEng Civil Engineering• MPhil Soil Mechanics
Committees:• Corporate Governance Committee
Other listed directorship:• Lottotech Ltd• Kolos Cement Ltd• Morning Light Co. Ltd
Citizen and Resident of Mauritius
PATRICE AH TECKVice-Chairman & Non-Executive Director
Appointed: 29 Dec 2000
Vice Chairman: Aug 2020
Age: 53
Skills and expertise:• Joined Gamma Group in 1993, and was appointed as Sales and Marketing Director in 2000
• Since 2015, he is no longer an executive director, and is a member of the Board in a non-executive capacity
• Appointed as Vice Chairman of the Company in Aug 2020
Qualifications:• BA (Hons) Accounting & Finance
Committees:• Corporate Governance Committee
Other listed directorship:• Lottotech Ltd• Kolos Cement Ltd• Morning Light Co. Ltd
Citizen and Resident of Mauritius
TOMMY AH TECKExecutive Chairman
Appointed: 28 Oct 1988
Executive Chairman: Apr 2020
Age: 59
Skills and expertise:• Managing Director of Gamma from 1987, until his appointment as Group CEO in 2011.
• Since 2015, he became a non-executive director of the Board, and Vice Chairman of the Company
• On the demise of the late Carl Ah Teck, he was appointed as the Executive Chairman
Qualifications:• BSC (Hons) Engineering• MPhil Mechanical Engineering
Committees:• Corporate Governance Committee
Other listed directorship:• Lottotech Ltd• Kolos Cement Ltd• Morning Light Co. Ltd
Citizen and Resident of Mauritius
MARIE CLAIRE CHONG AH-YANNon-Executive Director
Appointed: 27 Sep 2012
Age: 60
Skills and expertise:• Head of HR at Gamma Group since 2000, and appointed as HR Director of Gamma Civic Ltd in 2012
• Co-Trustee of Gamma Foundation, which coordinates all CSR projects for the Group
• Since 2015, she is no longer an executive director, and is a member of the Board in a non-executive capacity
Qualifications:• Bachelor degree in Arts• Bachelor degree in Human Resources Management• FT Non-Executive Director Diploma
Committees:• Corporate Governance Committee
Other listed directorship:• Lottotech Ltd• Kolos Cement Ltd• Morning Light Co. Ltd
Citizen and Resident of Mauritius
22 23

BOARD OF DIRECTORS
BOON HUI CHANNon-Executive Director
Appointed: 17 Jun 2014
Age: 53
Skills and expertise:• Founder and managing director of Chancery Capital, a boutique private equity & corporate advisory practice
• Over 18 years of investment banking experience with OCBC, BNP Paribas, and Rothschild Group in Singapore and New York
Qualifications:• MA (Hons) Law• Chartered Financial Analyst
Committees:• Audit & Risk Committee• Corporate Governance Committee
Other listed directorship:• JCY International Berhad (Malaysia)• Hiap Hoe Ltd (Singapore)
Citizen and Resident of Singapore
MAURICE LAM PAK NGNon-Executive Director
Appointed: 17 Jun 2014
Age: 73
Skills and expertise:• Founding partner of Stewardship Consulting Pte. Ltd., Singapore, boutique consulting firm advising Enterprising Families in Family Governance and Strategy
• Mentor /advisor to entrepreneurs in technology start-ups
• Extensive prior work experience in investment banking advising clients in financial strategy, investment management, treasury and risk management
Qualifications:• MBA
Committees:• Audit & Risk Committee• Corporate Governance Committee (Chairman)
Other listed directorship:• None
Citizen of Mauritius and Resident of Singapore
BOARD OF DIRECTORS
PAUL HALPINNon-Executive Director
Appointed: 17 Jun 2014
Age: 61
Skills and expertise:• Deep understanding of Gamma Group applying considerable commercial and strategic acumen
• Significant current international experience as a Non- Executive Director and board-level advisor
• Indepth experience in Corporate Governance, International Business, Corporate Transactions, Strategy Development and Risk Management
• Former Partner at PwC Johannesburg, London and Dublin
• Holds Non Executive Directorships in FinTech, construction, lottery, real estate, private equity and TravelTech sectors
Qualifications:• B.Comm FCA • Chartered Accountant
Committees:• Audit & Risk Committee (Chairman)
Other listed directorship:• Lottotech Ltd• Kolos Cement Ltd• MakeMyTrip Ltd (Nasdaq)
Citizen of Ireland and Resident of Mauritius
JEAN-CLAUDE LAM HUNGNon-Executive Director
Appointed: 1 Jan 2017
Age: 45
Skills and expertise:• Currently Chief Executive of CG Re (Africa) Ltd, a reinsurance broker
• Held the position of Group CFO of Gamma Civic Ltd between 2012-2015
• Prior to Gamma, he worked in London, qualifying as a Chartered Accountant with EY, and assumed senior manager and director roles at Deloitte and BDO respectively. In 2009, appointed as partner at Mazars LLP
Qualifications:• BA (Hons) Business Studies• Fellow of the Institute of Chartered Accountants in England and Wales
Committees:• Audit & Risk Committee
Other listed directorship:• Lottotech Ltd
Citizen and Resident of Mauritius
24 25

BOARD OF DIRECTORS EXECUTIVE TEAM
TWALHA DHUNNOOExecutive Director & Group CFO
Appointed: 26 May 2017
Age: 44
Skills and expertise:• Appointed as Group CFO and Executive Director of Gamma Civic Ltd in 2017
• Prior to Gamma, he worked in London at EY, Mellon Bank and Deutsche Bank between 1998 and 2007
• Since 2011, he became CFO and Executive Director of Gatehouse Bank Plc, a deposit-taking bank based in London
Qualifications:• MEng Electrical and Information Sciences• Fellow of the Institute of Chartered Accountants in England and Wales
Committees:• None
Other listed directorship:• Kolos Cement Ltd• Morning Light Co. Ltd
Citizen and Resident of Mauritius
JASON AH TECKExecutive Director
Appointed: 20 Apr 2020
Age: 27
Skills and expertise:• Joined Gamma as Corporate Affairs Executive in 2019
• Prior to Gamma, he was a strategy consultant at KPMG’s Global Strategy in London, where he focussed on growth strategy and data analytics for multinational corporations
Qualifications:• BEng Materials Engineering with Management• Masters in Management
Committees:• None
Other listed directorship:• Lottotech Ltd• Kolos Cement Ltd• Morning Light Co. Ltd
Citizen and Resident of Mauritius
CARL AH TECK, Executive Chairman Refer to “Board of Directors”, page 22
TOMMY AH TECK, Executive Chairman Refer to “Board of Directors”, page 22
TWALHA DHUNNOO, Group CFO and Executive Director Refer to “Board of Directors”, page 26
JASON AH TECK, Executive Director Refer to “Board of Directors”, page 26
CLEMENT LEU SAN, Deputy Group CFO Appointed: 1 Oct 2019
Skills and expertise:• Over 28 years of experience in the finance & accounting field• Spent 4 years at Kemp Chatteris Deloitte and left as audit supervisor in 1996 • Joined Gamma Group in 1996 as accountant• Promoted to Group Financial Controller in 1999• Promoted to Deputy Group CFO in 2019
Qualifications:• Fellow member of the Association of Chartered Certified Accountants
TONY KONG, IT Manager Appointed: 3 Jul 2017
Skills and expertise:• Joined Gamma Civic Ltd in 2007 as an IT Analyst until 2010• Appointed as Development Executive in 2010, before subsequently being promoted to MIS Team Leader in 2014• Was involved in various IT Projects such as Weighbridge solutions, Payroll and HR Systems and Oracle Applications support• Implemented an Oracle BI Project in 2015 and then left Gamma Civic Ltd• Worked in SBM, Mauritius on the flamingo project in 2016-2017 before being appointed as IT Manager in Gamma Civic Ltd• Currently involved in various projects for Gamma Group such as RPA, Digitalization, IT Security and Fintech projects
Qualifications:• Bsc (Hons) Software Engineering with Multimedia• Oracle Database Administration 10/11G• OBIEE 11G Bootcamp
KANNEN PADIACHY Appointed: 2 Sep 2019
Skills and expertise:• Over 14 years’ experience in the Human Capital field• Joined Gamma Group in July 2007• Held the position of Assistant Learning & Development Manager at the Hilton Mauritius Resort & Spa (for and on behalf of Morning Light Co. Ltd)• Joined Gamma Corporate Services Ltd in September 2019• Drives a series of HR initiatives in line with our HR Strategy with the collaboration of all HRs across the different clusters• Experienced in various HR areas; Recruitment & Selection, Learning & Development, Performance & Talent Management, HR Analytics, Employee Engagement and Industrial Relations
Qualifications:• BSc (Hons) Tourism, Leisure and Recreation Management• Post Graduate Certificate in HR Studies• Middle East & Africa Learning & Development Program – Level 2 – Hilton Worldwide in collaboration with the Association for Talent Development (ATD)
26 27

NURTURING TALENTS TO EMPOWER OUR FUTURE.

CORPORATE GOVERNANCE REPORT CORPORATE GOVERNANCE REPORT
INTRODUCTION
Since its coming into force, the Board of Directors of Gamma Civic Ltd have been very much focused on the implementation of the National Code of Corporate Governance for Mauritius (2016) and have ensured that the Company aims at applying the 8 Principles as far as possible, throughout the year under review.
PRINCIPLE 1: GOVERNANCE STRUCTURE
Board Structure
Board of Directors
As per the Constitution, the Board shall consist of not less than two and more than twelve Directors. Presently the Board is composed of 3 Independent Non-Executive Directors, 3 Non-Executive Directors and 3 Executive Directors.
The composition of the Board is in line with the National Code of Corporate Governance, in having the appropriate mixed of executive, non-executive and independent directors. Furthermore, the Board has the required mixed of terms of diversity, skills, experience, independence and knowledge to play its role fully in serving the best interests of all the stakeholders of the Company.
Board Committees
Board Committees are set to assist the Board in efficient decision making, without having decision making powers. The Board Committees make recommendations to the Board for decisions, as may be appropriate. Gamma Civic Ltd has two permanent Committees namely the Audit and Risk Committee and the Corporate Governance Committee.
Governance Documents
The Company has two main internal corporate documents which have been duly approved by the Board of Directors and the Shareholders. These are the Company’s Constitution and the Gamma Charter.
The Company’s Constitution The Company’s Constitution is in line with the Companies Act 2001 and has no material clauses requiring disclosure. A copy of the Company’s Constitution is available at the Company’s registered office. The Gamma Charter This Charter establishes and stipulates a governance framework, which is the rules, regulations, organization and governance principles which must permeate all levels of the Gamma Group in order to: • Value Rights - Preserve the rights of the Shareholders of Gamma Civic Ltd and ensure that Gamma Civic Ltd has sound governance practices throughout the organisation;
• Effective Oversight- Enable the Board of Gamma Civic Ltd to have effective oversight of the management of its Group Companies;
• Respective Roles & Responsibilities- Clarify the respective roles and responsibilities of Board members and senior executives of the Gamma Group, charged with the executive management of the Gamma Group of companies; and
• Protocols & Policies- Establish protocols and policies to promote compliance and consistency within an overall Gamma Group framework of policies and strategies.
The Gamma Charter is a forward looking document, reviewed by Professor Chris Pierce and Professor Mervyn King in 2013 and approved by the shareholders and Board of Directors in 2014. Both professors were heavily involved in the drafting of the national Code of Corporate Governance for Mauritius. The Charter is perfectly aligned to the new Code of Corporate Governance 2016.
The Gamma Charter is reviewed by the Board every two years. The last review done was in 2020.
A copy of the Charter is available for inspection to any Shareholder upon request made to the Company Secretary.
Key Positions
The Company has the following key positions, namely:
• The Executive Chairman;
• Chairman of Committees;
• Company Secretary.
The Executive Chairman The Company has an Executive Chairman who has been duly appointed by the shareholders at the Annual Meeting until the next Annual Meeting. He is eligible to stand for his re-appointment at the next Annual Meeting.
Mr Carl Ah Teck was the Executive Chairman until his demise in April 2020. Subsequently, the Board appointed Mr Tommy Ah Teck as the Executive Chairman in April 2020. Mr Tommy Ah Teck was re-appointed as the Executive Chairman at the Annual Meeting of Shareholders in September 2020. The Executive Chairman presides over the meeting of Directors and shareholders. He is responsible for corporate governance in the Company, ensuring that the Board carries out its responsibilities efficiently and that it has a clear comprehension of its role, function and deliverables as well as those of the management and shareholders. He is also responsible for ensuring that resolutions of the Board are promptly executed and implemented by Management. The Chairman of the Board acts for and on behalf of the Board.
Furthermore, it is part of the Executive Chairman’s responsibility to ensure that new Directors are properly introduced to the businesses of the Company, with the assistance of the Company Secretary.
Chairman of Board Committees The Chairman of each of the Board Committees, namely the Audit and Risk Committee and the Corporate Governance
Committee, are responsible for chairing their respective Committees and to ensure that the Committees deliver as per their respective terms of reference in their mandate to assist the Board to fulfil its duties and responsibilities.
Mr Paul Halpin is the Chairman of the Audit and Risk Committee and Mr Lim Sit Chen Lam Pak Ng, also known as Maurice Lam is the Chairman of the Corporate Governance Committee.
The Company Secretary The Company Secretary is appointed and removed by the Board of Directors on such terms as the Board may deem fit
and is accountable to the Board through the Chairman in the performance of its duties and responsibilities, as defined in the Companies Act 2001, as well as for the corporate governance processes.
Gamma Corporate Services Ltd is the Company’s Company Secretary.
Shareholders
Board of Directors
Group CFO
Corporate Governance Committee
Audit and RiskCommittee
30 31

CORPORATE GOVERNANCE REPORT CORPORATE GOVERNANCE REPORT
PRINCIPLE 2: STRUCTURE OF THE BOARD & ITS COMMITTEES
The Board
Powers of the Board
The role of the Board of Gamma Civic Ltd is first and foremost to direct, govern and control the Company in order to safeguard and enhance its total value and returns by overseeing directly or indirectly the executive management of Gamma Civic Ltd and its Group Companies. The Board shall have all the powers necessary for directing and supervising the management of the business and affairs of the Company and for creating and delivering sustainable value.
The Board determines the strategic direction within a framework of rewards, incentives and controls. The Board must ensure that Management strikes an appropriate balance between delivering short and medium term objectives and promoting long-term growth.
The Board is also responsible for ensuring that management maintains a system of internal control and procedures which provides assurance of effective and efficient operations, internal financial controls and compliance with existing laws and regulations. In carrying out this responsibility, the Board should have due regard to what is appropriate for the Company’s businesses and the materiality of the risks inherent in the businesses and the relative costs and benefits of implementing specific controls.
The Board is the decision making body for all matters which are of significance to the Company as a whole because of their strategic, financial and reputational implications and/or consequences.
As such, the Board of Gamma Civic Ltd has the responsibility of ensuring that the corporate governance system by which the Gamma Group is directed and controlled is effectively implemented by management in terms of processes, mechanisms, policies, laws and customs. The Board also provides effective corporate governance.
Legal Responsibility
All Directors of Gamma Civic Ltd and its Group Companies have the duty to comply with the Companies Act 2001.
Although Directors are entrusted by Shareholders with the task of oversight and steering over the Management of Gamma Civic Ltd and its Group Companies, the powers of the Directors may be limited by the Gamma Charter, by the Constitution and by ordinary resolutions of the Shareholders. The Directors may become liable for the consequences of any breach of duties as contained under the law, the Gamma Charter, the Constitution and resolutions of the Shareholders in case of actions entered against the Directors.
Board Meetings - Focus Areas 2020
The Board held quarterly statutory meetings to review the Company’s unaudited and audited financial statements in compliance with the provisions of the Companies Act 2001, the Listing Rules and the Gamma Charter. Matters discussed by the Board included:
• Strategic position assessment
• Five year strategic plan, including - Value ambition - Strategic initiatives with risk assessment - Capex plan with financing options - Key management agenda items for the next 3 years based on strategic initiatives
• Impact of COVID-19 and National Lockdown - Plan for re-opening the business and back to work - Business Continuity Plan - Scenario planning for future lockdown
• Budget
For the period under review the Company had a Board composed of 9 Directors.
Directors’ Profiles and details of external appointments Directors’ profiles, including details of their appointments in listed companies, have been disclosed in the section “[Leadership – Board of Directors]” of the Annual Report.
Balance in the Composition of the Board
The Shareholders have appointed a Board of Directors which is currently composed of:
Extract of Gamma CharterThe shareholders of Gamma Civic Ltd by ordinary resolution shall determine the size of the Board of Gamma Civic Ltd and hold the ultimate responsibility of electing the persons to act as Directors on the Board. The Board of Directors of Gamma Civic Ltd shall comprise of Executive Directors, Non-Executive Directors and Independent Non-Executive Directors in view of collectively representing a set of skills, competence and experience to adequately fulfil its responsibilities. It shall be a pre-requirement that at least one Independent Non-Executive Director appointed to the Board has the necessary skill and experience in financial matters to ensure that there is an independent judgement on issues of strategy, performance and resources, which are brought before the Board.
3 Independent
Non-Executive Director
1 Female
3 Non-Executive
Director
8 Male
3 Executive Director
32 33

CORPORATE GOVERNANCE REPORT
PRINCIPLE 2: STRUCTURE OF THE BOARD & ITS COMMITTEES
Attendance at Board meetings
For the period under review, the Board has met 7 times.
* Carl passed away on 10 April 2020** Jason was appointed on 20 April 2020
Directors Attendance
Carl Ah Teck 1/1*
Boon Hui Chan 7/7
Patrice Ah Teck 4/7
Jason Ah Teck 4/4**
Tommy Ah Teck 7/7
Jean-Claude Lam Hung 7/7
Maurice Lam Pak Ng 7/7
Paul Halpin 7/7
Marie Claire Chong Ah-Yan 7/7
Twalha Dhunnoo 7/7
Directors AttendancePaul Halpin (Chairman) 5/5
Boon Hui Chan 5/5
Maurice Lam Pak Ng 5/5
Jean-Claude Lam Hung 5/5
CORPORATE GOVERNANCE REPORT
BOARD COMMITTEES
AUDIT AND RISK COMMITTEE
The core function of the Audit and Risk Committee is to assist the Board of Gamma Civic Ltd in:
• Reviewing and assessing the adequacy of the Company in relation to its reporting of financial information, the appropriate application and amendment of accounting policies, the identification and management of financial risk,
internal control systems and internal audit, and statutory and regulatory compliance; • Reviewing and assessing the adequacy of the Company’s risk management systems, to ensure there is a sound framework of risk oversight, risk management and internal control in place and operating across the Gamma Group
in accordance with the Code of Corporate Governance for Mauritius principles and recommendations regarding the recognition and management of risk; and
• In providing a forum for effective communications between the Board and the external and internal auditors, both of whom must report to the Audit and Risk Committee.
Composition & Attendance
During the year under review, the Audit and Risk Committee met 5 times. The members of the Audit and Risk Committee are as follows:
Roles & Responsibilities
The roles and responsibilities of the Audit and Risk Committee are set out in the Gamma Charter. The Audit and Risk Committee reviews, assesses and make recommendations to the Board. In particular, the Audit and Risk Committee are responsible for and have oversight on:
• The accounting, reporting, and financial practices of Gamma Civic Ltd and its Controlled Entities, including the integrity of Gamma Civic Ltd’s financial statements and internal control over financial reporting in particular
considering: any changes in the Gamma Group’s accounting policies or practices; the application of relevant accounting standards; significant adjustments arising from the audit; the appropriateness of the going concern statement to be made by the Board of Gamma Civic Ltd and the statement of directors’ responsibilities in relation to the accounts;
• The Gamma Group’s accounting policies, disclosure controls and procedures,
• Management’s approach to internal controls to provide assurance to the Board that executive management’s control assurance processes are implemented and are complete and effective. • The system of internal control, review the manner and framework in which management ensures and monitors the adequacy of the nature, extent and effectiveness of internal control systems, including accounting control
systems, and thereby maintains an effective system of internal control;
• Compliance by managements in the Group to approved internal controls procedure and report to the Board thereon;
• Gamma Civic Ltd’s compliance with legal and regulatory requirements with regard to financial matters;
• The adequacy and scope of the internal and external audit function; • The external and internal auditor’s qualifications, independence, effectiveness and appointment;
• The performance review of Gamma Civic Ltd’s internal audit function and Gamma Civic Ltd’s external auditor;
34 35

CORPORATE GOVERNANCE REPORT CORPORATE GOVERNANCE REPORT
AUDIT & RISK COMMITTEE
Roles & Responsibilities (Cont’d)
• To review and approve the audit plans for the following year for the external and internal auditors;
• Gamma Civic Ltd’s information technology and operations environment;
• The appropriateness, completeness and effectiveness of Gamma Civic Ltd risk management system including reviewing and updating its risk profile;
• The annual formal risk assessment review to confirm and re-prioritize its key business risks and to reassess Gamma Civic Ltd and its Group Companies’ risk profile;
• The appropriateness and adequacy of Gamma Civic Ltd’s and its Controlled Entities’ insurance coverage; and
• Review all Company litigation.
The Chairman of the Audit & Risk Committee reports quarterly to the Board of Directors on risk areas identified over the last quarter and the Company’s internal control system.
Risk Review of 2020
In the year under review, the Company and the Group was exposed to heightened risks resulting directly from the COVID-19 pandemic and the inclusion of Mauritius on the FATF watch list and EU list of high-risk countries with strategic deficiencies in its Anti Money Laundering and Counter Financing Terrorism regime.
In light of the macro-economic context, the focus areas of the Audit & Risk Committee during the year were as follows: • Financial Performance and Financial Reporting
• Internal Audit Plans and Reports
• Oversight of the External Audit Process
• Risk Management Matters, including quarterly risk management reviews in the COVID-19 context on the following topics: - Scenario planning for all operating entities within the Group - Risk appetite and any proposed modifications - People risk management, including planned actions to protect our people and their ability to perform effectively and safely; - Liquidity risk management - Role of digital technologies in managing resilience - Impact of work-from-home and cyber-security considerations on internal controls - Specific additional COVID-19 risk management priorities - Review of any risk management activities that have been deferred during Covid-19 lockdown - Assessment of the quality of communications within the company - Any proposed changes to improve risk management effectiveness and resilience
• Adequacy of the resourcing in the Financial Reporting Team, aimed at ensuring a continuing dialogue with the CFO regarding the quality and adequacy of the resources available.
CORPORATE GOVERNANCE COMMITTEE
The Corporate Governance Committee acts as a mechanism for making recommendations to the Board on all corporate governance matters relevant to the Company to ensure that the Board remains effective and complies with the “Code” and prevailing corporate governance principles.
The Committee is also responsible for the remuneration and nomination matters. The remuneration philosophy is geared towards rewarding efforts and merits for individual and joint contribution to the Company’s results, whilst having also due regards to market conditions, the interest of the shareholders and to the financial well-being of the Company.
Under the aegis of the Corporate Governance Committee and the Chairman of the Board, the Board members have carried out their first Board Appraisal for the year under consideration. Analysis of the Board Appraisal is ongoing and appropriate action as may be required would be considered by the Board to ensure that as a Body, the Board is fully effective and delivers as per its objectives as defined in the Gamma Charter, to meet the expectation of all stakeholders.
Composition & Attendance
During the year under review, the Corporate Governance Committee met 2 times. The members of the Corporate Governance Committee are as follows:
* Carl passed away on 10 April 2020 ** Patrice Ah Teck was appointed to the Corporate Governance Committee on 9 November 2020. No Corporate Governance Committee meetings were held between 9 November and 31 December 2020.
Roles & Responsibilities
The roles and responsibilities of the Corporate Governance Committee are set out in the Gamma Charter.
Corporate Governance The Committee makes recommendations to the Board of Gamma Civic Ltd on all corporate governance matters,
including ensuring that that the Company remains compliant to prevailing corporate governance principles as contained in the Code of Corporate Governance for Mauritius. The Committee ensures that the reporting requirements on Corporate Governance, whether in the annual report, or on an ongoing basis, are in accordance with the principles of the Code of Corporate Governance for Mauritius.
Remuneration
The Committee reviews, assesses and make recommendations with respect to matters pertaining to the Remuneration policy of the Company ensuring that the Company remains align to prevailing market practices. In particular, the
Corporate Governance Committee is responsible for and has oversight on:
• The preparation of any proposal to the General Meeting on matters pertaining on the remuneration of Board members;
• The appointment, remuneration, performance and appraisals of the Non-Executive Directors of Gamma Civic Ltd;
• The appointment, remuneration, performance and appraisals of the Group CFO and Senior executive managers (members of the Management Committee, CEO and CFO/FM of controlled entities) of Gamma Civic Ltd;
• Remuneration system and policies, including performance assessment processes;
• Adoption of policies that govern certain annual compensation and, if any, stock ownership plans;
• Determining and recommending Committee Members’ fees and remuneration to the Board; and • Liaising with the Board in relation to the preparation of the Committee’s report to shareholders with respect to Remuneration as may be required.
Directors AttendanceMaurice Lam Pak Ng (Chairman) 2/2
Boon Hui Chan 2/2
Carl Ah Teck 1/1*
Tommy Ah Teck 2/2
Marie Claire Chong Ah-Yan 2/2
Patrice Ah Teck 0/0**
36 37

CORPORATE GOVERNANCE REPORT CORPORATE GOVERNANCE REPORT
CORPORATE GOVERNANCE COMMITTEE
Roles & Responsibilities (Cont’d)
Strategic HR Issues
The Corporate Governance Committee meets at least once a year to review and assess the Human Resource policies of Gamma Civic Ltd and its Controlled Entities. The Committee shall, review periodically a report from the HR Director
on strategic HR issues but not be limited to:
• employee retention, motivation and commitment;
• significant employee relations matters;
• the availability of talent for senior roles below Board level;
• results of any Group employee opinion survey; • progress in equality and diversity; and
• the Gamma Group’s performance against agreed employee metrics.
Employee Benefit Schemes
The Corporate Governance Committee reviews the Company’s policy relating to employee benefits and long term incentive schemes.
Nomination of Directors The Corporate Governance Committee assists the Board in the nomination of directors by:
• identifying individuals qualified to become members of the Board, consistent with criteria approved by the Board; • recommending Directors to be elected by the Board to fill any vacancies;
• recommending the appointment and succession of Non-Executive Directors; and
• overseeing Board induction processes.
Succession Planning
The Corporate Governance Committee oversees the succession planning proposals brought by management to the Committee for senior management and key employees with the potential to move into other functional or leadership roles and make recommendations to the Board, at regular intervals, and at least once a year.
Composition of Board The Corporate Governance Committee prepares proposals to the Annual Meeting for the appointment of Board members.
Re-election and renewal of Serving Non-Executive Directors The Corporate Governance Committee reviews, from time to time, the time commitment required of the Non-Executive
Directors and the Committee makes recommendations to the Board concerning:
• the re-election by shareholders of Directors in accordance with the Code of Corporate Governance for Mauritius;
• renewal of terms of office of Non-Executive Directors, based on a review of each Director’s performance; and
• any matters relating to the continuation in any office of any Director at any time.
Board Effectiveness and Performance
The Corporate Governance Committee: • considers and sets the criteria for the objective and rigorous performance review of each Non-Executive Director, the Board and each Committee of the Board;
• conducts an annual performance evaluation of the effectiveness of the Board, and of each Committee of the Board, and the contribution of each Director;
• ensures that the recommendations and conclusions arising out of the annual effectiveness review are reported to the Board;
• agrees an action plan addressing the results of the Board effectiveness review and review progress against the plan from time to time; and
• considers the effectiveness of each Board evaluation carried out.
Corporate Governance Review of 2020
The focus areas of the Corporate Governance Committee during the year were as follows:
• Reporting on corporate governance matters
• Nomination
• Succession planning
• Remuneration & reward
COMPANY SECRETARY
The main role and responsibilities of the Company Secretary as fully described in the Gamma Charter, which is in line with the provisions of the Companies Act 2001, includes the following:
• To provide the Board with guidance as to its duties and responsibilities, and powers;
• To inform the Board of all legislations on functions and operations relevant to or affecting meetings of shareholders and directors and reporting at any meetings as may be reasonably required from time to time and the filing of any documents required of Gamma Civic Ltd and any failure to comply with such legislation;
• To ensure that minutes of all meetings of shareholders and directors are duly recorded and that all statutory registers are properly maintained;
• To certify in the annual financial statements of Gamma Civic Ltd that Gamma Civic Ltd has filed with the Registrar of Companies all such returns as are required of Gamma Civic Ltd under the Companies Act 2001; and
• To ensure that a copy of Gamma Civic Ltd’s annual financial statements and, where applicable, the annual reports are sent by email or post to every person entitled to such statements or reports in terms of the Companies Act 2001.
38 39

CORPORATE GOVERNANCE REPORT CORPORATE GOVERNANCE REPORT
PRINCIPLE 3: DIRECTORS APPOINTMENT PROCEDURES
Selection, Appointment & Re-Election of Directors
Succession planning
An important responsibility of the Board of Directors is to ensure that the Company has an appropriate succession plan in place for Directors, Top Management and key officers, and this responsibility has been delegated to the Corporate Governance Committee under its Nomination function.
PRINCIPLE 4: DIRECTORS’ DUTIES, REMUNERATION AND PERFORMANCE
Legal Duties
All Directors of Gamma Civic Ltd have:
• common law fiduciary obligations to Gamma Civic Ltd and/or Group to act in good faith and the best interest of the Company;
• obligations imposed by the Companies Act 2001;
• obligations imposed by Constitution of Gamma Civic Ltd; and
• obligations imposed by the Gamma Charter.
Each Director has a duty to exercise a degree of care, skill and diligence in fulfilling his function as a member of the Board.
Induction
Upon appointment, Directors are issued a letter of appointment stipulating the terms and conditions of the directorship. The Directors are also communicated a copy of the Gamma Charter, which is applicable to the Company, the Company’s Constitution and relevant laws which applied to the operation and business of the Company. The corporate presentation of the Company and Group is effected by the Executive Chairman and meetings and visits are also planned to the different subsidiaries so that the new Directors would get acquainted with the businesses and operations of the Group.
Continuous Professional Development
The Directors are encouraged to keep themselves up to date with latest professional practices and to changes and trends in the Company’s business, market, economic, political, social and legal environment in general.
Board evaluation
The Board has established an internal process for an annual performance evaluation of the Board, Board Committees and individual Directors including the Chairman of Gamma Civic Ltd. The process is managed by the Corporate Governance Committee and the Company Secretary, and involves a peer-review of board members. For the year under review, an evaluation was carried out on 31 January 2020, assessing the following themes:
• Active Participation • Quality of Input
• Understanding of Role
• Performance of Board Chairman
No areas of concerns were identified requiring the Board’s attention. Nevertheless, the Board continues to work towards the effectiveness of the Board proceedings with the aim of sharpening its capacity.
It is to be noted that the full Board is appointed for only one year and all Directors stand for re-election at each Annual Meeting. The appointment of the Board and the Directors depend on the result which the Company is reporting and the creation of value for the shareholders.
Remuneration Policy
The Company remains focused on its long term philosophy as described in the Group HR Manual, which is to attract and retain leaders with the objective of delivering business priorities within a framework that is aligned with the interest of the Company.
For Board members, the recommendation of the Corporate Governance Committee is presented to the Shareholders at the Annual Meeting to obtain the approval of the Shareholders on the fees to be paid.
Directors fees paid to non-executive Directors are made of three components, namely retainer fees which represent an average of 17%, board committee attendance representing 6%, and special assignments/projects representing 77%.
Executive Directors receive remuneration and benefits made of three components, namely basic salary which represents an average 62% of the remuneration, a performance bonus representing 24% of same, and the remaining 14% includes pension contributions and other benefits.
For the period under review, remuneration and benefits received and receivable by the Directors from the Company and its subsidiaries were:
The Corporate Governance Committee, having knowledge of the skills required to add value to the affairs of the Board, is responsible for the identification and selection of directors.
An appointed director shall hold office only until the next following Annual Meeting of shareholders, and shall then be eligible for re-election.
The Corporate Governance Committee under its nomination function, is responsible for making a recommendation to the Board, which in turn would be presented to the shareholders at the Company’s Annual Meeting. In the cases of casual vacancy, the Board may appoint Directors who shall hold office only until the next Annual Meeting and shall then be eligible for re-election.
Upon their appointment, all Directors are provided with a letter of appointment, which stipulates the terms and conditions of such appointment. The Directors are also given a Gamma Charter which serves as a reference tool for all members of the Board and are referred to the Company’s constitution, the Companies Act 2001 and the Listing Rules of the Stock Exchange of Mauritius.
Identification & Selection
Re-Election
Recommendation
Appointment
1
2
3
4
From the Company
Rs
From the Subsidiaries
Rs
Directors of the Company
- Executive 52,903,858 29,099,993
- Non-Executive 27,614,164 15,769,084
Total 80,518,022 44,869,077
Directors of subsidiary companies (excluding those who are also Directors of the Company) - Executive 42,524,119- Non-executive 2,471,250Total 44,995,369
40 41

CORPORATE GOVERNANCE REPORT CORPORATE GOVERNANCE REPORT
PRINCIPLE 4: DIRECTORS’ DUTIES, REMUNERATION AND PERFORMANCE
IT Management Policy
Information technology (“IT”) is key to the Company and it forms part of the Company’s asset. The Board is responsible for IT Governance and management of IT risks, through policies, procedures and processes which are regularly updated, monitored and safeguarded by having in place the appropriate tools and software.
There is an IT Management Policy included in the Gamma Charter which provides the principles and recommended practices to achieve the future strategic goals identified and approved by the Gamma Board. However, the implementation of tactical plans remains the responsibility of senior management of each entity within the Group.
During the year under review, the Group initiated a move to implement the ISO/IEC 27001 standard on Information Security Management for all operating companies, which involved the following key areas:
• Information security policies • Organization of information security
• Human resource security
• Assigning information security roles and responsibilities
• Asset management
• Access control
• Cryptography
• Operation and communication security
• System acquisition, development and maintenance
• Information security incident management
• Information security aspects of business continuity management
Gamma Civic Ltd and its operating companies successfully completed this exercise and are ready to pursue ISO/IEC 27001 certification.
Directors’ Interest and Dealings in the Company’s Shares
As part of the Company’s statutory quarterly reporting process to the Stock Exchange of Mauritius Ltd and the Financial Services Commission, the Company Secretary would request the Directors to confirm their shareholding and any dealings which they may have effected in the Company’s shares, with reference to Code of Securities Transactions by Directors.
The Directors are thus fully aware of the principles of the Model of Code of Securities Transactions by Directors, as detailed in Appendix 6 of the Mauritius Stock Exchange Listing Rules.
There are no share dealings by the Directors for the period under review.
Interests’ register, conflicts of interest and related party transaction policy
The Directors are fully aware of the responsibility of disclosure of any conflicts of interest in accordance with the laws and the Gamma Charter under the heading Conflict of Interest and Disclosure Policy.
Declaration of Conflict of Interest at each Board Meeting
The Company Secretary holds an Interest Register in which declarations made by Directors at each quarterly statutory meeting.
The first item of the agenda for all board meetings is for directors to declare if they have any conflict on any items which the Board will address for the business of the day. All Directors would sign a duly approved declaration of interest form, which forms part of the Board’s proceedings. Furthermore, Directors who are conflicted would not participate on discussions on the specific agenda item.
Any related party transaction, if existing, would also be recorded in the said register and same is available for inspection upon request made to the Company Secretary.
PRINCIPLE 5: RISK GOVERNANCE AND INTERNAL CONTROL
Internal Control & Risk and Compliance report
It may not be possible to anticipate all risks which the Company may face. However, as the body responsible for risk governance and internal control, the Board has delegated the responsibility of ensuring that the Company has in place a risk management process to manage and mitigate key risks which could potentially impact the Company’s business and operations to the Audit and Risk Committee. Furthermore, the governance of risks, nature and risks appetite remain the ultimate responsibility of the Board.
Risk Management Framework
In order to manage the risk exposures faced by Gamma Civic Ltd and its Group Companies, the Board recognised the need to identify areas of significant business risk and to develop and implement strategies to investigate those risks as a basis of a formal system of risk management and internal control and compliance. The risk management and internal control framework is approved by the Board on the recommendation of the Audit and Risk Committee.
The Company’s risk management framework is a combination of risk management directives set by the Board and the Audit and Risk Committee, and identification of risks at the level of each operating division.
The Audit and Risk Committee meets regularly to evaluate, control, review and oversee the implementation of Gamma Civic Ltd’s objectives. The Company’s strategic and business plans are formulated in the context of the risk exposures and the requirements to effectively manage those risks as part of Gamma Civic Ltd and its Group Companies’ operations. The Audit and Risk Committee.
The Audit and Risk Committee in turns ensures that Management puts in place a comprehensive and robust system of risk management and a sound internal control system, and quarterly reports would be submitted to the Board.
The management team is responsible for implementing and reporting on risk mitigation measures, as well as identifying new risks that may arise over the course of business.
BOARD
AUDIT & RISK COMMITTEE
SENIOR MANAGEMENT TEAM
Bottom-Up Risk Reporting
Risk
Man
agem
ent D
irecti
on
HEAD OF FUNCTIONS(Risk Owners)
42 43

PRINCIPLE 5: RISK GOVERNANCE AND INTERNAL CONTROL
Risk Management Practices
The Board of Gamma Civic Ltd is responsible for the process of risk management and management is responsible for the implementation of risk management process. The Board of Gamma Civic Ltd maintains a number of policies which are designed to manage specific business risks.
Responsibility and accountability is placed on Management to maintain direct involvement in the businesses of the Company and Group Companies in order to manage potential exposure of Gamma Civic Ltd to risks. The Group CFO attends Technical Committee meetings of the operating companies within the group where risks are identified and appropriate mitigating measures are agreed with the Management of the operating companies.
Furthermore, the Group CFO meets the Audit and Risk committee to report on Strategic Risks in the Group.
Gamma Civic Ltd has a Risk Management Policy included in the Gamma Charter, which sets out the broad principles, responsibilities and practices that are used to manage Gamma Civic Ltd’s risk exposures and the various risk management systems and internal controls operated by Gamma Civic Ltd to respond to those risks.
Risk Management Areas
In the year under review, and under the direction of the Board and the Audit and Risk Committee, the management team prioritised the following risk management areas:
• People risk management – health and safety, new ways of working, succession planning • Business continuity – vulnerability assessments and operational resilience
• Investment risks – concentration in companies operating in difficult economic conditions
• Financial – liquidity and funding management, foreign currency availability • Technology – role of new digital tools, IT governance, cyber security threats
In addition, the Company and the Group initiated several actions specifically in response to the COVID-19 pandemic.
• Prior to the announcement of COVID-19 cases in Mauritius, a Group Crisis Committee composed of CEOs and CFOs across Group companies were tasked with planning ahead for the possibility of widespread local transmission and
a lockdown situation in Mauritius.
• Under the Group Crisis Committee’s guidance, several cross-company platforms were initiated, including Group IT, Group HR and Group Health & Safety committees, in order to coordinate and manage the Group’s response to
rapidly changing work environments, such as work from home policies, enhanced hygiene practices at all workplaces, and procurement of protective equipment.
• The resilience of each Group company was assessed, with a focus on employee health, safety and wellbeing. Split- team and work from home arrangements were implemented as part of business continuity planning.
• Each company’s working capital, cash flow and operating expenditures were reviewed and planned in order to ensure that the Company and the Group is able to withstand and mitigate the impact of possible worst-case scenarios.
This equally consisted of renewing and securing facilities and lines with our banks to mitigate the risk of cash flows and foreign currency availabilities.
• The strategy of the Company and the Group was readjusted in order to mitigate the current set of concentration risks and securing access to longer term funding.
Gamma’s Top 10 Thematic Risks
The Company’s top risks can be arranged in the following 10 themes:
Whistleblowing Policy
The Company is committed to openness, accountability, transparency and highest standards of ethics. All employees and the Company’s stakeholders are encouraged to report any incidents which they have reasonable grounds to believe may tantamount to an illegal act and cause harm and impact the reputation of the Company.
CORPORATE GOVERNANCE REPORT CORPORATE GOVERNANCE REPORT
Business Continuity Risk
Market Risk
Funding Risk
Information Security Risk
New Business Development Risk
Human Capital Risk
Reputational Risk
Credit Risk
Investment Risk
Compliance with Laws & Regulations
1
3
5
7
9
2
4
6
8
10
Interest Rate Risk
Geopolitical Risk
Foreign Exchange
Risk
ConcentrationRisk
Price Risk
44 45

PRINCIPLE 6: REPORTING WITH INTEGRITY
Financial and Operational Performance
The Company’s financial and operational performance is detailed in the Directors’ Report.
Environment, Health & Safety
The Company continues to be committed to providing all employees of the Group with a safe and healthy working environment in line with the Occupational Safety and Health Act 2005 and other applicable legislative and regulatory frameworks. Through its Health and Safety officers employed by the different Group companies, Gamma Civic Ltd ensures that the Group fulfils its legal obligations as an employer towards its employees. At the same time, the employees too are informed of their responsibility as regards safety and health, by receiving continuous training and awareness with the objective of having a safe working environment. During the year under review, several new health and safety measures were implemented in response to the COVID-19 pandemic, including:
• Activation of a Group Health and Safety platform to coordinate the implementation of COVID-19 related measures to safeguard employee health, safety and wellbeing in line with best practices • Widespread awareness campaigns for new hygiene standards
• Enforcing social distancing and disinfection of workplaces to reduce risk of cross-contamination
• Procurement of personal protective equipment for all employees
• Implementing split-team and work from home arrangements
• Registry of all non-Gamma employees who enter a Gamma workplace in order to facilitate contact tracing if ever required
The Company has an Environmental Policy as contained in the Gamma Charter.
Code of Conduct
The Company applies the Gamma Charter, which contains a Code of Conduct. The Code of Conduct is based on the fundamental belief that business should be conducted in all honesty, fairness and legally. This commitment is endorsed by the Board and all employees, sharing the commitment to high moral, ethical and legal standards.
The Code of Conduct clearly sets out the Company’s approach to
• Conflicts of interest
• Dealings with suppliers
• Dealings with customers and potential customers
• Dealings with public officials
• Political activities and contributions • Integrity of records and financial reports
• Proprietary information
• Discrimination and harassment
The Company does not tolerate any form of corruption and bribery. All directors, officers and employees of the Company and the Group must fully adhere to and comply with all applicable anti-bribery and anti-corruption laws. The Gamma Group seeks to build and manage a sound relationship with governmental authorities on an arm’s length basis and will not offer, pay, solicit or accept bribes in any form or shape in its dealings with the government, administration or the courts. The Company does make political donations at time of general elections in line with the provisions of the National Code of Corporate Governance (Charitable and Political Donations) and the recommendations of the then Joint Economic Council (now Business Mauritius), with a view to further the Country’s democratic process, without expecting any reward in return and make full disclosure on the subject matter.
Corporate Social Responsibility (“CSR”)
The Company remains committed to CSR program through the Gamma Foundation, which carries out philanthropic actions around four key principles derived from the United Nation’s Sustainable Development Goals (SDGs):
1. Reduce poverty within the community
2. Support solutions to improve food sufficiency
3. Provide the means for better medical conditions for fellow citizens
4. Improve education
This year marked the 10-year anniversary of Gamma Foundation. Since it was launched, Gamma Foundation has provided over Rs30M in financial support to local NGOs and CSR programmes.
In the year under review, the Foundation supported the following partner NGOs:
• Mouvement Jeunesse de Chebel
• L’Étoile du Berger
• Centre d’Amitié • Anglicare
• Eastern Welfare Association for the Disabled
• Muscular Dystrophy Association
• Soroptimist
• The New Chinatown Foundation
• Anou Grandi Association
In addition, to support the community in the wake of the COVID-19 pandemic, the Foundation launched a #noutousolider campaign in collaboration with Super U and Caritas Ile Maurice aimed at distributing food packages to vulnerable families. Over the course of the year, 590 families in need were supported.
Above and beyond the activities of the Gamma Foundation, the Company provided meals for the elderly at St Hugh’s Home and the Centre d’Amitié.
CORPORATE GOVERNANCE REPORT CORPORATE GOVERNANCE REPORT
46 47

PRINCIPLE 7: AUDIT
Directors’ Responsibility
All Directors have been informed of their duties and responsibilities as provided under the Companies Act 2001, and their responsibility under the Listing Rules.
They are also conversant with the provisions of the Gamma Charter, which applies to the Company, the Company’s constitution and the Code.
External Audit
Appointment of the Company’s external auditors remains a reserved right of the shareholders, though the appointment is made on the recommendation of the Board. The appointment process follows a tender exercise under the oversight of the Audit and Risk Committee, on behalf of the Board. The Company’s external auditor since 2016 is Ernst & Young.
The Board has delegated to the Audit and Risk Committee the responsibility of reviewing the auditors’ letter of engagement before the start of the audit work. The Committee will also monitor the independence of the external auditor and ensure that the auditors are not hindered in any manner whatsoever in the performance of their function.
The external auditors have direct access to the Audit and Risk Committee members and attend the Committee meetings. Once a year, the external auditors also meet with the Board to report on the external audit exercise and present their report to the Board.
Internal Audit
The internal audit (IA) function of Gamma Civic Ltd and the main operating companies is outsourced to KPMG since 2018. The internal auditor reports to the Audit and Risk Committee.
The appointment of the internal auditor was effected following a tender exercise under the supervision of the Audit and Risk Committee, on behalf of the Board. KPMG operates on a risk-based 3-year IA plan, under the supervision of the Audit and Risk Committee.
The key areas to be covered by the internal auditor have been identified following an enterprise wide risk assessment, which is approved by the Audit and Risk Committee. The internal audit plan is reviewed at each Audit and Risk Committee so that any emerging risks, or changed circumstances, may be factored-in to the areas of audit focus.
The duties of the internal auditor are defined in the Gamma Charter, and among others, include the examination and evaluation of the adequacy and effectiveness of the Company’s governance, risk management process, system of internal control structure, and the quality of performance in carrying out assigned responsibilities.
Internal Audit in the Covid-19 context
The outbreak of Covid-19 has demanded significant and rapid changes in the way businesses are operating. The unprecedented circumstances have driven the need for rapid decision making, which has resulted in increased risk in several critical areas. The Internal Audit plan was revised accordingly and adapted to accommodate the following reviews for Gamma Civic Ltd and the main operating companies:
1. Liquidity management and forecasting
Liquidity management and forecast financial information were identified, by the Audit and Risk Committee, as key risk areas having regard to the likely business impact of the Covid-19 pandemic. A robust approach to managing and forecasting the short-term and medium-term cash position is necessary to enable Management to make informed and timely business decisions and to respond to the needs of key stakeholders. As such, a Group-wide liquidity management and forecasting review was performed in 2020.
2. Key controls review
At the request of the Audit and Risk Committee a review of key controls, which were operating in each main operating company during the Covid-19 lockdown and the ensuing months, was performed, in view of the potential impact of work-from-home, and other flexible working arrangements on the company and the group’s internal control systems. The internal audit approach was adapted to focus on the company and group-wide key controls through a collaborative approach with the Management of Gamma Civic Ltd and the main operating companies, with the aim of maintaining a robust risk management environment for the main operating businesses. These key controls covered the main business areas and risks of each company.
In addition to the two special areas of focus during 2020, in accordance with a three-year internal audit plan, 37 internal audit reviews have been carried out for Gamma Civic Ltd and its main operating companies as shown in the diagrammatic representations below.
CORPORATE GOVERNANCE REPORT CORPORATE GOVERNANCE REPORT
16 Operations
6 Gamma
Materials Ltd
7 Others
7 Morning Light Co. Ltd (Hilton)
6 Gamma Civic Ltd
1 Gamma Treasury Management Ltd
7 Kolos
Cement Ltd
5 Lottotech Ltd5
Gamma Construction Ltd
3 Information
System
2 People
9 Finance
48 49

PRINCIPLE 8: RELATIONSHIP WITH SHAREHOLDERS AND KEY STAKEHOLDERS
Communication with Key Stakeholders
The Board of Directors is committed to have an open and transparent communication with its shareholders, local authorities, financial institutions, suppliers, investors and employees at all times. It normally communicates through its Annual report, announcements as provided under the Listing Rules, whenever applicable, through its statutory reporting and publications.
Shareholders holding more than 5% as at 31 December 2020
The composition of Gamma Civic Ltd’s shareholding is as follows:
No individuals or entities held more than 25% of Gamma Civic Ltd as at 31 December 2020.
Share Price Graph
Gamma Civic Ltd - Share Price 2020
Shares in Public Hands
In line with the Listing Rules, the Company has more than 25% of its shareholding in public hand.
Annual Meeting of Shareholders
The Company’s Annual Meeting for the shareholders to approve the audited financial statements including the Company’s annual report, appoint/renew appointment of Directors and the Board and appoint/renew the appointment of the external auditors has been fixed for the 25 June 2021. In due course the appropriate convocation will be issued to all shareholders of the Company to invite them to attend the said Annual Meeting where they are encouraged to ask questions about the financial position of the Company.
The Company Secretary will send out the notices and related papers to all shareholders at least 14 days before the Annual Meeting in accordance with the Company’s Constitution. The notices will clearly explain the procedures on proxy voting and include the deadline for receiving the proxies at the office of the Company Secretary.
The Company also uses its website to keep in touch with its shareholders and stakeholders as all communiqués, dividend announcements, abridged financial statements and sections of the annual reports are posted on the website to keep them informed and updated on Company’s activities and events. In addition to the website, shareholders and stakeholders may obtain further information on the Company and its governance documents from the Company Secretary.
Dividend Policy
According to the Gamma Charter, the Company aims at distributing a dividend which is equivalent to a 3% dividend yield, subject to meeting the requirements of the Solvency Test, and as a rule for each financial year the Company declares and pays an interim and a final dividend.
CORPORATE GOVERNANCE REPORT CORPORATE GOVERNANCE REPORT
Shareholders
Suppliers
Loca
l Aut
horit
iesFinancial
Institutions
Investors
Empl
oyee
s
45.00
35.0040.00
20.00
31-D
ec-1
9
31-J
an-2
0
29-F
eb-2
0
31-M
ar-2
0
30-A
pr-2
0
30-J
un-2
0
30-S
ep-2
0
30-N
ov-2
0
31-M
ay-2
0
31-J
ul-2
0
31-A
ug-2
0
31-O
ct-2
0
31-D
ec-2
0
25.0030.00
Rs Closing Price: 28.95
22.87% Other shareholders holding less than 5%
15.50% Consolidated
Holdings Limited
14.49% Fortier
Capital Limited
14.36% JHD
Holdings Ltd
14.30% Bluesilver Ltd
11.54% Landcorp
Capital Limited
6.94% Cyril How Kin Sang
50 51

PRINCIPLE 8: RELATIONSHIP WITH SHAREHOLDERS AND KEY STAKEHOLDERS
Shareholders’ Calendar of Events
DEC Financial Year End 31 December
MAR Publication of audited abridged group year-end results to 31 December Declaration of Final Dividend
APR Payment of Final Dividend
MAY Publication of unaudited abridged group first quarter’s results to 31 March
JUN Annual meeting of shareholders
AUG Publication of unaudited abridged group half-year’s results to 30 June Declaration of Interim Dividend
SEP Payment of Interim Dividend
NOV Publication of unaudited abridged group third quarter’s results to 30 September
30 March 2021
(Pursuant to Section 75 (3) of the Financial Reporting Act 2004)
Name of Public Interest Entity (“PIE”): Gamma Civic LtdReporting Period: 31 December 2020
We, the Directors of Gamma Civic Ltd confirm that to the best of our knowledge Gamma Civic Ltd has complied with all of its obligations and requirements under the Code of Corporate Governance.
30 March 2021
CORPORATE GOVERNANCE REPORT STATEMENT OF COMPLIANCE
Tommy Ah TeckExecutive Chairman
Maurice Lam Pak NgNon-Executive Director
Tommy Ah TeckExecutive Chairman
Maurice Lam Pak NgNon-Executive Director
52 53

In respect of the preparation of financial statements
The Directors are responsible for preparing the Annual Report and the financial statements in accordance with applicable laws and regulations.
Company law requires the Directors to prepare financial statements in accordance with International Financial Reporting Standards (“IFRS”) for each financial year, which present fairly the financial position, financial performance and cash flows of the Company and the Group.
The Directors confirm that, in preparing the financial statements, they have to:
• Select suitable accounting policies and then apply them consistently;
• Make judgements and accounting estimates that are reasonable and prudent;
• State that IFRS have been adhered to, subject to any material departures being disclosed and explained in the financial statements;
• Prepare the financial statements on the going concern basis, unless it is inappropriate to presume that the Company and the Group will continue in business; and
• Ensure compliance with the Code of Corporate Governance (“Code”) and provide reasons in case of non-compliance with the Code.
The Directors are responsible for keeping proper accounting records, which disclose with reasonable accuracy at any time the financial position of the Company and the Group to enable them to ensure that the financial statements comply with the Mauritius Companies Act 2001, IFRS and the Financial Reporting Act 2004.
They are also responsible for safeguarding the assets of the Company and the Group and hence for taking reasonable steps for the prevention and detection of fraud and other irregularities.
The Directors hereby confirm that they have complied with the above requirements.
Approved by the Board of Directors on 30 March 2021 and signed on its behalf by
30 March 2021
(Pursuant to Section 166(d) of the Companies Act 2001)
We certify that, to the best of our knowledge and belief, Gamma Civic Ltd has filed with the Registrar of Companies all such returns as are required of the Company under the Companies Act 2001 in terms of Section 166(d).
Gamma Corporate Services LtdCompany Secretary
30 March 2021
STATEMENT OF DIRECTORS’ RESPONSIBILITIES SECRETARY’S CERTIFICATE
Twalha DhunnooExecutive Director & Group CFO
Paul HalpinNon-Executive Director
54 55

The directors are pleased to submit their report together with the audited financial statements of Gamma Civic Ltd and the Group for the year ended 31 December 2020.
Main Investments
Gamma Civic Ltd is a listed investment holding company. Its main objectives are to safeguard and enhance its shareholders’ wealth, deliver an acceptable level of return to shareholders and to continue to build a sustainable platform for growth and profitability.
Gamma has investments in different sectors and the principal ones are:
• Contracting;
• Building Materials;
• Lottery;
• Hospitality;
• Properties (Real Estate); and
• Financial Services.
The operations within the sectors mentioned above as carried out by different companies which are subsidiaries, associates and joint venture of Gamma Civic Ltd.
Contracting
Gamma Construction Ltd, a wholly-owned subsidiary, is involved in asphalt production, asphalt and road works and building and civil engineering contracting works both in the private and public sectors.
Building Materials
Gamma Materials Ltd, a jointly controlled company, supplies building materials including aggregates, sand and blocks to the construction industry.
Kolos Cement Ltd, a subsidiary, trades in and distributes cement. It is listed on the Development & Enterprise Market of the Stock Exchange of Mauritius Ltd (“SEM”).
Lottery
Lottotech Ltd, a subsidiary, operates, under licence, the Mauritius National Lottery and is listed on the Official List of the SEM. It launched a new Loterie Vert game on 30 October 2020
Hospitality
Morning Light Co. Ltd, an associate company, operates in the hotel industry through Hilton Mauritius Resort & Spa and is listed on the Development & Enterprise Market of the SEM.
Properties (Real Estate)
BR Capital Ltd owns a seven-storey office building in Ebène known as Burford House. Part of the ground floor is occupied by Artisan Coffee, a brand of coffee shop well known in Mauritius.
The Group also owns several property assets, including freehold and leasehold land.
Financial Services
Square Mile Investment Nine Ltd, an associate company, is engaged, through its subsidiaries, in re-insurance brokering.
Gamma Treasury Management Limited (GTML) is a wholly-owned subsidiary of Gamma Civic Ltd which is engaged in treasury management to the Group companies. GTML is regulated by the Financial Services Commission (FSC) of Mauritius.
Results
Group Performance
Group Statement of Profit or Loss and Other Comprehensive Income Revenue Net Profit after Taxation Dec 2020: Rs3,706M Dec 2020: Rs228M Dec 2019: Rs3,750M Dec 2019: Rs596M
Company
Company Statement of Profit or Loss and Other Comprehensive Income Revenue Net Profit after Taxation Dec 2020: Rs358M Dec 2020: Rs173M Dec 2019: Rs460M Dec 2019: Rs250M
Business Review
For the year ended 31 December 2020, the Group and the Company reported net profit after taxation of Rs228M and Rs173M respectively.
More details on the business review are included in the Executive Chairman’ Statement.
Outlook
More details on the outlook are included in the Executive Chairman’ Statement.
Dividend
A final dividend of Rs1.50 per share (2019: Rs0.75 per share) was declared on 20 March 2020 and was paid by latest 30 June 2020 in respect of the financial year ended 31 December 2019.
No interim dividend (2019: Rs0.50 per share) was declared in respect of the financial year ended 31 December 2020.
On behalf of the Board of Directors
30 March 2021
DIRECTORS’ REPORT DIRECTORS’ REPORT
Twalha DhunnooExecutive Director & Group CFO
Jason Ah TeckExecutive Director
56 57

(Pursuant to Section 221 of the Companies Act 2001 and Section 88 of the Securities Act 2005)
Principal ActivitiesGamma Civic Ltd is an investment company holding investments in different sectors of activities in Mauritius.
Directors’ and Senior Officers’ Interests in SharesStatement of Direct and Indirect Interest of insiders as at 31 December 2020:
Directors’ Remuneration and Benefits
The split of the aggregate remuneration and benefits received and receivable by the Directors of the Company from the Company and its subsidiaries as disclosed in the Corporate Governance Report is as follows: Mr Carl Ah Teck (17%), Mr Tommy Ah Teck (32%), Mr Jason Ah Teck (11%), Mr Twalha Dhunnoo (8%), Mr Patrice Ah Teck (13%), Mr Boon Hui Chan (1%), Mr Marie-Claire Chong Ah-Yan (12%), Mr Paul Halpin (4%), Mr Jean-Claude Lam Hung (1%) and Mr Maurice Lam Pak Ng (1%).
Directors’ service contractsNone of the Directors of the Company have service contracts with the Company.
Contract of SignificanceThe Company has no contract of significance with either a Director or a controlling shareholder.
Directors’ InsuranceThe Directors of Gamma Civic Ltd are insured under the Gamma Civic Ltd master policy directors and officer’s liability insurance.
DonationsThe Company remains committed to CSR through the Gamma Fund and in addition, for the year 2020, the Group and the Company have contributed Rs1,200,000 as non-charitable donations.
Auditors’ remunerationThe remuneration payable by the Company and its subsidiaries for the financial year ended 31 December 2020 was as follows:
30 March 2021
The names of the Directors of the Company’s subsidiaries as at 31 December 2020 were as follows:
Tomm
y Ah Teck
Patrice Ah Teck
Marie C
laire Chong Ah Yan
Adam Issop M
oollan
Paul Halpin
Maurice Lam
Pak Ng
Michelle C
arinci
Kavita Achameesing
Muham
mad Khalid Peyrye
Allagappen Veeramootoo
Goolabchund G
oburdhun
Shailesh Beejhadarsing
Dom
inique Billon
Javier De Benito
Fahmida Jeerooburkhan
Aboo Twalha D
hunnoo
Jean-Claude Lam
Hung
Jacqueline Sitorus
Vivekanada Reddy Challa
Jason Ah Teck
Yive Men Leu San
Cyril H
ow Kin Sang
1 A.S. Burstein Management Ltd •2 Accacias Co Ltd • • •3 Aggregate Resources Co Ltd • •4 Bitumen Storage Ltd • • •5 Boron Investments Ltd • • •6 BR Capital Ltd • • •7 BR Hotel Resorts Ltd • • •8 Broadgate Holding Ltd • • • 9 Broadgate Investment Ltd • •
10 Burford Development Ltd • • • •11 Burford Investments Ltd • • •12 Burford Property Ltd • • •13 Burford Realty Ltd • • •14 Cement Logistics Ltd • •15 Centreview Development Ltd • • •16 Finepoint Property Ltd • • •17 Finepoint Realty Ltd • • •18 Gamlot Technologies Ltd • • •19 Gamma Asia Construction Ltd • •20 Gamma Asia Investment Pte. Ltd • • •20 Gamma Capital Ltd • • • •21 Gamma Cement Holdco Ltd •22 Gamma Cement International Ltd • • •23 Gamma Cement Ltd • • • • •24 Gamma Construction Ltd • • • • • • • •25 Gamma Corporate Services Ltd •26 Gamma Energy Holdings Ltd • • •27 Gamma Energy Ltd • • •28 Gamma FinTech Holding Ltd •29 Gamma Land Ltd • • •30 Gamma Leisure Ltd • • •31 GammaTech Ltd •32 Gamma Treasury Management Limited • • • •33 Gamma Civic Cement Holdings Ltd • •34 Gamma Civic Construction Holdings Ltd • •35 Gamma Civic Construction Ltd • • •36 Gamma Civic Hotel Holdings Ltd • • •37 Gammafin Resource Management Ltd • •38 Glot Holdings (Mauritius) Ltd • • •39 Glot Management Ltd • • •40 Govenland Co Ltd • • •41 G-Traxx Equipment & Rental Ltd • • •42 Infina Investment Ltd • • • •43 Insignia Leisure Resorts Ltd • • •44 Insignia Resorts Ltd • • •45 Kolos Building Materials Ltd • •46 Kolos Cement Ltd • • • • • • • • • •47 Lottotech Ltd • • • • • • • • • •48 Loterie Vert Ltd • • •49 Lotwin Investments Ltd • •50 Ludgate Investments Ltd • • •51 Maurilot Investments Ltd • • •52 Natlot Investments Ltd • • •53 North Point Holdings Ltd • •54 North Point Stone Products Ltd • •55 Osterley Investments Ltd • • • •56 Pool Joseph Merven Ltd • • • •57 Princegate Holdings Ltd • • •58 Regency Realty Ltd • • •59 RHT Media Ltd • • •60 Star Cement Ltd • •61 Traxx Ltd • •62 Westbourne Properties Ltd • • •63 Westview Realty Ltd • • •
OTHER STATUTORY DISCLOSURES LIST OF DIRECTORS – SUBSIDIARIES
No. of SharesNames of Directors Direct Indirect Boon Hui Chan - -Jason Ah Teck 4,500 -Jean-Claude Lam Hung 30,800 -Marie Claire Chong Ah-Yan 1,980,830 3,869,317Maurice Lam Pak Ng - -Patrice Ah Teck 250,000 22,925,777Paul Halpin - -Tommy Ah Teck - 23,175,777Twalha Dhunnoo - -
RsExternal audit fees:- Principal auditors 4,445,365- Other auditors -Tax review fees:- Principal auditors 323,050- Other auditors -Internal audit fees:- Principal auditors -- Other auditors 2,261,925
Twalha DhunnooExecutive Director & Group CFO
Jason Ah TeckExecutive Director
58 59

COMMITTED TO DOING GOOD THAT CREATES GREATNESS

SUMMARY OF PUBLISHED RESULTS AND ASSETS AND LIABILITIES OF THE GROUP
2020 2019 2018
Rs Rs Rs
Turnover 4,617,082,109 5,026,129,299 4,241,252,634
Revenue 3,705,804,870 3,750,331,445 3,261,761,106
Operating Profit 255,625,173 368,216,649 450,995,463
Net (Impairment)/Reversal of Impairment on Financial and Contract Assets (5,615,457) (1,942,036) 2,256,994
Net Gain/(Loss) from Fair Value Adjustment of Investment Properties 6,006,735 181,328,687 (108,948)
Finance costs (49,104,696) (47,965,946) (43,783,093)
Share of Profits of Associates and Joint Venture 75,433,351 184,309,839 124,013,551
Profit before Taxation 282,345,106 683,947,193 533,373,967
Taxation (54,365,083) (87,637,265) (99,377,792)
Profit for the Year 227,980,023 596,309,928 433,996,175
Profit attributable to:
-Owners of the Company 163,356,763 448,390,930 339,517,897
-Non-controlling Interests 64,623,260 147,918,998 94,478,278
227,980,023 596,309,928 433,996,175
Total Comprehensive Income attributable to:
-Owners of the Company 177,175,472 464,853,576 268,720,383
-Non-controlling Interests 67,949,504 150,592,517 96,452,393
245,124,976 615,446,093 365,172,776
Earnings per Share (Basic and Diluted) 1.23 3.37 2.55
2020 2019 2018
Rs Rs Rs
ASSETS 4,553,747,669 4,575,004,085 3,880,872,438
Non-current Assets 1,705,741,200 1,309,047,270 1,478,188,554
Current Assets 6,259,488,869 5,884,051,355 5,359,060,992
Total Assets
EQUITY AND LIABILITIES
Owners' Interests 3,440,444,863 3,463,144,391 3,127,403,828
Non-controlling Interests 204,487,630 206,191,948 217,474,727
Total Equity 3,644,932,493 3,669,336,339 3,344,878,555
Non-current Liabilities 1,050,823,734 931,117,998 570,531,082
Current Liabilities 1,563,732,642 1,283,597,018 1,443,651,355
Total Equity and Liabilities 6,259,488,869 5,884,051,355 5,359,060,992
(A) RESULTS
(B) ASSETS AND LIABILITIES
INDEPENDENT AUDITOR’S REPORT
TO THE SHAREHOLDERS OF Gamma Civic Ltd
REPORT ON THE AUDIT OF THE CONSOLIDATED AND SEPARATE FINANCIAL STATEMENTS
Opinion
We have audited the consolidated and separate financial statements of Gamma Civic Ltd (the “Company”) and its subsidiaries (the “Group”) set out on pages 68 to 149 which comprise the consolidated and separate statements of financial position as at 31 December 2020, and the consolidated and separate statements of profit or loss and other comprehensive income, consolidated and separate statements of changes in equity and consolidated and separate statements of cash flows for the year then ended, and notes to the consolidated and separate financial statements, including significant accounting policies.
In our opinion, the consolidated and separate financial statements give a true and fair view of the consolidated and separate financial position of Group and Company as at 31 December 2020, and of its consolidated and separate financial performance and consolidated and separate cash flows for the year then ended in accordance with International Financial Reporting Standards and comply with the Companies Act 2001 and the Financial Reporting Act 2004.
Basis for Opinion
We conducted our audit in accordance with International Standards on Auditing (ISAs). Our responsibilities under those standards are further described in the Auditor’s Responsibilities for the Audit of the Consolidated and Separate Financial Statements section of our report. We are independent of the Group and the Company in accordance with the International Ethics Standards Board for Accountants’ Code of Ethics for Professional Accountants (IESBA Code) and other independence requirements applicable to performing audits of financial statements of the Group and Company and in Mauritius. We have fulfilled our other ethical responsibilities in accordance with the IESBA Code and in accordance with other ethical requirements applicable to performing audits of the Group and Company and in Mauritius. We believe that the audit evidence we have obtained is sufficient and appropriate to provide a basis for our opinion.
Key Audit Matters
Key audit matters are those matters that, in our professional judgement, were of most significance in our audit of the consolidated and separate financial statements of the current period. These matters were addressed in the context of our audit of the consolidated and separate financial statements as a whole, and in forming our opinion thereon, and we do not provide a separate opinion on these matters. For each matter below, our description of how our audit addressed the matter is provided in that context.
We have fulfilled the responsibilities described in the Auditor’s responsibilities for the audit of the consolidated and separate financial statements section of our report, including in relation to these matters. Accordingly, our audit included the performance of procedures designed to respond to our assessment of the risks of material misstatement of the consolidated and separate financial statements. The results of our audit procedures, including the procedures performed to address the matters below, provide the basis for our audit opinion on the accompanying consolidated and separate financial statements.
Key Audit Matter How the matter was addressed in the audit
Recognition of contract revenue, margin, and related contract assets and receivables
The construction industry is characterised by contract risk with significant judgements involved in the assessment of both current and future contractual performance.
Revenue and margin are recognised using the output method namely surveys of performance completed to date of individual contracts.
- We assessed the design of key controls over the recognition of contract revenue process. Such controls were tested to determine their operating effectiveness;
- We attended cost meetings and inspected respective minutes forming a key part of the entity’s risk process to fully challenge at a lower executive level, both new tenders and contract bids, and ongoing performance on existing contracts;
- We assessed the design of key controls over the recognition of contract revenue recognition process. Such controls were tested to determine their operating effectiveness;
62 63

INDEPENDENT AUDITOR’S REPORT INDEPENDENT AUDITOR’S REPORT
TO THE SHAREHOLDERS OF Gamma Civic Ltd TO THE SHAREHOLDERS OF Gamma Civic Ltd
Key Audit Matter (Cont’d) How the matter was addressed in the audit (Cont’d)
Recognition of contract revenue, margin, and related contract assets and receivables (Cont’d)
Revenue and margin are recognised using the output method namely surveys of performance completed to date of individual contracts.
Refer to note 3 (q) for accounting policy on construction contracts as well as note 4 (critical judgments in applying the accounting policies), note 12 (trade receivables from contracts), note 19 (trade payables arising from contracts) and note 20 (revenue from contracts).
The status of contracts is updated on a regular basis through cost meetings. During this process, management is required to exercise significant judgement in their assessment of the valuation of contract variations, claims and liquidated damages (revenue items); the completeness and accuracy of forecast costs to complete; and the ability to deliver contracts within forecast timescales.
Dependent on the level of judgement in each, the range on each contract can be individually material. In addition, changes in these judgements, and the related estimates, as contracts progress can result in material adjustments to revenue and margin, which can be both positive and negative. For these reasons, we have considered the above as a key audit matter
- We selected a sample of contracts in order to challenge both current and future financial performance. Samples were selected based on a number of quantitative factors, as well as other randomly selected contracts;
For sampled contracts, we challenged management’s key judgements inherent in the forecasting of costs to completion that drives the accounting based on the value of work certified. This included: - a review of the contract terms and conditions by reference to contract documentation;
- testing the existence and valuation of claims and variations both within contract revenue and contract costs via inspection of correspondence with customers and the supply chain;
- a review of legal and experts’ reports received on contentious matters;
- discussions with project managers, quantity surveyors and finance team in respect of all significant contracts to understand the progress to-date, any issues foreseen on those contracts and estimated efforts to satisfy the performance obligations under the contracts and corroboration of these discussions with the accrued costs computed by the management for each contract;
- an assessment of the ability to deliver contracts within budgeted timescales and any exposures to liquidated damages for late delivery of contract works; and the ability to identify and determine foreseeable loses on contracts;
- a review of post-balance sheet certification from clients’ quantity surveyors;
- performing multiple site visits to corroborate findings as per the cost meetings and minutes of major contacts;
- reviewing significant deviations from original revenue, cost and margin estimates, obtaining appropriate explanation from management for such deviations and evaluation of the impact on the revenue recognition;
- Scrutinising all contracts which were closed during the year to consider their profitability and to compare with previous forecasts of those same contracts in order to assess management’s ability to estimate cost of completion;
REPORT ON THE AUDIT OF THE CONSOLIDATED AND SEPARATE FINANCIAL STATEMENTS (CONT’D)
Key Audit Matters (Cont’d)
REPORT ON THE AUDIT OF THE CONSOLIDATED AND SEPARATE FINANCIAL STATEMENTS (CONT’D)
Other Information
The Directors are responsible for the other information. The other information comprises the information included in the document titled “Gamma Civic Ltd Annual Report for the year ended 31 December 2020”, which includes the Corporate Governance Report, Statement of Compliance, Statement of Director’s Responsibilities, Certificate from the Secretary, Director’s Report and Other Statutory Disclosures as required by the Companies Act 2001, which we obtained prior to the date of this report, and the Annual Report, which is expected to be made available to us after that date. Other information does not include the consolidated or the separate financial statements and our auditor’s report thereon.
Our opinion on the consolidated and separate financial statements does not cover the other information and we do not express an audit opinion or any form of assurance conclusion thereon.
In connection with our audit of the consolidated and separate financial statements, our responsibility is to read the other information identified above and, in doing so, consider whether the other information is materially inconsistent with the consolidated and separate financial statements or our knowledge obtained in the audit, or otherwise appears to be materially misstated. If, based on the work we have performed on the other information obtained prior to the date of this auditor’s report, we conclude that there is a material misstatement of this other information, we are required to report that fact. We have nothing to report in this regard.
Corporate Governance Report
The Directors are responsible for preparing the Corporate Governance Report. Our responsibility under the Financial Reporting Act is to report on the compliance with the Code of Corporate Governance (‘’the Code’’) disclosed in the annual report and assess the explanations given for non-compliance with any requirement of the Code. From our assessment of the disclosures made on corporate governance in the annual report, the Group has, pursuant to section 75 of the Financial Reporting Act, complied with the requirements of the Code.
Responsibilities of the Directors for the Consolidated and Separate Financial Statements
The Directors are responsible for the preparation and fair presentation of the consolidated and separate financial statements in accordance with International Financial Reporting Standards and the requirements of the Companies Act 2001 and the Financial Reporting Act 2004, and for such internal control as the Directors determine is necessary to enable the preparation of consolidated and separate financial statements that are free from material misstatement, whether due to fraud or error.
In preparing the consolidated and separate financial statements, the Directors are responsible for assessing the Group and Company’s ability to continue as a going concern, disclosing, as applicable, matters related to going concern and using the going concern basis of accounting unless the Directors either intends to liquidate the Group and the Company or to cease operations, or have no realistic alternative but to do so.
Auditor’s Responsibilities for the Audit of the Consolidated and Separate Financial Statements
Our objectives are to obtain reasonable assurance about whether the consolidated and separate financial statements as a whole are free from material misstatement, whether due to fraud or error, and to issue an auditor’s report that includes our opinion. Reasonable assurance is a high level of assurance, but is not a guarantee that an audit conducted in accordance with ISAs will always detect a material misstatement when it exists. Misstatements can arise from fraud or error and are considered material if, individually or in the aggregate, they could reasonably be expected to influence the economic decisions of users taken on the basis of these consolidated and separate financial statements.
As part of an audit in accordance with ISAs, we exercise professional judgement and maintain professional scepticism throughout the audit. We also:
• Identify and assess the risks of material misstatement of the consolidated and separate financial statements, whether due to fraud or error, design and perform audit procedures responsive to those risks, and obtain audit evidence that is sufficient and appropriate to provide a basis for our opinion. The risk of not detecting a material misstatement resulting from fraud is higher than for one resulting from error, as fraud may involve collusion, forgery, intentional omissions, misrepresentations, or the override of internal control.
No KAM has been identified on separate financial statements.
64 65

INDEPENDENT AUDITOR’S REPORT INDEPENDENT AUDITOR’S REPORT
TO THE SHAREHOLDERS OF Gamma Civic Ltd TO THE SHAREHOLDERS OF Gamma Civic Ltd
REPORT ON THE AUDIT OF THE CONSOLIDATED AND SEPARATE FINANCIAL STATEMENTS (CONT’D)
Auditor’s Responsibilities for the Audit of the Consolidated and Separate Financial Statements (Cont’d)
• Obtain an understanding of internal control relevant to the audit in order to design audit procedures that are appropriate in the circumstances, but not for the purpose of expressing an opinion on the effectiveness of the Group and the Company’s internal control.
• Evaluate the appropriateness of accounting policies used and the reasonableness of accounting estimates and related disclosures made by the directors.
• Conclude on the appropriateness of the director’s use of the going concern basis of accounting and based on the audit evidence obtained, whether a material uncertainty exists related to events or conditions that may cast significant doubt on the Group and Company’s ability to continue as a going concern. If we conclude that a material uncertainty exists, we are required to draw attention in our auditor’s report to the related disclosures in the consolidated and separate financial statements or, if such disclosures are inadequate, to modify our opinion. Our conclusions are based on the audit evidence obtained up to the date of our auditor’s report. However, future events or conditions may cause the Group and/or the Company to cease to continue as a going concern.
• Evaluate the overall presentation, structure and content of the consolidated and separate financial statements, including the disclosures, and whether the consolidated and separate financial statements represent the underlying transactions and events in a manner that achieves fair presentation.
• Obtain sufficient appropriate audit evidence regarding the financial information of the entities or business activities within the Group to express an opinion on the consolidated and separate financial statements. We are responsible for the direction, supervision and performance of the group audit. We remain solely responsible for our audit opinion.
We communicate with the Directors regarding, among other matters, the planned scope and timing of the audit and significant audit findings, including any significant deficiencies in internal control that we identify during our audit.
We also provide the Directors with a statement that we have complied with relevant ethical requirements regarding independence, and to communicate with them all relationships and other matters that may reasonably be thought to bear on our independence, and where applicable, actions taken to eliminate threats or safeguards applied.
From the matters communicated with the Directors, we determine those matters that were of most significance in the audit of the consolidated and separate financial statements of the current period and are therefore the key audit matters. We describe these matters in our auditor’s report unless law or regulation precludes public disclosure about the matter or when, in extremely rare circumstances, we determine that a matter should not be communicated in our report because the adverse consequences of doing so would reasonably be expected to outweigh the public interest benefits of such communication.
REPORT ON THE AUDIT OF THE CONSOLIDATED AND SEPARATE FINANCIAL STATEMENTS (CONT’D)
Use of our report
This report is made solely to the Company’s shareholders, as a body, in accordance with Section 205 of the Companies Act 2001. Our audit work has been undertaken so that we might state to the Company’s shareholders those matters we are required to state to them in an auditor’s report and for no other purpose. To the fullest extent permitted by law, we do not accept or assume responsibility to anyone other than the Company and the Company’s shareholders, as a body, for our audit work, for this report, or for the opinions we have formed.
REPORT ON OTHER LEGAL AND REGULATORY REQUIREMENTS
Companies Act 2001
We have no relationship with or interests in the Group and the Company other than in our capacities as auditor, tax advisors and dealings in the ordinary course of business.
We have obtained all the information and explanations we have required.
In our opinion, proper accounting records have been kept by the Company as far as it appears from our examination of those records.
ERNST & YOUNG ANDRE LAI WAN LOONG, F.C.AEbène, Mauritius Licensed by FRC
30 March 2021
66 67

GROUP COMPANY
Notes 2020 2019 2020 2019 Rs Rs Rs Rs
ASSETS
NON-CURRENT ASSETSProperty, Plant and Equipment 5 1,500,586,833 1,390,218,324 354,940,133 378,827,409 Intangible Assets 6 789,557,765 791,875,184 1,818,666 2,235,888 Investments in Subsidiaries 7 - - 1,544,296,949 1,554,505,204 Investments in Associates and Joint Venture 8 831,550,527 901,239,155 53,245,640 53,245,640
Investment Properties 9 1,354,911,444 1,359,411,285 - - Deferred Tax Assets 17(b) 19,003,605 9,959,016 - - Contract Assets 12 50,351,096 87,513,810 - - Non-Current Receivables 31 7,786,399 34,787,311 490,114 490,114
4,553,747,669 4,575,004,085 1,954,791,502 1,989,304,255
CURRENT ASSETSInventories 11 250,060,102 167,552,556 - - Contract Assets 12 484,315,482 309,741,470 - - Trade and Other Receivables 12(a) 307,903,624 338,792,133 73,770,211 68,875,167 Amounts due from Subsidiaries 28 - - 26,311,888 86,254,259 Cash and Cash Equivalents 26 652,955,415 492,961,111 114,653,886 100,062,733
1,695,234,623 1,309,047,270 214,735,985 255,192,159 Assets classified as held for Sale 32 10,506,577 - - -
Total Current Assets 1,705,741,200 1,309,047,270 214,735,985 255,192,159
TOTAL ASSETS 6,259,488,869 5,884,051,355 2,169,527,487 2,244,496,414
EQUITY AND LIABILITIESCAPITAL AND RESERVESStated Capital 13 133,250,000 133,250,000 133,250,000 133,250,000 Share Premium 86,482,579 86,482,579 86,482,579 86,482,579 Other Reserves 3,220,712,284 3,243,411,812 1,217,014,136 1,245,018,957 EQUITY ATTRIBUTABLE TO OWNERS OF THE COMPANY 3,440,444,863 3,463,144,391 1,436,746,715 1,464,751,536
NON-CONTROLLING INTERESTS 7(d) 204,487,630 206,191,948 - -
TOTAL EQUITY 3,644,932,493 3,669,336,339 1,436,746,715 1,464,751,536
NON-CURRENT LIABILITIESLoans 14 608,279,721 561,814,616 387,884,465 390,028,047 Trade and Other Payables 19 95,573,338 36,268,206 - - Contract Liabilities 19(a) 13,027,268 12,093,812 - - Lease Liabilities 15 206,326,386 210,030,818 21,121,668 24,658,248 Retirement Benefit Obligations 16(c) 63,531,863 52,742,968 6,211,000 4,778,000 Deferred Tax Liabilities 17(b) 64,085,158 58,167,578 9,629,520 4,561,000
1,050,823,734 931,117,998 424,846,653 424,025,295
CURRENT LIABILITIESBank Overdrafts 18/26 23,421,268 19,187,897 - - Loans 14 161,574,069 71,462,675 70,352,211 68,208,629 Lease Liabilities 15 35,443,570 22,229,727 3,536,580 3,336,929 Trade and Other Payables 19 1,141,307,292 959,819,098 124,750,835 134,313,325 Contract Liabilities 19(a) 170,965,743 182,039,163 - - Amounts due to Subsidiaries 28 - - 102,883,478 149,860,700 Current Tax Liabilities 17(a) 31,020,700 28,858,458 6,411,015 -
1,563,732,642 1,283,597,018 307,934,119 355,719,583
TOTAL LIABILITIES 2,614,556,376 2,214,715,016 732,780,772 779,744,878
TOTAL EQUITY AND LIABILITIES 6,259,488,869 5,884,051,355 2,169,527,487 2,244,496,414
STATEMENTS OF FINANCIAL POSITION
AT 31 DECEMBER 2020
GROUP COMPANYNotes 2020 2019 2020 2019
Rs Rs Rs Rs
Turnover 20 4,617,082,109 5,026,129,299 358,066,897 459,566,364
Revenue 20 3,705,804,870 3,750,331,445 358,066,897 459,566,364
Operating Profit 21 255,625,173 368,216,649 204,465,222 292,720,031 Net Impairment on Financial and Contract Assets 12 (5,615,457) (1,942,036) (2,326,234) (4,770,510)Net Gain from Fair Value Adjustment of Investment Properties 9 6,006,735 181,328,687 - -
Finance costs 22 (49,104,696) (47,965,946) (18,482,943) (25,984,423)Share of Profits of Associates and Joint Venture 8 75,433,351 184,309,839 - -
Profit before Taxation 282,345,106 683,947,193 183,656,045 261,965,098 Taxation 17(a) (54,365,083) (87,637,265) (11,021,611) (11,805,198)
PROFIT FOR THE YEAR 227,980,023 596,309,928 172,634,434 250,159,900
OTHER COMPREHENSIVE INCOMEItems that will not be classified subsequently to Profit or Loss:Gain on Revaluation of Property 5 20,408,877 18,338,368 37,669 2,875,661 Deferred Tax on Gain on Revaluation of Property 17(b) (3,783,989) (3,096,272) (516,404) (467,612)
Share of Gain on Property Revaluation of Associates and Joint Venture
8(a) 7,473,777 5,646,566 - -
Remeasurement of Actuarial (Loss)/Gain on Retirement Benefit Obligations
16(f) (8,817,879) 1,177,523 (344,000) (393,000)
Deferred Tax on Remeasurement of Retirement Benefit Obligations
17(b) 1,497,339 (185,559) 58,480 66,810
Remeasurement of Actuarial Gain/(Loss) on Retirement Benefit Obligations in Associates & Joint Venture
8(a) 81,045 (2,998,778) -
-
Items to be classified subsequently to Profit or Loss:Foreign Currency Translation Reserves Movement 285,783 254,317 - -
OTHER COMPREHENSIVE INCOME/(LOSS) FOR THE YEAR 17,144,953 19,136,165 (764,255) 2,081,859
TOTAL COMPREHENSIVE INCOME FOR THE YEAR 245,124,976 615,446,093 171,870,179 252,241,759
PROFIT ATTRIBUTABLE TO:Owners of the Company 163,356,763 448,390,930 172,634,434 250,159,900 Non-Controlling Interests 64,623,260 147,918,998 - -
227,980,023 596,309,928 172,634,434 250,159,900
TOTAL COMPREHENSIVE INCOME ATTRIBUTABLE TO:Owners of the Company 177,175,472 464,853,576 171,870,179 252,241,759 Non-Controlling Interests 67,949,504 150,592,517 - -
245,124,976 615,446,093 171,870,179 252,241,759
EARNINGS PER SHARE (Basic and Diluted)
24 1.23 3.37
STATEMENT OF PROFIT OR LOSS AND OTHER COMPREHENSIVE INCOMEFOR THE YEAR ENDED 31 DECEMBER 2020
Approved by the Board of Directors and signed on its behalf on 30 March 2021.
The notes on pages 74 to l49 form an integral part of these financial statements.The notes on pages 74 to l49 form an integral part of these financial statements.
Twalha Dhunnoo Paul HalpinExecutive Director & Group CFO Non-Executive Director
68 69
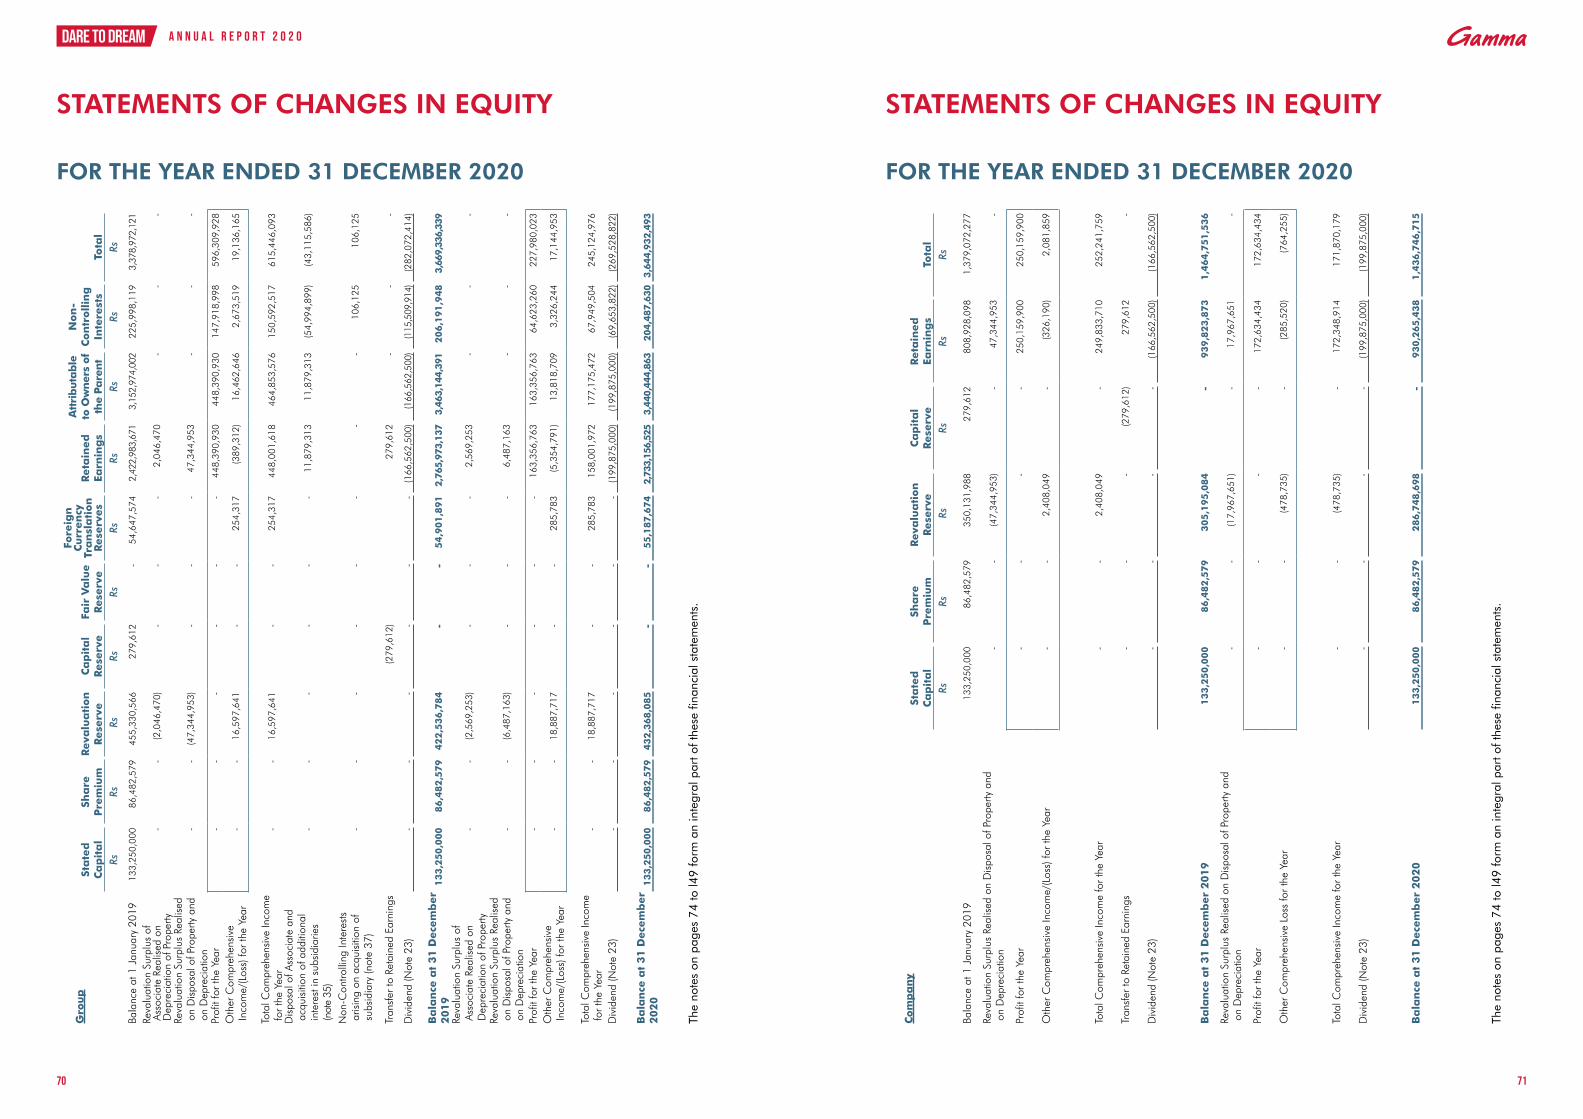
STATEMENTS OF CHANGES IN EQUITY
FOR THE YEAR ENDED 31 DECEMBER 2020
Gro
up
Sta
ted
C
ap
ita
l Sh
are
P
rem
ium
Reva
lua
tion
Rese
rve
Ca
pit
al
Rese
rve
Fair
Va
lue
Rese
rve
Fore
ign
C
urr
en
cy
Tra
nsl
ati
on
Rese
rves
Reta
ined
Ea
rnin
gs
Att
rib
uta
ble
to
Ow
ner
s of
the
Pare
nt
Non
-C
on
trollin
g
Inte
rest
sTo
tal
RsRs
Rs
RsRs
RsRs
RsRs
Rs
Bala
nce
at 1
Jan
uary
201
913
3,25
0,00
0 86
,482
,579
45
5,33
0,56
6 27
9,61
2 -
54
,647
,574
2,
422,
983,
671
3,15
2,97
4,00
2 22
5,99
8,11
9 3,
378,
972,
121
Reva
luat
ion
Surp
lus
of
Ass
ocia
te R
ealis
ed o
n
Dep
reci
atio
n of
Pro
perty
-
-
(2,0
46,4
70)
-
-
-
2,04
6,47
0 -
-
-
Reva
luat
ion
Surp
lus
Real
ised
o
n D
ispo
sal o
f Pro
perty
and
o
n D
epre
ciat
ion
-
-
(47,
344,
953)
-
-
-
47,3
44,9
53
-
-
-
Prof
it fo
r th
e Ye
ar -
-
-
-
-
-
44
8,39
0,93
0 44
8,39
0,93
0 14
7,91
8,99
8 59
6,30
9,92
8
Oth
er C
ompr
ehen
sive
In
com
e/(L
oss)
for
the
Year
-
-
16,5
97,6
41
-
-
254,
317
(389
,312
)16
,462
,646
2,
673,
519
19,1
36,1
65
Tota
l Com
preh
ensi
ve In
com
e
for
the
Year
-
-
16,5
97,6
41
-
-
254,
317
448,
001,
618
464,
853,
576
150,
592,
517
615,
446,
093
Dis
posa
l of A
ssoc
iate
and
a
cqui
sitio
n of
add
ition
al
inte
rest
in s
ubsi
diar
ies
(not
e 35
)
-
-
-
-
-
-
11,8
79,3
13
11,8
79,3
13
(54,
994,
899)
(43,
115,
586)
Non
-Con
trolli
ng In
tere
sts
a
risin
g on
acq
uisi
tion
of
sub
sidi
ary
(not
e 37
) -
-
-
-
-
-
-
-
10
6,12
5 10
6,12
5
Tran
sfer
to R
etai
ned
Earn
ings
(279
,612
)27
9,61
2 -
-
-
Div
iden
d (N
ote
23)
-
-
-
-
-
-
(166
,562
,500
)(1
66,5
62,5
00)
(115
,509
,914
)(2
82,0
72,4
14)
Ba
lan
ce a
t 31 D
ece
mb
er
2019
133,2
50,0
00
86,4
82,5
79
422,5
36,7
84
-
-
54,9
01,8
91
2,76
5,97
3,13
7
3,46
3,14
4,39
1
206,1
91,9
48
3,66
9,33
6,33
9
Reva
luat
ion
Surp
lus
of
Ass
ocia
te R
ealis
ed o
n
Dep
reci
atio
n of
Pro
perty
-
-
(2,5
69,2
53)
-
-
-
2,56
9,25
3 -
-
-
Reva
luat
ion
Surp
lus
Real
ised
o
n D
ispo
sal o
f Pro
perty
and
o
n D
epre
ciat
ion
-
-
(6,4
87,1
63)
-
-
-
6,48
7,16
3 -
-
-
Prof
it fo
r th
e Ye
ar -
-
-
-
-
-
16
3,35
6,76
3 16
3,35
6,76
3 64
,623
,260
22
7,98
0,02
3
Oth
er C
ompr
ehen
sive
In
com
e/(L
oss)
for
the
Year
-
-
18,8
87,7
17
-
-
285,
783
(5,3
54,7
91)
13,8
18,7
09
3,32
6,24
4 17
,144
,953
Tota
l Com
preh
ensi
ve In
com
e
for
the
Year
-
-
18,8
87,7
17
-
-
285,
783
158,
001,
972
177,
175,
472
67,9
49,5
04
245,
124,
976
Div
iden
d (N
ote
23)
-
-
-
-
-
-
(199
,875
,000
)(1
99,8
75,0
00)
(69,
653,
822)
(269
,528
,822
)
Ba
lan
ce a
t 31 D
ece
mb
er
2020
133,2
50,0
00
86,4
82,5
79
432,3
68,0
85
-
-
55,1
87,6
74
2,73
3,15
6,52
5
3,44
0,44
4,86
3
204,4
87,6
30
3,6
44,9
32,4
93
The
note
s on
pag
es 7
4 to
l49
form
an
inte
gral
par
t of t
hese
fina
ncia
l sta
tem
ents
.
STATEMENTS OF CHANGES IN EQUITY
FOR THE YEAR ENDED 31 DECEMBER 2020
Com
pa
ny
Sta
ted
C
ap
ita
l Sh
are
P
rem
ium
Reva
lua
tion
Rese
rve
Ca
pit
al
Rese
rve
Reta
ined
Ea
rnin
gs
Tota
lRs
Rs R
s Rs
RsRs
Bala
nce
at 1
Jan
uary
201
913
3,25
0,00
0 86
,482
,579
35
0,13
1,98
8 27
9,61
2 80
8,92
8,09
8 1,
379,
072,
277
Reva
luat
ion
Surp
lus
Real
ised
on
Dis
posa
l of P
rope
rty a
nd
on
Dep
reci
atio
n -
-
(4
7,34
4,95
3) -
47
,344
,953
-
Prof
it fo
r th
e Ye
ar -
-
-
-
25
0,15
9,90
0 25
0,15
9,90
0
Oth
er C
ompr
ehen
sive
Inco
me/
(Los
s) fo
r th
e Ye
ar -
-
2,
408,
049
-
(326
,190
)2,
081,
859
Tota
l Com
preh
ensi
ve In
com
e fo
r th
e Ye
ar -
-
2,
408,
049
-
249,
833,
710
252,
241,
759
Tran
sfer
to R
etai
ned
Earn
ings
-
-
-
(279
,612
)27
9,61
2 -
Div
iden
d (N
ote
23)
-
-
-
-
(166
,562
,500
)(1
66,5
62,5
00)
Ba
lan
ce a
t 31 D
ece
mb
er
2019
133,2
50,0
00
86,4
82,5
79
305,1
95,0
84
-
939,8
23,8
73
1,4
64,7
51,5
36
Reva
luat
ion
Surp
lus
Real
ised
on
Dis
posa
l of P
rope
rty a
nd
on
Dep
reci
atio
n -
-
(1
7,96
7,65
1) -
17
,967
,651
-
Prof
it fo
r th
e Ye
ar -
-
-
-
17
2,63
4,43
4 17
2,63
4,43
4
Oth
er C
ompr
ehen
sive
Los
s fo
r th
e Ye
ar -
-
(4
78,7
35)
-
(285
,520
)(7
64,2
55)
Tota
l Com
preh
ensi
ve In
com
e fo
r th
e Ye
ar -
-
(4
78,7
35)
-
172,
348,
914
171,
870,
179
Div
iden
d (N
ote
23)
-
-
-
-
(199
,875
,000
)(1
99,8
75,0
00)
Ba
lan
ce a
t 31 D
ece
mb
er
2020
133,2
50,0
00
86,4
82,5
79
286,7
48,6
98
-
930,2
65,4
38
1,4
36,7
46,7
15
The
note
s on
pag
es 7
4 to
l49
form
an
inte
gral
par
t of t
hese
fina
ncia
l sta
tem
ents
.
70 71

STATEMENTS OF CASH FLOWS
GROUP COMPANYNotes 2020 2019 2020 2019
Rs Rs Rs Rs
CASH FLOWS FROM OPERATING ACTIVITIES
Profit before Tax 282,345,106 683,947,193 183,656,045 261,965,098 Adjustments for:Depreciation of Property, Plant and Equipment 5 70,992,980 90,893,263 3,979,542 4,026,387
Depreciation of Right-of-Use assets 5(g) 42,652,001 40,349,888 3,892,966 3,892,966 Amortisation of Intangible Assets 6 2,553,671 2,400,493 653,472 558,973 Impairment Loss Recognised on Trade Receivables
12(a) 5,615,457 1,942,036 522,026 4,770,510
Impairment Loss Recognised on Investment in Subsidiaries - - 5,179,077 13,206,656
Impairment of goodwill 6 - 36,999,402 - - Property, Plant and Equipment scrapped 5 - 216,000 - 216,000 Provision for Slow Moving Inventories 21 4,663,452 3,662,043 - - Net Foreign Exchange Differences (7,375,715) (2,246,101) (4,588,136) (231,535)Interest Expense 22 49,104,696 47,965,946 18,482,943 25,984,423 Interest Income 21 (4,410,411) (5,709,838) (1,099,085) (2,367,235)Dividend Income 20 - - (236,344,637) (314,164,686)Non-cash Element of Retirement Benefit Expense 16 8,289,933 10,704,827 1,122,000 900,000
(Profit)/Loss on Disposal of Property, Plant and Equipment 21 (524,085) (634,020) (2,106,694) 1,542,418
Profit on disposal of Subsidiary 21 - (875,383) - - Amortisation of Land Lease Payment 480,912 480,911 - - Profit on disposal of Associate 21 - (11,879,313) - - Net Gain from Fair Value adjustment on Investment Properties 9 (6,006,735) (181,328,687) - -
Share of Profit of Associates and Joint Venture 8(e) (75,433,351) (184,309,839) - -
OPERATING PROFIT BEFORE WORKING CAPITAL CHANGES 372,947,911 532,578,821 (26,650,481) 299,975
(Increase)/Decrease in Inventories (87,170,998) 8,789,579 - - (Increase)/Decrease in Non-Current Receivables, Contract Assets, and Trade and Other Receivables
(91,618,381) 5,069,879 (5,401,934) 46,394,252
Decrease/(Increase) in Amount due from Subsidiaries - - 59,404,006 (15,809,937)
Increase/(Decrease) in Contract Liabilities, and Trade and Other Payables 232,415,151 (39,480,625) (7,277,472) 26,303,041
Increase/(Decrease) in Amount due to Subsidiaries - - 3,022,778 (7,721,993)
CASH GENERATED FROM OPERATIONS 426,573,683 506,957,654 23,096,897 49,465,338
Interest Paid (50,866,485) (48,269,522) (20,244,732) (26,287,999)Dividend Paid to Owners of the Company 23 (199,875,000) (166,562,500) (199,875,000) (166,562,500)Dividend Paid to Non-controlling Interests (69,653,822) (115,509,914) - - Dividend Received 152,681,801 99,582,227 236,344,637 314,164,686 Income Tax Paid 17 (57,616,500) (79,550,751) - - Retirement Benefits Paid 16 (33,000) (1,067,000) (33,000) -
NET CASH FLOWS GENERATED FROM OPERATING ACTIVITIES 201,210,677 195,580,194 39,288,802 170,779,525
STATEMENTS OF CASH FLOWS
GROUP COMPANYNotes 2020 2019 2020 2019
Rs Rs Rs Rs
CASH FLOWS FROM INVESTING ACTIVITIESPurchase of Property, Plant and Equipment
25 (164,575,606) (114,898,728) (892,294) (189,541)
Purchase of Intangible Assets 6 (236,252) (870,910) (236,250) -
Proceeds from Disposal of Property, Plant and Equipment 3,193,046 9,911,727 51,425 7,659,179
Consideration paid for acquiring investment in Subsidiary
36 - (23,031,288) - -
Incorporation of Subsidiary/Additional Investment in Subsidiary - - (3,990) (106,114,180)
Payment for Shares in Associates (5,000) (110,278,360) - - Proceeds from Disposal of Subsidiary - 1,000,000 - 1,000,000 Additions to Investment Properties - (74,689,456) - -
Decrease in Non-current Amount due from Subsidiaries - - 2,800,000 88,505,209
Increase in Non-current Amount due from Subsidiaries - - (28,766,832) (36,021,311)
Interest Received 4,410,411 5,709,838 1,099,085 2,367,235
NET CASH FLOWS USED IN FROM INVESTING ACTIVITIES (157,213,401) (307,147,177) (25,948,856) (42,793,409)
CASH FLOWS FROM FINANCING ACTIVITIES
New Loans 140,000,000 97,400,000 - - Repayment of Loans (3,423,501) (114,117,512) - (114,117,512)Repayments under Lease Agreements (32,188,557) (36,112,738) (3,336,929) (3,148,550)
NET CASH FLOWS GENERATED FROM/(USED IN) FINANCING ACTIVITIES
104,387,942 (52,830,250) (3,336,929) (117,266,062)
NET INCREASE/(DECREASE) IN CASH AND CASH EQUIVALENTS 148,385,218 (164,397,233) 10,003,017 10,720,054
Net Foreign Exchange Differences 7,375,715 2,246,101 4,588,136 231,535
CASH AND CASH EQUIVALENTS AT 1 JANUARY 473,773,214 635,924,346 100,062,733 89,111,144
CASH AND CASH EQUIVALENTS AT 31 DECEMBER
26 629,534,147 473,773,214 114,653,886 100,062,733
The notes on pages 74 to l49 form an integral part of these financial statements.
FOR THE YEAR ENDED 31 DECEMBER 2020 FOR THE YEAR ENDED 31 DECEMBER 2020
72 73

NOTES TO THE FINANCIAL STATEMENTS
1. INCORPORATION AND ACTIVITIES The consolidated financial statements of Gamma Civic Ltd and its subsidiaries (collectively, the “Group”) for the year ended 31 December 2020 were authorised for issue in accordance with a resolution of the Directors on 30 March 2021. Gamma Civic Ltd (the “Company”) is a public company incorporated in Mauritius and listed on the Official Market of the Stock Exchange of Mauritius Ltd. Its registered office is situated at Royal Road, Chapman Hill, Beau Bassin, Mauritius. The Company operates as an investment holding company. The Group operates in the following business segments: building materials, contracting, investments, lottery, corporate services and others. Its principal place of business is situated at HSBC Centre, Bank Street, Cybercity, Ebene, Mauritius.
2. CHANGES IN ACCOUNTING POLICIES AND DISCLOSURES The Group applied for the first-time certain standards and amendments, which are effective for annual periods beginning on or after 1 January 2020. The Group has not early adopted any other standard, interpretation or amendment that has been issued but is not yet effective.
Effective for accounting period beginning on or after
Definition of a Business (Amendments to IFRS 3) 1 January 2020
Amendments to IFRS 7, IFRS 9 and IAS 39 Interest Rate Benchmark Reform 1 January 2020
Definition of Material (Amendments to IAS 1 and IAS 8) 1 January 2020
Definition of a Business (Amendments to IFRS 3)
The amendment to IFRS 3 Business Combinations clarifies that to be considered a business, an integrated set of activities and assets must include, at a minimum, an input and a substantive process that, together, significantly contribute to the ability to create output. Furthermore, it clarifies that a business can exist without including all of the inputs and processes needed to create outputs. These amendments had no impact on the consolidated financial statements of the Group, but may impact future periods should the Group enter into any business combinations.
Amendments to IFRS 7, IFRS 9 and IAS 39 Interest Rate Benchmark Reform
The amendments to IFRS 9 and IAS 39 Financial Instruments: Recognition and Measurement provide a number of reliefs, which apply to all hedging relationships that are directly affected by interest rate benchmark reform. A hedging relationship is affected if the reform gives rise to uncertainty about the timing and/or amount of benchmark- based cash flows of the hedged item or the hedging instrument. These amendments have no impact on the consolidated financial statements of the Group as it does not have any interest rate hedge relationships.
Definition of Material (Amendments to IAS 1 and IAS 8)
The amendments provide a new definition of material that states, “information is material if omitting, misstating or obscuring it could reasonably be expected to influence decisions that the primary users of general purpose financial statements make on the basis of those financial statements, which provide financial information about a specific reporting entity.” The amendments clarify that materiality will depend on the nature or magnitude of information, either individually or in combination with other information, in the context of the financial statements. A misstatement of information is material if it could reasonably be expected to influence decisions made by the primary users. These amendments had no impact on the consolidated financial statements of, nor is there expected to be any future impact to the Group.
Amendments to IFRS 16 Covid-19 Related Rent Concessions
On 28 May 2020, the IASB issued Covid-19-Related Rent Concessions - amendment to IFRS 16 Leases. The amendments provide relief to lessees from applying IFRS 16 guidance on lease modification accounting for rent concessions arising as a direct consequence of the Covid-19 pandemic. As a practical expedient, a lessee may elect not to assess whether a Covid-19 related rent concession from a lessor is a lease modification. A lessee that makes this election accounts for any change in lease payments resulting from the Covid-19 related rent concession the same way it would account for the change under IFRS 16, if the change were not a lease modification. The amendment applies to annual reporting periods beginning on or after 1 June 2020 and had no impact on the consolidated financial statements of the Group.
NOTES TO THE FINANCIAL STATEMENTS
2.1 NEW AND AMENDED STANDARDS AND INTERPRETATIONS ISSUED BUT NOT YET EFFECTIVE The new and amended standards and interpretations that are issued, but not yet effective up to the date of issuance of the Group’s financial statements are listed below. The Group intends to adopt these new and amended standards and interpretations when they become effective, if applicable.
New or amended standards Effective for accounting period beginning on or after
Amendments to IFRS 3 Reference to the Conceptual Framework 1 January 2022
Amendments to IAS 16 Property, Plant and Equipment 1 January 2022
Amendments to IAS 37 Onerous Contracts 1 January 2022
Amendments to IFRS 1 First-time Adoption of International Financial Reporting Standards
1 January 2022
Amendments to IFRS 9 Financial Instruments 1 January 2022
Amendments to IAS 41 Agriculture 1 January 2022
IFRS 17 Insurance Contracts 1 January 2023
Amendments to IAS 1 Classification of Liabilities as Current or Non-current 1 January 2023
These amendments are not expected to have a significant impact on the financial statements of the Groupand Company.
3. SIGNIFICANT ACCOUNTING POLICIES
(a) Basis of Preparation
The consolidated financial statements are prepared under the historical cost convention, as modified by the revaluation of certain property, plant and equipment, investment properties and certain financial instruments. The consolidated financial statements have been prepared in accordance with International Financial Reporting Standards (“IFRSs”). The consolidated financial statements are presented in Mauritian Rupees and all values are rounded to the nearest Mauritian Rupee, except when otherwise indicated.
Historical cost is generally based on the fair value of the consideration given in exchange for goods and services.
Fair value is the price that would be received to sell an asset or paid to transfer a liability in an orderly transaction between market participants at the measurement date, regardless of whether that price is directly observable or estimated using another valuation technique. In estimating the fair value of an asset or a liability, the Group takes into account the characteristics of the asset or liability if market participants would take those characteristics into account when pricing the asset or liability at the measurement date.
In addition, for financial reporting purposes, fair value measurements are categorised into Level 1, 2 or 3 based on the degree to which the inputs to the fair value measurements are observable and the significance of the inputs to the fair value measurement in its entirety, which are described as follows:
Level 1 inputs are quoted prices (unadjusted) in active markets for identical assets or liabilities that the entity can access at the measurement date;
Level 2 inputs are inputs, other than quoted prices included within Level 1, that are observable for the asset or liability, either directly or indirectly; and
Level 3 inputs are unobservable inputs for the asset or liability.
(b) Investments in Subsidiaries
In the Company’s financial statements, investments in subsidiaries are stated at cost, less any impairment loss. Non-Current amounts due from subsidiaries are classified as Investment in Subsidiaries by the Company as these amounts are unsecured and management does not intend to recall any amount within the next twelve months. These amounts are in substance an extension of the equity investments in these subsidiaries so that the amounts are stated at nominal value.
FOR THE YEAR ENDED 31 DECEMBER 2020 FOR THE YEAR ENDED 31 DECEMBER 2020
74 75

NOTES TO THE FINANCIAL STATEMENTS
3. SIGNIFICANT ACCOUNTING POLICIES (CONT’D)
(c) Investments in Associates and Joint Venture
Associates are those companies which are not subsidiaries, over which the Group exercises significant influence and in which it holds a long-term equity interest. Significant influence is the power to participate in the financial and operating policy decisions of the investee but is not control or joint control over those policies.
A joint venture is a type of joint arrangement whereby the parties that have joint control of the arrangement have rights to the net assets of the joint venture. Joint control is the contractually agreed sharing of control of an arrangement, which exists only when decisions about the relevant activities require unanimous consent of the parties sharing control.
Investments in associates and joint venture are accounted for at cost in the Company’s accounts and under the equity method of accounting in the Group accounts from the date on which investee becomes an associate or a joint venture. Under the equity method, the Group’s share of the associates’ and joint venture’s profit or loss for the year is recognised in the Statements of Profit or Loss and Other Comprehensive Income and the Group’s interest in the associate and joint venture is carried in the Statements of Financial Position at an amount that reflects its share of the net assets of the associates and joint venture.
When the Group’s share of losses of an associate of joint venture exceeds the Group’s interest in the associate or joint venture, the Group discontinues recognising its share of further losses. Additional losses are recognised only to the extent that the Group has incurred legal or constructive obligations or made payments on behalf of associate the or joint venture.
The Group discontinues the use of the equity method from the date when the investment ceases to be an associate or a joint venture, or when the investment is classified as held for sale.
The Group continues to use the equity method when an investment in an associate becomes an investment in a joint venture or an investment in a joint venture becomes an investment in an associate. There is no remeasurement to fair value upon such changes in ownership interests.
Any excess of the cost of acquisition over the Group’s share of the net fair value of the identifiable assets, liabilities and contingent liabilities of the associate and joint venture recognised at the date of acquisition is recognised as goodwill. The goodwill is included within the carrying amount of the investment and is assessed for impairment on an annual basis as part of the investment. Any excess of the Group’s share of the net fair value of the identifiable assets, liabilities and contingent liabilities over the cost of acquisition, after reassessment, is recognised immediately in the Statements of Profit or Loss and Other Comprehensive Income.
(d) Basis of Consolidation
The consolidated financial statements include the results of the Company and its subsidiaries which are controlled by the Company. Control is achieved by the Company when:
- has power over the investee; - is exposed, or has rights, to variable returns from its involvement with the investee; and - has the ability to use its power to affect its returns.
The results of subsidiaries acquired or disposed of during the year are included in the Statements of Profit or Loss and Other Comprehensive Income from the date of their control is acquired or up to the date when control is lost.
Specifically, income and expenses of a subsidiary acquired or Company loses control of the subsidiary disposed of during the year are included in the consolidated statement of profit or loss and other comprehensive income from the date the Company gains control until the date when the Company ceases to control the subsidiary. All intragroup assets and liabilities, equity, income, expenses and cash flows relating to transactions between members of the Group are eliminated in full on consolidation. When the Company has less than a majority of the voting rights of an investee, it has power over the investee when the voting rights are sufficient to give it the practical ability to direct the relevant activities of the investee unilaterally.
The Company considers all relevant facts and circumstances in assessing whether or not the Company’s voting rights in an investee are sufficient to give it power, including:
- the size of the Company’s holding of voting rights relative to the size and dispersion of holdings of the other vote holders;
- potential voting rights held by the Company, other vote holders or other parties;
NOTES TO THE FINANCIAL STATEMENTS
3. SIGNIFICANT ACCOUNTING POLICIES (CONT’D)
(d) Basis of Consolidation (Cont’d)
- rights arising from other contractual arrangements; and - any additional facts and circumstances that indicate that the Company has, or does not have, the current ability to direct the relevant activities at the time that decisions need to be made, including voting patterns at previous shareholders’ meetings.
The Company reassesses whether or not it controls an investee if facts and circumstances indicate that there are changes to one or more of the three elements of control listed above.
Profit or loss and each component of other comprehensive income are attributed to the owners of the Company and to the non-controlling interests. Total comprehensive income of subsidiaries is attributed to the owners of the Company and to the non-controlling interests even if this results in the non-controlling interests having a deficit balance.
When necessary, adjustments are made to the financial statements of subsidiaries to bring their accounting policies into line with the Group’s accounting policies.
Changes in the Group’s interest in a subsidiary that do not result in a loss of control are accounted for as equity transactions. The carrying amounts of the Group’s interests and the non-controlling interests are adjusted to reflect the changes in their relative interests in the subsidiary. Any difference between the amount by which the non-controlling interests are adjusted and the fair value of the consideration paid or received is recognised directly in equity and attributed to owners of the Company.
When the Group loses control of a subsidiary, the profit or loss on disposal is calculated as the difference between (i) the aggregate of the fair value of the consideration received and the fair value of any retained interest and (ii) the previous carrying amount of the assets (including goodwill), and liabilities of the subsidiary and any non- controlling interests. Amounts previously recognised in other comprehensive income in relation to the subsidiary are accounted for (i.e. reclassified to profit or loss or transferred directly to retained earnings) in the same manner as would be required if the relevant assets or liabilities were disposed of. The fair value of any investment retained in the former subsidiary at the date when control is lost is regarded as the fair value on initial recognition for subsequent accounting under IFRS 9 Financial Instruments: Recognition and Measurement or, when applicable, the cost on initial recognition of an investment in an associate or jointly controlled entity.
(e) Business Combinations
The acquisition of subsidiaries is accounted for using the acquisition method. The cost of the acquisition is measured at the aggregate of the fair values, at the date of exchange, of assets given, liabilities incurred or assumed, and equity instruments issued by the Group in exchange for control of the acquiree. The acquiree’s identifiable assets, liabilities and contingent liabilities that meet the conditions for recognition under IFRS 3 are recognised at their fair values at the acquisition date.
Non-controlling interests in the net assets of consolidated subsidiaries are identified separately from the Group’s equity therein. Non-controlling interests consist of the amount of those interests at the date of the original business combination and the minority’s share of change in equity since the date of the combination. Total comprehensive income is attributed to non-controlling interests even if this results in the non-controlling interests having a deficit balance.
Goodwill arising on acquisition is recognised as an asset and initially measured at cost, being the excess of the cost of the business combination over the Group’s interest in the net fair value of the identifiable assets, liabilities and contingent liabilities recognised. If, after reassessment, the Group’s interest in the net fair value of the acquiree’s identifiable assets, liabilities and contingent liabilities exceeds the cost of the business combination, the excess is recognised immediately in the Statements of Profit or Loss and other Comprehensive Income.
Goodwill is subsequently measured at cost less any accumulated impairment losses. For the purpose of impairment testing, goodwill is allocated to each of the Group’s cash-generating units expected to benefit from the synergies of the combination. Cash-generating units to which goodwill has been allocated are tested for impairment annually, or more frequently when there is an indication that the unit may be impaired. If the recoverable amount of the cash- generating unit is less than the carrying amount of the unit, the impairment loss is allocated first to reduce the carrying amount of any goodwill allocated to the unit and then to the other assets of the unit pro-rata on the basis of the carrying amount of each asset in the unit. An impairment loss recognised for goodwill is not reversed in a subsequent period.
On disposal of a subsidiary, the attributable amount of goodwill is included in the determination of the profit or loss on disposal.
FOR THE YEAR ENDED 31 DECEMBER 2020 FOR THE YEAR ENDED 31 DECEMBER 2020
76 77

3. SIGNIFICANT ACCOUNTING POLICIES (CONT’D)
(f) Property, Plant and Equipment
All property, plant and equipment are initially recorded at cost.
Land and buildings are subsequently shown at revalued amounts less accumulated depreciation. Revaluations are made by independent professional valuers. Under the revaluation model, assets will be carried at revalued amount less accumulated depreciation and subsequent accumulated impairment losses. All other property, plant and equipment are stated at cost less accumulated depreciation and any accumulated impairment losses. Surpluses arising on revaluation are credited to revaluation reserve. Deficits that offset previous surpluses of the same asset are charged against the revaluation reserve in Other Comprehensive Income. All other deficits are charged to the Statements of Profit or Loss and Other Comprehensive Income in Profit or Loss.
Property, plant and equipment in the course of construction for production, rental or administrative purposes, or for purposes not yet determined, are carried at cost, less any recognised impairment loss. Cost includes professional fees and, for qualifying assets, borrowing costs capitalised in accordance with the Group’s accounting policy. Depreciation of these assets, on the same basis as other assets, commences when the assets are ready for their intended use.
Depreciation is calculated to write off the cost or revalued amount of property, plant and equipment, with the exception of freehold land and property, plant and equipment in progress, on a straight line basis over the expected useful lives of the assets concerned.
The gain or loss arising on the disposal or retirement of an item of property, plant and equipment is determined as the difference between the sales proceeds and the carrying amount of the assets and is recognised in Statements of Profit or Loss and other Comprehensive Income.
An annual transfer from the asset revaluation surplus to retained earnings is made for the difference between depreciation based on the revalued carrying amount of the asset and depreciation based on the asset’s original cost. Additionally, accumulated depreciation as at the revaluation date is eliminated against the gross carrying amount of the asset and the net amount is restated to the revalued amount of the asset. Upon disposal, any revaluation surplus relating to the particular asset being sold is transferred to retained earnings.
The principal annual rates used for the purpose are:
Leasehold Improvements 2% to 20%
Freehold Buildings 2% to 20%
Plant and Machinery 10% to 50%
Motor Vehicles 20%
Furniture, Fittings and Equipment 10% to 33 1/3%
Rights-of-use assets 2% to 20%
No depreciation is provided on freehold land and on work in progress.
The residual values, useful lives and methods of depreciation of property, plant and equipment are reviewed at each financial year end and adjusted prospectively, if appropriate.
(g) Intangible Assets
Intangible assets acquired separately are measured on initial recognition at cost. The cost of intangible assets acquired in a business combination is their fair value at the date of acquisition. Following initial recognition, intangible assets are carried at cost less any accumulated amortisation and accumulated impairment losses. Internally generated intangibles, excluding capitalised development costs, are not capitalised and the related expenditure is reflected in profit or loss in the period in which the expenditure is incurred. The useful lives of intangible assets are assessed as either finite or indefinite.
Intangible assets with finite lives are amortised over the useful economic life and assessed for impairment whenever there is an indication that the intangible asset may be impaired. The amortisation period and the amortisation method for an intangible asset with a finite useful life are reviewed at least at the end of each reporting period. Changes in the expected useful life or the expected pattern of consumption of future economic benefits embodied
3. SIGNIFICANT ACCOUNTING POLICIES (CONT’D)
(g) Intangible Assets (Cont’d)
in the asset are considered to modify the amortisation period or method, as appropriate, and are treated as changes in accounting estimates. The amortisation expense on intangible assets with finite lives is recognised in the statement of profit or loss in the expense category that is consistent with the function of the intangible assets.
Intangible assets with indefinite useful lives are not amortised, but are tested for impairment annually, either individually or at the cash-generating unit level. The assessment of indefinite life is reviewed annually to determine whether the indefinite life continues to be supportable. If not, the change in useful life from indefinite to finite is made on a prospective basis.
Gains or losses arising from derecognition of an intangible asset are measured as the difference between the net disposal proceeds and the carrying amount of the asset and are recognised in the statement of profit or loss and Other Comprehensive Income when the asset is derecognised.
(i) Goodwill
Goodwill represents the excess of the cost of an acquisition over the fair value of the Group’s share of the net identifiable assets of the acquired subsidiary at the date of acquisition. Goodwill on acquisition of subsidiaries is included in intangible assets. Goodwill on acquisition of associates is included in investments in associates. Goodwill is tested annually for impairment and carried at cost less accumulated impairment losses. Gains and losses on the disposal of an entity include the carrying amount of goodwill relating to the entity sold.
Goodwill is allocated to cash-generating units for the purpose of impairment testing. If the recoverable amount of the cash-generating unit is less than the carrying amount of the unit, the impairment loss is allocated first to reduce the carrying amount of any goodwill allocated to the unit and then to the other assets of the unit pro-rata on the basis of the carrying amount of each asset in the unit. An impairment loss recognised for goodwill is not reversed in a subsequent period.
(ii) Computer Software
Computer software that is not considered to form an integral part of any hardware equipment is recorded as intangible assets. The software is capitalised at cost and amortised over its estimated useful life. The principal annual rates used for the purpose are 20% to 33 1/3%.
(iii) Leasehold Rights
Leasehold rights acquired in a business combination and recognised separately from goodwill are initially recognised at their fair value at the acquisition date (which is regarded as their cost). Subsequent to initial recognition, the leasehold rights acquired in a business combination are reported at cost less accumulated amortisation and accumulated impairment losses, on the same basis as intangible assets that are acquired separately. Leasehold rights are amortised over a period of 41 years.
(h) Inventories
Inventories are valued at the lower of cost and net realisable value. In general, cost is determined on a weighted average basis. The cost of inventories comprises all costs of purchase, costs of conversion and other costs, including a proportion of relevant overheads, incurred in bringing them to their present location and condition. Net realisable value is the estimate of the selling price in the ordinary course of business, less the costs of completion and selling expenses. The main inventory item for the Group consist of cement which the Group purchases in bulk and packs for resale to customers. The bulk cement is disclosed as raw materials and the packed cement as finished goods.
(i) Financial Instruments
Financial Assets
Initial recognition and measurement
Financial assets are classified, at initial recognition, as subsequently measured at amortised cost and fair value through profit or loss.
NOTES TO THE FINANCIAL STATEMENTS NOTES TO THE FINANCIAL STATEMENTS
FOR THE YEAR ENDED 31 DECEMBER 2020 FOR THE YEAR ENDED 31 DECEMBER 2020
78 79

3. SIGNIFICANT ACCOUNTING POLICIES (CONT’D)
(i) Financial Instruments (Cont’d)
Financial Assets (Cont’d)
Initial recognition and measurement (Cont’d)
The classification of financial assets at initial recognition depends on the financial asset’s contractual cash flow characteristics and the Group’s business model for managing them. With the exception of trade receivables that do not contain a significant financing component or for which the Group has applied the practical expedient, the Group initially measures a financial asset at its fair value plus, in the case of a financial asset not at fair value through profit or loss, transaction costs. Trade receivables that do not contain a significant financing component or for which the Group has applied the practical expedient are measured at the transaction price determined under IFRS 15.
In order for a financial asset to be classified and measured at amortised cost it needs to give rise to cash flows that are ‘solely payments of principal and interest (SPPI)’ on the principal amount outstanding. This assessment is referred to as the SPPI test and is performed at an instrument level.
The Group’s business model for managing financial assets refers to how it manages its financial assets in order to generate cash flows. The business model determines whether cash flows will result from collecting contractual cash flows, selling the financial assets, or both.
Purchases or sales of financial assets that require delivery of assets within a time frame established by regulation or convention in the market place (regular way trades) are recognised on the trade date, i.e., the date that the Group commits to purchase or sell the asset.
The Group’s financial assets include cash in hand at banks, trade and other receivables and intercompany receivables.
Subsequent measurement
For purposes of subsequent measurement, financial assets are classified in four categories:
• Financial assets at amortised cost (debt instruments) • Financial assets at fair value through OCI with recycling of cumulative gains and losses (debt instruments) • Financial assets designated at fair value through OCI with no recycling of cumulative gains and losses upon derecognition (equity instruments) • Financial assets at fair value through profit or loss
Financial assets at amortised cost (debt instruments)
This category is the most relevant to the Group. The Group includes in this category loans and receivables. The Group measures financial assets at amortised cost if both of the following conditions are met: • The financial asset is held within a business model with the objective to hold financial assets in order to collect contractual cash flows
And
• The contractual terms of the financial asset give rise on specified dates to cash flows that are solely payments of principal and interest on the principal amount outstanding
Financial assets at amortised cost are subsequently measured using the effective interest (EIR) method and are subject to impairment. Gains and losses are recognised in profit or loss when the asset is derecognised, modified or impaired. The losses arising from impairment are recognised in the Statement of Profit or Loss and Other Comprehensive Income in Profit or Loss.
Derecognition
A financial asset (or, where applicable, a part of a financial asset or part of a group of similar financial assets) is primarily derecognised (i.e., removed from the Group’s consolidated statement of financial position) when:
3. SIGNIFICANT ACCOUNTING POLICIES (CONT’D)
(i) Financial Instruments (Cont’d)
Financial Assets (Cont’d)
Derecognition (Cont’d)
• The rights to receive cash flows from the asset have expired.
Or
• The Group has transferred its rights to receive cash flows from the asset or has assumed an obligation to pay the received cash flows in full without material delay to a third party under a ‘pass-through’ arrangement; and either (a) the Group has transferred substantially all the risks and rewards of the asset, or (b) the Group has neither transferred nor retained substantially all the risks and rewards of the asset, but has transferred control of the asset.
When the Group has transferred its rights to receive cash flows from an asset or has entered into a pass-through arrangement, it evaluates if, and to what extent, it has retained the risks and rewards of ownership. When it has neither transferred nor retained substantially all of the risks and rewards of the asset, nor transferred control of the asset, the Group continues to recognise the transferred asset to the extent of its continuing involvement. In that case, the Group also recognises an associated liability. The transferred asset and the associated liability are measured on a basis that reflects the rights and obligations that the Group has retained.
Continuing involvement that takes the form of a guarantee over the transferred asset is measured at the lower of the original carrying amount of the asset and the maximum amount of consideration that the Group could be required to repay.
Impairment of financial assets
The Group recognises an allowance for expected credit losses (ECLs) for all trade receivables and contract assets. ECLs are based on the difference between the contractual cash flows due and all the cash flows that the Group expects to receive.
For contract assets, the Group applies a simplified approach in calculating ECLs. The expected credit losses on these financial assets are estimated using a provision matrix based on the entity’s historical credit loss experience, adjusted for factors that are specific to the debtors, general economic conditions and an assessment of both the current as well as the forecast direction of conditions at the reporting date, including time value of money where appropriate. The Group will calibrate the matrix to adjust the historical credit loss experience with forward-looking information. For instance, if forecast economic conditions (i.e., gross domestic product) are expected to deteriorate over the next year which can lead to an increased number of defaults in the construction sector, the historical default rates are adjusted. At every reporting date, the historical observed default rates are updated and changes in the forward-looking estimates are analysed.
For trade receivables, the Group applies a simplified approach in calculating ECLs. The Group makes use of the roll rate methodology. It predicts the probability of default based on delinquency and calculates the percentage of debtors’ balance in each bucket that deteriorate to the next bucket in the following month. Therefore, the Group does not track changes in credit risk, but instead recognises a loss allowance based on lifetime ECLs at each reporting date. The Group has established a provision matrix that is based on its historical credit loss experience, adjusted for forward-looking factors specific to the debtors and the economic environment.
The Group considers a financial asset in default when contractual payments are 90 days past due. However, in certain cases, the Group may also consider a financial asset to be in default when internal or external information indicates that the Group is unlikely to receive the outstanding contractual amounts in full before taking into account any credit enhancements held by the Group. A financial asset is written off when there is no reasonable expectation of recovering the contractual cash flows. The information about the ECLs on the Group’s trade receivables is disclosed in Note 12.
For all the other financial instruments where there has not been a significant increase in credit risk since initial recognition, ECLs are provided for credit losses that results from default events that are possible within the next 12 months (a 12 month ECL).
For those credit exposures for which there has been a significant increase in credit risk since initial recognition, a loss allowance is required for credit losses expected over the remaining life of the exposure, irrespective of the timing of the default (a lifetime ECL).
NOTES TO THE FINANCIAL STATEMENTS NOTES TO THE FINANCIAL STATEMENTS
FOR THE YEAR ENDED 31 DECEMBER 2020 FOR THE YEAR ENDED 31 DECEMBER 2020
80 81

3. SIGNIFICANT ACCOUNTING POLICIES (CONT’D)
(i) Financial Instruments (Cont’d)
Financial Assets (Cont’d)
Impairment of financial assets (Cont’d)
Significant increase in credit risk
In assessing whether the credit risk on a financial instrument has increased significantly since initial recognition, the Group compares the risk of a default occurring on the financial instrument at the reporting date with the risk of a default occurring on the financial instrument at the date of initial recognition. In making this assessment, the Group considers both quantitative and qualitative information that is reasonable and supportable, including historical experience and forward-looking information that is available without undue cost or effort.
Write-off of financial assets
The Group assess any write-off to be made on trade receivables, contract assets and amount due from related parties on a case to case basis when there is sufficient evidence that the amount receivable will no longer be recoverable.
Financial Liabilities
Initial recognition and measurement
Financial liabilities are classified, at initial recognition, as financial liabilities at fair value through profit or loss, loans and borrowings, payables, or as derivatives designated as hedging instruments in an effective hedge, as appropriate.
All financial liabilities are recognised initially at fair value and, in the case of loans and borrowings and payables, net of directly attributable transaction costs.
The Group’s financial liabilities include trade and other payables, loans and borrowings including bank overdrafts.
Subsequent measurement
The measurement of financial liabilities depends on their classification, as described below:
Trade and other payables
Trade and other payables are initially recognised at fair value and subsequently carried at amortised cost using the effective interest method unless the effect of discounting would be immaterial in which case they are stated at cost.
Loans and borrowings
After initial recognition, interest-bearing loans and borrowings are subsequently measured at amortised cost using the EIR method. Gains and losses are recognised in profit or loss when the liabilities are derecognised as well as through the EIR amortisation process. Amortised cost is calculated by taking into account any discount or premium on acquisition and fees or costs that are an integral part of the EIR. The EIR amortisation is included as finance costs in the Statement of profit or loss.
This category includes interest bearing loans including bank overdrafts.
Derecognition
A financial liability is derecognised when the obligation under the liability is discharged or cancelled or expires. When an existing financial liability is replaced by another from the same lender on substantially different terms, or the terms of an existing liability are substantially modified, such an exchange or modification is treated as the derecognition of the original liability and the recognition of a new liability. The difference in the respective carrying amounts is recognised in the Statement of profit or loss.
3. SIGNIFICANT ACCOUNTING POLICIES (CONT’D)
(j) Offsetting of financial instruments
Financial assets and financial liabilities are offset and the net amount is reported in the consolidated statement of financial position if there is a currently enforceable legal right to offset the recognised amounts and there is an intention to settle on a net basis, to realise the assets and settle the liabilities simultaneously.
(k) Taxation
Income tax expense represents the sum of the tax currently payable, deferred tax and Corporate Social Responsibility.
Current and deferred tax are recognised as an expense or income in profit or loss, except when they relate to items that are recognised outside profit or loss (whether in other comprehensive income or directly in equity), in which case the tax is also recognised outside profit or loss, or where they arise from the initial accounting for a business combination. In the case of a business combination, the tax effect is included in the accounting for the business combination.
(i) Current tax
The tax currently payable is based on taxable profit for the year. Taxable profit differs from profit as reported in the consolidated Statements of Profit or Loss and Other Comprehensive Income because of items of income or expense that are taxable or deductible in other years and items that are never taxable or deductible. The Group liability for current tax is calculated using tax rates that have been enacted or substantively enacted by the end of the reporting period.
(ii) Deferred taxation Deferred taxation is provided for on the comprehensive basis using the liability method.
Deferred tax liabilities are recognised for all taxable temporary differences, except:
• When the deferred tax liability arises from the initial recognition of goodwill or an asset or liability in a transaction that is not a business combination and, at the time of the transaction, affects neither the accounting profit nor taxable profit or loss.
• In respect of taxable temporary differences associated with investments in subsidiaries, associates and interests in joint arrangements, when the timing of the reversal of the temporary differences can be controlled and it is probable that the temporary differences will not reverse in the foreseeable future.
Deferred tax assets are recognised for all deductible temporary differences, the carry forward of unused tax credits and any unused tax losses. Deferred tax assets are recognised to the extent that it is probable that taxable profit will be available against which the deductible temporary differences, and the carry forward of unused tax credits and unused tax losses can be utilised, except:
• When the deferred tax asset relating to the deductible temporary difference arises from the initial recognition of an asset or liability in a transaction that is not a business combination and, at the time of the transaction, affects neither the accounting profit nor taxable profit or loss.
• In respect of deductible temporary differences associated with investments in subsidiaries, associates and interests in joint arrangements, deferred tax assets are recognised only to the extent that it is probable that the temporary differences will reverse in the foreseeable future and taxable profit will be available against which the temporary differences can be utilised. The carrying amount of deferred tax assets is reviewed at each reporting date and reduced to the extent that it is no longer probable that sufficient taxable profit will be available to allow all or part of the deferred tax asset to be utilised.
Unrecognised deferred tax assets are re-assessed at each reporting date and are recognised to the extent that it has become probable that future taxable profits will allow the deferred tax asset to be recovered.
Deferred tax assets and liabilities are measured at the tax rates that are expected to apply in the year when the asset is realised or the liability is settled, based on tax rates (and tax laws) that have been enacted or substantively enacted at the reporting date.
NOTES TO THE FINANCIAL STATEMENTS NOTES TO THE FINANCIAL STATEMENTS
FOR THE YEAR ENDED 31 DECEMBER 2020 FOR THE YEAR ENDED 31 DECEMBER 2020
82 83

3. SIGNIFICANT ACCOUNTING POLICIES (CONT’D)
(k) Taxation (Cont’d)
(iii) Corporate Social Responsibility
The Group is required to allocate 2% of its chargeable income of the preceding financial year to Government approved Corporate Social Responsibility (CSR) projects. The required CSR charge for the current year is recognised as income tax expense in profit or loss. The net amount of CSR fund payable to the taxation authority is inclued as income tax payable in the statement of financial position.
(l) Leases
Rental income from operating leases is recognised on a straight-line basis over the term of the relevant lease. Initial direct costs incurred in negotiating and arranging an operating lease are added to the carrying amount of theleased asset and recognised on a straight-line basis over the lease term. Lessee
The Group considers whether a contract is, or contains a lease. A lease is defined as ‘a contract, or part of a contract, that conveys the right to use an asset (the underlying asset) for a period of time in exchange for consideration.
To apply this definition the Group assesses whether the contract meets three key evaluations which are whether: • the contract contains an identified asset, which is either explicitly identified in the contract or implicitly specified by being identified at the time the asset is made available to the Group. • the Group has the right to obtain substantially all of the economic benefits from use of the identified asset throughout the period of use, considering its rights within the defined scope of the contract. • the Group has the right to direct the use of the identified asset throughout the period of use.
The Group assess whether it has the right to direct ‘how and for what purpose’ the asset is used throughout the period of use.
Measurement and recognition of leases as a lessee
At lease commencement date, the Group recognises a right-of-use asset and a lease liability on the balance sheet. The right-of-use assets are measured at cost for those which are classified under Property, plant & Equipment, which is made up of the initial measurement of the lease liability, any initial direct costs incurred by the Group, an estimate of any costs to dismantle and remove the asset at the end of the lease, and any lease payments made in advance of the lease commencement date (net of any incentives received).
The Group depreciates the right-of-use assets on a straight-line basis from the lease commencement date to the earlier of the end of the useful life of the right-of-use asset or the end of the lease term. The Group also assesses the right-of-use asset for impairment when such indicators exist.
The right-of-use asset which are classified as Investment Properties are measured at fair value. Initial cost is made up of the initial measurement of the lease liability, any initial direct costs incurred by the Group, an estimate of any costs to dismantle and remove the asset at the end of the lease, and any lease payments made in advance of the lease commencement date (net of any incentives received). Subsequent re-measurements are taken to Profit or Loss
At the commencement date, the Group measures the lease liability at the present value of the lease payments un paid at that date, discounted using the interest rate implicit in the lease if that rate is readily available or the Group’s incremental borrowing rate.
Lease payments included in the measurement of the lease liability are made up of fixed payments (including in substance fixed), variable payments based on an index or rate, amounts expected to be payable under a residual value guarantee and payments arising from options reasonably certain to be exercised.
3. SIGNIFICANT ACCOUNTING POLICIES (CONT’D)
(l) Leases (Cont’d)
Measurement and recognition of leases as a lessee (Cont’d)
Subsequent to initial measurement, the liability will be reduced for payments made and increased for interest. It is remeasured to reflect any reassessment or modification, or if there are changes in in-substance fixed payments.
When the lease liability is remeasured, the corresponding adjustment is reflected in the right-of-use asset, or profit and loss if the right-of-use asset is already reduced to zero.
The Group has elected to account for short-term leases and leases of low-value assets using the practical expedients. Instead of recognising a right-of-use asset and lease liability, the payments in relation to these are recognised as an expense in profit or loss on a straight-line basis over the lease term.
(m) Investment Properties Investment properties, which are property held to earn rentals and/or for capital appreciation, are stated initially at cost, including transaction costs. Subsequent to initial recognition, the investment properties are measured at fair value. Gains or losses arising from changes in the fair value of the investment properties are included in the Statements of Profit or Loss in the period in which they arise.
Fair values are determined based on an annual evaluation performed by an accredited external independent valuer applying a valuation model recommended by the International Valuation Standards Committee.
Investment properties are derecognised either when they have been disposed of or when they are permanently withdrawn from use and no future economic benefit is expected from their disposal. The difference between the net disposal proceeds and the carrying amount of the asset is recognised in profit or loss in the period of derecognition.
(n) Foreign Currency Translation Transactions in foreign currencies are translated into the functional and presentation currency, Mauritian rupees, at the rates of exchange ruling at the dates of the transactions.
Monetary assets and liabilities denominated in foreign currencies in the Statements of Financial Position are translated into Mauritian rupees at the rates of exchange ruling at the Statements of Financial Position date, and any differences in exchange arising are taken to the Statements of Profit or Loss and Other Comprehensive Income.
For the purposes of presenting these consolidated financial statements, the assets and liabilities of the Group’s foreign operations are translated into Mauritian Rupees using exchange rates prevailing at the end of each reporting period. Income and expense items are translated at the average exchange rates for the period, unless exchange rates fluctuate significantly during that period, in which case the exchange rates at the dates of the transactions are used. Exchange differences arising, if any, are recognised in other comprehensive income and accumulated in equity (and attributed to non-controlling interests as appropriate).
On the disposal of a foreign operation all of the exchange differences accumulated in equity in respect of that operation attributable to the owners of the Company are reclassified to profit or loss.
In addition, in relation to a partial disposal of a subsidiary that includes a foreign operation that does not result in the Group losing control over the subsidiary, the proportionate share of accumulated exchange differences are re-attributed to non-controlling interests and are not recognised in profit or loss. For all other partial disposals (i.e. partial disposals of associates or joint arrangements that do not result in the Group losing significant influence or joint control), the proportionate share of the accumulated exchange differences is reclassified to profit or loss.
(o) Turnover
Turnover is proceeds from ticket sales and the aggregate of revenue from all sales of goods and services, rental income, dividend income and other contract work executed less discounts, allowances and returns.
NOTES TO THE FINANCIAL STATEMENTS NOTES TO THE FINANCIAL STATEMENTS
FOR THE YEAR ENDED 31 DECEMBER 2020 FOR THE YEAR ENDED 31 DECEMBER 2020
84 85

3. SIGNIFICANT ACCOUNTING POLICIES (CONT’D)
(p) Revenue Recognition
Revenue from contract with customers
Revenue is based on invoiced values, net of value added tax, of all sales of goods and services, proceeds from ticket sales net of prizes, sale of building materials and other contract work executed less discounts, allowances and returns.
Revenue from sales of goods and services are recognised when goods are delivered and title have passed and the services have been rendered.
Revenue from construction contracts is recognised in accordance with the Group’s accounting policy on construction contracts as per note 3(q).
Revenue from lottery consist of sale of tickets, which are the wagers placed on lottery tickets on the Group’s draw- based game, net of prizes.
Revenue from sales of building materials represents sales of cement, classified as bulk and bag. The performance is recognised at a point in time when control of the goods has transferred to the customer and the transactions price has already been set. As per condition of sales, no alterations and cancellation of orders can be made once goods and services have been delivered, this is generally when the goods are delivered to the customers. No revenue is recognized if there are significant uncertainties regarding recovery of the consideration due.
The Group’s revenue recognition occurs at the point in time when the draw has been held and the results have been certified by the Gambling Regulatory Authority. Where players wager in advance, the income is deferred and recorded as contract liabilities, until the draw has taken place when it is then recognised as revenue in the statement of profit or loss and other comprehensive income.
Revenue is recognised to depict the transfer of promised goods or services to customers in an amount that reflects the consideration to which the Group expects to be entitled in exchange for those goods or services. Revenue is measured at the fair value of consideration received or receivable, excluding discounts, rebates, and Value Added Tax.
Other Revenue
Interest income is recognised when the income can be reliably measured and on a time basis, unless collectability is in doubt. Interest income is recorded using the effective interest rate (EIR). The EIR is the rate that exactly discounts the estimated future cash receipts over the expected life of the financial instrument or a shorter period, where appropriate, to the net carrying amount of the financial asset. Interest income is included under operating profit in the statement of profit or loss.
Dividend income from equity investments is recognised when the shareholders’ rights to receive payment have been established.
Rental income from operating leases is recognised on a straight line basis over the term of the relevant lease.
(q) Construction Contracts
The Group is involved in the construction industry and produces asphalt for resale. Revenue from contracts with customers is recognised when the control of goods and services are transferred to the customer at an amount that reflects the consideration to which the Group expects to be entitled in exchange for those goods and services. The Group has generally concluded that it is the principal in its revenue arrangements.
The disclosures of significant accounting judgements, estimates and assumptions relating to revenue from contracts with customers are provided in Note 4.
The Group principally generate revenue from its construction activities such as building of infrastructures, roads and minor civil constructions. The Group has established that it has one performance obligation in contracts entered with clients.
The Group recognises revenue from its construction contracts over time, using an output method to measure progress towards completion of the asset promised, because the customer simultaneously receives and consumes the benefits provided by the Company. Output methods recognise revenue on the basis of direct measurements of the value to the customer of the goods transferred to date relative to the remaining goods promised under the contract.
3. SIGNIFICANT ACCOUNTING POLICIES (CONT’D)
(q) Construction Contracts (Cont’d)
The Group believes that the output method faithfully depicts the Company’s performance towards complete satisfaction of the performance obligation. The Group uses surveys of performance completed to date to determine the amount of revenue to be recognised.
(i) Variable consideration If the consideration in a contract includes a variable amount, the Group estimates the amount of consideration to which it will be entitled in exchange for transferring the goods to the customer. The variable consideration is estimated at contract inception and constrained until it is highly probable that a significant revenue reversal in the amount of cumulative revenue recognised will not occur when the associated uncertainty with the variable consideration is subsequently resolved.
(ii) Significant financing components in respect of advances from its customers
Generally, the Group receives advances from its customers which are classified as short term and long term advances and classified as current or non-current contract liabilities. Using the practical expedient in IFRS 15, the Company does not adjust the promised amount of consideration for the effects of a significant financing component if it expects, at contract inception, that the period between the transfer of the transfer of the promised good or service to the customer and when the customer pays for that good or service will be one year or less.
Based on the nature of the goods and services offered and the purpose of payment terms, the Group determined that for the vast majority of the contracts that require customers to pay long-term advances, the payment terms were structured primarily for reason other than the provision of finance to the Group, i.e. advances are generally required from new customers, as well as customers with a history. of late payments, they do not provide customers with an alternative to pay in arrears. In addition, the length of time between when the customer pays for the goods and the Group transfers goods to the customer is relatively short. Therefore, the Group has concluded that there is no significant financing component in these contracts.
Sale of asphalt
Revenue from sale of asphalt is recognised at the point in time when control of the asset is transferred to the customer, generally on delivery of the asphalt. The normal credit term is 60 days upon delivery.
Progress billings
Progress billings are invoices requesting payment for work completed till date. Progress billings are prepared and submitted for payment at each month end for all projects. Generally, the Company performs its surveys of work completed at each month end and issues a draft invoice to the customers for approval.
(iii) Non contracting revenue
Revenue from the sale of asphalt and testing of materials is recognised when the control of goods and services are transferred to the customer at an amount that reflects the consideration to which the Group expects to be entitled in exchange for those goods and services.
(r) Contract balances
(i) Contract asset A contract asset is the right to consideration in exchange of goods or services transferred to the customer. If the Group performs by transferring goods or services to a customer before the customer pays the consideration or before payment is due, a contract asset is recognised for the earned consideration that is conditional.
NOTES TO THE FINANCIAL STATEMENTS NOTES TO THE FINANCIAL STATEMENTS
FOR THE YEAR ENDED 31 DECEMBER 2020 FOR THE YEAR ENDED 31 DECEMBER 2020
86 87

3. SIGNIFICANT ACCOUNTING POLICIES (CONT’D)
(r) Contract balances (Cont’d) (ii) Trade receivables
A receivable represents the Group’s right to an amount of consideration that is unconditional (i.e., only the passage of time is required before payment of the consideration is due). Refer to accounting policies of financial assets in section e.
(iii) Contract liabilities
A contract liability is the obligation to transfer goods or services to a customer for which the Group has received consideration (or an amount of consideration is due) from customer. If a customer pays consideration before the Group transfers goods or services to the customer, a contract liability is recognised when the payment is made or the payment is due (whichever earlier). Contract liabilities are recognised as revenue when the Group performs under the contract.
(s) Retirement Benefit Obligations
Retirement Benefits in respect of The Workers’ Rights Act 2019
The present value of retirement benefits in respect of The Workers’ Rights Act 2019 is recognised in the Statement of Financial Position as a non-current liability. The valuation of the obligations is carried out annually by a firm of qualified actuaries.
Typically defined benefit plans define an amount of pension benefit that an employee will receive on retirement, usually dependent on one or more factors such as age, years of service and compensation. The liability recognised in the statement of financial position in respect of defined benefit pension plans is the present value of the defined benefit obligation at the end of the reporting period. The defined benefit obligation is calculated annually by independent actuaries using the projected unit credit method.
The present value of the defined benefit obligation is determined by discounting the estimated future cash outflows using interest rates of Government bonds that are denominated in the currency in which the benefits will be paid, and that have terms to maturity approximating to the terms of the related pension obligation.
Actuarial gains and losses arising from past experience adjustments and changes in actuarial assumptions are either charged or credited in Other Comprehensive Income in the period in which they arise. Past-service costs are recognised immediately in Profit or Loss when incurred.
Defined benefit costs are categorised as follows:
• service cost (including current service cost, past service cost, as well as gains and losses on curtailments and settlements); • net interest expense or income; and • remeasurement.
The Group presents the first two components of defined benefit costs in Profit or Loss.
Defined Contribution
The Group and the Company operate a defined contribution pension plan for all qualifying employees. The funds are managed by an independent management committee. Where employees leave the plan in prior to full vesting of the contributions, the contributions payable by the company are reduced by the amount of forfeited contributions. Any residual gratuities under the Workers’ Rights Act 2019 for the qualifying employees after allowing for permitted deduction in respect of the pension plan are included in retirement benefits.
Payments to the defined contribution pension plan are recognised as an expense when employees have rendered service entitling them to the contributions.
State plan
Contributions to the National Pension Scheme are expensed to the Statement of Profit or Loss in the period in which they fall due.
3. SIGNIFICANT ACCOUNTING POLICIES (CONT’D)
(t) Borrowing Costs
Borrowing costs attributable to the acquisition of plant and machinery and construction of buildings, which are assets that necessarily take a substantial period of time to get ready for their intended use or sale, are capitalised as part of the respective assets until such time as the asset are substantially ready for their intended use or sale.
All other borrowing costs are recognised in Statements of Profit or Loss and other Comprehensive Income in the period they are incurred.
(u) Dividend declared
Dividend declared are recognised directly in the Statement of Changes in Equity as a reduction in Retained Earnings when declared. A corresponding liability is accounted in the Statement of Financial Position for amounts not yet paid at year end.
(v) Impairment of non-financial asset
The Group assesses, at each reporting date, whether there is an indication that an asset may be impaired. If any indication exists, or when annual impairment testing for an asset is required, the Group estimates the asset’s recoverable amount. An asset’s recoverable amount is the higher of an asset’s or CGU’s fair value less costs of disposal and its value in use. The recoverable amount is determined for an individual asset, unless the asset does not generate cash inflows that are largely independent of those from other assets or groups of assets. When the carrying amount of an asset or CGU exceeds its recoverable amount, the asset is considered impaired and is written down to its recoverable amount.
In assessing value in use, the estimated future cash flows are discounted to their present value using a pre-tax discount rate that reflects current market assessments of the time value of money and the risks specific to the asset. In determining fair value less costs of disposal, recent market transactions are taken into account. If no such transactions can be identified, an appropriate valuation model is used. These calculations are corroborated by valuation multiples, quoted share prices for publicly traded companies or other available fair value indicators.
The Group bases its impairment calculation on most recent budgets and forecast calculations, which are prepared separately for each of the Group’s CGUs to which the individual assets are allocated. These budgets and forecast calculations generally cover a period of five years. A long-term growth rate is calculated and applied to project future cash flows after the fifth year.
Impairment losses of continuing operations are recognised in the statement of profit or loss in expense categories consistent with the function of the impaired asset, except for properties previously revalued with the revaluation taken to OCI. For such properties, the impairment is recognised in OCI up to the amount of any previous revaluation.
For assets excluding goodwill, an assessment is made at each reporting date to determine whether there is an indication that previously recognised impairment losses no longer exist or have decreased. If such indication exists, the Group estimates the asset’s or CGU’s recoverable amount. A previously recognised impairment loss is reversed only if there has been a change in the assumptions used to determine the asset’s recoverable amount since the last impairment loss was recognised. The reversal is limited so that the carrying amount of the asset does not exceed its recoverable amount, nor exceed the carrying amount that would have been determined, net of depreciation, had no impairment loss been recognised for the asset in prior years. Such reversal is recognised in the statement of profit or loss unless the asset is carried at a revalued amount, in which case, the reversal is treated as a revaluation increase.
Goodwill is tested for impairment annually and when circumstances indicate that the carrying value may be impaired. Impairment is determined for goodwill by assessing the recoverable amount of each CGU (or group of CGUs) to which the goodwill relates. When the recoverable amount of the CGU is less than its carrying amount, an impairment loss is recognised. Impairment losses relating to goodwill cannot be reversed in future periods.
Intangible assets with indefinite useful lives are tested for impairment annually at the CGU level, as appropriate, and when circumstances indicate that the carrying value may be impaired.
(w) Accruals
Accruals are recognised when the Group has not yet received invoices for a good or service that has already been supplied and it is expected that the Group will fulfil its responsibility towards the supplier.
NOTES TO THE FINANCIAL STATEMENTS NOTES TO THE FINANCIAL STATEMENTS
FOR THE YEAR ENDED 31 DECEMBER 2020 FOR THE YEAR ENDED 31 DECEMBER 2020
88 89

3. SIGNIFICANT ACCOUNTING POLICIES (CONT’D) (x) Prizes
The draw-based game is operated under a prize pool mechanism under which a predetermined percentage of the ticket sales is allocated to prizes. To the extent that the actual prizes won on the draw vary from the predetermined percentage, the relevant prize is carried forward under a rollover to subsequent draws.
The liability for prizes is recognised at the time of the draw in line with the predetermined percentage for that game. Prizes are net-off against gross lottery ticket sales in the Statement of Profit or Loss and Other Comprehensive income.
If prizes remain unclaimed for 184 days from the date of the draw-based game, the unclaimed prizes are remitted to the National Solidarity Fund.
(y) Consolidated Fund
The Group has a legal requirement to contribute a set proportion of net proceeds from lottery games to the Consolidated Fund managed by the Government of Mauritius.
The amount of Consolidated Fund represents the predetermined percentage of gross ticket sales net of prizes.
(z) Retailers’ and other commissions
The Group pays commissions to third party retailers who act as agents of the Group under a standard commission structure, fixed at a percentage of total sales. In addition, validation commission is paid on prizes. A similar commission structure is applicable for the Field Sales and Technical Representatives in Rodrigues.
(aa) Cash and Cash Equivalents
Cash comprises cash at bank and in hand and demand deposits net of bank overdrafts. Cash equivalents are short-term highly liquid investments that are readily convertible to known amounts of cash and which are subject to an insignificant risk of change in value.
(ab) Assets classified as held for sale
The Group classifies non-current assets and disposal groups as held for sale if their carrying amounts will be recovered principally through a sale transaction rather than through continuing use. Non-current assets and disposal groups classified as held for sale are measured at the lower of their carrying amount and fair value less costs to sell. Costs to sell are the incremental costs directly attributable to the disposal of an asset (disposal group), excluding finance costs and income tax expense.
The criteria for held for sale classification is regarded as met only when the sale is highly probable and the asset or disposal group is available for immediate sale in its present condition. Actions required to complete the sale should indicate that it is unlikely that significant changes to the sale will be made or that the decision to sale will be withdrawn. Management must be committed to the plan to sell the asset and the sale expected to be completed within one year from the date of the classification.
Property, plant and equipment and intangible assets are not depreciated or amortised once classified as held for sale. Assets and liabilities classified as held for sale are presented separately as current items in the statement of financial position.
A disposal group qualifies as discontinued operation if it is a component of an entity that either has been disposed of, or is classified as held for sale, and:
• Represents a separate major line of business or geographical area of operations
• Is part of a single co-ordinated plan to dispose of a separate major line of business or geographical area of operations
Or
• Is a subsidiary acquired exclusively with a view to resale
3. SIGNIFICANT ACCOUNTING POLICIES (CONT’D)
(ac) Government Grants and Covid-19 Levy
Government grants are not recognised until there is reasonable assurance that the Company will comply with the conditions attaching to them and that the grants will be received. Government Wage Assistance Scheme (GWAS) was introduced in March 2020 and was given during the months of lockdown. GWAS meets the definition of government grants under IAS 20. GWAS is recognised as an income over the periods for which the Company incur the related costs for which the grants are intended. The Government introduced the Covid-19 levy after the GWAS. The Covid-19 levy is an obligating event arising upon the making of the taxable profit. Repayment of the grant (COVID-19 Levy) is contingent on the chargeable income of the entity over the current and next years and is recognised in profit or loss, when the profit arises. The grant is shown net of the COVID-19 Levy.
4. CRITICAL ACCOUNTING JUDGEMENTS AND KEY SOURCES OF ESTIMATION UNCERTAINTY The preparation of financial statements in accordance with IFRS requires the directors and management to exercise judgement in the process of applying the accounting policies. It also requires the use of accounting estimates and assumptions that may affect the reported amounts and disclosures in the financial statements. Judgements and estimates are continuously evaluated and are based on historical experience and other factors, including expectations and assumptions concerning future events that are believed to be reasonable under the circumstances. The actual results could, by definition therefore, often differ from the related accounting estimates.
Where applicable, the notes to the financial statements set out areas where management has applied a higher degree of judgement that have a significant effect on the amounts recognised in the financial statements, or estimations and assumptions that have a significant risk of causing a material adjustment to the carrying amounts of assets and liabilities within the next financial year.
4.1. CRITICAL ACCOUNTING JUDGEMENTS
(a) Construction contracts
Identifying performance obligation in contracts
The Group provides construction services to its customers. The Group has established that it has one performance obligation in its contracts with its customers. The Group performs several tasks within a single contract such as excavation works and use of its machineries and labour (including its quantity surveyors, contract managers and engineers) to build the asset. The Group has established that these tasks do not represent separate promises in the contract and are necessary for the completion of the promised asset to the customer and thus the Group has one performance obligation.
Determining the timing of satisfaction of construction services
The Group concludes that revenue for the construction contracts is to be recognised over time because:
(i) the customer simultaneously receives and consumes the benefits provided by the Group. The fact that another Group would not need to re-perform the construction work completed by the Group demonstrates that the customer simultaneously receives and consumes the benefits of the Group’s performance as it performs.
(ii) the Group’s performance creates an asset that the customer controls as the asset is created.
(iii) the Group’s performance does not create an asset with an alternative use to the Group and as per the contract terms the Group has an enforceable right to payment for the performance completed to date.
In all contracts entered by the Group and its customers, the Group performs construction works on land that is owned by the customers. Therefore, as the Group performs its obligations as per the contract, the customers receive and consume the benefits of the work that has been completed. In addition, since the customers own the land, the customers control the asset being created and the Group cannot sell the work that has been performed to other customers.
NOTES TO THE FINANCIAL STATEMENTS NOTES TO THE FINANCIAL STATEMENTS
FOR THE YEAR ENDED 31 DECEMBER 2020 FOR THE YEAR ENDED 31 DECEMBER 2020
90 91

4. CRITICAL ACCOUNTING JUDGEMENTS AND KEY SOURCES OF ESTIMATION UNCERTAINTY (CONT’D)
4.1. CRITICAL ACCOUNTING JUDGEMENTS (CONT’D)
(a) Construction contracts (Cont’d)
Revenue recognition
Revenue is recognised based on output method of individual contracts. The output methods recognise revenue on the basis of direct measurements of the value to the customer of the goods or services transferred to date relative to the remaining goods or services promised under the contract.
The survey of work performed is believed to faithfully depict the entity’s performance towards satisfaction of its performance obligation. The Group signs a bill of quantities (BOQ) with the customer and the contract terms stipulate that the Group can make monthly claim based on the amount of work that has been completed till date based on the prices and quantities that have been agreed in the BOQ. Based on what has been agreed with the customers, the Group determines that the output method is the best method for measuring revenue.
Contract variations
Contract variations are recognised as revenues to the extent that it is probable that they will result in revenue which can be reliably measured. The Group estimates the amount of consideration to which it will be entitled in exchange for transferring the goods to the customer. The variable consideration is estimated at contract inception and constrained until it is highly probable that a significant revenue reversal in the amount of cumulative revenue recognised will not occur when the associated uncertainty with the variable consideration is subsequently resolved.
Loss making and onerous contracts
In determining whether a contract is loss making or onerous, management applies their professional judgement to assess the facts and circumstances specific to the relevant contract. The assessments are performed on a contract- by-contract basis. The following factors are taken into account: Future estimated revenues (including claims and variations), the stage of completion, the nature and relationship with the customer, expected inflation, the terms of contract and the Company’s experience in that industry.
(b) Revenue from lottery
The Group assesses its revenue arrangement on the operation of the lottery segment and determined that it is the principal as it controls the service before it is transferred to the customer. The primary responsibility for fulfilling the promise to provide the service towards the customers resides with the Group. The Group underwrites the jackpots and other prize money for the game and bears the risk associated with guaranteed jackpots. The Group is liable under the Civil Code should it default in making payment to the winners of the draw. The Group also bears the risk associated with prize pool and has no recourse to any other party in the event that it suffers losses in fulfilling its responsibilities under its gaming licence.
(c) Valuation of lease liabilities and right-of-use assets
The application of IFRS 16 requires the Group to make judgements that affect the valuation of the lease liabilities (note 15) and the valuation of right-of-use assets (notes 5 and 9). These include determining contracts in scope of IFRS 16, determining the contract term and determining the interest rate used for discounting of future cash flows.
The lease terms determined by the Group generally comprises non-cancellable period of lease contracts, periods covered by an option to extend the lease if the Company is reasonably certain to exercise that option and periods covered by an option to terminate the lease if the Company is reasonably certain not to exercise that option. The same term is applied as economic useful life of right-of-use assets.
The present value of the lease payment is determined using the discount rate representing the rate of interest rate applicable for currency of the lease contract and for similar tenor, corrected by the average credit spread of entities with rating similar to the Group’s rating, observed in the period when the lease contract commences or is modified.
4. CRITICAL ACCOUNTING JUDGEMENTS AND KEY SOURCES OF ESTIMATION UNCERTAINTY (CONT’D)
4.2 KEY SOURCES OF ESTIMATION UNCERTAINTY
(a) Going Concern assessment
The Company has interests in entities which are involved in several segments, namely Building Materials, Contracting, Property Investments and Lottery. The Company also has an associate in the hospitality segment. Except for the Contracting and hospitality clusters, all the other clusters have demonstrated financial resilience and recovered from the lockdown in 2020 given their strong market positions and established presence. The Directors consider that the Company has sufficient and adequate financial resources comprising of cash balances of Rs115M and undrawn bank overdraft facilities in order to meet any short-term obligations. Therefore, the financial statements continue to be prepared on the going concern basis. Group companies in Building Materials (Kolos Cement Ltd) and Lottery (Lottotech Ltd) segments and Gamma Materials Ltd (a joint-venture entity) are expected to be profitable and generate positive cash flows in 2021, taking into account the lockdown in place since 10 March 2021.
The Contracting segment (Gamma Construction Ltd) was affected by the lockdown period in 2020. As a result of no activity for 2 months, Gamma Construction recorded a loss of Rs21M for the full year ended 31 December 2020 (2019: Profit Rs15M). Net current assets amounted to Rs21M (2019: Rs9M) with surplus cash of Rs122M and shareholders’ equity of Rs88M (2019: Rs114M) as at 31 December 2020. Management of Gamma Construction Ltd has put in place several measures to ensure continuity of operations, namely the management of its receivables to ensure no delays in receipts. By incorporating the current lockdown in 2021, Directors do not foresee a going concern issue as given the adequate and sufficient financial resources and undrawn bank overdraft facility to meet short term obligations. The Group has several properties which are either income generating or held for capital appreciation until projects are developed. This cluster was not impacted by Covid-19 and Directors do not foresee any going concern issue.
The Group’s associate, Morning Light Co. Ltd, owns and operate the Hilton Resort & Spa Mauritius. As a result of closure of hotel during lockdown and partial ban on travel, the associate had accumulated losses of Rs34M and net current liabilities of Rs112M at 31 December 2020. The following measures were implemented in order to improve the cash flows of the associate: • Close monitoring of debtors and extension of credit terms with suppliers, • Reduction of all operating expenses including voluntary salary reduction. The following external measures also benefitted the associate: • Government Wage assistance scheme obtained from the Government of Rs42M for the year ended 31 December 2020, • Moratorium in place until June 2021 to ease the repayment for existing bank debts; • Additional loan facilities from the bank under the Bank of Mauritius Support Programme Based on cash flow forecast for the next 12 months, the funding secured so far and the waiver of financial covenants, the Directors are of the view that Morning Light Co. Ltd will be able to meet its financial obligations and fund operational losses that may result from the COVID-19 impact on its operations in the next financial year. The associate had a cash balance of Rs12M at 31 December 2020 and an adequate undrawn overdraft facility. Accordingly, they continue to adopt the going concern basis in preparing the associate’s Financial Statements.
(b) Construction cost estimates
The Group uses internal quantity surveyors together with project managers to estimate the costs to complete construction contracts. Factors such as escalation of material prices, labour costs and other costs are included in the construction cost estimates based on best estimates.
(c) Provision for expected credit losses of trade receivables and contract assets
The Group uses a provision matrix to calculate ECLs for trade receivables and contract assets. The provision rates are based on days past due for groupings of various customer segments that have similar loss patterns (i.e., by customer type and rating).
NOTES TO THE FINANCIAL STATEMENTS NOTES TO THE FINANCIAL STATEMENTS
FOR THE YEAR ENDED 31 DECEMBER 2020 FOR THE YEAR ENDED 31 DECEMBER 2020
92 93

4. CRITICAL ACCOUNTING JUDGEMENTS AND KEY SOURCES OF ESTIMATION UNCERTAINTY (CONT’D)
4.2 KEY SOURCES OF ESTIMATION UNCERTAINTY (CONT’D)
(c) Provision for expected credit losses of trade receivables and contract assets (Cont’d)
The provision matrix is initially based on the Group’s historical observed default rates. The Group will calibrate the matrix to adjust the historical credit loss experience with forward-looking information. For instance, if forecast economic conditions (i.e., gross domestic product) are expected to deteriorate over the next year which can lead to an increased number of defaults, the historical default rates are adjusted. At every reporting date, the historical observed default rates are updated and changes in the forward-looking estimates are analysed.
The assessment of the correlation between historical observed default rates, forecast economic conditions and ECLs is a significant estimate. The amount of ECLs is sensitive to changes in circumstances and of forecast economic conditions. The Group’s historical credit loss experience and forecast of economic conditions may also not be representative of customer’s actual default in the future.
(d) Allowance for slow moving stock
An allowance for slow moving stock is determined using a combination of factors including the overall quality and ageing of the stocks.
(e) Property, plant and equipment
Property, plant and equipment is depreciated over its estimated useful life, which is based on estimates for expected usage of the asset and expected physical wear and tear which are dependent on operational factors. Management has not considered any residual value as it is deemed immaterial.
(f) Investment properties and freehold land and buildings
The Group’s Investment properties and freehold land and buildings have been valued based on the valuation carried out by an independent valuer not related to the Group based on sales comparison method, depreciated replacement cost and income comparison approach.
(g) Determination of quantity of cement
The subsidiary, namely Kolos Cement Ltd, has a unique cement storing facilities which are sheds. Unlike vertical silos where there are level detectors where quantity can be reliably measured, sheds do not have such facilities. The subsidiary instead uses a volumetric measurement to estimate the quantity of cement in its sheds. This involves an element of judgement to cater for the absence of level detectors. Even if this methodology has proven to be reliable, there is a margin of error which is considered as tolerable.
(h) Post-employment benefits
The present value of the pension obligations depends on a number of factors that are determined on an actuarial basis using a number of assumptions. The assumptions used in determining the net cost (income) for post-employment benefits include the discount rate. Any changes in these assumptions will impact the carrying amount of post-employment benefits.
The actuary determines the appropriate discount rate at the end of each year. This is the interest rate that should be used to determine the present value of estimated future cash outflows expected to be required to settle the post-employment benefits. In determining the appropriate discount rate, the actuary considers the interest rates of government bonds that are denominated in the currency in which the benefits will be paid, and that have terms of maturity approximating the terms of the related post-employment benefits.
The present value of the defined benefit obligation is determined by discounting the estimated future cash outflows using interest rates of government bonds that are denominated in the currency in which the benefits will be paid, and that have terms to maturity approximating to the terms of the related pension obligation.
4. CRITICAL ACCOUNTING JUDGEMENTS AND KEY SOURCES OF ESTIMATION UNCERTAINTY (CONT’D)
4.2 KEY SOURCES OF ESTIMATION UNCERTAINTY (CONT’D)
(h) Post-employment benefits (Cont’d)
Other key assumptions for pension obligations are based in part on current market conditions. Additional information is disclosed in Note 16.
(i) Inventories
Management estimates the net realisable values of inventories, taking into account the most reliable evidence available at each reporting date. The future realisation of these inventories may be affected by future technology or other market-driven changes that may reduce future selling prices.
(j) Government Wage Assistance Scheme
Government Wage Assistance Scheme (“GWAS”) was introduced by the Government of Mauritius in March 2020 to assist local companies in the payment of salaries to employees during the lock down period caused by the Covid-19 pandemic. The scheme was then extended till May 2020 and did not have any pre-conditions attached to it. Hence, the entities within the Group had recourse to the GWAS during this period. In May 2020, the Government introduced a levy through the Covid-19 (Miscellaneous Provisions) Bill that would apply to all companies that have a chargeable income during the year the GWAS was received. This Covid-19 levy payable is the lower of the total amount received under the GWAS or 15% of the leviable chargeable income. Chargeable income for the purpose of computing the levy excludes tax losses brought forward from previous years. The chargeable income for the tax year of assessment for 2020/21 and 2021/22 are taken into account when assessing whether the amount received as GWAS is either repayable by the company in full or is subject to the Covid-19 levy.
For Group Companies where management has assessed that a liability in respect of the Covid-19 Levy for the full amount of GWAS received will be payable, this liability is stated in the Statement of Financial Position under Other payables, with no impact in the Statement of Comprehensive Income. For other Group Companies where it has been assessed that no refund of the GWAS received through the Covid-19 Levy is payable by an entity, the amount of GWAS received is accounted for as a grant as defined under IAS 20 as Other Income in the Statement of Comprehensive Income.
NOTES TO THE FINANCIAL STATEMENTS NOTES TO THE FINANCIAL STATEMENTS
FOR THE YEAR ENDED 31 DECEMBER 2020 FOR THE YEAR ENDED 31 DECEMBER 2020
94 95

5. PROPERTY, PLANT AND EQUIPMENT
Furniture, Right-of- (a) Group Leasehold Freehold Land Plant and Motor Fittings and Use Work In
Improvements and Buildings Machinery Vehicles Equipment Assets Progress Total Rs Rs Rs Rs Rs Rs Rs Rs
COST OR VALUATION
At 1 January 2019 82,479,311 684,461,326 828,922,108 125,906,214 387,887,770 - 37,906,468 2,147,563,197 Effect of adoption of IFRS 16
- - - - - 413,947,840 - 413,947,840
Reclassification (3,451,074) 3,451,074 16,746,003 - - - (16,746,003) -
Additions 7,028,974 - 14,681,267 1,462,600 17,575,126 5,633,204 74,150,761 120,531,932
Assets written off - - - - (3,747,740) - (216,000) (3,963,740)
Disposals - (9,354,048) - (14,685,122) (26,558,253) - - (50,597,423)
Revaluation adjustment - (3,879,200) - - - - - (3,879,200)
At 31 December 2019 86,057,211 674,679,152 860,349,378 112,683,692 375,156,903 419,581,044 95,095,226 2,623,602,606
Reclassification - 29,722,401 20,683,245 - - - (50,405,646) -
Additions 464,956 - 6,453,795 - 40,041,497 41,697,968 117,615,358 206,273,574
Assets written off - - - - (3,600) - - (3,600)
Disposals - - (3,012,943) - (8,292,792) - - (11,305,735)
Revaluation adjustment - 627,719 - - - - - 627,719
At 31 December 2020 86,522,167 705,029,272 884,473,475 112,683,692 406,902,008 461,279,012 162,304,938 2,819,194,564
ACCUMULATED DEPRECIATIONAt 1 January 2019 81,259,403 507,048 676,237,099 68,222,194 341,948,171 - - 1,168,173,915
Reclassification (629,814) 629,814 112,271 - (112,271) - -
Assets written off - - - - (3,747,740) - - (3,747,740)
Charge for the Year 3,300,099 19,996,069 33,826,878 2,043,293 31,726,924 40,349,888 - 131,243,151
Disposals - (167,603) - (14,609,011) (26,543,102) - - (41,319,716)
Revaluation adjustment - (20,965,328) - - - - - (20,965,328)
At 31 December 2019 83,929,688 - 710,176,248 55,656,476 343,271,982 40,349,888 - 1,233,384,282
Reclassification (9,739,502) - 9,739,502 - - - -
Assets written off - - - - (3,600) - - (3,600)
Charge for the Year 2,533,677 19,781,158 33,587,721 482,024 14,608,400 42,652,001 - 113,644,981
Disposals - - (3,012,943) - (5,623,831) - - (8,636,774)
Revaluation adjustment - (19,781,158) - - - - - (19,781,158)
At 31 December 2020 76,723,863 - 750,490,528 56,138,500 352,252,951 83,001,889 - 1,318,607,731
NET BOOK VALUE
At 31 December 2020 9,798,304 705,029,272 133,982,947 56,545,192 54,649,057 378,277,123 162,304,938 1,500,586,833
At 31 December 2019 2,127,523 674,679,152 150,173,130 57,027,216 31,884,921 379,231,156 95,095,226 1,390,218,324
5. PROPERTY, PLANT AND EQUIPMENT (CONT’D)
Furniture, Right-of- (b) Company Freehold Land Plant and Motor Fittings and Use Work In
and Buildings Machinery Vehicles Equipment Assets Progress TotalRs Rs Rs Rs Rs Rs Rs
COST OR VALUATION
At 1 January 2019 359,200,000 2,804,616 2,958,017 19,481,428 31,143,727 216,000 415,803,788
Additions - - - 189,541 - - 189,541
Assets written off - - - (3,747,740) - (216,000) (3,963,740)
Disposals (9,354,048) - (63,017) (28,710) - - (9,445,775)
Revaluation adjustment (45,952) - - - - - (45,952)
At 31 December 2019 349,800,000 2,804,616 2,895,000 15,894,519 31,143,727 - 402,537,862
Additions - - - 892,294 - - 892,294
Assets written off - - - - - - -
Disposals (16,900,000) - - (111,708) - - (17,011,708)
Revaluation adjustment (3,000,000) - - - - - (3,000,000)
At 31 December 2020 329,900,000 2,804,616 2,895,000 16,675,105 31,143,727 - 383,418,448
ACCUMULATED DEPRECIATION
At 1 January 2019 - 2,804,616 2,951,139 16,948,877 - - 22,704,632
Charge for the year 3,089,216 - 6,879 930,292 3,892,966 - 7,919,353
Disposals (167,603) - (63,018) (13,558) - - (244,179)
Assets written off - - - (3,747,740) - - (3,747,740)
Revaluation adjustment (2,921,613) - - - - - (2,921,613)
At 31 December 2019 - 2,804,616 2,895,000 14,117,871 3,892,966 - 23,710,453
Charge for the year 3,037,669 - - 941,873 3,892,966 - 7,872,508
Disposals - - - (66,977) - - (66,977)
Revaluation adjustment (3,037,669) - - - - - (3,037,669)
At 31 December 2020 - 2,804,616 2,895,000 14,992,767 7,785,932 - 28,478,315
NET BOOK VALUE
At 31 December 2020 329,900,000 - - 1,682,338 23,357,795 - 354,940,133
At 31 December 2019 349,800,000 - - 1,776,648 27,250,761 - 378,827,409
NOTES TO THE FINANCIAL STATEMENTS NOTES TO THE FINANCIAL STATEMENTS
FOR THE YEAR ENDED 31 DECEMBER 2020 FOR THE YEAR ENDED 31 DECEMBER 2020
96 97

5. PROPERTY, PLANT AND EQUIPMENT (CONT’D) Freehold land and buildings of the Company and its subsidiaries were revalued as at 31 December 2020 by Elevante Property Services Ltd, an independent valuer, not related to the Group, based on the current open market values. Elevante Property Services Ltd is a member of the Royal Institute of Chartered Surveyors and the directors are of the opinion that they have appropriate qualifications and recent experience in the valuation of freehold land and buildings in the relevant locations. The basis of valuation in estimating the open market values have been effected in accordance with the principles set out by the International Valuation Standards Committee as per the International Valuation Application 1 (IVA 1) which deals with valuation for financial reporting and which is to be used in the context of International Financial Reporting Standards (IFRS) published by the International Accounting Standards Board (IASB).
The fair value of freehold land was determined using the sales comparison approach, that reflects recent transaction prices for land and the depreciated replacement cost approach for buildings. The significant inputs include the estimated construction costs and other ancillary expenditure and depreciation factor applied to the estimated construction cost.
(c) Fair value hierarchy
Details of the Group’s and Company’s freehold land and buildings and information about the fair value hierarchy as at 31 December 2020 are as follows:
GROUP COMPANY
Reconciliation of Carrying amount Land Buildings Land Buildings
Rs Rs Rs Rs
Carrying amount as at 1 January 2019 277,200,000 397,479,152 277,200,000 72,600,000 Reclassification from Work in Progress - 29,722,401 - - Disposals - - (16,900,000) - Depreciation - (19,781,158) - (3,037,669)
277,200,000 407,420,395 260,300,000 69,562,331 Revaluation (loss)/gain as at 31 December 2020
(3,000,000) 23,408,877 (3,000,000) 3,037,669
Carrying amount and fair value as at 31 December 2020 274,200,000 430,829,272 257,300,000 72,600,000
The buildings categorised into Level 3 of the fair value hierarchy, the following information is relevant:
Significant unobservable
inputsBuildings Valuation techniques Range Fair valueGroup Company
Rs Rs
2020 Depreciate replacement cost
Depreciation rate 28% to 65% 430,829,272 72,600,000
2019Depreciated replacement
costDepreciation rate 28% to 65% 397,479,152 72,600,000
The valuation exercise is carried out by an independent valuer on an annual basis. The valuer uses a combination of the depreciated replacement cost approach and the sales comparison approach in estimating the property value. Factors such as physical deterioration and obsolescence are considered. Also, the valuer compares the property with similar properties recently sold on the open market.
Significant increase/(decrease) in the price per square metre would result in significantly lower/(higher) fair value on a linear basis respectively.
5. PROPERTY, PLANT AND EQUIPMENT (CONT’D)
(c) Fair value hierarchy (Cont’d)
The freehold land are categorised into Level 2 (2019: level 2) of the fair value hierarchy, the following information is relevant:
(d) Had the land and buildings owned by the Group and Company been measured on a historical basis, their carrying value would have been as follows:
Significant observable
inputsFreehold land Valuation techniques Range Fair valueGroup Company
Rs Rs
2020 Sales Comparison approach
Price per square metre Rs 918 - Rs 3,764 274,200,000 257,300,000
2019Sales Comparison
approach Price per square
metre Rs 913 - Rs 3,673 277,200,000 277,200,000
GROUP COMPANY2020 2019 2020 2019
Rs Rs Rs Rs
Freehold Land and Buildings 276,976,178 245,365,009 40,528,914 40,862,154
(e) Assets pledged as security
Property, plant and equipment have been pledged as security for bank facilities granted to the Group (Notes 14 and 18). The carrying value of the assets held under finance lease is detailed in Note 5(d).
(f) Assets written off
Assets written off refers mainly to damaged furniture which are not in a state to be used. These have been written off.
(g) Leasehold Rights on Business Combination transferred to Rights-of-Use Assets classified as Property, Plant and Equipment.
Leasehold rights previously recognised as intangibles on acquisition of subsidiary, Kolos Cement Ltd, have been reclassified to Rights of Use Assets upon application of IFRS 16.
NOTES TO THE FINANCIAL STATEMENTS NOTES TO THE FINANCIAL STATEMENTS
FOR THE YEAR ENDED 31 DECEMBER 2020 FOR THE YEAR ENDED 31 DECEMBER 2020
98 99

5. PROPERTY, PLANT AND EQUIPMENT (CONT’D)
(h) Right-of-Use assets
Group and Company as Lessee
The transfers from Non-current Receivables and Accounts receivables refers to previous payments which were accounted as prepayments made in relation to obtention of the leases. These amounts have been derecognised on transition under IAS 17 for operating leases.
Description of lease activities
Land and buildings The Group and Company lease land and buildings for their offices and Warehouses. The leases are for a period of 6 years for the Company and 6 to 50 years for the Group with no extension option. Plant and Machinery, and Motor Vehicles The Group leases Plant and Machinery like forklifts which are used in the operations and motor vehicles which are used by employees to attend construction sites and customers. The leases are for a period ranging from 2 to 5 years with no extension option.
Group Land & Buildings
Land & Buildings Motor Vehicles Total
Rs Rs Rs Rs
As at 1 January 2019 - - - - Transfer from Non-Current Receivables 51,096,512 - - 51,096,512 Transfer from Accounts Receivable 248,537 - - 248,537
Transfer of Leasehold Rights on business combination
114,071,000 - - 114,071,000
Recognition of Rights-of-use Assets 200,170,332 10,274,991 38,086,468 248,531,791
Effect of adoption of IFRS 16 - As at 1 January 2019 365,586,381 10,274,991 38,086,468 413,947,840
Additions - - 5,633,204 5,633,204 Depreciation for the year (25,469,769) (3,559,585) (11,320,534) (40,349,888)As at 31 December 2019 340,116,612 6,715,406 32,399,138 379,231,156
Additions 28,161,259 6,629,409 6,907,300 41,697,968 Depreciation for the year (25,099,882) (4,540,432) (13,011,687) (42,652,001)
As at 31 December 2020 343,177,989 8,804,383 26,294,751 378,277,123
CompanyBuildings
Rs
As at 1 January 2019 - -
Effect of adoption of IFRS 16 - As at 1 January 2019
31,143,727
Depreciation for the year (3,892,966)
As at 31 December 2019 27,250,761
Depreciation for the year (3,892,966)
As at 31 December 2020 23,357,795
Leasehold RightsConsolidation On Business Computer
(a) Group Goodwill Combination Software Total Rs Rs Rs Rs
COSTAt 1 January 2019 884,597,862 123,000,000 25,984,204 1,033,582,066 Additions 23,359,268 - 870,910 24,230,178 Write off - - (1,040,658) (1,040,658)Reclassification to Property, Plant & Equipment (Note 5) - (123,000,000) - (123,000,000)
At 31 December 2019 907,957,130 - 25,814,456 933,771,586 Additions - - 236,252 236,252
At 31 December 2020 907,957,130 - 26,050,708 934,007,838
ACCUMULATED IMPAIRMENT/AMORTISATION
At 1 January 2019 94,042,514 8,929,000 9,494,650 112,466,164 Charge for the Year - - 2,400,493 2,400,493 Impairment 36,999,402 - - 36,999,402 Write off - - (1,040,657) (1,040,657)Reclassification to Property, Plant & Equipment (Note 5) - (8,929,000) - (8,929,000)
At 31 December 2019 131,041,916 - 10,854,486 141,896,402 Charge for the Year - - 2,553,671 2,553,671 At 31 December 2020 131,041,916 - 13,408,157 144,450,073
NET BOOK VALUE
At 31 December 2020 776,915,214 - 12,642,551 789,557,765
At 31 December 2019 776,915,214 - 14,959,970 791,875,184
Computer(b) Company Software
Rs
COSTAt 1 January 2019 and 2020 6,258,338 Additions 236,250 Write off (1,040,658)
At 31 December 2019 & 31 December 2020 5,453,930
ACCUMULATED AMORTISATIONAt 1 January 2019 3,463,477 Charge for the year 558,973
At 31 December 2019 4,022,450 Charge for the Year 653,472 Write off (1,040,658)
At 31 December 2020 3,635,264
NET BOOK VALUE
At 31 December 2020 1,818,666
At 31 December 2019 2,235,888
6. INTANGIBLE ASSETS
NOTES TO THE FINANCIAL STATEMENTS NOTES TO THE FINANCIAL STATEMENTS
FOR THE YEAR ENDED 31 DECEMBER 2020 FOR THE YEAR ENDED 31 DECEMBER 2020
100 101

6. INTANGIBLE ASSETS (CONT’D)
Group
Goodwill acquired in a business combination is allocated, at acquisition, to the cash-generating units (“CGUs”) that are expected to benefit from that business combination. The carrying amount of goodwill, which represent the excess consideration paid between the purchase price and net assets acquired, had been allocated as follows:
2020 2019 Rs Rs
Investment and Corporate Services & Others - - - Investment CGU 776,915,214 776,915,214
Goodwill is allocated to the cash generating units. The main basis and assumptions used for impairment testing and the entities to which goodwill are allocated are as follows:
2020 2020 2019Rs Rs Rs
Basis of Impairment
Recoverable Amount
Carrying Amount
Carrying Amount
Princegate Holdings Ltd Net recoverable assets 72,049,671 25,855,314 25,855,314 Pool Joseph Merven Ltd Discounted cash flow 30,065,905 23,359,268 23,359,268 Kolos Cement Ltd Share price on Stock Exchange 2,717,280,000 727,700,632 727,700,632
2,819,395,576 776,915,214 776,915,214
The total amount of goodwill has been assessed as having indefinite useful life as the Group continues to derive benefits from its CGU’s for which Goodwill is allocated. In the context of Covid-19 additional discount premiums are used in the assumptions taken to perform and flex impairment tests.
Govenland Co Ltd has leasehold rights on a plot of land, which is undeveloped. Goodwill which was attributable has been impaired during the year based on the fact that no income will be derived from Govenland Co Ltd in the foreseable future and the fact that its net recoverable assets will continue to deteriorate as operating expenses will continue to be borne by the subsidiary. The goodwill attributable to Govenland Co Ltd was fully impaired in 2019. Main assumptions used for value in use of Pool Joseph Merven Ltd: (i) the expected future net cash flows for five years have been discounted. (ii) the post-tax discount rate used is 8.48%. (iii) annual growth rate averages 1% yearly as from fifth year. The goodwill attributable to Kolos Cement Ltd, which is significant compared to the total carrying amount of goodwill, have been tested for impairment based on its fair value less costs of disposal. The fair value are based on the share price of Kolos Cement Ltd, which is listed on the Development Entreprise Market of the Stock Exchange of Mauritius. No indication of impairment for the current financial year (2019: Nil).
7. INVESTMENTS IN SUBSIDIARIES
COMPANY2020 2019
Rs Rs
Investments in Subsidiaries 1,544,296,949 1,554,505,204
7. INVESTMENTS IN SUBSIDIARIES (CONT’D)
(a) The subsidiaries (direct and indirect) of the Company as at 31 December 2020 are as follows:
Activity Activity Class of Shares Held
Carrying value of investment Effective % Holding
2020 2019 2020 2019 Rs Rs Rs Rs
Accacias Co Ltd Investment Ordinary - - 100.0% 100.0%
Aggregate Resources Co Ltd Dormant Ordinary - - 100.0% 100.0%
A.S. Burstein Management Ltd Lottery Ordinary - - 100.0% 100.0%
Bitumen Storage Ltd Dormant Ordinary - - 100.0% 100.0%
Boron Investments Ltd Investment Ordinary 6,200,000 6,200,000 100.0% 100.0%
BR Capital Ltd Property investment Ordinary - - 100.0% 100.0%
BR Hotel Resorts Ltd Property investment Ordinary - - 100.0% 100.0%
Broadgate Holding Ltd Investment Ordinary - - 100.0% 100.0%
Broadgate Investment Ltd Investment Ordinary - - 100.0% 100.0%
Burford Development Ltd Property investment Ordinary 25,000 25,000 100.0% 100.0%
Burford Investments Ltd Property investment Ordinary - - 100.0% 100.0%
Burford Property Ltd Property investment Ordinary 25,000 25,000 100.0% 100.0%
Burford Realty Ltd Property investment Ordinary - - 100.0% 100.0%
Cement Logistics Ltd Cement Ordinary - - 74.0% 74.0%
Centreview Development Ltd Property investment Ordinary 25,000 25,000 100.0% 100.0%
Fine Point Property Ltd Dormant Ordinary - - 100.0% 100.0%
Fine Point Realty Ltd Dormant Ordinary - - 100.0% 100.0%
Gamlot Technologies Ltd Dormant Ordinary - - 100.0% 100.0%
Gamma Asia Construction Ltd Dormant Ordinary - - 100.0% 100.0%
Gamma Asia Investment Pte. Ltd Investment Ordinary 3,990 99.0% 0.0%
Gamma Capital Ltd Investment Ordinary 105,164,180 105,164,180 100.0% 100.0%
Gamma Cement Holdco Ltd Dormant Ordinary - - 100.0% 100.0%
Gamma Cement International Ltd Investment Ordinary 3,477,100 4,277,100 100.0% 100.0%
Gamma Cement Ltd Investment Ordinary 1,000,000 1,000,000 100.0% 100.0%
Gamma Corporate Services Ltd Secretarial services Ordinary 25,000 25,000 100.0% 100.0%
Gamma Civic Cement Holdings Ltd Investment Ordinary 100.0% 100.0%
Gamma Civic Construction Holdings Ltd Investment Ordinary - - 100.0% 100.0%
Gamma Civic Construction Ltd Dormant Ordinary - - 100.0% 100.0%
Gamma Civic Hotel Holdings Ltd Investment Ordinary 25,000 25,000 100.0% 100.0%
Gamma Construction Ltd Construction Ordinary 106,000,000 106,000,000 100.0% 100.0%
Gamma Energy Holdings Ltd Investment Ordinary - - 100.0% 100.0%
Gamma Energy Ltd Dormant Ordinary - - 100.0% 100.0%
Gamma FinTech Holding Ltd Dormant Ordinary - - 100.0% 100.0%
Gamma Land Ltd Investment Ordinary 1,000,000 1,000,000 100.0% 100.0%
GammaTech Ltd I.T Application Ordinary - - 100.0% 100.0%
Gamma Treasury Management Ltd Treasury Ordinary 1,000,000 1,000,000 100.0% 100.0%
Gammafin Resource Management Ltd Dormant Ordinary - - 100.0% 100.0%
G-Traxx Equipment & Rental Ltd Dormant Ordinary - - 100.0% 100.0%
Gamma Leisure Ltd Investment Ordinary 50,000 50,000 100.0% 100.0%
Govenland Co Ltd Property investment Ordinary - - 49.0% 49.0%
NOTES TO THE FINANCIAL STATEMENTS NOTES TO THE FINANCIAL STATEMENTS
FOR THE YEAR ENDED 31 DECEMBER 2020 FOR THE YEAR ENDED 31 DECEMBER 2020
102 103

7. INVESTMENTS IN SUBSIDIARIES (CONT’D)
The Non-Current amounts due from subsidiaries classified as Non-Current assets are unsecured and management does not intend to recall any amount within the next twelve months. These amounts are in substance an extension of the equity investments in these subsidiaries so that the amounts are stated at nominal value.
Non-Current amounts due from subsidiaries amounting to Rs 6,179,077 have been impaired during the year and reversal of impairment amounted to Rs 1,800,000 (2019: Impairment Rs 17,206,656 and reversal of impairment Rs 4,000,000). Impairment test is carried out for all subsidiaries by first comparing the Company’s investment against the net assets of the subsidiaries. Additionally, cash flow forecasts of subsidiaries are taken into account when carrying impairment test. Where the investment value is greater than the net assets of the subsidiaries, and there is no indication that the subsidiaries will generate positive cash flow in the foreseeable future, the investment value is impaired up to the net assets amount. The impairment during the year refers to additional investments in subsidiaries to cover their fixed costs. There is no immediate indication of these subsidiaries generating positive cash flows. The Directors consider that the Net Assets Value equals to the Fair value less cost of disposal. The fair value is considered as being a level-3 in the fair value hierarchy.
Activity Activity Class of Shares Held Carrying value of investment Effective % Holding
2020 2019 2020 2019 Rs Rs Rs Rs
Glot Holdings (Mauritius) Ltd Investment Ordinary 99,000 99,000 99.0% 99.0%
Glot Management Ltd Investment Ordinary - - 100.0% 100.0%
Kolos Cement Ltd Cement Ordinary - - 74.0% 74.0%
Kolos Building Materials Ltd Cement Ordinary - - 74.0% 74.0%
Infina Investment Ltd Dormant Ordinary - - 100.0% 0.0%
Insignia Leisure Resorts Ltd Dormant Ordinary - - 100.0% 100.0%
Insignia Resorts Ltd Dormant Ordinary - - 100.0% 100.0%
Lottotech Ltd Lottery Ordinary - - 56.1% 56.1%
Loterie Vert Ltd Lottery Ordinary - - 56.1% 56.1%
Ludgate Investments Ltd Property investment Ordinary - - 100.0% 100.0%
Maurilot Investments Ltd Investment Ordinary 50,000 50,000 100.0% 100.0%
Natlot Investments Ltd Investment Ordinary 10,050,000 10,050,000 100.0% 100.0%
North Point Holdings Ltd Investment Ordinary - - 100.0% 100.0%
North Point Stone Products Ltd Dormant Ordinary - - 100.0% 100.0%
Osterley Investments Ltd Property investment Ordinary - - 98.0% 98.0%
Pool Joseph Merven Limited Lottery Ordinary - - 56.1% 56.1%
Princegate Holdings Ltd Property investment Ordinary 27,563,100 27,563,100 100.0% 100.0%Reel Mada SA (In process of liquidation)
Dormant Ordinary - - 65.0% 65.0%
Regency Realty Ltd Dormant Ordinary - - 100.0% 100.0%
RHT Media Ltd Investment Ordinary - - 100.0% 100.0%
Star Cement Ltd Investment Ordinary - - 100.0% 100.0%
Traxx Ltd Trading Ordinary - - 100.0% 100.0%
Westbourne Properties Ltd Property investment Ordinary - - 100.0% 100.0%
Westview Realty Ltd Property investment Ordinary 100,000 100,000 100.0% 100.0%
261,882,370 262,678,380
Non-current amounts due from Subsidiaries - Note 7(c) 1,282,414,579 1,291,826,824
1,544,296,949 1,554,505,204
7. INVESTMENTS IN SUBSIDIARIES (CONT’D)
During the year Gamma Asia Investment Pte. Ltd and Infina Investment Ltd were incorporated by the Group.
(b) Composition of the Group
Information about the composition of the Group at the end of the reporting period is as follows:
(c) Non-Current Amount due from Subsidiaries
Principal ActivityPlace of incorporation and
operationNumber of wholly-owned subsidiaries
2020 2019
Construction Mauritius 1 1
Dormant Mauritius 16 15
I.T Application Mauritius 1 1
Investment Mauritius 19 19
Lottery Mauritius 1 1
Property investment Mauritius 11 11
Secretarial services Mauritius 1 1
Treasury Mauritius 1 1
Trading Mauritius 1 1
52 51
Principal ActivityPlace of incorporation and
operationNumber of non wholly-owned
subsidiaries2020 2019
Cement Mauritius 3 3
Dormant Mauritius 1 1
Investment Mauritius 2 1
Lottery Mauritius 3 3
Property investment Mauritius 2 2
11 10
COMPANY
2020 2019
At 1 January 1,291,826,824 1,357,742,908
Net cash movement during the year (5,033,168) (52,483,898)
Disposal of Subsidiary - (225,530)
Net Impairment Loss Recognised on Non-current Amount due from Subsidiaries (4,379,077) (13,206,656)
At 31 December (Quasi equity aggregated into investment in subsidiaries - Note 7 (a)) 1,282,414,579 1,291,826,824
NOTES TO THE FINANCIAL STATEMENTS NOTES TO THE FINANCIAL STATEMENTS
FOR THE YEAR ENDED 31 DECEMBER 2020 FOR THE YEAR ENDED 31 DECEMBER 2020
104 105

7. INVESTMENTS IN SUBSIDIARIES (CONT’D)
(d) Details of non-wholly owned subsidiaries that have material non-controlling
The table below shows details of non-wholly owned subsidiaries of the Group that have material Non-controlling interests:
Name of Subsidiary
Place of incorporation and principal
place of business
Proportion of ownership interests and
voting rights held by non-controlling interests
Profit allocated to non-controlling
interests
Accumulated non-controlling
interests
2020 2019 2020 2019 2020 2019
Rs Rs Rs Rs Rs Rs
Lottotech Ltd Mauritius 43.9% 43.9% 26,510,525 75,508,378 70,165,235 91,920,129
Kolos Cement Ltd Mauritius 26.0% 26% 37,136,642 47,835,263 139,444,197 120,602,202
Individually immaterial subsidiaries with non-controlling interests
976,093 24,575,357 (5,121,802) (6,330,382)
64,623,260 147,918,998 204,487,630 206,191,948
During the year ended 31 December 2019, the Group acquired 56.1% in Pool Joseph Merven Limited for a considerationof Rs 23,495,000 through Lottotech Ltd (Note 37). the Group also disposed of its 100% stake in Gammafin Ltd for a consideration of Rs 1,000,000 (Note 34). The profit allocated to non-controlling interest of individually immaterial subsidiaries of Rs 24,575,357 in 2019 included Rs 42,844,914 net gain on fair value of investment properties in subsidiaries BR Capital Ltd and Burford Investments Ltd.
7. INVESTMENTS IN SUBSIDIARIES (CONT’D)
(d) Details of non-wholly owned subsidiaries that have material non-controlling (Cont’d)
Summarised financial information in respect of each of the Group’s subsidiaries that has material non-controlling interests is set out below. The summarised financial information below represents amounts before intragroup eliminations.
Lottotech Ltd
2020 2019 Rs Rs
Current Assets 326,439,044 377,414,169
Non-current Assets 219,595,272 161,838,297
Current Liabilities (345,783,375) (311,679,006)
Non-current Liabilities (40,346,670) (18,090,499)
Equity attributable to owners of the Company 89,739,036 117,562,832
Non-controlling Interests 70,165,235 91,920,129
2020 2019Rs Rs
Revenue 959,095,415 1,354,713,186
Expenses (898,678,075) (1,182,630,007)
Profit for the year 60,417,340 172,083,179
Profit attributable to the owners of the Company 33,906,815 96,574,801
Profit attributable to the non-controlling interests 26,510,525 75,508,378
Profit for the year 60,417,340 172,083,179
Other comprehensive loss attributable to the owners of the Company (671,224) (555,705)
Other comprehensive loss attributable to non-controlling interests (524,806) (434,485)
Dividend paid to non-controlling interests (47,740,352) (62,659,212)
Net cash inflow from operating activities 82,835,793 66,833,924
Net cash outflow from investing activities (46,622,003) (126,003,707)
Net cash outflow from financing activities (8,273,095) (29,023,638)
Net cash inflow/(outflow) 27,940,695 (88,193,421)
NOTES TO THE FINANCIAL STATEMENTS NOTES TO THE FINANCIAL STATEMENTS
FOR THE YEAR ENDED 31 DECEMBER 2020 FOR THE YEAR ENDED 31 DECEMBER 2020
106 107

Kolos Cement Ltd
2020 2019 Rs Rs
Current Assets 279,504,385 256,172,957
Non-current Assets 689,931,465 616,831,217
Current Liabilities (209,989,451) (243,466,454)
Non-current Liabilities (223,122,564) (165,683,098)
Equity attributable to owners of the Company 396,879,638 343,252,420
Non-controlling Interests 139,444,197 120,602,202
2020 2019Rs Rs
Revenue 1,375,279,811 1,475,246,068
Expenses (1,232,446,572) (1,291,264,287)
Profit for the year 142,833,239 183,981,781
Profit attributable to the owners of the Company 105,696,597 136,146,518
Profit attributable to the non-controlling interests 37,136,642 47,835,263
Profit for the year 142,833,239 183,981,781
Other comprehensive income attributable to the owners of the Company 9,868,621 7,891,680
Other comprehensive income attributable to non-controlling interests 3,467,353 2,772,753
Dividend paid to non-controlling interests (14,674,500) (45,562,500)
Net cash inflow from operating activities 100,514,266 118,562,790
Net cash outflow from investing activities (94,877,385) (34,429,565)
Net cash outflow from financing activities (10,047,840) (112,547,277)
Net cash outflow (4,410,959) (28,414,052)
7. INVESTMENTS IN SUBSIDIARIES (CONT’D)
(e) Risks inherent in Investee Companies
Gamma Civic Ltd invests in companies which have activities in the following industries:
- Contracting; - Lottery, - Investments, - Secretarial services, - Treasury, - Building Materials, - Real Estate, Hotels and Leisure, and - Financial services
8. INVESTMENTS IN ASSOCIATES AND JOINT VENTURE
GROUP COMPANY
2020 2019 2020 2019
Rs Rs Rs Rs
At 1 January 437,926,464 329,473,933 11,180,640 11,180,640 Share of Profit of Associates for the year 16,873,512 58,698,083 - - Goodwill impairment of Associate (8,192,504) - - - Net Share of Profit of Associates 8,681,008 58,698,083 - - Additions 5,000 110,278,360 Revaluation Surplus of Property of Associates, net of Deferred Tax 4,990,331 5,646,566 - -
Dividend received (39,632,112) (15,536,357) - - Disposal of Associate - (51,262,028) - - Remeasurement of Retirement Benefit Obligations, net of Deferred Tax (1,539,531) 627,907 - -
At 31 December 410,431,160 437,926,464 11,180,640 11,180,640
Investment in Joint Venture
At 1 January 463,312,691 425,373,490 42,065,000 42,065,000 Share of Profit of Joint Venture 66,752,343 125,611,756 - - Dividend received (113,049,689) (84,045,870) - - Revaluation Surplus of Property of Joint Venture, net of Deferred Tax 2,483,446 - - -
Remeasurement of Retirement Benefit Obligations, net of Deferred Tax 1,620,576 (3,626,685) - -
At 31 December 421,119,367 463,312,691 42,065,000 42,065,000
Total Investments in Associates and Joint Venture 831,550,527 901,239,155 53,245,640 53,245,640
Valuation of Associates & Joint-Venture GROUP COMPANY
2020 2019 2020 2019
Rs Rs Rs Rs
Quoted Equity Investments at Fair Value 236,191,017 239,647,470 5,730,078 5,813,933 Unquoted Equity Investments at Cost 198,288,920 198,283,920 42,065,000 42,065,000
434,479,937 437,931,390 47,795,078 47,878,933
In 2019, Stamford Properties Ltd was disposed through redemption of the shares held by the Group. Non cashconsideration received was equal to additional shareholding received by the Group’s wholly owned subsidiary, Gamma Land Ltd, in BR Capital Ltd and Burford Investments Ltd. Consequently, the Group’s shareholding in these companies increased from 75% to 100%. The fair value of quoted equity investments is based on quoted prices on the Stock Exchange of Mauritius Ltd at reporting date.
(b) Fair value of Investments in Associates and Investment in Joint Venture.
(a) Investments in Associates
7. INVESTMENTS IN SUBSIDIARIES (CONT’D)
(d) Details of non-wholly owned subsidiaries that have material non-controlling (Cont’d)
Summarised financial information in respect of each of the Group’s subsidiaries that has material non-controlling interests is set out below. The summarised financial information below represents amounts before intragroup eliminations.
NOTES TO THE FINANCIAL STATEMENTS NOTES TO THE FINANCIAL STATEMENTS
FOR THE YEAR ENDED 31 DECEMBER 2020 FOR THE YEAR ENDED 31 DECEMBER 2020
108 109

8. INVESTMENTS IN ASSOCIATES AND JOINT VENTURE (CONT’D)
(c) The following are the associates of the Company:
Name ActivityClass of
Shares HeldPlace of business
Effective % Holding % of Voting Power Held
2020 2019 2020 2019
Morning Light Co. Ltd Hotel Ordinary Mauritius 25.1% 25.1% 25.1% 25.1%Viva Voce Limitee Media Ordinary Mauritius 25.7% 25.7% 25.7% 25.7%Stamford Properties Ltd Real Estate Ordinary Mauritius 0% 0% 0% 0%
Square Mile Investment Nine LtdInvestment Holding
Ordinary Mauritius 50% 50% 50% 50%
CG Re (Africa) LtdRe-Insurance broking
Ordinary Mauritius 50% 50% 50% 50%
CG Re (Africa) (Proprietary) Limited
Re-Insurance broking
Ordinary Botswana 50% 50% 50% 50%
Moon Craft LtdInvestment Holding
Ordinary Mauritius 30% 30% 30% 30%
Bastion Fort LtdI.T application Development
Ordinary Mauritius 30% 30% 30% 30%
IAME LimitedI.T application Development
Ordinary Mauritius 30% 30% 30% 30%
Mobi Move LtdI.T application Development
Ordinary Mauritius 30% 30% 30% 30%
Associates Joint Venture
2020 2019 2020 2019
Total Assets 1,869,619,268 2,015,188,799 1,591,952,050 1,617,707,662
Total Liabilities (734,719,261) (798,390,769) (749,713,317) (691,082,282)
Net Assets 1,134,900,007 1,216,798,030 842,238,733 926,625,380
Group’s Share of Associates’ and Joint Venture's Net Assets
407,122,093 326,397,724 421,119,367 463,312,690
Revenue 307,052,198 766,446,369 1,631,682,648 2,162,010,042
(Loss)/Profit for the Year (17,619,656) 138,372,265 133,504,686 251,223,510
Total Comprehensive Income (3,855,238) 163,370,162 141,712,728 243,970,140
Group's Share of Associates' and Joint Venture's Profit for the Year
18,248,813 58,054,564 66,752,343 125,611,755
Group's Share of Associates' and Joint Venture's Total Comprehensive Income for the Year
21,699,613 64,329,037 70,856,364 121,985,070
Name ActivityClass of
Shares HeldPlace of business
Effective % Holding % of Voting Power Held
2020 2019 2020 2019
Gamma Materials LtdBuilding Materials
Ordinary Mauritius 50% 50% 50% 50%
(d) Summarised financial information in respect of each of the Group’s material associates and joint venture is set out below. The summarised financial informatio
below represents amount shown in the associates’ and joint-venture’s financial statements prepared in accordance with IFRSs.
Details of the investment in the joint venture are as follows:
8. INVESTMENTS IN ASSOCIATES AND JOINT VENTURE (CONT’D))
(d) Summarised financial information in respect of each of the Group’s material associates and joint venture is set out below. The summarised financial informatio
below represents amount shown in the associates’ and joint-venture’s financial statements prepared in accordance with IFRSs. (Cont’d)
Morning Light Co. Ltd
2020 2019 Rs Rs
Current Assets - cash and cash equivalents 14,073,420 63,901,081
Other current Assets 27,158,611 100,521,261
Non-current Assets 1,711,636,974 1,730,951,398
Current Liabilities (148,358,954) (228,196,513)
Non-current Liabilities (562,294,997) (540,788,166)
2020 2019Rs Rs
Revenue 179,576,096 600,913,002
Depreciation and amortisation (56,326,858) (66,715,831)
Interest expense (20,596,722) (20,976,322)
Income tax credit/(expense) 11,024,579 (10,036,840)
(Loss)/Profit for the year (97,938,425) 38,586,742
Other comprehensive income for the year 13,764,418 24,997,897
Total comprehensive (loss)/income for the year (84,174,007) 63,584,639
Dividends received from the associate during the year - (11,521,513)
Reconciliation of the above summarised information to the carrying amount of the interest in Morning Light Co. Ltd recognised in the consolidated financial statements:
2020 2019Rs Rs
Net Assets in Associate 1,042,215,054 1,062,487,980 Proportion of the Group's ownership interest in Morning Light Co. Ltd 25.1% 25.1%Share of net assets in associate 261,283,314 266,684,483
Carrying amount of the Group's interest in Morning Light Co. Ltd 261,283,314 266,684,483
NOTES TO THE FINANCIAL STATEMENTS NOTES TO THE FINANCIAL STATEMENTS
FOR THE YEAR ENDED 31 DECEMBER 2020 FOR THE YEAR ENDED 31 DECEMBER 2020
110 111

Stamford Properties Ltd
2020 2019 Rs Rs
Revenue - 22,904,254
Interest expense - (9,305)
Income tax expense - (3,818,763)
Profit for the year - 16,358,031
Other Comprehensive Income for the year - -
Total Comprehensive Income for the year - 16,358,031
Dividends received from the associate during the year - -
Square Mile Investment Nine Ltd2020 2019
Rs Rs
Current Assets - cash and cash equivalents 47,989,494 45,962,882
Other current Assets 58,254,399 57,148,881
Non-current Assets 2,105,735 713,711
Current Liabilities (18,183,162) (21,733,043)
2020 2019 Rs Rs
Revenue 121,177,278 130,642,342
Interest income 51,566 200,181
Profit for the year 86,279,903 82,409,444
Other Comprehensive Income for the year - -
Total Comprehensive Income for the year 86,279,903 82,409,444
Dividends received from the associate during the year (39,632,112) -
The goodwill represents the excess of the Group’s share of net fair value of the identifiable assets and liabilities over the cost of the acquisition.The Group tests goodwill annually for impairment, or more frequently if there are indications that goodwill might be impaired.
At 31 December 2020, based on the impairment tests, the directors determined that goodwill that had been allocated to Square Mile Investment Nine Ltd had not been impaired. The Group considers the relationship between the book value of the investment and the discounted forecasted cash flow forecast.
2020 2019 Rs Rs
Net Assets in Associate 90,166,466 82,092,431 Proportion of the Group's ownership interest in Square Mile Investment Nine Ltd 50% 50%Share of net assets in Associate 45,083,233 41,046,216 Goodwill on purchase 100,000,000 100,158,106 Carrying amount of the Group's interest in Square Mile Investment Nine Ltd 145,083,233 141,204,322
2020 2019
Rs Rs
Net Assets in Associate 2,518,487 8,316,538 Proportion of the Group's ownership interest in Moon Craft Ltd 30% 30%Share of net assets in Associate 755,546 2,494,961 Goodwill on purchase - 8,192,504 Carrying amount of the Group's interest in Moon Craft Ltd 755,546 10,687,465
The Goodwill on purchase of shares in Moon Craft Ltd has been impaired during the year under Share of profit of Associates.
Moon Craft Ltd
2020 2019 Rs Rs
Current Assets - cash and cash equivalents 2,978,508 7,896,297
Other current Assets 1,150,586 2,044,293
Non-current Assets 4,271,541 6,048,995
Current Liabilities (619,726) (781,281)
Non-current liabilities (5,262,422) (6,891,766)
2020 2019 Rs Rs
Revenue 6,298,824 11,986,771
Depreciation and amortisation 1,874,102 638,930
Interest expense - 10,442
(Loss)/profit for the year (5,961,134) 1,018,048
Other Comprehensive Income for the year - -
Total Comprehensive Income for the year (5,961,134) 1,018,048
Reconciliation of the above summarised information to the carrying amount of the interest in Moon Craft Group recognised in the consolidated financial statements:
8. INVESTMENTS IN ASSOCIATES AND JOINT VENTURE (CONT’D)
(d) Summarised financial information in respect of each of the Group’s material associates and joint venture is set out below. The summarised financial informatio
below represents amount shown in the associates’ and joint-venture’s financial statements prepared in accordance with IFRSs. (Cont’d)
Square Mile Investment Nine Ltd (Cont’d)
Reconciliation of the above summarised information to the carrying amount of the interest in Square Mile Investment Nine Ltd recognised in the consolidated financial statements:
8. INVESTMENTS IN ASSOCIATES AND JOINT VENTURE (CONT’D)
(d) Summarised financial information in respect of each of the Group’s material associates and joint venture is set out below. The summarised financial informatio
below represents amount shown in the associates’ and joint-venture’s financial statements prepared in accordance with IFRSs. (Cont’d)
NOTES TO THE FINANCIAL STATEMENTS NOTES TO THE FINANCIAL STATEMENTS
FOR THE YEAR ENDED 31 DECEMBER 2020 FOR THE YEAR ENDED 31 DECEMBER 2020
112 113

Gamma Materials Ltd
2020 2019 Rs Rs
Current Assets - cash and cash equivalents 158,966,223 151,689,437
Other current Assets 486,973,791 468,802,076
Non-current Assets 946,012,036 997,216,150
Current Liabilities (450,918,430) (342,134,630)
Non-current Liabilities (298,794,887) (348,947,652)
2020 2019 Rs Rs
Revenue 1,631,682,648 2,162,010,042
Interest income 1,062,864 881,210
Interest expense (8,427,865) (5,353,435)Depreciation and Amortisation (123,585,811) (127,210,466)Income tax expense (27,081,865) (53,978,511)
Profit for the year 133,504,686 251,223,510
Other Comprehensive loss for the year 8,208,042 (7,253,370)
Total Comprehensive Income for the year 141,712,728 243,970,140
Dividends received from the Joint Venture during the year (113,049,688) (84,045,870)
Reconciliation of the above summarised information to the carrying amount of the interest in Gamma Materials Ltd recognised in the consolidated financial statements:
2020 2019 Rs Rs
Net Asset in Joint Venture 842,238,733 926,625,381 Proportion of the Group's ownership interest in Gamma Materials Ltd 50% 50%Share of Net Asset in Joint venture 421,119,367 463,312,691
Carrying amount of the Group's interest in Gamma Materials Ltd 421,119,367 463,312,691
Aggregate information of associates that are not individually material2020 2019
Rs Rs
The Group's share of (loss)/profit (6,957) 234,814
Aggregate carrying amount of the Group's interests in these associates 3,309,067 3,311,023
Equity accounting has been applied and the Group’s share of losses of associates recognised in the Group Statements of Profit or Loss and Other Comprehensive Income only to the extent of bringing the carrying amount of the investments in the respective associates down to zero.
The investments in associates in the Company’s Statements of Financial Position are not impaired.
GROUP
Freehold Land and Building on
Leasehold PropertyRight-Of- Use Assets Total
Rs Rs
At 1 January 2019 1,041,084,855 - 1,041,084,855 Effect of adoption of IFRS 16 - 62,308,287 62,308,287
Additions 74,689,456 - 74,689,456
Gain from fair value adjustment 182,059,888 (731,201) 181,328,687
At 31 December 2019 1,297,834,199 61,577,087 1,359,411,286 Reclassification to Assets Held for Sale (Note 32) (10,506,577) - (10,506,577)
Gain from fair value adjustment 4,842,500 1,164,235 6,006,735
At 31 December 2020 1,292,170,122 62,741,322 1,354,911,444
GROUP
2020 2019
Rs Rs
Rental income derived from investment properties 18,785,094 26,269,693 Direct operating expenses (including repairs and maintenance) generating rental income (included in administrative espenses) (7,653,426) (5,370,126)
Direct operating expenses (including repairs and maintenance) that did not generate rental income (included in administrative expenses) (7,000) (3,662,287)
Profit arising from investment properties carried at fair value 11,124,668 17,237,280
GROUP
Right-of-Use assets Building on Leasehold Property
Group as Lessee 2020 2019
Rs Rs
At 1 January (2019: Recognition of Rights-of-use Assets) 61,577,087 62,308,288 Gain/(Loss) from fair value adjustment for the year 1,164,235 (731,201)At 31 December 62,741,322 61,577,087
9. INVESTMENT PROPERTIES
The fair value of the Group’s investment properties as at 31 December 2020 has been arrived at on the basis of a valuation carried out on the respective dates by Elevante Property Services Ltd, an independent valuer not related to the Group. Elevante Property Services Ltd is member of the Royal Institute of Chartered Surveyors, and the directors determine that they have appropriate qualifications and recent experience in the valuation of properties in the relevant locations. The fair value was determined based on the sales comparison method and income capitalisation approach. The basis of valuation in estimating the open market values have been effected in accordance with the principles set out by the International Valuation Standards Committee as per the International Valuation Application 1 (IVA 1) which deals with valuation for financial reporting and which is to be used in the context of International Financial Reporting Standards (IFRS) published by the International Accounting Standards Board (IASB).
There has been no change to the valuation technique during the year. In estimating the fair value of the properties, the highest and best use of the properties is their current use.
The Group rents leasehold land on which it has constructed an office building. The leases are for a remaining period of 14 years, with an extension period of 60 years.
The Group has no restrictions on the realisability of its investment properties and no contractual obligations to purchase, construct or develop investment properties or for repairs, maintenance and enhancements.
8. INVESTMENTS IN ASSOCIATES AND JOINT VENTURE (CONT’D)
(d) Summarised financial information in respect of each of the Group’s material associates and joint venture is set out below. The summarised financial informatio
below represents amount shown in the associates’ and joint-venture’s financial statements prepared in accordance with IFRSs. (Cont’d)
NOTES TO THE FINANCIAL STATEMENTS NOTES TO THE FINANCIAL STATEMENTS
FOR THE YEAR ENDED 31 DECEMBER 2020 FOR THE YEAR ENDED 31 DECEMBER 2020
114 115

10. FAIR VALUE HIERARCHY OF INVESTMENT PROPERTIES Details of the Group’s investment properties and information about the fair value hierarchy as at 31 December 2020 and 2019 are as follows:
Valuation techniques
Significant observable inputs Range
2020 & 2019
Freehold Building on leasehold land
Freehold Building on leasehold land
Rental Growth 5%
Freehold office units and leasehold site
Freehold office units and leasehold site
Rental yield 8.75 to 9.00%
Valuation techniques
Significant observable inputs Range
2020 2019
Rs Rs
Freehold LandSales Comparison
approachPrice per square metre Rs 918 - Rs 3,764 Rs 918 - Rs 3,764
Level 2Fair value as at
31 December 2020 Rs Rs
Freehold building on leasehold land, freehold office units and leasehold site 496,470,122 496,470,122 Bare freehold land and buildings and other structures 795,700,000 795,700,000 Leasehold Land - Rights of Use Assets 62,741,322 62,741,322
1,354,911,444
Level 2Fair value as at
31 December 2019 Rs Rs
Freehold building on leasehold land, freehold office units and leasehold site 475,534,199 475,534,199 Bare freehold land and buildings and other structures 822,300,000 822,300,000 Leasehold Land - Rights of Use Assets 61,577,087 61,577,087
1,359,411,286
The investment properties categorised into Level 2 (2019: Level 2) of the fair value hierarchy, the following information is relevant:
11. INVENTORIES
12. CONTRACT ASSETS
The contract assets primarily relate to the Group’s receivables from its construction contracting activities. Contract assets also include all contracts retention and advances paid to subcontractors. Of the balances from trade receivables from current contracts assets at the end of the reporting date, Rs310M (2019: Rs245M) is due from Government Authorities and their related entities.
Contracts retention are amounts invoiced but not paid until the conditions specified in the contract are fulfilled or until defects have been rectified. These balances are carried at amortised cost using an effective interest rate of 4.90% p.a (2019:6.60%).
Advances are amounts paid to subcontractors for related work in progress. Progress billings are amounts billed for work performed but not yet recognised as revenue as at reporting date. Trade receivables from contracts are non-interest bearing and are generally on terms of 60 days. No interest is charged on the trade receivables but the Group reserves its contractual rights to claim interest on overdue amounts. The interest rates, if any, are normally agreed under the contract agreement. In determining the recoverability of contract assets, the Group assesses its contractual rights and the terms and conditions of the agreements. The Group does not hold any collateral as security over these balances. Prior to the decision to submit a tender for a particular contract, the Group assesses the financial strength and stability of the potential client. The Group bids for both private and Government projects. Payment terms form part of the contract agreement whereby all conditions and entitlements of the contractor are listed. The client portfolio varies from year to year depending on which contracts are awarded at that time.
Customer credit risk is managed in accordance with the Company’s established policy, procedures and control relating to customer credit risk management. Credit quality of a customer is assessed based on an extensive credit rating scorecard. Outstanding customer receivables and contract assets are regularly monitored. An impairment analysis is performed at each reporting date using a provision matrix to measure expected credit losses. The provision rates are based on days past due for groupings of various customer segments with similar loss patterns (i.e., by customer type and rating). The calculation reflects the probability-weighted outcome, the time value of money and reasonable and supportable information that is available at the reporting date about past events, current conditions and forecasts of future economic conditions.
GROUP
2020 2019
Rs Rs
Raw materials 154,514,301 111,523,167 Stock in transit 1,851,714 1,710,174 Finished Goods 93,694,087 54,319,215
250,060,102 167,552,556
During the period cost of inventories recognised as expense in the Statement of Profit or Loss amounts to Rs 928,083,886 (2019: Rs 992,905,355).
The cost of inventories recognised as expense includes Rs 4,663,452 in respect of write-downs (2019: Rs 3,662,043 reversal of write-downs) of inventory to net realisable value.
GROUP
2020 2019
Non-Current Assets Rs Rs
Contracts retention 50,351,096 43,175,313 Advance to subcontractors - 44,338,497
50,351,096 87,513,810
NOTES TO THE FINANCIAL STATEMENTS NOTES TO THE FINANCIAL STATEMENTS
FOR THE YEAR ENDED 31 DECEMBER 2020 FOR THE YEAR ENDED 31 DECEMBER 2020
116 117

12. CONTRACT ASSETS (CONT’D)
Balances of contract assets are assessed for expected credit losses. Allowance for expected credit losses / Provision for impairment on contract assets
Less than 30 days 31-60 days 61-90 days More than 90 days
Expected credit loss rate (%) 0.02% 0.43% 26.47% 84.12% Rs Rs Rs Rs
Estimated total gross carrying amount at default 570,488,384 102,936,225 19,123,958 18,299,555
Expected credit losses (108,993) (442,135) (5,062,224) (15,393,806)
Net carrying amount 570,379,391 102,494,090 14,061,734 2,905,749
31 December 2020
Less than 30 days 31-60 days 61-90 days More than 90 days
Expected credit loss rate (%) 0.01% 2.73% 15.65% 83.11% Rs Rs Rs Rs
Estimated total gross carrying amount at default 193,948,152 244,825,887 3,432,060 10,413,107
Expected credit losses (14,983) (6,687,167) (537,192) (8,654,424)Net carrying amount 193,933,169 238,138,720 2,894,868 1,758,683
GROUP
Allowance for expected credit losses 2020 2019Rs Rs
At 1 January 15,893,766 18,538,212 Charge/(Credit) for the year 5,113,392 (2,644,446)
At 31 December 21,007,158 15,893,766
The increase in allowance for expected credit losses is due to the increased amount of Contract Assets at 31 December 2020.
GROUP COMPANY
2020 2019 2020 2019Rs Rs Rs Rs
Trade Receivables, Net of allowance for expected credit losses 99,972,606 225,493,692 - -
Amount due from Associates and Joint Venture (Note 28) 8,804,078 6,085,471 7,460,778 6,085,471
Other receivables and Prepayments 199,126,940 107,212,970 66,309,433 62,789,696
307,903,624 338,792,133 73,770,211 68,875,167
The carrying amount of trade and other receivables approximates their fair value.
The average contractual credit period on sales of goods is three months. Allowance for expected credit losses is determined by the Group using provision matrix. No interest is charged on the trade receivables. Management expects full recoverability of due balances which are neither past due nor impaired.
12(a). TRADE AND OTHER RECEIVABLES
12(a). TRADE AND OTHER RECEIVABLES (CONT’D) Before accepting any new customer, the Group assesses the potential customer’s credit quality and defines credit limits by customer. There are no customers (2019: Nil) who represent more than 5% of the total balance of trade receivables.
Included in the Group’s trade receivables balance are debtors with a carrying amount of Rs 19,483,277 (2019: Rs 5,404,848) which are past due at the reporting date for which the Group have not provided as there has not been a significant change in credit quality and the amounts are still considered recoverable. The Group do not hold any collateral over these balances.
Other receivables balances for the Group and the Company includes Rs 66M (2019:Rs 66M) from a single customer, the Government of Mauritius, on compulsory acquisition of land.
Impairment Loss (Reversed)/Recognised on trade receivables refers to allowances for expected losses as required by IFRS 9. The decrease in allowances for expected credit losses is directly attributable to the decrease in trade receivables balances due at 31 December 2020. An amount of Rs 3,904,113 out of the balance of expected credit losses was written off during the year as uncollectible.
In determining the recoverability of a trade receivable, the Group considers any change in the credit quality of the trade receivable from the date credit was initially granted up to the reporting date.
The Group applies the IFRS 9 simplified approach to measuring the expected credit losses for other receivables and amounts due from related parties. Expected credit losses are calculated based on individual balances on a case to case basis.
The Group’s Other receivables and prepayments are assessed for expected credit losses individually on a case- by-case basis and an allowance for expected losses for an amount of Rs 2,547,103 was made during the year (2019: Rs 4,770,510).
Ageing of past due but not impaired trade receivables:
GROUP
2020 2019
Non-Current Assets Rs Rs
61 - 90 days 5,410,726 918,054 Over 91 days 154,800 3,799,829
Total 5,565,526 4,717,883
Allowance for expected credit losses on trade receivables
GROUP COMPANY
2020 2019 2020 2019
Non-Current Assets Rs Rs Rs Rs
At 1 January 11,594,748 11,778,776 546,351 546,351Credit for the year (5,949,151) (184,028) (220,869) -
At 31 December 5,645,597 11,594,748 325,482 546,351
NOTES TO THE FINANCIAL STATEMENTS NOTES TO THE FINANCIAL STATEMENTS
FOR THE YEAR ENDED 31 DECEMBER 2020 FOR THE YEAR ENDED 31 DECEMBER 2020
118 119

13. STATED CAPITAL
GROUP AND COMPANY
2020 2019
Rs Rs
133,250,000 (2019: 133,250,000) Ordinary Shares of Rs1 (2019: Rs1) each 133,250,000 133,250,000
Fully paid ordinary shares have rights to dividends and each share carry one voting right.
Credit exposure on trade receivables
Less than 30 days 31-60 days 61-90 days More than 90 days
Group - 31 December 2020
Expected credit loss rate (%) 0% - 1.96% 1.43% - 100% 3.53% - 100% 97.3% - 100% Rs Rs Rs Rs
Estimated total gross carrying amount at default 80,662,707 13,978,814 5,863,261 5,113,421
Expected credit loss (173,378) (494,064) (84,083) (4,894,072)Net carrying amount 80,489,329 13,484,750 5,779,178 219,349
Group - 31 December 2019
Expected credit loss rate (%) 0% - 1.96% 1.43% - 100% 3.53% - 100% 97.3% - 100%
Rs Rs Rs Rs
Estimated total gross carrying amount at default
220,175,000 1,052,726 1,855,875 14,004,839
Expected credit loss (86,156) (365,761) (937,821) (10,205,010)Net carrying amount 220,088,844 686,965 918,054 3,799,829
12(a). TRADE AND OTHER RECEIVABLES (CONT’D) 14. LOANS
15. LEASE LIABILITIES
GROUP COMPANY
2020 2019 2020 2019 Rs Rs Rs Rs
Loans Repayable by Instalments 769,853,790 633,277,291 458,236,676 458,236,676 Less: Amount due for Settlement within one year (shown under Current Liabilities) (161,574,069) (71,462,675) (70,352,211) (68,208,629)
Amount due for Settlement after one yea (shown under Non-current Liabilities) 608,279,721 561,814,616 387,884,465 390,028,047
GROUP COMPANY
2020 2019 2020 2019 Rs Rs Rs Rs
At 1 January (2019: Recognition of lease liability) 232,260,545 262,740,079 27,995,177 31,143,727 Accretion of interest 15,947,870 14,127,176 1,542,565 1,730,944 Additions 41,697,968 5,633,204 - - Repayments (48,136,427) (50,239,914) (4,879,494) (4,879,494)
Lease liabilities: 241,769,956 232,260,545 24,658,248 27,995,177 Less: Amount due for Settlement within one year (shown under Current Liabilities) (35,443,570) (22,229,727) (3,536,580) (3,336,929)
Amount due for Settlement after one year (shown under Non-current Liabilities) 206,326,386 210,030,818 21,121,668 24,658,248
(a) The loan due for settlement after one year are repayable as follows:
GROUP COMPANY
2020 2019 2020 2019 Rs Rs Rs Rs
After one year before two years 98,092,007 99,171,442 72,657,236 71,517,810 After two years before five years 312,894,667 301,337,326 232,569,525 235,828,507 After five years 197,293,047 161,305,848 82,657,704 82,681,730
608,279,721 561,814,616 387,884,465 390,028,047
The following are the amounts recognised in Profit or Loss:
GROUP COMPANY
2020 2019 2020 2019 Rs Rs Rs Rs
Depreciation of right-of-use assets 42,652,001 40,349,888 3,892,966 3,892,966 Interest expense on lease liabilities 15,947,870 14,127,176 1,542,565 1,730,944 Expense relating to short-term leases 896,842 631,928 - -
59,496,713 55,108,992 5,435,531 5,623,910
Part of the loans is secured by fixed and floating charges on the assets of the borrowing companies.The rates of interest of the remainder loans are variable and range between 3.25% p.a. to 4.35% p.a. (2019: 4.75% p.a. to 5.60% p.a.). The loans include a total amount of Rs 45,040,615 (2019: Rs 45,040,615) which are unsecured, interest-free with no fixed repayment terms. The fair value of loans approximates their carrying amount.
The lease liabilities in connection to Property, plant & equipment relate to leasehold land & buildings, plant & machinery and motor vehicles with lease term ranging from 2 to 77 years including renewal period at the option of the Group. The Group rents leasehold land on which it has constructed an office building. The leases are for a remaining period of 14 years, with extension periods of 60 years.
NOTES TO THE FINANCIAL STATEMENTS NOTES TO THE FINANCIAL STATEMENTS
FOR THE YEAR ENDED 31 DECEMBER 2020 FOR THE YEAR ENDED 31 DECEMBER 2020
120 121
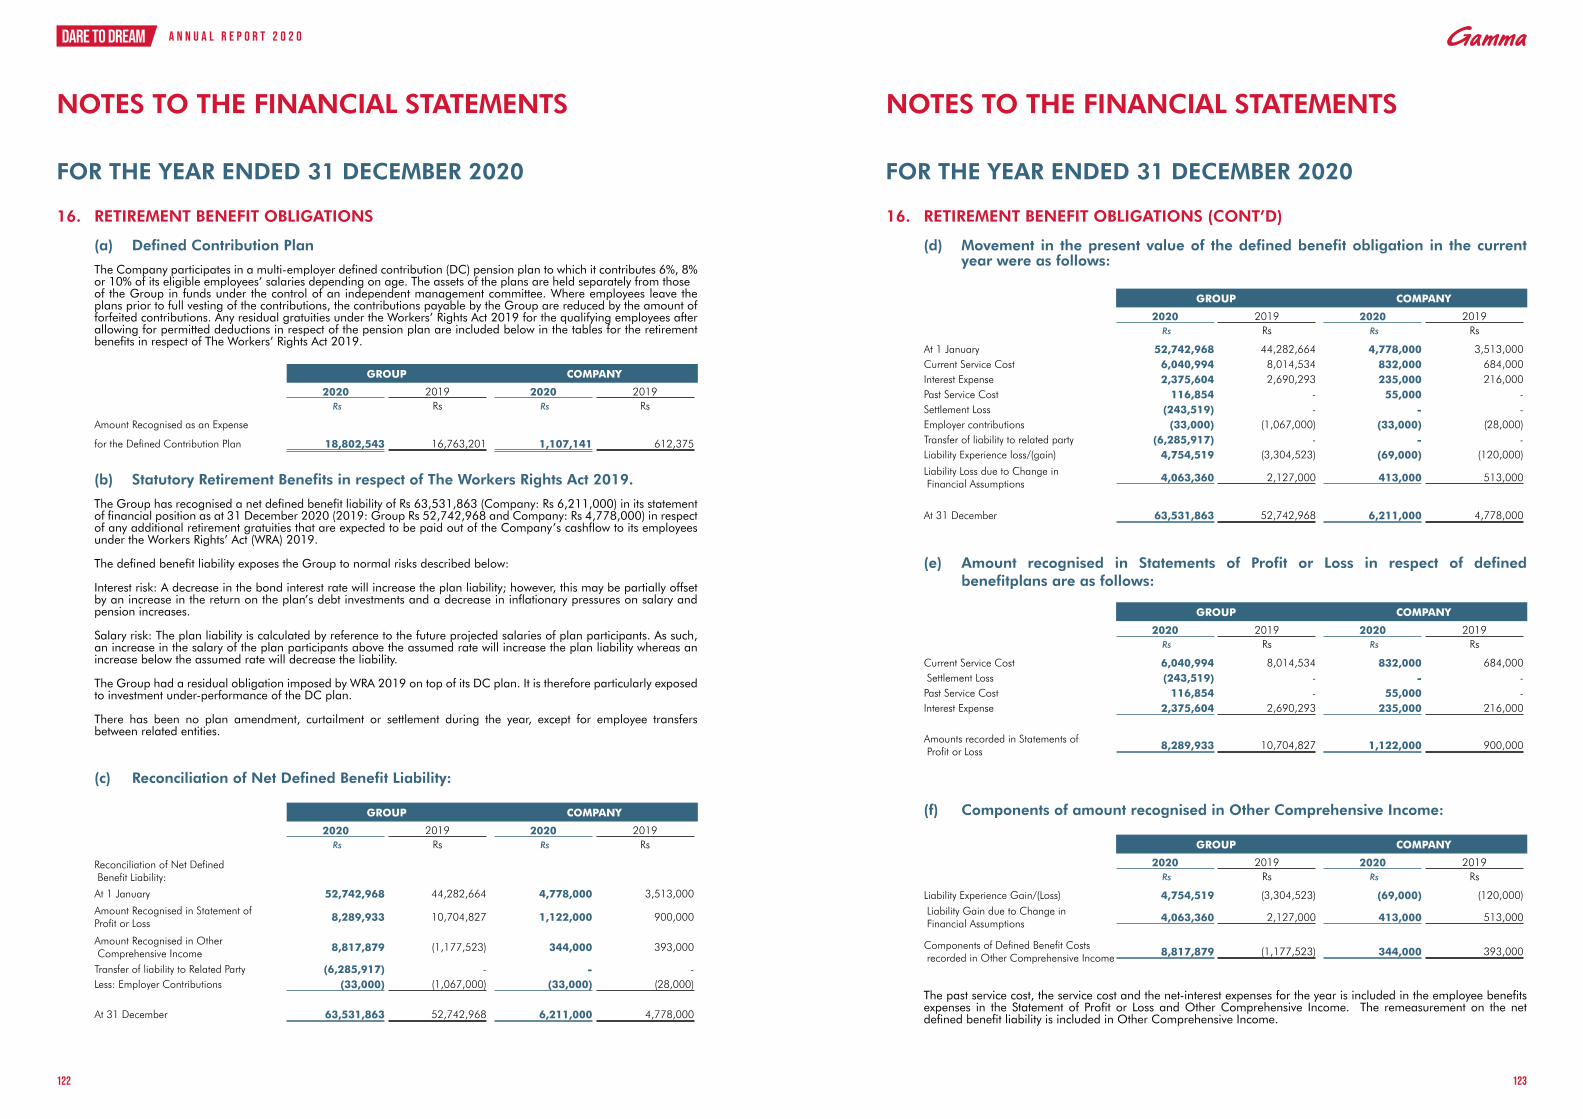
16. RETIREMENT BENEFIT OBLIGATIONS
(a) Defined Contribution Plan
The Company participates in a multi-employer defined contribution (DC) pension plan to which it contributes 6%, 8% or 10% of its eligible employees’ salaries depending on age. The assets of the plans are held separately from those of the Group in funds under the control of an independent management committee. Where employees leave the plans prior to full vesting of the contributions, the contributions payable by the Group are reduced by the amount of forfeited contributions. Any residual gratuities under the Workers’ Rights Act 2019 for the qualifying employees after allowing for permitted deductions in respect of the pension plan are included below in the tables for the retirement benefits in respect of The Workers’ Rights Act 2019.
(b) Statutory Retirement Benefits in respect of The Workers Rights Act 2019.
The Group has recognised a net defined benefit liability of Rs 63,531,863 (Company: Rs 6,211,000) in its statement of financial position as at 31 December 2020 (2019: Group Rs 52,742,968 and Company: Rs 4,778,000) in respect of any additional retirement gratuities that are expected to be paid out of the Company’s cashflow to its employees under the Workers Rights’ Act (WRA) 2019. The defined benefit liability exposes the Group to normal risks described below: Interest risk: A decrease in the bond interest rate will increase the plan liability; however, this may be partially offset by an increase in the return on the plan’s debt investments and a decrease in inflationary pressures on salary and pension increases. Salary risk: The plan liability is calculated by reference to the future projected salaries of plan participants. As such, an increase in the salary of the plan participants above the assumed rate will increase the plan liability whereas an increase below the assumed rate will decrease the liability. The Group had a residual obligation imposed by WRA 2019 on top of its DC plan. It is therefore particularly exposed to investment under-performance of the DC plan. There has been no plan amendment, curtailment or settlement during the year, except for employee transfers between related entities.
(c) Reconciliation of Net Defined Benefit Liability:
GROUP COMPANY
2020 2019 2020 2019 Rs Rs Rs Rs
Amount Recognised as an Expense
for the Defined Contribution Plan 18,802,543 16,763,201 1,107,141 612,375
GROUP COMPANY
2020 2019 2020 2019 Rs Rs Rs Rs
Reconciliation of Net Defined Benefit Liability:
At 1 January 52,742,968 44,282,664 4,778,000 3,513,000
Amount Recognised in Statement of Profit or Loss 8,289,933 10,704,827 1,122,000 900,000
Amount Recognised in Other Comprehensive Income 8,817,879 (1,177,523) 344,000 393,000
Transfer of liability to Related Party (6,285,917) - - - Less: Employer Contributions (33,000) (1,067,000) (33,000) (28,000)
At 31 December 63,531,863 52,742,968 6,211,000 4,778,000
GROUP COMPANY
2020 2019 2020 2019 Rs Rs Rs Rs
At 1 January 52,742,968 44,282,664 4,778,000 3,513,000 Current Service Cost 6,040,994 8,014,534 832,000 684,000 Interest Expense 2,375,604 2,690,293 235,000 216,000 Past Service Cost 116,854 - 55,000 - Settlement Loss (243,519) - - - Employer contributions (33,000) (1,067,000) (33,000) (28,000)Transfer of liability to related party (6,285,917) - - - Liability Experience loss/(gain) 4,754,519 (3,304,523) (69,000) (120,000)
Liability Loss due to Change in Financial Assumptions 4,063,360 2,127,000 413,000 513,000
At 31 December 63,531,863 52,742,968 6,211,000 4,778,000
GROUP COMPANY
2020 2019 2020 2019 Rs Rs Rs Rs
Current Service Cost 6,040,994 8,014,534 832,000 684,000 Settlement Loss (243,519) - - - Past Service Cost 116,854 - 55,000 - Interest Expense 2,375,604 2,690,293 235,000 216,000
Amounts recorded in Statements of Profit or Loss 8,289,933 10,704,827 1,122,000 900,000
GROUP COMPANY
2020 2019 2020 2019 Rs Rs Rs Rs
Liability Experience Gain/(Loss) 4,754,519 (3,304,523) (69,000) (120,000) Liability Gain due to Change in Financial Assumptions 4,063,360 2,127,000 413,000 513,000
Components of Defined Benefit Costs recorded in Other Comprehensive Income 8,817,879 (1,177,523) 344,000 393,000
16. RETIREMENT BENEFIT OBLIGATIONS (CONT’D)
(d) Movement in the present value of the defined benefit obligation in the current year were as follows:
(e) Amount recognised in Statements of Profit or Loss in respect of defined benefitplans are as follows:
(f) Components of amount recognised in Other Comprehensive Income:
The past service cost, the service cost and the net-interest expenses for the year is included in the employee benefits expenses in the Statement of Profit or Loss and Other Comprehensive Income. The remeasurement on the net defined benefit liability is included in Other Comprehensive Income.
NOTES TO THE FINANCIAL STATEMENTS NOTES TO THE FINANCIAL STATEMENTS
FOR THE YEAR ENDED 31 DECEMBER 2020 FOR THE YEAR ENDED 31 DECEMBER 2020
122 123

16. RETIREMENT BENEFIT OBLIGATIONS (CONT’D)
GROUP COMPANY
2020 2019 2020 2019 Rs Rs Rs Rs
Discount Rate 1.4% to 3.1% 3.9% to 5.3% 3.9% to 5.3% 4.9%Expected Rate of Salary Increase 1.0% to 2.0% 3% to 3.6% 3% to 3.6% 3.3%Expected Rate of Pension Increases 0.0% 0.9% to 1.3% 0.9% to 1.3% 0.9%Average Retirement Age (ARA) 65 / 60 years 65 / 60 years 65 / 60 years 65 / 60 years
GROUP COMPANY
2020 2019 2020 2019 Rs Rs Rs Rs
Increased due to 1% Decrease in Discount Rate 20,207,807 14,080,070 999,000 774,000
Decreased due to 1% Increase in Discount Rate 14,392,198 17,388,945 831,000 651,000
Increased due to 1% Increase in Salary Rate 18,095,863 11,050,435 1,015,000 803,000
Decreased due to 1% decrease in Salary Rate 13,076,998 6,346,056 859,000 685,000
GROUP COMPANY
2020 2019 2020 2019 Rs Rs Rs Rs
Expected Employer Contribution for the Next Year 2,463,000 609,000 72,000 -
Weighted Average Duration of the Defined Benefit Obligation 7 to 30 years 6 to 30 years 12 years 11 years
GROUP COMPANY
2020 2019 2020 2019 Rs Rs Rs Rs
National Pension Scheme Contributions Expensed 7,009,441 6,244,311 71,728 158,076
(h) Sensitivity analysis on defined benefit obligation at end of year
(i) Future cash flows
The funding policy is to pay benefits out of the reporting entity’s cashflow as and when due.
(g) The principal assumptions used for the purposes of the actuarial valuation were as follows:
17. TAXATION
(a) Income Tax
(i) The Income Tax expense for the year can be reconciled to the accounting profit as follows:
(ii) Income Tax recognised in Statements of Profit or Loss
(iii) Income Tax recognised in Statements of Financial Position
GROUP COMPANY
2020 2019 2020 2019 Rs Rs Rs Rs
Profit before Taxation 282,345,106 683,947,193 183,656,045 261,965,098
Tax at the above Applicable Rate (17%) 47,998,668 116,271,023 31,221,528 44,534,067 Income not subject to tax (13,844,815) (62,158,549) (40,178,588) (53,407,997)Underprovision in Previous Year 5,250,702 (1,398,532) - - Expenses not deductible 22,635,785 24,047,962 19,886,058 20,679,128 Other adjusting items (7,675,257) 10,875,361 - -
Taxation 54,365,083 87,637,265 10,928,998 11,805,198
Income not subject to tax refers to the Net gain from fair value adjustment of Investment Properties and share of Profits of Associates and Joint Venture for the Group, and dividend income for the Company. Expenses not deductible for the Company which is reflected in the Group figure mainly represents the proportion of expenses attributable to dividend income which is disallowed as not deductible, plus other costs not directly linked with production of taxable Income. Other adjusting items includes tax losses for which no deferred tax has been recognised.
GROUP COMPANY
2020 2019 2020 2019 Rs Rs Rs Rs
Current Tax Expense 54,528,040 75,265,859 6,411,015 -
(Overprovision)/underprovision in Previous Year 5,250,702 (1,398,532) - -
Deferred Tax Movement (5,413,659) 13,769,938 4,517,983 11,805,198
54,365,083 87,637,265 10,928,998 11,805,198
GROUP COMPANY
2020 2019 2020 2019 Rs Rs Rs Rs
At 1 January 28,858,458 34,541,882 - - Charge for the year 54,528,040 75,265,859 6,411,015 - Paid during the year (57,616,500) (79,550,751) - - (Overprovision)/underprovision in Previous Year 5,250,702 (1,398,532) - -
At 31 December 31,020,700 28,858,458 6,411,015 -
NOTES TO THE FINANCIAL STATEMENTS NOTES TO THE FINANCIAL STATEMENTS
FOR THE YEAR ENDED 31 DECEMBER 2020 FOR THE YEAR ENDED 31 DECEMBER 2020
124 125

17. TAXATION (CONT’D)
(b) Deferred Tax Liabilities/(Assets)
GROUP COMPANY
2020 2019 2020 2019 Rs Rs Rs Rs
Deferred Tax Assets (19,003,605) (9,959,016) - - Deferred Tax Liabilities 64,085,158 58,167,578 9,629,520 4,561,000
Net Deferred Tax Liabilities/(Assets) 45,081,553 48,208,562 9,629,520 4,561,000
GROUP COMPANY
2020 2019 2020 2019 Rs Rs Rs Rs
At 1 January 48,208,562 37,720,455 4,561,000 (7,645,000)
Charge/(credit) to Statement of Profit or Loss
Deferred Tax Expense (5,413,659) 13,769,938 4,610,596 11,805,198
(Credit)/charged to Other Comprehensive Income
Revaluation of Buildings 3,783,989 (3,096,272) 516,404 467,612 Remeasurement of Retirement Benefit Obligations (1,497,339) (185,559) (58,480) (66,810)
At 31 December 45,081,553 48,208,562 9,629,520 4,561,000
GROUP COMPANY
2020 2019 2020 2019 Rs Rs Rs Rs
Accelerated Capital Allowances 35,762,623 33,447,888 4,112,901 - Revaluation Surplus on Land and Buildings 32,652,925 31,236,747 6,572,489 8,423,897 Unused Tax Losses (23,283,868) (18,117,400) - (4,006,748)Other Temporary Differences (50,127) 1,641,327 (1,055,870) (1,368,032)
45,081,553 48,208,562 9,629,520 3,049,117
The expiry dates of the unutilised tax loss are as follows: GROUP
2020 2019 Rs Rs
31 December 2025 10,975,452 - 31 December 2024 10,701,540 10,901,023 31 December 2023 11,423,373 2,962,547 31 December 2022 2,770,187 5,318,879 31 December 2021 5,146,943 11,523,344 31 December 2020 - 10,638,398
41,017,495 41,344,191
17. TAXATION (CONT’D)
(b) Deferred Tax Liabilities/(Assets) (Cont’d)
The Group has aggregate unutilised tax losses and deductible temporary differences of Rs 41,017,495 (2019: Rs 41,344,191) to carry forward against future taxable income for which a deferred tax asset has not been recognised due to uncertainty of their recoverability.
18. BANK OVERDRAFTS The bank overdrafts are secured by fixed and floating charges on the assets of the Company and of the Group, including property, plant and equipment and investment properties and inventories.
Interest rates are floating rates and range between 3.65% and 4.05% p.a. (2019: 5.50% and 6.55% p.a).
Other Payables and Accruals comprise mainly of accruals for goods and services relating to the Group’s operations which was not yet invoiced at reporting date, and amounts due to third parties which are not classified as trade creditors. The amount comprise of Rs 601M (2019:Rs 402M) of accruals relating to construction costs on ongoing contracts.
The directors consider that the carrying amount of trade payables approximates their fair value.
The average credit period of creditors is two months. No interest is charged on trade payables. The Group has policies and procedures in place to ensure that all payables are paid within the credit timeframe.
19. TRADE AND OTHER PAYABLES
The bank overdrafts are secured by fixed and floating charges on the assets of the Company and of the Group, including property, plant and equipment and investment properties and inventories.
Interest rates are floating rates and range between 3.65% and 4.05% p.a. (2019: 5.50% and 6.55% p.a).
GROUP COMPANY
2020 2019 2020 2019 Rs Rs Rs Rs
Trade payables 169,443,620 88,651,186 14,432,063 1,551,362 Amount due to joint venture 55,048,780 - - - Other payables and accruals 746,586,422 691,522,366 110,318,772 132,761,963 Advance payment from customers 4,281,829 14,010,200 - - Prize liability and reserve fund 156,311,483 78,621,576 - - Unclaimed prize 2,541,156 6,420,865 - - Consolidated Fund 102,667,340 116,861,111 - -
1,236,880,630 996,087,304 124,750,835 134,313,325
Less: Amount due for Settlement after one year (shown under Non Current Liabilities) (95,573,338) (36,268,206) - -
1,141,307,292 959,819,098 124,750,835 134,313,325
NOTES TO THE FINANCIAL STATEMENTS NOTES TO THE FINANCIAL STATEMENTS
FOR THE YEAR ENDED 31 DECEMBER 2020 FOR THE YEAR ENDED 31 DECEMBER 2020
126 127

19(a). CONTRACT LIABILITIES
2020 2019
Non Current Rs Rs
Retention payable to subcontractors 8,745,439 5,811,342 Advance from customers 4,281,829 6,282,470
13,027,268 12,093,812
Current
Retention payable to Subcontractors 76,576,211 58,653,301 Advance from customers 94,389,532 123,385,862
170,965,743 182,039,163
20. TURNOVER AND REVENUE
The contract liabilities primarily relate to the advance consideration received from customers for the performance obligation yet to be satisfied and retention payable to sub-contractors.
The non-current contract liabilities are carried at amortised cost using an effective interest rate of 4.20% p.a (2019: 6.20%).
The significant changes in the balances of contract liabilities are disclosed in Note 20.
GROUP COMPANY
2020 2019 2020 2019 Rs Rs Rs Rs
Turnover 4,617,082,109 5,026,129,299 358,066,897 459,566,364 Less: Prizes (911,277,239) (1,275,797,854) - - Revenue 3,705,804,870 3,750,331,445 358,066,897 459,566,364
Revenue from contracts with customers 3,687,039,776 3,724,061,752 121,722,260 145,401,678
Rental Income from investment properties 18,765,094 26,269,693 - - Dividend income - - 236,344,637 314,164,686
Revenue from Continuing Operations 3,705,804,870 3,750,331,445 358,066,897 459,566,364
Set out below is the disaggregation of the revenue from contract with customers:
20. TURNOVER AND REVENUE (CONT’D)
(a) Disaggregation of revenue
GROUP COMPANY
2020 2019 2020 2019 Rs Rs Rs Rs
Set out below is the disaggregation of revenue from contract with customers:
Type of revenueSale of building materials 1,379,536,826 1,473,011,384 - - Construction contract revenue 1,319,031,024 856,513,750 - - Sale of lottery tickets 962,640,595 1,357,176,731 - - Sale of goods and services 25,831,331 37,359,887 121,722,260 145,401,678
Revenue from contracts with customers 3,687,039,776 3,724,061,752 121,722,260 145,401,678
Timing of revenue recognitionAt a point in time 2,368,008,752 2,867,548,002 121,722,260 145,401,678 Over time 1,319,031,024 856,513,750 - -
3,687,039,776 3,724,061,752 121,722,260 145,401,678
GROUP
2020 2019
Revenue derived over time are earned on: Rs Rs
Short-term contracts 222,310,679 152,481,858 Long-term contracts 1,096,720,345 704,031,892 Total revenue 1,319,031,024 856,513,750
The Group has disaggregated revenues generated from contracts with customers in terms of contract duration as projects profitability is normally analysed as being generated from Short term or Long term contracts. Short-term contracts are contracts having a duration of less than one year and Long-term contracts are those having a duration of one year or more.
2020Building Materials Contracting Investments Lottery
Corporate Services &
Others TotalRs Rs Rs Rs Rs Rs
External customer 1,379,536,826 1,322,710,502 75,027 962,640,595 22,076,826 3,687,039,776 Inter-Segment Revenue 314,665 25,237,272 2,904 - - 25,554,841
1,379,851,491 1,347,947,774 77,931 962,640,595 22,076,826 3,712,594,617 Inter-Segment adjustments and eliminations (314,665) (25,237,272) (2,904) - - (25,554,841)Revenue with external customers 1,379,536,826 1,322,710,502 75,027 962,640,595 22,076,826 3,687,039,776
2019 Building Materials Contracting Investments Lottery
Corporate Services &
Others TotalRs Rs Rs Rs Rs Rs
External customer 1,473,011,384 866,497,640 276,595 1,357,226,033 27,050,100 3,724,061,752 Inter-Segment Revenue 2,508,613 82,195,438 330,001 - - 85,034,052
1,475,519,997 948,693,078 606,596 1,357,226,033 27,050,100 3,809,095,804
Inter-Segment adjustments and eliminations
(2,508,613) (82,195,438) (330,001) - - (85,034,052)
Revenue with external customers 1,473,011,384 866,497,640 276,595 1,357,226,033 27,050,100 3,724,061,752
NOTES TO THE FINANCIAL STATEMENTS NOTES TO THE FINANCIAL STATEMENTS
FOR THE YEAR ENDED 31 DECEMBER 2020 FOR THE YEAR ENDED 31 DECEMBER 2020
128 129
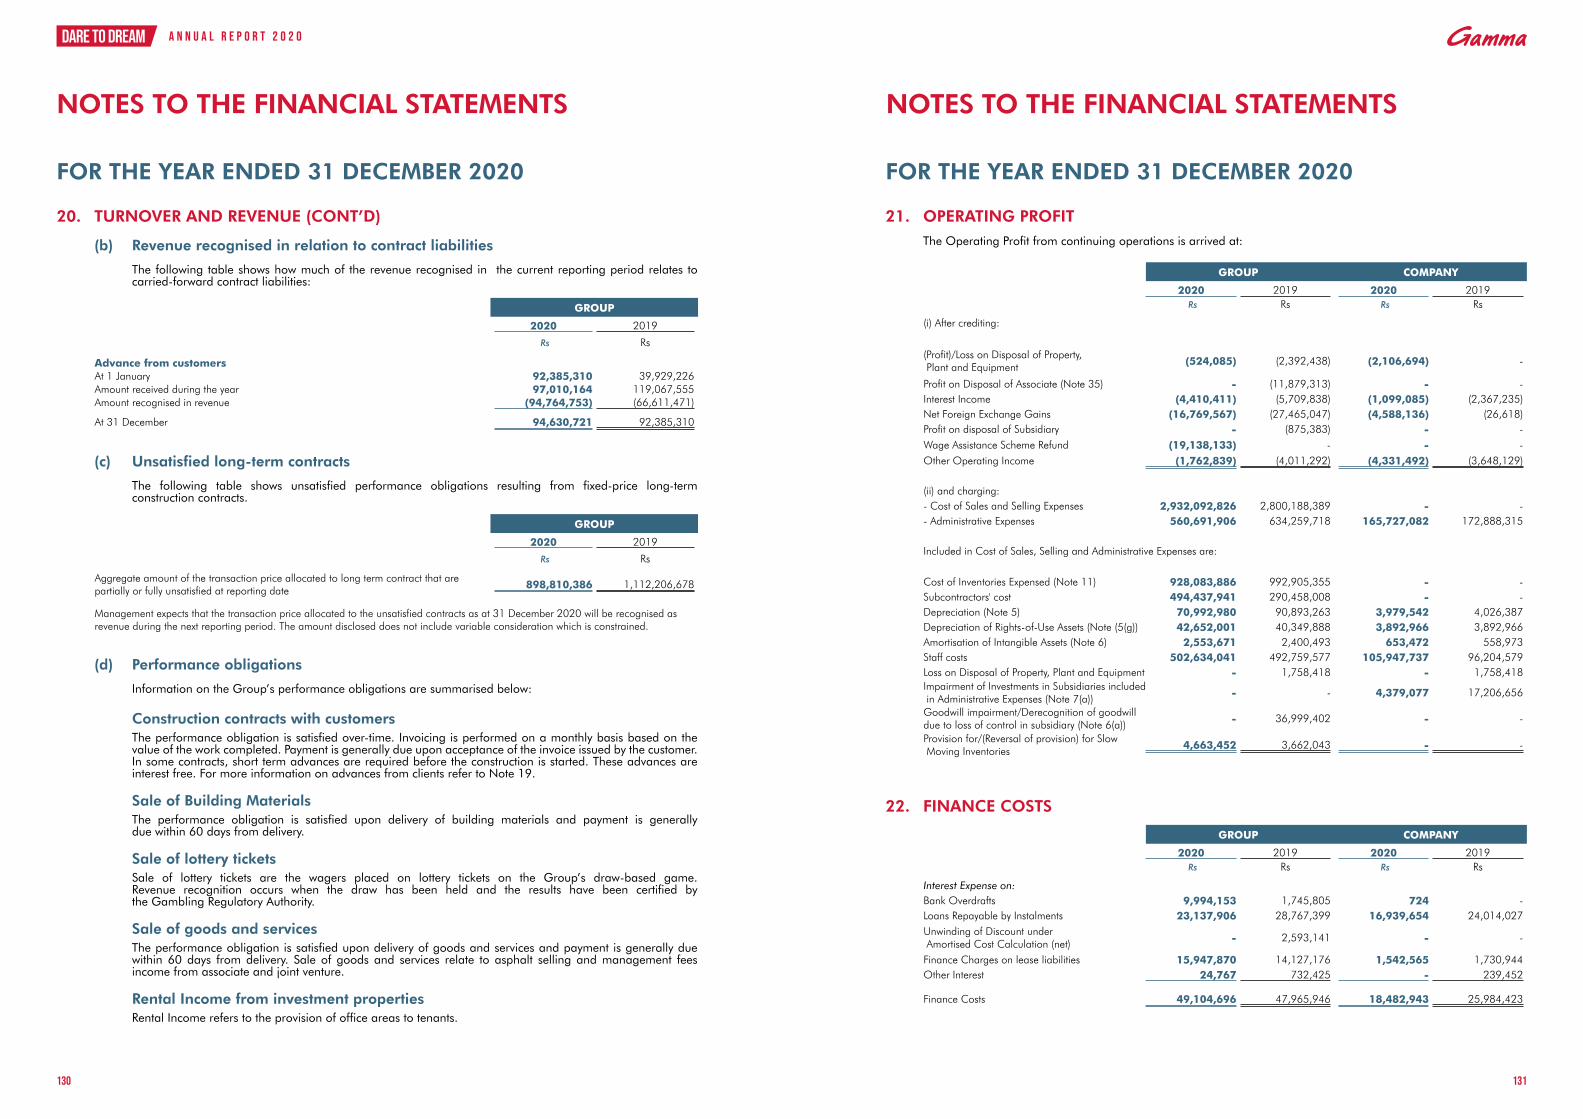
20. TURNOVER AND REVENUE (CONT’D)
(b) Revenue recognised in relation to contract liabilities
The following table shows how much of the revenue recognised in the current reporting period relates to carried-forward contract liabilities:
(c) Unsatisfied long-term contracts
The following table shows unsatisfied performance obligations resulting from fixed-price long-term construction contracts.
(d) Performance obligations
Information on the Group’s performance obligations are summarised below:
Construction contracts with customers The performance obligation is satisfied over-time. Invoicing is performed on a monthly basis based on the value of the work completed. Payment is generally due upon acceptance of the invoice issued by the customer. In some contracts, short term advances are required before the construction is started. These advances are interest free. For more information on advances from clients refer to Note 19.
Sale of Building Materials The performance obligation is satisfied upon delivery of building materials and payment is generally due within 60 days from delivery.
Sale of lottery tickets Sale of lottery tickets are the wagers placed on lottery tickets on the Group’s draw-based game. Revenue recognition occurs when the draw has been held and the results have been certified by the Gambling Regulatory Authority.
Sale of goods and services The performance obligation is satisfied upon delivery of goods and services and payment is generally due within 60 days from delivery. Sale of goods and services relate to asphalt selling and management fees income from associate and joint venture.
Rental Income from investment properties Rental Income refers to the provision of office areas to tenants.
GROUP
2020 2019
Rs Rs
Advance from customersAt 1 January 92,385,310 39,929,226 Amount received during the year 97,010,164 119,067,555 Amount recognised in revenue (94,764,753) (66,611,471)
At 31 December 94,630,721 92,385,310
GROUP
2020 2019
Rs Rs
Aggregate amount of the transaction price allocated to long term contract that are partially or fully unsatisfied at reporting date 898,810,386 1,112,206,678
Management expects that the transaction price allocated to the unsatisfied contracts as at 31 December 2020 will be recognised as revenue during the next reporting period. The amount disclosed does not include variable consideration which is constrained.
21. OPERATING PROFIT The Operating Profit from continuing operations is arrived at:
22. FINANCE COSTS
GROUP COMPANY
2020 2019 2020 2019 Rs Rs Rs Rs
(i) After crediting:
(Profit)/Loss on Disposal of Property, Plant and Equipment (524,085) (2,392,438) (2,106,694) -
Profit on Disposal of Associate (Note 35) - (11,879,313) - - Interest Income (4,410,411) (5,709,838) (1,099,085) (2,367,235)Net Foreign Exchange Gains (16,769,567) (27,465,047) (4,588,136) (26,618)Profit on disposal of Subsidiary - (875,383) - - Wage Assistance Scheme Refund (19,138,133) - - - Other Operating Income (1,762,839) (4,011,292) (4,331,492) (3,648,129)
(ii) and charging:- Cost of Sales and Selling Expenses 2,932,092,826 2,800,188,389 - - - Administrative Expenses 560,691,906 634,259,718 165,727,082 172,888,315
Included in Cost of Sales, Selling and Administrative Expenses are:
Cost of Inventories Expensed (Note 11) 928,083,886 992,905,355 - - Subcontractors' cost 494,437,941 290,458,008 - - Depreciation (Note 5) 70,992,980 90,893,263 3,979,542 4,026,387 Depreciation of Rights-of-Use Assets (Note (5(g)) 42,652,001 40,349,888 3,892,966 3,892,966 Amortisation of Intangible Assets (Note 6) 2,553,671 2,400,493 653,472 558,973 Staff costs 502,634,041 492,759,577 105,947,737 96,204,579 Loss on Disposal of Property, Plant and Equipment - 1,758,418 - 1,758,418 Impairment of Investments in Subsidiaries included in Administrative Expenses (Note 7(a)) - - 4,379,077 17,206,656
Goodwill impairment/Derecognition of goodwill due to loss of control in subsidiary (Note 6(a)) - 36,999,402 - -
Provision for/(Reversal of provision) for Slow Moving Inventories 4,663,452 3,662,043 - -
GROUP COMPANY
2020 2019 2020 2019 Rs Rs Rs Rs
Interest Expense on:Bank Overdrafts 9,994,153 1,745,805 724 - Loans Repayable by Instalments 23,137,906 28,767,399 16,939,654 24,014,027 Unwinding of Discount under Amortised Cost Calculation (net) - 2,593,141 - -
Finance Charges on lease liabilities 15,947,870 14,127,176 1,542,565 1,730,944 Other Interest 24,767 732,425 - 239,452
Finance Costs 49,104,696 47,965,946 18,482,943 25,984,423
NOTES TO THE FINANCIAL STATEMENTS NOTES TO THE FINANCIAL STATEMENTS
FOR THE YEAR ENDED 31 DECEMBER 2020 FOR THE YEAR ENDED 31 DECEMBER 2020
130 131

GROUP COMPANY
2020 2019 2020 2019 Rs Rs Rs Rs
Property, Plant and Equipment purchased 206,273,574 120,531,932 892,294 189,541
Financed as follows:Lease (Right-of-Use Asset) 41,697,968 5,633,204 - - Cash Disbursed 164,575,606 114,898,728 892,294 189,541
Total 206,273,574 120,531,932 892,294 189,541
23. DIVIDEND
24. EARNINGS PER SHARE
25. PURCHASE OF PROPERTY, PLANT AND EQUIPMENT
26. CASH AND CASH EQUIVALENTS
COMPANY
2020 2019
Rs Rs
Final Dividend of Rs 1.50 (2019: Rs 0.75) per Share 199,875,000 99,937,500 No Interim Dividend for 2020 (2019: Rs 0.50 per share) - 66,625,000
Total Dividend Paid during the Year 199,875,000 166,562,500
COMPANY
2020 2019
Rs Rs
Profit Attributable to Owners of the Company 163,356,763 448,390,930
Number of Shares for Earnings per Share Calculation 133,250,000 133,250,000
Earnings per Share (Basic and Diluted) 1.23 3.37
There were no dilution of shares for the periods presented therein.
GROUP COMPANY2020 2019 2020 2019
Rs Rs Rs Rs
Cash at Bank, in Hand and Short Term Deposits 652,955,415 492,961,111 114,653,886 100,062,733
Bank Overdrafts (23,421,268) (19,187,897) - -
629,534,147 473,773,214 114,653,886 100,062,733
27. SEGMENT INFORMATION IFRS 8 requires operating segments to be identified on the basis of internal reports about components of the group that are regularly reviewed by the Executive Committee in order to allocate resources to the segments identified previously under IAS 14, Segmental Reporting. Information reported to the chief operating decision maker focuses on the types of goods and services delivered or provided. The directors of the Company have chosen to organize the Group around differences in products and services. The Group’s reportable segments under IFRS 8 are: - Building Materials segment, which imports cement in bulk and sells it in bulk or bags - Contracting segment, which is engaged in the building and civil engineering works, asphalt production and asphalt road works - Investments segment, which has a bank of land and office buildings for development and rental - Lottery segment, which is engaged in the lottery business - Corporate Services & Others segment, which provides the corporate and secretarial services for the Group
2020Building Materials Contracting Investments Lottery
Corporate Services &
Others Eliminations Total
Rs Rs Rs Rs Rs Rs Rs
REVENUEExternal sales 1,379,536,826 1,322,710,502 18,705,036 962,640,595 174,893,711 (152,681,800) 3,705,804,870 Inter-segment Sales 7,570,723 25,237,272 - - 257,564,739 (290,372,734) -
1,387,107,549 1,347,947,774 18,705,036 962,640,595 432,458,450 (443,054,534) 3,705,804,870
OPERATING PROFITSegment Results 196,721,026 (22,651,516) 14,330,405 80,930,673 274,433,339 (288,138,754) 255,625,173
Net Impairment Reversal on Financial and Contract Assets
(5,615,457)
Net Gain from Fair Value Adjustment on Investment Properties
6,006,735
Finance Costs (49,104,696)Share of Profit of Associates and Joint Venture 66,752,343 - - - 16,873,512 (8,192,504) 75,433,351
Profit before Taxation 282,345,106 Taxation (54,365,083)
Profit for the Year 227,980,023
(a) Segment Revenue and Results
NOTES TO THE FINANCIAL STATEMENTS NOTES TO THE FINANCIAL STATEMENTS
FOR THE YEAR ENDED 31 DECEMBER 2020 FOR THE YEAR ENDED 31 DECEMBER 2020
132 133

27. SEGMENT INFORMATION (CONT’D)
(a) Segment Revenue and Results (Cont’d)
Segment revenue reported above represents revenue generated from external customers.
Inter-segment sales are effected on an arm’s length basis.
External sales elimination refers to dividend income from Associates and Joint Venture. The dividends are eliminated on consolidation since the share of Profit of Associates and Joint Venture are taken in the Group results.
The accounting policies of the reportable segments are the same as the Group’s accounting policies described in Note 3.
2019 Building Materials Contracting Investments Lottery
Corporate Services &
Others Eliminations TotalRs Rs Rs Rs Rs Rs Rs
REVENUEExternal sales 1,473,011,384 866,497,641 26,410,310 1,357,376,854 126,617,483 (99,582,227) 3,750,331,445 Inter-segment Sales 2,508,613 82,195,438 330,001 - 365,430,294 (450,464,346) -
1,475,519,997 948,693,079 26,740,311 1,357,376,854 492,047,777 (550,046,573) 3,750,331,445
OPERATING PROFITSegment Results 228,112,515 13,634,616 11,372,550 188,478,639 307,108,709 (380,490,380) 368,216,649
Net Impairment Reversal on Financial and Contract Assets
(1,942,036)
Net Gain from Fair Value Adjustment on Investment Properties
181,328,687
Finance Costs (47,965,946)Share of Profit of Associates and Joint Venture 125,611,755 - - - 58,698,084 - 184,309,839
Profit before Taxation 683,947,193 Taxation (87,637,265)
Profit for the Year 596,309,928
27. SEGMENT INFORMATION (CONT’D)
(b) Segment Assets and Liabilities
2020Building Materials Contracting Investments Lottery
Corporate Services &
Others Eliminations TotalRs Rs Rs Rs Rs Rs Rs
ASSETS
Segment Assets 382,418,136 905,588,457 725,389,786 529,497,129 4,512,756,093 (1,647,771,336) 5,407,878,265
Investments in Associates and joint venture 421,119,367 - - - 410,431,160 - 831,550,527
Unallocated Corporate Assets 20,060,077
Total Assets 6,259,488,869
LIABILITIES
Segment Liabilities 122,518,857 1,279,455,254 368,343,415 1,045,770,403 1,065,892,248 (2,374,153,405) 1,507,826,772
Unallocated Corporate Liabilities 1,106,729,604
Total Liabilities 2,614,556,376 Non-controlling Interests 139,444,197 - - 70,165,235 (5,121,802) - 204,487,630 Shareholders' Funds 3,440,444,863
Total Equity and Liabilities 6,259,488,869
2019Building Materials Contracting Investments Lottery
Corporate Services &
Others Eliminations TotalRs Rs Rs Rs Rs Rs Rs
ASSETS
Segment Assets 285,690,799 754,651,374 710,782,186 525,169,054 4,680,620,234 (2,011,636,935) 4,945,276,712
Investments in Associates and joint venture
463,312,691 - - - 437,926,464 - 901,239,155
Unallocated Corporate Assets
37,535,488
Total Assets 5,884,051,355
LIABILITIES
Segment Liabilities 237,472,958 1,081,094,841 522,183,465 1,018,612,226 1,116,806,505 (2,714,018,851) 1,262,151,144 Unallocated Corporate Liabilities
952,563,872
Total Liabilities 2,214,715,016 Non-controlling Interests 120,602,202 - - 91,920,129 (6,330,382) - 206,191,948 Shareholders' Funds 3,463,144,391
Total Equity and Liabilities
5,884,051,355
For the purpose of monitoring segment performance and allocating resources between segments:
All assets and liabilities are allocated to reportable segments. Goodwill is allocated to reportable segments as described in Note 6. Assets used jointly by reportable segments are allocated on the basis of the revenues earned by individual reportable segments.
NOTES TO THE FINANCIAL STATEMENTS NOTES TO THE FINANCIAL STATEMENTS
FOR THE YEAR ENDED 31 DECEMBER 2020 FOR THE YEAR ENDED 31 DECEMBER 2020
134 135

27. SEGMENT INFORMATION (CONT’D)
(c) Other Information
(i) Capital Additions, Depreciation and Amortisation
2020Building Materials Contracting Investments Lottery
Corporate Services &
Others Eliminations Total
Rs Rs Rs Rs Rs Rs Rs
Capital Additions 103,584,063 11,981,599 - 89,205,610 1,738,554 - 206,509,826
Depreciation and Amortisation 57,714,532 22,824,903 - 23,891,298 11,767,919 - 116,198,652
2019Building Materials Contracting Investments Lottery
Corporate Services &
Others Eliminations TotalRs Rs Rs Rs Rs Rs Rs
Capital Additions 34,429,564 25,954,159 29,900 60,585,047 404,172 - 121,402,842
Depreciation and Amortisation
59,235,712 25,242,626 12,898 40,076,063 9,076,345 - 133,643,644
(ii) Geographical
All of the Group operations are based in Mauritius. There is no revenue derived from foreign operations.
(iii) Information about major customers
No single customer contributed 10% or more of the Group’s revenue for both 2020 and 2019.
(iv) Revenue from Major Products and Services
The following is an analysis of the Group’s revenue classified into its major products and services.
2020 2019
Rs Rs
Building Materials 1,379,536,826 1,473,011,384 Contracting 1,322,710,502 866,497,641 Investment Properties 18,705,036 26,269,693 Lottery 962,640,595 1,357,376,854 Others 22,211,911 27,175,873
3,705,804,870 3,750,331,445
28. RELATED PARTY TRANSACTIONS Parties are considered to be related if one party has the ability to control the other party or exercise significant influence over the other party in making financial and operating decisions. The transactions of the Group with related parties during the year are as follows:
(a) Purchases of Goods and Services
(b) Dividend Income, Management Fee income and rental income derived from Administrative Services.
2020 2019 2020 2019 Rs Rs Rs Rs
From subsidiaries - - 4,560,000 4,695,343 From Director-related Entities 8,469,449 - 2,908,800 - From Associates and Joint venture 74,906 133,372,268 74,906 238,483
2020 2019 2020 2019 Rs Rs Rs Rs
(i) Dividend income
From Subsidiaries - - 123,294,950 229,839,300 From Associates and Joint venture 152,681,798 99,582,227 113,049,687 84,325,386
(ii) Management Fee income and Rental IncomeFrom subsidiaries - - 103,605,434 124,177,578 From Associates and Joint venture 18,116,826 23,420,100 18,116,826 23,420,100
(iii) Other transactions - Sale of Subsidiary and Acquisition of Associate
During the year ended 31 December 2019 the Group sold its existing interests in Gammafin Ltd to directors for a consideration of Rs 1,000,000. The group made a profit of Rs 875,383 from the transaction (Note 34).
During the year ended 31 December 2019, the Group acquired 50% shareholding in Square Mile Investment Nine Ltd, a director-related entity, for Rs100,000,000.
The above transactions have been made at arm’s length, on normal commercial terms and in the normal course of business.
(c) Compensation of Key Management Personnel
2020 2019 2020 2019 Rs Rs Rs Rs
Short-term Benefits 170,764,576 164,673,810 68,521,396 63,249,194 Post-employment Benefits 5,464,206 3,960,654 671,635 392,355
176,228,782 168,634,464 69,193,031 63,641,549
NOTES TO THE FINANCIAL STATEMENTS NOTES TO THE FINANCIAL STATEMENTS
FOR THE YEAR ENDED 31 DECEMBER 2020 FOR THE YEAR ENDED 31 DECEMBER 2020
136 137

28. RELATED PARTY TRANSACTIONS 29. FINANCIAL INSTRUMENTS During the course of its ordinary activities, the Group is exposed to various risks such as capital risk, market risk (which comprises of interest rate risk, currency risk and other price risk), credit risk and liquidity risk. The risks are monitored and reviewed by the Audit and Risk Committee on a quarterly basis. The risks are managed by senior management of the Group companies. The Group’s financial risks activities are governed by appropriate policies and procedures, and the financial risks are identified, measured and managed in accordance with the Group’s policies and risk objectives.
(a) Capital Risk Management
The Group manages its capital to ensure that the Group will be able to continue as a going concern while maximising the return to shareholders through the optimisation of the debt and equity balance. The Group’s overall strategy remains unchanged from 2019. The capital structure of the Group consists of net debt offset by cash and cash equivalents and equity comprising issued capital, reserves and retained earnings.
(b) Gearing Ratio
The Group reviews the capital structure on a regular basis and as part of this review, management considers the cost of capital and the risks associated with its capital.
The gearing ratio at the year end was as follows:
(c) Significant Accounting Policies
Details of the significant accounting policies and methods adopted, including the criteria for recognition, the basis of measurement and the basis on which income and expenses are recognised, in respect of each class of financial asset and financial liability and equity instruments are disclosed in Note 3 to the financial statements.
2020 2019 2020 2019 Rs Rs Rs Rs
Subsidiaries - - 26,311,888 86,254,259 Associates 2,051,600 2,400 862,500 2,400 Joint Venture 6,752,478 6,083,071 6,598,278 6,083,071
8,804,078 6,085,471 33,772,666 92,339,730
2020 2019 2020 2019 Rs Rs Rs Rs
Director-related Entities 48,253,438 45,040,615 - - Amount due to Subsidiaries - - 102,883,478 149,860,700
Associates and Joint venture include in Creditors and Accruals 55,048,780 - - -
103,302,218 45,040,615 102,883,478 149,860,700
(d) Outstanding Balances
(i) Amount due from Related Parties:
Remaining amount due from related parties is unsecured, interest-free and repayable at call except for amount shown in Note 7(c). The balances arise in the normal day-to-day operations of the Group. No allowance for expected credit losses are calculated on group balances. During the year 2019 part of the amount due from related parties carried interest at the rate of 3% per annum.
The amount due to related parties is unsecured, interest free and repayable at call except for amount shown in Note 19. Amounts due from related parties have been tested for impairment using the ECL method and no impairment is deemed to be recorded. (ii) Amount due to Related Parties
GROUP COMPANY
2020 2019 2020 2019
Rs Rs Rs Rs
Debt (i) 1,035,045,014 884,725,733 482,894,924 486,231,853 Cash at Bank and in Hand (652,955,415) (492,961,111) (114,653,886) (100,062,733)
Net Debt 382,089,599 391,764,622 368,241,038 386,169,120
Equity (ii) 3,644,932,493 3,669,336,339 1,436,746,715 1,464,751,536
Gearing Ratio 10.5% 10.7% 25.6% 26.4%
(i) Debt is defined as short and long term borrowings, as detailed in Notes 14, 15 and 18.
(ii) Equity includes capital and reserves of the Group/Company.
NOTES TO THE FINANCIAL STATEMENTS NOTES TO THE FINANCIAL STATEMENTS
FOR THE YEAR ENDED 31 DECEMBER 2020 FOR THE YEAR ENDED 31 DECEMBER 2020
138 139

29. FINANCIAL INSTRUMENTS (CONT’D)
(d) Fair Values
Except where stated elsewhere, the carrying amounts of the Group’s financial assets and financial liabilities approximate their fair values due to the short-term nature of the balances involved.
Categories of Financial Instruments
(ii) Company
GROUP COMPANY
2020 2019 2020 2019 Rs Rs Rs Rs
CurrencyMauritian Rupee 129,063,962 198,124,275 620,947,567 638,167,144 United States Dollar 82,443,898 57,557,998 - - Euro 139,572 - - -
211,647,432 255,682,273 620,947,567 638,167,144
Included in United States Dollar and Euro under Financial Assets are mainly cash at banks and short term deposits. Included in United States Dollar and Euro under Financial Liabilities are mainly trade payables.
(h) Foreign Currency Sensitivity Analysis
The Group is mainly exposed to United States Dollar (USD), Euro and South African Rand (ZAR).
The following table details the Group’s sensitivity to a 5% increase and decrease in foreign currencies against the Mauritian Rupee. The sensitivity analysis includes only outstanding foreign currency denominated monetary items and adjusts their translation at the year end for a 5% change in foreign currency rates. An increase in foreign currency will lead to an overall increase in profit and equity as shown below, and vice-versa.
The above is mainly attributable to the Group’s exposure outstanding on cash and cash equivalents and borrowings in USD, Euro and ZAR. The Group uses derivative financial instruments such as forward currency contracts to hedge its foreign currency risks. There was no open forward contract at reporting date.
In management’s opinion, the sensitivity analysis is unrepresentative of the inherent foreign exchange risk as the year end exposure does not reflect the exposure during the year.
(i) Credit Risk Management
Credit risk refers to the risk that a counterparty will default on its contractual obligations resulting in financial loss to the Group. The Group has adopted a policy of only dealing with creditworthy counterparties as a means of mitigating the risk of financial loss from defaults. Credit exposure is controlled by counterparty limits that are approved and reviewed by key management on regular basis.
The Group’s credit risk is primarily attributable to its trade receivables and from its financing activities including deposits with banks and financial institutions. The amounts presented in the Statements of Financial Position are net of allowances for expected credit losses, estimated by management based on prior experience and represents the company’s maximum exposure to credit risk.
The Group does not hold collateral as security.
(e) Fair Value Measurements recognised in the Statement of Financial Position
The following table provides an analysis of financial instruments that are measured subsequent to initial recognition at fair value, grouped into Levels 1 to 3 based on the degree to which the fair value is observable. - Level 1 fair value measurements are those derived from quoted prices (unadjusted) in active markets for identical assets or liabilities.
- Level 2 fair value measurements are those derived from inputs other than quoted prices included within Level 1 that are observable for the asset or liability, either directly (i.e. as prices) or indirectly (i.e. derived from prices). - Level 3 fair value measurements are those derived from valuation techniques that include inputs for the asset or liability that are not based on observable market data (unobservable inputs).
(f) Currency Risk
Currency risk is the risk that the fair value or future cash flows of an exposure will fluctuate because of changes in foreign exchange rates. The Group is exposed to the risk that the exchange rate of the Mauritian rupee relative to the currencies listed below (Note (g)) may change in a manner which has a material effect on the reported values of its assets and liabilities.
(g) Currency Profile
The currency profile of the Group’s and the Company’s financial assets and financial liabilities is summarised as follows:
(i) Group
GROUP COMPANY
2020 2019 2020 2019 Rs Rs Rs Rs
Financial AssetsFinancial Assets at amortised cost 1,459,940,342 1,179,674,465 211,647,432 255,682,273
Financial LiabilitiesFinancial Liabilities at amortised cost 2,311,288,205 1,860,530,657 620,947,567 638,167,144
Total financial assets consist of non-current receivables, trade and other receivables excluding prepayments, cash and cash equivalents and amounts due from subsidiaries (Company only).
Total financial liabilities consist of trade and other payables excluding accruals, lease liabilities, loans and amounts due to subsidiaries (Company only).
GROUP COMPANY
2020 2019 2020 2019 Rs Rs Rs Rs
CurrencyMauritian Rupee 1,365,913,000 1,112,123,010 2,303,506,344 1,815,410,125 United States Dollar 91,924,114 66,969,853 5,915,957 43,683,310 Euro 2,103,228 567,193 1,865,904 1,437,222 ZAR - 14,409 - -
1,459,940,342 1,179,674,465 2,311,288,205 1,860,530,657
GROUP COMPANY
2020 2019 2020 2019 Rs Rs Rs Rs
Impact Impact
United States Dollar 4,300,408 1,851,772 4,122,195 2,877,900 Euro 11,866 (12,150) 6,979 - ZAR - 720 - -
Total 4,312,274 1,840,342 4,129,174 2,877,900
29. FINANCIAL INSTRUMENTS (CONT’D)
(g) Currency Profile (Cont’d)
NOTES TO THE FINANCIAL STATEMENTS NOTES TO THE FINANCIAL STATEMENTS
FOR THE YEAR ENDED 31 DECEMBER 2020 FOR THE YEAR ENDED 31 DECEMBER 2020
140 141

29. FINANCIAL INSTRUMENTS (CONT’D)
(i) Credit Risk Management (Cont’d)
Ongoing credit evaluation is performed on the financial condition of accounts receivable and where appropriate, credit guarantee insurance cover is purchased for material subsidiaries of the group. The Group does not have any significant concentration of credit risks other than those disclosed in Note 12.
An impairment analysis is performed at each reporting date using a provision matrix to measure expected credit losses. The provision rates are based on days past due for groupings of various customer segments with similar loss patterns i.e., by customer type and rating. Generally, trade receivables are impaired if past due for more than one year. The maximum exposure to credit risk at the reporting date is the carrying value of each class of financial assets disclosed in Note 12. The Group does not hold collateral as security.
(j) Interest Rate Risk
Interest rate risk is the risk that the fair value or future cash flows of an exposure will fluctuate because of changes in market interest rates. The Group is exposed to interest rate risk as it borrows funds at both fixed and floating interest rates. The risk is managed by the company by maintaining an appropriate mix between fixed and floating rate borrowings.
The interest rate profile of the financial liabilities at 31 December was: Financial Liabilities
29. FINANCIAL INSTRUMENTS (CONT’D)
(l) Liquidity Risk Management
Liquidity risk is the risk that the Group will not be able to meet its financial obligations as they fall due. The Group’s approach to managing liquidity is to ensure, as far as possible, that it will always have sufficient liquidity to meet its liabilities when due, under both normal and stress conditions, by maintaining adequate reserves and banking facilities, by continuously monitoring forecast and actual cash flows and by matching the maturity profiles of financial assets and liabilities.
(k) Interest Rate Sensitivity Analysis
The sensitivity analysis below has been determined based on the exposure to interest rates for the non-derivative instruments at the reporting date. For floating rate liabilities, the analysis is prepared assuming the amount of liability outstanding at the reporting date was outstanding for the whole year. A 25 basis point increase or decrease is used when reporting interest rate risk internally to key management personnel and represents management’s assessment of the reasonably possible change in interest rates.
If interest rates had been 25 basis points higher and all other variables were held constant, the Group’s and the Company’s profit for the year ended 31 December 2019 would have decreased as follows:
This is mainly attributable to the Group’s and Company’s exposure to interest rates on its variable rate borrowings.
Bank Overdraft Bank Loan
Floating Interest Rate Floating Interest Rate
2020 2019 2020 2019% % % %
Mauritian Rupee From 4.10 to 5.05%
From 5.60 to 6.55%
From 3.25 to 4.35%
From 4.75 to 5.60%
GROUP COMPANY
2020 2019 2020 2019 Rs Rs Rs Rs
Decrease in Profit and equity 1,807,175 1,628,377 1,145,592 572,796
Group Less than1 year 1 - 5 years 5+ years Total
Rs Rs Rs Rs 2020
Non-interest Bearing 970,341,549 82,546,070 - 1,052,887,619 Lease Liability 47,589,568 162,737,805 333,688,741 544,016,114 Variable Interest Rate Instruments 209,054,286 477,314,246 189,870,160 876,238,692
1,226,985,403 722,598,121 523,558,901 2,473,142,425
2019
Non-interest Bearing 785,472,519 24,174,394 - 809,646,913 Lease Liability 45,209,836 131,399,406 393,587,939 570,197,181 Variable Interest Rate Instruments 118,559,607 568,139,057 82,019,911 768,718,575
949,241,962 723,712,857 475,607,850 2,148,562,669
Company Less than1 year 1 - 5 years 5+ years Total
Rs Rs Rs Rs 2020
Non-interest Bearing 228,157,542 - - 228,157,542 Lease Liability 4,879,494 34,746,986 150,533 39,777,013 Variable Interest Rate Instruments 84,677,898 338,711,595 84,677,898 508,067,391
317,714,934 373,458,581 84,828,431 776,001,946
2019
Non-interest Bearing 259,159,970 - - 259,159,970 Lease Liability 4,879,494 19,517,976 9,758,988 34,156,458 Variable Interest Rate Instruments 88,624,834 439,557,624 - 528,182,458
352,664,298 459,075,600 9,758,988 821,498,886
Non-interest bearing debts includes Trade and other payables and Amounts due to subsidiaries (Company only) and contract liabilities.
Variable Interest rate instruments refer to bank and other loans inclusive of future interests.
NOTES TO THE FINANCIAL STATEMENTS NOTES TO THE FINANCIAL STATEMENTS
FOR THE YEAR ENDED 31 DECEMBER 2020 FOR THE YEAR ENDED 31 DECEMBER 2020
142 143

30. OPERATING LEASES
The Group as Lessor
Leasing Arrangements
The Group leases office space with lease term of three to seven years, with an option to extend for a further period of three to five years on same terms and conditions. The operating lease contracts contain market review clauses in the event that the lessee exercises its option to renew. The lessee does not have an option to purchase the property at the expiry of the lease period.
During the year the rental income earned by the Group and Company under operating leases amounted to Rs 18,765,094 (2019: Rs 29,269,693) and Rs 2,193,000 (2019: Rs 2,196,000) respectively. Direct operating expenses incurred by the Group and Company for the year amount to Rs 7,653,426 (2019: Rs 5,370,126) and Rs Nil respectively. (2019: Nil)
Non-cancellable Operating Lease Receivables
31. NON-CURRENT RECEIVABLES
Advance payments were made in respect of lease of land. The advance payments are expensed in Statement of Profit or Loss and Other Comprehensive income as follows:
(i) Group 1 January Interest Cash (Outflows) Recognition of 31 December2020 cost /Inflows Reclassification lease liabilities 2020
Rs Rs Rs Rs Rs Rs
Current interest bearing loans 71,462,675 2,611,015 133,965,484 (46,465,105) - 161,574,069
Current lease liabilities 22,229,727 1,526,375 (9,482,225) 17,178,767 3,990,925 35,443,570 Non current interest bearing loans 561,814,616 20,526,891 (20,526,891) 46,465,105 - 608,279,721
Non current lease liabilities 210,030,818 14,421,495 (38,654,202) (17,178,767) 37,707,043 206,326,386
865,537,836 39,085,776 65,302,166 - 41,697,968 1,011,623,746
1 January Interest Cash Recognition of 31 December2019 cost (Outflows) Reclassification lease liabilities 2019
Rs Rs Rs Rs Rs Rs
Current interest bearing loans 192,450,392 8,517,448 (122,634,961) (6,870,205) - 71,462,675
Current lease liabilities - 1,163,864 (37,276,602) 36,223,467 22,118,998 22,229,727 Non current interest bearing loans 457,544,411 20,249,951 77,150,049 6,870,205 - 561,814,616
Non current lease liabilities - 12,963,312 (13,074,041) (36,223,467) 246,365,014 210,030,818
649,994,803 42,894,575 (95,835,554) - 268,484,012 865,537,836
(ii) Company 1 January Interest Cash 31 December2020 cost Outflows Reclassification 2020
Rs Rs Rs Rs Rs
Current interest bearing loans 68,208,629 2,751,190 (2,751,190) 2,143,582 70,352,211
Current lease liabilities 3,336,929 183,868 (3,520,797) 3,536,580 3,536,580 Non current interest bearing loans 390,028,047 15,731,753 (15,731,753) (2,143,582) 387,884,465
Non current lease liabilities 24,658,248 1,358,697 (1,358,697) (3,536,580) 21,121,668
486,231,853 20,025,508 (23,362,437) - 482,894,924
1 January Interest Cash Recognition of 31 December2019 cost (Outflows) Reclassification lease liabilities 2019
Rs Rs Rs Rs Rs Rs
Current interest bearing loans 114,809,777 4,817,026 (118,934,538) 67,516,364 - 68,208,629
Current lease liabilities - 174,994 (3,323,544) 3,336,929 3,148,550 3,336,929 Non current interest bearing loans 457,544,411 19,197,001 (19,197,001) (67,516,364) - 390,028,047
Non current lease liabilities - 1,555,950 (1,555,950) (3,336,929) 27,995,177 24,658,248
572,354,188 25,744,971 (143,011,033) - 31,143,727 486,231,853
GROUP GROUP
2020 2019 Rs Rs
Less than one year 10,678,343 10,433,919 Between one and two years 3,583,724 10,955,610 Between two and three years - 2,771,901
14,262,067 24,161,430
GROUP COMPANY
2020 2019 2020 2019 Rs Rs Rs Rs
Prepayment for lease of land 6,729,927 7,210,839 - - Other receivables 1,056,472 27,576,472 490,114 490,114
7,786,399 34,787,311 490,114 490,114
GROUP
2020 2019 Rs Rs
After one year but before five years 1,923,648 1,923,644 More than five years 4,806,279 5,287,195
6,729,927 7,210,839
Other receivables for the Group mainly relates to long-term deposit.
29. FINANCIAL INSTRUMENTS (CONT’D)
(l) Liquidity Risk Management (Cont’d)
Liquidity risk is the risk that the Group will not be able to meet its financial obligations as they fall due. The Group’s approach to managing liquidity is to ensure, as far as possible, that it will always have sufficient liquidity to meet its liabilities when due, under both normal and stress conditions, by maintaining adequate reserves and banking facilities, by continuously monitoring forecast and actual cash flows and by matching the maturity profiles of financial assets and liabilities. (Cont’d)
NOTES TO THE FINANCIAL STATEMENTS NOTES TO THE FINANCIAL STATEMENTS
FOR THE YEAR ENDED 31 DECEMBER 2020 FOR THE YEAR ENDED 31 DECEMBER 2020
144 145

32. ASSETS CLASSIFIED AS HELD FOR SALE 35. DISPOSAL OF ASSOCIATE AND ACQUISITION OF ADDITIONAL INTEREST IN SUBSIDIARIES On 12 December 2019, the Group’s associate, Stamford Properties Ltd, redeemed its shares which were held by the Group for a deemed consideration of Rs 63,116,086. No cash was received and, by way of consideration, the Group obtained additional shares (25% effective shareholding) in BR Capital Ltd and Burford Investments Ltd which were previously held by the non-controlling shareholder of Stamford Properties Ltd. Following the transaction, there was no outstanding balances among the entities.
Stamford Properties Ltd was derecognised as associate and BR Capital Ltd and Burford Investments Ltd became wholly owned subsidiaries of the Group.
The carrying value of the investment in associate disposed and Non-Controlling Interests in the subsidiaries purchased at date of transaction were as follows:
33. CONTINGENT LIABILITIES Contingent liabilities not provided for in the Group financial statements relate to expatriate guarantees of Rs2.5M (2019: Rs5.3M), customs guarantee of Rs3M (2019: Rs3M), performance bond of Rs301M (2019: Rs335M), tender bond of Rs13M (2019: Rs12M), advance payment guarantees of Rs77 M (2019: Rs91M) and guarantees of Rs0.3M (2019: Rs0.2M) to third parties.
Contingent liabilities not provided for in the Company financial statements relate to expatriates guarantees of Rs0.1M (2019: Rs3M) and custom guarantees of Rs3M (2019: Rs3M).
The Group has contingent liabilities in respect of legal claims arising in the ordinary course of business.
It is not anticipated that any material liabilities will arise from them and not practical to disclose the cases individually.
Assets held for sale refers to carrying book value of property which the Government has decided to acquire compulsorily by way of Notice to the Group. The carrying amount held as asset held for sale is transferred to Statement of Comprehensive Income when the asset is legally transferred to the buyer. The Assets is classified under the Investment segment of the Group.
34. DISPOSAL OF SUBSIDIARY The Group disposed its investment in Gammafin Ltd during the year ended 31 December 2019.
GROUP COMPANY
2020 2019 2020 2019 Rs Rs Rs Rs
At 1 January - 52,400,000 - 52,400,000 Transfer from Investment Property (Note 9) 10,506,577 - - - Disposal during the year - (52,400,000) - (52,400,000)At 31 December 10,506,577 - - -
2019
Gammafin Ltd Rs
Consideration Received in Cash and Cash Equivalents 1,000,000
Analysis of Assets and Liabilities over which Control was lost:
Current LiabilitiesPayables 124,617
Net Assets disposed of 124,617
Share of Net Assets disposed of 124,617
Profit on Disposal of Subsidiary (Note 21)/(Note 28 (c)(iii)) 875,383 Consideration Received in Cash and Cash Equivalents 1,000,000 Less: Cash and Cash Equivalent Balances disposed of -
Net consideration received 1,000,000
2019 Rs
Disposal of Associate
Deemed consideration 63,116,086 Investment in Associate (51,262,028)Other adjustments 25,255 Profit on disposal of associate - Statement of Profit or Loss Account 11,879,313
Acquisition of additional interest in subsidiaries
Book value of Non Controlling Interests acquired 54,994,899 Outstanding balances written back 20,000,500 Deemed purchase consideration (63,116,086)Profit on acquisition of additional interest in subsidiaries - Statement of Changes in Equity 11,879,313
NOTES TO THE FINANCIAL STATEMENTS NOTES TO THE FINANCIAL STATEMENTS
FOR THE YEAR ENDED 31 DECEMBER 2020 FOR THE YEAR ENDED 31 DECEMBER 2020
146 147

36. ACQUISITION OF SUBSIDIARY On 1 April 2019, the Group acquired 100% of the voting shares of Pool Joseph Merven Limited for a cash consideration of Rs 23,495,000 through its subsidiary, Lottotech Ltd. The Group’s effective interest is 56.12%. The subsidiary’s main operating activity is to act as agent of foreign pool promoter. The principal reason behind the acquisition is the benefits attributable to the operating license held by Pool Joseph Merven Limited.
The fair values of the identifiable assets and liabilities as at the date of acquisition were:
37. COVID-19 IMPACT (CONT’D)
Impact of COVID-19 on Group Activities (Cont’d)
37. COVID-19 IMPACT
Impact of COVID-19 on Group Activities
The Board and management team continue to monitor the development of the COVID-19 pandemic and the short- to-medium term implications of the national lockdown in 2020 and 2021.
Whilst we are pleased to note that our operations as a whole for the year ended 31 December 2020 were profitable, the overall impact of the pandemic is adverse. This is specially highlighted by the financial results of our associate company in the Hospitality sector and in our Contracting segment. It remains unclear to what extent the ongoing crisis in the world will continue to have on the Mauritian economy specifically driven by the restrictions on international travels, the downturn in the tourism sector, the impact on consumer spending and the effect of these factors on the segments of the Group.
COVID-19 pandemic continues to pose a threat in Mauritius in 2021. The Government of Mauritius announced a national confinement as from 10 March 2021 for 15 days following local transmission of COVID-19 amongst the population. On the positive side, we are encouraged by the current vaccination campaign which will mitigate the health and safety concerns of the general public. The Board and Management have placed the health, safety and wellbeing of our employees, as well as business continuity for operational and cash flow resilience, central to our crisis management strategy. The Group continues to adopt all necessary measures to ensure the safety of its employees, customers and partners. We are working with all stakeholders concerned to ensure their continued support during these challenging times.
38. EVENTS AFTER THE REPORTING DATE On 9 March 2021, the Government of Mauritius announced a national confinement as from 10 March 2021 for 15 days to protect the health and safety of its citizens. The exact impact of these measures cannot be quantified at the moment. The Directors are not aware of any other material uncertainties that may cast significant doubt upon the Group’s ability to continue as a going concern.
Below is a summary of the COVID-19 impact on the various segments of the Group:
Building Materials Segment Financial year 2020 was challenging with the global COVID-19 pandemic leading to a national curfew lastingover two months an increased raw materials cost driven by a weakening MUR. Despite the difficult operating environment, the segment showed tremendous resilience to conclude a profitable year. Financial year 2021 is expected to be equally challenging but the directors are confident they can maintain the segment at profitable levels through various risk mitigating actions.
Contracting Segment The operating loss reported for the year ended 31 December 2020 is directly as a result of the national confinement for two months. The outlook based on our pipeline and order book for the financial year 2021 is under careful monitoring by the Board.
Investment Segment This segment holds investment properties which are reported on the Statement of Financial Position in Non-Current Assets. The investment properties and the other properties classified as land and buildings on the Statement of Financial Position were revalue by an independent valuer at 31 December 2020. Overall, there was no decrease in the value of the properties.
Lottery Segment
This segment suspended the sale of its products between 20 March and 6 June 2020 to comply with the Government of Mauritius order of confinement of non-essential businesses and services to protect the health and safety of all its stakeholders. This resulted in an overall reduction in revenue and profitability for the full year. It mitigated the impact on the business by reducing operating costs, expenses and cash outlays. In addition, measures were implemented to strengthen its financial position and remain relevant in the marketplace. During the third and fourth quarters of the year, the business showed signs of returning to pre-confinement sales levels specially with the launch of the revamped Lotterie Vert game in October 2020. The segment is actively engaging with the regulators in order to provide a digital solution to its customers which will enhance users experience and reduce risks of anti-money laundering, counter-terrorism financing, and COVID-19 transmission in line with government directives.
Associates and Joint Venture
Building Materials Segment Our joint venture entity which is engaged in the building materials sector has been profitable for the year ended 31 December 2020.
The activities resumed to a satisfactory level after the national lockdown period.
Hospitality Segment One of our associates engaged in the hospitality sector continues to be materially impacted by the Covid-19 pandemic despite the reopening of the Mauritian borders as from 1 October 2020. The ongoing Covid-19 situation continues to impact the global tourism industry. It is expected that recovery will be slow and gradual, with the sector not resuming normal operating levels within the foreseeable future.
The ongoing Covid-19 situation continues to impact the global tourism industry. It is expected that recovery will be slow and gradual, with the sector not resuming normal operating levels within the foreseeable future.
2019 Rs
Assets
Property and equipment 107,154 Non-current deposits 400,000 Cash and cash equivalents 463,712 Trade receivables 86,136
1,057,002
Liabilities
Trade payables (791,354)Current income tax liabilities (23,791)Total identifiable net assets at fair value 241,857 Less: Non-Controlling Interests (106,125)Share of Group's total identifiable net assets at fair value 135,732 Goodwill arising on acquisition 23,359,268 Purchase consideration 23,495,000
Net cash outflow on acquisition of subsidiary: 23,495,000
Consideration paid in cash (463,712)Less: Cash and cash equivalents acquired 23,031,288
The goodwill comprises the value of expected synergies arising from the acquisition and a license, which is not separately recognised. Due to the high level of uncertainty involved in the fair valuation of the license, it has not been recognised as a separate intangible asset under IAS 38. Impairment test on goodwill at reporting date did not identify any indication of impairment.
NOTES TO THE FINANCIAL STATEMENTS
FOR THE YEAR ENDED 31 DECEMBER 2020 FOR THE YEAR ENDED 31 DECEMBER 2020
NOTES TO THE FINANCIAL STATEMENTS
148 149

NOTES NOTES
150 151